response of a geometric nonlinear structure with closely ...
11
Renson, L., Ehrhardt, D. A., Barton, D. A. W., Neild, S. A., & Cooper, J. E. (2016). Connecting nonlinear normal modes to the forced response of a geometric nonlinear structure with closely spaced modes. In Proceedings of ISMA 2016 - International Conference on Noise and Vibration Engineering and USD2016 - International Conference on Uncertainty in Structural Dynamics (pp. 2775-2784). K U Leuven. Peer reviewed version Link to publication record in Explore Bristol Research PDF-document This is the author accepted manuscript (AAM). The final published version (version of record) is published via ISMA. Please refer to any applicable terms of use of the publisher. University of Bristol - Explore Bristol Research General rights This document is made available in accordance with publisher policies. Please cite only the published version using the reference above. Full terms of use are available: http://www.bristol.ac.uk/red/research-policy/pure/user-guides/ebr-terms/
Transcript of response of a geometric nonlinear structure with closely ...

Renson, L., Ehrhardt, D. A., Barton, D. A. W., Neild, S. A., & Cooper,J. E. (2016). Connecting nonlinear normal modes to the forcedresponse of a geometric nonlinear structure with closely spacedmodes. In Proceedings of ISMA 2016 - International Conference onNoise and Vibration Engineering and USD2016 - InternationalConference on Uncertainty in Structural Dynamics (pp. 2775-2784). KU Leuven.
Peer reviewed version
Link to publication record in Explore Bristol ResearchPDF-document
This is the author accepted manuscript (AAM). The final published version (version of record) is published viaISMA. Please refer to any applicable terms of use of the publisher.
University of Bristol - Explore Bristol ResearchGeneral rights
This document is made available in accordance with publisher policies. Please cite only thepublished version using the reference above. Full terms of use are available:http://www.bristol.ac.uk/red/research-policy/pure/user-guides/ebr-terms/

Connecting nonlinear normal modes to the forced responseof a geometric nonlinear structure with closely spacedmodes
L. Renson1, D. A. Ehrhardt1, D. A. W. Barton1, S. A. Neild1, and J. E. Cooper11Faculty of Engineering, University of Bristol, Bristol, UK.e-mail: [email protected]
AbstractThis paper numerically and experimentally investigates the relationship between the nonlinear normal modesand the forced response of a clamped-clamped cross beam structure. The system possesses closely-spacedlinear modes such that the applied force distribution across the structure plays a central role in the appropria-tion of the nonlinear normal modes. Numerical simulations show that the quadrature conditions of the forcedresponse does not necessarily match the peak response nor the nonlinear normal modes of the underlyingconservative system, but instead are dependent upon the applied excitation. Experimental investigations per-formed with a single-point excitation and control based continuation further demonstrate the necessity forappropriate forcing in order to extract the NNMs of such systems.
1 Introduction
Vibration modes play an important role in the design of mechanical structures as they govern the structure’spreferred deformation shapes and the resonance frequencies at which the system is particularly sensitive toexternal excitations. For nonlinear systems, resonance frequencies and modes shapes vary as a function ofthe vibration amplitude [1, 2]. This evolution can be captured by nonlinear normal modes (NNMs).
In analogy with linear normal modes (LNMs), the resonances of a weakly-damped nonlinear system occurin the neighborhood of its NNMs. More precisely, it was proved that a forced damped system can oscillateaccording to the NNMs of its underlying conservative system provided that a multi-harmonic excitation inphase quadrature with the response is applied to all the degrees of freedom of the system [3]. The appropriateselection of the input force distribution (both spatially and harmonically) permits the counterbalance of thedamping in the structure and the isolation of a specific NNM. Several techniques exploit this result to directlymeasure NNMs during experimental tests. For instance, the NNMs of a nonlinear beam, spring-mass system,a wing-pylon structure, and steel frame structure were extracted using a method termed resonant decay inRefs. [4–7], respectively. In Refs. [8, 9], the NNMs of a nonlinear tuned mass damper and of a energyharvester were extracted using the control-based continuation method which is also implemented in thepresent work. In the above experiments, the minimal nonlinear coupling allowed the simplification of theinput force to a single-point single-harmonic excitation while still successfully capturing the system NNMs.In Ref. [10], a system with symmetric but harmonically couple modes was considered, and a single-pointmulti-harmonic excitation was required to isolate NNMs.
The present work investigates the resonant dynamics of a system with two closely-spaced modes (i.e. coupledin the fundamental harmonic). For such systems, the amplitude and spatial distribution of the excitationacross the structure can strongly influence the ability to observe the NNMs of the system. Different forcingconfigurations can lead to vastly different forced response curves and resonance peaks. Furthermore, as aconsequence of inappropriate forcing, the phase quadrature achieved between the excitation and the response
does not necessarily correspond to a resonance peak or a NNM of the underlying conservative system. Theseresults can have strong practical implications if one wants to measure NNMs during experimental tests.
Experimental investigations are conducted on a clamped-clamped cross beam. The thickness of the clamped-clamped beam is relatively small compared to its length such that the system features geometric nonlinearitieswith predominantly hardening characteristics when under large amplitude planar deformations. The NNMsof the physical structure are studied experimentally using the method developed in Ref. [8]. Exploiting theconcept of control-based continuation (CBC), this method combines stabilizing feedback control and pathfollowing techniques to track in the experiment the steady-state periodic responses describing the NNMs ofthe system. The distribution of the applied input force will appear particularly important for the method.The particular case of a single-point forcing that essentially excites one the LNMs of the underlying linearstructure is considered in order to show the limitations introduced by inappropriate forcing. In particular,quadrature conditions will no longer be reached and the CBC method will fail to control the system dynamicsas the unexcited LNM gains importance in the response.
The paper is organized as follows. The system studied in the paper is presented in Section 2, togetherwith its linear properties which are experimentally identified. Numerical investigations are presented inSection 3. A reduced-order model of the structure is built using the implicit condensation and expansionmethod [11]. The NNMs of the underlying conservative system are discussed. The theory for nonlinearforce appropriation is briefly reviewed in Section 3.3 and the connections that exist between the systemNNMs and forced response is investigated for different forcing configurations. In Section 4 the NNMs of thephysical system are experimentally measured. Conclusions are discussed in Section 5.
2 The physical system
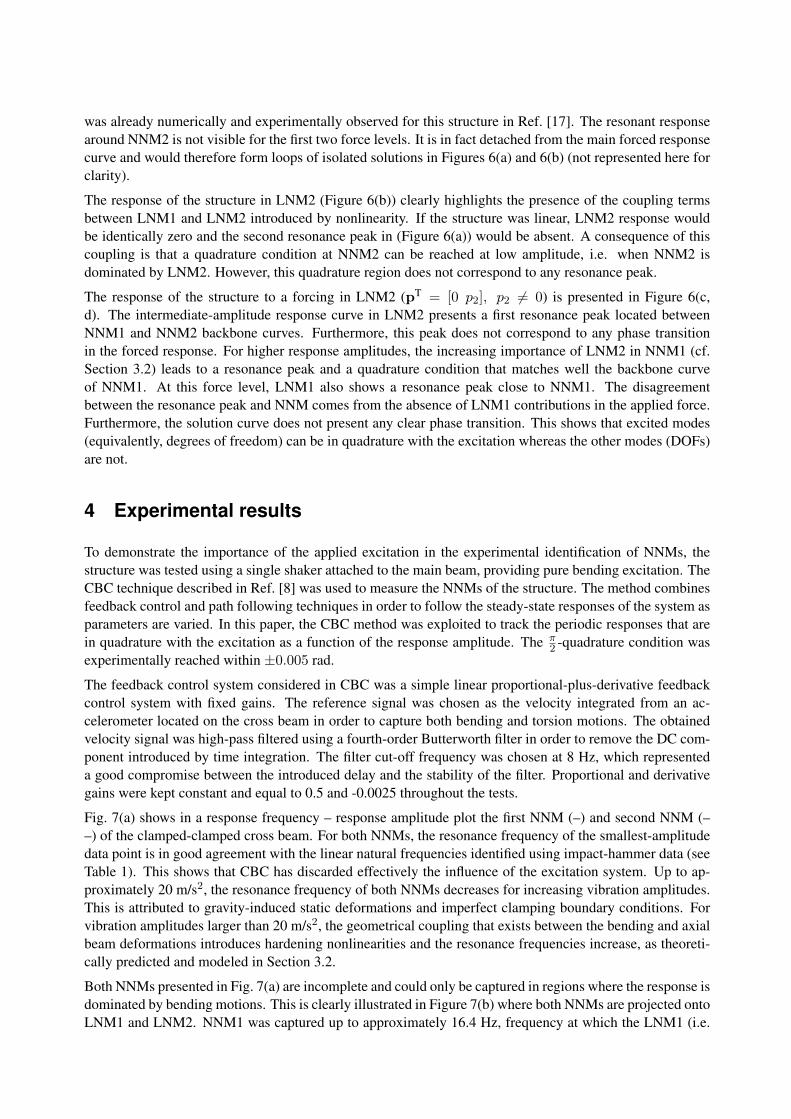
The structure under consideration was created to exhibit close natural frequencies between the first bendingand first torsion mode of vibration. The final design consists of two beams (the main beam and the crossbeam) joined in the middle and a third smaller beam connected to the main beam as seen in Fig. 1. The mainbeam is clamped at both ends. The cross beam is welded to the main beam and two concentrated massesare attached at both ends with set screws so the masses remain adjustable (i.e. change in the cross beamsymmetry and inertia is permitted). The third beam (force cross beam) was also welded to the main beam tofacilitate multi-input testing and the excitation of the first torsion mode; however, this is not utilized in thiswork. The main beam’s dimensions are l x w x h of 1000mm x 12mm x 6mm, the cross beam’s dimensionsare l x d of 410mm x 12mm, and the force cross beams dimensions are l x w x h 150mm x 15mm x 15mm.The dimensions of the concentrated masses are d x h of 38 mm x 24 mm.
Figure 1: Clamped-clamped cross beam.

2.1 Linear modal testing
The clamped-clamped cross beam structure presented in Figure 1 was first investigated using multi-inputmulti-output impact hammer tests in order to extract its underlying linear properties. The shaker later usedfor measuring NNMs was disconnected from the structure in order to discard its influence on the stiffness anddamping properties of the structure. The positions of the localized masses were adjusted such that the firsttwo natural frequencies are approximately 0.5 Hz apart while breaking the torsion mode symmetry to avoidveering [12]. The two first natural frequencies and damping ratios of the final configuration are reported inTable 1. The associated modal shapes are sketched in Figure 2. Although both modes combine bending andtorsion components, the first mode is dominated by a bending motion (Fig. 2(a)) whereas the second one isdominated by torsion (Fig. 2(b)).
Mode 1 Mode 2Frequency (Hz) 15.67 16.18
Damping ratio (%) 0.11 0.26
Table 1: Resonance frequencies and damping ratios identified from impact-hammer data.
(a) (b)
Figure 2: Linear mode shapes identified from impact-hammer data.
3 Numerical simulations
3.1 Reduced-order model
A finite element model of the structure in Fig. 1 was created in Abaqus. A total of 266 B31 beam elementswere used to discretise the cross sections of all beams as well as the concentrated masses at the tip of thecross beam. The boundary conditions of the main beam are also modeled using linear axial springs whosestiffness coefficients were determined from static force-displacement tests prior to clamping. The resultingmodel contains 1596 degrees of freedom and appears to be stiffer than the physical system. The first andsecond natural frequencies are overestimated by 1.55 Hz and 1.33 Hz, respectively.
Performing nonlinear dynamic analysis on this size of a model can be time consuming. Therefore a non-linear reduced order model (NLROM) was created using the implicit condensation and expansion method

(ICE) [11]. In this method, the expected nonlinear stiffening effects due to large amplitudes of deforma-tion are implicitly accounted for using nonlinear static solutions in Abaqus. Using specific levels of appliedmodal forces, the resulting deformation is decomposed onto a preselected modal reduction basis, and thenonlinear stiffness coefficients are determined based on the resulting restoring force and modal displacementrelationship. The ICE method produces an N DOF system of equations in the modal domain as
q̈ + Λq + Nq(q) = 0, (1)
where q stands for the linear modal coordinates. Since this work focuses on the coupling between the two firstfundamental modes, Eq. (1) can be summarized to a 2-DOF system with q = [q1 q2]
T, Λ = diag(ω21, ω
22),
and
Nq(q) =
(α1q
21 + 2α2q1q2 + α3q
22 + γ1q
31 + 3γ2q
21q2 + γ3q1q
22 + γ4q
32
α2q21 + 2α3q1q2 + α4q
22 + γ2q
31 + γ3q
21q2 + 3γ4q1q
22 + γ5q
32
). (2)
In linear response regimes the system response can be well approximated as uncoupled using the linearmodes of vibration; however, in nonlinear response regimes, the system response now includes both modesof interest (coupled through Nq(q)). The 2-DOF NLROM created using the ICE method is used to find theNNMs and study the forced response of the structure as described in Sections 3.2 and 3.4.
3.2 Nonlinear normal modes
In this work, NNMs are defined as non-necessarily synchronous periodic solutions of the conservative equa-tions of motion (1). A number of numerical algorithms were developed to compute NNMs, as recentlyreviewed in Ref. [13]. The method considered here combines shooting and pseudo-arclength continuationtechniques and is freely available in the so-called NNMcont software package [14].
The NNMs of this structure exhibit strong coupled dynamic motions between the bending- and torsion-dominated LNMs as seen in Fig. 3. At low energies, the deformation of the first NNM (NNM1) and secondNNM (NNM2) match the corresponding LNM shapes. At higher response energies, the NNM deformationsexhibit a veering phenomenon where the deformations are an equal combination of the underlying LNMs,but are separated by 0.13 Hz. As the response is pushed passed the region of veering, the deformation ofNNM1 resembles the torsion dominated LNM (i.e. LNM2) and NNM2 resembles the bending dominatedLNM shape (i.e. LNM1).
The change in the deformation of the NNMs can also be examined in terms of the first and second LNMamplitude (Figs. 4(a, b)). For frequencies close to the linear natural frequencies, the amplitude of LNM1dominates the response of NNM1 whereas the amplitude of LNM2 dominates NNM2. As frequency in-creases, the LNM contributions to the NNMs are swapped such that NNM1 is dominated by LNM2 andNNM2 by LNM1.
3.3 Nonlinear force appropriation
The forced damped dynamics of system (1) can be written in linear modal space as
q̈ + Ξq̇ + Λq + Nq(q) = p, (3)
where Ξ = diag(2ζ1ω1, 2ζ2ω2) is the modal damping matrix and p is the modal forcing vector. As wasdone in Refs. [10, 15, 16], the energy balance technique can be used to find the multi-point multi-harmonicinput force p that puts the same amount of energy into the structures (Ein/cycle) as is dissipated by damping(Ediss./cycle). Considering the structure response qnnm(t) at a given NNM, the balance between the input anddissipated energy per cycle writes∫ T
0q̇T
nnmΞq̇nnmdt =
∫ T
0q̇T
nnmp =∑k
∫ T
0q̇T
nnmck sin(kωt), (4)

Figure 3: Frequency-energy plot of the nonlinear normal modes of the clamped-clamped cross beam structureROM. (–) First NNM; (– –) second NNM. Mode shapes are inset.
(a) (b)
Figure 4: Amplitude of the first (a) and second (b) linear modal coordinates for the nonlinear normal modesof the clamped-clamped cross beam structure. (–) First NNM; (– –) second NNM.
where the second equality is obtained by fixing the phase of the periodic excitation and ck is the force ampli-tude vector at the harmonic k. Equation (4) is exploited in Section 3.4 to estimate the forcing coefficients ckrequired to balance the damping introduced by Ξ when the system oscillates according to one of its NNM.In practice, the NNM is not known a priori, so one generally has to tune the input force until the phasequadrature condition is met.

3.4 Comparison between the NNMs and the forced response
The particular case of an ideal force distribution as given by Equation (4) is studied before investigating otherinput force distributions.
The appropriate force is calculated for NNM1 at several response amplitudes. The modal force vector pT =[p1 p2] includes contributions from both LNMs (p1 6= 0 and p2 6= 0) due to the coupling introduced bynonlinearity. The response in LNM1 and LNM2 is reported in Figure 5(a) and 5(b), respectively. Theagreement between the peak response, the quadrature condition and the backbone curve of NNM1 (solid-black) is excellent. The presence of a LNM2 component in the forcing leads to the presence of a secondresonance peak and a phase quadrature condition around NNM2 (Figure 5(b)). Such a peak and phasetransition are not visible in the response of LNM1 because the response regimes for which NNM2 includessignificant LNM1 contributions are not yet reached.
(a) (b)
Figure 5: Amplitude of the first (a) and second (b) linear modal coordinates for the nonlinear normal modesof the clamped-clamped cross beam structure. First (–) and second (– –) NNM backbone curve. The colourcode represents the phase lag φ between the LNM response and the excitation. Blue: φ < 89.7◦; green:φ = 90◦; red: φ > 90.3◦.
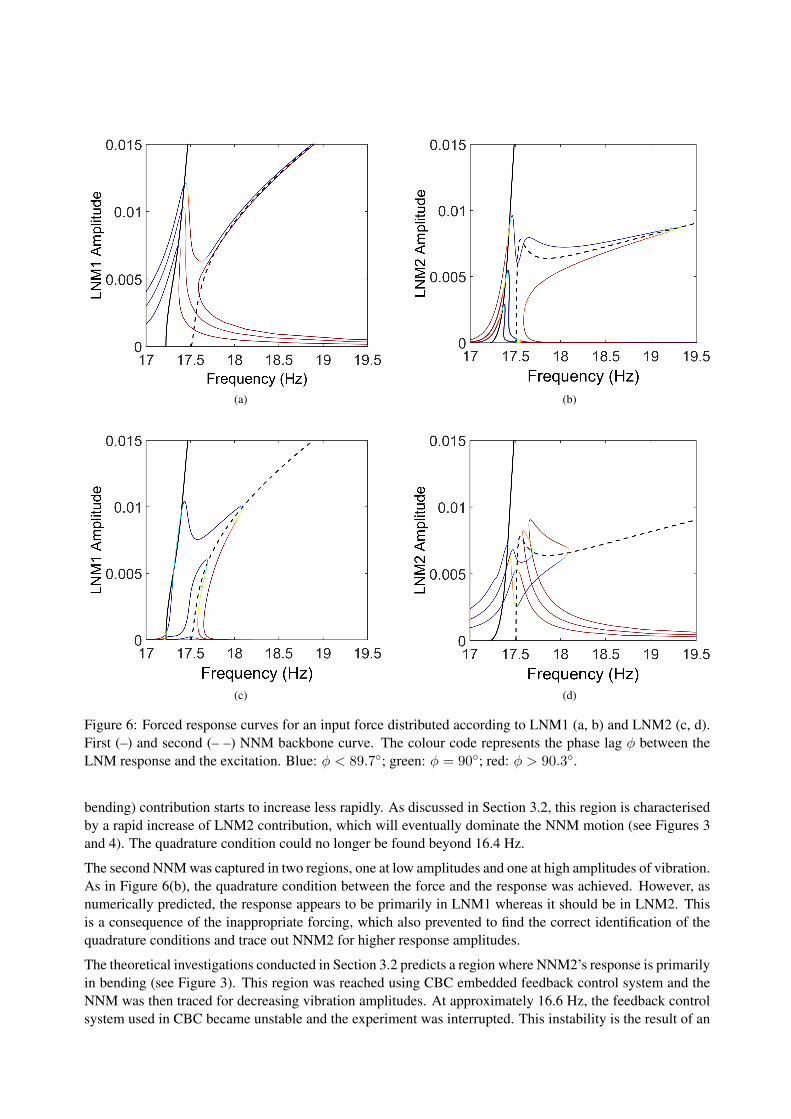
The particular case of an excitation applied to a single LNM is now investigated. Figure 6(a, b) shows forthree force amplitudes the response of the structure when the excitation is distributed according to LNM1(i.e., pT = [p1 0], p1 6= 0). The response in LNM1 (Fig. 6(a)) shows a first resonance peak close to NNM1backbone curve. For the low-amplitude response curve, the NNM, the phase quadrature condition, and theresonance peak are all in good agreement with each other. For larger response amplitudes, however, theNNM starts to deviate from the peak response and the quadrature condition no longer lines up with the peakamplitude nor the NNM. This is a direct consequence of the absence of LNM2 components in the excitation.Similar observations are made when looking at the response in LNM2 (Figure 6(b)). Although NNM1 andthe phase quadrature condition are in good agreement, they do not match the forced response resonance peak.
As seen in Section 3.2, the second NNM can contain strong LNM1 contributions when at high vibrationamplitudes (see Figure 3). This leads to the presence of a resonance peak around NNM2 backbone curve forhigh-amplitude responses (Figure 6(a)).
The high-amplitude response curve in Figure 6(a) shows a second phase transition, occurring between thefirst and second resonance peak. This transition is the consequence of a Neimark-Sacker bifurcation atwhich periodic solutions lose stability and quasi-periodic oscillations become visible. This phenomenon
was already numerically and experimentally observed for this structure in Ref. [17]. The resonant responsearound NNM2 is not visible for the first two force levels. It is in fact detached from the main forced responsecurve and would therefore form loops of isolated solutions in Figures 6(a) and 6(b) (not represented here forclarity).
The response of the structure in LNM2 (Figure 6(b)) clearly highlights the presence of the coupling termsbetween LNM1 and LNM2 introduced by nonlinearity. If the structure was linear, LNM2 response wouldbe identically zero and the second resonance peak in (Figure 6(a)) would be absent. A consequence of thiscoupling is that a quadrature condition at NNM2 can be reached at low amplitude, i.e. when NNM2 isdominated by LNM2. However, this quadrature region does not correspond to any resonance peak.
The response of the structure to a forcing in LNM2 (pT = [0 p2], p2 6= 0) is presented in Figure 6(c,d). The intermediate-amplitude response curve in LNM2 presents a first resonance peak located betweenNNM1 and NNM2 backbone curves. Furthermore, this peak does not correspond to any phase transitionin the forced response. For higher response amplitudes, the increasing importance of LNM2 in NNM1 (cf.Section 3.2) leads to a resonance peak and a quadrature condition that matches well the backbone curveof NNM1. At this force level, LNM1 also shows a resonance peak close to NNM1. The disagreementbetween the resonance peak and NNM comes from the absence of LNM1 contributions in the applied force.Furthermore, the solution curve does not present any clear phase transition. This shows that excited modes(equivalently, degrees of freedom) can be in quadrature with the excitation whereas the other modes (DOFs)are not.
4 Experimental results
To demonstrate the importance of the applied excitation in the experimental identification of NNMs, thestructure was tested using a single shaker attached to the main beam, providing pure bending excitation. TheCBC technique described in Ref. [8] was used to measure the NNMs of the structure. The method combinesfeedback control and path following techniques in order to follow the steady-state responses of the system asparameters are varied. In this paper, the CBC method was exploited to track the periodic responses that arein quadrature with the excitation as a function of the response amplitude. The π
2 -quadrature condition wasexperimentally reached within ±0.005 rad.
The feedback control system considered in CBC was a simple linear proportional-plus-derivative feedbackcontrol system with fixed gains. The reference signal was chosen as the velocity integrated from an ac-celerometer located on the cross beam in order to capture both bending and torsion motions. The obtainedvelocity signal was high-pass filtered using a fourth-order Butterworth filter in order to remove the DC com-ponent introduced by time integration. The filter cut-off frequency was chosen at 8 Hz, which representeda good compromise between the introduced delay and the stability of the filter. Proportional and derivativegains were kept constant and equal to 0.5 and -0.0025 throughout the tests.
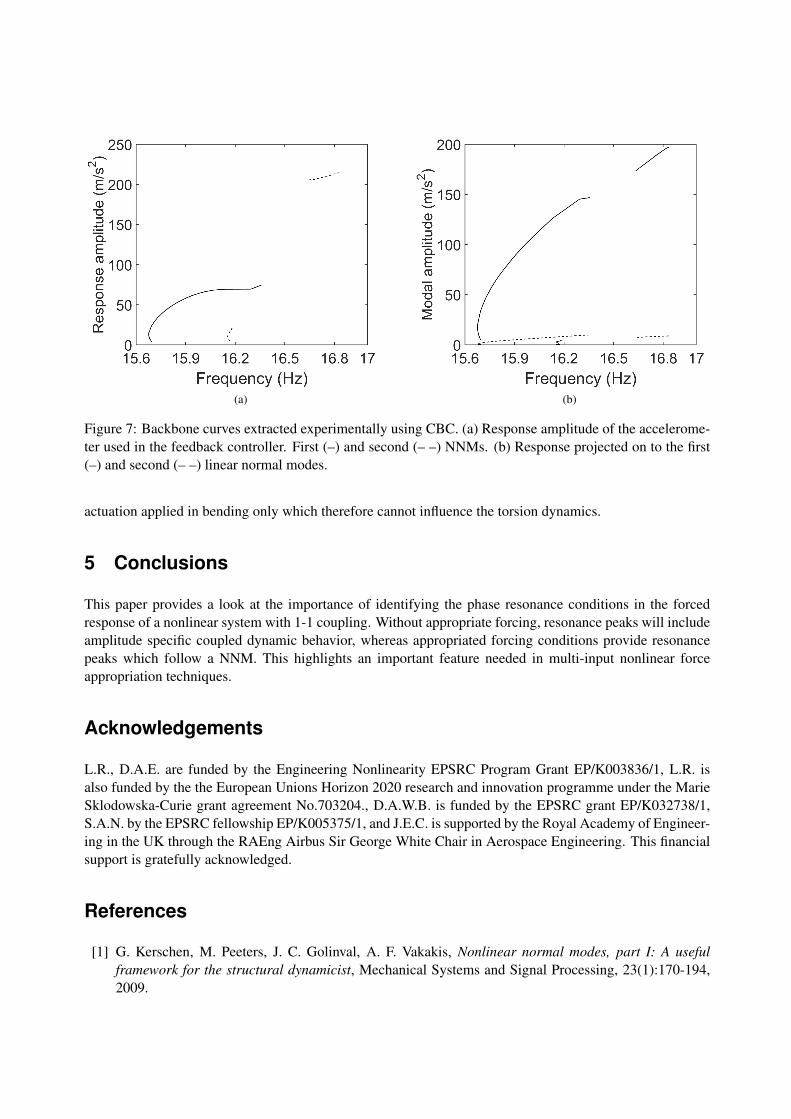
Fig. 7(a) shows in a response frequency – response amplitude plot the first NNM (–) and second NNM (––) of the clamped-clamped cross beam. For both NNMs, the resonance frequency of the smallest-amplitudedata point is in good agreement with the linear natural frequencies identified using impact-hammer data (seeTable 1). This shows that CBC has discarded effectively the influence of the excitation system. Up to ap-proximately 20 m/s2, the resonance frequency of both NNMs decreases for increasing vibration amplitudes.This is attributed to gravity-induced static deformations and imperfect clamping boundary conditions. Forvibration amplitudes larger than 20 m/s2, the geometrical coupling that exists between the bending and axialbeam deformations introduces hardening nonlinearities and the resonance frequencies increase, as theoreti-cally predicted and modeled in Section 3.2.
Both NNMs presented in Fig. 7(a) are incomplete and could only be captured in regions where the response isdominated by bending motions. This is clearly illustrated in Figure 7(b) where both NNMs are projected ontoLNM1 and LNM2. NNM1 was captured up to approximately 16.4 Hz, frequency at which the LNM1 (i.e.
(a) (b)
(c) (d)
Figure 6: Forced response curves for an input force distributed according to LNM1 (a, b) and LNM2 (c, d).First (–) and second (– –) NNM backbone curve. The colour code represents the phase lag φ between theLNM response and the excitation. Blue: φ < 89.7◦; green: φ = 90◦; red: φ > 90.3◦.
bending) contribution starts to increase less rapidly. As discussed in Section 3.2, this region is characterisedby a rapid increase of LNM2 contribution, which will eventually dominate the NNM motion (see Figures 3and 4). The quadrature condition could no longer be found beyond 16.4 Hz.
The second NNM was captured in two regions, one at low amplitudes and one at high amplitudes of vibration.As in Figure 6(b), the quadrature condition between the force and the response was achieved. However, asnumerically predicted, the response appears to be primarily in LNM1 whereas it should be in LNM2. Thisis a consequence of the inappropriate forcing, which also prevented to find the correct identification of thequadrature conditions and trace out NNM2 for higher response amplitudes.
The theoretical investigations conducted in Section 3.2 predicts a region where NNM2’s response is primarilyin bending (see Figure 3). This region was reached using CBC embedded feedback control system and theNNM was then traced for decreasing vibration amplitudes. At approximately 16.6 Hz, the feedback controlsystem used in CBC became unstable and the experiment was interrupted. This instability is the result of an
(a) (b)
Figure 7: Backbone curves extracted experimentally using CBC. (a) Response amplitude of the accelerome-ter used in the feedback controller. First (–) and second (– –) NNMs. (b) Response projected on to the first(–) and second (– –) linear normal modes.
actuation applied in bending only which therefore cannot influence the torsion dynamics.
5 Conclusions
This paper provides a look at the importance of identifying the phase resonance conditions in the forcedresponse of a nonlinear system with 1-1 coupling. Without appropriate forcing, resonance peaks will includeamplitude specific coupled dynamic behavior, whereas appropriated forcing conditions provide resonancepeaks which follow a NNM. This highlights an important feature needed in multi-input nonlinear forceappropriation techniques.
Acknowledgements
L.R., D.A.E. are funded by the Engineering Nonlinearity EPSRC Program Grant EP/K003836/1, L.R. isalso funded by the the European Unions Horizon 2020 research and innovation programme under the MarieSklodowska-Curie grant agreement No.703204., D.A.W.B. is funded by the EPSRC grant EP/K032738/1,S.A.N. by the EPSRC fellowship EP/K005375/1, and J.E.C. is supported by the Royal Academy of Engineer-ing in the UK through the RAEng Airbus Sir George White Chair in Aerospace Engineering. This financialsupport is gratefully acknowledged.
References
[1] G. Kerschen, M. Peeters, J. C. Golinval, A. F. Vakakis, Nonlinear normal modes, part I: A usefulframework for the structural dynamicist, Mechanical Systems and Signal Processing, 23(1):170-194,2009.

[2] M. Peeters, R. Viguie, G. Serandour, G. Kerschen, J. C. Golinval, Nonlinear normal modes, part II:Toward a practical computation using numerical continuation techniques, Mechanical Systems andSignal Processing, 23(1):195-216, 2009.
[3] M. Peeters, G. Kerschen, J. C. Golinval, Dynamic testing of nonlinear vibrating structures using non-linear normal modes, Journal of Sound and Vibration, 330(3):486-509, 2011.
[4] M. Peeters, G. Kerschen, J. C. Golinval, Modal testing of nonlinear vibrating structures based onnonlinear normal modes: Experimental demonstration, Mechanical Systems and Signal Processing,25(4):1227-1247, 2011.
[5] J. M. Londono, S. A. Neild, J. E. Cooper, Identification of backbone curves of nonlinear systems fromresonance decay responses, Journal of Sound and Vibration, 348(0):224-238, 2015.
[6] J. M. Londono, J. E. Cooper, S. A. Neild, Identification of systems containing nonlinear stiffnessesusing backbone curves, Mechanical Systems and Signal Processing, in press.
[7] J. L. Zapico-Valle, M. Garcia-Diguez, R. Alonso-Camblor, Nonlinear modal identification of a steelframe, Engineering Structures, 56(0):246-259, 2013.
[8] L. Renson, A. Gonzalez-Buelga, D. A. W. Barton, S. A. Neild, Robust identification of backbone curvesusing control-based continuation, Journal of Sound and Vibration, 367:145-158, 2016.
[9] L. Renson, D. A. W. Barton, S. A. Neild, Experimental analysis of a softening-hardening nonlinear os-cillator using control-based continuation, Proceedings of the International Modal Analysis Conference(IMAC), Orlando, USA, 2016.
[10] D. A. Ehrhardt, M. S. Allen, Measurement of nonlinear normal modes using multi-harmonic steppedforce appropriation and free decay, Mechanical Systems and Signal Processing, 7677:612-633, 2016.
[11] R. J. Kuether, B. J. Deaner, J. J. Hollkamp, M. S. Allen, Evaluation of geometrically nonlinear reduced-order models with nonlinear normal modes, AIAA Journal, 53(11):3273-3285, 2015.
[12] D. A. Ehrhardt, S. A. Neild, J. E. Cooper, Experimental and numerical investigation of the nonlinearbending-torsion coupling of a clamped-clamped beam with centre masses. Proceedings of the Interna-tional Modal Analysis Conference (IMAC), Orlando, USA, 2016.
[13] L. Renson, G. Kerschen, B. Cochelin, Numerical computation of nonlinear normal modes in mechani-cal engineering, Journal of Sound and Vibration, 364:177-206, 2016.
[14] NNMcont - A matlab package for the computation of nonlinear normal modes.http://www.ltasvis.ulg.ac.be/cmsms/index.php?page=nnm#package, 2014.
[15] R. J. Kuether, L. Renson, T. Detroux, C. Grappasonni, G. Kerschen, M. S. Allen, Nonlinear normalmodes, modal interactions and isolated resonance curves, Journal of Sound and Vibration, 351:299-310, 2015.
[16] T. L. Hill, A. Cammarano, S. A. Neild, D. J. Wagg, Interpreting the forced response of a two-degree-of-freedom nonlinear oscillator using backbone curves, Journal of Sound and Vibration, 349:276-288,2015.
[17] D. A. Ehrhardt, T. L. Hill, S. A. Neild, J. E. Cooper, Nonlinear bending-torsion coupling of a clamped-clamped beam with tuneable masses, Submitted, 2016.