Resourcing Strategy 2021 - tweed.nsw.gov.au
64
Resourcing Strategy 2021 Supporting the 2017–2027 Community Strategic Plan
Transcript of Resourcing Strategy 2021 - tweed.nsw.gov.au

Resourcing Strategy 2021Supporting the 2017–2027 Community Strategic Plan

Council values and statements
What we value
‘Living and Loving the Tweed’
We look after people and our places, explore all opportunities, and are proud of our passionate approach.
We care about each other, choose to be here, and are in this together.
We have conversations where everyone can contribute, and we are willing to have a go.
We put back in to make a difference, so that our Tweed community is even better tomorrow than it is today.
Vision
The Tweed will be recognised for its desirable lifestyle, strong community, unique character and environment and the opportunities its residents enjoy.
Mission
Working with community and partners, provide leadership in facilitating and delivering services that manage growth sustainably, create opportunity and enhance the value of our civic and natural assets for this and future generations.
Statement of acknowledgement of the Bundjalung Aboriginal Nation
We wish to recognise the generations of the local Aboriginal people of the Bundjalung Nation who have lived in and derived their physical and spiritual needs from the forests, rivers, lakes and streams of this beautiful valley over many thousands of years as the traditional owners and custodians of these lands.

Resourcing Strategy 2021 1
Contents
Introduction 2Background – Legislative Framework 2
What is a workforce management plan? 5Key themes of Council’s Workforce Management Plan 6
Establish Council as an employer of choice 8Strategies/actions 8Targets 8
Provide professional learning and development opportunities for all staff 10Strategies/actions 10Targets 10
Prioritise staff safety, health and wellbeing 12Strategies/actions 12Targets 12
Strengthen workplace diversity 14Strategies/actions 14Targets 14
Plan for our future workforce 16Strategies/actions 16Targets 16
Supporting the Workforce Management Plan 17
Celebrating our successes: Recognising our achievements 18
Section 2: Asset Management Planning 20
Introduction 21Asset Management 21Asset Management issues 21Asset Management – current and future condition 22
Section 3: Long-term Financial Plan 32
Introduction 33Long-term Financial Plan structure and format 33Financial goals – consolidated 34Assumption and estimates 36Reviewing of the Long-term Financial Plan 38

Resourcing Strategy 20212
Introduction
The Resourcing Strategy forecasts Council’s ability to deliver assets and services to the community over the next 10 years in line with the adopted Community Strategic Plan 2017–2027 – Living and loving the Tweed.
Its aim is to ensure that the resources are available as and when required to achieve the Community Strategic Plan:
• People – Workforce Management Plan• Assets – Asset Management Planning• Finances – Long-term Financial Plan
Background – Legislative Framework
The Integrated Planning and Reporting Framework requires that Council prepare:
• A 10-year Community Strategic Plan to be developed in consultation with the community, State Government agencies and other relevant stakeholders. The purpose of the plan is to identify the community’s main priorities and aspirations for the future and to plan strategies for achieving these goals.
• A four (4) year Delivery Program that details all activities Council will be committing to over the next four years to work towards achieving its long term objectives as documented in the Community Strategic Plan.
• An annual Operational Plan that specifies individual activities Council will be undertaking during the year together with details of income and expenditure estimates for the year. These activities are drawn from the Delivery Program which is based on the Community Strategic Plan.
• A Resourcing Strategy which is aimed at ensuring that the resources – money, assets and people – required to achieve the Community Strategic Plan are available as and when required. The Resourcing Strategy is focussed purely on Council’s responsibilities in the roles of leader and provider.
The figure opposite graphically demonstrates the flow of the Integrated Planning and Reporting Framework.

Resourcing Strategy 2021 3
Community Engagement Strategy
Community Strategic Plan 2017–2027
Goals Strategies/actions Targets
Delivery Program 2017–2021
4-year strategies/actions 4-year financials
Operational plans
Annual deliverablesService Key
Performance Indicators
Annual budget
Resourcing Strategy
Asset Management Plan
Workforce Management Plan
Long-term Financial Plan
The Resourcing Strategy supports the Community Strategic Plan 2017–2027 and guides the deliverables outlined in the Delivery Program 2017–2021 and operational plans

Section 1: Workforce Management Plan 2017–2021

Resourcing Strategy 2021 5
What is a workforce management plan?
At Tweed Shire Council our most important resources are our people, so it’s important to regularly review our workforce against our strategic objectives to ensure we have the capacity now and in the future to deliver services and support to the Tweed community.
Workforce management planning ensures that Council has the right people, with the right skills, at the right time, undertaking the right jobs. It supports the achievement of goals detailed in Council’s Delivery Program which is informed by the Community Strategic Plan.
RIGHT JOBS
Matched to current and future community needs
RIGHT PEOPLEBehavioural/cultural fit
RIGHT SKILLSTechnical capacity to deliver
RIGHT TIME
Available when needed
Tweed Shire Council delivers a diverse range of services, with a large multi-skilled workforce, in what is a competitive regional employment market. This presents a number of challenges including:
• Attracting and retaining skilled staff.• Growing community expectations .
of Council.• Technological advancements.• Skill shortages.• Ageing workforce issues.
In order to address these challenges Council must:
• Demonstrate strong leadership.• Have a contemporary, inclusive and
adaptable organisational culture. • Prioritise staff safety, wellbeing and
professional development.• Meet its legislative requirements.• Have employee diversity that is reflective
of the Tweed community.

Resourcing Strategy 20216
Key themes of Council’s Workforce Management Plan
Council has taken a strategic approach to addressing these key challenges and has identified five core actions as the basis for the Workforce Management Plan:
1Establish Council as an employer of choice
2 Provide professional learning and development opportunities for all staff
3 Prioritise staff safety, health and wellbeing
4Strengthen workplace diversity
5Plan for our future workforce
The Workforce Management Plan aligns directly with principal stream 4 of the Community Strategic Plan 2017–2027:
Behind the scenes: Providing support to make it happen
Sub-stream 4.2: Support Services
The goal being to:
‘Foster safe, productive and professional workspaces, enabling Council staff to source, manage and maintain services to the community.’
As with the Community Strategic Plan, Council’s Workforce Management Plan is underpinned by support documents that detail planned projects, budgets, timeframes and responsibilities. Support structures for this plan are detailed under the heading ‘Supporting the Workforce Management Plan’ on page 17.
Flexibility within the strategies and actions identified within each theme area is required to enable unexpected emerging issues or new ideas and solutions to be included.
7Resourcing Strategy 2021
1Establish Council as an employer of choice
Tweed Shire Council needs to consistently attract and retain enthusiastic and qualified staff to deliver services and meet the growing expectations of the Tweed community.
A number of Council Staff participated in group workshops in the development of the Organisational Values.
They were asked “What are the best things about working at Tweed Shire Council?”
Their responses included:
People are amazing
Good teamwork
Friendly culture
Working conditions
Seems more people at the top care
Lots of professions
Helping the community on the ground
Good training opportunities
Treated well and opportunities
are provided
Teams are passionate about what they do
Working for the community – putting back in
8 Resourcing Strategy 2021
Establish Council as an employer of choice
In a competitive labour market, a strong brand reputation and employer profile are essential in recruiting quality people.
Being an ‘employer of choice’ simply means becoming an organisation who potential and existing employees want to work for, over and above others in the same marketplace.
In the modern work environment, employees are seeking more than just job and financial security. Significant value is now being placed on cultural fit and work practices that best suit an individual’s lifestyle and career aspirations.
This means placing greater emphasis on workplace culture, communication and consultation, as well as promoting work/life balance initiatives, and staff reward and recognition schemes.
Strategies/actions
We need to:
• Ensure Council’s values underpin all policies, protocols, processes and practices.• Ensure we ‘walk the talk’ and live our organisational values.• Have conversations with staff to understand their needs and seek their input on making
things better.• Promote local government as a desirable and progressive career path where you can make a
real difference.• Promote a work environment that recognises the need to achieve work/life balance.• Celebrate our achievements and successes.• Ensure contemporary and best practice principles underpin our people management plans.• Challenge traditional work practices, embrace innovation, flexibility and equal opportunity.
Targets
We aim to:
• Maintain staff turnover in line with industry benchmarks.• Achieve greater than 75% overall staff satisfaction of Council as an employer.• Obtain White Ribbon Workplace Accreditation.*• Increase the number of employees new to Local Government.
*White Ribbon Accreditation recognises organisations for:
– taking active steps to prevent and respond to violence against women; – drive social change; and – showcase a workplace committed to equity and respect.

9Resourcing Strategy 2021
2 Provide professional learning and development opportunities for all staff
At Tweed Shire Council our employees are our most important resource – to invest in them is to invest in our future and the future of the community.

10 Resourcing Strategy 2021
Provide professional learning and development opportunities for all staff
With changing technology, community expectations, and service delivery models, skills need to be continually updated and new capabilities developed.
Half of Council’s current workforce is eligible to retire within the next 10 years. We need to plan for what these changes will bring by looking at how we work and attracting and nurturing new talent.
Addressing skills shortages, staff retention, and job satisfaction are important areas that can be improved through learning and development programs.
Learning and development opportunities need to be targeted, resource efficient, engaging, valued, timely and result in measurable improvements in knowledge, skill and or behaviour.
Strategies/actions
We need to:
• Deliver a blended learning culture that combines on the job learning with formal training.• Develop and implement a whole of organisation leadership framework that is visionary
and transparent.• Develop and implement a suite of programs to support and strengthen Council’s capacity
to deliver.• Challenge traditional work practices to ensure future outcomes are relevant and contemporary.• Actively review and seek feedback on our performance embedding a culture of process
improvement.• Nurture the talent of high performing individuals across all levels of the organisation,
supporting their potential as future leaders.
Targets
We aim to:
• Implement the Learning and Development Strategy.• Decrease skill shortage gaps.• Increase staff satisfaction with organisational leadership.• Develop and implement a Business Excellence Framework.• Identify employees to participate in Future Leaders Program.

11Resourcing Strategy 2021
3Prioritise staff safety, health and wellbeing
At Tweed Shire Council, the safety, health and wellbeing of our staff is our number one priority.

12 Resourcing Strategy 2021
Prioritise staff safety, health and wellbeing
Council’s approach is that all injuries are unacceptable and our commitment is to the provision of a safe and healthy work environment for our employees, volunteers, contractors and visitors.
A large percentage of Council’s workforce undertakes high risk duties with much of this work being undertaken in public spaces. All our staff have the right to return home safely from work to their loved ones each day.
Safety today is about much more than illness and injury prevention and return to work programs. Our approach also includes broad based health and wellbeing strategies, programs to manage occupational aggression, transitional strategies for ageing workers and meeting increased legislative obligations relating to design, procurement and contractor management.
Strategies/actions
We need to:
• Embrace an organisational culture that identifies and addresses risks in all facets of work.• Continue to promote a safe working culture as an organisational priority.• Integrate safety into project design, procurement and contract management and monitor
its implementation.• Ensure the community understands that aggression and abuse towards Council staff from
members of the public will not be tolerated.• Support staff who have experienced occupational aggression from members of the public.• Ensure health and wellbeing initiatives are accessible and relevant to Council’s diverse
workforce needs.• Value and actively look after our own and our colleagues’ physical and mental wellness.• Value the contribution of Council’s ageing workforce and continue to support these
employees through potential new career paths and retirement transition initiatives.
Targets
We aim to:
• Increase participation levels in Council’s Health and Wellbeing initiatives.• Have less than 3 health and safety incidents per 100 full time equivalent staff each year.• Have less than 15 lost time injuries each year.• Implement Enterprise Risk Management Framework.

13Resourcing Strategy 2021
4Strengthen workplace diversity
Tweed Shire Council embraces and values people of all abilities and where possible includes identified positions to attract employees from areas that have traditionally had low levels of workplace representation.
Indigenous employment• 2.71% of the Tweed community identify as Aboriginal or
Torres Strait Islander• 2.79% of Council employees identify as Aboriginal or
Torres Strait Islander.• 12.5% of our current trainees and apprentices identify as
Aboriginal or Torres Strait Islander.
Youth employment• 13.08% of Council employees are under 35 years of age. • 30% of the total Tweed Shire workforce is under 35. • Council hosts 30 young trainees and apprentices.• 26% of labour hire placements are under 35 years of age.
Women employees• 29% of Council employees are women.• 14.3% of Managers and senior staff are women.• 58 women are employed in non-traditional female roles
e.g. engineering and trades. • 15% of our current apprentices and trainees are women.• 40% of labour hire placements are women.
Ageing workforce• 47.68% of Council’s workforce is 50 or older, with
10.13% being 60 or older.• 28% of Council’s current workforce will be able to access
their superannuation and retire within the next 5 years with close to 50% eligible to retire within 10 years.
14 Resourcing Strategy 2021
Strengthen workplace diversity
As a local government authority it is important that our workforce reflects the diversity in our communities and positively contributes to correcting historical inequitable imbalances. Given the gaps in diversity and gender representation in our current workforce, the priority areas to help improve this are enhanced employment and promotion opportunities for women, young people and those who identify as Aboriginal and Torres Strait Islanders.
Council should embrace and value people of all abilities and where possible, establish identified positions to attract employees from areas that have traditionally had low levels of mainstream workplace representation.
Increasing diversity will also assist with addressing issues associated with our rapidly ageing workforce.
Strategies/actions
We need to:
• Challenge traditional work practices to embrace innovation, flexibility and equal opportunity.• Promote local government to the broader community as a desirable and progressive career path
where ‘you can make a real difference’.• Develop and implement initiatives to increase the number of Gen Y and millennial employees.*• Develop and implement initiatives that attract and retain employees who identify as
Aboriginal/Torres Strait Islander and through culturally safe and sensitive support structures, provide career pathways across Council’s diverse range of services.
• Develop and implement initiatives to increase the number of women employees and provide career development paths for women with a focus on engineering, trades, management and field based roles.
Targets
We aim to:
• Increase representation of employees who identify as Aboriginal or Torres Strait Islander across all service areas of Council and across all job grades.
• Meet local government benchmarks for women employees.• Increase entry level and youth employment opportunities.
*Gen Y or millennials are those people born between 1977 and 1995.

15Resourcing Strategy 2021
5Plan for our future workforce
As a community, the Tweed is rapidly evolving and Council needs to keep pace

16 Resourcing Strategy 2021
Plan for our future workforce
The Tweed Shire Council of 10 years ago is very different to the modern local government organisation we are now – and will be very different again in another 10 years’ time.
With changing customer expectations, increased cost shifting from other levels of government, technological advancements, legislative changes and reform, Council’s workforce needs will change significantly over time.
To remain competitive and to respond to community expectations, Council needs to ensure its workforce management strategies remain contemporary, and that performance data is used to benchmark ourselves against leaders in any field within which we operate.
Strategies/actions
We need to:
• Value and retain organisational knowledge held by individuals ensuring it is preserved and transferred to relevant colleagues.
• Nurture the talent of high performing individuals across all levels of the organisation, recognising their potential as future leaders.
• Implement integrated Human Resource management information practices to provide access to more accurate and timely data, delivering improved operational efficiencies.
• Promote a culture that embraces new technologies and emerging workplace innovations.• Ensure all employees understand their role in, and are equipped to provide, genuine and
responsive customer service delivery.• Commit to being individually responsible and accountable for performing our roles and make
the changes we need to improve our performance in the future.
Targets
We aim to:
• Identify employees to participate in Future Leaders Program.• Identify critical positions and individuals for knowledge transference.• Develop and implement a knowledge transference framework.• Develop and implement a Business Excellence Framework.• Fully implement an integrated Human Resource Information System.• Deliver customer centred service delivery training across the organisation.

Resourcing Strategy 2021 17
Supporting the Workforce Management Plan
The following documents have informed the development of the Workforce Management Plan.
• Community Strategic Plan – 2017–2027: Living and Loving The Tweed• Human Resources Operational Plan 2017–2019• Work Health and Safety Strategic Plan 2015–2018• Learning and Development Strategy 2016• Health and Wellbeing Strategy 2016• Learning and Development Operational Plan 2016–2018• Australasian Local Government Performance Excellence Program FY2016
The following documents will provide mechanisms to implement the Workforce Management Plan strategies:
• Human Resources Operational Plan 2017–2019• Learning and Development Strategy 2016• Work Health and Safety Strategic Plan 2015–2018• Health and Wellbeing Strategy 2016• Learning and Development Operational Plan 2016–2018
The following internal committees of Council, comprising management, employee and union representatives, assist in the development, implementation, evaluation and review of the Workforce Management Plan:
• Industrial Relations Subcommittee• Reconciliation Action Plan Working Group• Consultative Committee• Equal Opportunity Subcommittee• WHS/Executive Management Team Committee• WHS Committee (Field and Office)• Occupational Aggression Working Group• Human Resources Steering Committee• Learning and Development Subcommittee• Corporate Management Team• Job Evaluation Committee
The following committees of Council comprising external membership will assist Council with advice on feedback throughout the Workforce Management Plan’s implementation:
• Aboriginal Advisory Committee• Youth Council• Equal Access Advisory Committee

Resourcing Strategy 202118
Celebrating our successes: Recognising our achievements
Council’s annual Service and Productivity Excellence Awards recognise and celebrate the great work we do here at Council and the dedicated and innovative people behind the scenes.
Excellence of individuals and teams is recognised in the following categories.
Smarter ways of working• Delivering a more efficient and effective service• Creating an easier process• Using an existing Council system more efficiently• Reducing red-tape• Achieving value for money • Improving safety
Innovation• Trying something new• Thinking outside the box• Finding an innovative solution to a complex issue• Creative ways to solve a problem
Working collaboratively• Improved teamwork through whole-of-Council collaboration• Sharing knowledge and keeping each other informed• Teamwork that saves time or resources• Considering impacts and benefits of our work on colleagues in other teams• Partnering with external agencies and services
Customer ServiceRecognising staff whose interactions with their colleagues and external customers is always genuine, friendly and professional. They keep their customers updated along the way and the service they provide is consistently meaningful, respectful and memorable for all the right reasons.
Sustainability• Being more productive in a sustainable way • Adopting sustainable business practices• Applying environmentally beneficial processes, systems or practices• Reducing our footprint on the environment• Using materials and practices promoting reuse, reduce and recycle principles
Caring, Committed and CooperativeTo recognise those colleagues who, through their positive can do attitude, make Tweed Shire Council a better place. When their workmates need a hand or deadlines need to be met, they roll up their sleeves, pitch in and help. They go that extra mile often flying under the radar to support the organisation. Nothing is too much trouble for them and you wish more people were like them.
A customised professional development opportunity is developed with each of the winners. This may include attending a special conference, workshop, seminar or other learning and professional development activity.

Resourcing Strategy 2021 19

Section 2: Asset Management Planning

Resourcing Strategy 2021 21
Introduction
Assets are physical objects owned, controlled and/or maintained by Council to deliver services to the community. Assets provide the foundation on which the community carries out its everyday activities while contributing to overall quality of life.
Roads and paths meet transport and access needs; facilities provide for cultural, recreational, health, community and civic purposes; parks and reserves provide recreational opportunities and enhance community life; underground stormwater drainage provides for public safety and the protection against property damage; water, wastewater and waste infrastructure provides for public health.
Asset Management
Asset Management is a process of logic used to guide the planning, acquisition, operation and maintenance, renewal and disposal of assets. Its objective is to maximise asset service delivery potential and manage related risks and costs over their entire lifecycle. In simplest terms, asset management is about the way in which the Council looks after its assets, both on a day-to-day basis (i.e. maintenance and operations) and in the medium to long term (i.e. strategic and forward planning).
The challenge in asset management is to understand the manner in which the Council’s assets perform over time and whether they can be maintained in a “fit for purpose” condition, given that many cannot be seen and/or were built many years ago.
Asset Management issues
The majority of Council’s assets were first constructed at the same time the original suburbs were built. These assets are approaching half of their expected life and, as such, the physical condition will further deteriorate in the coming years. In addition, Council has also received in recent years an increasing amount of contributed assets from developments.
At the same time, population growth as identified by recent studies and increased economic activity are challenging the capacity of existing assets to meet the increasing demands and changes in our environment.
Community expectations are also changing, which affect the ability of existing assets to meet the functional needs of the community.
The following provides a general assessment of the issues Council is currently experiencing and will need to address in the near future:
• Adopting good-practice asset management strategies to ensure the intergenerational sustainability of community assets.
• Ensuring the required funding is available to upgrade the existing assets of the Council to meet changing expectations of the community.
• Being able to reliably predict the condition of assets after 10 years’ time at the current rate of expenditure.
• Ensuring sound risk management and mitigation associated with Council’s assets.• Community education/involvement and understanding of levels of service and the
relationship between funding and service delivery.• Life cycle costing to justify new assets.• Future maintenance needs for new infrastructure and managing sustainability.

Resourcing Strategy 202122
Asset Management – current and future condition
Tweed Shire Council manages a broad range of assets valued in excess of $2.8 billion.
The following information outlines, by major asset category, the current:
Quantity of assets The physical number or length or size of the assets.
Value of the assets The cost to replace/renew the asset.
The current value of the asset after deducted depreciation (or the amount of the asset already consumed).
Condition of assets at a system/network level The system/network level is the average of all the asset condition ratings within the asset category.
Long-term Financial Plan funding The funds included with the Long-term Financial Plan applied to the renewal (capital) and maintenance of the asset category.
Long term system/network condition The predicted condition of the assets at a system/network level after 10 years based on the funding levels adopted in the Long-term Financial Plan.
Major asset category Includes assets such as
Storm Water Drainage Pits, Pipes, Headwalls and Minor Culverts
Roads, Traffic, Footpaths and Cycleways Sealed Roads, Unsealed Roads, Kerbing, Bridges and Major Culverts, Carparks, Footpaths, Traffic Management Devices and Roadside Furniture.
Water Supply Pipes, Fittings, Pump Stations, Treatment Plant, Dams, Weirs, Reservoirs and associated assets
Sewerage Pipes, Manholes, Pump Stations, Treatment Plant and associated assets
Asset condition scoring scale level
Condition rating Community rating Description of asset condition
0 Brand New A new asset or recently constructed/reconstructed.
1 Excellent An asset in excellent overall condition however is not new and shows no signs of distress or defects.
2 Good Sound construction with good condition and no distortion with limited ageing or may show minor distress upon close inspection such as sporadic fine cracking or isolated minor defects with no associated distortion.
3 Fair Reasonable construction showing some aging and or signs of distress, such as fine to moderate cracking and or minor distortion. The extent of such defects will typically affect less than 20% of the asset targeted for assessment and can be rectified with minor maintenance works.
4 Poor Asset displays substantial deterioration (20% to 50%) Major renewal work required.
5 Very Poor Asset displays significant deterioration (greater than 50%). Extensive renewal work required.
The condition scoring scale follows internationally accepted good practice of starting with a condition score of 0 for new or near new and the values increasing as the asset condition deteriorates.
The descriptions in the condition scoring table above are a general guide to help understand the meaning of each condition score. In practise, the condition score for an asset is determined by a range of measures and indicators that vary for each asset category.

Resourcing Strategy 2021 23
Asset category information
Stormwater drainage
Quantity
Stormwater drainage quantities
Drain types Lengths (m)
Channel 32,490
Culvert 7,325
Pipe 338,546
Total 378,361
Pit types Pit structure numbers
Field inlet 2,749Gross pollutant trap 177Headwall 1,793Kerb inlet 8,108Manhole 3,980Outlet 2
Grand total 16,809
Value (as at 30 June 2015)
Asset financial class Replacement value Accumulated depreciation Written down value Annual depreciation
Stormwater pipe drainage network $181,551,007 $58,117,435 $123,433,572 $1,891,317
Stormwater pit drainage network $40,067,490 $13,322,684 $26,744,806 $502,202
Grand total $221,618,497 $71,440,119 $150,178,378 $2,393,519
Condition level (as at May 2015)
Condition rating Pipes Pits
1 8.4% 10.4%
2 25.5% 24.7%
3 52.4% 52.9%
4 1.9% 0%
5 11.8% 12.0%

Resourcing Strategy 202124
Long-term Financial Plan funding
Renewal (capital) Maintenance
Year Pipes ($) Pits ($) Total ($) Pipes ($) Pits* ($) Total ($)
1 1,506,308 265,380 1,771,688 758,083 0 758,083
2 1,524,391 268,140 1,792,531 738,613 0 738,613
3 1,542,774 271,740 1,814,514 718,967 0 718,967
4 1,561,730 275,280 1,837,010 698,995 0 698,995
5 1,581,722 278,980 1,860,702 678,768 0 678,768
6 1,601,684 282,280 1,883,964 658,303 0 658,303
7 1,622,603 286,340 1,908,943 637,662 0 637,662
8 1,644,570 289,760 1,934,330 616,647 0 616,647
9 1,659,288 293,920 1,953,208 598,440 0 598,440
10 1,689,659 298,120 1,987,779 585,925 0 585,925
Total ($) 15,934,729 2,809,940 18,744,669 6,690,403 0 6,690,403
*Denotes maintenance requirements included as part of capital
Long term system/network condition
Year Pipes Pits
0 2.8 2.8
1 2.8 2.8
2 2.8 2.8
3 2.7 2.7
4 2.7 2.7
5 2.6 2.7
6 2.5 2.7
7 2.5 2.6
8 2.4 2.6
9 2.4 2.6
10 2.3 2.6

Resourcing Strategy 2021 25
Transport (roads, bridges, kerb and gutter pathways)
Quantity
Assets Class Quantity
Sealed roads – regional/local 1077km Collector 352kmDistributor 231kmLocal access 494km
Unsealed roads 164km
Bridges 362 Timber 87Concrete 270Steel 5
Kerb and gutter 853 km
Pathways 240 km Average width 1.65m
Value (as at 30 June 2015)
Asset Class Gross Replacement Cost ($) Depreciated Replacement Cost ($) Annual Depreciation Expense ($)
Roads 737,453,602 590,898,784 11,967,427
Bridges 182,987,639 157,373,491 2,143,996
Kerb and Gutter 53,148,513 43,651,978 677,575
Pathways 36,292,977 29,868,317 463,784
Total 1,009,882,731 821,792,570 15,252,782
Condition level (as at May 2015)
Roads – sealed
Condition rating Surface Pavement
1 64.58% 53.01%
2 30.21% 39.11%
3 4.53% 7.24%
4 0.66% 0.63%
5 0.00% 0.00%
Bridges
Condition rating % of Network
1 77.0%
2 20.8%
3 1.8%
4 0.4%
5 0.0%

Resourcing Strategy 202126
Condition level (as at May 2015) (continued)
Kerb and gutter
Condition rating % of Network
1 59.0%
2 24.1%
3 8.8%
4 6.3%
5 1.8%
Pathways
Condition rating % of Network
1 59.0%
2 6.7%
3 21.5%
4 11.5%
5 1.2%
Long-term Financial Plan funding
Year Roads ($) Bridges ($) Kerbs ($) Footpaths ($) Carparks ($) Road ancillary ($) Total ($)
2017–18 11,683,007 3,276,000 70,862 143,538 152,079 221,000 15,546,486
2018–19 12,400,202 816,000 73,231 147,844 82,426 221,000 13,740,703
2019–20 12,623,057 576,000 75,555 152,280 124,656 221,000 13,772,548
2020–21 13,010,173 1,008,000 77,856 156,848 70,272 221,000 14,544,149
2021–22 13,359,131 576,000 80,454 161,553 63,826 221,000 14,461,964
2022–23 13,744,524 904,000 82,962 166,398 31,392 221,000 15,150,276
2023–24 13,989,927 776,000 85,777 171,390 149,282 221,000 15,393,376
2024–25 14,361,734 776,000 88,423 176,534 151,872 221,000 15,775,563
2025–26 14,747,881 776,000 90,986 181,831 151,525 221,000 16,169,223
2026–27 15,162,167 776,000 94,296 186,831 152,242 221,000 16,592,536
Total ($) 135,081,803 10,260,000 820,402 1,645,047 1,129,572 2,210,000 151,146,824

Resourcing Strategy 2021 27
Long term system/network condition
Local road
Year Option 1
1 1.40
2 1.38
3 1.37
4 1.32
5 1.30
6 1.31
7 1.33
8 1.32
9 1.31
10 1.31
Regional road
Year Option 1
1 1.40
2 1.35
3 1.30
4 1.37
5 1.31
6 1.32
7 1.30
8 1.28
9 1.33
10 1.44
Bridge
Year Option 1
1 1.25
2 1.26
3 1.27
4 1.27
5 1.28
6 1.29
7 1.30
8 1.33
9 1.35
10 1.38
Kerb
Year Option 1
1 1.7
2 1.7
3 1.7
4 1.7
5 1.7
6 1.7
7 1.7
8 1.8
9 1.8
10 1.9
Footpath
Year Option 1
1 2.0
2 2.0
3 2.1
4 2.2
5 2.2
6 2.3
7 2.3
8 2.3
9 2.3
10 2.2
Carpark
Year Option 1
1 1.9
2 1.9
3 1.9
4 2.0
5 2.1
6 2.1
7 2.2
8 2.1
9 2.2
10 2.3
Road ancillary
Year Option 1
1 1.6
2 2.1
3 2.0
4 2.2
5 2.4
6 2.4
7 2.4
8 2.4
9 2.3
10 2.4

Resourcing Strategy 202128
Water supply
Quantity
Asset class Quantity
Water mains 720 km
Pump stations 25
Reservoirs 35
Dams and weirs 1 dam/2 weirs
Treatment plants 3
Value (as at 30 June 2018)
Asset class Gross replacement cost Depreciated replacement cost Percent depreciated Annual depreciation expense
Water mains $364,101,098 $311,747,998 14% $3,642,071
Pump stations $23,718,001 $13,341,148 44% $653,059
Reservoirs $45,402,453 $33,730,841 26% $682,723
Dams and weirs $75,838,522 $66,573,079 12% $452,600
Treatment plants $100,160,581 $78,925,387 21% $1,916,002
Total $609,220,655 $504,318,453 17% $7,346,455
Condition level (as at 30 June 2018)
Pump stationWater main Reservoir
0
10
20
30
40
% o
f net
wor
k 50
60
70
80
Condition rating1 2 3 4 5

Resourcing Strategy 2021 29
Long-term Financial Plan funding
Year Renewal expenditure Growth expenditure* Operating expenditure
2019 $4,474,750 $1,553,000 $23,017,039
2020 $3,144,068 $1,441,620 $23,053,222
2021 $3,388,780 $170,350 $23,449,777
2022 $2,429,872 $1,008,784 $23,919,569
2023 $8,935,075 $1,075,500 $24,445,304
2024 $10,179,242 $11,184,650 $25,169,570
2025 $8,313,500 $13,841,500 $25,701,006
2026 $7,739,500 $28,087,500 $26,329,375
2027 $8,570,000 $10,725,000 $26,941,363
2028 $9,099,500 $2,164,500 $27,712,802
Total $66,274,287 $71,252,404 $249,739,027
* Where a project incorporates both renewal and growth components, 100% of project costs are reported under Expenditure Growth.
Wastewater
Quantity
Asset class Quantity
Gravity mains 541 km
Manholes 12,456
Rising mains 201 km
Vacuum mains 2.3 km
Vacuum chambers 40
Pump stations 184
Treatment plants 8

Resourcing Strategy 202130
Value (as at 30 June 2018)
Asset class Gross replacement cost Depreciated replacement cost Percent depreciated Annual depreciation expense
Gravity mains $241,092,679 $196,783,432 18% $2,073,003
Manholes $59,002,687 $51,946,764 12% $435,827
Rising mains $88,731,851 $70,763,745 20% $1,187,848
Vacuum mains $379,769 $348,903 8% $3,957
Vacuum chambers $743,803 $665,964 10% $13,344
Pump stations $88,997,227 $58,704,780 34% $2,620,903
Treatment plants $220,729,374 $161,935,875 27% $5,056,817
Total $699,677,390 $541,149,462 23% $11,391,699
Condition level (as at 30 June 2018)
ManholeGravity main Rising main Pump station Vacuum main Vacuum chamber
0
10
20
30
40
% o
f net
wor
k 50
60
70
80
90
100
Condition rating1 2 3 4 5

Resourcing Strategy 2021 31
Long-term Financial Plan funding
Year Renewal expenditure Growth expenditure* Operating expenditure
2019 $4,474,750 $1,553,000 $23,017,039
2020 $3,144,068 $1,441,620 $23,053,222
2021 $3,388,780 $170,350 $23,449,777
2022 $2,429,872 $1,008,784 $23,919,569
2023 $8,935,075 $1,075,500 $24,445,304
2024 $10,179,242 $11,184,650 $25,169,570
2025 $8,313,500 $13,841,500 $25,701,006
2026 $7,739,500 $28,087,500 $26,329,375
2027 $8,570,000 $10,725,000 $26,941,363
2028 $9,099,500 $2,164,500 $27,712,802
Total $66,274,287 $71,252,404 $249,739,027
* Where a project incorporates both renewal and growth components, 100% of project costs are reported under Expenditure Growth.

Section 3: Long-term Financial Plan

Resourcing Strategy 2021 33
Introduction
The Long Term Financial Plan forecasts the financial capacity of Tweed Shire Council to meet the objectives adopted in the Community Strategic Plan.
Estimates, projections and assumptions have been used to develop a picture of how Council’s finances will progress over each of the next 10 years by quantifying revenue growth, expenditure commitments, and funding capacity. It also serves to measure to what extent Council is able to finance its asset management commitments as determined in the various Asset Management Plans, outlined in Section 2.
Long-term Financial Plan structure and format
Council’s financial structure is divided into three separate funds: General, Water and Sewerage. These funds are subject to legislative restrictions which do not permit monetary transfers between funds. They could be considered to be three separate businesses but they can also be combined to present a single consolidated result.
The Long Term Financial Plan is presented for both consolidated and individual fund/s using the Annual Financial Statements format of:
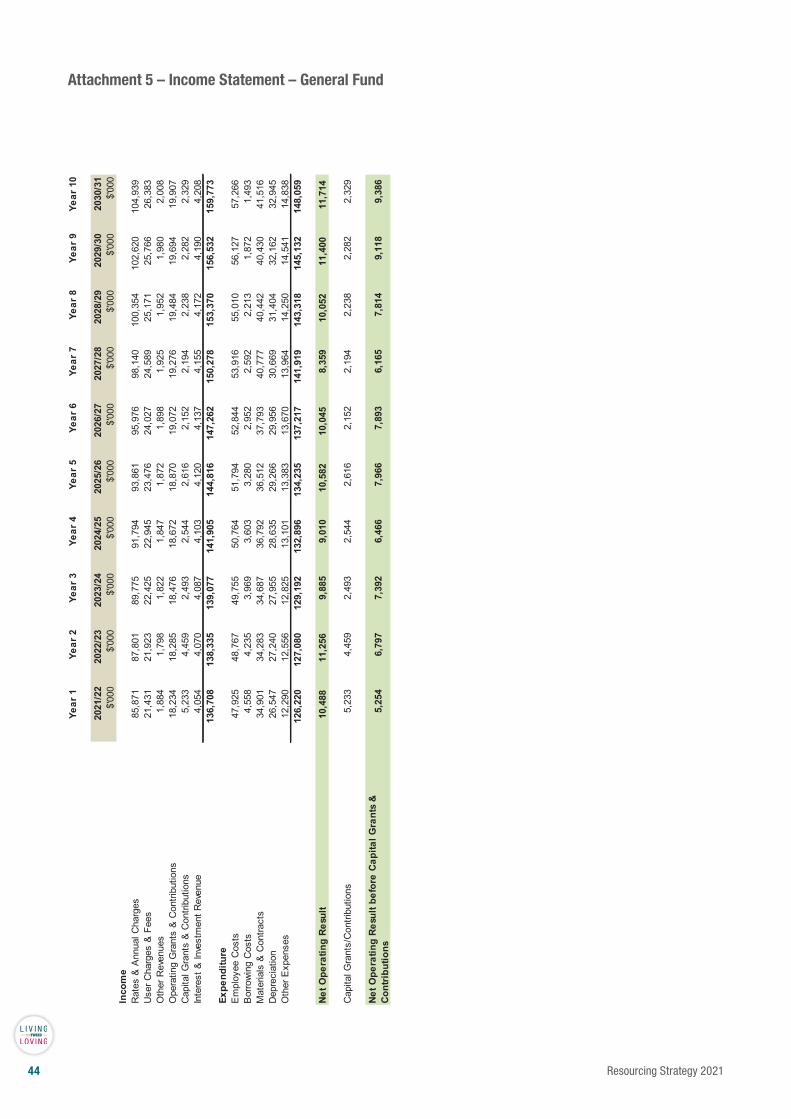
Income Statement
Presents the operating result and change in net assets from operations for the year.
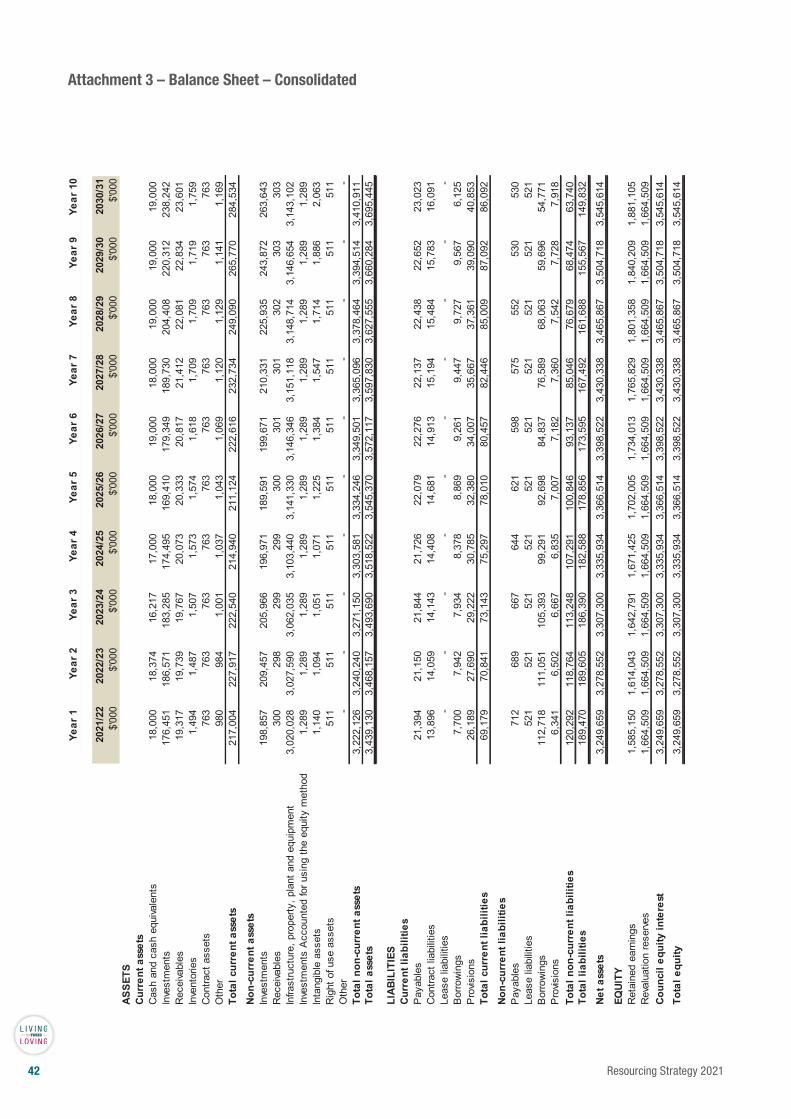
Balance Sheet
Discloses the assets, liabilities and equity of Council.
Cash Flow Statement
Shows the cash flows associated with Council’s operating, financing and investing activities.
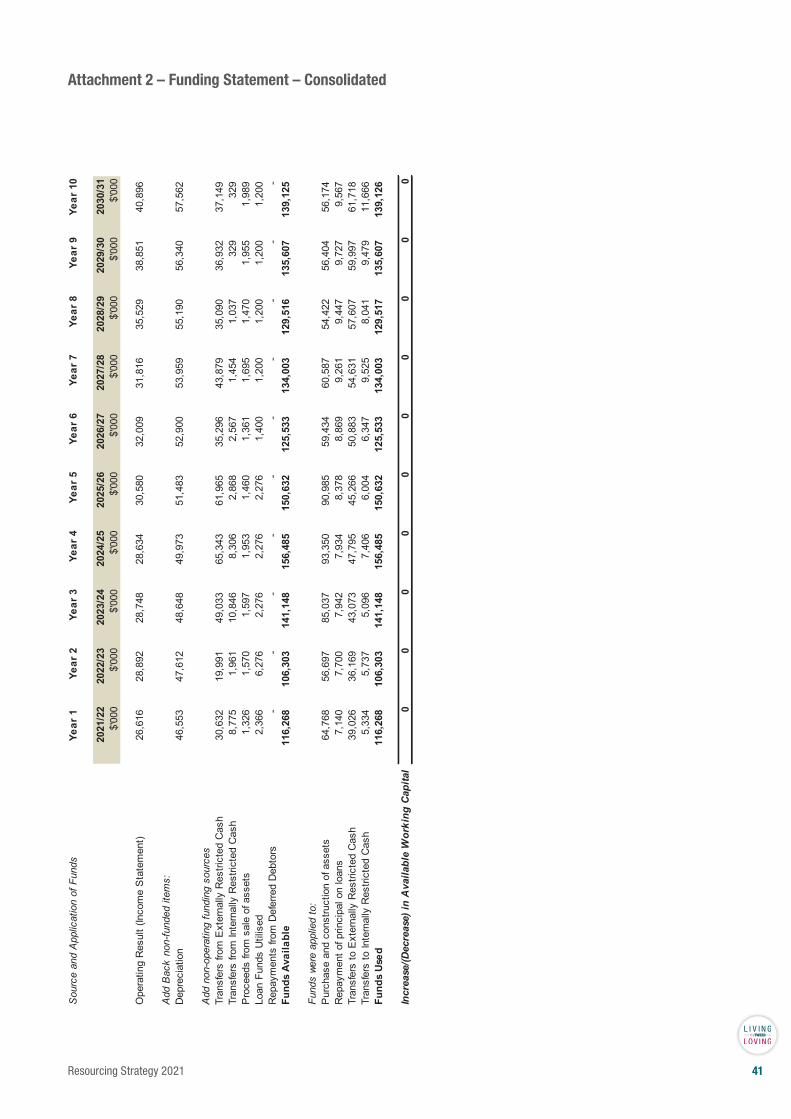
Also a Funding Statement has been included that explains the source and application of funds.

Resourcing Strategy 202134
Financial goals – consolidated
The following financial goals have been adopted by Council in developing the Long Term Financial Plan:
• The current range of services remains unchanged. • Progressive increases to asset maintenance and renewal funding; in order to maintain or
improve current asset conditions.• Eliminate the reliance on debt to finance asset renewals, as opposed to major new projects
where inter-generational equity issues justify borrowing.• Achieve long term financial sustainability by generating surplus operating results before
capital grants and contributions.• Performance indicators to be at the following levels:
Consolidated General Water Sewer
Unrestricted current ratio > 2:1 > 2:1 n/a n/a
Unrestricted cash >$16m >$9.6m >$3.2m >$3.2m
Debt service ratio <=15% <=10% <=25% <=25%
Unrestricted current ratio – The total current cash or cash convertible assets available, divided by current liabilities, excluding assets and liabilities which relate to activities that are restricted to specific purposes by legislation. This is a measure of Council’s liquidity.
Unrestricted cash – The amount of unrestricted cash needed to meet the day-to day operations of Councils; including the financing of hard core debtors and to provide a buffer against unforeseen and unbudgeted expenditures.
Debt service ratio – The amount used to repay borrowings as a percentage of total operating revenues. The indicator shows the amount of revenue necessary to service annual debt obligations.

Resourcing Strategy 2021 35
Fit for the Future – General Fund
The NSW Government’s Fit for the Future reforms aim to improve the strength and effectiveness of local government in providing services and infrastructure that communities need.
The reform process is expected to benefit ratepayers by leading to councils that will be financially sustainable into the future, and more capable of being strategic partners with other levels of government.
As a result of these reforms NSW councils are required by the NSW Government to meet a variety of financial criteria in their General Funds to prove they are ‘fit’ for the future.
The financial criteria are:
Measure Definition Benchmark
Sustainability
Operating performance ratio
Total continuing operating revenue (exc capital grants and contributions) less operating expenses Greater than or equal to break-even average over 3
yearsTotal continuing operating revenue (exc capital grants and contributions)
Own source revenue ratio
Total continuing operating revenue less all grants and contributions
Greater than 60% - average over 3 yearsTotal continuing operating revenue inclusive of capital grants and contributions
Building and asset renewal ratio
Asset renewals (building and infrastructure)
Greater than 100% - average over 3 yearsDepreciation, amortisation and impairment (building and infrastructure)
Infrastructure and service management
Infrastructure backlog ratio
Estimated cost to bring assets to satisfactory condition
Less than 2%Total (WDV) of infrastructure, buildings, other structures and depreciable land improvement assets
Asset maintenance rationActual asset maintenance
Greater than 100% - average over 3 yearsRequired asset maintenance
Debt service ratio
Cost of Debt Service (interest & principalGreater than 0% and less than or equal to 20% - average over 3 years Total continuing operating revenues (exc capital
grants and contributions)
Efficiency
Real operating expenditureOperating expenditure A decrease in real operating expenditure per capita
over timePopulation

Resourcing Strategy 202136
Assumption and estimates
The following assumptions and estimates have been adopted as a general guide in formulating the Long Term Financial Plan. Specific items may have been treated differently than presented:
Global
• The adopted July 2019 Long Term Financial Plan is used as the base year for the Long Term Financial Plan.
• Local and national economic activity to remain similar to current conditions.• Asset management or service expenditures created by new infrastructure and facilities,
funded from Section 94 plans or contributed by developers, will commence in the year following construction/contribution.
• Any budget surplus for General Fund has been placed into a reserve to cover any future budget deficit. Any surpluses in Water and Sewer Funds have been placed into reserves for future asset replacement works.
Income Statement – Revenue
Rates and annual charges Rate pegging (set by IPART) at 2.6%, plus 0% growth in assessable properties for year 1 (2020/21); 2.5% rate pegging plus 0% growth for years 2 to 10.
Water Access Charges are predicted to increase by CPI for 2020/21 and by similar indexation thereafter.
Sewer Access Charges are predicted to increase by CPI for 2020/21 and by similar indexation thereafter.
Domestic Waste Management charges are based on the reasonable costs calculations as required by legislation.
User charges and fees Statutory fees where the fee is set by the State Government, such as most planning fees, to remain static for the life of the Plan. Due to uncertainty in timing, no attempt has been made to estimate increased development fees arising from new developments.
Water Volumetric Charges are predicted to increase approximately 6c/kl per annum for each of the 10 years.
Other fees and charges to increase by 5% per annum.
Interest received Interest on investments estimated at 2.0%.
Other revenues Other revenues to increase by 5% per annum.
Operating grants and contributions Financial Assistance Grant to increase 1% per annum.
Pensioner Rate Subsidies to remain static.
Recurring operating grants and contributions to increase by 2.5% per annum.
Capital grants and contributions Section 94 fees to have variable increase approximating 3% per annum.
Projects funded from Section 94 plans will commence only when the relevant plan/s have accumulated sufficient funds. The projection of Section 94 receipts is highly uncertain due to the unpredictable timing of developments.
Section 64 fees are based on predicted population increases used in the calculation of Developer Services Plan charges.

Resourcing Strategy 2021 37
Income Statement – Expenditure
Employee benefits and on-costs Employee costs to increase by an estimated 2.5% per annum. Award increases after 2019/20 are not known at this time.
Borrowing costs Interest rate for new borrowings predicted to be 4%.
Repayments of interest and principal of existing loans are known from current loan repayment schedules.
The proposed borrowings program provides for annual borrowings of approximately:
General
Public toilets
Bridges (average annual)
Drainage
Flood mitigation
Annual
$100,000
$630,000
$600,000 to $1,100,000
$200,000 to $700,000
Materials and contracts Materials, contracts, and other costs to increase by 2.75% per annum based on recent CPI.
Plant hire (council’s own fleet) Costs to increase by 2.75% per annum.
Depreciation and amortisation Depreciation expense has been calculated based on expected acquisitions and useful lives.
Other expenses Other expenses to increase by 2% per annum.
Balance Sheet – Assets
Cash and cash equivalents Balance from changes in Cash Flow Statement
Investments Maintained at current levels.
Receivables Maintained at current levels.
Inventories Maintained at current levels.
Other Assets Maintained at current levels.
Infrastructure, property, plant and equipment Additions – from capital expenditure list.
Disposal – from Cash Flow Statement.
Depreciation – Income Statement.
Investment Property Maintained at current levels.
Intangible Assets Maintained at current levels.
Balance Sheet – Liabilities and Equity
Payables Maintained at current levels.
Borrowings Balance from loan borrowings and repayments in Cash Flow Statement
Provisions Maintained at current levels.
Equity Retained earnings from Income Statement
Revaluation Reserves maintained at current level.

Resourcing Strategy 202138
Cash Flow – operating activities
Receipts From Income Statement
Payments From Income Statement
Cash Flow – investing activities
Receipts Disposals from budget
Payments Additions – from capital expenditure list
Cash Flow – financing activities
Receipts Balance from loan borrowings in budget
Payments Balance from repayments in budget
* Changes in accrual values have not been estimated as the timing of receipts and payments is too difficult to predict.
A listing of proposed Capital Expenditure projects contained with the Long Term Financial Plan and a forecast of a typical rate notice for each year of the plan have also been included below.
Review of the Long-term Financial Plan
A review of the Long-term Financial Plan in relation to results, estimates and forecasts will be undertaken in conjunction with the annual Operational Plan.
Commentary on projections
Operating result: (attachment 1, 5, 9, 13)The operating results for the consolidated and the General, Water and Sewerage fund Income Statements show surpluses before capital contributions in all years. The surplus is a positive result and meets one of the key financial goals of providing surplus results before capital grants and contributions.
It is important to note that a surplus result indicates the funding of depreciation (i.e. asset consumption) for the year, while a deficit result indicates under funding of depreciation for the year.
Unrestricted current ratio (attachment 17)The Unrestricted Current ratio maintains a balance above 1.5:1 for all 10 years of the Long Term Financial Plan, which is considered acceptable. This ratio is sensitive to the amount of funds Council places in non-current investments (ie. Investments due longer than 12 months).
Debt service ratio (attachment 22)The predicted Debt Service Ratios for the individual and consolidated funds are within the Long Term Financial Plan goals from year two onwards.
Sensitivity analysis (modelling scenarios) (attachment 19)Attachment 19 presents a listing of the sensitivity to the Long-term Financial Plan assumptions
Resourcing Strategy 2021 39
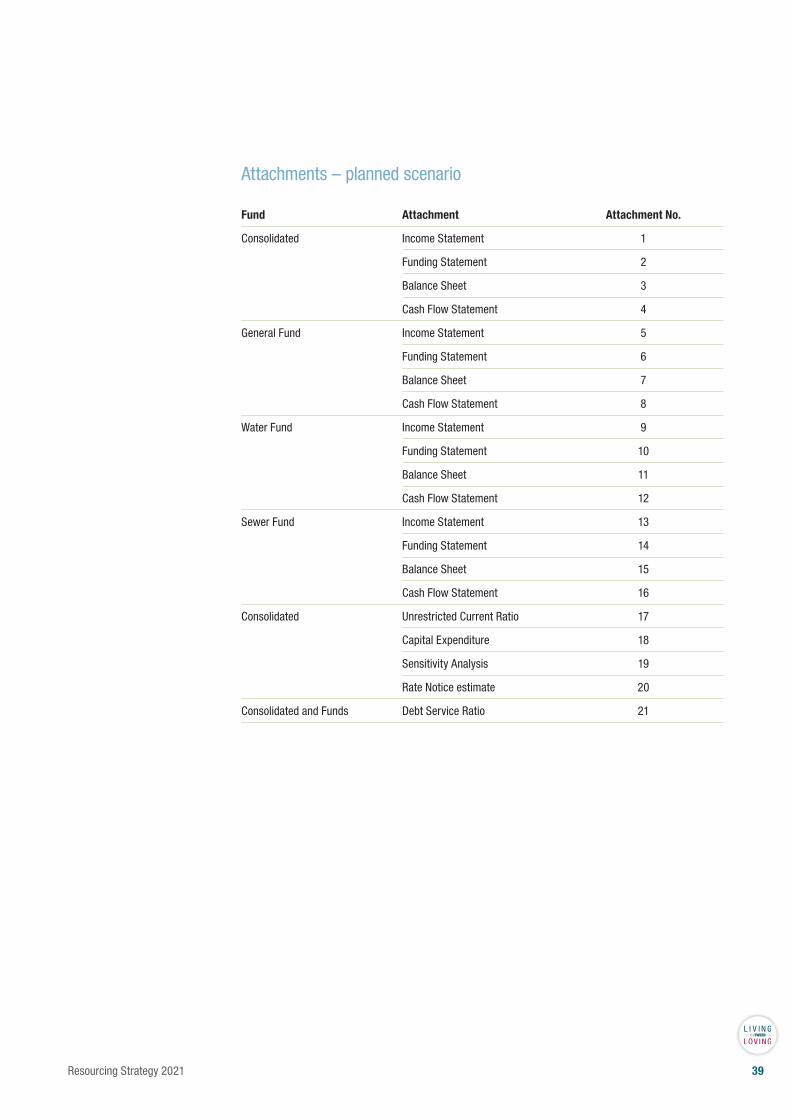
Attachments – planned scenario
Fund Attachment Attachment No.
Consolidated Income Statement 1
Funding Statement 2
Balance Sheet 3
Cash Flow Statement 4
General Fund Income Statement 5
Funding Statement 6
Balance Sheet 7
Cash Flow Statement 8
Water Fund Income Statement 9
Funding Statement 10
Balance Sheet 11
Cash Flow Statement 12
Sewer Fund Income Statement 13
Funding Statement 14
Balance Sheet 15
Cash Flow Statement 16
Consolidated Unrestricted Current Ratio 17
Capital Expenditure 18
Sensitivity Analysis 19
Rate Notice estimate 20
Consolidated and Funds Debt Service Ratio 21

40 Resourcing Strategy 2021
Attachment 1 – Income Statement – ConsolidatedYe
ar 1
Ye
ar 2
Year
3Ye
ar 4
Year
5Ye
ar 6
Year
7Ye
ar 8
Year
9Ye
ar 1
0
2021
/22
2022
/23
2023
/24
2024
/25
2025
/26
2026
/27
2027
/28
2028
/29
2029
/30
2030
/31
$'00
0$'
000
$'00
0$'
000
$'00
0$'
000
$'00
0$'
000
$'00
0$'
000
Inco
me
Rat
es &
Ann
ual C
harg
es12
6,51
112
9,84
813
3,26
613
6,75
914
0,33
114
4,01
714
7,82
215
1,72
915
5,72
315
9,83
1U
ser C
harg
es &
Fee
s52
,479
53,9
4555
,517
57,1
3258
,802
60,5
1862
,274
64,0
7965
,906
67,7
84O
ther
Rev
enue
s2,
261
2,19
12,
232
2,27
52,
320
2,36
52,
413
2,46
22,
512
2,56
5O
pera
ting
Gra
nts
& C
ontri
butio
ns19
,074
19,1
3719
,341
19,5
5119
,763
19,9
7820
,196
20,4
1820
,643
20,8
70C
apita
l Gra
nts
& C
ontri
butio
ns9,
306
8,59
46,
750
6,82
76,
957
6,73
17,
008
7,18
97,
288
7,52
0In
tere
st &
Inve
stm
ent R
even
ue6,
325
6,46
46,
506
6,18
15,
849
6,00
46,
150
6,36
66,
629
6,89
921
5,95
422
0,18
022
3,61
222
8,72
423
4,02
123
9,61
424
5,86
325
2,24
225
8,70
226
5,46
9Ex
pend
iture
Em
ploy
ee C
osts
59,9
8660
,502
61,7
6263
,679
65,6
2466
,997
68,4
0169
,235
70,7
0072
,198
Bor
row
ing
Cos
ts8,
440
7,97
87,
574
7,05
96,
537
6,02
75,
487
4,88
94,
324
3,71
5M
ater
ials
& C
ontra
cts
58,4
1058
,859
60,1
4762
,242
62,2
4463
,701
67,7
8368
,547
69,1
9271
,347
Dep
reci
atio
n46
,553
47,6
1248
,648
49,9
7351
,483
52,9
0053
,959
55,1
9056
,340
57,5
62O
ther
Exp
ense
s15
,949
16,3
3716
,732
17,1
3717
,553
17,9
8018
,417
18,8
5119
,295
19,7
5118
9,33
819
1,28
719
4,86
420
0,09
020
3,44
220
7,60
521
4,04
721
6,71
321
9,85
122
4,57
3
Net O
pera
ting
Resu
lt
26
,616
28
,892
28
,748
28
,634
30
,580
32
,009
31
,816
35
,529
38
,851
40
,896
Cap
ital G
rant
s/C
ontri
butio
ns9,
306
8,59
46,
750
6,82
76,
957
6,73
17,
008
7,18
97,
288
7,52
0
Net O
pera
ting
Resu
lt be
fore
Cap
ital G
rant
s &
Cont
ribut
ions
17,3
11
20,2
99
21,9
98
21,8
07
23,6
22
25,2
78
24,8
07
28,3
40
31,5
62
33,3
76
41Resourcing Strategy 2021
Attachment 2 – Funding Statement – ConsolidatedS
ourc
e an
d A
pplic
atio
n of
Fun
dsYe
ar 1
Ye
ar 2
Year
3Ye
ar 4
Year
5Ye
ar 6
Year
7Ye
ar 8
Year
9Ye
ar 1
0
2021
/22
2022
/23
2023
/24
2024
/25
2025
/26
2026
/27
2027
/28
2028
/29
2029
/30
2030
/31
$'00
0$'
000
$'00
0$'
000
$'00
0$'
000
$'00
0$'
000
$'00
0$'
000
Ope
ratin
g R
esul
t (In
com
e S
tate
men
t)26
,616
28,8
9228
,748
28,6
3430
,580
32,0
0931
,816
35,5
2938
,851
40,8
96
Add
Bac
k no
n-fu
nded
item
s:D
epre
ciat
ion
46,5
5347
,612
48,6
4849
,973
51,4
8352
,900
53,9
5955
,190
56,3
4057
,562
Add
non
-ope
ratin
g fu
ndin
g so
urce
sTr
ansf
ers
from
Ext
erna
lly R
estri
cted
Cas
h30
,632
19,9
9149
,033
65,3
4361
,965
35,2
9643
,879
35,0
9036
,932
37,1
49Tr
ansf
ers
from
Inte
rnal
ly R
estri
cted
Cas
h8,
775
1,96
110
,846
8,30
62,
868
2,56
71,
454
1,03
732
932
9P
roce
eds
from
sal
e of
ass
ets
1,32
61,
570
1,59
71,
953
1,46
01,
361
1,69
51,
470
1,95
51,
989
Loan
Fun
ds U
tilis
ed2,
366
6,27
62,
276
2,27
62,
276
1,40
01,
200
1,20
01,
200
1,20
0R
epay
men
ts fr
om D
efer
red
Deb
tors
--
--
--
--
--
Fund
s Av
aila
ble
116,
268
106,
303
141,
148
156,
485
150,
632
125,
533
134,
003
129,
516
135,
607
139,
125
Fund
s we
re a
pplie
d to
:P
urch
ase
and
cons
truct
ion
of a
sset
s64
,768
56,6
9785
,037
93,3
5090
,985
59,4
3460
,587
54,4
2256
,404
56,1
74R
epay
men
t of p
rinci
pal o
n lo
ans
7,14
07,
700
7,94
27,
934
8,37
88,
869
9,26
19,
447
9,72
79,
567
Tran
sfer
s to
Ext
erna
lly R
estri
cted
Cas
h39
,026
36,1
6943
,073
47,7
9545
,266
50,8
8354
,631
57,6
0759
,997
61,7
18Tr
ansf
ers
to In
tern
ally
Res
trict
ed C
ash
5,33
45,
737
5,09
67,
406
6,00
46,
347
9,52
58,
041
9,47
911
,666
Fund
s Us
ed11
6,26
810
6,30
314
1,14
815
6,48
515
0,63
212
5,53
313
4,00
312
9,51
713
5,60
713
9,12
6
Incr
ease
/(Dec
reas
e) in
Ava
ilabl
e W
orki
ng C
apita
l 0
0 0
0 0
0 0
0 0
0
42 Resourcing Strategy 2021
Attachment 3 – Balance Sheet – ConsolidatedYe
ar 1
Ye
ar 2
Year
3Ye
ar 4
Year
5Ye
ar 6
Year
7Ye
ar 8
Year
9Ye
ar 1
0
2021
/22
2022
/23
2023
/24
2024
/25
2025
/26
2026
/27
2027
/28
2028
/29
2029
/30
2030
/31
$'00
0$'
000
$'00
0$'
000
$'00
0$'
000
$'00
0$'
000
$'00
0$'
000
ASSE
TSCu
rren
t ass
ets
Cas
h an
d ca
sh e
quiva
lent
s18
,000
18,3
7416
,217
17,0
0018
,000
19,0
0018
,000
19,0
0019
,000
19,0
00In
vest
men
ts17
6,45
118
6,57
118
3,28
517
4,49
516
9,41
017
9,34
918
9,73
020
4,40
822
0,31
223
8,24
2R
ecei
vabl
es19
,317
19,7
3919
,767
20,0
7320
,333
20,8
1721
,412
22,0
8122
,834
23,6
01In
vent
orie
s1,
494
1,48
71,
507
1,57
31,
574
1,61
81,
709
1,70
91,
719
1,75
9C
ontra
ct a
sset
s76
376
376
376
376
376
376
376
376
376
3O
ther
980
984
1,00
11,
037
1,04
31,
069
1,12
01,
129
1,14
11,
169
Tota
l cur
rent
ass
ets
217,
004
227,
917
222,
540
214,
940
211,
124
222,
616
232,
734
249,
090
265,
770
284,
534
Non-
curr
ent a
sset
sIn
vest
men
ts19
8,85
720
9,45
720
5,96
619
6,97
118
9,59
119
9,67
121
0,33
122
5,93
524
3,87
226
3,64
3R
ecei
vabl
es30
029
829
929
930
030
130
130
230
330
3In
frast
ruct
ure,
pro
perty
, pla
nt a
nd e
quip
men
t3,
020,
028
3,02
7,59
03,
062,
035
3,10
3,44
03,
141,
330
3,14
6,34
63,
151,
118
3,14
8,71
43,
146,
654
3,14
3,10
2In
vest
men
ts A
ccou
nted
for u
sing
the
equi
ty m
etho
d1,
289
1,28
91,
289
1,28
91,
289
1,28
91,
289
1,28
91,
289
1,28
9In
tang
ible
ass
ets
1,14
01,
094
1,05
11,
071
1,22
51,
384
1,54
71,
714
1,88
62,
063
Rig
ht o
f use
ass
ets
511
511
511
511
511
511
511
511
511
511
Oth
er-
--
--
--
--
-To
tal n
on-c
urre
nt a
sset
s3,
222,
126
3,24
0,24
03,
271,
150
3,30
3,58
13,
334,
246
3,34
9,50
13,
365,
096
3,37
8,46
43,
394,
514
3,41
0,91
1To
tal a
sset
s3,
439,
130
3,46
8,15
73,
493,
690
3,51
8,52
23,
545,
370
3,57
2,11
73,
597,
830
3,62
7,55
53,
660,
284
3,69
5,44
5
LIAB
ILIT
IES
Curr
ent l
iabi
litie
sP
ayab
les
21,3
9421
,150
21,8
4421
,726
22,0
7922
,276
22,1
3722
,438
22,6
5223
,023
Con
tract
liab
ilitie
s13
,896
14,0
5914
,143
14,4
0814
,681
14,9
1315
,194
15,4
8415
,783
16,0
91Le
ase
liabi
litie
s-
--
--
--
--
-B
orro
win
gs7,
700
7,94
27,
934
8,37
88,
869
9,26
19,
447
9,72
79,
567
6,12
5P
rovis
ions
26
,189
27,6
9029
,222
30,7
8532
,380
34,0
0735
,667
37,3
6139
,090
40,8
53To
tal c
urre
nt li
abili
ties
69,1
7970
,841
73,1
4375
,297
78,0
1080
,457
82,4
4685
,009
87,0
9286
,092
Non-
curr
ent l
iabi
litie
sP
ayab
les
712
689
667
644
621
598
575
552
530
530
Leas
e lia
bilit
ies
521
521
521
521
521
521
521
521
521
521
Bor
row
ings
112,
718
111,
051
105,
393
99,2
9192
,698
84,8
3776
,589
68,0
6359
,696
54,7
71P
rovis
ions
6,
341
6,50
26,
667
6,83
57,
007
7,18
27,
360
7,54
27,
728
7,91
8To
tal n
on-c
urre
nt li
abili
ties
120,
292
118,
764
113,
248
107,
291
100,
846
93,1
3785
,046
76,6
7968
,474
63,7
40To
tal l
iabi
litie
s18
9,47
018
9,60
518
6,39
018
2,58
817
8,85
617
3,59
516
7,49
216
1,68
815
5,56
714
9,83
2
Net a
sset
s3,
249,
659
3,27
8,55
23,
307,
300
3,33
5,93
43,
366,
514
3,39
8,52
23,
430,
338
3,46
5,86
73,
504,
718
3,54
5,61
4
EQUI
TYR
etai
ned
earn
ings
1,58
5,15
01,
614,
043
1,64
2,79
11,
671,
425
1,70
2,00
51,
734,
013
1,76
5,82
91,
801,
358
1,84
0,20
91,
881,
105
Rev
alua
tion
rese
rves
1,66
4,50
91,
664,
509
1,66
4,50
91,
664,
509
1,66
4,50
91,
664,
509
1,66
4,50
91,
664,
509
1,66
4,50
91,
664,
509
Coun
cil e
quity
inte
rest
3,24
9,65
93,
278,
552
3,30
7,30
03,
335,
934
3,36
6,51
43,
398,
522
3,43
0,33
83,
465,
867
3,50
4,71
83,
545,
614
Tota
l equ
ity3,
249,
659
3,27
8,55
23,
307,
300
3,33
5,93
43,
366,
514
3,39
8,52
23,
430,
338
3,46
5,86
73,
504,
718
3,54
5,61
4

43Resourcing Strategy 2021
Attachment 4 – Cash Flow Statement – Consolidated
Cash
flow
s fro
m fi
nanc
ing
activ
ities
Rece
ipts
:B
orro
win
gs a
nd a
dvan
ces
2,36
66,
276
2,27
62,
276
2,27
61,
400
1,20
01,
200
1,20
01,
200
Oth
erPa
ymen
ts:
Bor
row
ings
and
adv
ance
s(7
,140
)(7
,700
)(7
,942
)(7
,934
)(8
,378
)(8
,869
)(9
,261
)(9
,447
)(9
,727
)(9
,567
)Le
ase
Liab
ilitie
sO
ther
Net c
ash
prov
ided
by
finan
cing
act
iviti
es(4
,774
)(1
,424
)(5
,666
)(5
,658
)(6
,102
)(7
,469
)(8
,061
)(8
,247
)(8
,527
)(8
,367
)
Net i
ncre
ase/
(dec
reas
e) in
cas
h an
d ca
sh e
quiv
alen
ts1,
000
374
(2,1
57)
783
1,00
01,
000
(1,0
00)
1,00
0-
(0)
Cash
and
cas
h eq
uiva
lent
s at
beg
inni
ng o
f rep
ortin
g pe
riod
17,0
0018
,000
18,3
7416
,217
17,0
0018
,000
19,0
0018
,000
19,0
0019
,000
Cash
and
cas
h eq
uiva
lent
s at
end
of r
epor
ting
perio
d18
,000
18,3
7416
,217
17,0
0018
,000
19,0
0018
,000
19,0
0019
,000
19,0
00
Year
1
Year
2Ye
ar 3
Year
4Ye
ar 5
Year
6Ye
ar 7
Year
8Ye
ar 9
Year
10
2021
/22
2022
/23
2023
/24
2024
/25
2025
/26
2026
/27
2027
/28
2028
/29
2029
/30
2030
/31
$'00
0$'
000
$'00
0$'
000
$'00
0$'
000
$'00
0$'
000
$'00
0$'
000
Cash
flow
s fro
m o
pera
ting
activ
ities
Rece
ipts
:R
ates
and
ann
ual c
harg
es12
6,96
113
0,24
113
3,66
613
7,16
714
0,74
814
4,44
114
8,25
315
2,16
815
6,17
116
0,28
7U
ser c
harg
es a
nd fe
es53
,289
54,1
0255
,673
57,2
9158
,959
60,6
7762
,435
64,2
4366
,080
67,9
62In
vest
men
t rev
enue
and
inte
rest
6,31
36,
255
6,56
36,
262
5,95
15,
837
5,97
36,
097
6,31
76,
562
Gra
nts
and
cont
ribut
ions
29,1
9527
,758
26,1
6126
,368
26,7
0926
,719
27,1
9527
,597
27,9
2128
,380
Bon
ds a
nd D
epos
its re
ceive
d-
--
--
--
--
-O
ther
2,38
12,
167
2,21
12,
225
2,26
82,
320
2,35
92,
406
2,45
52,
506
Paym
ents
:E
mpl
oyee
ben
efits
and
on-
cost
s(5
8,25
8)(5
8,71
1)(5
9,92
9)(6
1,80
8)(6
3,71
5)(6
5,05
0)(6
6,41
4)(6
7,20
8)(6
8,63
2)(7
0,08
7)M
ater
ials
& c
ontra
cts
(58,
766)
(59,
323)
(60,
552)
(62,
569)
(62,
734)
(64,
098)
(68,
042)
(69,
052)
(69,
694)
(71,
768)
Bor
row
ing
cost
s(8
,453
)(7
,975
)(7
,590
)(7
,075
)(6
,554
)(6
,049
)(5
,511
)(4
,913
)(4
,347
)(3
,737
)B
onds
and
Dep
osits
refu
nded
(100
)(1
00)
(100
)(1
00)
(100
)(1
00)
(100
)(1
00)
(100
)-
Oth
er
(15,
983)
(16,
378)
(16,
770)
(17,
171)
(17,
595)
(18,
017)
(18,
450)
(18,
894)
(19,
338)
(19,
791)
N et c
ash
prov
ided
in o
pera
ting
activ
ities
76,5
7978
,036
79,3
3380
,591
83,9
3786
,678
87,6
9792
,343
96,8
3310
0,31
3Ca
sh fl
ows
from
inve
stin
g ac
tiviti
esRe
ceip
ts:
Sal
e of
inve
stm
ents
610
-6,
777
23,4
1325
,097
-6,
010
--
-S
ale
of in
frast
ruct
ure,
pro
perty
, pla
nt &
equ
ipm
ent
1,32
61,
558
1,59
51,
935
1,48
41,
366
1,67
91,
481
1,93
21,
988
Paym
ents
:P
urch
ase
of in
vest
men
ts(6
,768
)(2
0,74
7)-
(5,2
55)
(12,
639)
(20,
023)
(27,
055)
(30,
285)
(33,
845)
(37,
703)
Pur
chas
e of
infra
stru
ctur
e pr
oper
ty, p
lant
& e
quip
men
t(6
5,83
6)(5
6,90
9)(8
4,40
7)(9
3,74
0)(9
0,62
5)(5
9,39
5)(6
1,10
9)(5
4,12
7)(5
6,22
3)(5
6,05
6)P
urch
ase
of re
al e
stat
e-
--
--
--
--
-O
ther
(136
)(1
40)
(144
)(1
48)
(152
)(1
56)
(161
)(1
65)
(169
)(1
74)
Net c
ash
used
in In
vest
ing
activ
ities
(70,
805)
(76,
238)
(76,
179)
(73,
795)
(76,
835)
(78,
208)
(80,
636)
(83,
096)
(88,
306)
(91,
945)
44 Resourcing Strategy 2021
Attachment 5 – Income Statement – General FundYe
ar 1
Ye
ar 2
Year
3Ye
ar 4
Year
5Ye
ar 6
Year
7Ye
ar 8
Year
9Ye
ar 1
0
2021
/22
2022
/23
2023
/24
2024
/25
2025
/26
2026
/27
2027
/28
2028
/29
2029
/30
2030
/31
$'00
0$'
000
$'00
0$'
000
$'00
0$'
000
$'00
0$'
000
$'00
0$'
000
Inco
me
Rat
es &
Ann
ual C
harg
es85
,871
87,8
0189
,775
91,7
9493
,861
95,9
7698
,140
100,
354
102,
620
104,
939
Use
r Cha
rges
& F
ees
21,4
3121
,923
22,4
2522
,945
23,4
7624
,027
24,5
8925
,171
25,7
6626
,383
Oth
er R
even
ues
1,88
41,
798
1,82
21,
847
1,87
21,
898
1,92
51,
952
1,98
02,
008
Ope
ratin
g G
rant
s &
Con
tribu
tions
18,2
3418
,285
18,4
7618
,672
18,8
7019
,072
19,2
7619
,484
19,6
9419
,907
Cap
ital G
rant
s &
Con
tribu
tions
5,23
34,
459
2,49
32,
544
2,61
62,
152
2,19
42,
238
2,28
22,
329
Inte
rest
& In
vest
men
t Rev
enue
4,05
44,
070
4,08
74,
103
4,12
04,
137
4,15
54,
172
4,19
04,
208
136,
708
138,
335
139,
077
141,
905
144,
816
147,
262
150,
278
153,
370
156,
532
159,
773
Expe
nditu
reE
mpl
oyee
Cos
ts47
,925
48,7
6749
,755
50,7
6451
,794
52,8
4453
,916
55,0
1056
,127
57,2
66B
orro
win
g C
osts
4,55
84,
235
3,96
93,
603
3,28
02,
952
2,59
22,
213
1,87
21,
493
Mat
eria
ls &
Con
tract
s34
,901
34,2
8334
,687
36,7
9236
,512
37,7
9340
,777
40,4
4240
,430
41,5
16D
epre
ciat
ion
26,5
4727
,240
27,9
5528
,635
29,2
6629
,956
30,6
6931
,404
32,1
6232
,945
Oth
er E
xpen
ses
12,2
9012
,556
12,8
2513
,101
13,3
8313
,670
13,9
6414
,250
14,5
4114
,838
126,
220
127,
080
129,
192
132,
896
134,
235
137,
217
141,
919
143,
318
145,
132
148,
059
Net O
pera
ting
Resu
lt
1
0,48
8
1
1,25
6
9,88
5
9,01
0
1
0,58
2
1
0,04
5
8,35
9
1
0,05
2
1
1,40
0
1
1,71
4
Cap
ital G
rant
s/C
ontri
butio
ns5,
233
4,45
92,
493
2,54
42,
616
2,15
22,
194
2,23
82,
282
2,32
9
Net O
pera
ting
Resu
lt be
fore
Cap
ital G
rant
s &
Cont
ribut
ions
5,
254
6,
797
7,
392
6,
466
7,
966
7,
893
6,
165
7,
814
9,
118
9,
386

45Resourcing Strategy 2021
Attachment 6 – Funding Statement – General FundYe
ar 1
Ye
ar 2
Year
3Ye
ar 4
Year
5Ye
ar 6
Year
7Ye
ar 8
Year
9Ye
ar 1
020
21/2
220
22/2
320
23/2
420
24/2
520
25/2
620
26/2
720
27/2
820
28/2
920
29/3
020
30/3
1$'
000
$'00
0$'
000
$'00
0$'
000
$'00
0$'
000
$'00
0$'
000
$'00
0O
pera
ting
Res
ult (
Inco
me
Sta
tem
ent)
10,4
8811
,256
9,88
59,
010
10,5
8210
,045
8,35
910
,052
11,4
0011
,714
Add
Bac
k no
n-fu
nded
item
s:D
epre
ciat
ion
26,5
4727
,240
27,9
5528
,635
29,2
6629
,956
30,6
6931
,404
32,1
6232
,945
Add
non
-ope
ratin
g fu
ndin
g so
urce
sTr
ansf
ers
from
Ext
erna
lly R
estri
cted
Cas
h5,
222
1,90
94,
746
1,12
54,
445
4,49
12,
172
1,03
21,
017
1,01
6Tr
ansf
ers
from
Inte
rnal
ly R
estri
cted
Cas
h8,
775
1,96
110
,846
8,30
62,
868
2,56
71,
454
1,03
732
932
9P
roce
eds
from
sal
e of
ass
ets
1,32
61,
570
1,59
71,
953
1,46
01,
361
1,69
51,
470
1,95
51,
989
Loan
Fun
ds U
tilis
ed2,
366
6,27
62,
276
2,27
62,
276
1,40
01,
200
1,20
01,
200
1,20
0R
epay
men
ts fr
om D
efer
red
Deb
tors
Fund
s Av
aila
ble
54,7
2350
,212
57,3
0551
,305
50,8
9849
,820
45,5
4946
,196
48,0
6449
,194
Fund
s we
re a
pplie
d to
:P
urch
ase
and
cons
truct
ion
of a
sset
s37
,539
32,1
1539
,618
31,3
3334
,550
32,7
6922
,272
24,2
8524
,491
23,6
48R
epay
men
t of p
rinci
pal o
n lo
ans
5,22
75,
649
5,75
35,
596
5,84
16,
150
6,36
26,
330
6,38
45,
995
Tran
sfer
s to
Ext
erna
lly R
estri
cted
Cas
h6,
621
6,71
06,
838
6,97
04,
502
4,55
37,
391
7,53
97,
709
7,88
5Tr
ansf
ers
to In
tern
ally
Res
trict
ed C
ash
5,33
45,
737
5,09
67,
406
6,00
46,
347
9,52
58,
041
9,47
911
,666
Fund
s Us
ed54
,723
50,2
1257
,305
51,3
0550
,898
49,8
2045
,549
46,1
9648
,064
49,1
94In
crea
se/(D
ecre
ase)
in A
vaila
ble
Wor
king
Cap
ital
--
--
--
--
--

46 Resourcing Strategy 2021
Attachment 7 – Balance Sheet – General FundAS
SETS
Curr
ent a
sset
sC
ash
and
cash
equ
ivale
nts
15,0
0015
,000
14,2
1715
,000
15,0
0015
,000
15,0
0015
,000
15,0
0015
,000
Inve
stm
ents
94,0
7298
,550
98,5
5010
1,09
010
3,48
510
6,09
611
2,72
211
9,73
912
7,76
013
6,91
8R
ecei
vabl
es12
,483
12,6
6212
,551
12,8
2513
,048
13,2
2413
,592
13,9
4314
,359
14,7
83In
vent
orie
s1,
494
1,48
71,
507
1,57
31,
574
1,61
81,
709
1,70
91,
719
1,75
9C
ontra
ct a
sset
s76
376
376
376
376
376
376
376
376
376
3O
ther
881
881
895
930
935
960
1,00
71,
011
1,02
01,
043
Tota
l cur
rent
ass
ets
124,
694
129,
343
128,
483
132,
180
134,
805
137,
661
144,
792
152,
165
160,
621
170,
267
Non-
curr
ent a
sset
sIn
vest
men
ts11
4,39
311
9,83
811
9,83
812
2,92
712
5,84
012
9,01
413
7,07
214
5,60
415
5,35
816
6,49
5R
ecei
vabl
es30
029
829
929
930
030
130
130
230
330
3In
frast
ruct
ure,
pro
perty
, pla
nt a
nd e
quip
men
t1,
835,
474
1,83
8,82
61,
848,
544
1,84
9,27
11,
852,
942
1,85
4,23
71,
843,
985
1,83
5,23
11,
825,
435
1,81
3,97
5In
tang
ible
ass
ets
1,09
11,
045
1,00
21,
022
1,17
61,
335
1,49
81,
665
1,83
72,
014
Rig
ht o
f use
ass
ets
511
511
511
511
511
511
511
511
511
511
Inve
stm
ents
Acc
ount
ed fo
r usi
ng th
e eq
uity
met
hod
1,28
91,
289
1,28
91,
289
1,28
91,
289
1,28
91,
289
1,28
91,
289
Oth
erTo
tal n
on-c
urre
nt a
sset
s1,
953,
059
1,96
1,80
81,
971,
483
1,97
5,31
91,
982,
058
1,98
6,68
71,
984,
655
1,98
4,60
21,
984,
733
1,98
4,58
6To
tal a
sset
s2,
077,
753
2,09
1,15
12,
099,
966
2,10
7,49
92,
116,
863
2,12
4,34
82,
129,
448
2,13
6,76
72,
145,
354
2,15
4,85
3LI
ABIL
ITIE
SCu
rren
t lia
bilit
ies
Pay
able
s20
,200
19,9
1220
,562
20,4
3120
,763
20,9
4220
,747
21,0
0121
,181
21,4
99C
ontra
ct li
abili
ties
13,8
9614
,059
14,1
4314
,408
14,6
8114
,913
15,1
9415
,484
15,7
8316
,091
Leas
e lia
bilit
ies
Bor
row
ings
5,64
95,
753
5,59
65,
841
6,15
06,
362
6,33
06,
384
5,99
56,
125
Pro
visio
ns
26,1
8927
,690
29,2
2230
,785
32,3
8034
,007
35,6
6737
,361
39,0
9040
,853
Tota
l cur
rent
liab
ilitie
s65
,934
67,4
1469
,523
71,4
6673
,974
76,2
2377
,938
80,2
3082
,049
84,5
68
2021
/22
2022
/23
2023
/24
2024
/25
2025
/26
2026
/27
2027
/28
2028
/29
2029
/30
2030
/31
$'00
0$'
000
$'00
0$'
000
$'00
0$'
000
$'00
0$'
000
$'00
0$'
000
Non-
curr
ent l
iabi
litie
sP
ayab
les
712
689
667
644
621
598
575
552
530
530
Leas
e lia
bilit
ies
521
521
521
521
521
521
521
521
521
521
Bor
row
ings
60,9
1661
,439
58,1
1954
,554
50,6
8045
,718
40,5
8835
,404
30,6
0925
,684
Pro
visio
ns
6,34
16,
502
6,66
76,
835
7,00
77,
182
7,36
07,
542
7,72
87,
918
Tota
l non
-cur
rent
liab
ilitie
s68
,490
69,1
5265
,974
62,5
5458
,828
54,0
1849
,044
44,0
2039
,388
34,6
53To
tal l
iabi
litie
s13
4,42
413
6,56
613
5,49
613
4,02
013
2,80
213
0,24
212
6,98
212
4,25
012
1,43
711
9,22
1
Net a
sset
s1,
943,
329
1,95
4,58
51,
964,
470
1,97
3,47
91,
984,
061
1,99
4,10
62,
002,
465
2,01
2,51
72,
023,
917
2,03
5,63
2
EQUI
TYR
etai
ned
earn
ings
1,07
3,41
01,
084,
666
1,09
4,55
11,
103,
560
1,11
4,14
21,
124,
187
1,13
2,54
61,
142,
598
1,15
3,99
81,
165,
713
Rev
alua
tion
rese
rves
869,
919
869,
919
869,
919
869,
919
869,
919
869,
919
869,
919
869,
919
869,
919
869,
919
Cou
ncil
equi
ty in
tere
st1,
943,
329
1,95
4,58
51,
964,
470
1,97
3,47
91,
984,
061
1,99
4,10
62,
002,
465
2,01
2,51
72,
023,
917
2,03
5,63
2
Tota
l equ
ity1,
943,
329
1,95
4,58
51,
964,
470
1,97
3,47
91,
984,
061
1,99
4,10
62,
002,
465
2,01
2,51
72,
023,
917
2,03
5,63
2
Year
1Ye
ar 2
Year
3Ye
ar 4
Year
5Ye
ar 6
Year
7Ye
ar 8
Year
9Ye
ar 1
0

47Resourcing Strategy 2021
Attachment 8 – Cash Flow Statement – General FundYe
ar 1
Ye
ar 2
Year
3Ye
ar 4
Year
5Ye
ar 6
Year
7Ye
ar 8
Year
9Ye
ar 1
020
21/2
220
22/2
320
23/2
420
24/2
520
25/2
620
26/2
720
27/2
820
28/2
920
29/3
020
30/3
1$'
000
$'00
0$'
000
$'00
0$'
000
$'00
0$'
000
$'00
0$'
000
$'00
0Ca
sh fl
ows
from
ope
ratin
g ac
tiviti
esRe
ceip
ts:
Rat
es a
nd a
nnua
l cha
rges
85,9
8787
,862
89,8
3791
,858
93,9
2696
,043
98,2
0810
0,42
410
2,69
210
5,01
2U
ser c
harg
es a
nd fe
es22
,284
22,1
3522
,649
23,1
7523
,711
24,2
6624
,834
25,4
2326
,028
26,6
52In
vest
men
t rev
enue
and
inte
rest
4,08
33,
924
4,08
44,
018
4,05
04,
062
3,98
43,
994
3,98
73,
979
Gra
nts
and
cont
ribut
ions
24,3
1222
,772
21,0
3921
,206
21,4
7621
,234
21,4
6121
,711
21,9
6622
,225
Bon
ds a
nd D
epos
its re
ceive
d-
--
--
--
--
-O
ther
2,00
71,
774
1,80
01,
796
1,82
01,
852
1,87
11,
896
1,92
21,
949
Paym
ents
:E
mpl
oyee
ben
efits
and
on-
cost
s(4
6,27
2)(4
7,07
9)(4
8,02
8)(4
9,00
2)(4
9,99
5)(5
1,00
9)(5
2,04
4)(5
3,10
0)(5
4,17
7)(5
5,27
7)M
ater
ials
& c
ontra
cts
(34,
789)
(34,
276)
(34,
612)
(36,
601)
(36,
481)
(37,
656)
(40,
524)
(40,
413)
(40,
377)
(41,
389)
Bor
row
ing
cost
s(4
,571
)(4
,232
)(3
,985
)(3
,619
)(3
,296
)(2
,974
)(2
,616
)(2
,236
)(1
,896
)(1
,515
)B
onds
and
Dep
osits
refu
nded
(100
)(1
00)
(100
)(1
00)
(100
)(1
00)
(100
)(1
00)
(100
)-
Oth
er
(12,
281)
(12,
553)
(12,
819)
(13,
090)
(13,
378)
(13,
661)
(13,
950)
(14,
246)
(14,
536)
(14,
830)
N et c
ash
prov
ided
in o
pera
ting
activ
ities
40,6
6040
,226
39,8
6539
,642
41,7
3342
,056
41,1
2343
,354
45,5
0946
,807
Cash
flow
s fro
m in
vest
ing
activ
ities
Rece
ipts
:S
ale
of in
vest
men
ts-
--
--
--
--
-S
ale
of in
frast
ruct
ure,
pro
perty
, pla
nt &
equ
ipm
ent
1,32
5,65
41,
557,
705
1,59
5,22
71,
935,
120
1,48
4,04
11,
366,
057
1,67
8,90
81,
481,
382
1,93
1,62
51,
987,
772
Sal
e of
inte
rest
s in
join
t ven
ture
s/as
soci
ates
Oth
erPa
ymen
ts:
Pur
chas
e of
inve
stm
ents
(96)
(9,9
23)
-(5
,628
)(5
,309
)(5
,785
)(1
4,68
4)(1
5,54
9)(1
7,77
6)(2
0,29
4)P
urch
ase
of in
frast
ruct
ure
prop
erty
, pla
nt &
equ
ipm
ent
(38,
890)
(32,
345)
(38,
620)
(31,
696)
(34,
189)
(32,
728)
(22,
793)
(23,
990)
(24,
309)
(23,
529)
Pur
chas
e of
real
est
ate
Pur
chas
e of
inte
rest
s in
join
t ven
ture
s/as
soci
ates
Oth
er(1
38)
(142
)(1
46)
(150
)(1
54)
(158
)(1
63)
(167
)(1
72)
(177
)Ne
t cas
h us
ed in
Inve
stin
g ac
tiviti
es(3
7,79
8)(4
0,85
3)(3
7,17
0)(3
5,53
9)(3
8,16
8)(3
7,30
6)(3
5,96
1)(3
8,22
4)(4
0,32
5)(4
2,01
2)Ca
sh fl
ows
from
fina
ncin
g ac
tiviti
esRe
ceip
ts:
Bor
row
ings
and
adv
ance
s2,
366
6,27
62,
276
2,27
62,
276
1,40
01,
200
1,20
01,
200
1,20
0O
ther
Paym
ents
:B
orro
win
gs a
nd a
dvan
ces
(5,2
27)
(5,6
49)
(5,7
53)
(5,5
96)
(5,8
41)
(6,1
50)
(6,3
62)
(6,3
30)
(6,3
84)
(5,9
95)
Leas
e Li
abili
ties
--
--
--
--
--
Oth
erNe
t cas
h pr
ovid
ed b
y fin
anci
ng a
ctiv
ities
(2,8
61)
627
(3,4
77)
(3,3
20)
(3,5
65)
(4,7
50)
(5,1
62)
(5,1
30)
(5,1
84)
(4,7
95)
Net i
ncre
ase/
(dec
reas
e) in
cas
h an
d ca
sh e
quiv
alen
ts-
-(7
83)
783
--
--
--
Cash
and
cas
h eq
uiva
lent
s at
beg
inni
ng o
f rep
ortin
g pe
riod
15,0
0015
,000
15,0
0014
,217
15,0
0015
,000
15,0
0015
,000
15,0
0015
,000
Cash
and
cas
h eq
uiva
lent
s at
end
of r
epor
ting
perio
d15
,000
15,0
0014
,217
15,0
0015
,000
15,0
0015
,000
15,0
0015
,000
15,0
00

48 Resourcing Strategy 2021
Attachment 9 – Income Statement – Water FundYe
ar 1
Ye
ar 2
Year
3Ye
ar 4
Year
5Ye
ar 6
Year
7Ye
ar 8
Year
9Ye
ar 1
0
2021
/22
2022
/23
2023
/24
2024
/25
2025
/26
2026
/27
2027
/28
2028
/29
2029
/30
2030
/31
$'00
0$'
000
$'00
0$'
000
$'00
0$'
000
$'00
0$'
000
$'00
0$'
000
Inco
me
Rat
es &
Ann
ual C
harg
es6,
365
6,59
96,
827
7,06
37,
303
7,55
47,
816
8,08
78,
363
8,65
0U
ser C
harg
es &
Fee
s27
,287
28,1
6429
,128
30,1
1531
,125
32,1
6033
,220
34,3
0535
,415
36,5
52O
ther
Rev
enue
s35
937
539
241
042
844
746
848
951
253
5O
pera
ting
Gra
nts
& C
ontri
butio
ns42
042
643
343
944
645
346
046
747
448
2C
apita
l Gra
nts
& C
ontri
butio
ns2,
460
2,49
82,
572
2,58
72,
627
2,76
62,
909
2,99
23,
025
3,13
8In
tere
st &
Inve
stm
ent R
even
ue95
095
990
472
135
136
029
330
133
044
337
,840
39,0
2140
,256
41, 3
3542
,281
43,7
4145
,166
46,6
4248
,120
49,7
99Ex
pend
iture
Em
ploy
ee C
osts
4,98
85,
091
5,18
65,
312
5,44
25,
575
5,71
15,
851
5,99
46,
141
Bor
row
ing
Cos
ts3,
882
3,74
33,
605
3,45
63,
258
3,07
52,
895
2,67
72,
451
2,22
2M
ater
ials
& C
ontra
cts
11,6
1711
,747
12,1
6612
,429
12,6
8712
,915
13,5
5513
,655
13,8
8914
,388
Dep
reci
atio
n7,
906
8,06
98,
229
8,45
28,
788
9,28
49,
450
9,74
19,
939
10,0
80O
ther
Exp
ense
s1,
390
1,43
71,
485
1,53
51,
587
1,64
01,
695
1,75
21,
811
1,87
229
,784
30,0
8730
,671
31,1
8431
,760
32,4
8833
,305
33,6
7534
,084
34,7
02
Net O
pera
ting
Resu
lt
8,0
56
8
,934
9,5
85
10,
151
10,
520
11,
253
11,
861
12 ,
966
14,
035
15,
097
Cap
ital G
rant
s/C
ontri
butio
ns2,
460
2,49
82,
572
2,58
72,
627
2,76
62,
909
2,99
23,
025
3,13
8
Net O
pera
ting
Resu
lt be
fore
Cap
ital G
rant
s &
Cont
ribut
ions
5
,596
6,4
36
7
,013
7,5
63
7
,893
8,4
86
8
,952
9,9
74
11,
010
11,
959

49Resourcing Strategy 2021
Attachment 10 – Funding Statement – Water FundYe
ar 1
Ye
ar 2
Year
3Ye
ar 4
Year
5Ye
ar 6
Year
7Ye
ar 8
Year
9Ye
ar 1
0
2021
/22
2022
/23
2023
/24
2024
/25
2025
/26
2026
/27
2027
/28
2028
/29
2029
/30
2030
/31
$'00
0$'
000
$'00
0$'
000
$'00
0$'
000
$'00
0$'
000
$'00
0$'
000
Ope
ratin
g R
esul
t (In
com
e S
tate
men
t)8,
056
8,93
49,
585
10,1
5110
,520
11,2
5311
,861
12,9
6614
,035
15,0
97
Add
Bac
k no
n-fu
nded
item
s:D
epre
ciat
ion
7,90
68,
069
8,22
98,
452
8,78
89,
284
9,45
09,
741
9,93
910
,080
Add
non
-ope
ratin
g fu
ndin
g so
urce
sTr
ansf
ers
from
Ext
erna
lly R
estri
cted
Cas
h14
,529
13,3
0518
,804
32,6
5344
,990
19,3
7429
,104
22,0
6017
,410
20,7
00Tr
ansf
ers
from
Inte
rnal
ly R
estri
cted
Cas
hP
roce
eds
from
sal
e of
ass
ets
Loan
Fun
ds U
tilis
edR
epay
men
ts fr
om D
efer
red
Deb
tors
Fund
s Av
aila
ble
30,4
9230
,307
36,6
1851
,255
64,2
9839
,911
50,4
1544
,767
41,3
8445
,877
Fund
s we
re a
pplie
d to
:P
urch
ase
and
cons
truct
ion
of a
sset
s14
,548
14,4
7419
,490
28,8
4041
,976
15,1
5725
,384
17,9
2313
,326
16,9
45R
epay
men
t of p
rinci
pal o
n lo
ans
1,91
22,
051
2,18
92,
338
2,53
62,
719
2,89
93,
117
3,34
33,
572
Tran
sfer
s to
Ext
erna
lly R
estri
cted
Cas
h14
,031
13,7
8314
,938
20,0
7719
,786
22,0
3522
,132
23,7
2724
,715
25,3
60Tr
ansf
ers
to In
tern
ally
Res
trict
ed C
ash
Fund
s Us
ed30
,492
30,3
0736
,618
51,2
5564
,298
39,9
1150
,415
44,7
6741
,385
45,8
77
Incr
ease
/(Dec
reas
e) in
Ava
ilabl
e W
orki
ng C
apita
l(0
)(0
)(0
)(0
)(0
)(0
)(0
)(0
)(0
)0

50 Resourcing Strategy 2021
Attachment 11 – Balance Sheet – Water FundYe
ar 1
Ye
ar 2
Year
3Ye
ar 4
Year
5Ye
ar 6
Year
7Ye
ar 8
Year
9Ye
ar 1
020
21/2
220
22/2
320
23/2
420
24/2
520
25/2
620
26/2
720
27/2
820
28/2
920
29/3
020
30/3
1$'
000
$'00
0$'
000
$'00
0$'
000
$'00
0$'
000
$'00
0$'
000
$'00
0AS
SETS
Curr
ent a
sset
sC
ash
and
cash
equ
ivale
nts
1,00
01,
374
1,00
01,
000
1,00
02,
000
1,00
02,
000
2,00
02,
000
Inve
stm
ents
30,0
9130
,091
28,4
8922
,824
11,5
1612
,202
9,49
49,
731
12,9
3914
,970
Rec
eiva
bles
4,02
14,
136
4,22
44,
240
4,15
04,
305
4,37
84,
530
4,73
24,
915
Inve
ntor
ies
--
--
--
--
--
Con
tract
ass
ets
Oth
er41
4243
4445
4648
4950
51To
tal c
urre
nt a
sset
s35
,153
35,6
4333
,756
28,1
0816
,711
18,5
5314
,921
16,3
0919
,721
21,9
36
Non-
curr
ent a
sset
sIn
vest
men
ts36
,693
36,6
9334
,741
27,8
3214
,043
14,8
7911
,578
11,8
6615
,778
18,2
55R
ecei
vabl
es-
--
--
--
--
-In
frast
ruct
ure,
pro
perty
, pla
nt a
nd e
quip
men
t58
2,25
258
8,65
759
9,91
862
0,30
665
3,49
465
9,36
767
5,30
168
3,48
368
6,87
169
3,73
6In
vest
men
ts A
ccou
nted
for u
sing
the
equi
ty m
etho
d-
--
--
--
--
-In
tang
ible
ass
ets
2222
2222
2222
2222
2222
Rig
ht o
f use
ass
ets
Inve
stm
ents
Acc
ount
ed fo
r usi
ng th
e eq
uity
met
hod
Oth
erTo
tal n
on-c
urre
nt a
sset
s61
8,96
762
5,37
263
4,68
064
8,16
066
7,55
967
4,26
868
6,90
169
5,37
270
2,67
171
2,01
3To
tal a
sset
s65
4,12
066
1,01
566
8,43
667
6,26
868
4,27
069
2,82
170
1,82
171
1,68
172
2,39
273
3,94
8
LIAB
ILIT
IES
Curr
ent l
iabi
litie
sP
ayab
les
744
756
782
801
820
837
876
887
905
937
Bor
row
ings
2,05
12,
189
2,33
82,
536
2,71
92,
899
3,11
73,
343
3,57
2-
Pro
visio
ns
Tota
l cur
rent
liab
ilitie
s2,
795
2,94
53,
121
3,33
83,
539
3,73
63,
993
4,23
04,
477
937
Non-
curr
ent l
iabi
litie
sP
ayab
les
Bor
row
ings
51,8
0149
,612
47,2
7444
,738
42,0
1839
,119
36,0
0232
,659
29,0
8729
,087
Pro
visio
ns
Tota
l non
-cur
rent
liab
ilitie
s51
,801
49,6
1247
,274
44,7
3842
,018
39,1
1936
,002
32,6
5929
,087
29,0
87To
tal l
iabi
litie
s54
,596
52,5
5750
,395
48,0
7545
,557
42,8
5539
,995
36,8
8833
,564
30,0
23
Net a
sset
s59
9,52
360
8,45
761
8,04
262
8,19
363
8,71
364
9,96
566
1,82
767
4,79
368
8,82
870
3,92
5
EQUI
TYR
etai
ned
earn
ings
236,
802
245,
736
255,
321
265,
472
275,
992
287,
244
299,
106
312,
072
326,
107
341,
204
Rev
alua
tion
rese
rves
362,
721
362,
721
362,
721
362,
721
362,
721
362,
721
362,
721
362,
721
362,
721
362,
721
Cou
ncil
equi
ty in
tere
st59
9,52
360
8,45
761
8,04
262
8,19
363
8,71
364
9,96
566
1,82
767
4,79
368
8,82
870
3,92
5
Tota
l equ
ity59
9,52
360
8,45
761
8,04
262
8,19
363
8,71
364
9,96
566
1,82
767
4,79
368
8,82
870
3,92
5

51Resourcing Strategy 2021
Attachment 12 – Cash Flow Statement – Water FundYe
ar 1
Ye
ar 2
Year
3Ye
ar 4
Year
5Ye
ar 6
Year
7Ye
ar 8
Year
9Ye
ar 1
020
21/2
220
22/2
320
23/2
420
24/2
520
25/2
620
26/2
720
27/2
820
28/2
920
29/3
020
30/3
1$'
000
$'00
0$'
000
$'00
0$'
000
$'00
0$'
000
$'00
0$'
000
$'00
0Ca
sh fl
ows
from
ope
ratin
g ac
tiviti
esRe
ceip
ts:
Rat
es a
nd a
nnua
l cha
rges
6,35
66,
590
6,81
97,
054
7,29
47,
545
7,80
78,
077
8,35
38,
639
Use
r cha
rges
and
fees
27,1
8228
,064
29,0
1830
,002
31,0
1032
,042
33,0
9834
,180
35,2
8836
,422
Inve
stm
ent r
even
ue a
nd in
tere
st95
695
693
882
956
733
635
428
826
840
4G
rant
s an
d co
ntrib
utio
ns2,
880
2,92
43,
004
3,02
73,
073
3,21
93,
369
3,45
93,
500
3,61
9B
onds
and
Dep
osits
rece
ived
--
--
--
--
--
Oth
er35
937
539
241
042
844
746
848
951
253
5Pa
ymen
ts:
Em
ploy
ee b
enef
its a
nd o
n-co
sts
(4,9
88)
(5,0
91)
(5,1
86)
(5,3
12)
(5,4
42)
(5,5
75)
(5,7
11)
(5,8
51)
(5,9
94)
(6,1
41)
Mat
eria
ls &
con
tract
s (1
1,62
0)(1
1,73
9)(1
2,14
3)(1
2,41
4)(1
2,67
2)(1
2,90
1)(1
3,52
1)(1
3,64
8)(1
3,87
5)(1
4,36
1)B
orro
win
g co
sts
(3,8
82)
(3,7
43)
(3,6
05)
(3,4
56)
(3,2
58)
(3,0
75)
(2,8
95)
(2,6
77)
(2,4
51)
(2,2
22)
Bon
ds a
nd D
epos
its re
fund
ed-
--
--
--
--
-O
ther
(1
,390
)(1
,437
)(1
,485
)(1
,535
)(1
,587
)(1
,640
)(1
,695
)(1
,752
)(1
,811
)(1
,872
)Ne
t cas
h pr
ovid
ed in
ope
ratin
g ac
tiviti
es15
,851
16,8
9917
,752
18,6
0419
,415
20,3
9921
,274
22,5
6623
,789
25,0
24Ca
sh fl
ows
from
inve
stin
g ac
tiviti
esRe
ceip
ts:
Sal
e of
inve
stm
ents
610
-3,
554
12,5
7425
,097
-6,
010
--
-S
ale
of in
frast
ruct
ure,
pro
perty
, pla
nt &
equ
ipm
ent
Sal
e of
inte
rest
s in
join
t ven
ture
s/as
soci
ates
Oth
erPa
ymen
ts:
Pur
chas
e of
inve
stm
ents
--
--
-(1
,522
)-
(526
)(7
,120
)(4
,507
)P
urch
ase
of in
frast
ruct
ure
prop
erty
, pla
nt &
equ
ipm
ent
(14,
548)
(14,
474)
(19,
490)
(28,
840)
(41,
976)
(15,
157)
(25,
384)
(17,
923)
(13,
326)
(16,
945)
Pur
chas
e of
real
est
ate
Pur
chas
e of
inte
rest
s in
join
t ven
ture
s/as
soci
ates
Oth
erNe
t cas
h us
ed in
Inve
stin
g ac
tiviti
es(1
3,93
9)(1
4,47
4)(1
5,93
6)(1
6,26
6)(1
6,87
8)(1
6,67
9)(1
9,37
4)(1
8,44
9)(2
0,44
6)(2
1,45
2)Ca
sh fl
ows
from
fina
ncin
g ac
tiviti
esRe
ceip
ts:
Bor
row
ings
and
adv
ance
s-
--
--
--
--
-O
ther
Paym
ents
:B
orro
win
gs a
nd a
dvan
ces
(1,9
12)
(2,0
51)
(2,1
89)
(2,3
38)
(2,5
36)
(2,7
19)
(2,8
99)
(3,1
17)
(3,3
43)
(3,5
72)
Leas
e Li
abili
ties
Oth
erNe
t cas
h pr
ovid
ed b
y fin
anci
ng a
ctiv
ities
(1,9
12)
(2,0
51)
(2,1
89)
(2,3
38)
(2,5
36)
(2,7
19)
(2,8
99)
(3,1
17)
(3,3
43)
(3,5
72)
Net i
ncre
ase/
(dec
reas
e) in
cas
h an
d ca
sh e
quiv
alen
ts-
374
(374
)-
-1,
000
(1,0
00)
1,00
0-
-
Cash
and
cas
h eq
uiva
lent
s at
beg
inni
ng o
f rep
ortin
g pe
riod
1,00
01,
000
1,37
41,
000
1,00
01,
000
2,00
01,
000
2,00
02,
000
Cash
and
cas
h eq
uiva
lent
s at
end
of r
epor
ting
perio
d1,
000
1,37
41,
000
1,00
01,
000
2,00
01,
000
2,00
02,
000
2,00
0

52 Resourcing Strategy 2021
Attachment 13 – Income Statement – Sewer FundYe
ar 1
Ye
ar 2
Year
3Ye
ar 4
Year
5Ye
ar 6
Year
7Ye
ar 8
Year
9Ye
ar 1
0
2021
/22
2022
/23
2023
/24
2024
/25
2025
/26
2026
/27
2027
/28
2028
/29
2029
/30
2030
/31
$'00
0$'
000
$'00
0$'
000
$'00
0$'
000
$'00
0$'
000
$'00
0$'
000
Inco
me
Rat
es &
Ann
ual C
harg
es34
,274
35,4
4936
,664
37,9
0239
,167
40,4
8841
,866
43,2
8844
,740
46,2
43U
ser C
harg
es &
Fee
s3,
761
3,85
83,
964
4,07
24,
200
4,33
14,
466
4,60
34,
725
4,84
9O
ther
Rev
enue
s18
1819
1920
2020
2121
22O
pera
ting
Gra
nts
& C
ontri
butio
ns42
042
643
343
944
645
346
046
747
448
2C
apita
l Gra
nts
& C
ontri
butio
ns1,
612
1,63
71,
685
1,69
61,
714
1,81
21,
905
1,95
91,
981
2,05
4In
tere
st &
Inve
stm
ent R
even
ue1,
320
1,43
41,
515
1,35
71,
378
1,50
71,
702
1,89
22,
110
2,24
841
,406
42,8
2344
,279
45,4
8446
,924
48,6
1150
,419
52,2
3054
,050
55,8
97Ex
pend
iture
Em
ploy
ee C
osts
7,07
26,
645
6,82
17,
602
8,38
88,
578
8,77
48,
374
8,58
08,
791
Bor
row
ing
Cos
ts-
--
--
--
--
-M
ater
ials
& C
ontra
cts
11,8
9212
,828
13,2
9413
,020
13,0
4612
,993
13,4
5114
,450
14,8
7315
,443
Dep
reci
atio
n12
,100
12,3
0312
,463
12,8
8713
,429
13,6
6013
,841
14,0
4614
,239
14,5
38O
ther
Exp
ense
s2,
269
2,34
42,
421
2,50
12,
584
2,66
92,
758
2,84
92,
943
3,04
133
,333
34,1
2135
,000
36,0
1037
,447
37,9
0038
,824
39,7
1940
,635
41,8
12
Net O
pera
ting
Resu
lt
8,0
72
8
,703
9,2
78
9
,474
9,4
77
10
,711
1
1,59
5
12,5
11
13,
415
14
,085
Cap
ital G
rant
s/C
ontri
butio
ns1,
612
1,63
71,
685
1,69
61,
714
1,81
21,
905
1,95
91,
981
2,05
4
Net O
pera
ting
Resu
lt be
fore
Cap
ital G
rant
s &
Cont
ribut
ions
6
,460
7,0
66
7
,593
7,7
78
7
,763
8,8
99
9
,690
10,5
52
11,
435
12
,031

53Resourcing Strategy 2021
Attachment 14 – Funding Statement – Sewer FundYe
ar 1
Ye
ar 2
Year
3Ye
ar 4
Year
5Ye
ar 6
Year
7Ye
ar 8
Year
9Ye
ar 1
0
2021
/22
2022
/23
2023
/24
2024
/25
2025
/26
2026
/27
2027
/28
2028
/29
2029
/30
2030
/31
$'00
0$'
000
$'00
0$'
000
$'00
0$'
000
$'00
0$'
000
$'00
0$'
000
Ope
ratin
g R
esul
t (In
com
e S
tate
men
t)8,
072
8,70
39,
278
9,47
49,
477
10,7
1111
,595
12,5
1113
,415
14,0
85
Add
Bac
k no
n-fu
nded
item
s:D
epre
ciat
ion
12,1
0012
,303
12,4
6312
,887
13,4
2913
,660
13,8
4114
,046
14,2
3914
,538
Add
non
-ope
ratin
g fu
ndin
g so
urce
sTr
ansf
ers
from
Ext
erna
lly R
estri
cted
Cas
h10
,881
4,77
725
,483
31,5
6512
,530
11,4
3212
,603
11,9
9718
,505
15,4
33Tr
ansf
ers
from
Inte
rnal
ly R
estri
cted
Cas
h-
--
--
--
--
-P
roce
eds
from
sal
e of
ass
ets
Loan
Fun
ds U
tilis
edR
epay
men
ts fr
om D
efer
red
Deb
tors
Fund
s Av
aila
ble
31,0
5325
,784
47,2
2553
,925
35,4
3635
,802
38,0
3938
,554
46,1
5944
,055
Fund
s we
re a
pplie
d to
:P
urch
ase
and
cons
truct
ion
of a
sset
s12
,680
10,1
0925
,929
33,1
7814
,459
11,5
0812
,931
12,2
1318
,587
15,5
81R
epay
men
t of p
rinci
pal o
n lo
ans
--
--
--
--
--
Tran
sfer
s to
Ext
erna
lly R
estri
cted
Cas
h18
,373
15,6
7521
,296
20,7
4820
,978
24,2
9525
,108
26,3
4127
,572
28,4
74Tr
ansf
ers
to In
tern
ally
Res
trict
ed C
ash
--
--
--
--
--
Fund
s Us
ed31
,053
25,7
8447
,225
53,9
2535
,437
35,8
0338
,039
38,5
5446
,159
44,0
55
Incr
ease
/(Dec
reas
e) in
Ava
ilabl
e W
orki
ng C
apita
l(0
)(0
)(0
)(0
)(0
)(0
)(0
)(0
)(0
)(0
)

54 Resourcing Strategy 2021
Attachment 15 – Balance Sheet – Sewer FundYe
ar 1
Ye
ar 2
Year
3Ye
ar 4
Year
5Ye
ar 6
Year
7Ye
ar 8
Year
9Ye
ar 1
0
2021
/22
2022
/23
2023
/24
2024
/25
2025
/26
2026
/27
2027
/28
2028
/29
2029
/30
2030
/31
$'00
0$'
000
$'00
0$'
000
$'00
0$'
000
$'00
0$'
000
$'00
0$'
000
ASSE
TSCu
rren
t ass
ets
Cas
h an
d ca
sh e
quiva
lent
s2,
000
2,00
01,
000
1,00
02,
000
2,00
02,
000
2,00
02,
000
2,00
0In
vest
men
ts52
,288
57,9
3056
,246
50,5
8154
,409
61,0
5167
,514
74,9
3879
,613
86,3
54R
ecei
vabl
es2,
812
2,94
12,
992
3,00
93,
135
3,28
83,
442
3,60
83,
743
3,90
3In
vent
orie
s-
--
--
--
--
-C
ontra
ct a
sset
sO
ther
5761
6363
6363
6570
7274
Tota
l cur
rent
ass
ets
57,1
5762
,932
60,3
0154
,652
59,6
0766
,402
73,0
2180
,616
85,4
2892
,331
Non-
curr
ent a
sset
sIn
vest
men
ts47
,771
52,9
2651
,387
46,2
1249
,709
55,7
7761
,681
68,4
6472
,735
78,8
94R
ecei
vabl
esIn
frast
ruct
ure,
pro
perty
, pla
nt a
nd e
quip
men
t60
2,30
260
0,10
761
3,57
363
3,86
463
4,89
463
2,74
263
1,83
263
0,00
063
4,34
863
5,39
2In
vest
men
ts A
ccou
nted
for u
sing
the
equi
ty m
etho
dIn
tang
ible
ass
ets
2727
2727
2727
2727
2727
Rig
ht o
f use
ass
ets
Inve
stm
ents
Acc
ount
ed fo
r usi
ng th
e eq
uity
met
hod
Oth
erTo
tal n
on-c
urre
nt a
sset
s65
0,10
065
3,06
066
4,98
768
0,10
368
4,62
968
8,54
669
3,54
169
8,49
170
7,11
071
4,31
3To
tal a
sset
s70
7,25
771
5,99
272
5,28
873
4,75
574
4,23
675
4,94
876
6,56
177
9,10
679
2,53
880
6,64
4
LIAB
ILIT
IES
Curr
ent l
iabi
litie
sP
ayab
les
450
482
499
493
497
498
515
550
566
587
Bor
row
ings
--
--
--
--
--
Pro
visio
ns
Tota
l cur
rent
liab
ilitie
s45
048
249
949
349
749
851
555
056
658
7
Non-
curr
ent l
iabi
litie
sP
ayab
les
Bor
row
ings
--
--
--
--
--
Pro
visio
ns
Tota
l non
-cur
rent
liab
ilitie
s-
--
--
--
--
-To
tal l
iabi
litie
s45
048
249
949
349
749
851
555
056
658
7
Net a
sset
s70
6,80
771
5,51
072
4,78
873
4,26
274
3,74
075
4,45
176
6,04
677
8,55
779
1,97
280
6,05
7
EQUI
TYR
etai
ned
earn
ings
274,
938
283,
641
292,
919
302,
393
311,
871
322,
582
334,
177
346,
688
360,
103
374,
188
Rev
alua
tion
rese
rves
431,
869
431,
869
431,
869
431,
869
431,
869
431,
869
431,
869
431,
869
431,
869
431,
869
Cou
ncil
equi
ty in
tere
st70
6,80
771
5,51
072
4,78
873
4,26
274
3,74
075
4,45
176
6,04
677
8,55
779
1,97
280
6,05
7
Tota
l equ
ity70
6,80
771
5,51
072
4,78
873
4,26
274
3,74
075
4,45
176
6,04
677
8,55
779
1,97
280
6,05
7

55Resourcing Strategy 2021
Attachment 16 – Cash Flow Statement – Sewer FundYe
ar 1
Ye
ar 2
Year
3Ye
ar 4
Year
5Ye
ar 6
Year
7Ye
ar 8
Year
9Ye
ar 1
020
21/2
220
22/2
320
23/2
420
24/2
520
25/2
620
26/2
720
27/2
820
28/2
920
29/3
020
30/3
1$'
000
$'00
0$'
000
$'00
0$'
000
$'00
0$'
000
$'00
0$'
000
$'00
0Ca
sh fl
ows
from
ope
ratin
g ac
tiviti
esRe
ceip
ts:
Rat
es a
nd a
nnua
l cha
rges
34,2
2435
,401
36,6
1437
,851
39,1
1440
,433
41,8
0943
,229
44,6
8046
,181
Use
r cha
rges
and
fees
3,73
83,
836
3,94
04,
047
4,17
14,
302
4,43
54,
572
4,69
84,
821
Inve
stm
ent r
even
ue a
nd in
tere
st1,
280
1,37
61,
538
1,41
51,
333
1,43
91,
636
1,81
52,
062
2,17
8G
rant
s an
d co
ntrib
utio
ns2,
032
2,06
32,
118
2,13
52,
160
2,26
52,
365
2,42
62,
455
2,53
5B
onds
and
Dep
osits
rece
ived
--
--
--
--
--
Oth
er18
1819
1920
2020
2121
22In
tern
al tr
ansf
ers
Paym
ents
:E
mpl
oyee
ben
efits
and
on-
cost
s(7
,072
)(6
,645
)(6
,821
)(7
,602
)(8
,388
)(8
,578
)(8
,774
)(8
,374
)(8
,580
)(8
,791
)M
ater
ials
& c
ontra
cts
(11,
896)
(12,
800)
(13,
279)
(13,
026)
(13,
043)
(12,
992)
(13,
436)
(14,
420)
(14,
859)
(15,
424)
Bor
row
ing
cost
s-
--
--
--
--
-B
onds
and
Dep
osits
refu
nded
--
--
--
--
--
Oth
er
(2,2
69)
(2,3
44)
(2,4
21)
(2,5
01)
(2,5
84)
(2,6
69)
(2,7
58)
(2,8
49)
(2,9
43)
(3,0
41)
Net c
ash
prov
ided
in o
pera
ting
activ
ities
20,0
5620
,906
21,7
0622
,338
22,7
8324
,219
25,2
9726
,420
27,5
3328
,481
Cash
flow
s fro
m in
vest
ing
activ
ities
Rece
ipts
:S
ale
of in
vest
men
ts-
-3,
223
10,8
39-
--
--
-S
ale
of in
frast
ruct
ure,
pro
perty
, pla
nt &
equ
ipm
ent
Sal
e of
inte
rest
s in
join
t ven
ture
s/as
soci
ates
Oth
erPa
ymen
ts:
Pur
chas
e of
inve
stm
ents
(6,3
75)
(10,
797)
--
(7,3
24)
(12,
711)
(12,
367)
(14,
207)
(8,9
46)
(12,
900)
Pur
chas
e of
infra
stru
ctur
e pr
oper
ty, p
lant
& e
quip
men
t(1
2,68
0)(1
0,10
9)(2
5,92
9)(3
3,17
8)(1
4,45
9)(1
1,50
8)(1
2,93
1)(1
2,21
3)(1
8,58
7)(1
5,58
1)P
urch
ase
of re
al e
stat
eP
urch
ase
of in
tere
sts
in jo
int v
entu
res/
asso
ciat
esO
ther
Net c
ash
used
in In
vest
ing
activ
ities
(19,
056)
(20,
906)
(22,
706)
(22,
338)
(21,
783)
(24,
219)
(25,
297)
(26,
420)
(27,
533)
(28,
481)
Cash
flow
s fro
m fi
nanc
ing
activ
ities
Rece
ipts
:B
orro
win
gs a
nd a
dvan
ces
--
--
--
--
--
Oth
erPa
ymen
ts:
Bor
row
ings
and
adv
ance
s-
--
--
--
--
-Le
ase
Liab
ilitie
sO
ther
Net c
ash
prov
ided
by
finan
cing
act
iviti
es-
--
--
--
--
-
Net i
ncre
ase/
(dec
reas
e) in
cas
h an
d ca
sh e
quiv
alen
ts1,
000
-(1
,000
)-
1,00
0-
--
--
Cash
and
cas
h eq
uiva
lent
s at
beg
inni
ng o
f rep
ortin
g pe
riod
1,00
02,
000
2,00
01,
000
1,00
02,
000
2,00
02,
000
2,00
02,
000
Cash
and
cas
h eq
uiva
lent
s at
end
of r
epor
ting
perio
d2,
000
2,00
01,
000
1,00
02,
000
2,00
02,
000
2,00
02,
000
2,00
0

56 Resourcing Strategy 2021
Attachment 17 – Unrestricted Current Ratio – ConsolidatedYe
ar 1
Ye
ar 2
Year
3Ye
ar 4
Year
5Ye
ar 6
Year
7Ye
ar 8
Year
9Ye
ar 1
020
21/2
220
22/2
320
23/2
420
24/2
520
25/2
620
26/2
720
27/2
820
28/2
920
29/3
020
30/3
1
2.76
2.82
2.74
2.77
2.74
2.74
2.84
2.92
3.05
3.15
2.00
2.20
2.40
2.60
2.80
3.00
3.20
3.40
3.60
3.80
4.00
12
34
56
78
910
% Current Asset over Current Liabili�es
Year
Unr
estr
icte
d Cu
rren
t Ra�
o

57Resourcing Strategy 2021
Attachment 18 – Capital WorksYe
ar 1
Ye
ar 2
Year
3Ye
ar 4
Year
5Ye
ar 6
Year
7Ye
ar 8
Year
9Ye
ar 1
0As
set C
ateg
ory
2021
/22
2022
/23
2023
/24
2024
/25
2025
/26
2026
/27
2027
/28
2028
/29
2029
/30
2030
/31
$'00
0$'
000
$'00
0$'
000
$'00
0$'
000
$'00
0$'
000
$'00
0$'
000
Artw
orks
3334
3536
3637
3838
3940
Brid
ges
2,09
677
61,
168
776
776
00
00
0C
omm
unity
Lan
d0
00
00
00
349
00
Equ
ipm
ent
7173
7476
7879
8183
8586
Flee
t4,
737
4,92
15,
733
4,53
95,
281
4,84
44,
279
5,99
25,
892
4,73
7In
tang
ible
s: S
oftw
are
138
142
146
150
154
158
162
166
170
175
Ker
b &
Gut
ter
8082
8385
8788
9092
9496
Non
Spe
cial
ised
Bui
ldin
gs3,
609
6,89
38,
861
8,00
91,
103
817
832
846
861
877
Ope
ratio
nal L
and
890
300
300
300
300
00
00
0O
ther
Infra
stru
ctur
e8,
803
2,00
06,
072
125
10,0
0010
,226
00
00
Oth
er S
truct
ures
Rec
Ser
vices
110
112
114
116
119
121
124
126
129
131
Roa
ds16
,006
15,3
3015
,637
15,6
5415
,144
14,9
1815
,179
15,4
4615
,717
15,9
94S
ewer
Infra
stru
ctur
e12
,680
10,1
0925
,864
33,1
7814
,459
11,5
0812
,931
12,2
1318
,587
15,5
81S
torm
wat
er D
rain
age
939
1,42
51,
432
1,43
81,
445
1,45
21,
459
1,46
61,
474
1,48
1S
treet
Fur
nitu
re46
4748
4950
5152
5354
55W
ater
Infra
stru
ctur
e14
,529
14,4
5319
,470
28,8
1841
,954
15,1
3525
,361
17,5
5013
,302
16,9
20
Gra
nd T
otal
64,7
6856
,697
85,0
3793
,350
90,9
8559
,434
60,5
8754
,422
56,4
0456
,174

58 Resourcing Strategy 2021
Attachment 19 – Sensitivity Analysis – ConsolidatedYe
ar 1
Ye
ar 2
Year
3Ye
ar 4
Year
5Ye
ar 6
Year
7Ye
ar 8
Year
9Ye
ar 1
020
21/2
220
22/2
320
23/2
420
24/2
520
25/2
620
26/2
720
27/2
820
28/2
920
29/3
020
30/3
1$'
000
$'00
0$'
000
$'00
0$'
000
$'00
0$'
000
$'00
0$'
000
$'00
0
O+2
.00%
1,18
71,
215
1,24
51,
276
1,30
81,
341
1,37
41,
409
1,44
41,
480
Gen
eral
Fun
d R
ates
A
60,7
3062
,248
63,8
0465
,399
67,0
3468
,709
70,4
2772
,188
73,9
9275
,842
W-1
.00%
(594
)(6
07)
(622
)(6
38)
(654
)(6
70)
(687
)(7
04)
(722
)(7
40)
O+1
.00%
500
514
529
545
561
577
594
611
628
646
Use
r Cha
rges
& F
ees
A52
,546
54,0
1255
,584
57,1
9958
,869
60,5
8562
,341
64,1
4665
,973
67,8
51(n
on s
tatu
tory
)W
-2.0
0%(1
,001
)(1
,029
)(1
,059
)(1
,089
)(1
,121
)(1
,154
)(1
,187
)(1
,222
)(1
,257
)(1
,292
)
O+2
.00%
3,61
43,
694
3,71
73,
532
3,34
23,
431
3,51
43,
637
3,78
83,
942
Inte
rest
Rec
eive
dA
6,32
56,
464
6,50
66,
181
5,84
96,
004
6,15
06,
366
6,62
96,
899
W-2
.00%
(3,6
14)
(3,6
94)
(3,7
17)
(3,5
32)
(3,3
42)
(3,4
31)
(3,5
14)
(3,6
37)
(3,7
88)
(3,9
42)
O-1
.00%
(581
)(5
88)
(602
)(6
23)
(644
)(6
60)
(676
)(6
87)
(704
)(7
21)
Em
ploy
ee C
osts
A59
,903
60,3
9361
,652
63,5
6665
,508
66,8
8068
,281
69,1
1370
,576
72,0
70W
+0.5
0%29
129
430
131
132
233
033
834
335
236
1
O-2
.00%
(40)
(87)
(212
)(2
58)
(303
)(3
49)
(377
)(4
01)
(425
)(4
49)
Bor
row
ing
Cos
tsA
8,44
07,
978
7,57
47,
059
6,53
76,
027
5,48
74,
889
4,32
43,
715
W+2
.00%
4087
212
258
303
349
377
401
425
449
O-1
.00%
(573
)(5
78)
(590
)(6
11)
(611
)(6
25)
(665
)(6
73)
(679
)(7
00)
Mat
eria
ls &
Con
tract
sA
58,8
6759
,367
60,6
6562
,770
62,7
8464
,251
68,3
4569
,121
69,7
7771
,944
W+1
.00%
573
578
590
611
611
625
665
673
679
700
O =
Opt
imis
ticA
= A
dopt
edW
= W
orse
cas
e

59Resourcing Strategy 2021
Attachment 20 – Rate Notice estimateYe
ar 1
Ye
ar 2
Year
3Ye
ar 4
Year
5Ye
ar 6
Year
7Ye
ar 8
Year
9Ye
ar 1
020
21/2
220
22/2
320
23/2
420
24/2
520
25/2
620
26/2
720
27/2
820
28/2
920
29/3
020
30/3
1Ra
tes
- min
imum
Res
iden
tial -
@ 2
% in
crea
se$1
,124
.70
$1,1
47.2
0$1
,170
.10
$1,1
93.5
0$1
,217
.40
$1,2
41.7
0$1
,266
.50
$1,2
91.8
0$1
,317
.60
$1,3
44.0
0
Was
te M
anag
emen
tD
omes
tic W
aste
Ser
vice
Cha
rge
*$1
85.0
0$1
90.6
0$1
96.3
0$2
02.2
0$2
08.3
0$2
14.5
0$2
20.9
0$2
27.5
0$2
34.3
0$2
41.3
0D
omes
tic W
aste
Man
agem
ent C
harg
e$7
1.90
$74.
10$7
6.30
$78.
60$8
1.00
$83.
40$8
5.90
$88.
50$9
1.20
$93.
90W
aste
Min
imis
atio
n an
d R
ecyc
ling
Cha
rge
*$8
0.00
$82.
40$8
4.90
$87.
40$9
0.00
$92.
70$9
5.50
$98.
40$1
01.4
0$1
04.4
0La
ndfil
l Man
agem
ent C
harg
e$5
7.50
$59.
20$6
1.00
$62.
80$6
4.70
$66.
60$6
8.60
$70.
70$7
2.80
$75.
00$3
94.4
0$4
06.3
0$4
18.5
0$4
31.0
0$4
44.0
0$4
57.2
0$4
70.9
0$4
85.1
0$4
99.7
0$5
14.6
0
Sew
er A
cces
s Ch
arge
$881
.35
$894
.90
$908
.70
$922
.70
$936
.90
$951
.35
$966
.00
$980
.90
$996
.00
$1,0
11.3
5
Wat
er A
cces
s Ch
arge
20m
m s
ervic
e$1
82.1
0$1
84.9
0$1
87.7
5$1
90.6
5$1
93.6
0$1
96.6
0$1
99.6
5$2
02.7
0$2
05.8
0$2
08.9
5
Wat
er V
olum
etric
@ 2
00 K
l$6
32.0
0$6
44.0
0$6
56.0
0$6
68.0
0$6
80.0
0$6
92.0
0$7
04.0
0$7
16.0
0$7
28.0
0$7
40.0
0
Wat
er V
olum
etric
/Kl
$3.1
6$3
.22
$3.2
8$3
.34
$3.4
0$3
.46
$3.5
2$3
.58
$3.6
4$3
.70
Tota
l for
a R
esid
entia
l Pro
perty
$3,2
14.5
5$3
,277
.30
$3,3
41.0
5$3
,405
.85
$3,4
71.9
0$3
,538
.85
$3,6
07.0
5$3
,676
.50
$3,7
47.1
0$3
,818
.90
* ba
sed
on ty
pica
l bin
siz
es a
nd c
olle
ctio
n fre
quen
cy

60 Resourcing Strategy 2021
Attachment 21Ye
ar 1
Year
2Ye
ar 3
Year
4Ye
ar 5
Year
6Ye
ar 7
Year
8Ye
ar 9
Year
10
Fina
ncia
l Goa
ls20
21/2
220
22/2
320
23/2
420
24/2
520
25/2
620
26/2
720
27/2
820
28/2
920
29/3
020
30/3
1G
ener
al F
und
7.8%
7.7%
7.4%
6.9%
6.7%
6.5%
6.3%
5.9%
5.6%
5.0%
10.0
%W
ater
Fun
d16
.4%
15.9
%15
.4%
15.0
%14
.6%
14.1
%13
.7%
13.3
%12
.8%
12.4
%25
.0%
Con
solid
ated
9.67
%9.
52%
9.21
%8.
70%
8.48
%8.
27%
8.00
%7.
60%
7.28
%6.
72%
15.0
0%
0.0%
2.0%
4.0%
6.0%
8.0%
10.0
%
12.0
%
14.0
%
16.0
%
18.0
%
12
34
56
78
910
% Opera�ng Revenue
Year
Debt
Ser
vice
Ra�
o
Gen
eral
Fun
d
Wat
er F
und
Cons
olid
ated


Customer Service | 02 6670 2400 | 1300 292 872
[email protected] www.tweed.nsw.gov.au
PO Box 816 Murwillumbah NSW 2484