RESOURCING STRATEGY - Georges River Council
73
www.georgesriver.nsw.gov.au RESOURCING STRATEGY 2018-2019 LONG TERM FINANCIAL PLAN WORKFORCE MANAGEMENT PLAN ASSET MANAGEMENT STRATEGY AND PLAN
Transcript of RESOURCING STRATEGY - Georges River Council

www.georgesriver.nsw.gov.au
RESOURCING STRATEGY2018-2019LONG TERM FINANCIAL PLANWORKFORCE MANAGEMENT PLANASSET MANAGEMENT STRATEGY AND PLAN
2 Georges River Council // Resourcing Strategy 3
Resourcing Strategy Introduction ................................................3Long Term Financial Plan ............................................................6Workforce Management Plan ......................................................22Asset Management Plan .............................................................44 Asset Management Plan - Appendices........................................91
CONTENTS
4 Georges River Council // Resourcing Strategy 5
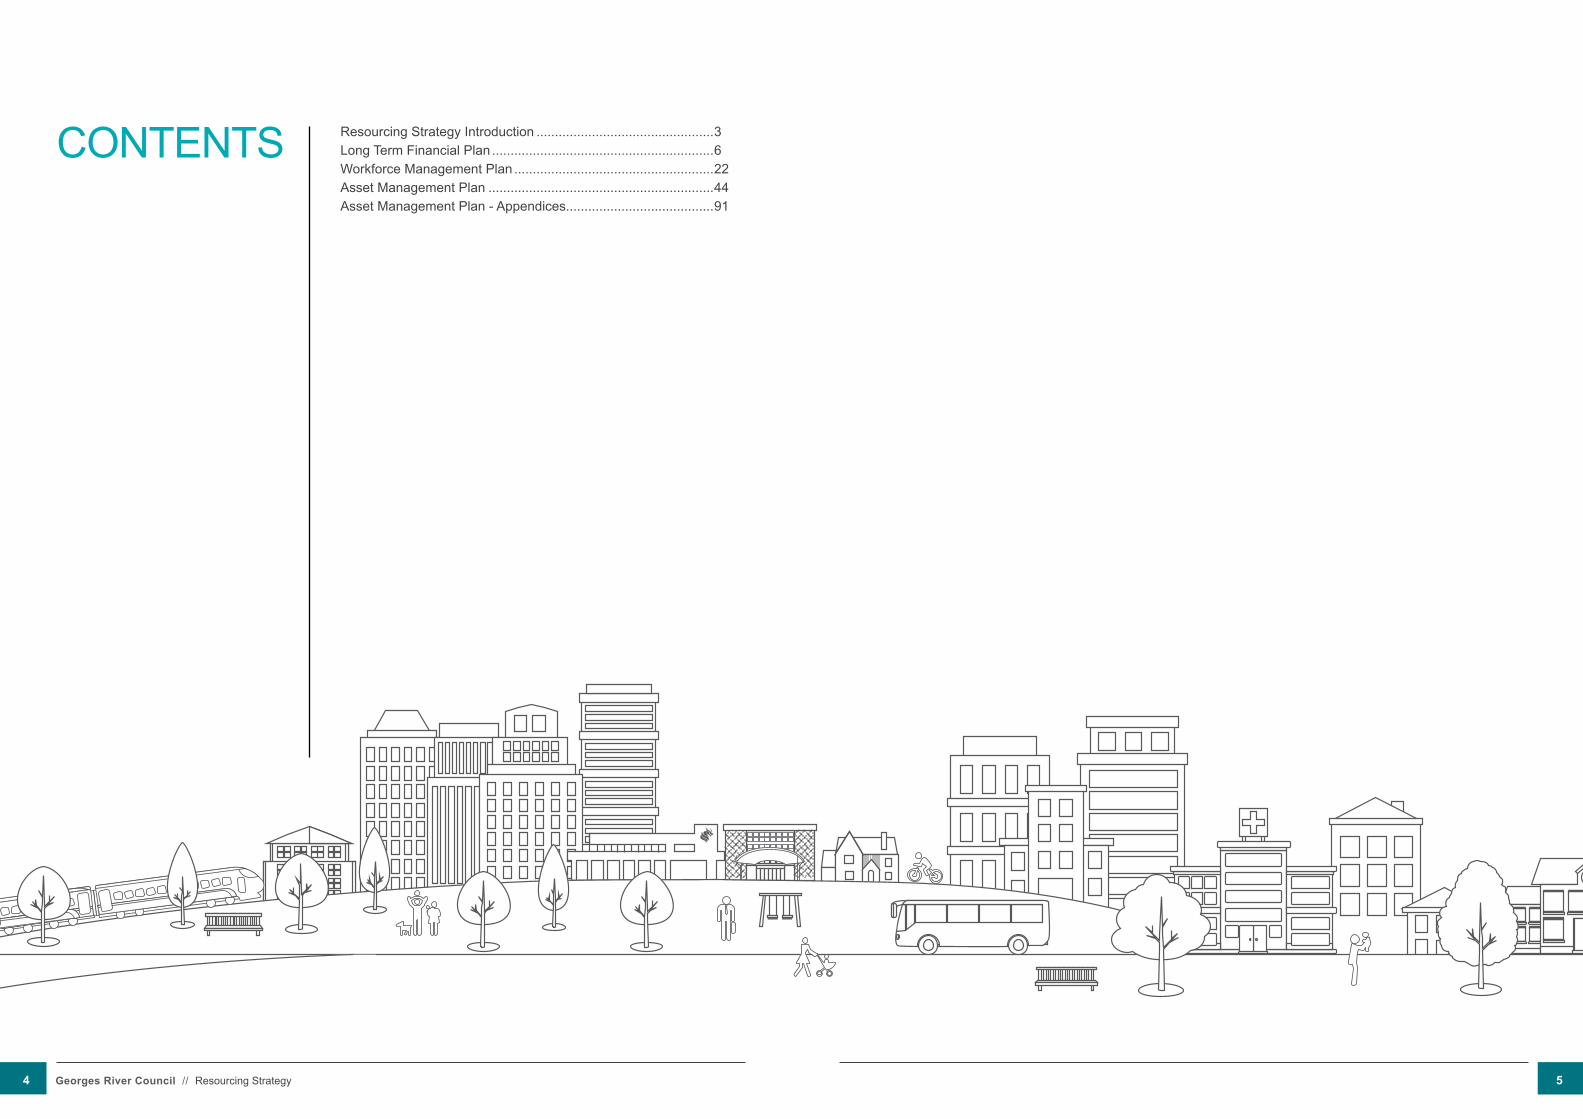
RESOuRCING STRATEGY INTRODuCTIONBackground - Integrated Planning and ReportingLike all Councils, Georges River Council operates under the Local Government Act 1993. The Act requires us to produce a suite of documents as part of an Integrated Planning and Reporting Framework.
The Framework brings together Councils’ various plans, giving both Council and the community a clear understanding of how each of the plans interact. This process maximises Council efforts to strategically and holistically plan for the future.
DELIVERY PROGRAM
3 YEARS
OPERATIONAL PLAN1 YEAR
ANNUAL REPORT
PERPETuAL MONITORING AND REVIEW
RESOURCING STRATEGY
Contains the Long Term Financial, Workforce and Asset
Management PlansCOMMUNITY
ENGAGEMENT
COMMuNITY STRATEGIC PLAN
10 + YEARS
This Resourcing Strategy has been developed alongside our first-ever Community Strategic Plan, which is based on extensive community engagement during 2017. The Community Strategic Plan contains the community’s priorities and aspirations for the next 10 years, as well as the strategies for achieving these goals.
Our Delivery Program sets out the proposed actions to achieve the goals and strategies in the Community Strategic Plan. Normally, the Delivery Program runs for four years; as a recently merged Council, our first Delivery Program is for three years to align with the local government election cycle.
We have also prepared a one-year Operational Plan to show the specific actions and budgets that we propose for 2018-19, consistent with the three-year Delivery Program.
Resourcing StrategyWe cannot achieve the commitments we have made to the community in our Community Strategic Plan, Delivery Program and Operational Plan without sufficient resources – time, money, assets and people. This Resourcing Strategy will help us to meet our commitments.
It consists of three components:The Long Term Financial Plan forecasts Council’s financial position for the next 10 years based on our Delivery Program and Operational Plan. It will be updated annually and reviewed in detail every four years.
The Workforce Management Plan identifies the people requirements, including skills and employment practices, needed to implement our Delivery Program.The Asset Management Strategy and Plan incorporates existing and new assets and aligns with the Community Strategic Plan.
While the Community Strategic Plan outlines, in general, how other levels of government and other stakeholders can help us to meet the community’s priorities, this Resourcing Strategy details the matters that are Council’s responsibility.
6 Georges River Council // Resourcing Strategy 7

LONG TERM FINANCIAL PLANIntroductionThe Georges River Council Long-Term Financial Plan (LTFP) encompasses the operations of the former Hurstville and Kogarah councils. under the terms of the amalgamation, changes to the rate in the dollar in respect of property rates and employment conditions are restricted until 2020-21.
The basic premise of the 2017-18 LTFP, while adhering to the above terms of amalgamation, is to meet Council’s ambition to introduce equity in the rates and charges relating to property (from 2021-22), including the Domestic Waste Management Charge (DWMC). Since the amounts levied for the DWMC is in the form of a “charge”, variations to bring about parity can be introduced as soon as required.
Council is required to reduce its rates income for the 2021-22 rating year by $2,166,708, as per the June 2006 Directive in the “Instrument under Section 508(2) and Section 548(3) (a)” by the then Minister of Local Government to Hurstville City Council to “reduce its general income for the 2021/2022 rating year by $1,580,385 plus the equivalent cumulative proportion of this increase from any general variation increases or any special variation increases approved for the 2007/2008 to 2020/2021 rating years inclusive.”
The overall impact of implementing this Directive results in an ongoing adverse impact on future revenue streams.
While incorporating the above requirements into the LTFP, we are conscious of the need to maintain financial sustainability of our operations over the long term.
The Income & Expenditure Statements in this LTFP show a negative or downward trending financial results from 2021-22 onwards as a direct consequence of the reduction of $2,166,708 income in 2021-22. This then has an adverse compounding effect that sees exponential growth in Council’s lack of profitability.This is a specific challenge, particularly from 2021-22. Financial operational and strategic decisions will be required over the next few years to ensure Council’s current and longer-term financial sustainability.
ScenariosThe approach to preparing the LTFP was to evaluate the potential outcomes in the course of meeting the aforementioned structure, through three scenarios:
• “As is” – continue current structure and revenue base with the incremental increase to harmonise the two Council DWMCs (based on the 2018-19 budget and Fees and Charges).
• “Harmonise Rates Structure and DWMC” to reflect lower of the two Council charges.
• “Harmonise Rates Structure and DWMC” to reflect mid-point of the two Council charges.
Summary of LTFP scenario outcomesThe LTFP has evaluated the financial feasibility of implementing Council’s intent to harmonise property rates and DWMCs between the former Hurstville and Kogarah local government areas.
Harmonisation of property rates structure does not impact total Council income, as the amount permitted to be levied remains unaffected by any changes to the rating structure.
The DWMC, however, is not governed by those provisions and must be structured to fully recover all Domestic Waste Management Service costs.The LTFP shows that the implementation of harmonisation initiatives are hampered by the effects of the repeal of the Special Rate Variation granted to the former Hurstville City Council.
In addition, it also shows that continuing to use the existing rate structure is also unfeasible, given that Scenario 1 also records losses in the latter half of the 10-year period.
While there is no immediate pressure to find solutions, under the circumstances, strong decisions to address this challenge need to be made during 2018-19.
The obvious requirement is to increase operating income and/or reduce operating expenditure. In this regard, Council recognises the need to:
• enquire into the various elements of income and expenditure
• find additional sources of revenue and/or increase existing streams of revenue
• explore avenues to reduce expenditure without affecting levels of service to the community.
Georges River Council is committed to drawing the organisation into positive territory and improving its financial strength. Sustainability of operations enables us to continue providing services not just at existing standards but at enhanced levels to ultimately benefit its community. We will consult the community on proposed initiatives that will aim to embed sustainability in our operations.
ReviewsReviews of each scenario show none yield positive results throughout the 10-year period. The overriding influence of the repeal of the Special Rate Variation afforded to Hurstville City Council in June 2006 affects the ability of the merged Georges River Council to generate sufficient revenue to cover its level of operating expenditure.
Council has therefore undertaken, over the coming financial year, to enquire into and understand the options available to increase the revenue it generates and reduce its operating expenditure while maintaining its level of service delivery.
Assumptions and estimatesThe assumptions that have informed Council’s the long-term financial outlook are below.
2018/19 2019/20 2020/21 2021/22 2022/23 2023/24 2024/25 2025/26 2026/27 2027/28BUDGET Estimate Estimate Estimate Estimate Estimate Estimate Estimate Estimate Estimate
Consumer Price Index % 2.3% 2.3% 2.0% 2.0% 2.1% 2.2% 2.3% 2.4% 2.5% 2.5%
Rate Pegging Limit % 2.3% 2.3% 2.0% 2.0% 2.1% 2.2% 2.3% 2.4% 2.5% 2.5%
Rate increases % 2.3% 2.3% 2.0% 2.0% 2.1% 2.2% 2.3% 2.4% 2.5% 2.5%
Stormwater Management Charge Revenue $M 1.249 1.278 1.304 1.330 1.358 1.388 1.420 1.454 1.490 1.527
Domestic Waste Revenue $M 23.71 25.04 25.93 27.38 28.63 29.26 29.93 30.65 31.42 32.20
User Fees and Charges Revenue $M 14.61 14.94 15.24 15.55 15.87 16.22 16.59 16.99 17.42 17.85
Interest Rate on Investments % 2.5% 2.5% 2.5% 2.5% 2.5% 2.5% 2.5% 2.5% 2.5% 2.5%
Revenue from Interest on Investments $M 5.63 4.22 3.85 3.47 3.09 2.74 2.39 2.04 1.70 1.38
Operating Grants & Contributions $M 8.13 8.32 8.49 8.66 8.84 9.03 9.24 9.46 9.70 9.94
Capital Grants & Contributions $M 14.61 14.95 15.25 15.55 15.88 16.23 16.60 17.00 17.43 17.86
Rate of Increase in Employee Costs % 2.3% 2.3% 2.0% 2.0% 2.1% 2.2% 2.3% 2.4% 2.5% 2.5%
Accounts Receivable - Days Outstanding Days 11 11 11 11 11 11 11 11 11 11
Accounts Payable - Days Outstanding Days 45 44 43 42 41 40 39 38 37 36
Loans Outstanding $M 1.625 1.125 0.625 0.125 0 0 0 0 0 0
New Borrowings NIL NIL NIL NIL NIL NIL NIL NIL NIL NIL
Capital Works Program $M 25.00 25.00 25.00 25.00 25.00 25.00 25.00 25.00 25.00 25.00
Inventory Turnover # 16 17 17 17 17 17 17 17 17 17
Georges River CouncilFinancial Assumptions and Highlights
9 8 Georges River Council // Long Term Financial Plan
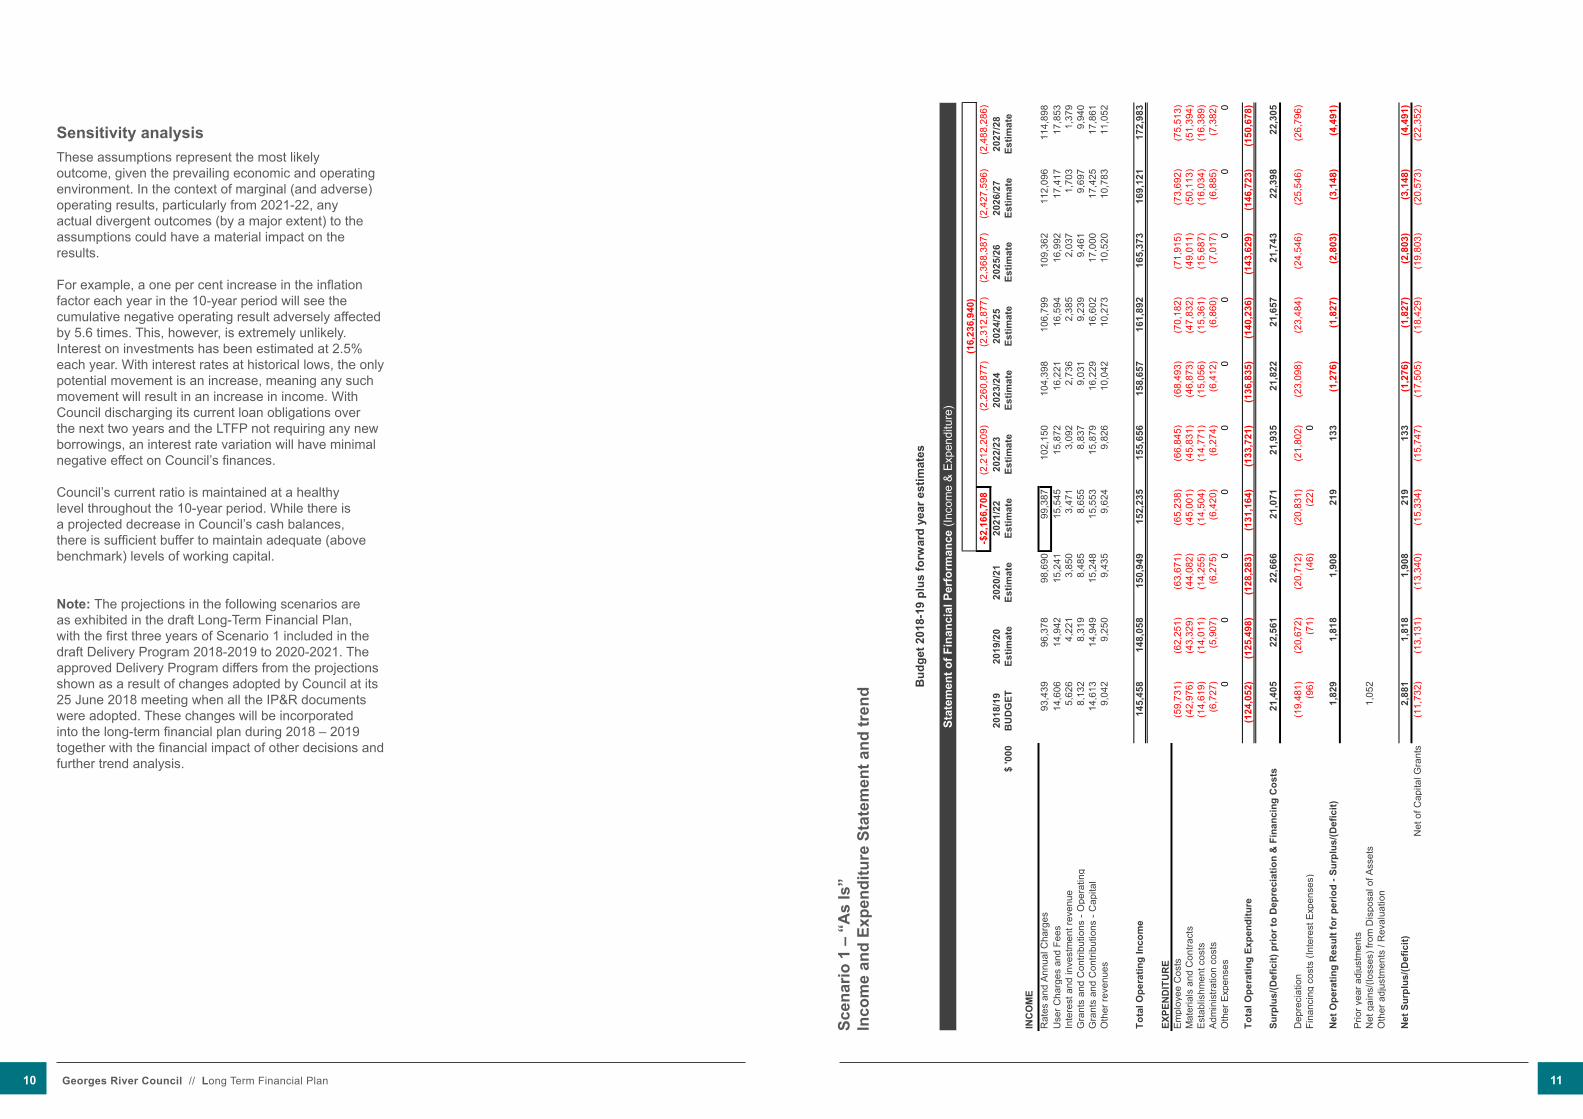
Sensitivity analysisThese assumptions represent the most likely outcome, given the prevailing economic and operating environment. In the context of marginal (and adverse) operating results, particularly from 2021-22, any actual divergent outcomes (by a major extent) to the assumptions could have a material impact on the results.
For example, a one per cent increase in the inflation factor each year in the 10-year period will see the cumulative negative operating result adversely affected by 5.6 times. This, however, is extremely unlikely.Interest on investments has been estimated at 2.5% each year. With interest rates at historical lows, the only potential movement is an increase, meaning any such movement will result in an increase in income. With Council discharging its current loan obligations over the next two years and the LTFP not requiring any new borrowings, an interest rate variation will have minimal negative effect on Council’s finances.
Council’s current ratio is maintained at a healthy level throughout the 10-year period. While there is a projected decrease in Council’s cash balances, there is sufficient buffer to maintain adequate (above benchmark) levels of working capital.
Note: The projections in the following scenarios are as exhibited in the draft Long-Term Financial Plan, with the first three years of Scenario 1 included in the draft Delivery Program 2018-2019 to 2020-2021. The approved Delivery Program differs from the projections shown as a result of changes adopted by Council at its 25 June 2018 meeting when all the IP&R documents were adopted. These changes will be incorporated into the long-term financial plan during 2018 – 2019 together with the financial impact of other decisions and further trend analysis.
Scen
ario
1 –
“A
s Is
”In
com
e an
d Ex
pend
iture
Sta
tem
ent a
nd tr
end
Scen
ario
1 -
As
is
-$2,
166,
708
(2,2
12,2
09)
(2,2
60,8
77)
(2,3
12,8
77)
(2,3
68,3
87)
(2,4
27,5
96)
(2,4
88,2
86)
2018
/19
2019
/20
2020
/21
2021
/22
2022
/23
2023
/24
2024
/25
2025
/26
2026
/27
2027
/28
$ '0
00B
UD
GET
Estim
ate
Estim
ate
Estim
ate
Estim
ate
Estim
ate
Estim
ate
Estim
ate
Estim
ate
Estim
ate
INC
OM
ER
ates
and
Ann
ual C
harg
es93
,439
96,3
7898
,690
99,3
8710
2,15
010
4,39
810
6,79
910
9,36
211
2,09
611
4,89
8U
ser C
harg
es a
nd F
ees
14,6
0614
,942
15,2
4115
,545
15,8
7216
,221
16,5
9416
,992
17,4
1717
,853
Inte
rest
and
inve
stm
ent r
even
ue5,
626
4,22
13,
850
3,47
13,
092
2,73
62,
385
2,03
71,
703
1,37
9G
rant
s an
d C
ontri
butio
ns -
Ope
ratin
g8,
132
8,31
98,
485
8,65
58,
837
9,03
19,
239
9,46
19,
697
9,94
0G
rant
s an
d C
ontri
butio
ns -
Cap
ital
14,6
1314
,949
15,2
4815
,553
15,8
7916
,229
16,6
0217
,000
17,4
2517
,861
Oth
er re
venu
es9,
042
9,25
09,
435
9,62
49,
826
10,0
4210
,273
10,5
2010
,783
11,0
52
Tota
l Ope
ratin
g In
com
e14
5,45
814
8,05
815
0,94
915
2,23
515
5,65
615
8,65
716
1,89
216
5,37
316
9,12
117
2,98
3
EXPE
ND
ITU
RE
Empl
oyee
Cos
ts(5
9,73
1)(6
2,25
1)(6
3,67
1)(6
5,23
8)(6
6,84
5)(6
8,49
3)(7
0,18
2)(7
1,91
5)(7
3,69
2)(7
5,51
3)M
ater
ials
and
Con
tract
s(4
2,97
6)(4
3,32
9)(4
4,08
2)(4
5,00
1)(4
5,83
1)(4
6,87
3)(4
7,83
2)(4
9,01
1)(5
0,11
3)(5
1,39
4)Es
tabl
ishm
ent c
osts
(14,
619)
(14,
011)
(14,
255)
(14,
504)
(14,
771)
(15,
056)
(15,
361)
(15,
687)
(16,
034)
(16,
389)
Adm
inis
tratio
n co
sts
(6,7
27)
(5,9
07)
(6,2
75)
(6,4
20)
(6,2
74)
(6,4
12)
(6,8
60)
(7,0
17)
(6,8
85)
(7,3
82)
Oth
er E
xpen
ses
00
00
00
00
00
Tota
l Ope
ratin
g Ex
pend
iture
(124
,052
)(1
25,4
98)
(128
,283
)(1
31,1
64)
(133
,721
)(1
36,8
35)
(140
,236
)(1
43,6
29)
(146
,723
)(1
50,6
78)
Surp
lus/
(Def
icit)
prio
r to
Dep
reci
atio
n &
Fin
anci
ng C
osts
21,4
0522
,561
22,6
6621
,071
21,9
3521
,822
21,6
5721
,743
22,3
9822
,305
Dep
reci
atio
n(1
9,48
1)(2
0,67
2)(2
0,71
2)(2
0,83
1)(2
1,80
2)(2
3,09
8)(2
3,48
4)(2
4,54
6)(2
5,54
6)(2
6,79
6)Fi
nanc
ing
cost
s (In
tere
st E
xpen
ses)
(96)
(71)
(46)
(22)
0
Net
Ope
ratin
g R
esul
t for
per
iod
- Sur
plus
/(Def
icit)
1,82
91,
818
1,90
821
913
3(1
,276
)(1
,827
)(2
,803
)(3
,148
)(4
,491
)
Prio
r yea
r adj
ustm
ents
Net
gai
ns/(l
osse
s) fr
om D
ispo
sal o
f Ass
ets
1,05
2O
ther
adj
ustm
ents
/ R
eval
uatio
n
Net
Sur
plus
/(Def
icit)
2,88
11,
818
1,90
821
913
3(1
,276
)(1
,827
)(2
,803
)(3
,148
)(4
,491
)N
et o
f Cap
ital G
rant
s(1
1,73
2)(1
3,13
1)(1
3,34
0)(1
5,33
4)(1
5,74
7)(1
7,50
5)(1
8,42
9)(1
9,80
3)(2
0,57
3)(2
2,35
2)
(16,
236,
940)
Stat
emen
t of F
inan
cial
Per
form
ance
(Inc
ome
& E
xpen
ditu
re)
B
udge
t 201
8-19
plu
s fo
rwar
d ye
ar e
stim
ates
10 Georges River Council // Long Term Financial Plan 11

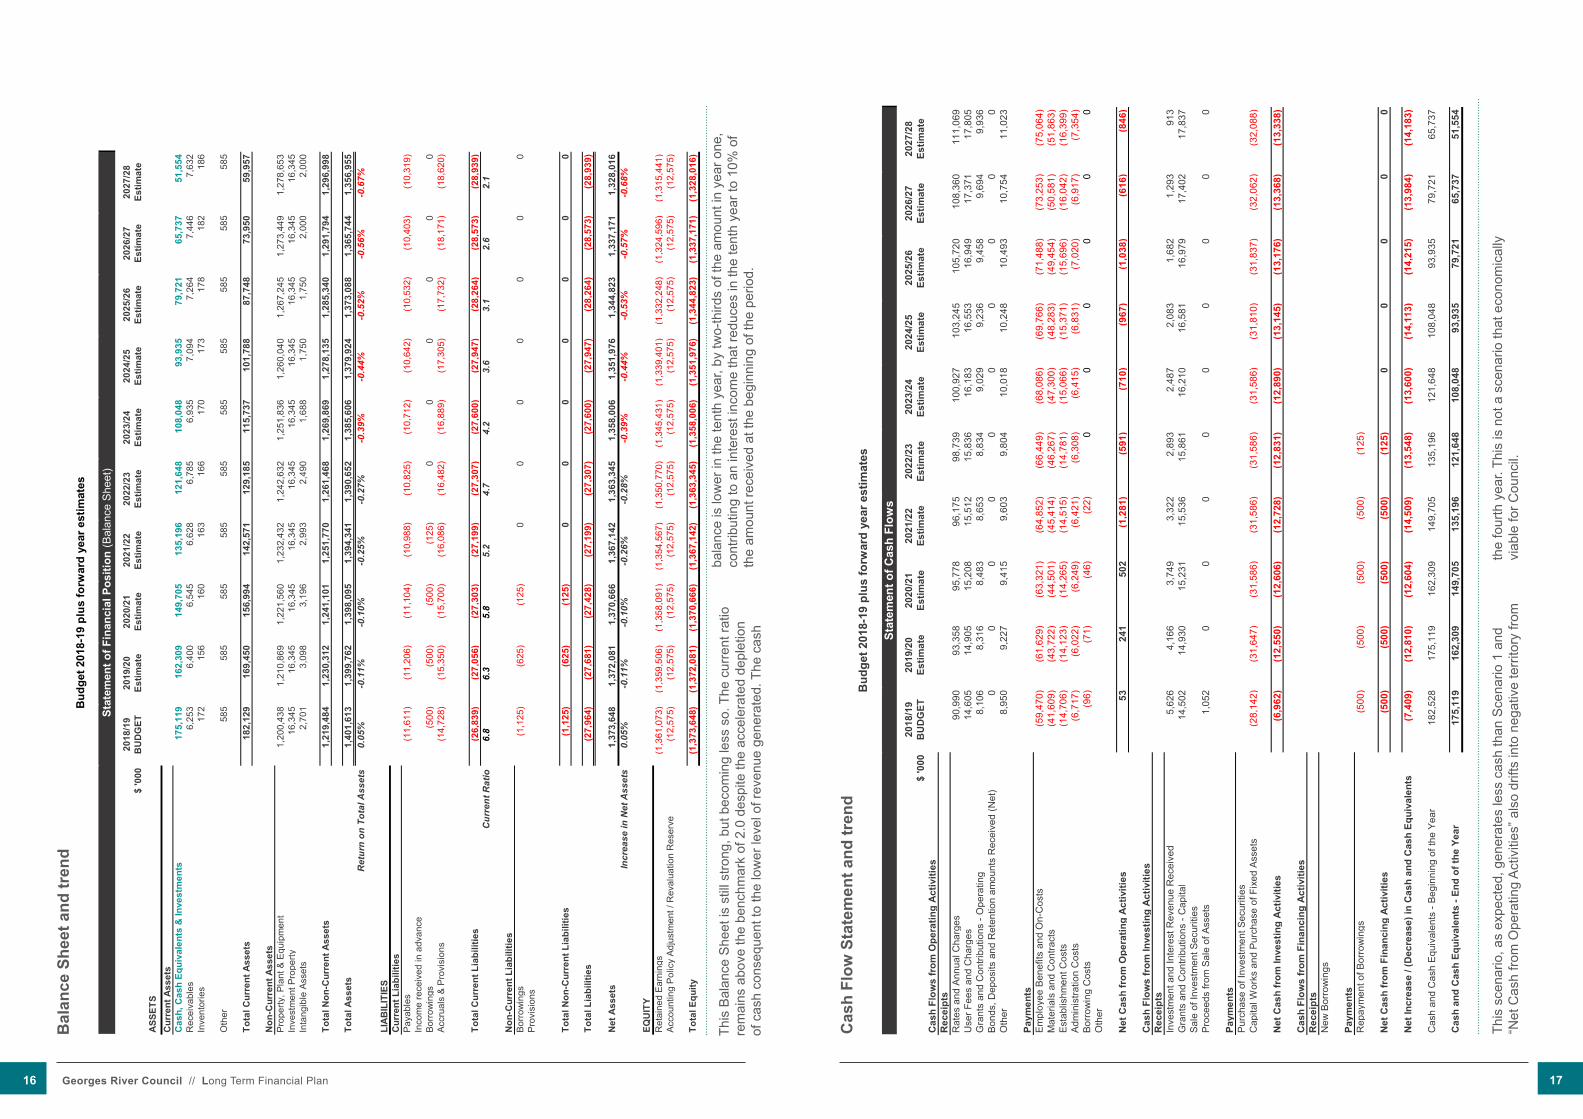
Des
pite
the
draw
dow
n on
the
Net
Wor
th (R
etai
ned
Ear
ning
s) o
f Cou
ncil,
the
Bal
ance
She
et re
mai
ns re
ason
ably
hea
lthy.
Cou
ncil’s
cas
h po
sitio
n de
plet
es th
roug
hout
the
10-y
ear p
erio
d an
d is
the
resu
lt of
an
annu
al c
apita
l wor
ks p
rogr
am o
f $25
mill
ion
each
yea
r and
a
redu
ctio
n in
rate
s re
venu
e fro
m 2
021-
22.
The
avai
labi
lity
of s
uffic
ient
cas
h pr
eclu
des
the
need
to b
orro
w to
fina
nce
the
capi
tal w
orks
pro
gram
.
Alth
ough
the
curr
ent r
atio
(refl
ectin
g w
orki
ng c
apita
l) re
duce
s fro
m 6
.9 to
3.4
, it
is s
till w
ell a
bove
the
wid
ely
acce
pted
ben
chm
ark
of 2
.0.
Oth
er th
an fo
r the
redu
ctio
n in
equ
ity (c
onse
quen
t to
the
adve
rse
oper
atin
g re
sult)
, the
Bal
ance
She
et s
how
s a
stro
ng fi
nanc
ial p
ositi
on a
lbei
t one
that
is
grad
ually
losi
ng it
s st
reng
th.
Bal
ance
She
et a
nd tr
end
2018
/19
2019
/20
2020
/21
2021
/22
2022
/23
2023
/24
2024
/25
2025
/26
2026
/27
2027
/28
$ '0
00B
UD
GET
Estim
ate
Estim
ate
Estim
ate
Estim
ate
Estim
ate
Estim
ate
Estim
ate
Estim
ate
Estim
ate
ASS
ETS
Cur
rent
Ass
ets
Cas
h, C
ash
Equi
vale
nts
& In
vest
men
ts17
7,25
416
7,76
215
8,48
514
7,70
813
8,08
612
8,54
711
8,63
510
8,76
899
,287
89,7
64R
ecei
vabl
es6,
320
6,48
96,
630
6,72
46,
886
7,03
77,
199
7,37
27,
556
7,74
5In
vent
orie
s17
215
616
016
316
617
017
317
818
218
6
Oth
er58
558
558
558
558
558
558
558
558
558
5
Tota
l Cur
rent
Ass
ets
184,
331
174,
992
165,
859
155,
180
145,
723
136,
339
126,
593
116,
902
107,
610
98,2
80
Non
-Cur
rent
Ass
ets
Prop
erty
, Pla
nt &
Equ
ipm
ent
1,20
0,43
81,
210,
869
1,22
1,56
01,
232,
432
1,24
2,63
21,
251,
836
1,26
0,04
01,
267,
245
1,27
3,44
91,
278,
653
Inve
stm
ent P
rope
rty16
,345
16,3
4516
,345
16,3
4516
,345
16,3
4516
,345
16,3
4516
,345
16,3
45In
tang
ible
Ass
ets
2,70
13,
098
3,19
62,
993
2,49
01,
688
1,75
01,
750
2,00
02,
000
Tota
l Non
-Cur
rent
Ass
ets
1,21
9,48
41,
230,
312
1,24
1,10
11,
251,
770
1,26
1,46
81,
269,
869
1,27
8,13
51,
285,
340
1,29
1,79
41,
296,
998
Tota
l Ass
ets
1,40
3,81
41,
405,
304
1,40
6,96
01,
406,
949
1,40
7,19
01,
406,
208
1,40
4,72
81,
402,
242
1,39
9,40
41,
395,
278
Ret
urn
on T
otal
Ass
ets
0.21
%0.
13%
0.14
%0.
02%
0.01
%-0
.09%
-0.1
3%-0
.20%
-0.2
2%-0
.32%
LIA
BIL
ITIE
SC
urre
nt L
iabi
litie
sPa
yabl
es(1
1,61
1)(1
1,16
2)(1
1,05
9)(1
0,94
4)(1
0,78
1)(1
0,66
8)(1
0,59
9)(1
0,48
8)(1
0,35
9)(1
0,27
6)In
com
e re
ceiv
ed in
adv
ance
Borr
owin
gs(5
00)
(500
)(5
00)
(125
)0
00
00
0Ac
crua
ls &
Pro
visi
ons
(14,
728)
(15,
350)
(15,
700)
(16,
086)
(16,
482)
(16,
889)
(17,
305)
(17,
732)
(18,
171)
(18,
620)
Tota
l Cur
rent
Lia
bilit
ies
(26,
839)
(27,
011)
(27,
259)
(27,
155)
(27,
263)
(27,
557)
(27,
904)
(28,
221)
(28,
530)
(28,
896)
Cur
rent
Rat
io6.
96.
56.
15.
75.
34.
94.
54.
13.
83.
4
Non
-Cur
rent
Lia
bilit
ies
Borr
owin
gs(1
,125
)(6
25)
(125
)0
00
00
00
Prov
isio
ns
Tota
l Non
-Cur
rent
Lia
bilit
ies
(1,1
25)
(625
)(1
25)
00
00
00
0
Tota
l Lia
bilit
ies
(27,
964)
(27,
636)
(27,
384)
(27,
155)
(27,
263)
(27,
557)
(27,
904)
(28,
221)
(28,
530)
(28,
896)
Net
Ass
ets
1,37
5,85
01,
377,
668
1,37
9,57
51,
379,
794
1,37
9,92
71,
378,
651
1,37
6,82
41,
374,
021
1,37
0,87
41,
366,
382
Incr
ease
in N
et A
sset
s0.
21%
0.13
%0.
14%
0.02
%0.
01%
-0.0
9%-0
.13%
-0.2
0%-0
.23%
-0.3
3%
EQU
ITY
Ret
aine
d Ea
rnin
gs(1
,363
,275
)(1
,365
,093
)(1
,367
,000
)(1
,367
,219
)(1
,367
,352
)(1
,366
,076
)(1
,364
,249
)(1
,361
,446
)(1
,358
,299
)(1
,353
,807
)Ac
coun
ting
Polic
y Ad
just
men
t / R
eval
uatio
n R
eser
ve(1
2,57
5)(1
2,57
5)(1
2,57
5)(1
2,57
5)(1
2,57
5)(1
2,57
5)(1
2,57
5)(1
2,57
5)(1
2,57
5)(1
2,57
5)
Tota
l Equ
ity(1
,375
,850
)(1
,377
,668
)(1
,379
,575
)(1
,379
,794
)(1
,379
,927
)(1
,378
,651
)(1
,376
,824
)(1
,374
,021
)(1
,370
,874
)(1
,366
,382
)
Stat
emen
t of F
inan
cial
Pos
ition
(Bal
ance
She
et)
Bud
get 2
018-
19 p
lus
forw
ard
year
est
imat
es
12 Georges River Council // Long Term Financial Plan 13
Net
cas
h flo
w fr
om o
pera
ting
activ
ities
is s
how
n to
be
posi
tive
thro
ugho
ut
the
10-y
ear p
erio
d. W
hile
this
is p
ositi
ve, t
here
is n
o di
scer
nibl
e up
war
d
Cas
h Fl
ow S
tate
men
t and
tren
d
2018
/19
2019
/20
2020
/21
2021
/22
2022
/23
2023
/24
2024
/25
2025
/26
2026
/27
2027
/28
$ '0
00B
UD
GET
Estim
ate
Estim
ate
Estim
ate
Estim
ate
Estim
ate
Estim
ate
Estim
ate
Estim
ate
Estim
ate
Cas
h Fl
ows
from
Ope
ratin
g A
ctiv
ities
Rec
eipt
sR
ates
and
Ann
ual C
harg
es93
,126
96,2
8998
,620
99,3
6610
2,06
710
4,33
010
6,72
610
9,28
511
2,01
411
4,81
4U
ser F
ees
and
Cha
rges
14,6
0514
,905
15,2
0815
,512
15,8
3616
,183
16,5
5316
,949
17,3
7117
,805
Gra
nts
and
Con
tribu
tions
- O
pera
ting
8,10
68,
316
8,48
38,
653
8,83
49,
029
9,23
69,
458
9,69
49,
936
Bond
s, D
epos
its a
nd R
eten
tion
amou
nts
Rec
eive
d (N
et)
00
00
00
00
00
Oth
er8,
950
9,22
79,
415
9,60
39,
804
10,0
1810
,248
10,4
9310
,754
11,0
23
Paym
ents
Empl
oyee
Ben
efits
and
On-
Cos
ts(5
9,47
0)(6
1,62
9)(6
3,32
1)(6
4,85
2)(6
6,44
9)(6
8,08
6)(6
9,76
6)(7
1,48
8)(7
3,25
3)(7
5,06
4)M
ater
ials
and
Con
tract
s(4
1,60
9)(4
3,39
0)(4
4,11
7)(4
5,02
2)(4
5,86
7)(4
6,89
1)(4
7,86
5)(4
9,02
6)(5
0,14
3)(5
1,41
3)Es
tabl
ishm
ent C
osts
(14,
706)
(14,
123)
(14,
265)
(14,
515)
(14,
781)
(15,
066)
(15,
371)
(15,
696)
(16,
042)
(16,
399)
Adm
inis
tratio
n C
osts
(6,7
17)
(6,0
22)
(6,2
49)
(6,4
21)
(6,3
08)
(6,4
15)
(6,8
31)
(7,0
20)
(6,9
17)
(7,3
54)
Borr
owin
g C
osts
(96)
(71)
(46)
(22)
00
00
00
Oth
er
Net
Cas
h fr
om O
pera
ting
Act
iviti
es2,
188
3,50
33,
728
2,30
33,
136
3,10
12,
932
2,95
43,
476
3,34
9
Cas
h Fl
ows
from
Inve
stin
g A
ctiv
ities
Rec
eipt
sIn
vest
men
t and
Inte
rest
Rev
enue
Rec
eive
d5,
626
4,22
13,
850
3,47
13,
092
2,73
62,
385
2,03
71,
703
1,37
9G
rant
s an
d C
ontri
butio
ns -
Cap
ital
14,5
0214
,930
15,2
3115
,536
15,8
6116
,210
16,5
8116
,979
17,4
0217
,837
Sale
of I
nves
tmen
t Sec
uriti
esPr
ocee
ds fr
om S
ale
of A
sset
s1,
052
00
00
00
00
0
Paym
ents
Purc
hase
of I
nves
tmen
t Sec
uriti
esC
apita
l Wor
ks a
nd P
urch
ase
of F
ixed
Ass
ets
(28,
142)
(31,
647)
(31,
586)
(31,
586)
(31,
586)
(31,
586)
(31,
810)
(31,
837)
(32,
062)
(32,
088)
Net
Cas
h fr
om In
vest
ing
Act
iviti
es(6
,962
)(1
2,49
6)(1
2,50
5)(1
2,58
0)(1
2,63
3)(1
2,64
0)(1
2,84
4)(1
2,82
1)(1
2,95
8)(1
2,87
1)
Cas
h Fl
ows
from
Fin
anci
ng A
ctiv
ities
Rec
eipt
sN
ew B
orro
win
gs
Paym
ents
Rep
aym
ent o
f Bor
row
ings
(500
)(5
00)
(500
)(5
00)
(125
)
Net
Cas
h fr
om F
inan
cing
Act
iviti
es(5
00)
(500
)(5
00)
(500
)(1
25)
00
00
0
Net
Incr
ease
/ (D
ecre
ase)
in C
ash
and
Cas
h Eq
uiva
lent
s(5
,274
)(9
,492
)(9
,277
)(1
0,77
7)(9
,621
)(9
,539
)(9
,912
)(9
,867
)(9
,481
)(9
,523
)
Cas
h an
d C
ash
Equi
vale
nts
- Beg
inni
ng o
f the
Yea
r18
2,52
817
7,25
416
7,76
215
8,48
514
7,70
813
8,08
612
8,54
711
8,63
510
8,76
899
,287
Cas
h an
d C
ash
Equi
vale
nts
- End
of t
he Y
ear
177,
254
167,
762
158,
485
147,
708
138,
086
128,
547
118,
635
108,
768
99,2
8789
,764
Stat
emen
t of C
ash
Flow
s
Bud
get 2
018-
19 p
lus
forw
ard
year
est
imat
es
trend
and
the
amou
nts
gene
rate
d flu
ctua
te. T
his
refle
cts
the
unse
ttled
nat
ure
of C
ounc
il’s c
ombi
ned
oper
atio
ns
Scen
ario
2 -
DW
MC
Har
mon
ised
(Low
er)
-$2,
166,
708
(2,2
12,2
09)
(2,2
60,8
77)
(2,3
12,8
77)
(2,3
68,3
87)
(2,4
27,5
96)
(2,4
88,2
86)
2018
/19
2019
/20
2020
/21
2021
/22
2022
/23
2023
/24
2024
/25
2025
/26
2026
/27
2027
/28
$ '0
00B
UD
GET
Estim
ate
Estim
ate
Estim
ate
Estim
ate
Estim
ate
Estim
ate
Estim
ate
Estim
ate
Estim
ate
INC
OM
ER
ates
and
Ann
ual C
harg
es91
,238
93,4
2495
,851
96,1
8598
,819
100,
993
103,
315
105,
795
108,
440
111,
151
Use
r Cha
rges
and
Fee
s14
,606
14,9
4215
,241
15,5
4515
,872
16,2
2116
,594
16,9
9217
,417
17,8
53In
tere
st a
nd in
vest
men
t rev
enue
5,62
64,
166
3,74
93,
322
2,89
32,
487
2,08
31,
682
1,29
391
3G
rant
s an
d C
ontri
butio
ns -
Ope
ratin
g8,
132
8,31
98,
485
8,65
58,
837
9,03
19,
239
9,46
19,
697
9,94
0G
rant
s an
d C
ontri
butio
ns -
Cap
ital
14,6
1314
,949
15,2
4815
,553
15,8
7916
,229
16,6
0217
,000
17,4
2517
,861
Oth
er re
venu
es9,
042
9,25
09,
435
9,62
49,
826
10,0
4210
,273
10,5
2010
,783
11,0
52
Tota
l Ope
ratin
g In
com
e14
3,25
614
5,05
014
8,01
014
8,88
415
2,12
615
5,00
315
8,10
716
1,45
016
5,05
516
8,76
9
EXPE
ND
ITU
RE
Empl
oyee
Cos
ts(5
9,73
1)(6
2,25
1)(6
3,67
1)(6
5,23
8)(6
6,84
5)(6
8,49
3)(7
0,18
2)(7
1,91
5)(7
3,69
2)(7
5,51
3)M
ater
ials
and
Con
tract
s(4
2,97
6)(4
3,70
5)(4
4,46
6)(4
5,39
3)(4
6,23
1)(4
7,28
2)(4
8,25
0)(4
9,43
8)(5
0,55
1)(5
1,84
4)Es
tabl
ishm
ent c
osts
(14,
619)
(14,
011)
(14,
255)
(14,
504)
(14,
771)
(15,
056)
(15,
361)
(15,
687)
(16,
034)
(16,
389)
Adm
inis
tratio
n co
sts
(6,7
27)
(5,9
07)
(6,2
75)
(6,4
20)
(6,2
74)
(6,4
12)
(6,8
60)
(7,0
17)
(6,8
85)
(7,3
82)
Oth
er E
xpen
ses
00
00
00
00
00
Tota
l Ope
ratin
g Ex
pend
iture
(124
,052
)(1
25,8
74)
(128
,667
)(1
31,5
56)
(134
,121
)(1
37,2
43)
(140
,653
)(1
44,0
57)
(147
,162
)(1
51,1
28)
Surp
lus/
(Def
icit)
prio
r to
Dep
reci
atio
n &
Fin
anci
ng C
osts
19,2
0419
,176
19,3
4317
,328
18,0
0517
,759
17,4
5417
,393
17,8
9317
,641
Dep
reci
atio
n(1
9,48
1)(2
0,67
2)(2
0,71
2)(2
0,83
1)(2
1,80
2)(2
3,09
8)(2
3,48
4)(2
4,54
6)(2
5,54
6)(2
6,79
6)Fi
nanc
ing
cost
s (In
tere
st E
xpen
ses)
(96)
(71)
(46)
(22)
0
Net
Ope
ratin
g R
esul
t for
per
iod
- Sur
plus
/(Def
icit)
(373
)(1
,567
)(1
,415
)(3
,524
)(3
,797
)(5
,339
)(6
,030
)(7
,153
)(7
,652
)(9
,154
)
Prio
r yea
r adj
ustm
ents
Net
gai
ns/(l
osse
s) fr
om D
ispo
sal o
f Ass
ets
1,05
2O
ther
adj
ustm
ents
/ R
eval
uatio
n
Net
Sur
plus
/(Def
icit)
680
(1,5
67)
(1,4
15)
(3,5
24)
(3,7
97)
(5,3
39)
(6,0
30)
(7,1
53)
(7,6
52)
(9,1
54)
Net
of C
apita
l Gra
nts
(13,
933)
(16,
515)
(16,
663)
(19,
077)
(19,
677)
(21,
568)
(22,
632)
(24,
153)
(25,
078)
(27,
015)
Stat
emen
t of F
inan
cial
Per
form
ance
(Inc
ome
& E
xpen
ditu
re)
Geo
rges
Riv
er C
ounc
ilB
udge
t 201
8-19
plu
s fo
rwar
d ye
ar e
stim
ates
(16,
236,
940)
Scen
ario
2 –
DW
MC
Har
mon
ised
(Low
er)
Inco
me
and
Expe
nditu
re S
tate
men
t and
tren
d
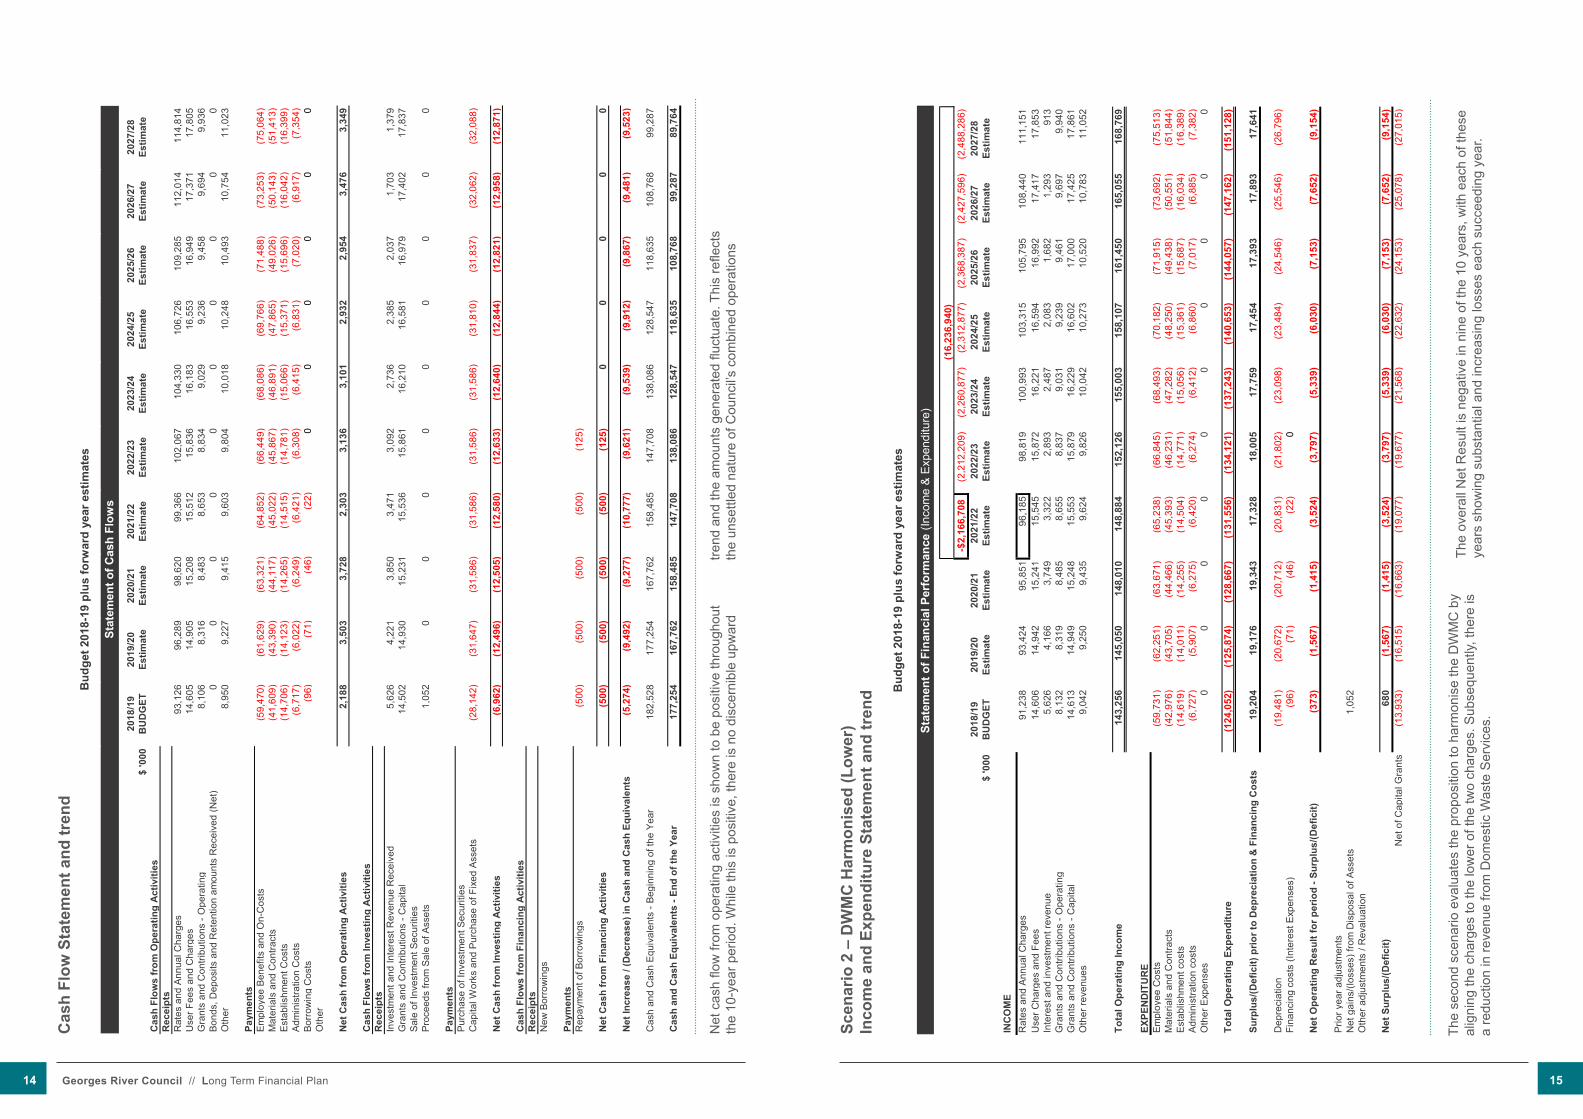
The
seco
nd s
cena
rio e
valu
ates
the
prop
ositi
on to
har
mon
ise
the
DW
MC
by
alig
ning
the
char
ges
to th
e lo
wer
of t
he tw
o ch
arge
s. S
ubse
quen
tly, t
here
is
a re
duct
ion
in re
venu
e fro
m D
omes
tic W
aste
Ser
vice
s.
The
over
all N
et R
esul
t is
nega
tive
in n
ine
of th
e 10
yea
rs, w
ith e
ach
of th
ese
year
s sh
owin
g su
bsta
ntia
l and
incr
easi
ng lo
sses
eac
h su
ccee
ding
yea
r.
14 Georges River Council // Long Term Financial Plan 15
2018
/19
2019
/20
2020
/21
2021
/22
2022
/23
2023
/24
2024
/25
2025
/26
2026
/27
2027
/28
$ '0
00B
UD
GET
Estim
ate
Estim
ate
Estim
ate
Estim
ate
Estim
ate
Estim
ate
Estim
ate
Estim
ate
Estim
ate
ASS
ETS
Cur
rent
Ass
ets
Cas
h, C
ash
Equi
vale
nts
& In
vest
men
ts17
5,11
916
2,30
914
9,70
513
5,19
612
1,64
810
8,04
893
,935
79,7
2165
,737
51,5
54R
ecei
vabl
es6,
253
6,40
06,
545
6,62
86,
785
6,93
57,
094
7,26
47,
446
7,63
2In
vent
orie
s17
215
616
016
316
617
017
317
818
218
6
Oth
er58
558
558
558
558
558
558
558
558
558
5
Tota
l Cur
rent
Ass
ets
182,
129
169,
450
156,
994
142,
571
129,
185
115,
737
101,
788
87,7
4873
,950
59,9
57
Non
-Cur
rent
Ass
ets
Prop
erty
, Pla
nt &
Equ
ipm
ent
1,20
0,43
81,
210,
869
1,22
1,56
01,
232,
432
1,24
2,63
21,
251,
836
1,26
0,04
01,
267,
245
1,27
3,44
91,
278,
653
Inve
stm
ent P
rope
rty16
,345
16,3
4516
,345
16,3
4516
,345
16,3
4516
,345
16,3
4516
,345
16,3
45In
tang
ible
Ass
ets
2,70
13,
098
3,19
62,
993
2,49
01,
688
1,75
01,
750
2,00
02,
000
Tota
l Non
-Cur
rent
Ass
ets
1,21
9,48
41,
230,
312
1,24
1,10
11,
251,
770
1,26
1,46
81,
269,
869
1,27
8,13
51,
285,
340
1,29
1,79
41,
296,
998
Tota
l Ass
ets
1,40
1,61
31,
399,
762
1,39
8,09
51,
394,
341
1,39
0,65
21,
385,
606
1,37
9,92
41,
373,
088
1,36
5,74
41,
356,
955
Ret
urn
on T
otal
Ass
ets
0.05
%-0
.11%
-0.1
0%-0
.25%
-0.2
7%-0
.39%
-0.4
4%-0
.52%
-0.5
6%-0
.67%
LIA
BIL
ITIE
SC
urre
nt L
iabi
litie
sPa
yabl
es(1
1,61
1)(1
1,20
6)(1
1,10
4)(1
0,98
8)(1
0,82
5)(1
0,71
2)(1
0,64
2)(1
0,53
2)(1
0,40
3)(1
0,31
9)In
com
e re
ceiv
ed in
adv
ance
Borr
owin
gs(5
00)
(500
)(5
00)
(125
)0
00
00
0Ac
crua
ls &
Pro
visi
ons
(14,
728)
(15,
350)
(15,
700)
(16,
086)
(16,
482)
(16,
889)
(17,
305)
(17,
732)
(18,
171)
(18,
620)
Tota
l Cur
rent
Lia
bilit
ies
(26,
839)
(27,
056)
(27,
303)
(27,
199)
(27,
307)
(27,
600)
(27,
947)
(28,
264)
(28,
573)
(28,
939)
Cur
rent
Rat
io6.
86.
35.
85.
24.
74.
23.
63.
12.
62.
1
Non
-Cur
rent
Lia
bilit
ies
Borr
owin
gs(1
,125
)(6
25)
(125
)0
00
00
00
Prov
isio
ns
Tota
l Non
-Cur
rent
Lia
bilit
ies
(1,1
25)
(625
)(1
25)
00
00
00
0
Tota
l Lia
bilit
ies
(27,
964)
(27,
681)
(27,
428)
(27,
199)
(27,
307)
(27,
600)
(27,
947)
(28,
264)
(28,
573)
(28,
939)
Net
Ass
ets
1,37
3,64
81,
372,
081
1,37
0,66
61,
367,
142
1,36
3,34
51,
358,
006
1,35
1,97
61,
344,
823
1,33
7,17
11,
328,
016
Incr
ease
in N
et A
sset
s0.
05%
-0.1
1%-0
.10%
-0.2
6%-0
.28%
-0.3
9%-0
.44%
-0.5
3%-0
.57%
-0.6
8%
EQU
ITY
Ret
aine
d Ea
rnin
gs(1
,361
,073
)(1
,359
,506
)(1
,358
,091
)(1
,354
,567
)(1
,350
,770
)(1
,345
,431
)(1
,339
,401
)(1
,332
,248
)(1
,324
,596
)(1
,315
,441
)Ac
coun
ting
Polic
y Ad
just
men
t / R
eval
uatio
n R
eser
ve(1
2,57
5)(1
2,57
5)(1
2,57
5)(1
2,57
5)(1
2,57
5)(1
2,57
5)(1
2,57
5)(1
2,57
5)(1
2,57
5)(1
2,57
5)
Tota
l Equ
ity(1
,373
,648
)(1
,372
,081
)(1
,370
,666
)(1
,367
,142
)(1
,363
,345
)(1
,358
,006
)(1
,351
,976
)(1
,344
,823
)(1
,337
,171
)(1
,328
,016
)
Stat
emen
t of F
inan
cial
Pos
ition
(Bal
ance
She
et)
Geo
rges
Riv
er C
ounc
ilB
udge
t 201
8-19
plu
s fo
rwar
d ye
ar e
stim
ates
Bal
ance
She
et a
nd tr
end
This
Bal
ance
She
et is
stil
l stro
ng, b
ut b
ecom
ing
less
so.
The
cur
rent
ratio
re
mai
ns a
bove
the
benc
hmar
k of
2.0
des
pite
the
acce
lera
ted
depl
etio
n of
cas
h co
nseq
uent
to th
e lo
wer
leve
l of r
even
ue g
ener
ated
. The
cas
h
bala
nce
is lo
wer
in th
e te
nth
year
, by
two-
third
s of
the
amou
nt in
yea
r one
, co
ntrib
utin
g to
an
inte
rest
inco
me
that
redu
ces
in th
e te
nth
year
to 1
0% o
f th
e am
ount
rece
ived
at t
he b
egin
ning
of t
he p
erio
d.
This
sce
nario
, as
expe
cted
, gen
erat
es le
ss c
ash
than
Sce
nario
1 a
nd
“Net
Cas
h fro
m O
pera
ting
Act
iviti
es” a
lso
drift
s in
to n
egat
ive
terr
itory
from
Cas
h Fl
ow S
tate
men
t and
tren
d
2018
/19
2019
/20
2020
/21
2021
/22
2022
/23
2023
/24
2024
/25
2025
/26
2026
/27
2027
/28
$ '0
00B
UD
GET
Estim
ate
Estim
ate
Estim
ate
Estim
ate
Estim
ate
Estim
ate
Estim
ate
Estim
ate
Estim
ate
Cas
h Fl
ows
from
Ope
ratin
g A
ctiv
ities
Rec
eipt
sR
ates
and
Ann
ual C
harg
es90
,990
93,3
5895
,778
96,1
7598
,739
100,
927
103,
245
105,
720
108,
360
111,
069
Use
r Fee
s an
d C
harg
es14
,605
14,9
0515
,208
15,5
1215
,836
16,1
8316
,553
16,9
4917
,371
17,8
05G
rant
s an
d C
ontri
butio
ns -
Ope
ratin
g8,
106
8,31
68,
483
8,65
38,
834
9,02
99,
236
9,45
89,
694
9,93
6Bo
nds,
Dep
osits
and
Ret
entio
n am
ount
s R
ecei
ved
(Net
)0
00
00
00
00
0O
ther
8,95
09,
227
9,41
59,
603
9,80
410
,018
10,2
4810
,493
10,7
5411
,023
Paym
ents
Empl
oyee
Ben
efits
and
On-
Cos
ts(5
9,47
0)(6
1,62
9)(6
3,32
1)(6
4,85
2)(6
6,44
9)(6
8,08
6)(6
9,76
6)(7
1,48
8)(7
3,25
3)(7
5,06
4)M
ater
ials
and
Con
tract
s(4
1,60
9)(4
3,72
2)(4
4,50
1)(4
5,41
4)(4
6,26
7)(4
7,30
0)(4
8,28
3)(4
9,45
4)(5
0,58
1)(5
1,86
3)Es
tabl
ishm
ent C
osts
(14,
706)
(14,
123)
(14,
265)
(14,
515)
(14,
781)
(15,
066)
(15,
371)
(15,
696)
(16,
042)
(16,
399)
Adm
inis
tratio
n C
osts
(6,7
17)
(6,0
22)
(6,2
49)
(6,4
21)
(6,3
08)
(6,4
15)
(6,8
31)
(7,0
20)
(6,9
17)
(7,3
54)
Borr
owin
g C
osts
(96)
(71)
(46)
(22)
00
00
00
Oth
er
Net
Cas
h fr
om O
pera
ting
Act
iviti
es53
241
502
(1,2
81)
(591
)(7
10)
(967
)(1
,038
)(6
16)
(846
)
Cas
h Fl
ows
from
Inve
stin
g A
ctiv
ities
Rec
eipt
sIn
vest
men
t and
Inte
rest
Rev
enue
Rec
eive
d5,
626
4,16
63,
749
3,32
22,
893
2,48
72,
083
1,68
21,
293
913
Gra
nts
and
Con
tribu
tions
- C
apita
l14
,502
14,9
3015
,231
15,5
3615
,861
16,2
1016
,581
16,9
7917
,402
17,8
37Sa
le o
f Inv
estm
ent S
ecur
ities
Proc
eeds
from
Sal
e of
Ass
ets
1,05
20
00
00
00
00
Paym
ents
Purc
hase
of I
nves
tmen
t Sec
uriti
esC
apita
l Wor
ks a
nd P
urch
ase
of F
ixed
Ass
ets
(28,
142)
(31,
647)
(31,
586)
(31,
586)
(31,
586)
(31,
586)
(31,
810)
(31,
837)
(32,
062)
(32,
088)
Net
Cas
h fr
om In
vest
ing
Act
iviti
es(6
,962
)(1
2,55
0)(1
2,60
6)(1
2,72
8)(1
2,83
1)(1
2,89
0)(1
3,14
5)(1
3,17
6)(1
3,36
8)(1
3,33
8)
Cas
h Fl
ows
from
Fin
anci
ng A
ctiv
ities
Rec
eipt
sN
ew B
orro
win
gs
Paym
ents
Rep
aym
ent o
f Bor
row
ings
(500
)(5
00)
(500
)(5
00)
(125
)
Net
Cas
h fr
om F
inan
cing
Act
iviti
es(5
00)
(500
)(5
00)
(500
)(1
25)
00
00
0
Net
Incr
ease
/ (D
ecre
ase)
in C
ash
and
Cas
h Eq
uiva
lent
s(7
,409
)(1
2,81
0)(1
2,60
4)(1
4,50
9)(1
3,54
8)(1
3,60
0)(1
4,11
3)(1
4,21
5)(1
3,98
4)(1
4,18
3)
Cas
h an
d C
ash
Equi
vale
nts
- Beg
inni
ng o
f the
Yea
r18
2,52
817
5,11
916
2,30
914
9,70
513
5,19
612
1,64
810
8,04
893
,935
79,7
2165
,737
Cas
h an
d C
ash
Equi
vale
nts
- End
of t
he Y
ear
175,
119
162,
309
149,
705
135,
196
121,
648
108,
048
93,9
3579
,721
65,7
3751
,554
Stat
emen
t of C
ash
Flow
s
Geo
rges
Riv
er C
ounc
ilB
udge
t 201
8-19
plu
s fo
rwar
d ye
ar e
stim
ates
the
four
th y
ear.
This
is n
ot a
sce
nario
that
eco
nom
ical
ly
viab
le fo
r Cou
ncil.
16 Georges River Council // Long Term Financial Plan 17
Scen
ario
3 -
DW
MC
Har
mon
ised
(Mid
-Poi
nt)
Inco
me
and
Expe
nditu
re S
tate
men
t and
tren
dSc
enar
io 3
- D
WM
C H
arm
onis
ed (M
id-P
oint
)
-$2,
166,
708
(2,2
12,2
09)
(2,2
60,8
77)
(2,3
12,8
77)
(2,3
68,3
87)
(2,4
27,5
96)
(2,4
88,2
86)
2018
/19
2019
/20
2020
/21
2021
/22
2022
/23
2023
/24
2024
/25
2025
/26
2026
/27
2027
/28
$ '0
00B
UD
GET
Estim
ate
Estim
ate
Estim
ate
Estim
ate
Estim
ate
Estim
ate
Estim
ate
Estim
ate
Estim
ate
INC
OM
ER
ates
and
Ann
ual C
harg
es92
,817
94,5
6397
,068
97,4
2610
0,08
510
2,28
710
4,63
910
7,15
010
9,82
911
2,57
5U
ser C
harg
es a
nd F
ees
14,6
0614
,942
15,2
4115
,545
15,8
7216
,221
16,5
9416
,992
17,4
1717
,853
Inte
rest
and
inve
stm
ent r
even
ue5,
626
4,21
83,
831
3,43
53,
038
2,66
32,
292
1,92
51,
569
1,22
5G
rant
s an
d C
ontri
butio
ns -
Ope
ratin
g8,
132
8,31
98,
485
8,65
58,
837
9,03
19,
239
9,46
19,
697
9,94
0G
rant
s an
d C
ontri
butio
ns -
Cap
ital
14,6
1314
,949
15,2
4815
,553
15,8
7916
,229
16,6
0217
,000
17,4
2517
,861
Oth
er re
venu
es9,
042
9,25
09,
435
9,62
49,
826
10,0
4210
,273
10,5
2010
,783
11,0
52
Tota
l Ope
ratin
g In
com
e14
4,83
514
6,24
114
9,30
915
0,23
815
3,53
615
6,47
315
9,64
016
3,04
816
6,72
117
0,50
5
EXPE
ND
ITU
RE
Empl
oyee
Cos
ts(5
9,73
1)(6
2,25
1)(6
3,67
1)(6
5,23
8)(6
6,84
5)(6
8,49
3)(7
0,18
2)(7
1,91
5)(7
3,69
2)(7
5,51
3)M
ater
ials
and
Con
tract
s(4
2,97
6)(4
3,70
5)(4
4,46
6)(4
5,39
3)(4
6,23
1)(4
7,28
2)(4
8,25
0)(4
9,43
8)(5
0,55
1)(5
1,84
4)Es
tabl
ishm
ent c
osts
(14,
619)
(14,
011)
(14,
255)
(14,
504)
(14,
771)
(15,
056)
(15,
361)
(15,
687)
(16,
034)
(16,
389)
Adm
inis
tratio
n co
sts
(6,7
27)
(5,9
07)
(6,2
75)
(6,4
20)
(6,2
74)
(6,4
12)
(6,8
60)
(7,0
17)
(6,8
85)
(7,3
82)
Oth
er E
xpen
ses
00
00
00
00
00
Tota
l Ope
ratin
g Ex
pend
iture
(124
,052
)(1
25,8
74)
(128
,667
)(1
31,5
56)
(134
,121
)(1
37,2
43)
(140
,653
)(1
44,0
57)
(147
,162
)(1
51,1
28)
Surp
lus/
(Def
icit)
prio
r to
Dep
reci
atio
n &
Fin
anci
ng C
osts
20,7
8320
,368
20,6
4218
,682
19,4
1519
,229
18,9
8618
,991
19,5
5919
,377
Dep
reci
atio
n(1
9,48
1)(2
0,67
2)(2
0,71
2)(2
0,83
1)(2
1,80
2)(2
3,09
8)(2
3,48
4)(2
4,54
6)(2
5,54
6)(2
6,79
6)Fi
nanc
ing
cost
s (In
tere
st E
xpen
ses)
(96)
(71)
(46)
(22)
0
Net
Ope
ratin
g R
esul
t for
per
iod
- Sur
plus
/(Def
icit)
1,20
6(3
75)
(116
)(2
,170
)(2
,387
)(3
,869
)(4
,497
)(5
,555
)(5
,987
)(7
,419
)
Prio
r yea
r adj
ustm
ents
Net
gai
ns/(l
osse
s) fr
om D
ispo
sal o
f Ass
ets
1,05
2O
ther
adj
ustm
ents
/ R
eval
uatio
n
Net
Sur
plus
/(Def
icit)
2,25
9(3
75)
(116
)(2
,170
)(2
,387
)(3
,869
)(4
,497
)(5
,555
)(5
,987
)(7
,419
)N
et o
f Cap
ital G
rant
s(1
2,35
4)(1
5,32
4)(1
5,36
4)(1
7,72
3)(1
8,26
6)(2
0,09
8)(2
1,09
9)(2
2,55
5)(2
3,41
2)(2
5,28
0)
(16,
236,
940)
Stat
emen
t of F
inan
cial
Per
form
ance
(Inc
ome
& E
xpen
ditu
re)
Geo
rges
Riv
er C
ounc
ilB
udge
t 201
8-19
plu
s fo
rwar
d ye
ar e
stim
ates
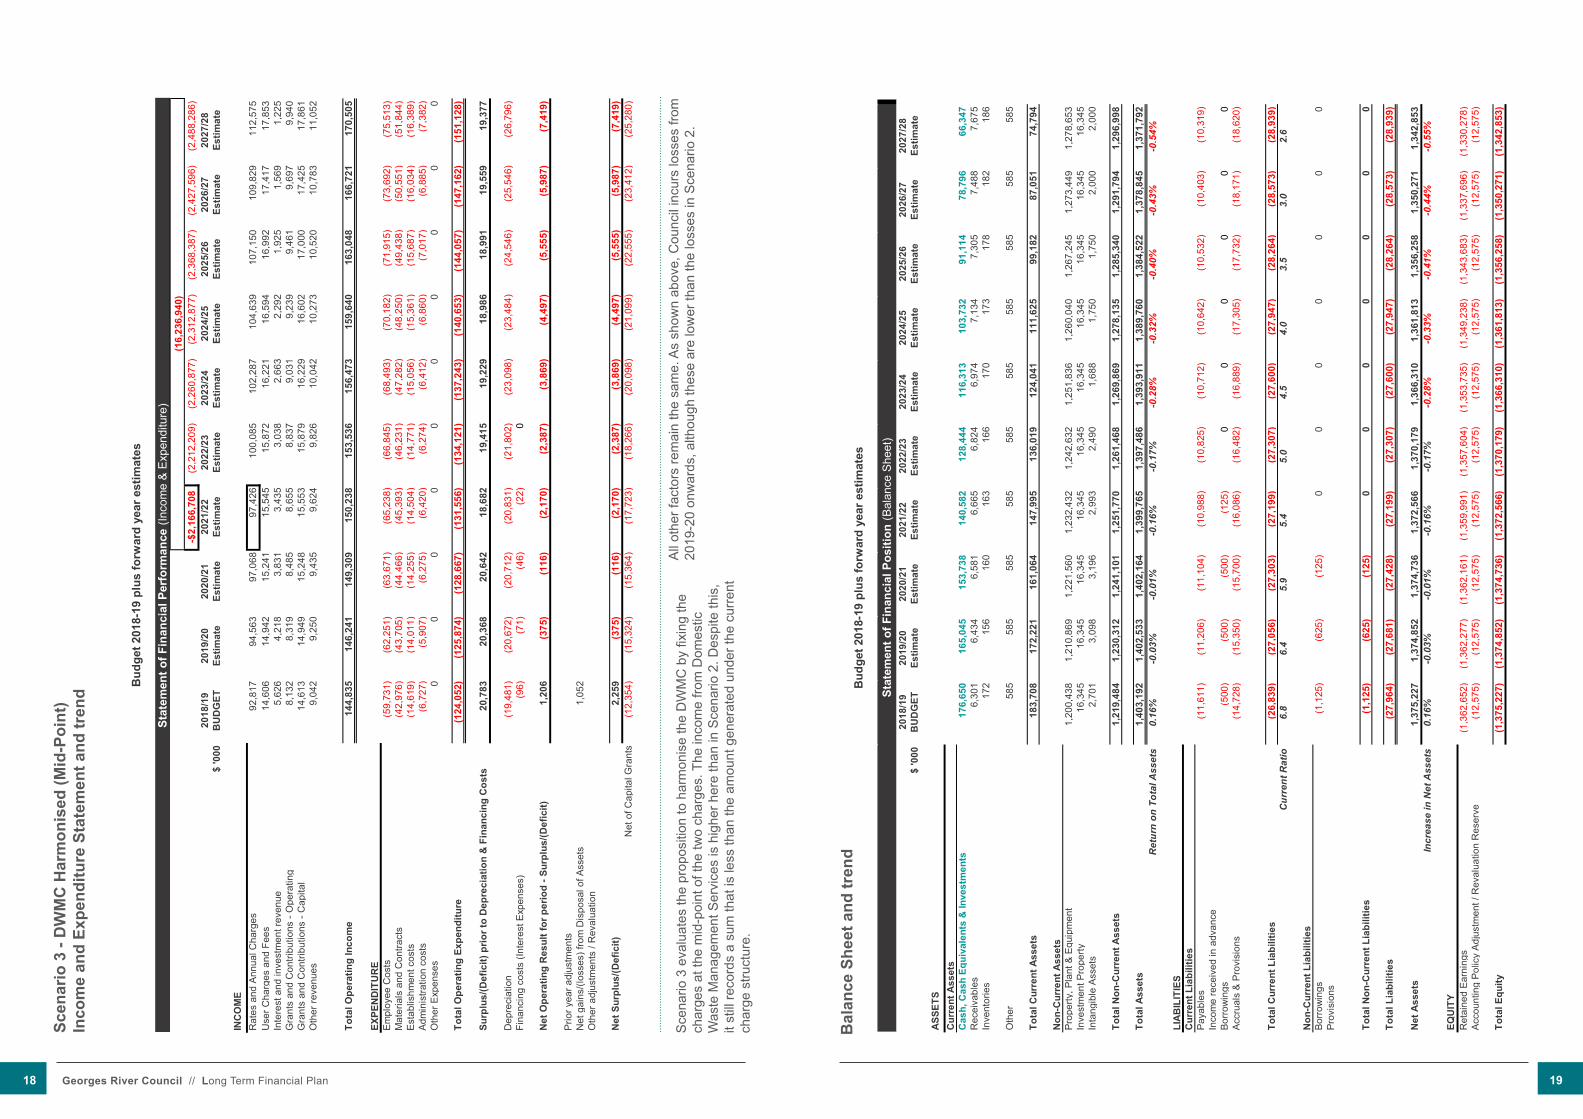
Sce
nario
3 e
valu
ates
the
prop
ositi
on to
har
mon
ise
the
DW
MC
by
fixin
g th
e ch
arge
s at
the
mid
-poi
nt o
f the
two
char
ges.
The
inco
me
from
Dom
estic
W
aste
Man
agem
ent S
ervi
ces
is h
ighe
r her
e th
an in
Sce
nario
2. D
espi
te th
is,
it st
ill re
cord
s a
sum
that
is le
ss th
an th
e am
ount
gen
erat
ed u
nder
the
curr
ent
char
ge s
truct
ure.
All
othe
r fac
tors
rem
ain
the
sam
e. A
s sh
own
abov
e, C
ounc
il in
curs
loss
es fr
om
2019
-20
onw
ards
, alth
ough
thes
e ar
e lo
wer
than
the
loss
es in
Sce
nario
2.
Bal
ance
She
et a
nd tr
end
2018
/19
2019
/20
2020
/21
2021
/22
2022
/23
2023
/24
2024
/25
2025
/26
2026
/27
2027
/28
$ '0
00B
UD
GET
Estim
ate
Estim
ate
Estim
ate
Estim
ate
Estim
ate
Estim
ate
Estim
ate
Estim
ate
Estim
ate
ASS
ETS
Cur
rent
Ass
ets
Cas
h, C
ash
Equi
vale
nts
& In
vest
men
ts17
6,65
016
5,04
515
3,73
814
0,58
212
8,44
411
6,31
310
3,73
291
,114
78,7
9666
,347
Rec
eiva
bles
6,30
16,
434
6,58
16,
665
6,82
46,
974
7,13
47,
305
7,48
87,
675
Inve
ntor
ies
172
156
160
163
166
170
173
178
182
186
Oth
er58
558
558
558
558
558
558
558
558
558
5
Tota
l Cur
rent
Ass
ets
183,
708
172,
221
161,
064
147,
995
136,
019
124,
041
111,
625
99,1
8287
,051
74,7
94
Non
-Cur
rent
Ass
ets
Prop
erty
, Pla
nt &
Equ
ipm
ent
1,20
0,43
81,
210,
869
1,22
1,56
01,
232,
432
1,24
2,63
21,
251,
836
1,26
0,04
01,
267,
245
1,27
3,44
91,
278,
653
Inve
stm
ent P
rope
rty16
,345
16,3
4516
,345
16,3
4516
,345
16,3
4516
,345
16,3
4516
,345
16,3
45In
tang
ible
Ass
ets
2,70
13,
098
3,19
62,
993
2,49
01,
688
1,75
01,
750
2,00
02,
000
Tota
l Non
-Cur
rent
Ass
ets
1,21
9,48
41,
230,
312
1,24
1,10
11,
251,
770
1,26
1,46
81,
269,
869
1,27
8,13
51,
285,
340
1,29
1,79
41,
296,
998
Tota
l Ass
ets
1,40
3,19
21,
402,
533
1,40
2,16
41,
399,
765
1,39
7,48
61,
393,
911
1,38
9,76
01,
384,
522
1,37
8,84
51,
371,
792
Ret
urn
on T
otal
Ass
ets
0.16
%-0
.03%
-0.0
1%-0
.16%
-0.1
7%-0
.28%
-0.3
2%-0
.40%
-0.4
3%-0
.54%
LIA
BIL
ITIE
SC
urre
nt L
iabi
litie
sPa
yabl
es(1
1,61
1)(1
1,20
6)(1
1,10
4)(1
0,98
8)(1
0,82
5)(1
0,71
2)(1
0,64
2)(1
0,53
2)(1
0,40
3)(1
0,31
9)In
com
e re
ceiv
ed in
adv
ance
Borr
owin
gs(5
00)
(500
)(5
00)
(125
)0
00
00
0Ac
crua
ls &
Pro
visi
ons
(14,
728)
(15,
350)
(15,
700)
(16,
086)
(16,
482)
(16,
889)
(17,
305)
(17,
732)
(18,
171)
(18,
620)
Tota
l Cur
rent
Lia
bilit
ies
(26,
839)
(27,
056)
(27,
303)
(27,
199)
(27,
307)
(27,
600)
(27,
947)
(28,
264)
(28,
573)
(28,
939)
Cur
rent
Rat
io6.
86.
45.
95.
45.
04.
54.
03.
53.
02.
6
Non
-Cur
rent
Lia
bilit
ies
Borr
owin
gs(1
,125
)(6
25)
(125
)0
00
00
00
Prov
isio
ns
Tota
l Non
-Cur
rent
Lia
bilit
ies
(1,1
25)
(625
)(1
25)
00
00
00
0
Tota
l Lia
bilit
ies
(27,
964)
(27,
681)
(27,
428)
(27,
199)
(27,
307)
(27,
600)
(27,
947)
(28,
264)
(28,
573)
(28,
939)
Net
Ass
ets
1,37
5,22
71,
374,
852
1,37
4,73
61,
372,
566
1,37
0,17
91,
366,
310
1,36
1,81
31,
356,
258
1,35
0,27
11,
342,
853
Incr
ease
in N
et A
sset
s0.
16%
-0.0
3%-0
.01%
-0.1
6%-0
.17%
-0.2
8%-0
.33%
-0.4
1%-0
.44%
-0.5
5%
EQU
ITY
Ret
aine
d Ea
rnin
gs(1
,362
,652
)(1
,362
,277
)(1
,362
,161
)(1
,359
,991
)(1
,357
,604
)(1
,353
,735
)(1
,349
,238
)(1
,343
,683
)(1
,337
,696
)(1
,330
,278
)Ac
coun
ting
Polic
y Ad
just
men
t / R
eval
uatio
n R
eser
ve(1
2,57
5)(1
2,57
5)(1
2,57
5)(1
2,57
5)(1
2,57
5)(1
2,57
5)(1
2,57
5)(1
2,57
5)(1
2,57
5)(1
2,57
5)
Tota
l Equ
ity(1
,375
,227
)(1
,374
,852
)(1
,374
,736
)(1
,372
,566
)(1
,370
,179
)(1
,366
,310
)(1
,361
,813
)(1
,356
,258
)(1
,350
,271
)(1
,342
,853
)
Stat
emen
t of F
inan
cial
Pos
ition
(Bal
ance
She
et)
Geo
rges
Riv
er C
ounc
ilB
udge
t 201
8-19
plu
s fo
rwar
d ye
ar e
stim
ates
18 Georges River Council // Long Term Financial Plan 19

This
Bal
ance
She
et in
dica
tes
the
flow
-on
effe
cts
of th
e un
profi
tabl
e op
erat
ions
. Whi
le a
som
ewha
t st
rong
er fi
nanc
ial p
ositi
on th
an S
cena
rio 2
, it i
s st
ill n
ot a
des
irabl
e op
tion.
This
is a
n ac
cept
able
cas
h po
sitio
n, b
ut it
is n
ot d
esira
ble
as a
n al
tern
ativ
e to
cur
rent
ope
ratio
ns.
Cas
h Fl
ow S
tate
men
t and
tren
d
2018
/19
2019
/20
2020
/21
2021
/22
2022
/23
2023
/24
2024
/25
2025
/26
2026
/27
2027
/28
$ '0
00B
UD
GET
Estim
ate
Estim
ate
Estim
ate
Estim
ate
Estim
ate
Estim
ate
Estim
ate
Estim
ate
Estim
ate
Cas
h Fl
ows
from
Ope
ratin
g A
ctiv
ities
Rec
eipt
sR
ates
and
Ann
ual C
harg
es92
,522
94,5
1196
,993
97,4
1510
0,00
510
2,22
010
4,56
810
7,07
510
9,74
811
2,49
2U
ser F
ees
and
Cha
rges
14,6
0514
,905
15,2
0815
,512
15,8
3616
,183
16,5
5316
,949
17,3
7117
,805
Gra
nts
and
Con
tribu
tions
- O
pera
ting
8,10
68,
316
8,48
38,
653
8,83
49,
029
9,23
69,
458
9,69
49,
936
Bond
s, D
epos
its a
nd R
eten
tion
amou
nts
Rec
eive
d (N
et)
00
00
00
00
00
Oth
er8,
950
9,22
79,
415
9,60
39,
804
10,0
1810
,248
10,4
9310
,754
11,0
23
Paym
ents
Empl
oyee
Ben
efits
and
On-
Cos
ts(5
9,47
0)(6
1,62
9)(6
3,32
1)(6
4,85
2)(6
6,44
9)(6
8,08
6)(6
9,76
6)(7
1,48
8)(7
3,25
3)(7
5,06
4)M
ater
ials
and
Con
tract
s(4
1,60
9)(4
3,72
2)(4
4,50
1)(4
5,41
4)(4
6,26
7)(4
7,30
0)(4
8,28
3)(4
9,45
4)(5
0,58
1)(5
1,86
3)Es
tabl
ishm
ent C
osts
(14,
706)
(14,
123)
(14,
265)
(14,
515)
(14,
781)
(15,
066)
(15,
371)
(15,
696)
(16,
042)
(16,
399)
Adm
inis
tratio
n C
osts
(6,7
17)
(6,0
22)
(6,2
49)
(6,4
21)
(6,3
08)
(6,4
15)
(6,8
31)
(7,0
20)
(6,9
17)
(7,3
54)
Borr
owin
g C
osts
(96)
(71)
(46)
(22)
00
00
00
Oth
er
Net
Cas
h fr
om O
pera
ting
Act
iviti
es1,
585
1,39
31,
716
(40)
674
583
356
316
772
577
Cas
h Fl
ows
from
Inve
stin
g A
ctiv
ities
Rec
eipt
sIn
vest
men
t and
Inte
rest
Rev
enue
Rec
eive
d5,
626
4,21
83,
831
3,43
53,
038
2,66
32,
292
1,92
51,
569
1,22
5G
rant
s an
d C
ontri
butio
ns -
Cap
ital
14,5
0214
,930
15,2
3115
,536
15,8
6116
,210
16,5
8116
,979
17,4
0217
,837
Sale
of I
nves
tmen
t Sec
uriti
esPr
ocee
ds fr
om S
ale
of A
sset
s1,
052
00
00
00
00
0
Paym
ents
Purc
hase
of I
nves
tmen
t Sec
uriti
esC
apita
l Wor
ks a
nd P
urch
ase
of F
ixed
Ass
ets
(28,
142)
(31,
647)
(31,
586)
(31,
586)
(31,
586)
(31,
586)
(31,
810)
(31,
837)
(32,
062)
(32,
088)
Net
Cas
h fr
om In
vest
ing
Act
iviti
es(6
,962
)(1
2,49
8)(1
2,52
3)(1
2,61
5)(1
2,68
7)(1
2,71
4)(1
2,93
7)(1
2,93
4)(1
3,09
1)(1
3,02
6)
Cas
h Fl
ows
from
Fin
anci
ng A
ctiv
ities
Rec
eipt
sN
ew B
orro
win
gs
Paym
ents
Rep
aym
ent o
f Bor
row
ings
(500
)(5
00)
(500
)(5
00)
(125
)
Net
Cas
h fr
om F
inan
cing
Act
iviti
es(5
00)
(500
)(5
00)
(500
)(1
25)
00
00
0
Net
Incr
ease
/ (D
ecre
ase)
in C
ash
and
Cas
h Eq
uiva
lent
s(5
,878
)(1
1,60
5)(1
1,30
7)(1
3,15
6)(1
2,13
8)(1
2,13
1)(1
2,58
1)(1
2,61
8)(1
2,31
9)(1
2,44
9)
Cas
h an
d C
ash
Equi
vale
nts
- Beg
inni
ng o
f the
Yea
r18
2,52
817
6,65
016
5,04
515
3,73
814
0,58
212
8,44
411
6,31
310
3,73
291
,114
78,7
96
Cas
h an
d C
ash
Equi
vale
nts
- End
of t
he Y
ear
176,
650
165,
045
153,
738
140,
582
128,
444
116,
313
103,
732
91,1
1478
,796
66,3
47
Stat
emen
t of C
ash
Flow
s
Geo
rges
Riv
er C
ounc
ilB
udge
t 201
8-19
plu
s fo
rwar
d ye
ar e
stim
ates
20 Georges River Council // Long Term Financial Plan 21
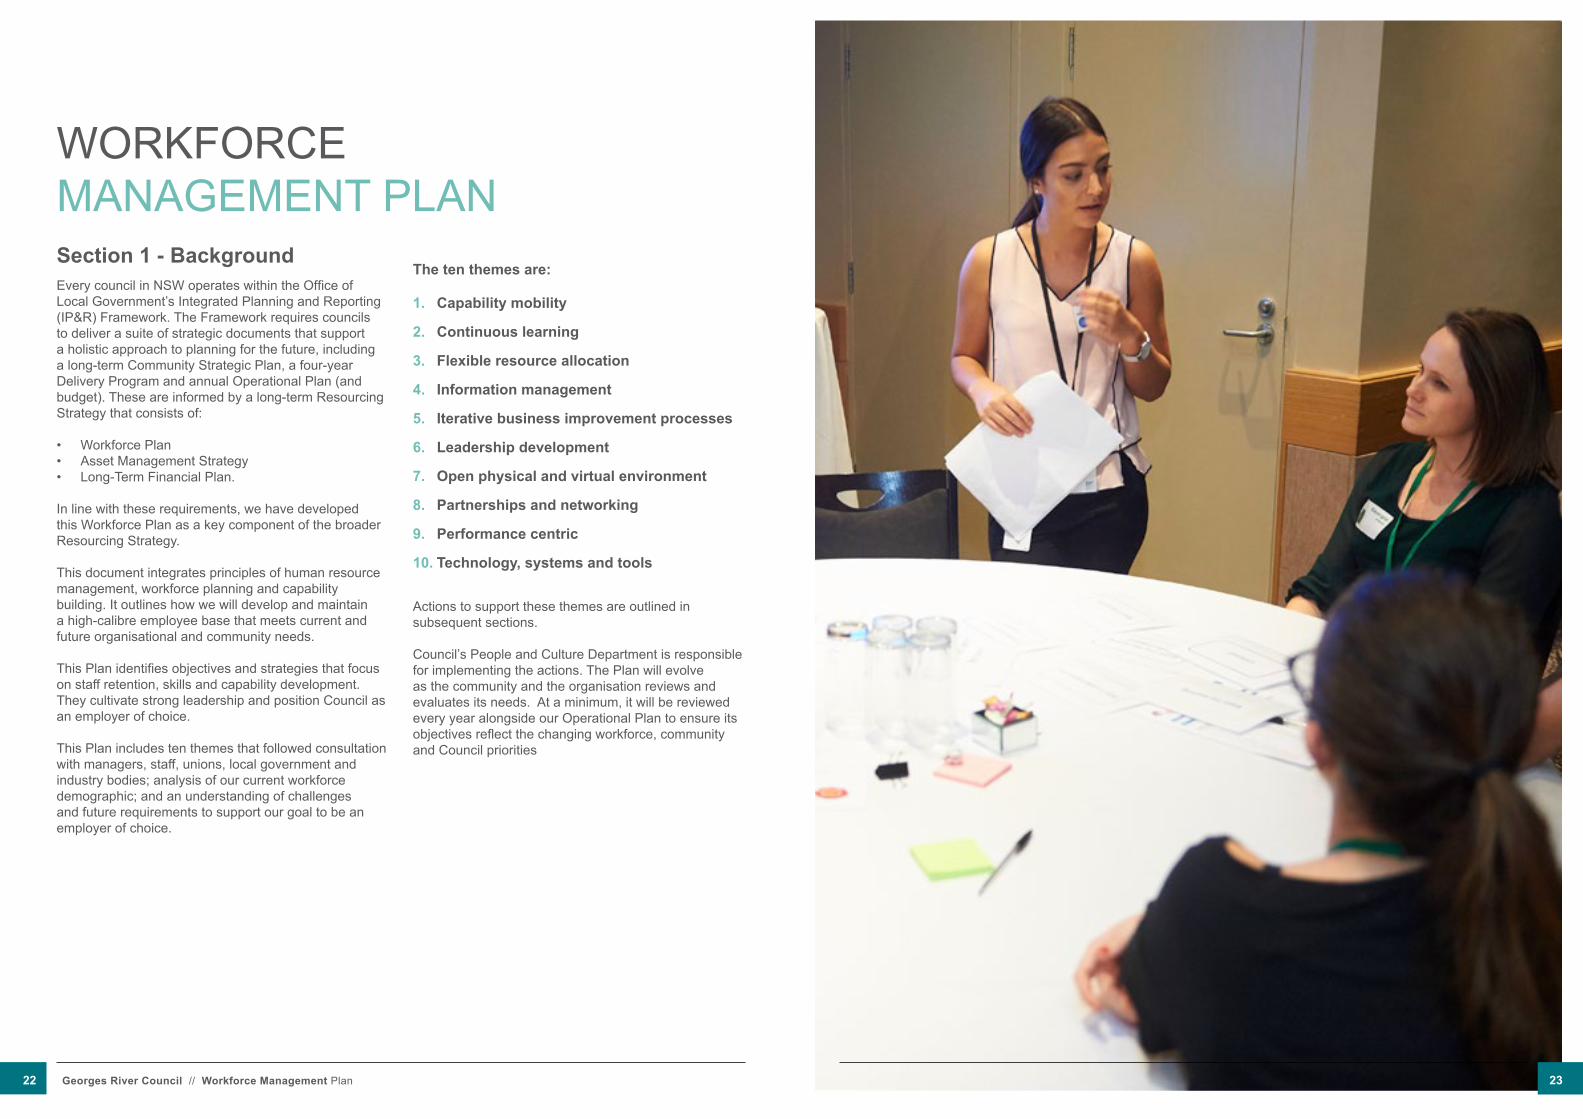
WORKFORCE MANAGEMENT PLANSection 1 - BackgroundEvery council in NSW operates within the Office of Local Government’s Integrated Planning and Reporting (IP&R) Framework. The Framework requires councils to deliver a suite of strategic documents that support a holistic approach to planning for the future, including a long-term Community Strategic Plan, a four-year Delivery Program and annual Operational Plan (and budget). These are informed by a long-term Resourcing Strategy that consists of:
• Workforce Plan• Asset Management Strategy• Long-Term Financial Plan.
In line with these requirements, we have developed this Workforce Plan as a key component of the broader Resourcing Strategy.
This document integrates principles of human resource management, workforce planning and capability building. It outlines how we will develop and maintain a high-calibre employee base that meets current and future organisational and community needs.
This Plan identifies objectives and strategies that focus on staff retention, skills and capability development. They cultivate strong leadership and position Council as an employer of choice.
This Plan includes ten themes that followed consultation with managers, staff, unions, local government and industry bodies; analysis of our current workforce demographic; and an understanding of challenges and future requirements to support our goal to be an employer of choice.
The ten themes are:
1. Capability mobility
2. Continuous learning
3. Flexible resource allocation
4. Information management
5. Iterative business improvement processes
6. Leadership development
7. Open physical and virtual environment
8. Partnerships and networking
9. Performance centric
10. Technology, systems and tools
Actions to support these themes are outlined in subsequent sections.
Council’s People and Culture Department is responsible for implementing the actions. The Plan will evolve as the community and the organisation reviews and evaluates its needs. At a minimum, it will be reviewed every year alongside our Operational Plan to ensure its objectives reflect the changing workforce, community and Council priorities
22 Georges River Council // Workforce Management Plan 23

Section 2- Where are we now?DemographicsLocal councils are diverse organisations representing various geographical sizes, populations and cultures. In many areas, local councils are significant employers, providing opportunities in a range of occupations.
In 2015, there were 192,500 local government employees across Australia (Australian Centre of Excellence for Local Government, 2015), with a full-time equivalent (FTE) of 45,000 of those employed by local councils in NSW (Local Government NSW, 2016).
Males make up 54% of the local government workforce nationally; however, there are differences in gender distribution according to occupation type:
90% of employees in engineering/infrastructure roles
and 76% of employees in planning/environment are men while
65% of corporate services/governance and 78% of human/community services positions are filled by women.
Females are underrepresented in the upper echelons of councils;
approximately 30% of all
councillors and 23% of mayors are women and
just 11% of council CEOs or General Managers are female (Australian Centre of Excellence for Local Government, 2015).
Indigenous people are well represented, with
22% of Indigenous public sector workers employed by local councils, equating
to 4.6% of the national local government workforce
(exceeding the 2.6% target set by the Council of Australian Governments (CoAG) in 2008 under Closing the Gap) (Australian Centre of Excellence for Local Government, 2015).
Ç
Conversely people from culturally and linguistically diverse backgrounds are underrepresented in the local government workforce.
Only 11% of employees speak a language other than English at home, compared to the national
average of 24%. This limits the flexibility and richness of a culturally diverse workforce (Australian Centre of Excellence for Local Government, 2015).
Challenges
Australia-wideSeveral immediate challenges confront the sector in Australia:
The local government workforce population is ageing. While this is not exclusive to councils, the local council proportion of employees who are 50 and over (37%) is higher than the wider Australian labour
force (29%) (Australian Centre of Excellence for Local Government, 2015). With impending retirements come issues of knowledge transfer from mature employees to retain corporate knowledge, difficulties in attracting younger workers and investment to obtain new machinery or tools to support the decreasing physical capacity of older staff.
Skills shortages and position vacancies in councils result in greater competition for staff and recruitment difficulties for councils where incentives and opportunities for career progression are not always accessible.
Generally, council employees have higher levels of education attainment than the Australian average yet minimal budget (as a proportion of total payroll) is dedicated to training, which has implications for maintaining best
practice and building capability as new thinking emerges.
NSWAs well as national challenges the NSW Local Government Workforce Strategy 2015 (Local Government NSW, 2016) identified the following issues, in order of significance:
• ageing workforce• uncertainty due to possible future local government
reforms• skills shortages in professional areas• limitations in leadership capability• gender imbalance in senior roles• lack of skills and experience in workforce planning• lack of workforce trend data• difficulty in recruiting staff• resistance to more flexible work practices• lack of cultural diversity.
Local government reforms and amalgamations are unique to councils like Georges River Council. Bringing together diverse teams, harmonising policies, procedures and conditions, and strengthening systems impact employees and the organisation. Remaining a competitive employer during this time is a pressing issue for newly amalgamated councils which are constrained by the Local Government Award and are, initially, unable to offer the clarity and direction of long-established organisations. Local councils must differentiate themselves from other sectors, promoting themselves as employers of choice by providing flexible working conditions, career development opportunities and capitalising on the benefits of a diverse workforce.
Georges River Council now has the opportunity to fortify its place in the community and as an employer under its new identity, revised workplace policies and procedures and modernised resources.
24 Georges River Council // Workforce Management Plan 25

STONEY CREEK ROAD
FOREST ROAD
HENRY LAWSON DRIVE
FOREST ROAD
FOR
EST
RO
AD
FOREST ROAD
BAUMANS ROAD
MOUNTVIEW
AVENUE
JUNCTION RDEDGBASTON ROAD
PENSHURST ROAD
GEORGE STREET
MORTS ROAD
VICTORIA AVENUE
RAILWAY PARADE LAYCOCK ROAD
HILLCREST AVENUE
HURSTVILLE ROAD
MULGA ROAD
WO
RO
NO
RA
PDE
UNIVERSAL ST G
UN
GAH
BAY
RO
AD
ROBERTS AVENUELOR
RAI
NE
STR
EET
STANLEY ST
BOUNDARY ROAD
BONDS ROAD
BROADARROW ROADBE
LMO
RE
RO
AD
RAILWAY PARADE
JUBILEE AVENUE
PRINCES H
IGHWAY
PRIN
CES
HIG
HWAY
BELLEVUE PARADE
PRIN
CES
HIG
HW
AY
PARK ROAD
RAMSGATE ROAD
THE
PRO
MEN
ADE
VIST
A ST
REET RO
CKY
POIN
T RO
AD
KING GEORGES ROAD
KING GEORGES ROAD
KING GEORGES ROAD
MORGAN STREET
PATRICK STREET
DORA STREET
GLOUCESTER ROAD QUEENS ROAD
THE AVENUE
VANESSA STREET
KENSINGTON ST
GRAY STREET
STU
ART
ST
TERRY STREET
BLAKESLEY ROAD
WONIORA ROAD
KING
SGR
OVE R
OAD
HARROW RD
REGENT ST
BELM
OR
E R
D
JOSOPHINE ST
ISAAC STREET
MAVIS AVE
WATTLE ST
BON
DS
RD
ROMILLY STREET
KING G
EORG
ES ROAD
CROYDON ROAD
GEORGES RIVER
GEORGES RIVER
GEORGES RIVER
GEORGES RIVER
BOTANY STREET
HURSTVILLE
BEVERLY HILLS
KINGSGROVE
NARWEE
PENSHURST
ALLAWAHCARLTON
KOGARAH
BEVERLEY PARK
SAN SOUCI
KOGARAH BAY
CARSS PARK
BLAKEHURST
KYLEBAY
CONNELLSPOINT
HURSTVILLE GROVE
SOUTH HURSTVILLE
OATLEY
PEAKHURSTHEIGHTS
LUGARNO
PEAKHURST
RIVERWOOD
MORTDALE
JAQUES AVE
THUR
LOW ST
STONEY CREEK ROAD
FOREST ROAD
RO
SA S
TRE
ET
WAITAR
A PDE
KING
GEO
RG
ES ROADPRINCES
HIG
HWAY
KY
LE PARA
DE K
YLE
PARAD
E
RO
CKY P
OIN
T RO
AD
RAILWAY PARADE
FOREST ROAD
FOR
EST
RO
AD
DURHAM ST
M5 MOTORWAY M5 MOTORWAY
C
ARLTON PDE
SALT
PAN CREEK
CONNELLS P
OINT
HURSTVILLE WARD
MORTDALE WARD
BLAKEHURST WARD
PEAKHURST WARD
KOGARAH BAY WARD
Our Local Government Area (LGA)The Georges River Local Government Area consists of the former Hurstville City and Kogarah City local government areas and was proclaimed in May 2016.Comprised of 21 suburbs within five wards, the LGA spans an area of 38 square kilometres, bounded by the City of Canterbury Bankstown in the north, the Bayside LGA in the east, the Georges River in the south and Salt Pan Creek in the west. While predominantly residential, the area also has substantial industrial, commercial and recreational areas including waterways and large open spaces.
The communityIn 2016, the resident population
of 146,841 was almost equally
divided between females (51.1 %) and males (48.9%) (Australian Bureau of Statistics, 2018). By 2036 the population is
forecasted to increase by 18.34% to 185,346 (.idcommunity, 2017). In addition to people living here, 63% of the local workforce - or 26,761 people – travel to the LGA for work (.idcommunity, 2017).
Compared to the Greater Sydney population, Georges River has a slightly lower proportion of younger
age group (0 to 17 years) and a higher proportion of older people
(60+ years) (Australian Bureau of Statistics, 2018). The median age of the local
population is 37 years compared to 38 years for NSW (Australian Bureau of Statistics, 2018).
Georges River has a high proportion of coupled and single-parent families with children and a low proportion of single-person households and families without children compared to Greater Sydney.
In 2016, the 54,017 dwellings in the LGA were mostly separate houses, but there is strong growth in high density dwellings (.idcommunity, 2017). In the same year, the median house valuation in the area was
$1,241,882, 48% higher than the median house valuation for houses in NSW (.idcommunity, 2017)
More than half the resident population were born overseas and are from a non-English
speaking background, including 22.8% of the population from
Chinese ancestry. More than 56% of the households in the
LGA speak a language other than English including
Mandarin (14.4%), Cantonese (9.9%), Greek (5.4%), Arabic (3.6%) and Nepali (3.4%) (.idcommunity, 2017).
Economic profile
In 2016, the LGA generated and estimated gross
regional product (GRP) of $7.24 billion,
representing 1.4% of the state’s gross state product
(GSP). The region boasted 15,831 local businesses
and provided 47,511 local jobs. Key industries
include household services (44.4%), goods
related (31.8%) and business services (17.2%) (.idcommunity, 2017).
26 Georges River Council // Workforce Management Plan 27
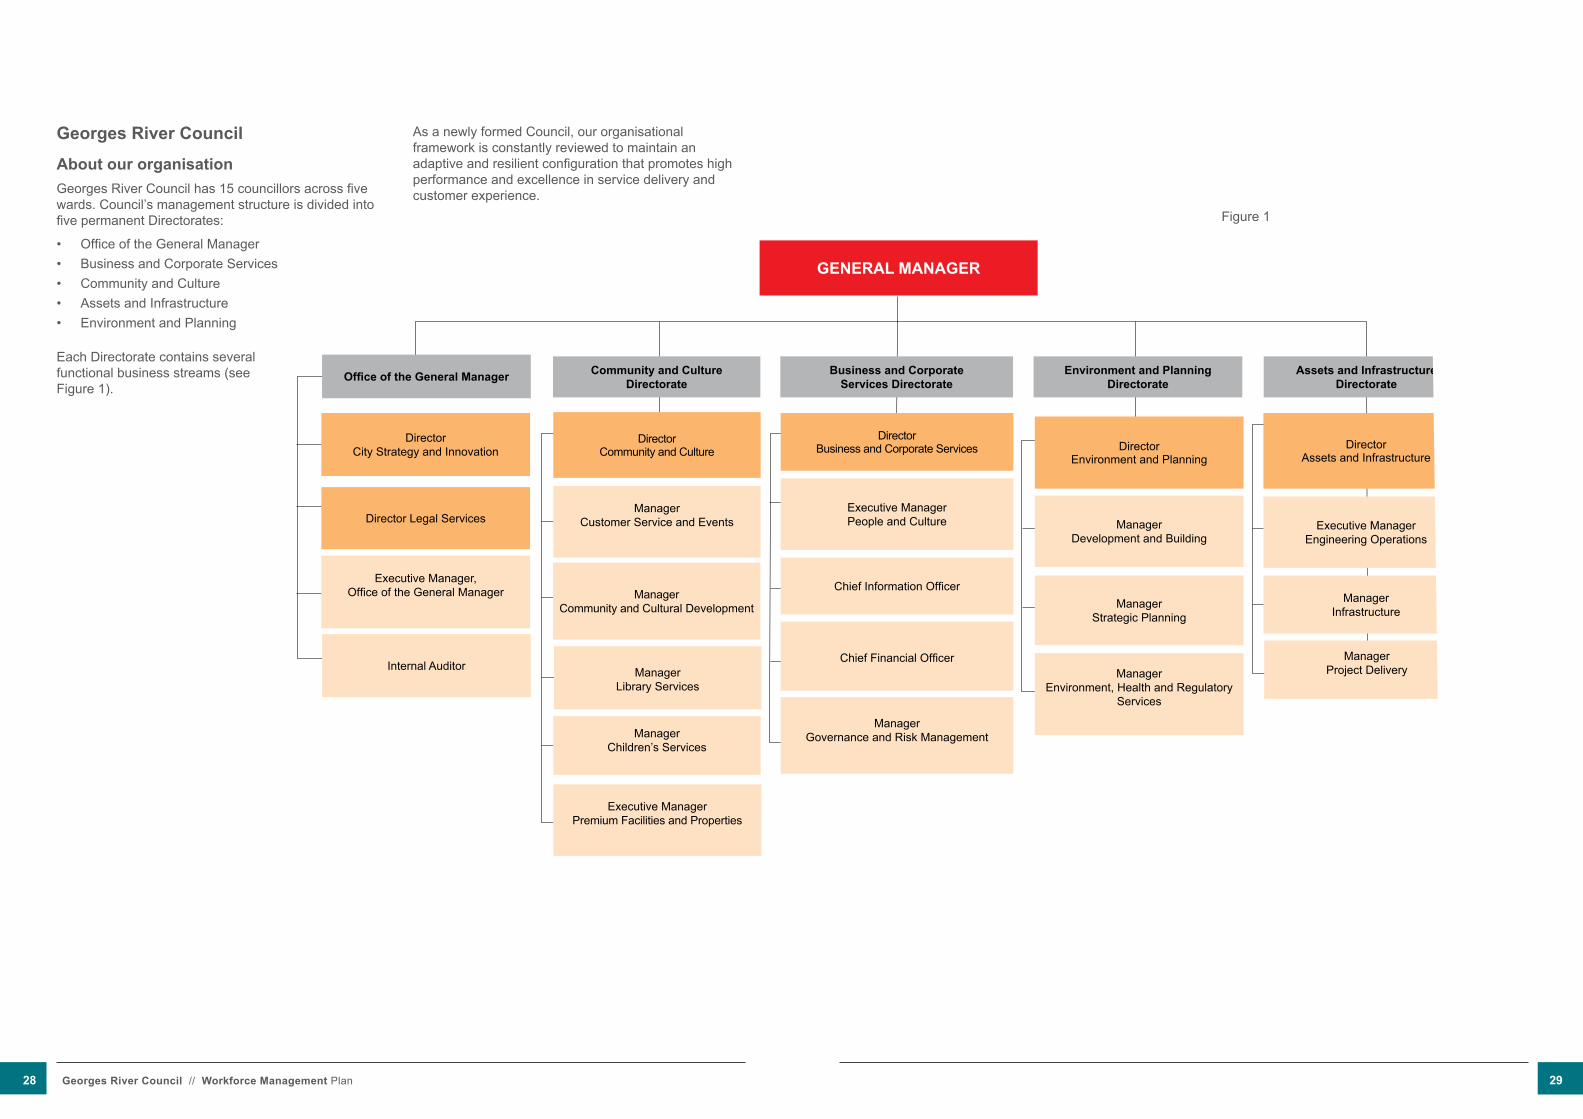
Georges River Council
About our organisationGeorges River Council has 15 councillors across five wards. Council’s management structure is divided into five permanent Directorates:
• Office of the General Manager• Business and Corporate Services• Community and Culture• Assets and Infrastructure• Environment and Planning
Each Directorate contains several functional business streams (see Figure 1).
As a newly formed Council, our organisational framework is constantly reviewed to maintain an adaptive and resilient configuration that promotes high performance and excellence in service delivery and customer experience.
GENERAL MANAGER
Community and Culture Directorate
Business and Corporate Services Directorate
Environment and Planning Directorate
Assets and Infrastructure Directorate
Director Community and Culture
DirectorBusiness and Corporate Services Director
Environment and PlanningDirector
Assets and Infrastructure
Manager Customer Service and Events
Manager Library Services
Manager Children’s Services
Manager Community and Cultural Development
Executive Manager People and Culture
Chief Information Officer
Chief Financial Officer
Manager Governance and Risk Management
Manager Development and Building
Manager Strategic Planning
Manager Environment, Health and Regulatory
Services
Executive Manager Engineering Operations
Manager Infrastructure
Manager Project Delivery
GEORGESRIVERCOUNCIL
Director Legal Services
Internal Auditor
ORGANISATIONAL STRUCTURE
Executive Manager Premium Facilities and Properties
Executive Manager, Office of the General Manager
Office of the General Manager
Director City Strategy and Innovation
Figure 1
28 Georges River Council // Workforce Management Plan 29

Workplace demographicsOur people are crucial to how we demonstrate our values and achieve our mission, which are described later in this chapter. Consisting of permanent, temporary and casual staff, our head count workforce as at March 2018 is 589 staff with an FTE of 605. Head count fluctuates due to establishment vacancies. Our workforce is a mix of local and non-local employees with 35.82% of staff traveling less than five kilometres to get to work (Georges River Council, 2018).
Approximately one quarter (26%) of our staff hold management or leadership roles and 74% are in operational positions (PricewaterhouseCoopers
Category Subcategory Count (n=) Percentage %FTE Current FTE (excluding casuals) 605 -
Head Count (excluding casuals) 589 -Employees by status Permanent 528 89.64%
Temporary 61 10.36%Casual Staff 83 -
Gender Male Workforce 291 49.41%Female Workforce 298 50.59%Males in Management 8 30.77%Females in Management 18 69.23%
Age 18-24 20 3.4%25-34 104 17.66%35-44 155 26.32%45-54 151 25.64%55-64 133 22.58%65 + 26 4.41%
Distance travelled to work Less than 5km distance 211 35.82%5km to 10km distance 139 23.6%10km to 15km distance 91 15.45%15km to 20km distance 61 10.36%20km + distance 87 14.77%
Turnover Rolling Annual as at 30 June 2017 - 20.22%Length of service Less than 5 years 262 44.48%
5 to 10 years 124 21.05%11 to 15 years 83 14.09%16 to 20 years 45 7.64%20 + years 75 12.73%
Diversity and inclusion % Of staff with a disability 4 0.68%% Aboriginal or Torres Strait Islander ** **% Language other than English at home
36 6.11%
% Culturally diverse 131 22.24%
(PWC), 2017). Females (50.59%) and males (49.41%) are almost equally represented in Council’s workforce; however, females (69.23%) account for the largest percentage of employees in management positions, which is 30% higher that the NSW median (PricewaterhouseCoopers (PWC), 2017).
We face the challenges of an ageing workforce (37% of employees are 52 or over). The highest proportion (38%) of our workforce were born between 1967 and 1980, with the remaining 25% were born after 1980 indicating a wide spread of represented age groups.
.
Workforce skillsOur broad occupational base delivers 150 different services to the local community and requires staff from professional, technical, operational and administrative occupations.
Directorate Department RolesGeorges River Council Leadership General Manager
DirectorsManagersCoordinators
Team LeadersSupervisorsExecutive AssistantsPersonal Assistants
Assets and Infrastructure
Projects Building ProjectsProject Delivery Administration
Environmental and Open Space OfficerCivil Works Projects Officer
Engineering Operations Civil Maintenance and Trades SpecialistCleansing OperatorsFleet and Operational Procurement Officers
Parks Maintenance OperatorsField Health & Safety Officer
Infrastructure AdministrationDesign Survey & DrainageParks and WaterwaysTraffic and Transport
Security & EmergencyAssets & Restorations OfficerBuilding Maintenance OfficerProperty & Assets Officer
Community and Culture Customer Service and Events
Customer Service Officers Events Officers
Children’s Services Administration OfficersChildcare AssistantsChildcare Workers
Cooks, CleanersEarly Childhood Teachers/Educators
Community and Cultural Development
Community Development OfficersCultural Services Officers
Administration OfficersTechnical OfficersCurators
Library Services Library AssistantsLibrary OfficersLibrarians
Environment and Planning
Development and Building
Building Certification OfficersDevelopment Assessment OfficersDevelopment & Building Administration Officers
Consultant ArboristSenior Planner Business Improvement
Environmental Health and Regulatory Services
Compliance OfficersSustainability and Waste OfficersEnvironmental Health Officers
Parking/RangersLicensing and Permits Officers
Strategic Planning Economic Development OfficerEconomic Strategic PlannerAdministration Officer
Strategic PlannersStrategic Project OfficerInformation Management Officer
30 Georges River Council // Workforce Management Plan 31
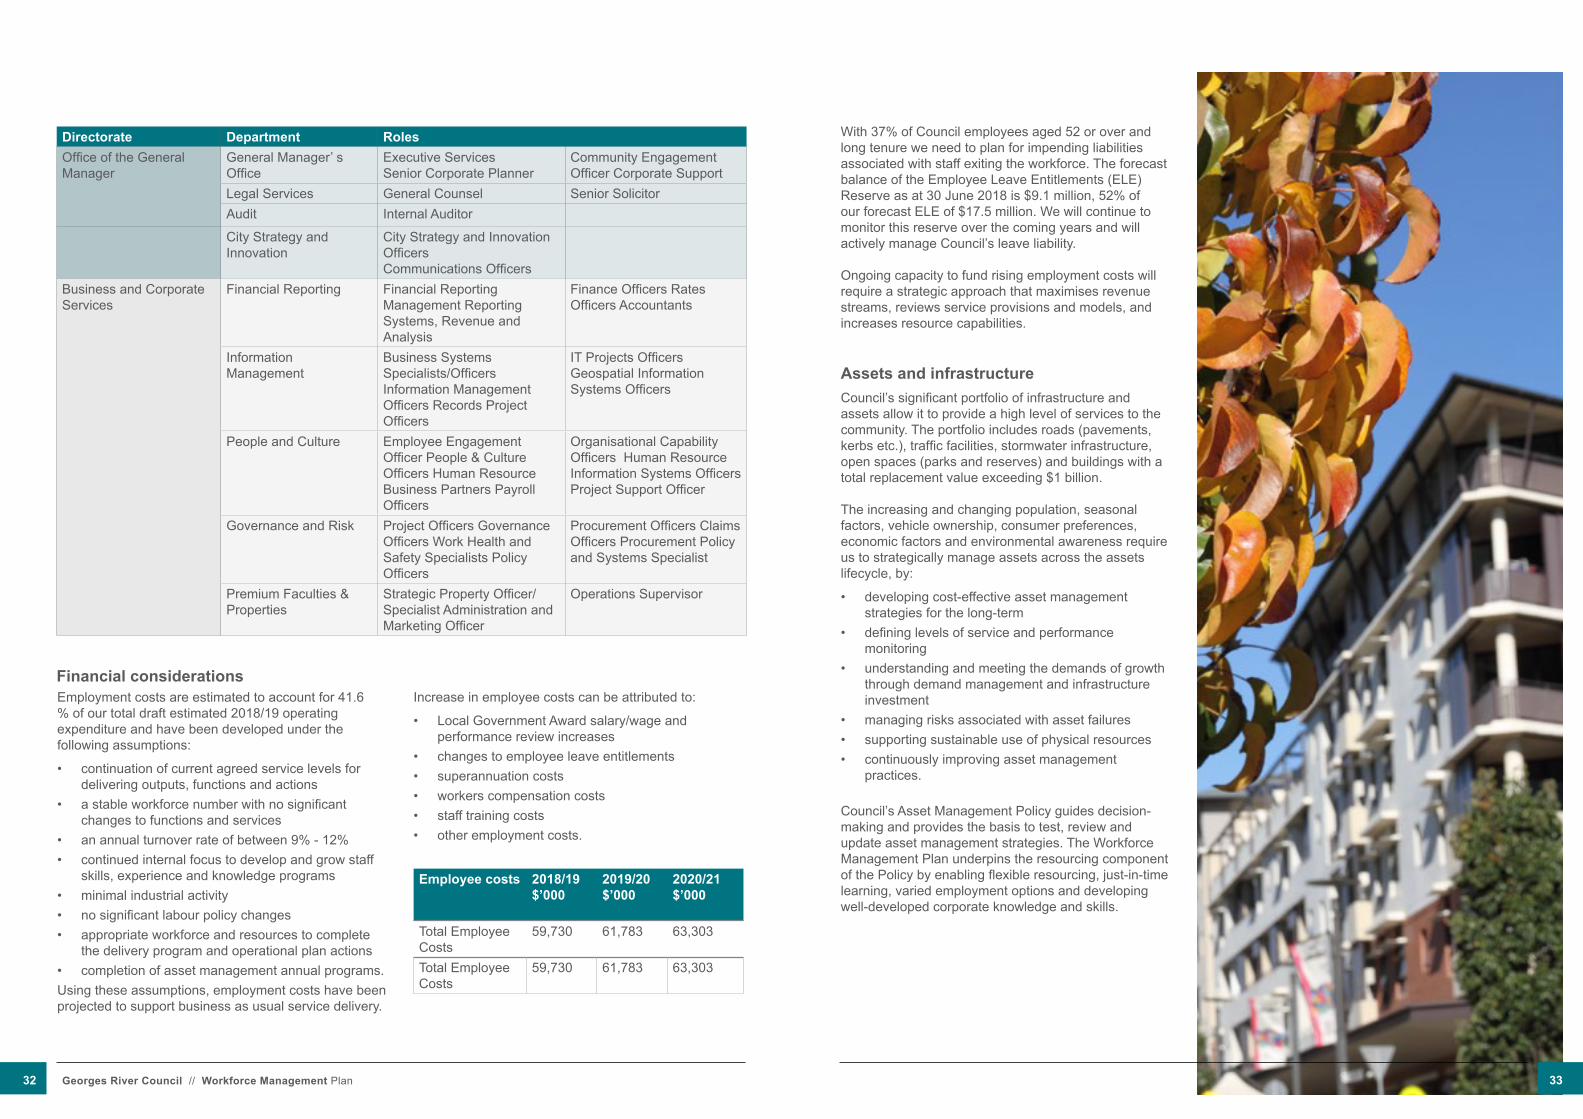
Directorate Department RolesOffice of the General Manager
General Manager’ s Office
Executive Services Senior Corporate Planner
Community Engagement Officer Corporate Support
Legal Services General Counsel Senior SolicitorAudit Internal Auditor
City Strategy and Innovation
City Strategy and Innovation OfficersCommunications Officers
Business and Corporate Services
Financial Reporting Financial Reporting Management Reporting Systems, Revenue and Analysis
Finance Officers Rates Officers Accountants
Information Management
Business Systems Specialists/Officers Information Management Officers Records Project Officers
IT Projects Officers Geospatial Information Systems Officers
People and Culture Employee Engagement Officer People & Culture Officers Human Resource Business Partners Payroll Officers
Organisational Capability Officers Human Resource Information Systems Officers Project Support Officer
Governance and Risk Project Officers Governance Officers Work Health and Safety Specialists Policy Officers
Procurement Officers Claims Officers Procurement Policy and Systems Specialist
Premium Faculties & Properties
Strategic Property Officer/Specialist Administration and Marketing Officer
Operations Supervisor
Financial considerationsEmployment costs are estimated to account for 41.6 % of our total draft estimated 2018/19 operating expenditure and have been developed under the following assumptions:
• continuation of current agreed service levels for delivering outputs, functions and actions
• a stable workforce number with no significant changes to functions and services
• an annual turnover rate of between 9% - 12% • continued internal focus to develop and grow staff
skills, experience and knowledge programs• minimal industrial activity• no significant labour policy changes • appropriate workforce and resources to complete
the delivery program and operational plan actions• completion of asset management annual programs.using these assumptions, employment costs have been projected to support business as usual service delivery.
Increase in employee costs can be attributed to:
• Local Government Award salary/wage and performance review increases
• changes to employee leave entitlements• superannuation costs• workers compensation costs• staff training costs• other employment costs.
Employee costs 2018/19$’000
2019/20$’000
2020/21$’000
Total Employee Costs
59,730 61,783 63,303
Total Employee Costs
59,730 61,783 63,303
With 37% of Council employees aged 52 or over and long tenure we need to plan for impending liabilities associated with staff exiting the workforce. The forecast balance of the Employee Leave Entitlements (ELE) Reserve as at 30 June 2018 is $9.1 million, 52% of our forecast ELE of $17.5 million. We will continue to monitor this reserve over the coming years and will actively manage Council’s leave liability.
Ongoing capacity to fund rising employment costs will require a strategic approach that maximises revenue streams, reviews service provisions and models, and increases resource capabilities.
Assets and infrastructureCouncil’s significant portfolio of infrastructure and assets allow it to provide a high level of services to the community. The portfolio includes roads (pavements, kerbs etc.), traffic facilities, stormwater infrastructure, open spaces (parks and reserves) and buildings with a total replacement value exceeding $1 billion.
The increasing and changing population, seasonal factors, vehicle ownership, consumer preferences, economic factors and environmental awareness require us to strategically manage assets across the assets lifecycle, by:
• developing cost-effective asset management strategies for the long-term
• defining levels of service and performance monitoring
• understanding and meeting the demands of growth through demand management and infrastructure investment
• managing risks associated with asset failures• supporting sustainable use of physical resources• continuously improving asset management
practices.
Council’s Asset Management Policy guides decision-making and provides the basis to test, review and update asset management strategies. The Workforce Management Plan underpins the resourcing component of the Policy by enabling flexible resourcing, just-in-time learning, varied employment options and developing well-developed corporate knowledge and skills.
32 Georges River Council // Workforce Management Plan 33

Our missionIn recognising our responsibilities under the Local Government Act 1993, we developed a Council mission to articulates the breadth and depth of our community’s priorities:
‘A leading people-focused organisation delivering outstanding results for our community and city’. This is our commitment to the community we serve and promotes who we are as a Council.
UNITED PROFESSIONAL HONEST ACCOUNTABLEWe will work
collaboratively as one team with common
purpose and respect
We will act with integrity and seek
opportunities to learn and grow
We will be open and truthful with each other
and our community
We will own our decisions and actions
as we strive for excellence
Our valuesWe established four values in consultation with all Council staff. These values - united, Professional, Honest and Accountable – define the principles and standards we will strive towards.
Our values are embedded in all pivotal people processes including recruitment and selection, succession planning, performance management and recognition programs. Behaving in ways that support our values shows personal commitment to Council and to the community we serve.
A people cultureA strong, positive organisational culture will help us to achieve the community goals, as established through the Community Strategic Plan. We are committed to an engaged and community-focused workforce that is geared toward excellence in service delivery while optimising the customer experience. We proactively encourage a positive culture through engagement with staff and the community. The organisational culture is guided by our mission and values.
Two staff surveys have gauged the organisational climate and given a voice to the satisfaction levels of our workforce. From these, we have developed several programs and initiatives to increase employee satisfaction and drive a positive workplace culture. These are:• Project Fusion: Co-locating two workforces in the
one location and updating open plan workspaces to encourage cross-collaboration and team cohesion
• Mission and values: These were adopted in June 2017, to drive our workplace culture.
• Social events (mufti days, fundraising, community events): Our social calendar encourages staff from different areas of the business to intermingle and get behind a charitable cause.
• Employee excellence reviews: These ensure equity and parity around role performance and provide a formal opportunity for one on one feedback.
• Rewards and recognition program: The program links to employee excellence reviews to recognise high achieving employees.
• Learning and development program: The River Runs Deep learning and development plan launched in 2017 ensures our people are informed, adaptable and prepared with the skills and knowledge to effectively do their job both now and in the future.
• Design thinking workshops: These take a bottom-up approach to problem solving and require employees to think about solutions to organisational issues.
• Wellness and Belonging – The Wellness and Belonging Program will include employee wellbeing policies, a drug and alcohol policy, quit smoking policy and strategies to manage the ageing workforce and the development of a data-based strategy.
We will continue to monitor our organisational culture and provide opportunities for staff to identify areas of concern and develop appropriately timed and targeted initiatives that improve the workplace culture.
COMMUNITY
OUR MIS
SION:
A L
EA
DIN
G, P
EO
PLE
– F
OCU
SED ORGANISATION DELIVERING OUTSTANDING
RESULTS
FOR
OU
R C
OM
MU
NITY AND CITY
PERSONALPERFORMANCE(YOUR WORKPLAN)
ACCOUNTABL
E
UNIT
EDPROFESSIO
NA
LHONEST
COMMUNITY STRATEGIC PLAN (10 YEARS)DELIVERY PLAN (4 YEARS)
OPERATIONAL PLAN (1 YEAR)
PE
RFORMANCE INDICATORS
The relationship between our various plans, our mission and values and personal performance is shown in the adjacent diagram:
34 Georges River Council // Workforce Management Plan 35
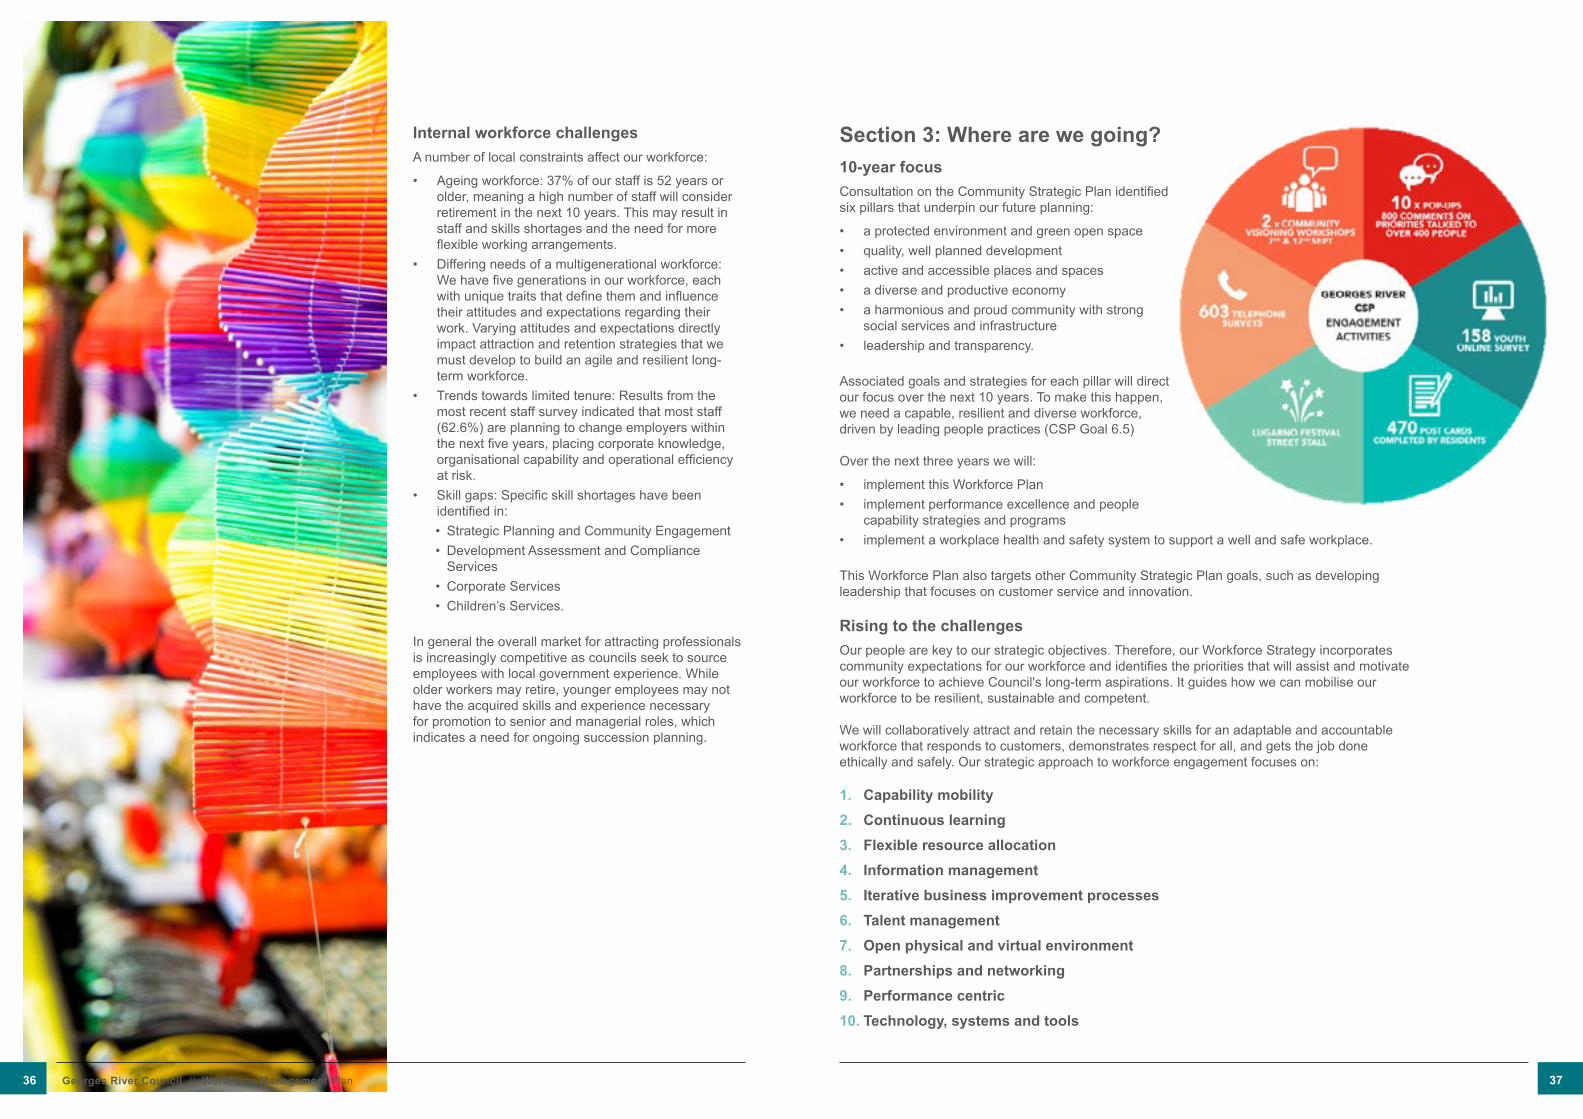
Internal workforce challengesA number of local constraints affect our workforce:
• Ageing workforce: 37% of our staff is 52 years or older, meaning a high number of staff will consider retirement in the next 10 years. This may result in staff and skills shortages and the need for more flexible working arrangements.
• Differing needs of a multigenerational workforce: We have five generations in our workforce, each with unique traits that define them and influence their attitudes and expectations regarding their work. Varying attitudes and expectations directly impact attraction and retention strategies that we must develop to build an agile and resilient long-term workforce.
• Trends towards limited tenure: Results from the most recent staff survey indicated that most staff (62.6%) are planning to change employers within the next five years, placing corporate knowledge, organisational capability and operational efficiency at risk.
• Skill gaps: Specific skill shortages have been identified in:• Strategic Planning and Community Engagement• Development Assessment and Compliance
Services• Corporate Services• Children’s Services.
In general the overall market for attracting professionals is increasingly competitive as councils seek to source employees with local government experience. While older workers may retire, younger employees may not have the acquired skills and experience necessary for promotion to senior and managerial roles, which indicates a need for ongoing succession planning.
Section 3: Where are we going?10-year focusConsultation on the Community Strategic Plan identified six pillars that underpin our future planning:
• a protected environment and green open space• quality, well planned development• active and accessible places and spaces• a diverse and productive economy• a harmonious and proud community with strong
social services and infrastructure• leadership and transparency.
Associated goals and strategies for each pillar will direct our focus over the next 10 years. To make this happen, we need a capable, resilient and diverse workforce, driven by leading people practices (CSP Goal 6.5)
Over the next three years we will:
• implement this Workforce Plan• implement performance excellence and people
capability strategies and programs• implement a workplace health and safety system to support a well and safe workplace.
This Workforce Plan also targets other Community Strategic Plan goals, such as developing leadership that focuses on customer service and innovation.
Rising to the challengesOur people are key to our strategic objectives. Therefore, our Workforce Strategy incorporates community expectations for our workforce and identifies the priorities that will assist and motivate our workforce to achieve Council's long-term aspirations. It guides how we can mobilise our workforce to be resilient, sustainable and competent.
We will collaboratively attract and retain the necessary skills for an adaptable and accountable workforce that responds to customers, demonstrates respect for all, and gets the job done ethically and safely. Our strategic approach to workforce engagement focuses on:
1. Capability mobility2. Continuous learning 3. Flexible resource allocation 4. Information management 5. Iterative business improvement processes 6. Talent management 7. Open physical and virtual environment 8. Partnerships and networking9. Performance centric10. Technology, systems and tools
36 Georges River Council // Workforce Management Plan 37
Our workforce strategy
1. Capability mobilityImplement temporary, planned mobility of targeted employees across functional business areas to build capability and develop a more experienced and engaged workforce.
2. Continuous learning Regularly review the learning needs of our workforce and commit to upgrading their skills so that we can successfully adapt to the changing environment, increased demands and ever-expanding functionality of Council.
3. Flexible resource allocation Proactively coordinate our human resources, systems and tools, to enable business continuity and real-time responses to changing circumstances.
4. Information management Streamline and maintain complete and integrated data management to effectively fulfil our functions and store information in a safe and accessible way.
5. Iterative business improvement processesConstantly strive to improve our processes and services in accordance with industry standards to achieve customer centricity, increased productivity and the capability embrace new developments or technologies.
6. Talent management Persistently attract, recruit, hire and retain the most talented and superior employees available, regardless of age or diversity, and provide opportunities for continuous development.
7. Open physical and virtual environment Create a fit-for-purpose environment that influences a positive workplace culture and supports work/life balance.
8. Partnerships and networkingActively encourage internal and external stakeholder relationships to share knowledge and utilise skills to supplement expertise and accomplish mutual goals.
9. Performance centricMotivate our workforce through feedback mechanisms, role clarity and a rewards and recognition program.
10. Technology, systems and toolsIdentify opportunities to invest in new technologies or to upgrade, streamline and perfect our systems and tools.
Supporting our Workforce PlanAcknowledging that day-to-day Council operations are influenced by the highly politicised and regulated environment in which we work, changes are often beyond our control. In addition, local government in NSW faces contemporary challenges relating to its structure, ongoing financial sustainability and community relevance. Our workforce should be able to effectively respond to potential changes at a local and industry level.
In response, additional social planning and strategy documents complement this Workforce Plan by incorporating identified community needs to address specific areas:
• learning and development program• talent management strategy • work health and safety strategy.
We developed these documents following extensive community consultation.
Learning and Development Program: The River Runs DeepOur vision is to create a learning culture that supports our mission, vision and values. The River Runs Deep will result in an adaptive, digitally literate and customer-focused workforce where managers and leaders foster ongoing learning and continual improvement.
This Program structures development programs and activities into six streams with a focus on compliance, e-learning and mandatory training. The programs to manage compliance and ongoing training will aim to reduce non-compliance instances, reduce accidents and injuries, and sustain a safe and healthy work environment. Our goal is to create the foundation for the skills, knowledge, behaviours and systems that set our staff and organisation up for success.
The program expands learning beyond the traditional classroom by focusing:
• 70% of learning towards on-the-job training• 20% of learning via coaching and mentoring
relationships • 10% of learning by formal training courses, long
term education programs, conferences and seminars.
This approach relies on the support of leaders throughout the organisation to free up their talent to provide and share their skills with others. This will improve learning experiences and build deeper cross-departmental relationships, which is a priority under our Performance Excellence Program.
The program’s success will be measured through relevant metrics around cross-functional project initiatives, successful internal secondment and promotion movements, successful skill development of staff and feedback through leadership and performance reviews.
We will continually review our learning and development suite based on the annual workforce training needs analysis to ensure relevancy and quality. This includes investigations into relevant programs that directly link to nationally-accredited and government-funded training programs.
Leadership Development Strategy: The Captain’s CollectiveOur leadership drives our culture. Great leadership is having the courage to make difficult decisions that benefit the whole community and the skills
to engage our teams in providing quality service. Sustainable leadership is about engaging and inspiring leaders to develop, contribute and perform at an optimum level across all layers of the organisation.
The Captains Collective is a monthly managers’ meeting that aims to build individual and team leadership capabilities. It focuses on emotional intelligence, technical and people skills to help managers motivate and develop staff, model and promote positive leadership behaviour and improve talent retention rates. Our goal is to create a thriving organisation driven by leaders who inspire and lead staff and teams to achieve our operational and strategic goals that go to providing quality outcomes for our community.
The
Captain’s Collective
38 Georges River Council // Workforce Management Plan 39
Work Health and Safety Strategic PlanWe are committed to a safety-first approach by providing and maintaining a safe and healthy workplace for staff, contractors and visitors. Our Work Health and Safety (WHS) Strategic Plan aims to achieve high standards of health, safety and risk management in all operations by:
• taking a systematic approach to safety• reducing and managing WHS risks• building a robust safety culture• developing innovative consultation platforms• measuring safety performance.
The Strategy also aims to exceed the requirements of the Australian Work Health and Safety Strategy 2012-2022 which details a 10-year national framework to improve workplace health and safety. It sets out four outcomes to be achieved by 2022:
• reduced incidence of work-related death, injury and illness
• reduced exposure to hazards and risks • improved hazard controls • an improved work health and safety infrastructure.
Our Strategy will continuously grow our safety culture, focus on employee health and wellbeing, and apply best practice strategies in workplace health, safety and risk management to maintain sound safety and risk management practices that protect the community and service agency staff.
Embracing opportunitiesDespite our challenges, we recognise a number of opportunities that may assist in developing our sustainable workforce.
Using new technologies can increase efficiencies, streamline processes and facilitate information exchange. Identifying opportunities to review and install systems upgrades where appropriate will allow us to remain modern and relevant as both an employer and as a service provider.
Through annual performance reviews, we will continue to understand the capacity of our staff and identify opportunities to create our own professionals to address skills shortages. Combining this approach with our Learning and Development Program, will equip employees with the newest information and principles for best practice.
Continuous business improvement ensures service delivery meets the needs of internal and external stakeholders and allows us to mobilise resources in ways that maximise efficiencies, reduce administrative burden and ultimately position Council services as essential to the lifestyle of the local community.To effectively embrace opportunities as they become apparent, this Plan will be reviewed and adjusted annually to create a workforce that is relevant to the present and ready for the future.
40 Georges River Council // Workforce Management Plan 41
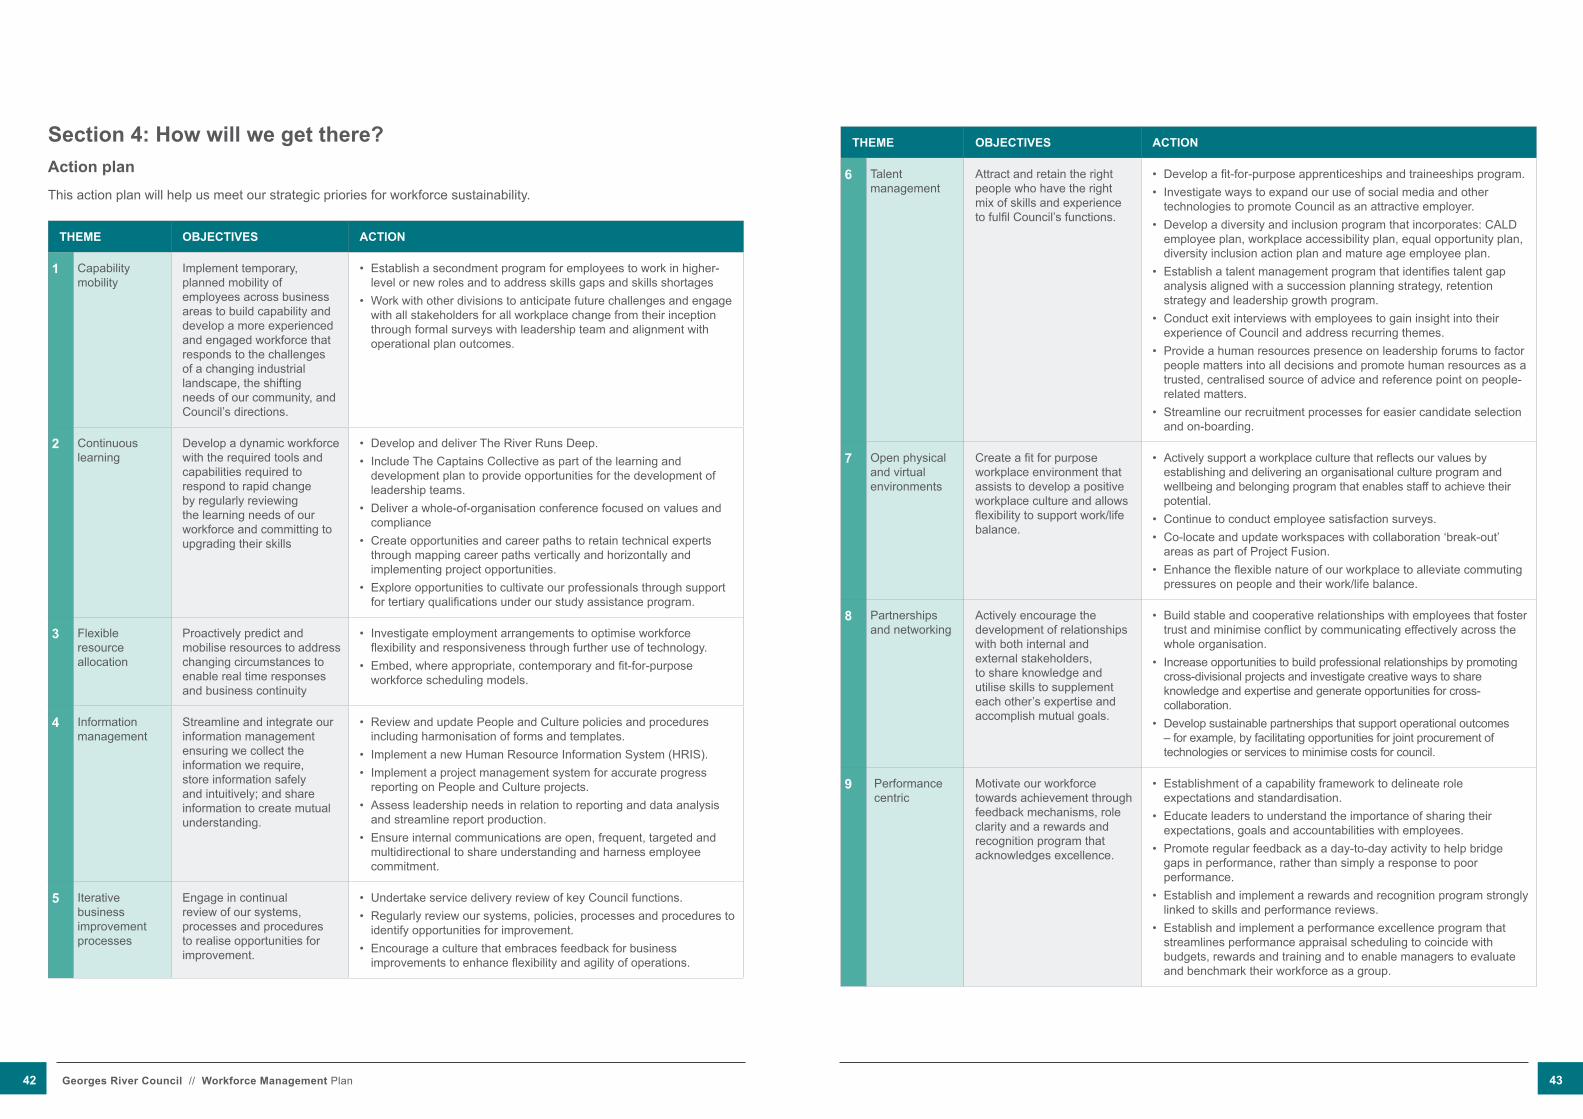
Section 4: How will we get there?Action plan This action plan will help us meet our strategic priories for workforce sustainability.
THEME OBJECTIVES ACTION
1 Capability mobility
Implement temporary, planned mobility of employees across business areas to build capability and develop a more experienced and engaged workforce that responds to the challenges of a changing industrial landscape, the shifting needs of our community, and Council’s directions.
• Establish a secondment program for employees to work in higher-level or new roles and to address skills gaps and skills shortages
• Work with other divisions to anticipate future challenges and engage with all stakeholders for all workplace change from their inception through formal surveys with leadership team and alignment with operational plan outcomes.
2 Continuous learning
Develop a dynamic workforce with the required tools and capabilities required to respond to rapid change by regularly reviewing the learning needs of our workforce and committing to upgrading their skills
• Develop and deliver The River Runs Deep. • Include The Captains Collective as part of the learning and
development plan to provide opportunities for the development of leadership teams.
• Deliver a whole-of-organisation conference focused on values and compliance
• Create opportunities and career paths to retain technical experts through mapping career paths vertically and horizontally and implementing project opportunities.
• Explore opportunities to cultivate our professionals through support for tertiary qualifications under our study assistance program.
3 Flexible resource allocation
Proactively predict and mobilise resources to address changing circumstances to enable real time responses and business continuity
• Investigate employment arrangements to optimise workforce flexibility and responsiveness through further use of technology.
• Embed, where appropriate, contemporary and fit-for-purpose workforce scheduling models.
4 Information management
Streamline and integrate our information management ensuring we collect the information we require, store information safely and intuitively; and share information to create mutual understanding.
• Review and update People and Culture policies and procedures including harmonisation of forms and templates.
• Implement a new Human Resource Information System (HRIS).• Implement a project management system for accurate progress
reporting on People and Culture projects. • Assess leadership needs in relation to reporting and data analysis
and streamline report production.• Ensure internal communications are open, frequent, targeted and
multidirectional to share understanding and harness employee commitment.
5 Iterative business improvement processes
Engage in continual review of our systems, processes and procedures to realise opportunities for improvement.
• undertake service delivery review of key Council functions.• Regularly review our systems, policies, processes and procedures to
identify opportunities for improvement.• Encourage a culture that embraces feedback for business
improvements to enhance flexibility and agility of operations.
THEME OBJECTIVES ACTION
6 Talent management
Attract and retain the right people who have the right mix of skills and experience to fulfil Council’s functions.
• Develop a fit-for-purpose apprenticeships and traineeships program.• Investigate ways to expand our use of social media and other
technologies to promote Council as an attractive employer.• Develop a diversity and inclusion program that incorporates: CALD
employee plan, workplace accessibility plan, equal opportunity plan, diversity inclusion action plan and mature age employee plan.
• Establish a talent management program that identifies talent gap analysis aligned with a succession planning strategy, retention strategy and leadership growth program.
• Conduct exit interviews with employees to gain insight into their experience of Council and address recurring themes.
• Provide a human resources presence on leadership forums to factor people matters into all decisions and promote human resources as a trusted, centralised source of advice and reference point on people-related matters.
• Streamline our recruitment processes for easier candidate selection and on-boarding.
7 Open physical and virtual environments
Create a fit for purpose workplace environment that assists to develop a positive workplace culture and allows flexibility to support work/life balance.
• Actively support a workplace culture that reflects our values by establishing and delivering an organisational culture program and wellbeing and belonging program that enables staff to achieve their potential.
• Continue to conduct employee satisfaction surveys. • Co-locate and update workspaces with collaboration ‘break-out’
areas as part of Project Fusion.• Enhance the flexible nature of our workplace to alleviate commuting
pressures on people and their work/life balance.
8 Partnerships and networking
Actively encourage the development of relationships with both internal and external stakeholders, to share knowledge and utilise skills to supplement each other’s expertise and accomplish mutual goals.
• Build stable and cooperative relationships with employees that foster trust and minimise conflict by communicating effectively across the whole organisation.
• Increase opportunities to build professional relationships by promoting cross-divisional projects and investigate creative ways to share knowledge and expertise and generate opportunities for cross-collaboration.
• Develop sustainable partnerships that support operational outcomes – for example, by facilitating opportunities for joint procurement of technologies or services to minimise costs for council.
9 Performance centric
Motivate our workforce towards achievement through feedback mechanisms, role clarity and a rewards and recognition program that acknowledges excellence.
• Establishment of a capability framework to delineate role expectations and standardisation.
• Educate leaders to understand the importance of sharing their expectations, goals and accountabilities with employees.
• Promote regular feedback as a day-to-day activity to help bridge gaps in performance, rather than simply a response to poor performance.
• Establish and implement a rewards and recognition program strongly linked to skills and performance reviews.
• Establish and implement a performance excellence program that streamlines performance appraisal scheduling to coincide with budgets, rewards and training and to enable managers to evaluate and benchmark their workforce as a group.
42 Georges River Council // Workforce Management Plan 43
THEME OBJECTIVES ACTION
10 Technology, systems and tools
Identify opportunities to invest in new technologies or to upgrade, streamline and perfect our systems and tools.
• Implementation of ATO single-touch payroll process (including software update and business process review).
• Implement a mobile interface (CI Anywhere) for staff and managers (current users of CI only).
• Advocate for investment in technology to increase workplace productivity and to facilitate further flexibility in the organisation of work.
• Deliver technical skills training to help the workforce adapt to new technologies in the workplace.
Measuring successWe will measure our performance against this Plan every year by reviewing the following factors:
• Workforce Plan Implementation: Measure the number of strategies in this document that have been implemented by the beginning of the next review cycle.
• Streamlined internal processes: Measure time and cost savings of streamlined internal processes in conjunction with customer feedback including complaint and end user experience of new processes.
• Employee engagement, organisational culture and satisfaction with leadership: Collect and analyse data on these measures via the staff survey and compare to previous survey results.
• Learning and development: Audit the number of training modules circulated against staff participation for future comparison.
• Human resources: Measure and compare key performance indicators relating to human resources such as position vacancies, staff turnover, new recruits between review cycles (one year).
• Workforce succession: Assess the number of internal/external secondment, transfer and promotions within the review period.
44 Georges River Council // Workforce Management Plan 45

ASSET MANAGEMENT PLANExecutive SummaryThis Asset Management Plan combines the plans of the former Kogarah and Hurstville councils and broadly identifies goals and strategies relating to infrastructure assets and the level of service expected by our community.
This plan is one component of the Asset Management Framework and covers four asset categories:
• Roads• Stormwater• Open Space & Recreation• Buildings.
This Asset Management Plan is a living dynamic document. Over time, we will build on it so that we can continue to sustainably manage and maintain the community’s infrastructure and building assets.
Council assetsCouncil is the custodian of a significant infrastructure asset portfolio that enables services to be provided to the community. Council’s infrastructure assets currently have a total replacement value exceeding $1billion, as outlined below:
Asset Category Current Replacement Cost ($M)
Roads – comprisingFootpathsKerbsTraffic FacilitiesRoad SurfaceRoad PavementRoad Formation
$725$72$133$14$69$322$115
Stormwater $143Open Space & Recreation $74Buildings $244Total $1196
CostsThe two key indicators of cost in providing levels of service are life cycle costs and maintenance and renewal expenditure. Life cycle costs are the average annual cost over the life of assets administered by Georges River Council. Life cycle expenditure is the actual maintenance and renewal expenditure over the same period. These are summarised below:
Asset category
Life cycle cost ($m)
Life cycle expenditure ($m)
Life cycle gap ($m)
Roads $11.85 $10.4 -1.45Stormwater $2.06 $1.4 -0.66Parks & Recreation
$8.62 $7.87 -0.75
Buildings $7.1 $6.83 -0.72Total $29.63 $26.50 -0.9
Note: These figures are based on Georges River Council’s 2017-18 budget
A shortfall between life cycle cost and life cycle expenditure gives an indication of the life cycle gap to be addressed in asset management in the long-term financial plan.
The former councils consulted the community on
46 Georges River Council // Asset Management Plan 47
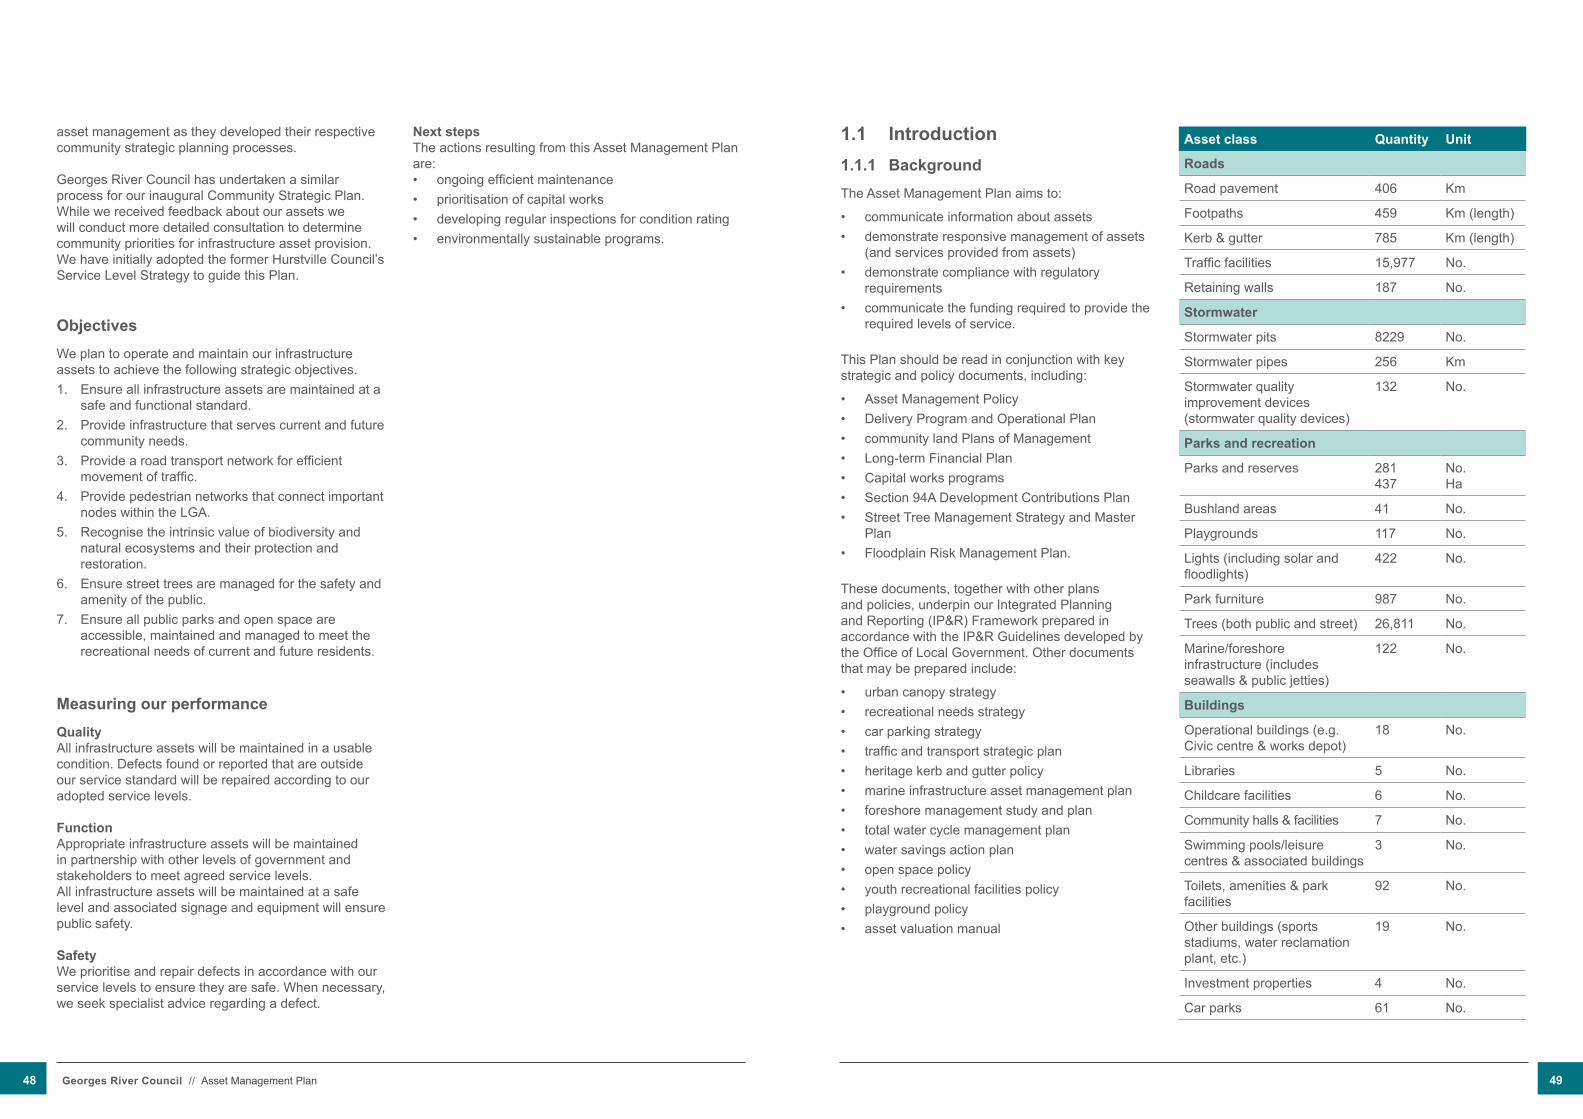
asset management as they developed their respective community strategic planning processes.
Georges River Council has undertaken a similar process for our inaugural Community Strategic Plan. While we received feedback about our assets we will conduct more detailed consultation to determine community priorities for infrastructure asset provision. We have initially adopted the former Hurstville Council’s Service Level Strategy to guide this Plan.
ObjectivesWe plan to operate and maintain our infrastructure assets to achieve the following strategic objectives.1. Ensure all infrastructure assets are maintained at a
safe and functional standard. 2. Provide infrastructure that serves current and future
community needs.3. Provide a road transport network for efficient
movement of traffic.4. Provide pedestrian networks that connect important
nodes within the LGA.5. Recognise the intrinsic value of biodiversity and
natural ecosystems and their protection and restoration.
6. Ensure street trees are managed for the safety and amenity of the public.
7. Ensure all public parks and open space are accessible, maintained and managed to meet the recreational needs of current and future residents.
Measuring our performanceQualityAll infrastructure assets will be maintained in a usable condition. Defects found or reported that are outside our service standard will be repaired according to our adopted service levels.
FunctionAppropriate infrastructure assets will be maintained in partnership with other levels of government and stakeholders to meet agreed service levels.All infrastructure assets will be maintained at a safe level and associated signage and equipment will ensure public safety.
SafetyWe prioritise and repair defects in accordance with our service levels to ensure they are safe. When necessary, we seek specialist advice regarding a defect.
Next stepsThe actions resulting from this Asset Management Plan are:• ongoing efficient maintenance• prioritisation of capital works• developing regular inspections for condition rating• environmentally sustainable programs.
1.1 Introduction1.1.1 BackgroundThe Asset Management Plan aims to:
• communicate information about assets• demonstrate responsive management of assets
(and services provided from assets)• demonstrate compliance with regulatory
requirements• communicate the funding required to provide the
required levels of service.
This Plan should be read in conjunction with key strategic and policy documents, including:
• Asset Management Policy• Delivery Program and Operational Plan• community land Plans of Management• Long-term Financial Plan• Capital works programs• Section 94A Development Contributions Plan• Street Tree Management Strategy and Master
Plan• Floodplain Risk Management Plan. These documents, together with other plans and policies, underpin our Integrated Planning and Reporting (IP&R) Framework prepared in accordance with the IP&R Guidelines developed by the Office of Local Government. Other documents that may be prepared include:
• urban canopy strategy• recreational needs strategy• car parking strategy• traffic and transport strategic plan• heritage kerb and gutter policy• marine infrastructure asset management plan• foreshore management study and plan • total water cycle management plan• water savings action plan• open space policy• youth recreational facilities policy• playground policy• asset valuation manual
Asset class Quantity Unit
Roads
Road pavement 406 Km
Footpaths 459 Km (length)
Kerb & gutter 785 Km (length)
Traffic facilities 15,977 No.
Retaining walls 187 No.
Stormwater
Stormwater pits 8229 No.
Stormwater pipes 256 Km
Stormwater quality improvement devices (stormwater quality devices)
132 No.
Parks and recreation
Parks and reserves 281437
No.Ha
Bushland areas 41 No.
Playgrounds 117 No.
Lights (including solar and floodlights)
422 No.
Park furniture 987 No.
Trees (both public and street) 26,811 No.
Marine/foreshore infrastructure (includes seawalls & public jetties)
122 No.
Buildings
Operational buildings (e.g. Civic centre & works depot)
18 No.
Libraries 5 No.
Childcare facilities 6 No.
Community halls & facilities 7 No.
Swimming pools/leisure centres & associated buildings
3 No.
Toilets, amenities & park facilities
92 No.
Other buildings (sports stadiums, water reclamation plant, etc.)
19 No.
Investment properties 4 No.
Car parks 61 No.
48 Georges River Council // Asset Management Plan 49

Assets covered by this PlanThe roads asset category includes the road, footpath and kerb-related assets within the boundary of the road reserve. It also includes on-grade asphalt car parks outside of parks and reserves and other transport-related infrastructure such as the bus interchange. We are collecting more data about our road assets, including a comprehensive road network survey that collected detailed performance and condition data such as severity and extent of rutting, cracking, ravelling, roughness, ravelling and other pavement and surface defects. This data forms the basis for our adopted five-year forward works program for road rehabilitation and resurfacing.
The stormwater asset category covers stormwater pits and pipes and stormwater quality improvement devices. The main difficulty with the stormwater asset category is the underground nature of the assets and the costs associated with assessing these assets. Our ongoing program for CCTV inspections of stormwater pipes and conduits aims to condition assess 5-10% of the network each a year.
The parks and recreation asset category includes sporting fields, parks and reserves, gardens, walking tracks and park footpaths, irrigation systems, playgrounds, trees (both in parks and street trees), park furniture (fixtures and fittings), bushland areas and foreshore/marine infrastructure.
Our parks and reserves are either in Council ownership or in the ownership of a State agency like the NSW Department of Lands, Railcorp or Sydney Water but under Council’s care, control and management.
State-dedicated reserves are managed under the Crown Lands Act 1989. Parcels of land owned by Council and classified as ‘Community Land’ and are managed under the Local Government Act 1993. Plans of Management regulate use and management of community land. Bushland areas are defined as all areas of remnant or regenerated vegetation where there is evidence of a natural vegetation structure comprised of locally indigenous species.
The buildings category includes operational buildings, libraries, child care facilities, halls, rental properties, swimming pools, toilets, amenities buildings and car parks. Some building assets are operationally managed by external parties, such as the Beverley Park and Hurstville Golf Courses and Hurstville Aquatic and Leisure Centre.
Appendix 2 details each of these asset classes.
1.1.2 Plan FrameworkThis Plan includes:
• levels of service: specifies the services and levels of service to be provided by council, initially adopting the former Hurstville Council’s methodology.
• future demand: how demand will impact future service delivery and how it will be addressed.
• Life cycle management: how we will manage existing and future assets to provide required services.
• financial summary: funding needed to provide the required services.
• asset management practices• monitoring: how the plan will be monitored to
ensure it is meeting our objectives.• asset management improvement plan.
A road map for preparing an Asset Management Plan is shown in Figure 1:
CORPORATE PLANNINGConfirmstrategic objectives and establish AM
policies, procedures and goals.Define responsibilites and ownership
Decide core or advanced AM PanGain organisation commitment
REVIEW/COLLATE ASSET INFORMATIONExisting information sourcesIdentify and describe assets.
Data collectionCondition assessmentsPerformance monitoring
Valuation Data
IMPROVEMENT PLANAssess current/desired practices
Develop improvement plan
FINANCIAL FORECASTSLifecycle analysis
Financial forecast summaryValuation depreciation
Funding
ESTABLISH LEVELS OF SERVICEEstablish strategic linkages
Define and adopt statementsEstablish measures and targets
Consultation
IS THE PLAN AFFORDABLE?
ITERATIONReconsider service statements
Options for fundingConsult with Council
Consult with community
ANNUAL PLAN/BUSINESS PLAN
IMPLEMENT IMPROVEMENT
STRATEGY
AM PLAN REVIEW AND
AUDIT
INFO
RM
ATIO
N M
AN
AG
EMEN
T A
ND
DAT
A IM
PRO
VEM
ENT
DEFINE AND SCOPE
LIFECYCLE MANAGEMENT STRATEGIESDevelop lifecycle strategies
Describe service delivery strategyRisk management strategies
Demand forecasting and managementOptimised decision making (renewals, new
works, disposals)Optimise maintenance strategies
50 Georges River Council // Asset Management Plan 51
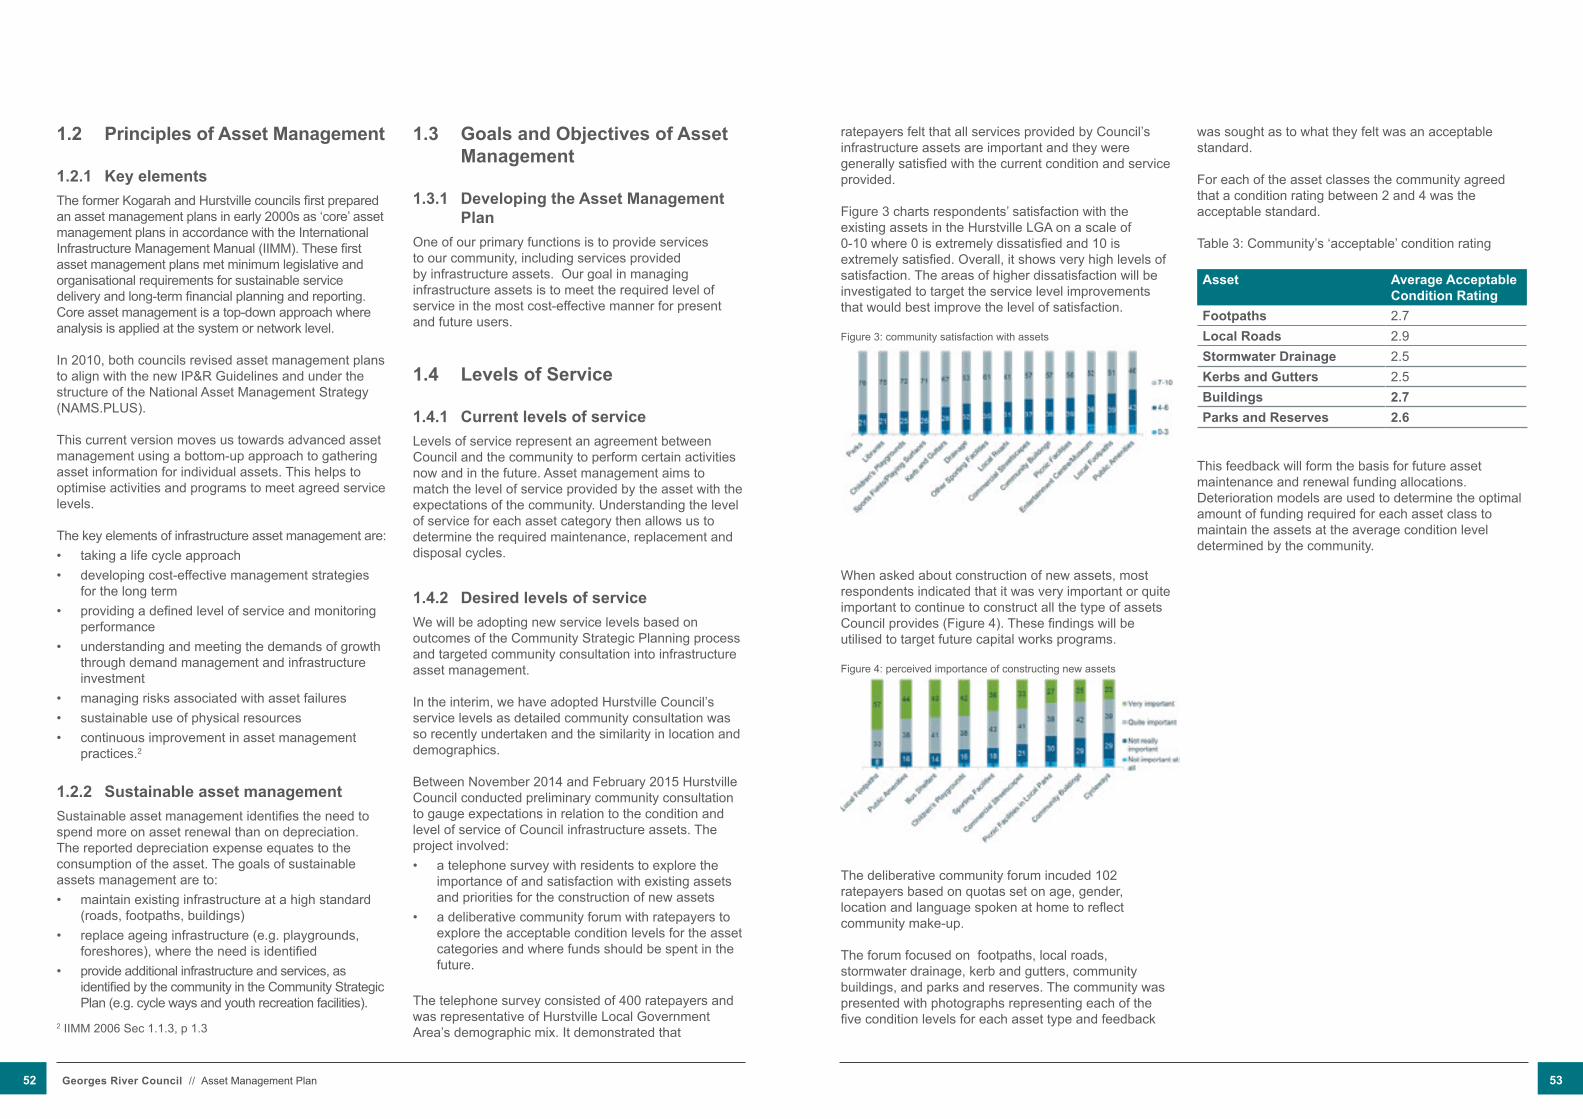
1.2 Principles of Asset Management
1.2.1 Key elementsThe former Kogarah and Hurstville councils first prepared an asset management plans in early 2000s as ‘core’ asset management plans in accordance with the International Infrastructure Management Manual (IIMM). These first asset management plans met minimum legislative and organisational requirements for sustainable service delivery and long-term financial planning and reporting. Core asset management is a top-down approach where analysis is applied at the system or network level.
In 2010, both councils revised asset management plans to align with the new IP&R Guidelines and under the structure of the National Asset Management Strategy (NAMS.PLuS).
This current version moves us towards advanced asset management using a bottom-up approach to gathering asset information for individual assets. This helps to optimise activities and programs to meet agreed service levels. The key elements of infrastructure asset management are:• taking a life cycle approach• developing cost-effective management strategies
for the long term• providing a defined level of service and monitoring
performance• understanding and meeting the demands of growth
through demand management and infrastructure investment
• managing risks associated with asset failures• sustainable use of physical resources• continuous improvement in asset management
practices.2
1.2.2 Sustainable asset managementSustainable asset management identifies the need to spend more on asset renewal than on depreciation. The reported depreciation expense equates to the consumption of the asset. The goals of sustainable assets management are to:• maintain existing infrastructure at a high standard
(roads, footpaths, buildings)• replace ageing infrastructure (e.g. playgrounds,
foreshores), where the need is identified• provide additional infrastructure and services, as
identified by the community in the Community Strategic Plan (e.g. cycle ways and youth recreation facilities).
2 IIMM 2006 Sec 1.1.3, p 1.3
1.3 Goals and Objectives of Asset Management
1.3.1 Developing the Asset Management PlanOne of our primary functions is to provide services to our community, including services provided by infrastructure assets. Our goal in managing infrastructure assets is to meet the required level of service in the most cost-effective manner for present and future users.
1.4 Levels of Service
1.4.1 Current levels of serviceLevels of service represent an agreement between Council and the community to perform certain activities now and in the future. Asset management aims to match the level of service provided by the asset with the expectations of the community. understanding the level of service for each asset category then allows us to determine the required maintenance, replacement and disposal cycles.
1.4.2 Desired levels of serviceWe will be adopting new service levels based on outcomes of the Community Strategic Planning process and targeted community consultation into infrastructure asset management.
In the interim, we have adopted Hurstville Council’s service levels as detailed community consultation was so recently undertaken and the similarity in location and demographics.
Between November 2014 and February 2015 Hurstville Council conducted preliminary community consultation to gauge expectations in relation to the condition and level of service of Council infrastructure assets. The project involved:• a telephone survey with residents to explore the
importance of and satisfaction with existing assets and priorities for the construction of new assets
• a deliberative community forum with ratepayers to explore the acceptable condition levels for the asset categories and where funds should be spent in the future.
The telephone survey consisted of 400 ratepayers and was representative of Hurstville Local Government Area’s demographic mix. It demonstrated that
ratepayers felt that all services provided by Council’s infrastructure assets are important and they were generally satisfied with the current condition and service provided.
Figure 3 charts respondents’ satisfaction with the existing assets in the Hurstville LGA on a scale of 0-10 where 0 is extremely dissatisfied and 10 is extremely satisfied. Overall, it shows very high levels of satisfaction. The areas of higher dissatisfaction will be investigated to target the service level improvements that would best improve the level of satisfaction.
Figure 3: community satisfaction with assets
When asked about construction of new assets, most respondents indicated that it was very important or quite important to continue to construct all the type of assets Council provides (Figure 4). These findings will be utilised to target future capital works programs.
Figure 4: perceived importance of constructing new assets
The deliberative community forum incuded 102 ratepayers based on quotas set on age, gender, location and language spoken at home to reflect community make-up.
The forum focused on footpaths, local roads, stormwater drainage, kerb and gutters, community buildings, and parks and reserves. The community was presented with photographs representing each of the five condition levels for each asset type and feedback
was sought as to what they felt was an acceptable standard.
For each of the asset classes the community agreed that a condition rating between 2 and 4 was the acceptable standard.
Table 3: Community’s ‘acceptable’ condition rating
Asset Average Acceptable Condition Rating
Footpaths 2.7Local Roads 2.9Stormwater Drainage 2.5Kerbs and Gutters 2.5Buildings 2.7Parks and Reserves 2.6
This feedback will form the basis for future asset maintenance and renewal funding allocations. Deterioration models are used to determine the optimal amount of funding required for each asset class to maintain the assets at the average condition level determined by the community.
52 Georges River Council // Asset Management Plan 53

1.5 Future Demand
1.5.1 ForecastFactors affecting demand include population change, changes in demographics, seasonal factors, vehicle ownership, consumer preferences and expectations, economic factors and environmental awareness. Demand factor trends and impacts on service delivery are summarised in the table below Table 4: DEMAND FACTORS
Projection Impact on servicesPopulation151,569 (ABS estimated resident population), projected to be 181,146 by 2036
Increased users of road assets causing greater deterioration rates and more traffic.
Increased population, increased pressure on the ageing stormwater network.
Increased demand/usage of foreshore/marine structures.
Greater demand for public space and community services.
Potential increase in conflict and intrusion into personal space.
Increased demand for community services/facilities such as swimming pools and libraries.DemographicsIncrease in ageing population and migration
Changing cultural diversity
More working parents
Increased demand for footpath network linking public transport nodes, shopping areas, hospitals and community precincts. Increased demand for street lighting and a safer/more accessible footpath network.
Greater need for education programs regarding covering of drains and dumping into waterways and drains.
Change in park usage to suits visitation by adults with grandchildren and aged persons. Increased demand for more accessible spaces and park amenities.
Recreational facilities and services need to meet different cultural needs.
Increased demand for aged housing and related services.
Increased demand for child care facilities.Urban planning
Increase in higher density housing and development of the CBD areas
Increased users of road assets, e.g. More pedestrians on footpaths, more cars on roads, increased use of bicycles. Increased heavy vehicles on roads due to construction sites, particularly in cbd areas.
Greater impervious surfaces increases stormwater runoff volume, which adds to the pollutant load and increases pressure on the ageing stormwater network.
More people have less personal outdoor space, increasing use and demand for parks, outdoor public areas, dog leash-free areas and amenities.
People have less room for entertaining, increasing use of community-based facilities such as halls for functions.
Traffic volumesIncreased population and prosperity leading to more vehicles on roads.
Significant loading impact on roads and increased traffic congestion.
Environmental factorsPotential sea level rise and climate change impacts on foreshores and marine structures
Increased need for waterfront protection measures and modelling of potential impacts.
Changes to terrestrial and marine flora and fauna.
1.5.2 Changes in technologyTechnology changes are forecast to affect the delivery of services covered by this Plan. Table 5 details some examples where technology changes will affect the delivery of the services covered by this Plan.
Table 5: CHANGES IN TECHNOLOGY AND FORECAST EFFECT ON SERVICE DELIVERY
Technology Change Effect on Service Delivery
Change in road construction methods. use of existing road pavement materials for in-situ stabilisation reducing construction and disposal cost.
Relining and rehabilitation of pipes, rather than replacement.
This is an easier, more cost effective and less disruptive way of repairing a failed or failing pipe. It lowers the risks involved and saves time and money.
Increasing use of CCTV survey methods.
CCTV survey increases the amount of information for planning with less disruption.
Continued improvement and development of stormwater quality devices.
The new generation of stormwater quality devices are increasingly becoming more effective, cost efficient and require less maintenance.
Water Sensitive Urban Design. WSuD generally incurs a greater cost, but results in a better environmental outcome.
Development of improved/different materials which are less susceptible to environmental degradation.
Longer remaining life for marine structures and reduced maintenance costs for Council.
The use of stormwater harvesting infrastructure for park irrigation and on buildings to run amenities.
Reduces the use of potable water and saves on cost.
Energy efficient/solar lighting. Decreased running costs allowing for more lighting and make a safer environment for users.
Water efficient technology, such as shower heads and spring handle taps.
Decreases the amount of water wasted and the cost.
Changes in computing and telecommunications.
Impact on the design of buildings owned by Council.
Use of electronic asset data management systems for buildings (e.g. MEX).
This will allow for better management and more proactive maintenance. This will also act as a stock inventory as individual building components can be catalogued and then also valued.
New and cheaper/efficient construction/maintenance methodologies and materials.
More cost effective and more efficient construction/maintenance.
The increasing complexity of building management systems (BMA), e.g. remotely controlling buildings air-con, lighting, etc.
Allows for quicker and more accurate troubleshooting, also reducing turnaround time for rectification of faults. Allows for more efficient operation of buildings and reduces maintenance costs.
The increased use of solar power and bi-directional meters.
Decreased running costs and greater environmental sustainability of Council’s building portfolio.
54 Georges River Council // Asset Management Plan 55

1.5.3 Demand management planDemand for new services will be managed through a combination of managing existing assets, upgrading existing assets and providing new assets. Demand management practices include non-asset solutions, insuring against risks and managing failures.
Table 6 shows opportunities identified to date for demand management. Further opportunities will be developed in future revisions of this Asset Management Plan.
Table 6: DEMAND MANAGEMENT PLAN SuMMARY
Service activity Demand management plan
Roads asset category
Pedestrian access Pedestrian access and mobility plans.
Alternative modes of transport Bicycle network investigation studies.
Managing traffic and parking Local traffic/parking studies.
Stormwater asset category
Stormwater conveyance Floodplain risk management planning process.
Stormwater conveyance Local hydraulic surveys/studies.
Water quality improvement Estuary management plans, identifying new gross pollutant trap opportunities.
Water quality improvement Development application water quality management policy.
Parks & recreation asset category
Removal/renewal of park assets Risk and hazard assessment as per as:4360:2004.
Council parks and recreation risk management plan
Local hydraulic surveys/studies.
Removal/replacement of street trees GRC urban forest strategy (to be developed from former Street Tree Management Strategy and Master Plan).
The use and management of community land
Community land plans of management.
Redevelopment of parks and amenities Community surveys of park visitors and residents around park sites, assessing items such as lighting/safety, frequency of use, expectations etc.
Marine facilities Marine infrastructure asset management plan and speciality studies undertaken e.g. Kogarah bay boat ramp survey.
Foreshore structures Foreshore asset management plan, including a measure of social values.
Management of bushland areas. Biodiversity study.Bushland plans of management.
Service activity Demand management plan
Long-term planning of parks and recreation strategies.
Open Space and Recreation Strategy, Regional Leisure and Recreation Strategies, recreation survey report, aquatic facilities strategy and community land plans of management.
Buildings asset category
Professional management Manage properties to maximise commercial benefit to Council.
Reuse asset stock Highlight underutilised assets and either increase usage for maximum return, or retire the asset appropriately.
System of inspection Continuous system of inspection conducted at a minimum annually, the data from these inspections feeds into the rolling forward works program.
1.5.4 New assets from growthNew assets required to meet growth will be acquired from additional development and constructed by Council.
As the Georges River area has well-established assets, new assets from growth do not generally have a significant impact in relation to the current asset stock and subsequent asset management. However, redevelopment of land into higher density housing often provides the opportunity to upgrade existing streetscapes and install new or upgrade existing stormwater pipes and pits.
The new parks and recreation assets required to meet growth will be installed or constructed in existing parks and reserves or land purchased for additional parks and reserves. The purchase of land for conversion to provide additional public open space will be subject to Council’s Section 94A Plan, income generated from new development and the availability of suitable market real estate within the area of need.
Acquiring new assets will require us to fund ongoing operations and maintenance costs for the period that the service provided from the assets is required. The future costs are identified and considered in developing
56 Georges River Council // Asset Management Plan 57

forecasts of future operating and maintenance costs.
1.6 Lifecycle Management Plan The life cycle management plan details how we plan to manage and operate the assets at the agreed levels of service while optimising life cycle costs.
1.6.1 Background dataThe tables in Appendix 2 in conjunction with Charts in Section 1.6.2 detail the number, type and condition of our infrastructure assets.
The following figures identify the current replacement costs (CRC) and the age profile of Council’s major infrastructure assets.
Figure 5: AGE PROFILE – ROADS ASSET CATEGORY (ROAD BASE, SEAL, FOOTPATH AND KERB & GuTTER)
The age profile data for the roads asset category (Figure 5) appears to be in distinct groups, possibly due to the year acquired for some asset classes predominantly being calculated from remaining life (for example, kerb and gutter). This compares to road seal data, which is highly accurate and based on historical and current reseal data.
Figure 6: AGE PROFILE – STORMWATER ASSET CLASS
The age profile data for the stormwater asset category (Figure 6) indicates a large portion of the infrastructure was constructed between 1937 and 1957, indicating ageing stormwater pits and pipes. The small peak in the graph in 2002 indicates the installation of several larger stormwater quality devices, including Moore Reserve wetland.
We are updating our stormwater asset information in preparation for asset revaluation. These figures will be updated after revaluation.
Figure 7: AGE PROFILE –FORESHORE/MARINE INFRASTRuCTuRE ASSET CLASS
58 Georges River Council // Asset Management Plan 59
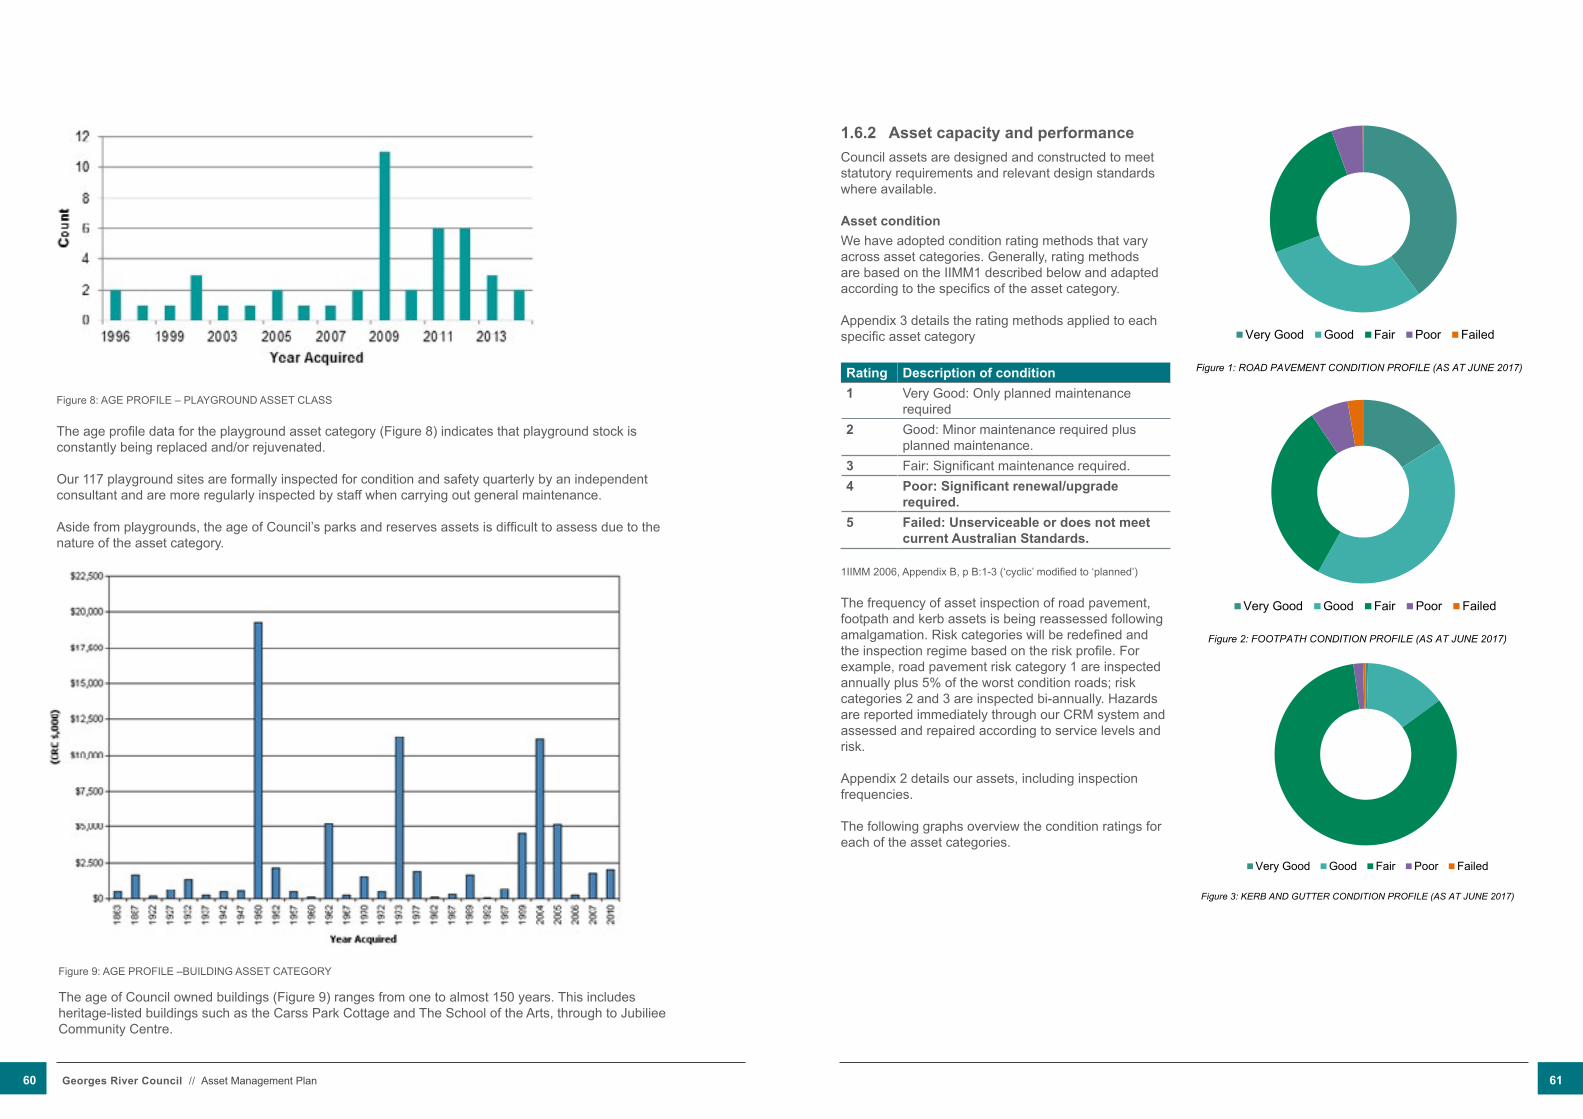
Figure 8: AGE PROFILE – PLAYGROUND ASSET CLASS
The age profile data for the playground asset category (Figure 8) indicates that playground stock is constantly being replaced and/or rejuvenated.
Our 117 playground sites are formally inspected for condition and safety quarterly by an independent consultant and are more regularly inspected by staff when carrying out general maintenance.
Aside from playgrounds, the age of Council’s parks and reserves assets is difficult to assess due to the nature of the asset category.
Figure 9: AGE PROFILE –BUILDING ASSET CATEGORY
The age of Council owned buildings (Figure 9) ranges from one to almost 150 years. This includes heritage-listed buildings such as the Carss Park Cottage and The School of the Arts, through to Jubiliee Community Centre.
1.6.2 Asset capacity and performance Council assets are designed and constructed to meet statutory requirements and relevant design standards where available.
Asset conditionWe have adopted condition rating methods that vary across asset categories. Generally, rating methods are based on the IIMM1 described below and adapted according to the specifics of the asset category.
Appendix 3 details the rating methods applied to each specific asset category
Rating Description of condition1 Very Good: Only planned maintenance
required2 Good: Minor maintenance required plus
planned maintenance.3 Fair: Significant maintenance required.4 Poor: Significant renewal/upgrade
required.5 Failed: Unserviceable or does not meet
current Australian Standards.
1IIMM 2006, Appendix B, p B:1-3 (‘cyclic’ modified to ‘planned’)
The frequency of asset inspection of road pavement, footpath and kerb assets is being reassessed following amalgamation. Risk categories will be redefined and the inspection regime based on the risk profile. For example, road pavement risk category 1 are inspected annually plus 5% of the worst condition roads; risk categories 2 and 3 are inspected bi-annually. Hazards are reported immediately through our CRM system and assessed and repaired according to service levels and risk.
Appendix 2 details our assets, including inspection frequencies.
The following graphs overview the condition ratings for each of the asset categories.
Figure 1: ROAD PAVEMENT CONDITION PROFILE (AS AT JUNE 2017)
Very Good Good Fair Poor Failed
Figure 2: FOOTPATH CONDITION PROFILE (AS AT JUNE 2017)
Very Good Good Fair Poor Failed
Figure 3: KERB AND GUTTER CONDITION PROFILE (AS AT JUNE 2017)
Very Good Good Fair Poor Failed
60 Georges River Council // Asset Management Plan 61
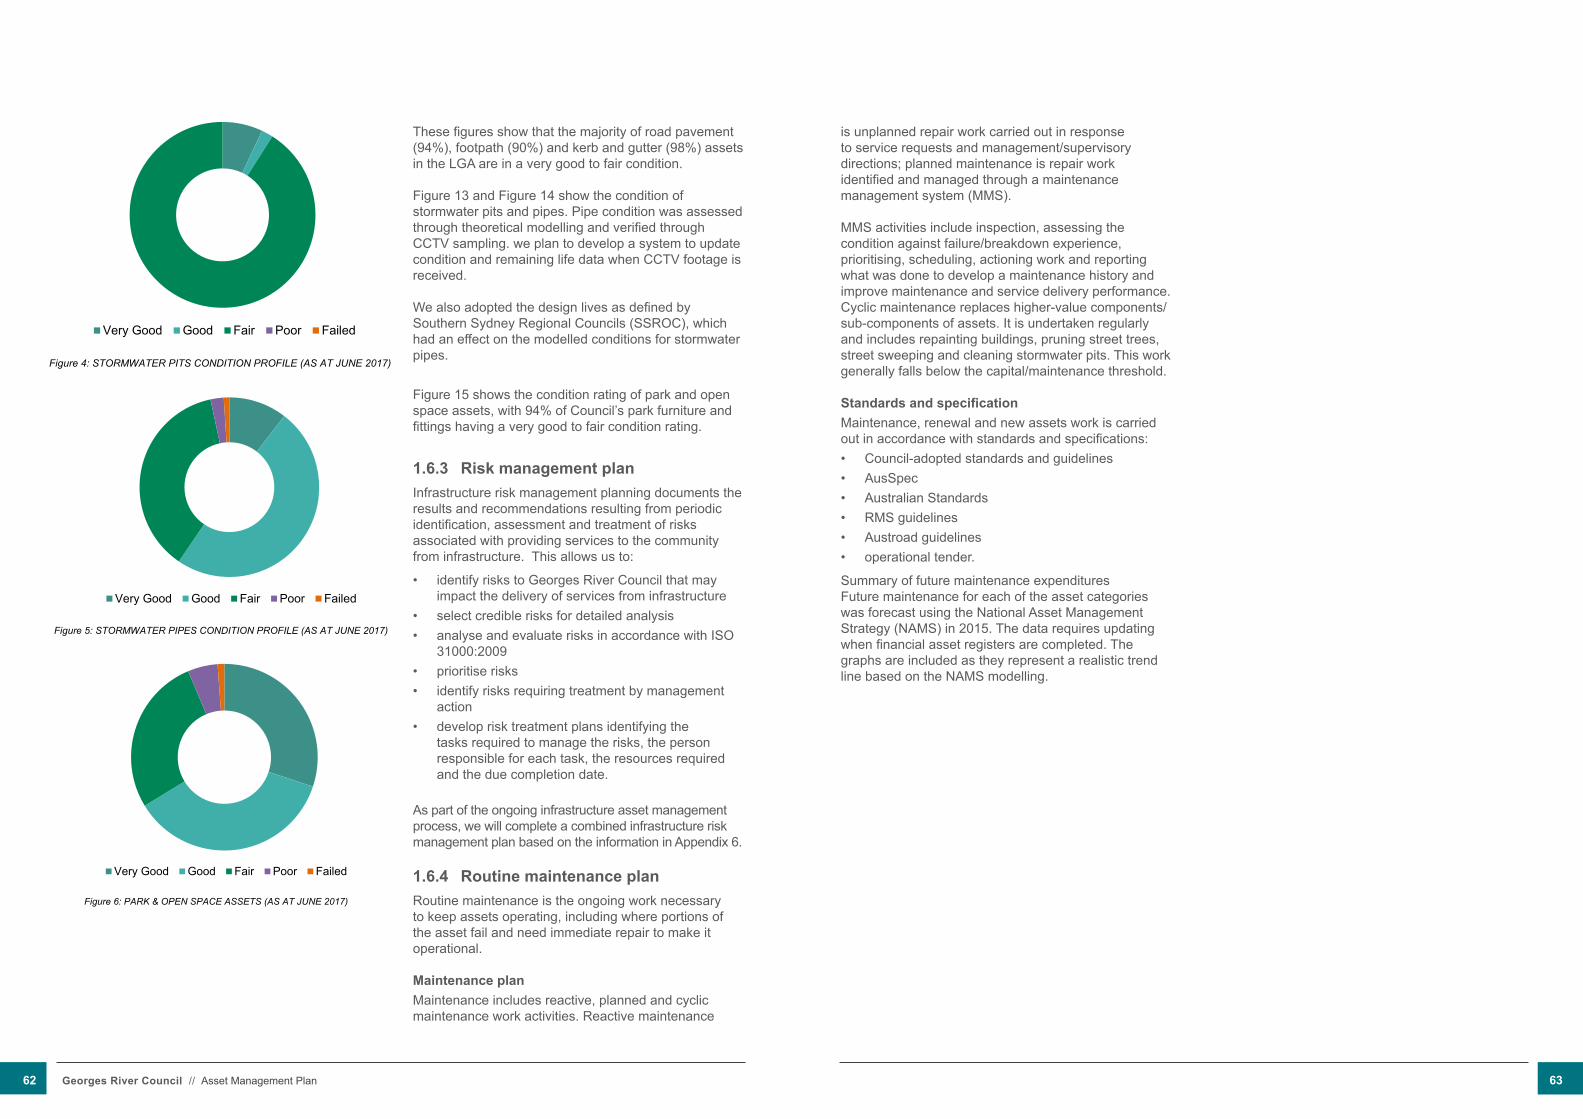
These figures show that the majority of road pavement (94%), footpath (90%) and kerb and gutter (98%) assets in the LGA are in a very good to fair condition.
Figure 13 and Figure 14 show the condition of stormwater pits and pipes. Pipe condition was assessed through theoretical modelling and verified through CCTV sampling. we plan to develop a system to update condition and remaining life data when CCTV footage is received.
We also adopted the design lives as defined by Southern Sydney Regional Councils (SSROC), which had an effect on the modelled conditions for stormwater pipes.
Figure 15 shows the condition rating of park and open space assets, with 94% of Council’s park furniture and fittings having a very good to fair condition rating.
1.6.3 Risk management planInfrastructure risk management planning documents the results and recommendations resulting from periodic identification, assessment and treatment of risks associated with providing services to the community from infrastructure. This allows us to:
• identify risks to Georges River Council that may impact the delivery of services from infrastructure
• select credible risks for detailed analysis• analyse and evaluate risks in accordance with ISO
31000:2009• prioritise risks• identify risks requiring treatment by management
action• develop risk treatment plans identifying the
tasks required to manage the risks, the person responsible for each task, the resources required and the due completion date.
As part of the ongoing infrastructure asset management process, we will complete a combined infrastructure risk management plan based on the information in Appendix 6.
1.6.4 Routine maintenance planRoutine maintenance is the ongoing work necessary to keep assets operating, including where portions of the asset fail and need immediate repair to make it operational.
Maintenance planMaintenance includes reactive, planned and cyclic maintenance work activities. Reactive maintenance
Figure 4: STORMWATER PITS CONDITION PROFILE (AS AT JUNE 2017)
Very Good Good Fair Poor Failed
Figure 5: STORMWATER PIPES CONDITION PROFILE (AS AT JUNE 2017)
Very Good Good Fair Poor Failed
Figure 6: PARK & OPEN SPACE ASSETS (AS AT JUNE 2017)
Very Good Good Fair Poor Failed
is unplanned repair work carried out in response to service requests and management/supervisory directions; planned maintenance is repair work identified and managed through a maintenance management system (MMS).
MMS activities include inspection, assessing the condition against failure/breakdown experience, prioritising, scheduling, actioning work and reporting what was done to develop a maintenance history and improve maintenance and service delivery performance. Cyclic maintenance replaces higher-value components/sub-components of assets. It is undertaken regularly and includes repainting buildings, pruning street trees, street sweeping and cleaning stormwater pits. This work generally falls below the capital/maintenance threshold.
Standards and specificationMaintenance, renewal and new assets work is carried out in accordance with standards and specifications:• Council-adopted standards and guidelines• AusSpec• Australian Standards• RMS guidelines• Austroad guidelines• operational tender.
Summary of future maintenance expendituresFuture maintenance for each of the asset categories was forecast using the National Asset Management Strategy (NAMS) in 2015. The data requires updating when financial asset registers are completed. The graphs are included as they represent a realistic trend line based on the NAMS modelling.
62 Georges River Council // Asset Management Plan 63
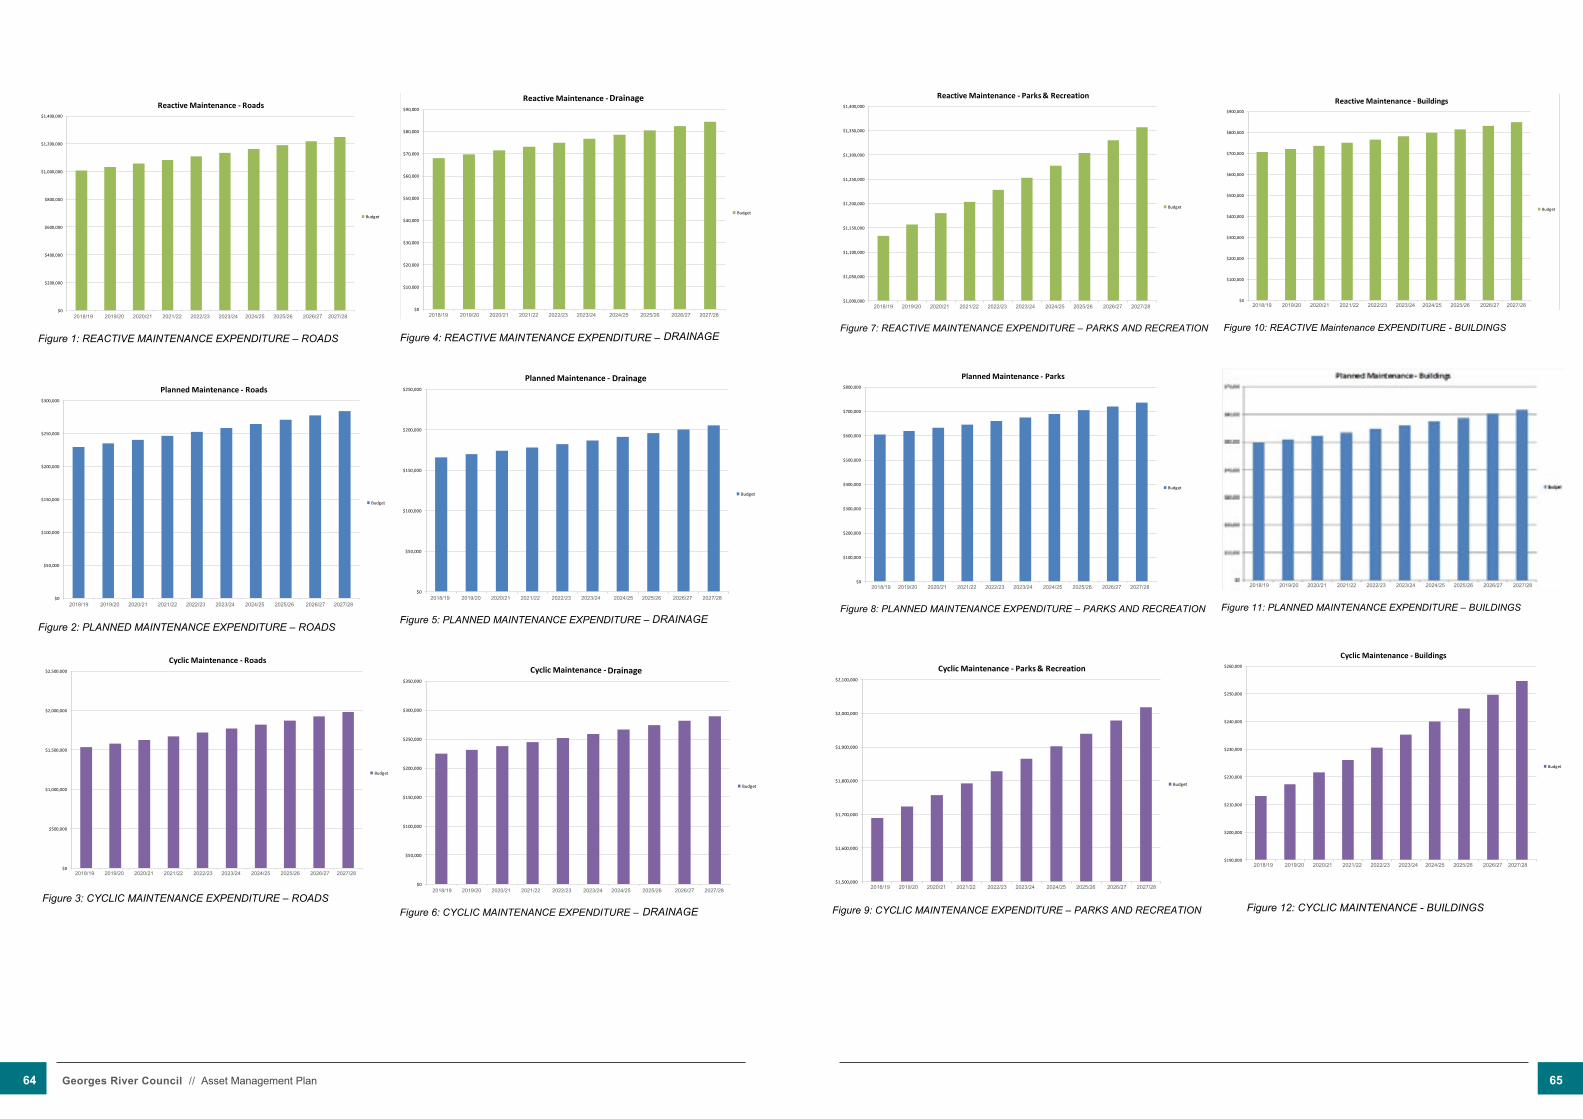
Figure 1: REACTIVE MAINTENANCE EXPENDITURE – ROADS
Figure 2: PLANNED MAINTENANCE EXPENDITURE – ROADS
$0
$200,000
$400,000
$600,000
$800,000
$1,000,000
$1,200,000
$1,400,000
2015/16 2016/17 2017/18 2018/19 2019/20 2020/21 2021/22 2022/23 2023/24 2024/25
Reactive Maintenance - Roads
Budget
$0
$50,000
$100,000
$150,000
$200,000
$250,000
$300,000
2015/16 2016/17 2017/18 2018/19 2019/20 2020/21 2021/22 2022/23 2023/24 2024/25
Planned Maintenance - Roads
Budget
Figure 3: CYCLIC MAINTENANCE EXPENDITURE – ROADS
Figure 4: REACTIVE MAINTENANCE EXPENDITURE – WATER
$0
$500,000
$1,000,000
$1,500,000
$2,000,000
$2,500,000
2015/16 2016/17 2017/18 2018/19 2019/20 2020/21 2021/22 2022/23 2023/24 2024/25
Cyclic Maintenance - Roads
Budget
$0
$10,000
$20,000
$30,000
$40,000
$50,000
$60,000
$70,000
$80,000
$90,000
2015/16 2016/17 2017/18 2018/19 2019/20 2020/21 2021/22 2022/23 2023/24 2024/25
Reactive Maintenance - Water
Budget
Figure 5: PLANNED MAINTENANCE EXPENDITURE – WATER
Figure 6: CYCLIC MAINTENANCE EXPENDITURE – WATER
$0
$50,000
$100,000
$150,000
$200,000
$250,000
2015/16 2016/17 2017/18 2018/19 2019/20 2020/21 2021/22 2022/23 2023/24 2024/25
Planned Maintenance - Water
Budget
$0
$50,000
$100,000
$150,000
$200,000
$250,000
$300,000
$350,000
2015/16 2016/17 2017/18 2018/19 2019/20 2020/21 2021/22 2022/23 2023/24 2024/25
Cyclic Maintenance - Water
Budget
Figure 7: REACTIVE MAINTENANCE EXPENDITURE – PARKS AND RECREATION
Figure 8: PLANNED MAINTENANCE EXPENDITURE – PARKS AND RECREATION
$1,000,000
$1,050,000
$1,100,000
$1,150,000
$1,200,000
$1,250,000
$1,300,000
$1,350,000
$1,400,000
2015/16 2016/17 2017/18 2018/19 2019/20 2020/21 2021/22 2022/23 2023/24 2024/25
Reactive Maintenance - Parks & Recreation
Budget
$0
$100,000
$200,000
$300,000
$400,000
$500,000
$600,000
$700,000
$800,000
2015/16 2016/17 2017/18 2018/19 2019/20 2020/21 2021/22 2022/23 2023/24 2024/25
Planned Maintenance - Parks
Budget
Figure 9: CYCLIC MAINTENANCE EXPENDITURE – PARKS AND RECREATION
Figure 10: REACTIVE Maintenance EXPENDITURE - BUILDINGS
$1,500,000
$1,600,000
$1,700,000
$1,800,000
$1,900,000
$2,000,000
$2,100,000
2015/16 2016/17 2017/18 2018/19 2019/20 2020/21 2021/22 2022/23 2023/24 2024/25
Cyclic Maintenance - Parks & Recreation
Budget
$0
$100,000
$200,000
$300,000
$400,000
$500,000
$600,000
$700,000
$800,000
$900,000
2015/16 2016/17 2017/18 2018/19 2019/20 2020/21 2021/22 2022/23 2023/24 2024/25
Reactive Maintenance - Buildings
Budget
Figure 11: PLANNED MAINTENANCE EXPENDITURE – BUILDINGS
$190,000
$200,000
$210,000
$220,000
$230,000
$240,000
$250,000
$260,000
2015/16 2016/17 2017/18 2018/19 2019/20 2020/21 2021/22 2022/23 2023/24 2024/25
Cyclic Maintenance - Buildings
Budget
2018/19 2019/20 2020/21 2021/22 2022/23 2023/24 2024/25 2025/26 2026/27 2027/28
2018/19 2019/20 2020/21 2021/22 2022/23 2023/24 2024/25 2025/26 2026/27 2027/28
2018/19 2019/20 2020/21 2021/22 2022/23 2023/24 2024/25 2025/26 2026/27 2027/28
2018/19 2019/20 2020/21 2021/22 2022/23 2023/24 2024/25 2025/26 2026/27 2027/28 2018/19 2019/20 2020/21 2021/22 2022/23 2023/24 2024/25 2025/26 2026/27 2027/28
2018/19 2019/20 2020/21 2021/22 2022/23 2023/24 2024/25 2025/26 2026/27 2027/28
2018/19 2019/20 2020/21 2021/22 2022/23 2023/24 2024/25 2025/26 2026/27 2027/28
2018/19 2019/20 2020/21 2021/22 2022/23 2023/24 2024/25 2025/26 2026/27 2027/28 2018/19 2019/20 2020/21 2021/22 2022/23 2023/24 2024/25 2025/26 2026/27 2027/28
Drainage
Drainage
Drainage
DRAINAGE
DRAINAGE
DRAINAGE
2018/19 2019/20 2020/21 2021/22 2022/23 2023/24 2024/25 2025/26 2026/27 2027/28
2018/19 2019/20 2020/21 2021/22 2022/23 2023/24 2024/25 2025/26 2026/27 2027/28
2018/19 2019/20 2020/21 2021/22 2022/23 2023/24 2024/25 2025/26 2026/27 2027/28
Figure 12: CYCLIC MAINTENANCE - BUILDINGS
64 Georges River Council // Asset Management Plan 65
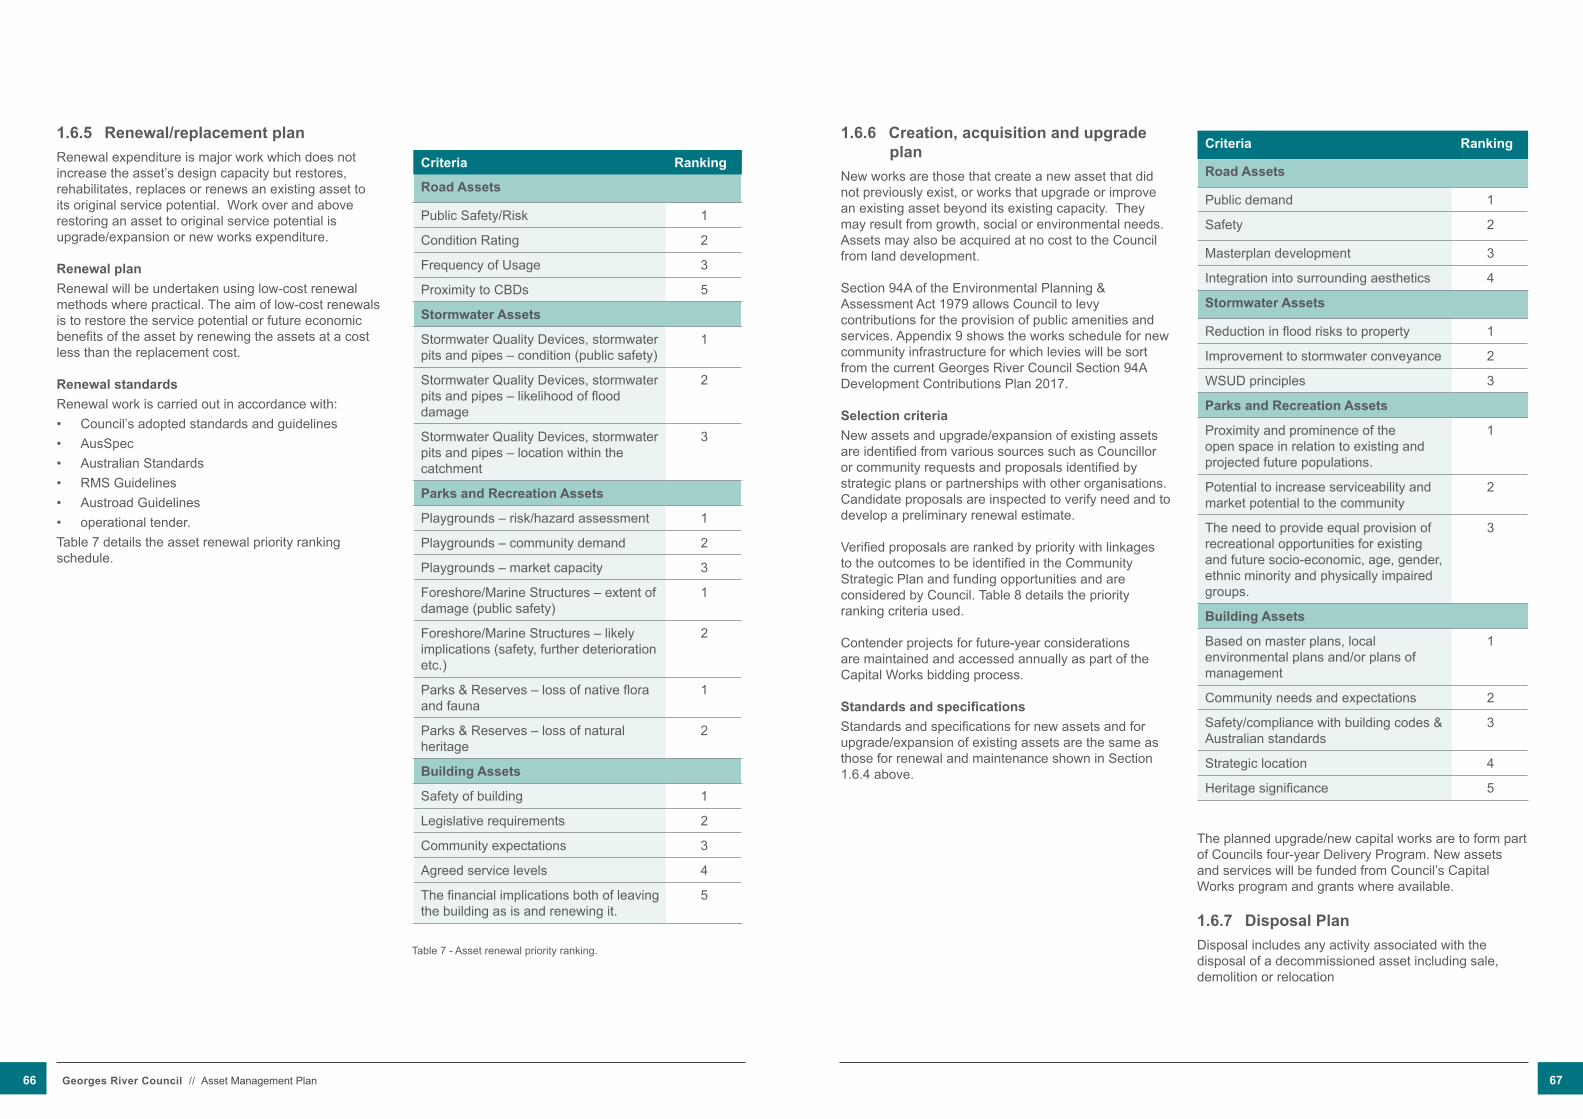
1.6.5 Renewal/replacement planRenewal expenditure is major work which does not increase the asset’s design capacity but restores, rehabilitates, replaces or renews an existing asset to its original service potential. Work over and above restoring an asset to original service potential is upgrade/expansion or new works expenditure.
Renewal planRenewal will be undertaken using low-cost renewal methods where practical. The aim of low-cost renewals is to restore the service potential or future economic benefits of the asset by renewing the assets at a cost less than the replacement cost.
Renewal standardsRenewal work is carried out in accordance with:• Council’s adopted standards and guidelines• AusSpec• Australian Standards• RMS Guidelines• Austroad Guidelines• operational tender.Table 7 details the asset renewal priority ranking schedule.
Criteria Ranking
Road Assets
Public Safety/Risk 1
Condition Rating 2
Frequency of usage 3
Proximity to CBDs 5
Stormwater Assets
Stormwater Quality Devices, stormwater pits and pipes – condition (public safety)
1
Stormwater Quality Devices, stormwater pits and pipes – likelihood of flood damage
2
Stormwater Quality Devices, stormwater pits and pipes – location within the catchment
3
Parks and Recreation Assets
Playgrounds – risk/hazard assessment 1
Playgrounds – community demand 2
Playgrounds – market capacity 3
Foreshore/Marine Structures – extent of damage (public safety)
1
Foreshore/Marine Structures – likely implications (safety, further deterioration etc.)
2
Parks & Reserves – loss of native flora and fauna
1
Parks & Reserves – loss of natural heritage
2
Building Assets
Safety of building 1
Legislative requirements 2
Community expectations 3
Agreed service levels 4
The financial implications both of leaving the building as is and renewing it.
5
1.6.6 Creation, acquisition and upgrade planNew works are those that create a new asset that did not previously exist, or works that upgrade or improve an existing asset beyond its existing capacity. They may result from growth, social or environmental needs. Assets may also be acquired at no cost to the Council from land development.
Section 94A of the Environmental Planning & Assessment Act 1979 allows Council to levy contributions for the provision of public amenities and services. Appendix 9 shows the works schedule for new community infrastructure for which levies will be sort from the current Georges River Council Section 94A Development Contributions Plan 2017.
Selection criteriaNew assets and upgrade/expansion of existing assets are identified from various sources such as Councillor or community requests and proposals identified by strategic plans or partnerships with other organisations. Candidate proposals are inspected to verify need and to develop a preliminary renewal estimate.
Verified proposals are ranked by priority with linkages to the outcomes to be identified in the Community Strategic Plan and funding opportunities and are considered by Council. Table 8 details the priority ranking criteria used.
Contender projects for future-year considerations are maintained and accessed annually as part of the Capital Works bidding process.
Standards and specificationsStandards and specifications for new assets and for upgrade/expansion of existing assets are the same as those for renewal and maintenance shown in Section 1.6.4 above.
Criteria Ranking
Road Assets
Public demand 1
Safety 2
Masterplan development 3
Integration into surrounding aesthetics 4
Stormwater Assets
Reduction in flood risks to property 1
Improvement to stormwater conveyance 2
WSuD principles 3
Parks and Recreation Assets
Proximity and prominence of the open space in relation to existing and projected future populations.
1
Potential to increase serviceability and market potential to the community
2
The need to provide equal provision of recreational opportunities for existing and future socio-economic, age, gender, ethnic minority and physically impaired groups.
3
Building Assets
Based on master plans, local environmental plans and/or plans of management
1
Community needs and expectations 2
Safety/compliance with building codes & Australian standards
3
Strategic location 4
Heritage significance 5
The planned upgrade/new capital works are to form part of Councils four-year Delivery Program. New assets and services will be funded from Council’s Capital Works program and grants where available.
1.6.7 Disposal PlanDisposal includes any activity associated with the disposal of a decommissioned asset including sale, demolition or relocation
Table 7 - Asset renewal priority ranking.
66 Georges River Council // Asset Management Plan 67
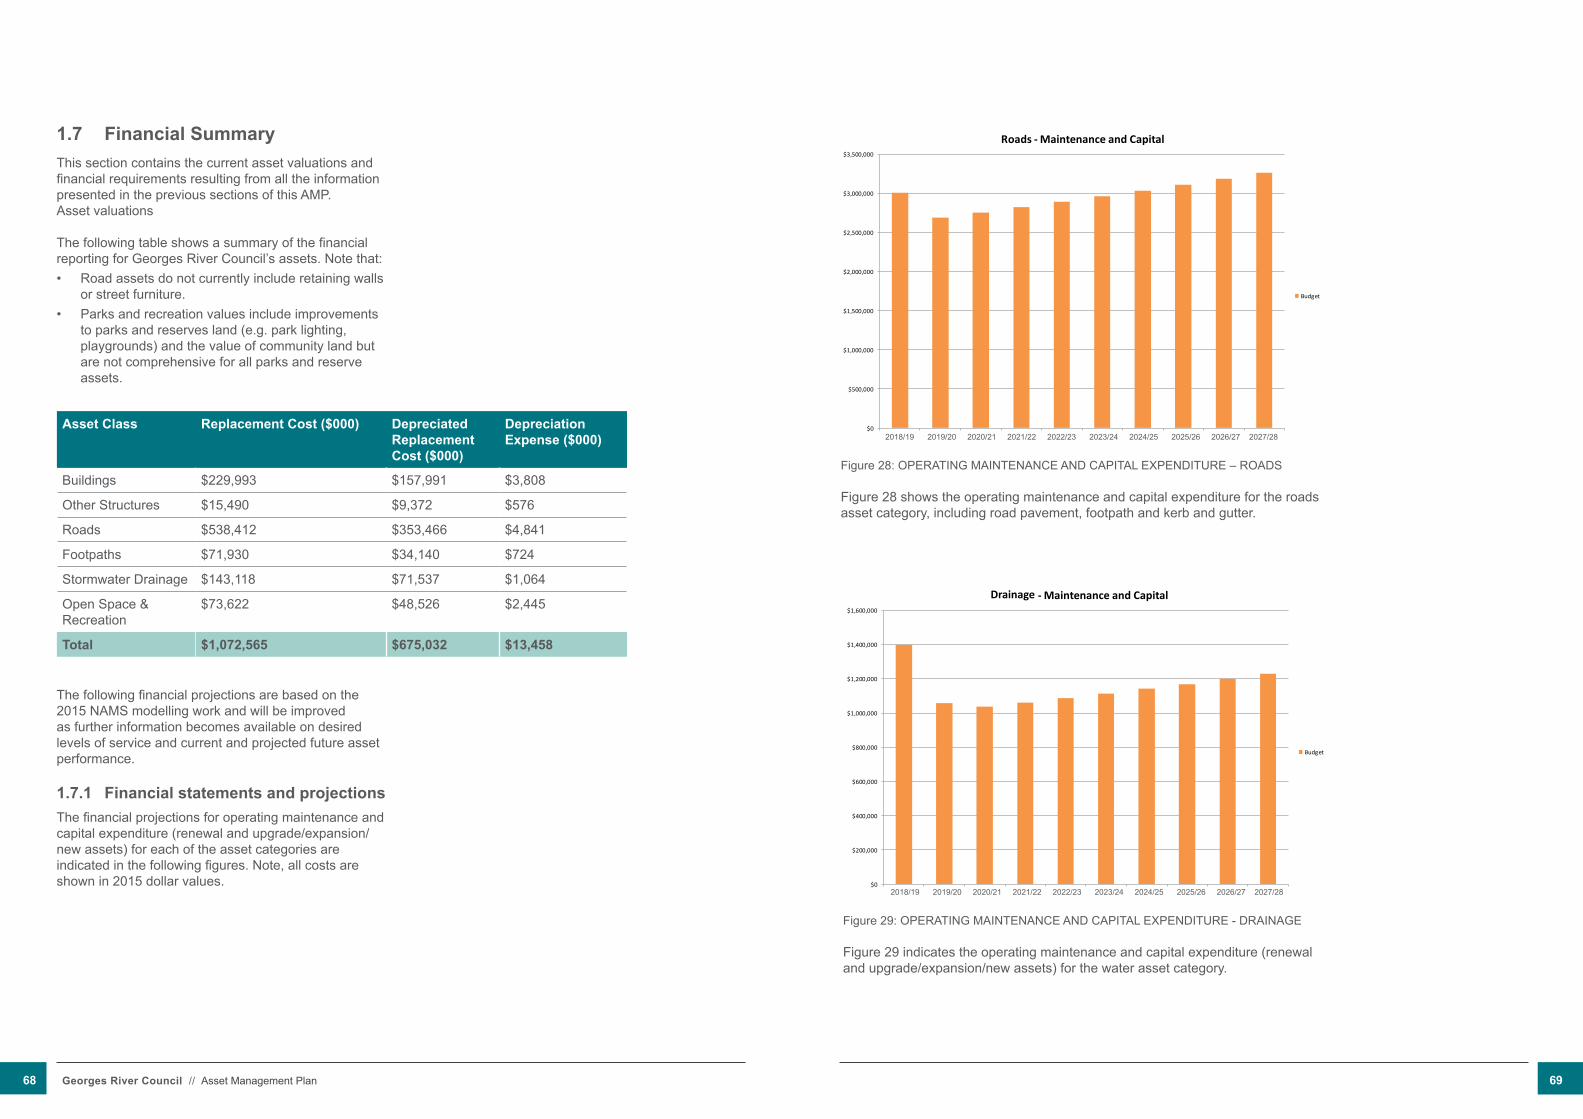
1.7 Financial Summary This section contains the current asset valuations and financial requirements resulting from all the information presented in the previous sections of this AMP. Asset valuations
The following table shows a summary of the financial reporting for Georges River Council’s assets. Note that:• Road assets do not currently include retaining walls
or street furniture. • Parks and recreation values include improvements
to parks and reserves land (e.g. park lighting, playgrounds) and the value of community land but are not comprehensive for all parks and reserve assets.
Asset Class Replacement Cost ($000) Depreciated Replacement Cost ($000)
Depreciation Expense ($000)
Buildings $229,993 $157,991 $3,808
Other Structures $15,490 $9,372 $576
Roads $538,412 $353,466 $4,841
Footpaths $71,930 $34,140 $724
Stormwater Drainage $143,118 $71,537 $1,064
Open Space & Recreation
$73,622 $48,526 $2,445
Total $1,072,565 $675,032 $13,458
The following financial projections are based on the 2015 NAMS modelling work and will be improved as further information becomes available on desired levels of service and current and projected future asset performance.
1.7.1 Financial statements and projectionsThe financial projections for operating maintenance and capital expenditure (renewal and upgrade/expansion/new assets) for each of the asset categories are indicated in the following figures. Note, all costs are shown in 2015 dollar values.
Figure 1: OPERATING MAINTENANCE AND CAPITAL EXPENDITURE – ROADS
Figure 1 shows the operating maintenance and capital expenditure for the roads asset category, including road pavement, footpath and kerb and gutter.
Figure 2: OPERATING MAINTENANCE AND CAPITAL EXPENDITURE - WATER
Figure 2 indicates the operating maintenance and capital expenditure (renewal and upgrade/expansion/new assets) for the water asset category.
$0
$500,000
$1,000,000
$1,500,000
$2,000,000
$2,500,000
$3,000,000
$3,500,000
2015/16 2016/17 2017/18 2018/19 2019/20 2020/21 2021/22 2022/23 2023/24 2024/25
Roads - Maintenance and Capital
Budget
$0
$200,000
$400,000
$600,000
$800,000
$1,000,000
$1,200,000
$1,400,000
$1,600,000
2015/16 2016/17 2017/18 2018/19 2019/20 2020/21 2021/22 2022/23 2023/24 2024/25
Water - Maintenance and Capital
Budget
Figure 28: OPERATING MAINTENANCE AND CAPITAL EXPENDITURE – ROADS
Figure 28 shows the operating maintenance and capital expenditure for the roads asset category, including road pavement, footpath and kerb and gutter.
Figure 29: OPERATING MAINTENANCE AND CAPITAL EXPENDITuRE - DRAINAGE
Figure 29 indicates the operating maintenance and capital expenditure (renewal and upgrade/expansion/new assets) for the water asset category.
Drainage
2018/19 2019/20 2020/21 2021/22 2022/23 2023/24 2024/25 2025/26 2026/27 2027/28
2018/19 2019/20 2020/21 2021/22 2022/23 2023/24 2024/25 2025/26 2026/27 2027/28
68 Georges River Council // Asset Management Plan 69
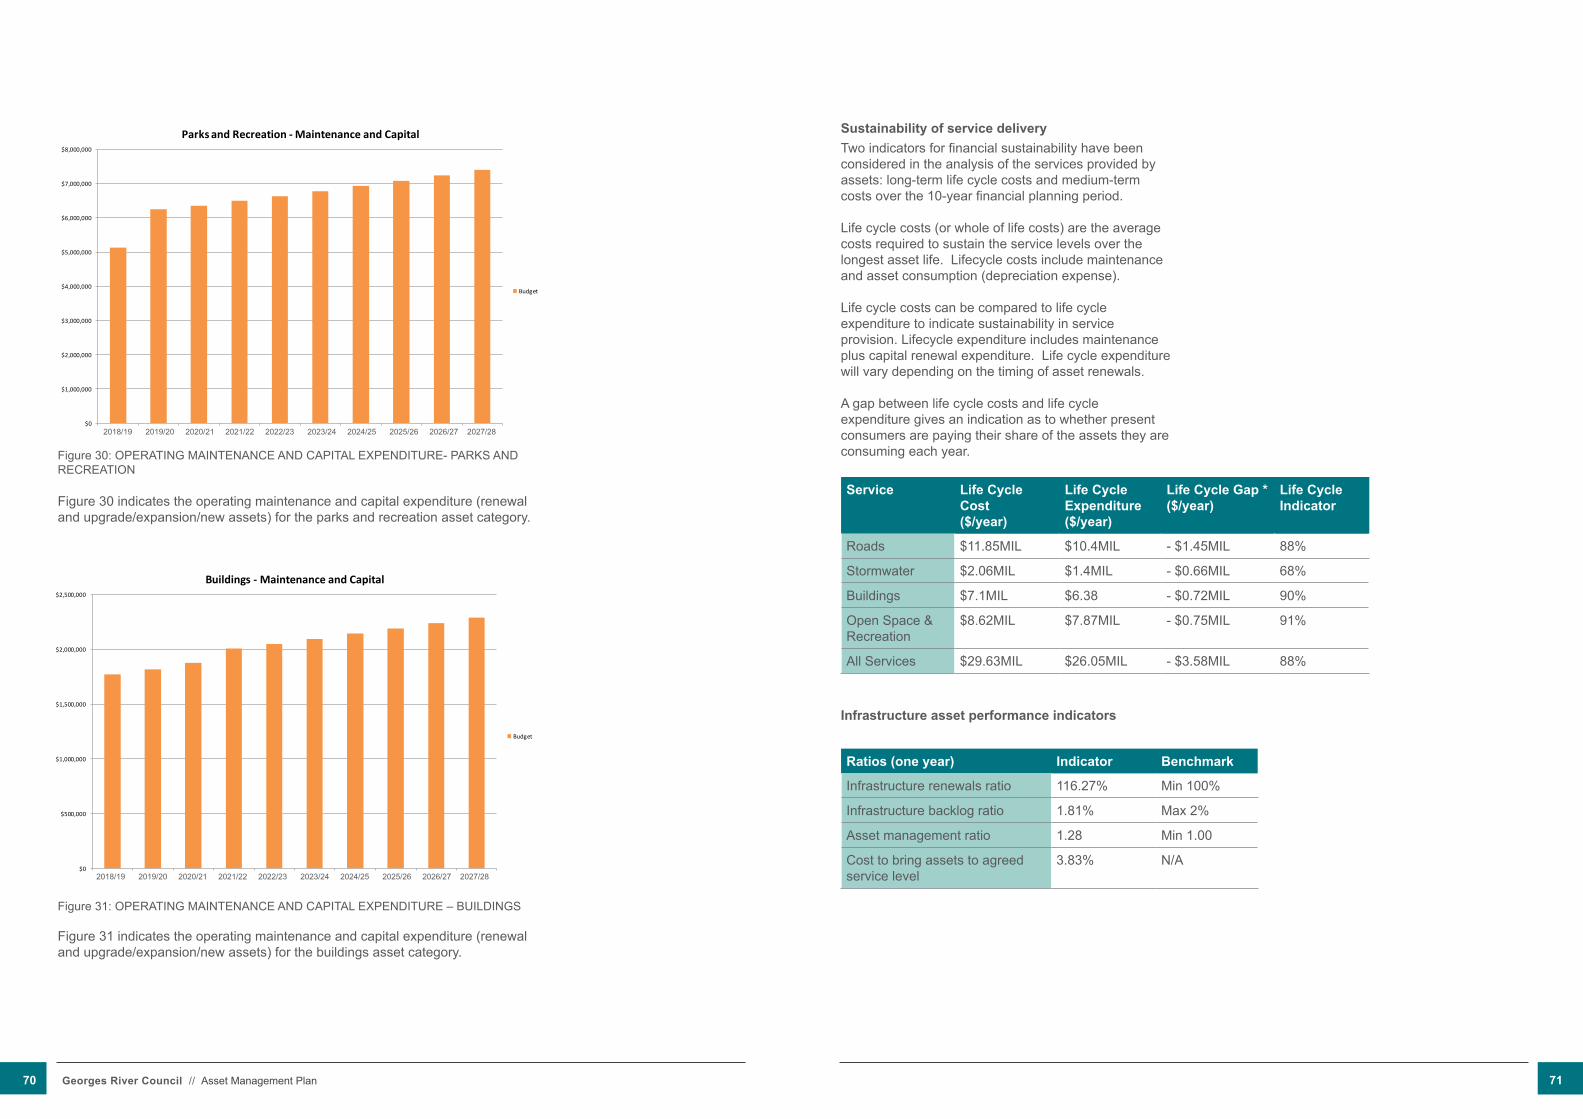
Figure 3: OPERATING MAINTENANCE AND CAPITAL EXPENDITURE- PARKS AND RECREATION
Figure 3 indicates the operating maintenance and capital expenditure (renewal and upgrade/expansion/new assets) for the parks and recreation asset category.
Figure 4: OPERATING MAINTENANCE AND CAPITAL EXPENDITURE – BUILDINGS
Figure 4 indicates the operating maintenance and capital expenditure (renewal and upgrade/expansion/new assets) for the buildings asset category.
$0
$1,000,000
$2,000,000
$3,000,000
$4,000,000
$5,000,000
$6,000,000
$7,000,000
$8,000,000
2015/16 2016/17 2017/18 2018/19 2019/20 2020/21 2021/22 2022/23 2023/24 2024/25
Parks and Recreation - Maintenance and Capital
Budget
$0
$500,000
$1,000,000
$1,500,000
$2,000,000
$2,500,000
2015/16 2016/17 2017/18 2018/19 2019/20 2020/21 2021/22 2022/23 2023/24 2024/25
Buildings - Maintenance and Capital
Budget
Figure 30: OPERATING MAINTENANCE AND CAPITAL EXPENDITuRE- PARKS AND RECREATION
Figure 30 indicates the operating maintenance and capital expenditure (renewal and upgrade/expansion/new assets) for the parks and recreation asset category.
Figure 31: OPERATING MAINTENANCE AND CAPITAL EXPENDITURE – BUILDINGS
Figure 31 indicates the operating maintenance and capital expenditure (renewal and upgrade/expansion/new assets) for the buildings asset category.
Sustainability of service deliveryTwo indicators for financial sustainability have been considered in the analysis of the services provided by assets: long-term life cycle costs and medium-term costs over the 10-year financial planning period.
Life cycle costs (or whole of life costs) are the average costs required to sustain the service levels over the longest asset life. Lifecycle costs include maintenance and asset consumption (depreciation expense).
Life cycle costs can be compared to life cycle expenditure to indicate sustainability in service provision. Lifecycle expenditure includes maintenance plus capital renewal expenditure. Life cycle expenditure will vary depending on the timing of asset renewals.
A gap between life cycle costs and life cycle expenditure gives an indication as to whether present consumers are paying their share of the assets they are consuming each year.
Service Life Cycle Cost ($/year)
Life Cycle Expenditure ($/year)
Life Cycle Gap * ($/year)
Life Cycle Indicator
Roads $11.85MIL $10.4MIL - $1.45MIL 88%
Stormwater $2.06MIL $1.4MIL - $0.66MIL 68%
Buildings $7.1MIL $6.38 - $0.72MIL 90%
Open Space & Recreation
$8.62MIL $7.87MIL - $0.75MIL 91%
All Services $29.63MIL $26.05MIL - $3.58MIL 88%
Infrastructure asset performance indicators
Ratios (one year) Indicator Benchmark
Infrastructure renewals ratio 116.27% Min 100%
Infrastructure backlog ratio 1.81% Max 2%
Asset management ratio 1.28 Min 1.00
Cost to bring assets to agreed service level
3.83% N/A
2018/19 2019/20 2020/21 2021/22 2022/23 2023/24 2024/25 2025/26 2026/27 2027/28
2018/19 2019/20 2020/21 2021/22 2022/23 2023/24 2024/25 2025/26 2026/27 2027/28
70 Georges River Council // Asset Management Plan 71

Medium-term – 10-year financial planning periodThis Asset Management Plan identifies the estimated maintenance and capital expenditures required to provide an agreed level of service to the community over a 20-year period for input into a 10-year financial plan and funding plan to provide the service in a sustainable manner.
This may be compared to existing or planned expenditures in the 20-year period to identify any gap. In a core asset management plan, a gap is generally due to increasing asset renewals. Providing services in a sustainable manner will require us to match projected asset renewals to meet agreed service levels with planned capital works programs and available revenue.
A gap between projected asset renewals, planned asset renewals and funding indicates that further work is required to manage required service levels and funding to eliminate any funding gap.
We use this AMP to address the gap and guide future service levels and resources required to provide these services.
Council’s Long-Term Financial Plan covers the first 10 years of the 20-year planning period.
1.7.2 Funding strategyProjected expenditure will be funded from Council’s operating and capital budgets. The funding strategy is detailed in the Long-Term Financial Plan.
1.7.3 Valuation forecastsAsset values are forecast to increase as additional assets are added to the asset stock from construction and acquisition by Council and from assets constructed by land developers and others and donated to Council.
The depreciation expense is increasing due to the new assets created. Each of these new assets will have an associated depreciation cost that aggregates to increase the total depreciation to Council. The depreciated replacement cost (current replacement cost less accumulated depreciation) will vary over the forecast period depending on the rates of addition of new assets, disposal of old assets and consumption and renewal of existing assets.
Depreciated replacement costs show the value of the assets. A decline in value currently indicates that the
consumption (or depreciation) is occurring at a greater rate than the assets are being renewed.
1.7.4 Assumptions By presenting the assumptions made in this AMP and in preparing forecasts of required operating and capital expenditure and asset values, depreciation expense and carrying amount estimates, we can provide an understanding of the levels of confidence in the data behind the financial forecasts.
Key assumptions made in this AMP are:• No substantial increase in asset stock.
• Future financial forecasts are based on stable price increases in accordance with RBA forecasts for price growth.
• Technology in delivery of new infrastructure and maintenance of existing infrastructure will not substantially change over the forward estimates.
• Service level expectations of the community will not change substantially over the forward estimates.
• The population growth will not be significantly different to the population estimates determined by the state government plan.
• Accuracy of future financial forecasts may be improved in future revisions of this AMP by:
• More detailed information on asset classes e.g. park furniture, street furniture.
• Inclusion of all asset classes into financial forecasting.
• More detailed long-term modelling for capital works spending.
• Increased accuracy of condition monitoring.
1.8 Asset Management Practices 1.8.1 Accounting/financial systemsCouncil uses Tech-One software that has the capacity to record financial transactions, and units of work and where they occur.
Council managers maintain their own budgets, including the setup of job numbers according to maintenance and capital and the processing of invoices against these budgets. Managers and the Asset’s Engineer provide valuation information to Council’s Finance officers, who use this information to update accounting records and produce the annual financial reports.
The following accounting guidelines and standards are
applicable to asset management practices:• AASB 116 – Property, Plant & Equipment
• AASB 136 – Impairment of Assets
• AASB 138 – Intangible Assets
• AASB 140 – Investment Properties
• AASB 1031 – Materiality
• AASB 1051 – Land under Roads
1.8.2 Asset management systems• Asset Register
• Customer Request Management System
• Electronic Document Management: TRIM is Council’s electronic document management system. It is widely used throughout the organisation as the primary records management system. It contains all appropriate written correspondence, either sent or received by Council. TRIM is similar to Council’s CRM for all written requests concerning an asset related issue. Tasks can be assigned to appropriate staff and the actions, dates and comments recorded.
1.8.3 Information Flow Requirements and ProcessesThe key information flows into this AMP are the:• asset register data including size, age, value and
remaining life of the network.
• unit rates for categories of work/material.
• adopted service levels.
• projections of various factors affecting future demand for services.
• correlations between maintenance and renewal, including decay models.
• data on new assets acquired by Council.
• The key information flows from this AMP are the:
• assumed works program and trends.
• resulting budget, valuation and depreciation projections.
• useful life analysis.
These impact the Long-Term Financial Plan, Strategic Business Plan, annual budget and departmental business plans and budgets.
The recognition of new assets and capitalisation process starts with asset managers using the budgeting process to identify the distinction between capital and operating expenditure. Council then uses the project costing module in Authority to monitor the cost of new assets during the financial year; Council’s Finance section uses the project costing data to update the asset database with all new capitalised assets; and this information informs annual financial reports.
1.8.4 Standards and guidelinesCouncil has adopted an Asset Management Policy and Strategy. Refer Appendix 1
72 Georges River Council // Asset Management Plan 73
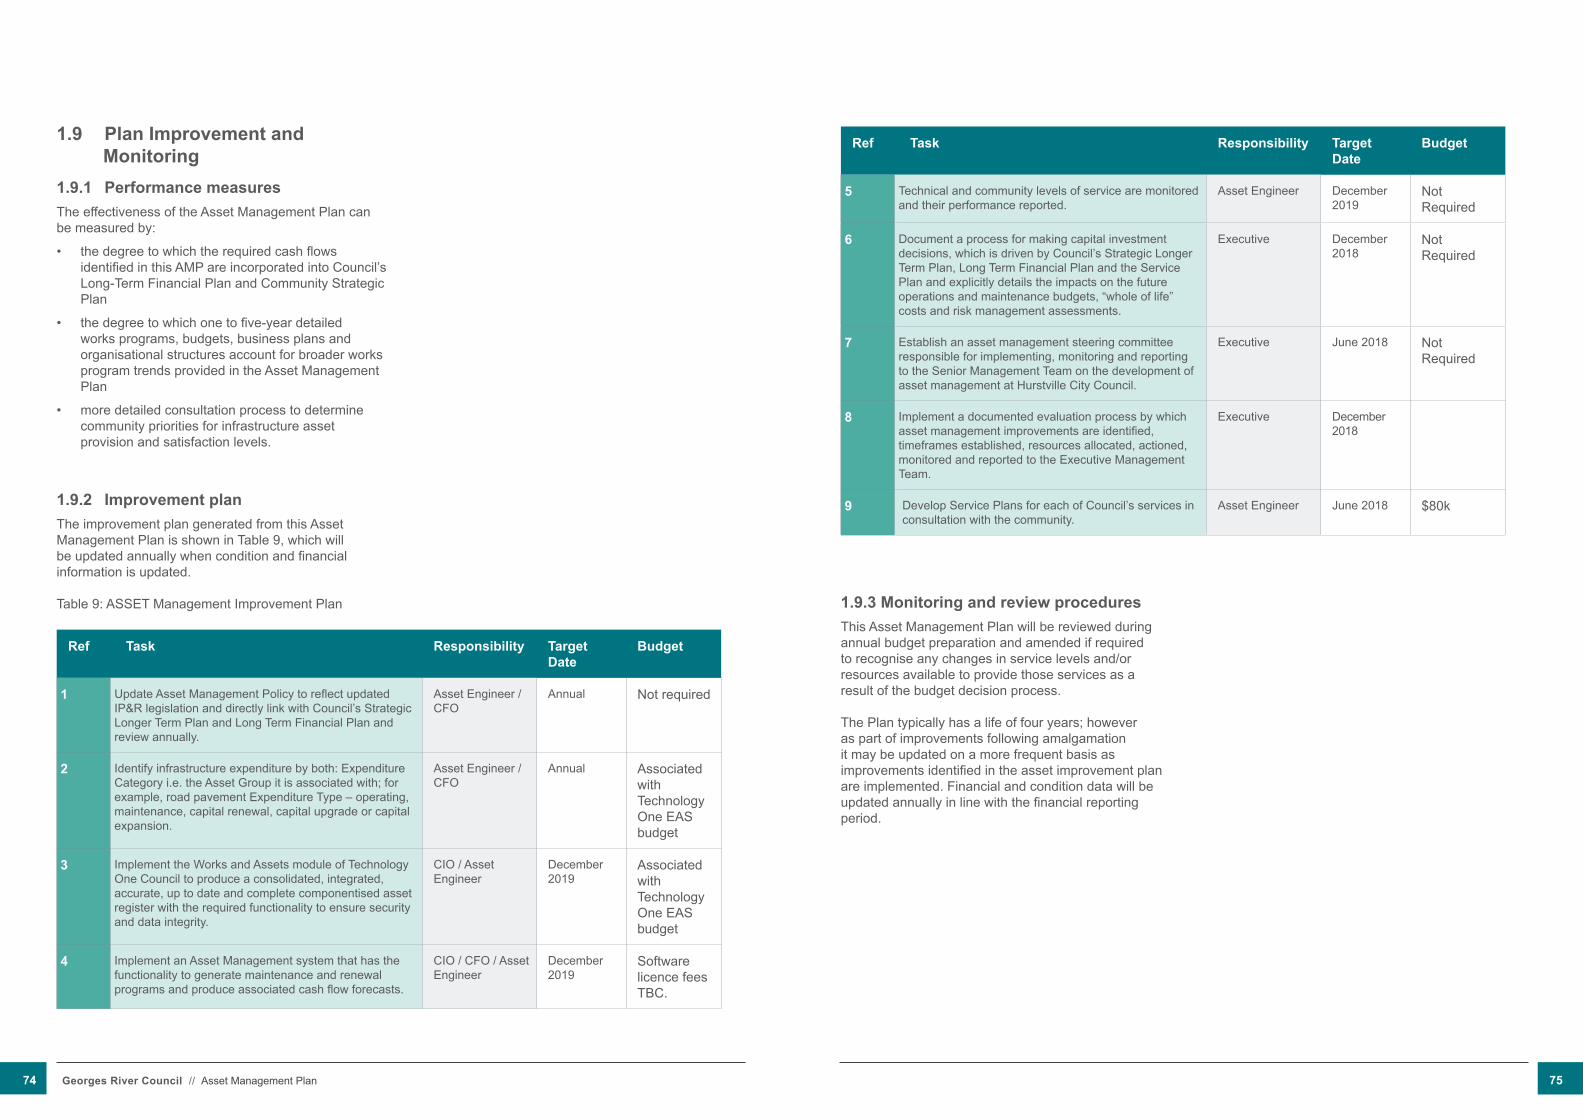
1.9 Plan Improvement and Monitoring 1.9.1 Performance measuresThe effectiveness of the Asset Management Plan can be measured by:
• the degree to which the required cash flows identified in this AMP are incorporated into Council’s Long-Term Financial Plan and Community Strategic Plan
• the degree to which one to five-year detailed works programs, budgets, business plans and organisational structures account for broader works program trends provided in the Asset Management Plan
• more detailed consultation process to determine community priorities for infrastructure asset provision and satisfaction levels.
1.9.2 Improvement planThe improvement plan generated from this Asset Management Plan is shown in Table 9, which will be updated annually when condition and financial information is updated.
Table 9: ASSET Management Improvement Plan
Ref Task Responsibility Target Date
Budget
1 Update Asset Management Policy to reflect updated IP&R legislation and directly link with Council’s Strategic Longer Term Plan and Long Term Financial Plan and review annually.
Asset Engineer / CFO
Annual Not required
2 Identify infrastructure expenditure by both: Expenditure Category i.e. the Asset Group it is associated with; for example, road pavement Expenditure Type – operating, maintenance, capital renewal, capital upgrade or capital expansion.
Asset Engineer / CFO
Annual Associated with Technology One EAS budget
3 Implement the Works and Assets module of Technology One Council to produce a consolidated, integrated, accurate, up to date and complete componentised asset register with the required functionality to ensure security and data integrity.
CIO / Asset Engineer
December 2019
Associated with Technology One EAS budget
4 Implement an Asset Management system that has the functionality to generate maintenance and renewal programs and produce associated cash flow forecasts.
CIO / CFO / Asset Engineer
December 2019
Software licence fees TBC.
Ref Task Responsibility Target Date
Budget
5 Technical and community levels of service are monitored and their performance reported.
Asset Engineer December 2019
Not Required
6 Document a process for making capital investment decisions, which is driven by Council’s Strategic Longer Term Plan, Long Term Financial Plan and the Service Plan and explicitly details the impacts on the future operations and maintenance budgets, “whole of life” costs and risk management assessments.
Executive December 2018
Not Required
7 Establish an asset management steering committee responsible for implementing, monitoring and reporting to the Senior Management Team on the development of asset management at Hurstville City Council.
Executive June 2018 Not Required
8 Implement a documented evaluation process by which asset management improvements are identified, timeframes established, resources allocated, actioned, monitored and reported to the Executive Management Team.
Executive December 2018
9 Develop Service Plans for each of Council’s services in consultation with the community.
Asset Engineer June 2018 $80k
1.9.3 Monitoring and review proceduresThis Asset Management Plan will be reviewed during annual budget preparation and amended if required to recognise any changes in service levels and/or resources available to provide those services as a result of the budget decision process.
The Plan typically has a life of four years; however as part of improvements following amalgamation it may be updated on a more frequent basis as improvements identified in the asset improvement plan are implemented. Financial and condition data will be updated annually in line with the financial reporting period.
74 Georges River Council // Asset Management Plan 75

1.10 References Georges River Council Asset Management Policy
Georges River Council Asset Management Strategy - August 2016
Georges River Council, Section 94 Contribution Plans
IPWEA, 2015, ‘International Infrastructure Management Manual’,
Institute of Public Works Engineering Australia, Sydney, www.ipwea.org.au
1.11 Abbreviations AAAC Average Annual Asset Consumption
AMP Asset Management Plan
ARI Average Recurrence Interval
BOD Biochemical (biological) Oxygen Demand
CRC Current Replacement Cost
CWMS Community Wastewater Management Systems
DA Depreciable Amount
DoH Department of Health
EF Earthworks/Formation
GIS Geographic Information System
IRMP Infrastructure Risk Management Plan
LCC Life Cycle Cost
LCE Life Cycle Expenditure
LEP Local Environmental Plan
LGA Local Government Area
MMS Maintenance Management System
PCI Pavement Condition Index
RTA Roads & Traffic Authority
RV Residual Value
SS Suspended Solids
vph Vehicles Per Hour
1.12 Glossary Annual service cost (ASC): An estimate of the cost that would be tendered, per annum, if tenders were called for the supply of a service to a performance specification for a fixed term. The Annual Service Cost includes operating, maintenance, depreciation, finance/opportunity and disposal costs, less revenue.
Asset class: Grouping of assets of a similar nature and use in an entity's operations (AASB 166.37).
Asset condition assessment: The process of continuous or periodic inspection, assessment, measurement and interpretation of the resultant data to indicate the condition of a specific asset so as to determine the need for some preventative or remedial action.
Asset management: The combination of management, financial, economic, engineering and other practices applied to physical assets with the objective of providing the required level of service in the most cost effective manner.
Assets: Future economic benefits controlled by the entity as a result of past transactions or other past events (AAS27.12). Property, plant and equipment including infrastructure and other assets (such as furniture and fittings) with benefits expected to last more than 12 months.
Asset Hierarchy: A framework in which components of an asset base are allocated appropriate classifications, determined by asset functionality or type. The hierarchy classifications are:• Category – the highest level at which assets are
grouped according to function, and being the title of each of the suite of Asset Management Plans e.g. ROADS.
• Class - the overall asset type, e.g. KERB.Element - sub-classification of Class, e.g. BRICK KERB.
• Asset (Individual) - item or segment to which a unique identifier has been assigned, e.g. KERB & GuTTER, NORTH SIDE, JONES STREET, Brown Street to White Street, ID 9999.
Average Annual Asset Consumption (AAAC): The amount of a local government’s asset base consumed during a year. This may be calculated by dividing the Depreciable Amount (DA) by the useful Life and totalled for each and every asset OR by dividing the Fair Value (Depreciated Replacement Cost) by the Remaining Life and totalled for each and every asset in an asset category or class.
Component: individual part of an asset which contributes to the composition of the whole and can be separated from or attached to an asset or a system.Brownfield asset values. Asset (re)valuation values based on the cost to replace the asset including demolition and restoration costs.
Capital expansion expenditure: Expenditure that extends an existing asset, at the same standard as is currently enjoyed by residents, to a new group of users. It is discretional expenditure, which increases future operating and maintenance costs, because it increases Council’s asset base, but may be associated with additional revenue from the new user group, e.g. extending a drainage or road network, the provision of an oval or park in a new suburb for new residents.
Capital expenditure: Relatively large (material) expenditure, which has benefits, expected to last for more than 12 months. Capital expenditure includes renewal, expansion and upgrade. Where capital projects involve a combination of renewal, expansion and/or upgrade expenditures, the total project cost needs to be allocated accordingly.
Capital funding: Funding to pay for capital expenditure.
Capital grants: Monies received generally tied to the specific projects for which they are granted, which are often upgrade and/or expansion or new investment proposals.
Capital investment expenditure: See capital expenditure definition.
Capital new expenditure: Expenditure which creates a new asset providing a new service to the community that did not exist beforehand. As it increases service potential it may impact revenue and will increase future operating and maintenance expenditure.
Capital renewal expenditure: Expenditure on an existing asset, which returns the service potential or the life of the asset up to that which it had originally. It is periodically required expenditure, relatively large (material) in value compared with the value of the components or sub-components of the asset being renewed. As it reinstates existing service potential, it has no impact on revenue, but may reduce future operating and maintenance expenditure if completed at the optimum time, e.g. resurfacing or resheeting a material part of a road network, replacing a material section of a drainage network with pipes of the same capacity, resurfacing an oval. Where capital projects involve a combination of renewal, expansion and/or upgrade expenditures, the total project cost needs to be allocated accordingly.
76 Georges River Council // Asset Management Plan 77

Capital upgrade expenditure: Expenditure, which enhances an existing asset to provide a higher level of service or expenditure that will increase the life of the asset beyond that which it had originally. upgrade expenditure is discretional and often does not result in additional revenue unless direct user charges apply. It will increase operating and maintenance expenditure in the future because of the increase in the Council’s asset base, e.g. widening the sealed area of an existing road, replacing drainage pipes with pipes of a greater capacity, enlarging a grandstand at a sporting facility. Where capital projects involve a combination of renewal, expansion and/or upgrade expenditures, the total project cost needs to be allocated accordingly.
Carrying amount: The amount at which an asset is recognised after deducting any accumulated depreciation/amortisation and accumulated impairment losses thereon.
Class of assets: See asset hierarchy definition.Component: See asset hierarchy definition.
Cost of an asset: The amount of cash or cash equivalents paid or the fair value of the consideration given to acquire an asset at the time of its acquisition or construction, plus any costs necessary to place the asset into service. This includes one-off design and project management costs.
Current Replacement Cost (CRC): The cost Council would incur to acquire the asset on the reporting date. The cost is measured by reference to the lowest cost at which the gross future economic benefits could be obtained in the normal course of business or the minimum it would cost, to replace the existing asset with a technologically modern equivalent new asset (not a second hand one) with the same economic benefits (gross service potential) allowing for any differences in the quantity and quality of output and in operating costs.
Current Replacement Cost “As New” (CRC): The current cost of replacing the original service potential of an existing asset, with a similar modern equivalent asset, i.e. the total cost of replacing an existing asset with an as NEW or similar asset expressed in current dollar values.
Cyclic maintenance: Replacement of higher value components/sub-components of assets that is undertaken on a regular cycle including repainting, road cleaning, replacement of air conditioning equipment, etc. This work generally falls below the capital/maintenance threshold and needs to be identified in a specific maintenance budget allocation.
Depreciable amount: The cost of an asset, or other amount substituted for its cost, less its residual value (AASB 116.6).
Depreciated Replacement Cost (DRC): The Current Replacement Cost (CRC) of an asset less, where applicable, accumulated depreciation calculated on the basis of such cost to reflect the already consumed or expired future economic benefits of the asset.
Depreciation / amortisation: The systematic allocation of the depreciable amount (service potential) of an asset over its useful life.
Economic life: See useful life definition.Expenditure: The spending of money on goods and services. Expenditure includes recurrent and capital.
Fair value: The amount for which an asset could be exchanged, or a liability settled, between knowledgeable, willing parties, in an arm’s length transaction.
Greenfield asset values: Asset (re)valuation values based on the cost to initially acquire the asset.
Heritage asset: An asset with historic, artistic, scientific, technological, geographical or environmental qualities that is held and maintained principally for its contribution to knowledge and culture and this purpose is central to the objectives of the council holding it.
Impairment Loss: The amount by which the carrying amount of an asset exceeds its recoverable amount.
Infrastructure assets: Physical assets of the council or of another entity that contribute to meeting the public's need for access to major economic and social facilities and services, e.g. roads, drainage, footpaths and cycleways. These are typically large, interconnected networks or portfolios of composite assets. The components of these assets may be separately maintained, renewed or replaced so that the required level and standard of service from the network of assets is continuously sustained. Generally the components and hence the assets have long lives. They are fixed in place and often have no market value.
Investment property: Property held to earn rentals or for capital appreciation or both, rather than for:• use in the production or supply of goods or services
or for administrative purposes; or• sale in the ordinary course of business (AASB
140.5).
Level of service: The defined service quality for a particular asset against which service performance may be measured. Service levels usually relate to quality, quantity, reliability, responsiveness, environmental acceptability and cost.
Life Cycle Cost: The Life Cycle Cost (LCC) is the average cost to provide the service over the longest asset life cycle. It comprises of annual maintenance and asset consumption expense, represented by depreciation expense. The LCC does not indicate the funds required to provide the service in a particular year.
Life Cycle Expenditure: The Life Cycle Expenditure (LCE) is the actual or planned annual maintenance and capital renewal expenditure incurred in providing the service in a particular year. Life Cycle Expenditure may be compared to Life Cycle Cost to give an initial indicator of life cycle sustainability.
Loans / borrowings: Loans result in funds being received which are then repaid over a period of time with interest (an additional cost). Their primary benefit is in ‘spreading the burden’ of capital expenditure over time. Although loans enable works to be completed sooner, they are only ultimately cost effective where the capital works funded (generally renewals) result in operating and maintenance cost savings, which are greater than the cost of the loan (interest and charges).
Maintenance and renewal gap: Difference between estimated budgets and projected expenditures for maintenance and renewal of assets, totalled over a defined time (e.g. 5, 10 and 15 years).
Maintenance and renewal sustainability index: Ratio of estimated budget to projected expenditure for maintenance and renewal of assets over a defined time (e.g. 5, 10 and 15 years).
Maintenance expenditure: Recurrent expenditure, which is periodically or regularly required as part of the anticipated schedule of works required to ensure that the asset achieves its useful life and provides the required level of service. It is expenditure, which was anticipated in determining the asset’s useful life.
Materiality: An item is material if its omission or misstatement could influence the economic decisions of users taken on the basis of the financial report. Materiality depends on the size and nature of the omission or misstatement judged in the surrounding circumstances.
Modern equivalent asset: A structure similar to an existing structure and having the equivalent productive
capacity, which could be built using modern materials, techniques and design. Replacement cost is the basis used to estimate the cost of constructing a modern equivalent asset.
Non-revenue generating investments: Investments for the provision of goods and services to sustain or improve services to the community that are not expected to generate any savings or revenue to the Council, e.g. parks and playgrounds, footpaths, roads and bridges, libraries, etc.
Operating expenditure: Recurrent expenditure, which is continuously required excluding maintenance and depreciation, e.g. power, fuel, staff, plant equipment, on-costs and overheads.
Planned maintenance: Repair work that is identified and managed through a maintenance management system (MMS). MMS activities include inspection, assessing the condition against failure/breakdown criteria/experience, prioritising scheduling, action the work and reporting what was done to develop a maintenance history and improve maintenance and service delivery performance.
Rate of annual asset consumption: A measure of average annual consumption of assets (AAAC) expressed as a percentage of the depreciable amount (AAAC/DA). Depreciation may be used for AAAC.
Rate of annual asset renewal: A measure of the rate at which assets are being renewed per annum expressed as a percentage of depreciable amount (capital renewal expenditure/DA).
Rate of annual asset upgrade: A measure of the rate at which assets are being upgraded and expanded per annum expressed as a percentage of depreciable amount (capital upgrade/expansion expenditure/DA).
Reactive maintenance: unplanned repair work that is carried out in response to service requests and management/supervisory directions.
Recoverable amount: The higher of an asset's fair value, less costs to sell and its value in use.
Recurrent expenditure: Relatively small (immaterial) expenditure or that which has benefits expected to last less than 12 months. Recurrent expenditure includes operating and maintenance expenditure.
Recurrent funding: Funding to pay for recurrent expenditure.
78 Georges River Council // Asset Management Plan 79
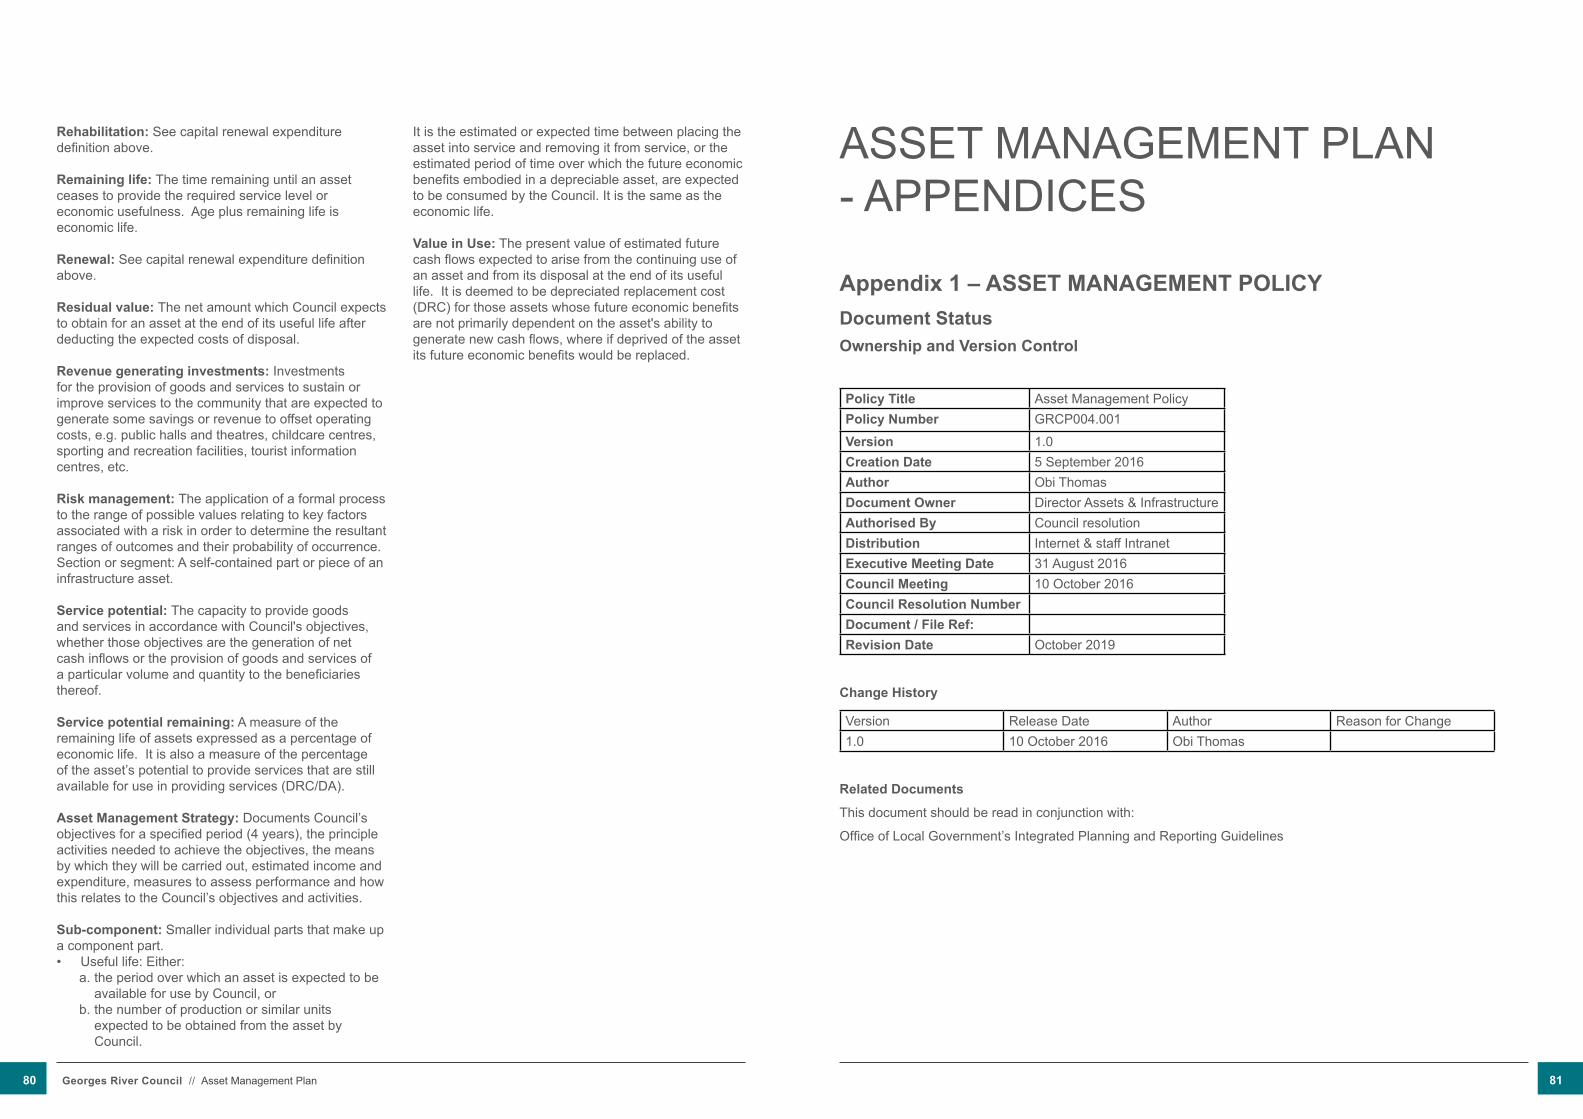
Rehabilitation: See capital renewal expenditure definition above.
Remaining life: The time remaining until an asset ceases to provide the required service level or economic usefulness. Age plus remaining life is economic life.
Renewal: See capital renewal expenditure definition above.
Residual value: The net amount which Council expects to obtain for an asset at the end of its useful life after deducting the expected costs of disposal.
Revenue generating investments: Investments for the provision of goods and services to sustain or improve services to the community that are expected to generate some savings or revenue to offset operating costs, e.g. public halls and theatres, childcare centres, sporting and recreation facilities, tourist information centres, etc.
Risk management: The application of a formal process to the range of possible values relating to key factors associated with a risk in order to determine the resultant ranges of outcomes and their probability of occurrence.Section or segment: A self-contained part or piece of an infrastructure asset.
Service potential: The capacity to provide goods and services in accordance with Council's objectives, whether those objectives are the generation of net cash inflows or the provision of goods and services of a particular volume and quantity to the beneficiaries thereof.
Service potential remaining: A measure of the remaining life of assets expressed as a percentage of economic life. It is also a measure of the percentage of the asset’s potential to provide services that are still available for use in providing services (DRC/DA).
Asset Management Strategy: Documents Council’s objectives for a specified period (4 years), the principle activities needed to achieve the objectives, the means by which they will be carried out, estimated income and expenditure, measures to assess performance and how this relates to the Council’s objectives and activities.
Sub-component: Smaller individual parts that make up a component part.• useful life: Either:
a. the period over which an asset is expected to be available for use by Council, or
b. the number of production or similar units expected to be obtained from the asset by Council.
It is the estimated or expected time between placing the asset into service and removing it from service, or the estimated period of time over which the future economic benefits embodied in a depreciable asset, are expected to be consumed by the Council. It is the same as the economic life.
Value in Use: The present value of estimated future cash flows expected to arise from the continuing use of an asset and from its disposal at the end of its useful life. It is deemed to be depreciated replacement cost (DRC) for those assets whose future economic benefits are not primarily dependent on the asset's ability to generate new cash flows, where if deprived of the asset its future economic benefits would be replaced.
ASSET MANAGEMENT PLAN - APPENDICES
Appendix 1 – ASSET MANAGEMENT POLICYDocument Status Ownership and Version Control
Policy Title Asset Management PolicyPolicy Number GRCP004.001
Version 1.0Creation Date 5 September 2016Author Obi ThomasDocument Owner Director Assets & Infrastructure Authorised By Council resolutionDistribution Internet & staff IntranetExecutive Meeting Date 31 August 2016Council Meeting 10 October 2016Council Resolution NumberDocument / File Ref:Revision Date October 2019
Change History
Version Release Date Author Reason for Change1.0 10 October 2016 Obi Thomas
Related Documents
This document should be read in conjunction with:
Office of Local Government’s Integrated Planning and Reporting Guidelines
80 Georges River Council // Asset Management Plan 81

Part 1 – PreliminaryBackground and Purpose Council is required as part of its Community Strategic Plan to develop a Resourcing Strategy.
The Resourcing Strategy is comprised of Council’s Long Term Financial Plan, Workforce Management Strategy and Asset Management Framework. A component of the Asset Management Framework is that an Asset Management Policy be developed. In accordance with this requirement and the Office of Local Government’s Integrated Planning and Reporting Guidelines, the following policy has been developed.
The purpose of this policy is to establish a framework for the management of Georges River Council’s infrastructure assets valued at over $1Billion.
The policy will guide the planning, acquisition / divestment, construction, maintenance and operation of the infrastructure necessary for Georges River Council to provide services to the community in accordance with the Community Strategic Plan
Definition of Terms• Community Strategic Plan:The Community
Strategic Plan is the highest level plan that a council will prepare. The Plan identifies the community’s main priorities and aspirations for the future and strategies for achieving these goals.
• Resourcing Strategy: The Resourcing Strategy details strategies to achieve the objectives established by the Community Strategic Plan, for which the council is responsible. The strategy must include provision for long-term financial planning, workforce management planning and asset management planning.
• Long Term Financial Plan: The Long Term Financial Plan details financial information to inform decision making during the finalisation of the Community Strategic Plan and the development of the Delivery Program.
• Asset Management Plan: Asset Management Plans must account for and plan for all of the existing assets under Council’s ownership, and any new asset solutions proposed in its Community Strategic Plan and Delivery Program.
• Asset Management Strategy: The Asset Management Strategy identifies assets that are critical to the council’s operations and outlines risk management strategies for these assets.
• Asset Management Policy: The Asset Management Strategy must include a council endorsed Asset Management Policy.
Objectives• Ensuring that Council’s services and infrastructure
are provided in a sustainable manner, with the appropriate levels of service to residents, visitors and the environment.
• Safeguarding Council assets including physical assets and employees by implementing appropriate asset management strategies and appropriate financial resources for those assets.
• Creating an environment where all Council employees take an integral part in overall management of Council assets by creating and sustaining asset management awareness throughout the Council.
• Meeting legislative requirements for asset management.
• Ensuring resources and operational capabilities are identified and responsibility for asset management is allocated.
• Demonstrating transparent and responsible asset management processes that align with best practice.
Application / ScopeThe Asset Management Policy applies to all Council activities and establishes a corporate approach to asset management within all operational areas of Council.
The infrastructure asset categories covered under this policy include;
• Roads• Open Space & Recreation• Stormwater • Buildings
Part 2 – PolicyPrinciples / Body• Council is committed to implementing a systematic
asset management methodology in order to apply appropriate asset management practices across all areas of Council. This includes ensuring that assets are planned, created, operated, maintained,
renewed and disposed of in accordance with Council’s priorities for service delivery.
• A consistent Asset Management Strategy must exist for implementing systematic asset management and asset management best-practice throughout Council.
• All relevant legislative requirements together with political, social and economic environments are to be taken into account in asset management.
• Asset management principles will be integrated within existing planning and operational processes.
• An inspection regime will be used as part of asset management to ensure agreed service levels are maintained and to identify asset renewal priorities.
• In accordance with Council’s long-Term Financial Plan Council’s aim is to fully fund the required asset renewals to meet agreed service levels, as identified in Council’s Infrastructure Asset Management Plans.
• Asset renewal plans will be prioritised and implemented progressively based on agreed service levels and the effectiveness of the current assets to provide that level of service.
• Systematic and cyclic reviews will be applied to all asset classes to ensure that assets are managed, valued and depreciated in accordance with best practice and the applicable Australian Standards.
• Future life-cycle costs will be reported and considered in all decisions relating to the provision of new services and assets and upgrading of existing services and assets.
• Future service levels will be determined in consultation with the Community.
Part 3 – AdministrationRelated and Associated Legislation, Council Policy and Procedures• Local Government Act 1993• Local Government (General) Regulation 2005• Australian Standards• Building Code of Australia 2009 • Crown Lands Act 1989• Coastal Protection Act 1979• Civil Liability Act 2002• Disability Discrimination Act 1992 (Cth)• Environmental Planning and Assessment Act 1979• Environmental Planning and Assessment
Amendment Act 2008• Graffiti Control Act 2008• Graffiti Control Amendment Act 2009• Infrastructure Implementation Corporation Act 2005• Land and Environment Court Act 1979• Land Acquisitions (Just Terms Compensation) Act
1991• Work Health and Safety Act 2011• Work Health and Safety Regulation 2011• Protection of the Environment Operations Act 1997• National Resources Management Act 2004• Roads Act 1993• Valuation of Land Act 1916• Asset Management Strategy• Asset Management Plans• Long-Term Financial Plan
Record Keeping, Confidentiality and PrivacyAll documents created in relation to this policy will be kept in accordance with NSW State Records Act, Georges River Council’s record management practice Corporate Records Policy and NSW State Records Act 1998.
Members of the public can access Council’s documents in accordance with Government Information Public Access (GIPA) Act 2009 and Privacy and Personal Information Protection Act (PPIPA) 1998.
The Government Information (Public Access) Act became effective from 1 July 2010 it replaced previous legislation relating to access/rights to information i.e., Freedom of Information (FOI) Act 1989 and s12 of the Local Government Act 1993.
Breaches and SanctionsRelevant legislation applies where applicable.
82 Georges River Council // Asset Management Plan 83

Appendix 2 - CURRENT SITUATION
ASSET CATEGORY: ROADS
ROAD PAVEMENT
Holdings 406 km of roads comprising of:- o 382 km of local road. o 24km of state road.
Council is responsible for the maintenance of all local roads. State roads are under the control and maintenance of the Roads and Maritime Services (RMS).
The surface construction type is predominantly asphaltic concrete seal. The age of Georges River’s road network dates back as far as the late 1800’s,
with the majority of roads being formally registered by 1940. Council has accurate records of the age of the pavement seal since 1973.
Figure 2, section 4.6.2 includes the age of seal and base of Georges River’s roads.
Replacement Value $524 million Last revalued in 2014.
Available data X:\Assets\Road Asset\Road Pavement\Roads_master.TAB X:\Assets\Documentation\ Assets Data Dictionary.doc provides detail as to the
fields used and the history of the layer. Refer age graph in Section 4.6.1, Figure 2. Refer condition map in Appendix 4. Refer condition assessment methodology and photo references in appendix 3. Design lives based on SSROC lives and adapted to suit local conditions.
o Base – all 100 years. o Seal – all 25 years.
Unit rates based on SSROC values and adapted to suit local conditions. o Base Sub-Arterial - $150 o Base Collector - $100 o Base Local - $75 o Seal Sub-Arterial - $25 o Seal Collector - $25 o Seal Local - $20
Last Condition Survey
Network condition assessments completed in 2014 and 2016 by Infrastructure Management Group.
Condition Assessment Schedule
Next complete network inspection scheduled to be completed by December 2020 to align with asset revaluation cycles. Footpaths and other high risk assets are inspected more frequently.
Risk category one inspected annually plus an additional 5% of the worst condition roads, risk level two and three bi-annually.
Any hazards observed on inspection, reported through the service request system and repaired according to risk and service level response times.
New work captured by Assets at completion of work by contractors or Georges River Works staff from review of project details and finance WIP accounts.
General Assessment of Condition:
Condition Rating % of length
1 Very Good 7%
2 Good 28%
3 Fair 61%
4 Poor 4%
5 Failed 0%
Level of Utilisation Currently unassessed
Level of User Satisfaction
Currently unassessed
Budget Implications Additional funds added from the SRV increased annual maintenance from $766,000 (2009/10) to $1,616 (2013/14).
Current budget considered adequate to maintain network at current condition.
Maintenance Programs
4-year forward works program based on condition. Annual Reactive, planned and cyclic maintenance shown for all road assets1
Other comments
1 The following are the breakup of the different roads maintenance budgets:- Reactive maintenance
o Pavement maintenance (80%) o Footpath maintenance (80%) o Traffic facilities (100%)
Planned maintenance o Pavement maintenance (20%) o Footpath maintenance (20%)
Cyclic maintenance o Environmental control (82%)
FOOTPATH
Holdings 459km (length) of footpath. 14km of new footpath since 2010 AMP, increase of 2%. Footpath construction types (area):-
o Concrete o Various o Pavers o Stencilcrete o Bitumen Seal o Exposed Aggregate
The width of footpath varies, some up to 3.5m wide, although most approximately 1.5m wide.
The age of some parts of the footpath network dates back to the early 1900’s. Detailed records of the original construction of footpaths are contained in Council’s road register.
84 Georges River Council // Asset Management Plan 85
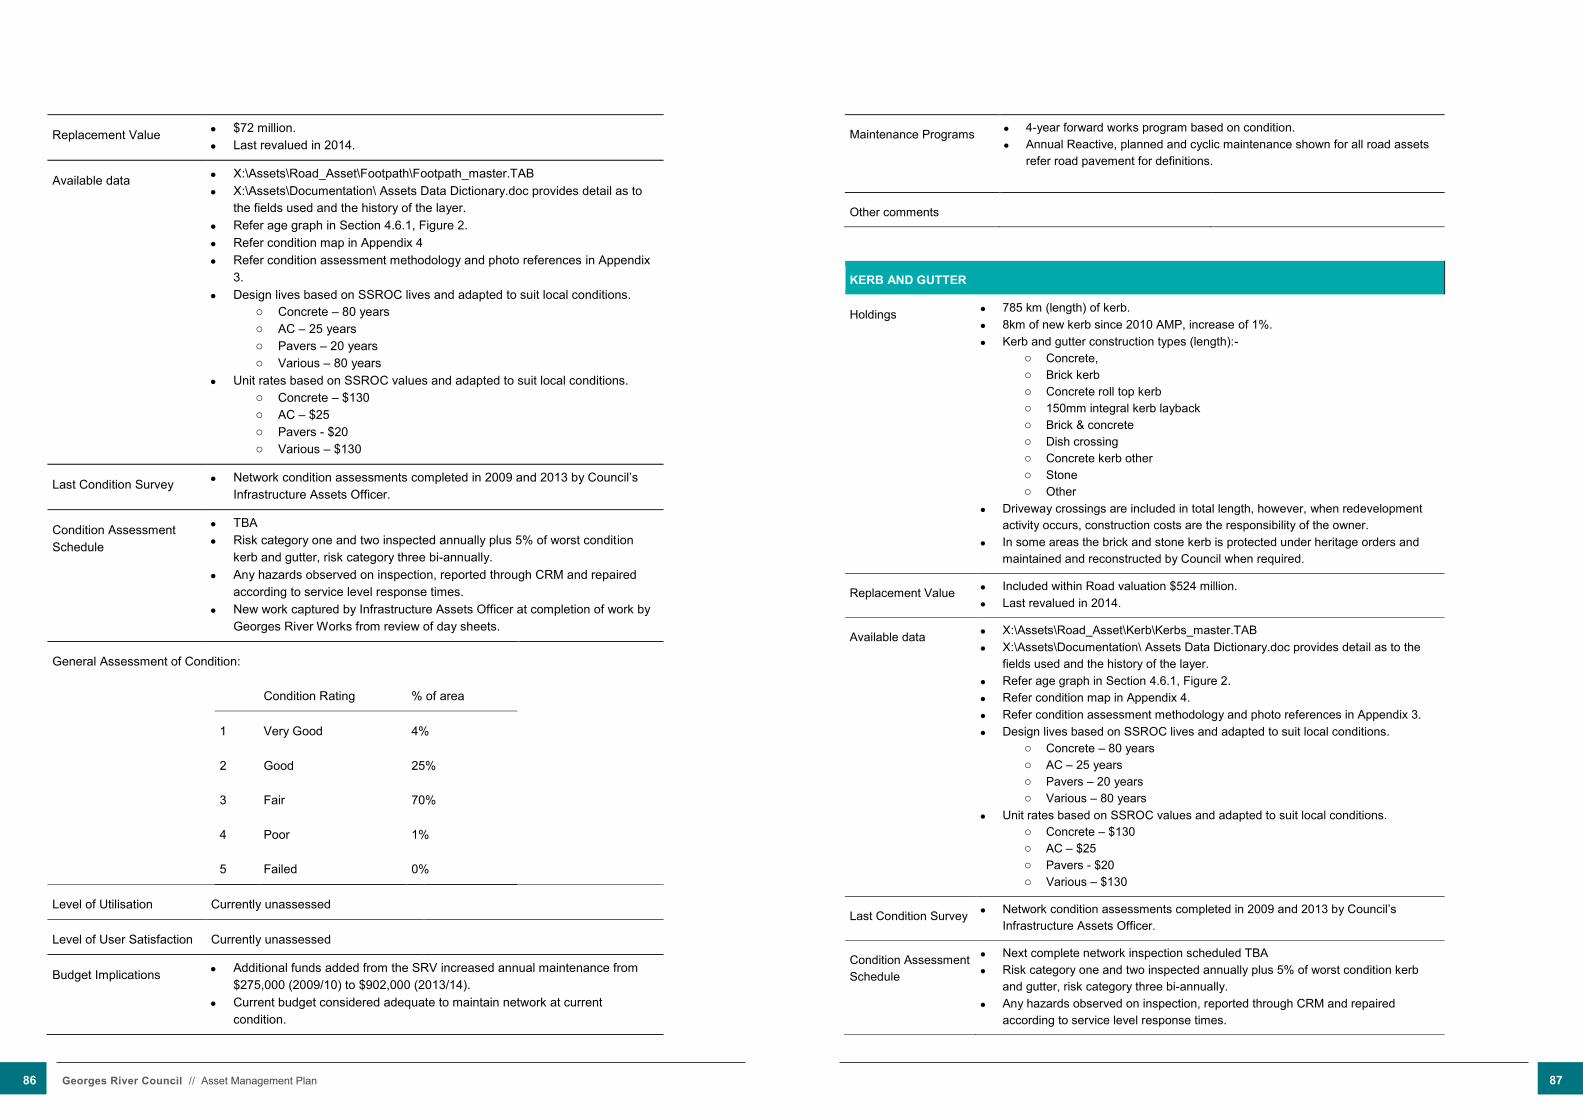
Replacement Value $72 million. Last revalued in 2014.
Available data X:\Assets\Road_Asset\Footpath\Footpath_master.TAB X:\Assets\Documentation\ Assets Data Dictionary.doc provides detail as to
the fields used and the history of the layer. Refer age graph in Section 4.6.1, Figure 2. Refer condition map in Appendix 4 Refer condition assessment methodology and photo references in Appendix
3. Design lives based on SSROC lives and adapted to suit local conditions.
o Concrete – 80 years o AC – 25 years o Pavers – 20 years o Various – 80 years
Unit rates based on SSROC values and adapted to suit local conditions. o Concrete – $130 o AC – $25 o Pavers - $20 o Various – $130
Last Condition Survey Network condition assessments completed in 2009 and 2013 by Council’s Infrastructure Assets Officer.
Condition Assessment Schedule
TBA Risk category one and two inspected annually plus 5% of worst condition
kerb and gutter, risk category three bi-annually. Any hazards observed on inspection, reported through CRM and repaired
according to service level response times. New work captured by Infrastructure Assets Officer at completion of work by
Georges River Works from review of day sheets.
General Assessment of Condition:
Condition Rating % of area
1 Very Good 4%
2 Good 25%
3 Fair 70%
4 Poor 1%
5 Failed 0%
Level of Utilisation Currently unassessed
Level of User Satisfaction Currently unassessed
Budget Implications Additional funds added from the SRV increased annual maintenance from $275,000 (2009/10) to $902,000 (2013/14).
Current budget considered adequate to maintain network at current condition.
Maintenance Programs 4-year forward works program based on condition. Annual Reactive, planned and cyclic maintenance shown for all road assets
refer road pavement for definitions.
Other comments
KERB AND GUTTER
Holdings 785 km (length) of kerb. 8km of new kerb since 2010 AMP, increase of 1%. Kerb and gutter construction types (length):-
o Concrete, o Brick kerb o Concrete roll top kerb o 150mm integral kerb layback o Brick & concrete o Dish crossing o Concrete kerb other o Stone o Other
Driveway crossings are included in total length, however, when redevelopment activity occurs, construction costs are the responsibility of the owner.
In some areas the brick and stone kerb is protected under heritage orders and maintained and reconstructed by Council when required.
Replacement Value Included within Road valuation $524 million. Last revalued in 2014.
Available data X:\Assets\Road_Asset\Kerb\Kerbs_master.TAB X:\Assets\Documentation\ Assets Data Dictionary.doc provides detail as to the
fields used and the history of the layer. Refer age graph in Section 4.6.1, Figure 2. Refer condition map in Appendix 4. Refer condition assessment methodology and photo references in Appendix 3. Design lives based on SSROC lives and adapted to suit local conditions.
o Concrete – 80 years o AC – 25 years o Pavers – 20 years o Various – 80 years
Unit rates based on SSROC values and adapted to suit local conditions. o Concrete – $130 o AC – $25 o Pavers - $20 o Various – $130
Last Condition Survey Network condition assessments completed in 2009 and 2013 by Council’s Infrastructure Assets Officer.
Condition Assessment Schedule
Next complete network inspection scheduled TBA Risk category one and two inspected annually plus 5% of worst condition kerb
and gutter, risk category three bi-annually. Any hazards observed on inspection, reported through CRM and repaired
according to service level response times.
86 Georges River Council // Asset Management Plan 87

New work captured by Infrastructure Assets Officer at completion of work by Georges River Works from review of day sheets.
General Assessment of Condition:
Condition Rating % of area
1 Very Good 0.7%
2 Good 6.1%
3 Fair 93%
4 Poor 0.5%
5 Failed 0%
Level of Utilisation Currently unassessed
Level of User Satisfaction
Currently unassessed
Budget Implications Current maintenance budget $133,000 per annum. Current budget considered adequate to maintain network at current condition.
Maintenance Programs
4-year forward works program based on condition. Annual Reactive, planned and cyclic maintenance shown for all road assets refer
road pavement for definitions.
Other comments
TRAFFIC FACILITIES
Holdings 15,977 items These are all the elements which are needed to be installed on the road network
to ensure that standards of safe traffic movement are in accordance with RMS, Australian Standards and Georges River Council policy.
Types include (count):- o Signs 11,291 o Lines 2,869 o Islands 623 o Traffic Control Devices 80 o Roundabouts 39 o Pedestrian Crossings 73 o Fences 67 o Parking Bays 351 o Other 584
Traffic signs are administered by RMS.
Replacement Value $10.8 million Last revalued in 2014.
Available data X:\Assets\Road Asset\Signs\Signs_Master.TAB X:\Assets\Road Asset\Traffic Features\Traffic_Features.TAB X:\Assets\Road Asset\Lines\Lines.TAB X:\Assets\Documentation\ Assets Data Dictionary.doc provides detail as to the
fields used and the history of the layers. Refer Appendix 4 for condition maps. Age data not collected.
Last Condition Survey
Lines originally collected in 2002 by JRA. Signs originally collected in 2002 and 2009. Traffic features collected between 2009 and 2015 by IAO at the same time as
assessing road assets. Lines and traffic features collection based on aerial photography was undertaken
by IAO in 2015. Signs with condition 5, with no condition or missing data were inspected by IAO in
2015.
Condition Assessment Schedule
New lines & signs added by IAO from traffic work orders. New traffic features captured by Infrastructure Assets Officer at completion of work
by Georges River Works from review of day sheets. Lines and traffic features to be checked against any updated aerial photography. Traffic features to be condition assessed in conjunction with roads inspections.
General Assessment of Condition:
Condition Rating % of assets
1 Very Good 29%
2 Good 49%
3 Fair 16%
4 Poor 6%
5 Failed 1%
Level of Utilisation Currently unassessed
RETAINING WALLS
Holdings 187 retaining walls with construction types of :- o Man-made – 85 o Partial – 16 o Natural – 60 o Other -26
Any natural or man-made walls and cuttings constructed to retain roads, buildings, vehicles, natural areas or landscaping.
Replacement Value Not currently valued
88 Georges River Council // Asset Management Plan 89
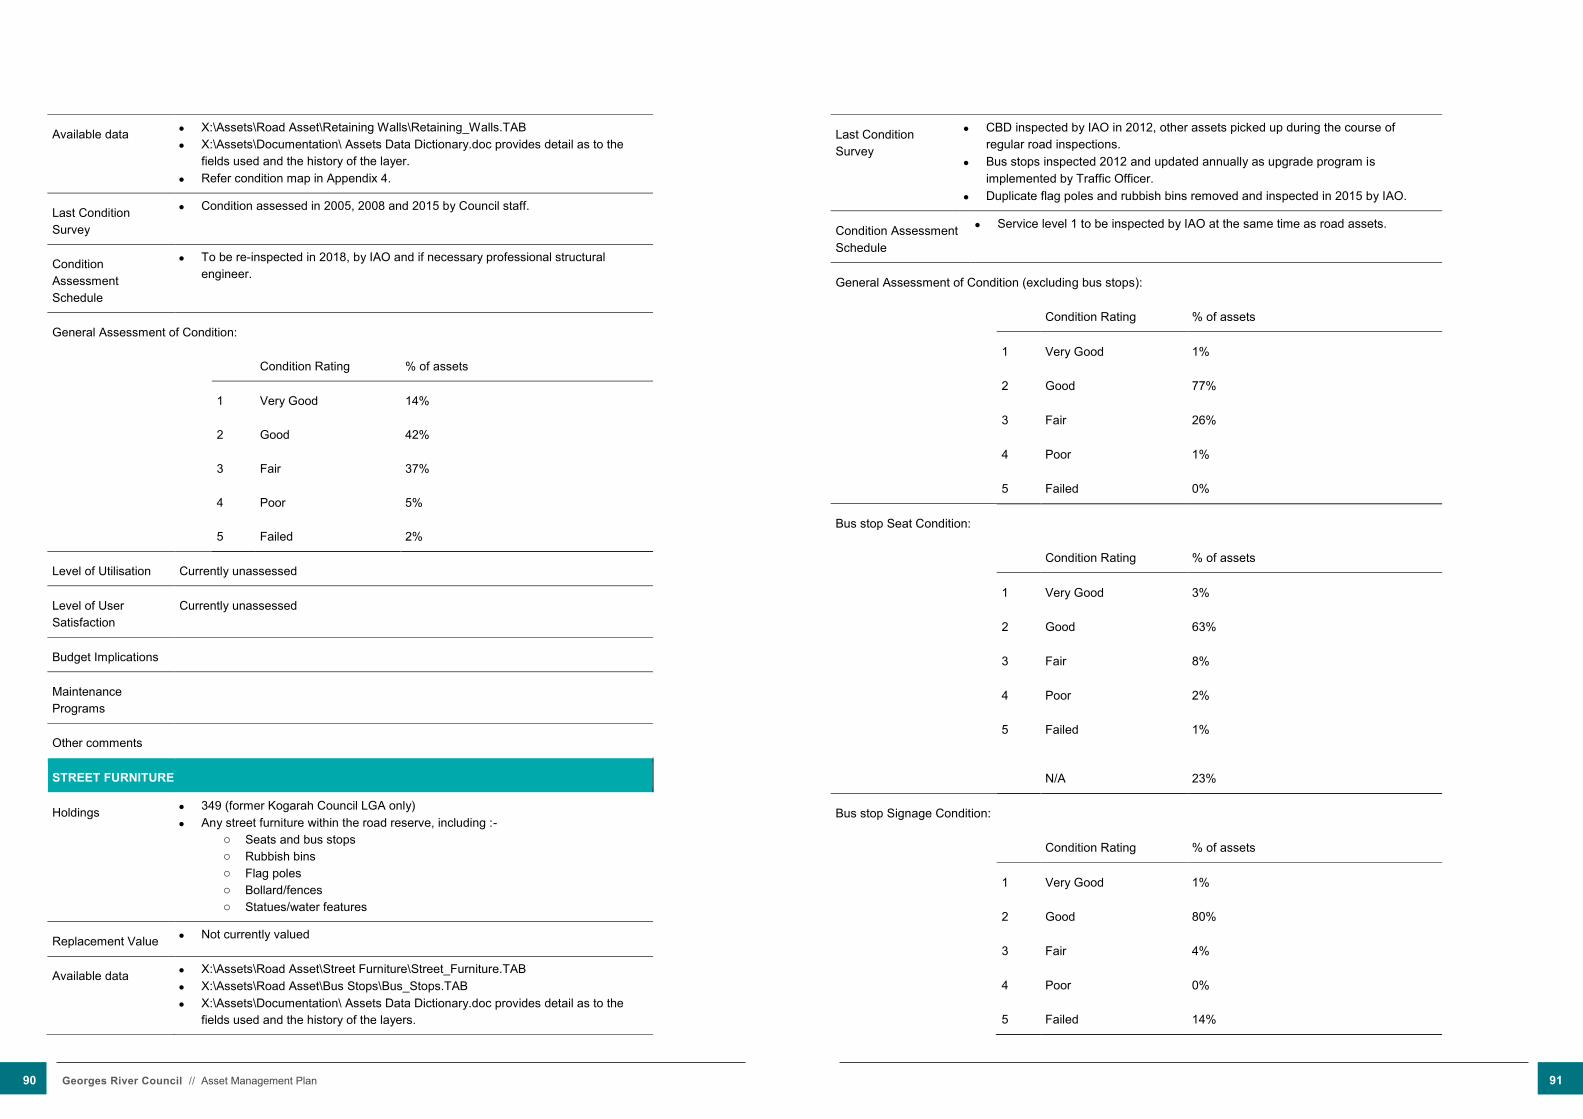
Available data X:\Assets\Road Asset\Retaining Walls\Retaining_Walls.TAB X:\Assets\Documentation\ Assets Data Dictionary.doc provides detail as to the
fields used and the history of the layer. Refer condition map in Appendix 4.
Last Condition Survey
Condition assessed in 2005, 2008 and 2015 by Council staff.
Condition Assessment Schedule
To be re-inspected in 2018, by IAO and if necessary professional structural engineer.
General Assessment of Condition:
Condition Rating % of assets
1 Very Good 14%
2 Good 42%
3 Fair 37%
4 Poor 5%
5 Failed 2%
Level of Utilisation Currently unassessed
Level of User Satisfaction
Currently unassessed
Budget Implications
Maintenance Programs
Other comments
STREET FURNITURE
Holdings 349 (former Kogarah Council LGA only) Any street furniture within the road reserve, including :-
o Seats and bus stops o Rubbish bins o Flag poles o Bollard/fences o Statues/water features
Replacement Value Not currently valued
Available data X:\Assets\Road Asset\Street Furniture\Street_Furniture.TAB X:\Assets\Road Asset\Bus Stops\Bus_Stops.TAB X:\Assets\Documentation\ Assets Data Dictionary.doc provides detail as to the
fields used and the history of the layers.
Last Condition Survey
CBD inspected by IAO in 2012, other assets picked up during the course of regular road inspections.
Bus stops inspected 2012 and updated annually as upgrade program is implemented by Traffic Officer.
Duplicate flag poles and rubbish bins removed and inspected in 2015 by IAO.
Condition Assessment Schedule
Service level 1 to be inspected by IAO at the same time as road assets.
General Assessment of Condition (excluding bus stops):
Condition Rating % of assets
1 Very Good 1%
2 Good 77%
3 Fair 26%
4 Poor 1%
5 Failed 0%
Bus stop Seat Condition:
Condition Rating % of assets
1 Very Good 3%
2 Good 63%
3 Fair 8%
4 Poor 2%
5 Failed
N/A
1%
23%
Bus stop Signage Condition:
Condition Rating % of assets
1 Very Good 1%
2 Good 80%
3 Fair 4%
4 Poor 0%
5 Failed 14%
90 Georges River Council // Asset Management Plan 91
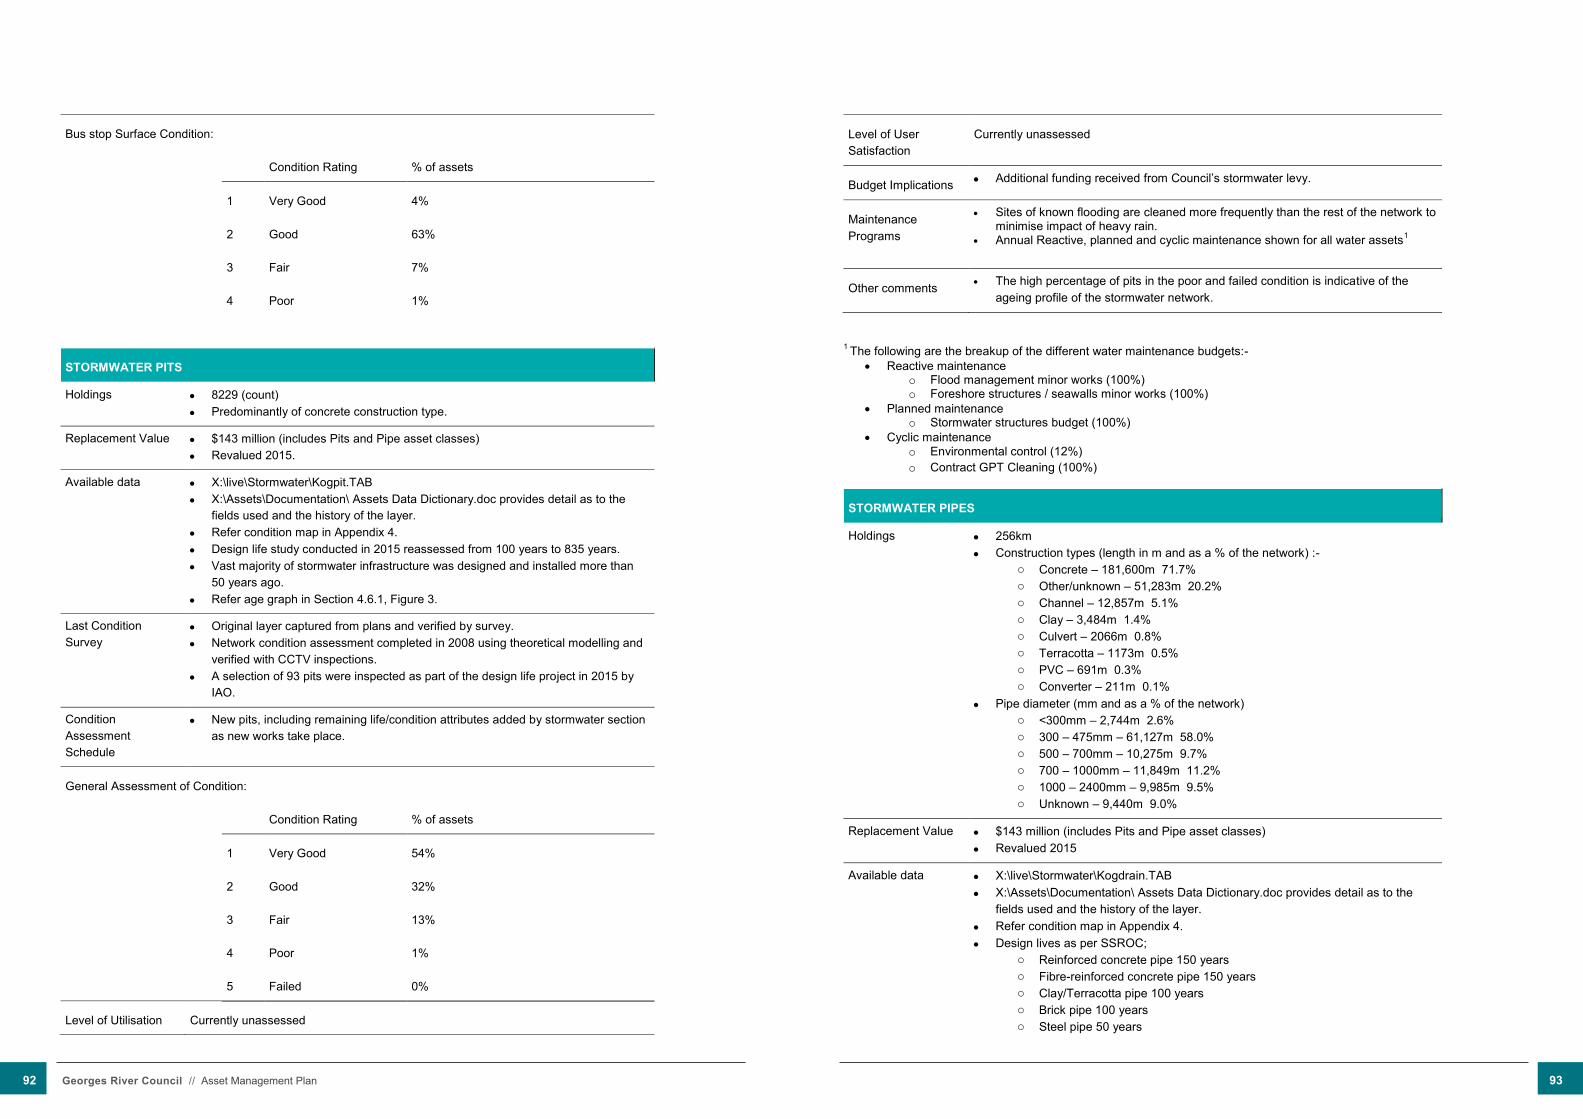
Bus stop Surface Condition:
Condition Rating % of assets
1 Very Good 4%
2 Good 63%
3 Fair 7%
4 Poor 1%
STORMWATER PITS
Holdings 8229 (count) Predominantly of concrete construction type.
Replacement Value $143 million (includes Pits and Pipe asset classes) Revalued 2015.
Available data X:\live\Stormwater\Kogpit.TAB X:\Assets\Documentation\ Assets Data Dictionary.doc provides detail as to the
fields used and the history of the layer. Refer condition map in Appendix 4. Design life study conducted in 2015 reassessed from 100 years to 835 years. Vast majority of stormwater infrastructure was designed and installed more than
50 years ago. Refer age graph in Section 4.6.1, Figure 3.
Last Condition Survey
Original layer captured from plans and verified by survey. Network condition assessment completed in 2008 using theoretical modelling and
verified with CCTV inspections. A selection of 93 pits were inspected as part of the design life project in 2015 by
IAO.
Condition Assessment Schedule
New pits, including remaining life/condition attributes added by stormwater section as new works take place.
General Assessment of Condition:
Condition Rating % of assets
1 Very Good 54%
2 Good 32%
3 Fair 13%
4 Poor 1%
5 Failed 0%
Level of Utilisation Currently unassessed
Level of User Satisfaction
Currently unassessed
Budget Implications Additional funding received from Council’s stormwater levy.
Maintenance Programs
Sites of known flooding are cleaned more frequently than the rest of the network to minimise impact of heavy rain.
Annual Reactive, planned and cyclic maintenance shown for all water assets1
Other comments The high percentage of pits in the poor and failed condition is indicative of the ageing profile of the stormwater network.
1 The following are the breakup of the different water maintenance budgets:-
Reactive maintenance o Flood management minor works (100%) o Foreshore structures / seawalls minor works (100%)
Planned maintenance o Stormwater structures budget (100%)
Cyclic maintenance o Environmental control (12%) o Contract GPT Cleaning (100%)
STORMWATER PIPES
Holdings 256km Construction types (length in m and as a % of the network) :-
o Concrete – 181,600m 71.7% o Other/unknown – 51,283m 20.2% o Channel – 12,857m 5.1% o Clay – 3,484m 1.4% o Culvert – 2066m 0.8% o Terracotta – 1173m 0.5% o PVC – 691m 0.3% o Converter – 211m 0.1%
Pipe diameter (mm and as a % of the network) o <300mm – 2,744m 2.6% o 300 – 475mm – 61,127m 58.0% o 500 – 700mm – 10,275m 9.7% o 700 – 1000mm – 11,849m 11.2% o 1000 – 2400mm – 9,985m 9.5% o Unknown – 9,440m 9.0%
Replacement Value $143 million (includes Pits and Pipe asset classes) Revalued 2015
Available data X:\live\Stormwater\Kogdrain.TAB X:\Assets\Documentation\ Assets Data Dictionary.doc provides detail as to the
fields used and the history of the layer. Refer condition map in Appendix 4. Design lives as per SSROC;
o Reinforced concrete pipe 150 years o Fibre-reinforced concrete pipe 150 years o Clay/Terracotta pipe 100 years o Brick pipe 100 years o Steel pipe 50 years
92 Georges River Council // Asset Management Plan 93
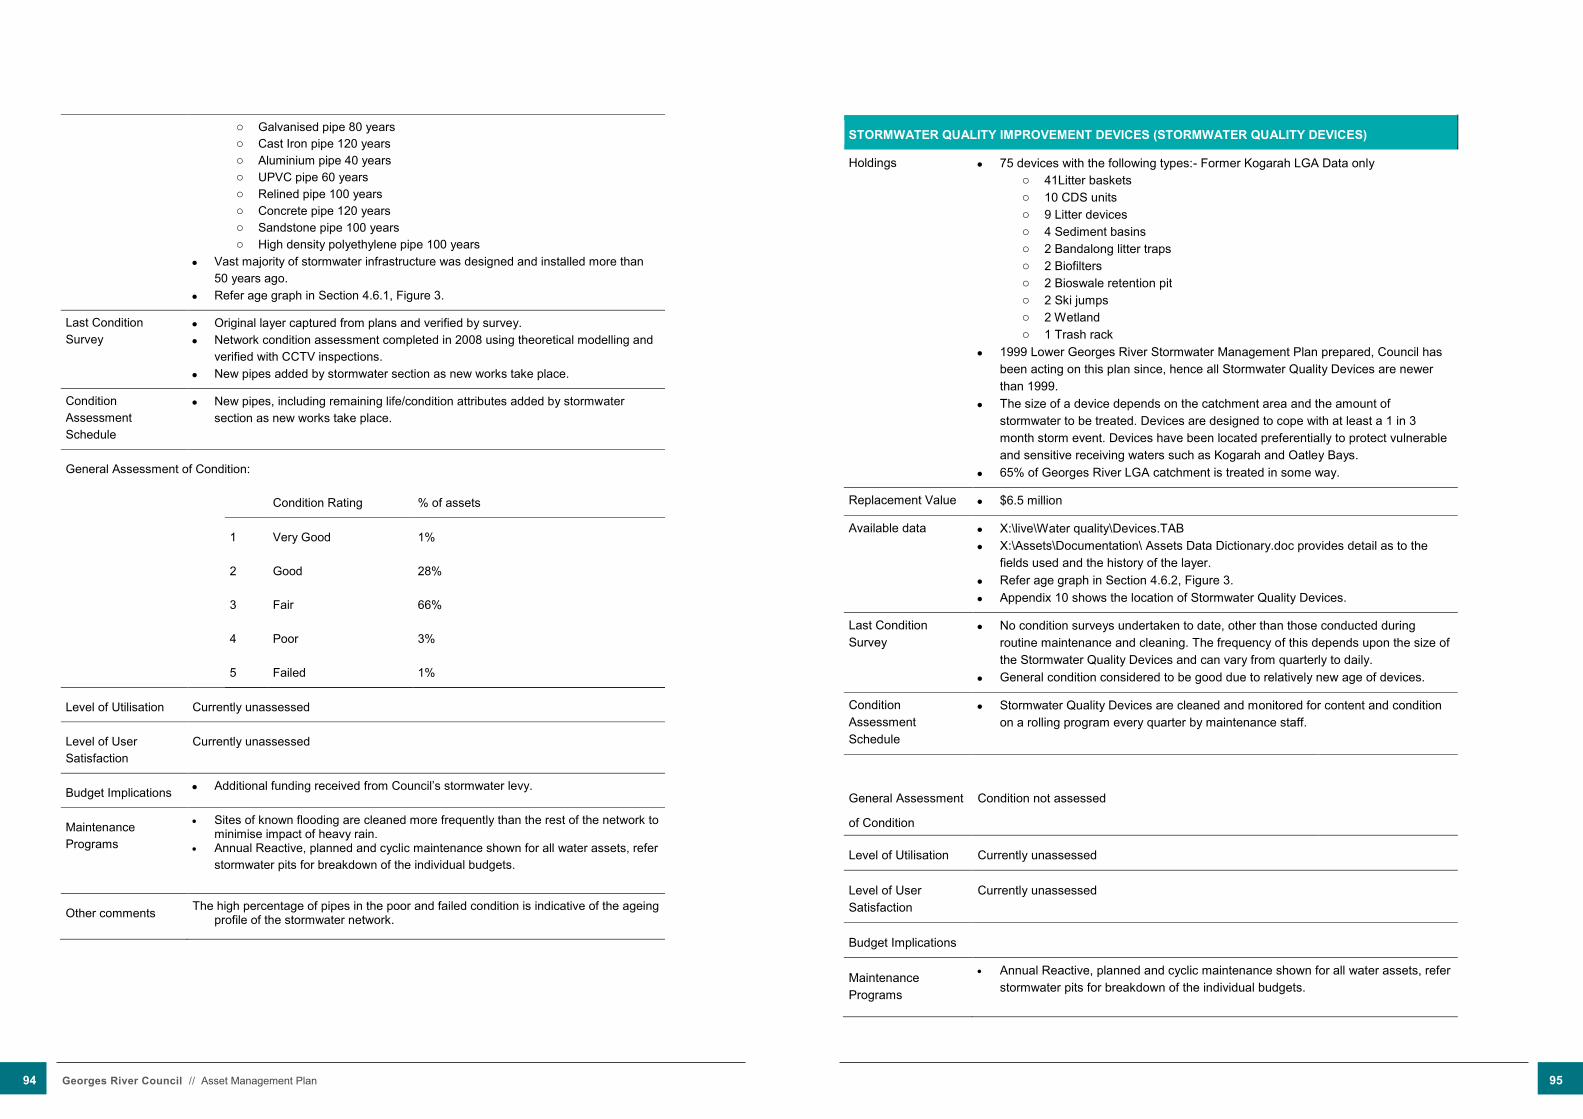
o Galvanised pipe 80 years o Cast Iron pipe 120 years o Aluminium pipe 40 years o UPVC pipe 60 years o Relined pipe 100 years o Concrete pipe 120 years o Sandstone pipe 100 years o High density polyethylene pipe 100 years
Vast majority of stormwater infrastructure was designed and installed more than 50 years ago.
Refer age graph in Section 4.6.1, Figure 3.
Last Condition Survey
Original layer captured from plans and verified by survey. Network condition assessment completed in 2008 using theoretical modelling and
verified with CCTV inspections. New pipes added by stormwater section as new works take place.
Condition Assessment Schedule
New pipes, including remaining life/condition attributes added by stormwater section as new works take place.
General Assessment of Condition:
Condition Rating % of assets
1 Very Good 1%
2 Good 28%
3 Fair 66%
4 Poor 3%
5 Failed 1%
Level of Utilisation Currently unassessed
Level of User Satisfaction
Currently unassessed
Budget Implications Additional funding received from Council’s stormwater levy.
Maintenance Programs
Sites of known flooding are cleaned more frequently than the rest of the network to minimise impact of heavy rain.
Annual Reactive, planned and cyclic maintenance shown for all water assets, refer stormwater pits for breakdown of the individual budgets.
Other comments The high percentage of pipes in the poor and failed condition is indicative of the ageing profile of the stormwater network.
STORMWATER QUALITY IMPROVEMENT DEVICES (STORMWATER QUALITY DEVICES)
Holdings 75 devices with the following types:- Former Kogarah LGA Data only o 41Litter baskets o 10 CDS units o 9 Litter devices o 4 Sediment basins o 2 Bandalong litter traps o 2 Biofilters o 2 Bioswale retention pit o 2 Ski jumps o 2 Wetland o 1 Trash rack
1999 Lower Georges River Stormwater Management Plan prepared, Council has been acting on this plan since, hence all Stormwater Quality Devices are newer than 1999.
The size of a device depends on the catchment area and the amount of stormwater to be treated. Devices are designed to cope with at least a 1 in 3 month storm event. Devices have been located preferentially to protect vulnerable and sensitive receiving waters such as Kogarah and Oatley Bays.
65% of Georges River LGA catchment is treated in some way.
Replacement Value $6.5 million
Available data X:\live\Water quality\Devices.TAB X:\Assets\Documentation\ Assets Data Dictionary.doc provides detail as to the
fields used and the history of the layer. Refer age graph in Section 4.6.2, Figure 3. Appendix 10 shows the location of Stormwater Quality Devices.
Last Condition Survey
No condition surveys undertaken to date, other than those conducted during routine maintenance and cleaning. The frequency of this depends upon the size of the Stormwater Quality Devices and can vary from quarterly to daily.
General condition considered to be good due to relatively new age of devices.
Condition Assessment Schedule
Stormwater Quality Devices are cleaned and monitored for content and condition on a rolling program every quarter by maintenance staff.
General Assessment
of Condition
Condition not assessed
Level of Utilisation Currently unassessed
Level of User Satisfaction
Currently unassessed
Budget Implications
Maintenance Programs
Annual Reactive, planned and cyclic maintenance shown for all water assets, refer stormwater pits for breakdown of the individual budgets.
94 Georges River Council // Asset Management Plan 95

MARINE/FORESHORE INFRASTRUCTURE
Holdings 122 marine/foreshore structures, within Council’s 32 foreshore areas, along the Georges River.
Replacement Value $3.2 million
Available data X:\Assets\Foreshore and Waterway\Foreshore_Assets.TAB X:\Assets\Foreshore and Waterway\Marine_Infrastructure.TAB X:\Assets\Foreshore and Waterway\Public Jetties\Public_Jetties.TAB X:\Assets\Foreshore and Waterway\FAMP_Data.xls X:\Assets\Foreshore and Waterway\MAMP_Data.xls X:\Assets\Documentation\ Assets Data Dictionary.doc provides detail as to the
fields used and the history of the layers. Figure 4 in 4.6.1 shows the age of marine/foreshore infrastructure. Refer the condition map in Appendix 4.
Last Condition Survey
2008 assessment conducted by independent consultants, results published in Foreshore Management Study and Plan (FAMP) and Marine Infrastructure Asset Management Plan (MAMP). Conditions updated from forward works programs.
Appendix 3 shows the criteria used when assessing condition.
Condition Assessment Schedule
Public jetties and boat ramps inspected twice yearly by Council’s Catchment Management Officer.
General Assessment of Condition:
(all marine/foreshore infrastructure based on 2008 inspection data)
Condition Rating % of assets
1 Very Good 13%
2 Good 40%
3 Fair 22%
4 Poor 24%
5 Failed 1%
Assessment of Condition:
(public jetties and boat ramps)
Condition Rating % of assets
1 Very Good 7%
2 Good 64%
3 Fair 21%
4 Poor 7%
5 Failed 0%
Level of Utilisation Currently unassessed
Level of User Satisfaction
Currently unassessed
Budget Implications Additional funding of $245,000 provided in 2013/2014 from SRV for work at 12 foreshore sites.
Maintenance Programs
Jetty inspections provide information for forward works. Annual Reactive, planned and cyclic maintenance shown for all water assets, refer
stormwater pits for breakdown of the individual budgets.
Other comments
ASSET CATEGORY: PARKS & RECREATION
PARKS AND RESERVES
Holdings 281 (count), 437 Hectares 10 regional, 18 district parks, 85% of these parks are covered by park specific
plans of management. Regional and district parks are generally those of a larger nature and situated
around the foreshore of the Georges River. These parks often contain multiple sports fields and are used for large scale community events.
Some of Council’s park land is under the ownership of a State Department (e.g. the NSW Land and Property Information, RailCorp, Sydney Water) but are under Council’s care, control and management and are managed through the provisions of the Crown Lands Act 1989.
8 parks include leash free, 5 with fenced areas.
Replacement Value $175.9 million (community land valuation)
Available data X:\live\Parks\Parks.TAB X:\Assets\Documentation\ Assets Data Dictionary.doc provides detail as to the
fields used and the history of the layer. Refer location map in Appendix 10.
Last Condition Survey
Carrying capacity, condition and adequacy of sports fields informally assessed by the Parks and Waterways section when receiving bookings and by the maintenance crews.
Condition Assessment Schedule
N/A
Level of Utilisation Tri-annual surveys by Recreation and Urban Landscapes section.
Level of User Satisfaction
Usage of sportsfields is monitored through booking system, heavily used all year round.
Community consultation through the process of the development of new Plans of Management.
Budget Implications
96 Georges River Council // Asset Management Plan 97

Maintenance Programs
Annual reactive, planned and cyclic maintenance shown for all parks assets1
Other comments Predicted to be an increased demand for public open space due to the increase in higher density housing.
Lack of sports fields or used to maximum capacity known current service deficiency.
1 The following are the breakup of the different parks maintenance budgets:- Reactive maintenance
o Parks (15% of total budget) o Parks and Reserves Minor Works (100%) o Streetscapes (85% of 75% of total budget, this accounts for money that is spent on road reserve
garden beds) Planned maintenance
o Parks (10%) o Bush Regeneration Contractors (100%) o Bushfire Reduction Program (100%) o Contracted Playground Inspections (100%) o Street Tree Planting (Master Plan) (100%) o Street Tree Removals (Master Plan) (100%) o Streetscapes (15% of 75% of total budget)
Cyclic maintenance o Parks (75%)
BUSHLAND AREAS
Holdings 41 reserves with portions of land consisting of significant remnant bushland of varying sizes.
Local Bushland Reserves Generic Plan of Management adopted July 2011.
Replacement Value Included in the value of parks and reserves.
Available data X:\Live\Bushland\Bushland2014.TAB X:\Assets\Documentation\ Assets Data Dictionary.doc provides detail as to the
fields used and the history of the layer.
Last Condition Survey No formal or cyclical condition assessments conducted.
General Assessment
of Condition
Condition measured by the native or remnant biodiversity found within the reserve, by the levels of disturbance and the reserve’s ability to recover after a disturbance event.
Former Kogarah LGA - Poulton Park, Kyle Williams Reserve & Carss Bush Park house 5 separate populations or communities of threatened species flora species and several rare plant species, including:-
o Southern Sydney Sheltered Forest o Coastal Saltmarsh Community o Swamp Oak Floodplain Forest o Acacia Prominens (endangered) o Sydney Turpentine Ironbark Forest (critically endangered)
Many threatened and protected species of fauna have also been recorded, include the vulnerable listed Eastern Bentwing Bat.
Other smaller reserves are more susceptible to disturbance and encroachment due to their location.
Condition Assessment Schedule
N/A
Level of Utilisation Currently unassessed
Level of User Satisfaction
Currently unassessed
Budget Implications
Maintenance Programs
Annual reactive, planned and cyclic maintenance shown for all parks assets, refer park and reserves for breakdown of individual budgets.
PLAYGROUNDS
Holdings 117 Playground sites o Spring/Bouncing Unit o Swing o Shade Cloth o Spinner o Cubby House o Slide o Liberty Swing o Fitness Centre o Other
Replacement Value $7.7 million
Available data X:\Assets\Park Asset\Playgrounds\Playfix 20*.TAB X:\Assets\Documentation\ Assets Data Dictionary.doc provides detail as to the
fields used and the history of the layer. Refer condition map in Appendix 4. Refer age graph in Section 4.6.1, Figure 5.
Last Condition Survey
April 2015 Condition provided annually for each site is an average condition for the
playground as a whole.
Condition Assessment Schedule
Assessed quarterly by independent consultants PlayFix and Playground doctor. April includes a condition assessment,
Recommendations made for immediate repairs based on risk. Informal assessment by KCW maintenance crews while carrying out routine
maintenance.
General Assessment of Condition:
Condition Rating % of playgrounds
1 Very Good 4%
2 Good 18%
3 Fair 78%
4 Poor 0%
98 Georges River Council // Asset Management Plan 99

5 Failed 0%
Level of Utilisation Tri-annual surveys by Recreation and Urban Landscapes section.
Level of User Satisfaction
Tri-annual surveys by Recreation and Urban Landscapes section.
Budget Implications
Maintenance Programs
Additional $300,000 provided in 2013/2014 from the SRV funding. 15 new playgrounds provided over the 4 year SRV. 4-year forward works program developed based on PlayFix, playground doctor
inspections. Annual reactive, planned and cyclic maintenance shown for all parks assets, refer
park and reserves for breakdown of individual budgets.
Other comments In 2010 edition of this AMP, concern for the high percentage of playgrounds that do not meet Australian Standards. Additional funding from the SRV has provided the means to rectify this issue.
PARK FURNITURE
Holdings 2,906 pieces of furniture and park fittings
Replacement Value Not currently reported
Available data X:\Assets\Park Asset\Park Asset Condition\Artworks.TAB X:\Assets\Park Asset\Park Asset Condition\ConstructedWalls.TAB X:\Assets\Park Asset\Park Asset Condition\Electrical.TAB X:\Assets\Park Asset\Park Asset Condition\Feature.TAB X:\Assets\Park Asset\Park Asset Condition\Fences.TAB X:\Assets\Park Asset\Park Asset Condition\Gates.TAB X:\Assets\Park Asset\Park Asset Condition\ParkBins.TAB X:\Assets\Park Asset\Park Asset Condition\ParkGardenBeds.TAB X:\Assets\Park Asset\Park Asset Condition\ParkSeating.TAB X:\Assets\Park Asset\Park Asset Condition\PathwayTrackBridge.TAB X:\Assets\Park Asset\Park Asset Condition\PicnicSeating.TAB X:\Assets\Park Asset\Park Asset Condition\Playground_ExerciseStation.TAB X:\Assets\Park Asset\Park Asset Condition\Post.TAB X:\Assets\Park Asset\Park Asset Condition\Signs.TAB X:\Assets\Park Asset\Park Asset Condition\SportsField.TAB X:\Assets\Park Asset\Park Asset Condition\SportsHardcourts.TAB X:\Assets\Park Asset\Park Asset Condition\StepHandrail.TAB X:\Assets\Park Asset\Park Asset Condition\WaterTaps.TAB X:\Assets\Documentation\ Assets Data Dictionary.doc provides detail as to the
fields used and the history of the layers.
Last Condition Survey
Condition survey conducted in 2011 and 2012 by Parks Officer and Infrastructure Assets Officer.
Condition Assessment Schedule
Not scheduled to be repeated in the immediate future. General condition and risk assessed by parks maintenance staff during the course
of routine maintenance.
General Assessment
of Condition
Condition Rating % of park furniture
1 Very Good 4%
2 Good 49%
3 Fair 31%
4 Poor 15%
5 Failed 2%
Level of Utilisation Currently unassessed
Level of User Satisfaction
Currently unassessed
Budget Implications
Maintenance Annual reactive, planned and cyclic maintenance shown for all parks assets, refer
100 Georges River Council // Asset Management Plan 101
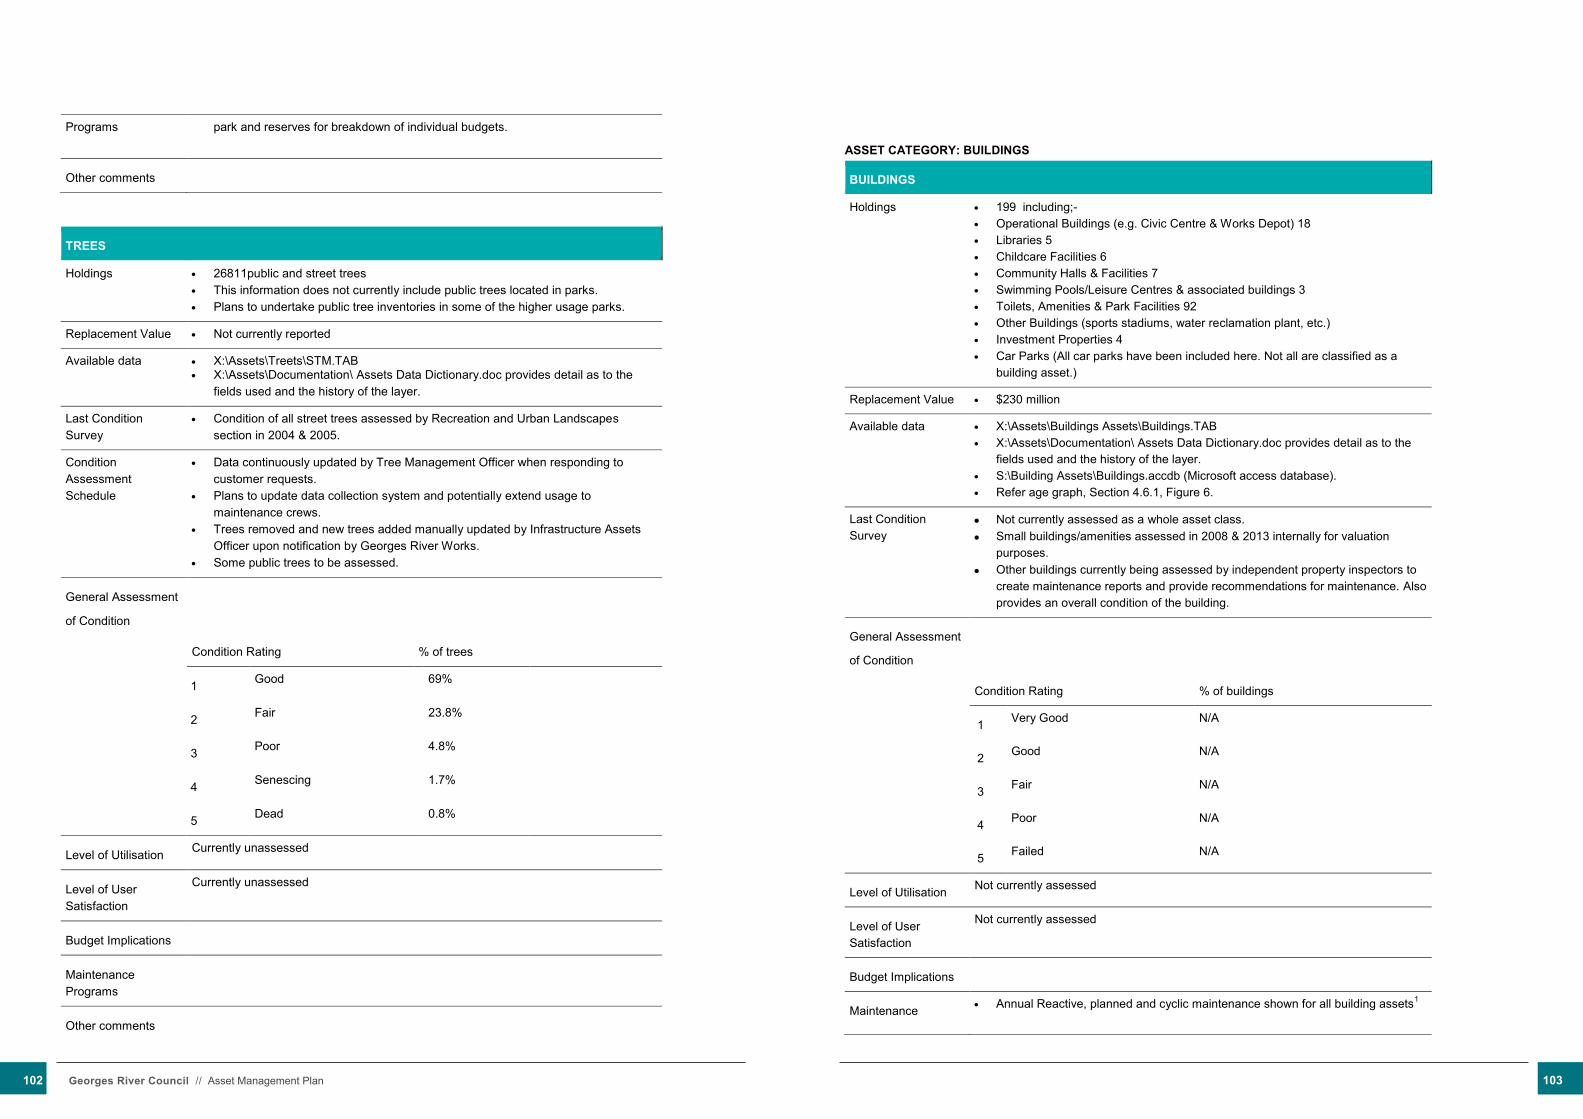
Programs park and reserves for breakdown of individual budgets.
Other comments
TREES
Holdings 26811public and street trees This information does not currently include public trees located in parks. Plans to undertake public tree inventories in some of the higher usage parks.
Replacement Value Not currently reported
Available data X:\Assets\Treets\STM.TAB X:\Assets\Documentation\ Assets Data Dictionary.doc provides detail as to the
fields used and the history of the layer.
Last Condition Survey
Condition of all street trees assessed by Recreation and Urban Landscapes section in 2004 & 2005.
Condition Assessment Schedule
Data continuously updated by Tree Management Officer when responding to customer requests.
Plans to update data collection system and potentially extend usage to maintenance crews.
Trees removed and new trees added manually updated by Infrastructure Assets Officer upon notification by Georges River Works.
Some public trees to be assessed.
General Assessment
of Condition
Condition Rating % of trees
1 Good 69%
2 Fair 23.8%
3 Poor 4.8%
4 Senescing 1.7%
5 Dead 0.8%
Level of Utilisation Currently unassessed
Level of User Satisfaction
Currently unassessed
Budget Implications
Maintenance Programs
Other comments
ASSET CATEGORY: BUILDINGS
BUILDINGS
Holdings 199 including;- Operational Buildings (e.g. Civic Centre & Works Depot) 18 Libraries 5 Childcare Facilities 6 Community Halls & Facilities 7 Swimming Pools/Leisure Centres & associated buildings 3 Toilets, Amenities & Park Facilities 92 Other Buildings (sports stadiums, water reclamation plant, etc.) 19 Investment Properties 4 Car Parks (All car parks have been included here. Not all are classified as a
building asset.)
Replacement Value $230 million
Available data X:\Assets\Buildings Assets\Buildings.TAB X:\Assets\Documentation\ Assets Data Dictionary.doc provides detail as to the
fields used and the history of the layer. S:\Building Assets\Buildings.accdb (Microsoft access database). Refer age graph, Section 4.6.1, Figure 6.
Last Condition Survey
Not currently assessed as a whole asset class. Small buildings/amenities assessed in 2008 & 2013 internally for valuation
purposes. Other buildings currently being assessed by independent property inspectors to
create maintenance reports and provide recommendations for maintenance. Also provides an overall condition of the building.
General Assessment
of Condition
Condition Rating % of buildings
1 Very Good N/A
2 Good N/A
3 Fair N/A
4 Poor N/A
5 Failed N/A
Level of Utilisation Not currently assessed
Level of User Satisfaction
Not currently assessed
Budget Implications
Maintenance Annual Reactive, planned and cyclic maintenance shown for all building assets1
102 Georges River Council // Asset Management Plan 103

Programs
Other comments 4-year buildings forward works program. Projects to componentise all buildings and alignment of building’s GIS and
database ongoing.
1 The following are the breakup of the different buildings maintenance budgets:-
Reactive maintenance o Car Parks (50%) o Buildings Minor Works (50%) o Properties (95%) o Civic Centre – various works (100%)
Planned maintenance o Car Parks (50%) o Buildings Minor Works (50%)
Cyclic maintenance o Properties (5%)
Property Operating Costs (Contract Cleaning) (100%)
CAR PARKS
Holdings 61 o 6 are part of a constructed building and maintenance is jointly managed
with the strata or the buildings’ owners. o 55 outdoor open land, mainly only pavement seal and line marking.
Surface types of outdoor car parks are as follows:- o A/C o Concrete o Paved o Gravel o Grass
Replacement Value Not currently reported, value of the three formed car parks included in Building value.
Available data X:\Assets\Buildings Assets\Car Parks\Carparks.TAB S:\Building Assets\Buildings.accdb (Microsoft access database) Refer age graph, Section 4.6.1, Figure 6, only includes built car parks age. Refer condition map in Appendix 4.
Last Condition Survey
Condition assessment conducted in 2003, 2012 and 2015 by Council staff, assessed condition of surface and line marking and adequacy of lighting.
Condition Assessment Schedule
Before the next full revision of this AMP, 2019.
Surface Condition
Condition Rating % of car parks
1 Very Good 25%
2 Good 23%
3 Fair 45%
4 Poor 8%
5 Failed 0%
Line Marking Condition
Condition Rating % of car parks
1 Very Good 15%
2 Good 35%
3 Fair 17%
4 Poor 3%
5 Failed 3%
N/A 28%
Level of Utilisation Currently unassessed
Level of User Satisfaction
Currently unassessed
Budget Implications
Maintenance Programs
Annual Reactive, planned and cyclic maintenance shown for all building assets, refer buildings above for the breakdown of the individual budgets.
Other comments
104 Georges River Council // Asset Management Plan 105

Appendix 3 - ASSET CONDITION INSPECTION METHODOLOGIES Roads Asset CategoryRoad Infrastructure Assets in the Georges River LGA are assessed using a 5 level condition rating based on the levels defined in the International Infrastructure Management Manual.
During inspection of assets, the assessor will make a determination of the final score which may be any number between 1 and 5, For example a score of 2.7 indicates that the asset segment inspected is broadly rated “good” but may have some parts of it that are in a poorer condition, thus slightly reducing its score. The determination of the final score will be in the judgement of the assessor based on visual inspection and the assessor’s background experience of the assets.
Road infrastructure assets such as the Road, Footpath & Kerb & Gutter are assessed in segments. Generally a road segment runs from intersection to intersection and is of homogenous nature, this does not necessarily apply to smaller laneways. Segments have been deliberately aligned with the numbering in the Council’s financial system, so as to easily calculate valuations and depreciations.
RoadsThe term “road” refers to that section of the road reserve between the kerbs. Most usually this is the bitumen section of the road.
Some of the considerations used by the assessor in the condition rating of roads include the road structure, the surface roughness and the extent of cracking. On this basis the five condition ratings for roads can generally be described as follows, with one or more of the descriptors being used to determine the final rating.
1 - Very Good • No significant deflections in the road surface.• No significant surface roughness.• No visible cracking.• Insignificant deterioration. • Asset likely to perform adequately without major work
for 20 years or more.
2 - Good• Minor deflections in the road surface, but not
requiring repair yet.
• Some level of roughness, but not dangerous to vehicle stability.
• Visible minor cracking that is only superficial.• Isolated potholes.• Only minor work required, if any.
3 - Fair• Some deflections in the road surface. May be found
in a good proportion of the length, but not dangerous to vehicle stability.
• Level of roughness that may cause a minimum level of ride discomfort, but not dangerous to stability or road grip.
• Cracking that is starting to become significant in extent and depth that requires monitoring.
• Pothole development and incidence may be high. • Failure unlikely within the next 10 years but further
deterioration likely and major replacement likely within next 5 to 15 years.
4 - Poor• Deflections on road surface are extensive to the point
of being dangerous for vehicle stability.• Roughness is significant to be a problem for ride and
grip and hence dangerous.• Extensive cracking indicating underlying problems
and exacerbating water ingress into the structure.• Extensive potholing and patching again indicating
structural problems that require addressing.• Failure likely in the short to medium term, likely need
to replace most or all of asset within short term, possibly next 2 years.
5 - Failed• Failed or failure imminent, immediate need to replace
most or all of asset. • Large increase in pavement roughness and surface
defects. • For all intent and purposes, the physical deterioration
of the road in the various considerations is such that it is a significant risk for vehicular traffic at normal operating speeds.
• Major work or replacement required urgently.
FootpathThe term “footpath” refers to the hard surface that pedestrians use located between the kerb and property boundary. The definition here does not include the grass nature strip or gardens found between kerb and property boundary. For assessment purposes, the footpath also includes driveways and pram ramps.
The predominant consideration for footpaths is deflections or displacements that could result in trip accidents. Roughness and aesthetics are less important considerations. On this basis the five condition ratings for footpaths can generally be described as follows, with one or more of the descriptors being used to determine the final rating.
1 - Very Good• No significant displacements between slabs.• No significant cracking within slabs.• Fresh looking in appearance
2 - Good• A number of slabs display displacements up to
10mm.• Some slabs may be cracked.• Fresh looking in appearance and fairly smooth.
3 - Fair• Several slabs have displacements up to 10mm and
some slabs have displacements up to 15mm.• Several slabs may have cracking.• Appearance may be fresh or somewhat faded with
a degree of roughness.
4 - Poor• Some slabs have displacements great than 15mm.• Some slabs have cracking that has fractured into
pieces that are loose and missing.• Appearance is very faded and dirty with high levels
of roughness.
5 - Failed• For all intent and purposes, the physical
deterioration of the footpath in the various considerations is such that it is a significant risk for the least able of pedestrians.
Kerb & Gutter (K&G)The K&G serves two main functions. The kerb section forms the shoulder of the road. The gutter section allows channelling of water into the drainage system. K&G will also include the layback of driveways.
The predominant consideration for K&G is for it to retain its linear design levels so as to allow proper drainage and forms a good shoulder for the road to grade to.
On this basis the five condition ratings for K&G can generally be described as follows, with one or more of the descriptors being used to determine the final rating.
1 - Very Good• No visible movement in K&G structure from original
design.• Very good aesthetic appearance.• unrestricted stormwater drainage adjacent to the
road pavement.
2 - Good• Minor movements in K&G structure but not affecting
stormwater drainage or road integrity.• Good appearance with little roughness in gutter
section.• Negligible distortion such as less than 5mm vertical
movement or less than 5mm stepping.
3 - Fair• Showing signs of surface deterioration, minor
distortions such as 5mm to 15mm vertical movements or greater than 5mm or less than 10mm stepping.
• Average appearance in several lengths with a greater level of roughness.
• These defects may cause localised minor ponding but do not impede stormwater drainage adjacent to the road pavement.
4 - Poor• Substantial surface deterioration or the construction
is affected by areas of cracking over several of the K&G lengths.
• K&G may display distortion greater than 15mm vertical movement or greater than 10mm stepping. This could also include the rolling back of sections which cause a step and drainage obstruction between the road and channel.
• These defects may cause ponding in the channel and impedes the water drainage adjacent to the road pavement.
• Poor appearance across most of the K&G length.
5 - Failed• For all intent and purposes, the physical
deterioration of the K&G in the various considerations is such that it is unable to perform any reasonable drainage function, or does not form a sound shoulder for the road to grade to, or is a hazard to traffic or the public.
106 Georges River Council // Asset Management Plan 107

Retaining Walls
ConstructionHow was the wall assembled? • Manmade – Constructed by human hands• Partial – Made from natural materials but have been
assisted by human intervention• Natural – Natural rock formation or a rock face
cutting
Construction MaterialWhat is the wall made of?• Stone• Timber• Concrete• Brick Note; For partial walls construction material is classified as the material that is in use on the majority of the wall e.g. If a stone cutting has several concrete and brick patches, the material noted would be stone as that makes up the bulk of the wall.
Natural walls can only have a construction material of stone.
Wall Type
What type of retaining wall is it?• Crib Wall
• Block Wall
• Cutting
Note; • Manmade walls will either be a block wall or a crib
wall. Partial and Natural walls will either be a block wall or a cutting.
• Natural rock formations that have not been cut are considered to be block walls
• Crib Walls will only be made of concrete or timber.• Cuttings will only be made of stone.
Condition
1 - Very Good • No visible cracking or wear• No effects of weathering• No disjointed blocks or slabs• No fault lines or deterioration in cuttings (check
around vegetation and rock joints for areas of clay and/or silt)
2 - Good • Minor cracking or wear• Minor effects due to weathering• Isolated disjointed blocks or slabs• Isolated fault lines or deterioration in cuttings
3 - Fair• Some cracking or wear• Some effects due to weathering• Some disjointed blocks or slabs, but not enough to
compromise the safety or stability of the structure• Fault lines and deterioration of clay joints in cuttings
may be more visible and require monitoring• Isolated location of concrete cancer/exposed
reinforcement• Isolated location of block separation
4 - Poor
• Extensive cracking or wear• Extensive damage due to weathering• Extensive disjointed blocks or slabs, which may
compromise the safety or stability of the structure• Fault lines and deterioration of clay joints in cutting
are highly visible and require remediation works• Extensive concrete cancer/exposed reinforcement• Extensive block separation• Visible leaning forward of the retaining wall
5 - Failed• Structure has failed, generally resulting in
collapse or the structure poses a significant risk to pedestrians or vehicles in the vicinity of the retaining wall.
Risk
What is the possibility of the wall causing danger to bystanders?• Low• Moderate• High
Likelihood of Failure• What is the possibility of the wall failing
(collapsing)?• unlikely• Possible• Almost Certain
Service Level (for any new walls added since the service levels were defined)Assign a service level to the wall based on the following categories;1. Walls and cuttings retaining Arterial or Sub-Arterial
Roads or walls/cuttings greater than 3m in height.2. Walls and cuttings retaining Local or Collector
Roads or walls/cuttings greater than 1.5m in height but less than 3m in height.
3. Landscaping walls or walls and cuttings less than 1.5m in height
Examples
Construction - Manmade, Construction Material - Concrete, Wall Type - Crib Wall, Condition - 3, Risk - Low, Likelihood of Failure - Unlikely, Service Level – 1.
Construction - Manmade, Construction Material - Timber, Wall Type - Crib Wall, Condition - 3, Risk - Low, Likelihood of Failure - Unlikely, Service Level – 3.
Construction - Manmade, Construction Material - Stone, Wall Type – Block Wall, Condition - 1, Risk - Low, Likelihood of Failure - Unlikely, Service Level – 3.
108 Georges River Council // Asset Management Plan 109
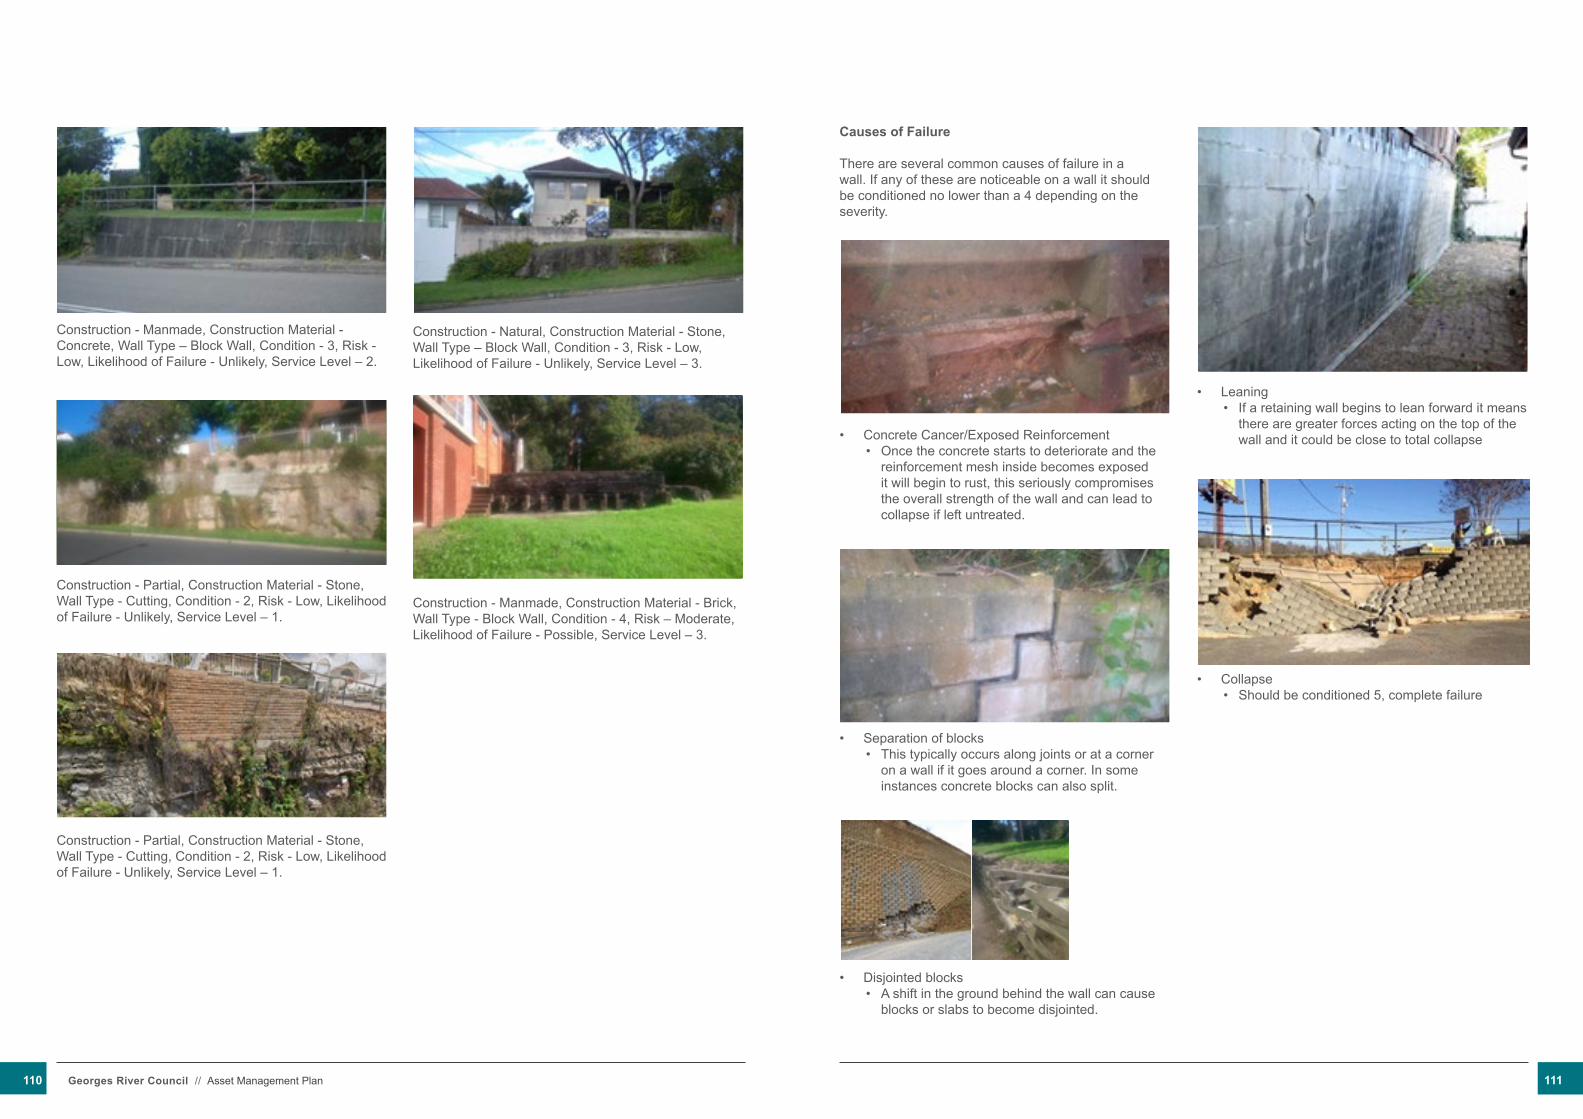
Construction - Manmade, Construction Material - Concrete, Wall Type – Block Wall, Condition - 3, Risk - Low, Likelihood of Failure - Unlikely, Service Level – 2.
Construction - Partial, Construction Material - Stone, Wall Type - Cutting, Condition - 2, Risk - Low, Likelihood of Failure - Unlikely, Service Level – 1.
Construction - Partial, Construction Material - Stone, Wall Type - Cutting, Condition - 2, Risk - Low, Likelihood of Failure - Unlikely, Service Level – 1.
Construction - Natural, Construction Material - Stone, Wall Type – Block Wall, Condition - 3, Risk - Low, Likelihood of Failure - Unlikely, Service Level – 3.
Construction - Manmade, Construction Material - Brick, Wall Type - Block Wall, Condition - 4, Risk – Moderate, Likelihood of Failure - Possible, Service Level – 3.
Causes of Failure
There are several common causes of failure in a wall. If any of these are noticeable on a wall it should be conditioned no lower than a 4 depending on the severity.
• Concrete Cancer/Exposed Reinforcement• Once the concrete starts to deteriorate and the
reinforcement mesh inside becomes exposed it will begin to rust, this seriously compromises the overall strength of the wall and can lead to collapse if left untreated.
• Separation of blocks• This typically occurs along joints or at a corner
on a wall if it goes around a corner. In some instances concrete blocks can also split.
• Disjointed blocks• A shift in the ground behind the wall can cause
blocks or slabs to become disjointed.
• Leaning• If a retaining wall begins to lean forward it means
there are greater forces acting on the top of the wall and it could be close to total collapse
• Collapse• Should be conditioned 5, complete failure
110 Georges River Council // Asset Management Plan 111

Stormwater Asset Category
Foreshore and Jetty Rating Definitions. Condition Ratings as per those supplied by WMAWater in 2008.
Excellent/Very GoodAs new/natural, with no significant damage and no maintenance requirements.
Good Superficial damage and/or weathering that does not affect the integrity and does not require maintenance but should be monitored periodically.
Fair Minor damage or weathering that requires minimal repairs.
Poor Major damage or substantial weathering that requires significant repairs.
Failed Substantial collapse that requires complete replacement.
Stormwater Pits
Pit Construction MaterialWhat is the pit constructed of? Pits in the Georges River LGA are generally either constructed from bricks or precast concrete. Pits also have either a brick or concrete/mortar base.
Pit ConditionWhen considering the condition of the pit, the following components of the asset are considered;
• The walls of the pit;• Whether the pit has a floor or not;• If there is a grate, the condition of the grate.
The following components of the asset are NOT considered• The lintel or opening of the pit. They are maintained
separately from the chamber itself;• Concrete pit lids. They are maintained separately
from the chamber itself.
1 - Very Good • No visible cracking or deterioration of mortar
between bricks• No visible cracking or deterioration of bricks
• No disjointed bricks• No visible cracking in precast concrete• The pit has a floor• No visible cracking or damage to the grate that
would compromise its functionality• No flora growing between joints, indicating gaps
2 - Good • Minimal visible cracking or deterioration of mortar
between bricks• Minimal visible cracking or deterioration of bricks• No disjointed bricks• Minimal visible cracking in precast concrete• The pit has a floor• No visible cracking or damage to the grate that
would compromise its functionality• Minimal flora growing between joints, indicating
gaps
3 - Fair• Some visible cracking or deterioration of mortar
between bricks• Some visible cracking or deterioration of bricks• Minimal disjointed bricks• Some visible cracking in precast concrete• The pit has a floor• Minimal visible cracking or damage to the grate that
would compromise its functionality• Some flora growing between joints, indicating gaps
4 - Poor• Extensive visible cracking or deterioration of mortar
between bricks• Extensive visible cracking or deterioration of bricks• Some disjointed bricks• Extensive visible cracking in precast concrete• The pit does not have a floor• Some visible cracking or damage to the grate that
would compromise its functionality• Extensive flora growing between joints, indicating
gaps
5 - Failed• Structure has failed, generally resulting in collapse
or loss of functionality
OtherPit condition monitoring is undertaken by the Assets Infrastructure Officer, in conjunction with work crew
members who provide assistance with lifting the pit lids safely.
Each pit is assessed and given a rating in the field, and then several photos are taken, using a good digital camera with a flash, and an extendable pole so that the images can be taken when the camera is inside the pit, and the assessor doesn’t have to reach in. Any cracks or faults should be photographed as evidence for the condition rating.
Condition rating data can be entered into the digital Pit Asset Register on the GIS layer Kogpit.TAB in the ‘Condition’ field, along with the name of assessor in Surveyed_by and date of monitoring Surveyed_date.
Pit construction material can be entered into the Pit Asset Register.
Parks & Recreation Asset CategoryPark Furniture and FittingsCondition Rating is the actual condition of the asset, appearance Rating is the appearance condition of the asset. Points to consider include:- • Appropriate park furniture for the location• Safe, hazard free, risk to public• Comfortable• Vandalism• Graffiti • Age• Aesthetic appeal• Function – park furniture which ensures that user
requirements are met
Condition is measured using a 1-5 rating system:-
1 - Very Good• As new and structurally sound. • No evidence of deterioration, damage or
discoloration. • Suitable for a range of populations.
2 – Good• Structurally sound. • Minor deterioration, discoloration and wear to
surfaces.• Fully functional and fit for purpose. • Only minor work required.
3 – Fair
• Minor cracking in structural elements. • Minor deterioration, discoloration wear or damage
to surfaces. • Minor evidence of weatherproof breaches,
dampness or mildew. • Fittings generally operational with minor breakages
or defect. • Functional but occasional restrictions on use. • Some customer concerns.• Suitable for a limited population type.
4 – Poor• Structure functional but signs of significant cracking
or distortion. • Breaches of weatherproofing evident.• Surfaces in need of significant repair or
replacement before recoating or painting. • Fixtures often inoperable or damaged. • Services have limited function.
5 – Fail• Structures have serious problems and the integrity
of the structure is questionable, serious cracking, distortion, leakages or breakages compromising operation and/or safety.
• Coatings badly damaged or non-existent.• Fittings unsafe or inoperable.• Structure is generally not fit for purpose or for use
by customers. • urgent replacement/ rehabilitation required. • Extremely poor design and not appropriate for most
of the population.
Example, condition 1, appearance 1
112 Georges River Council // Asset Management Plan 113
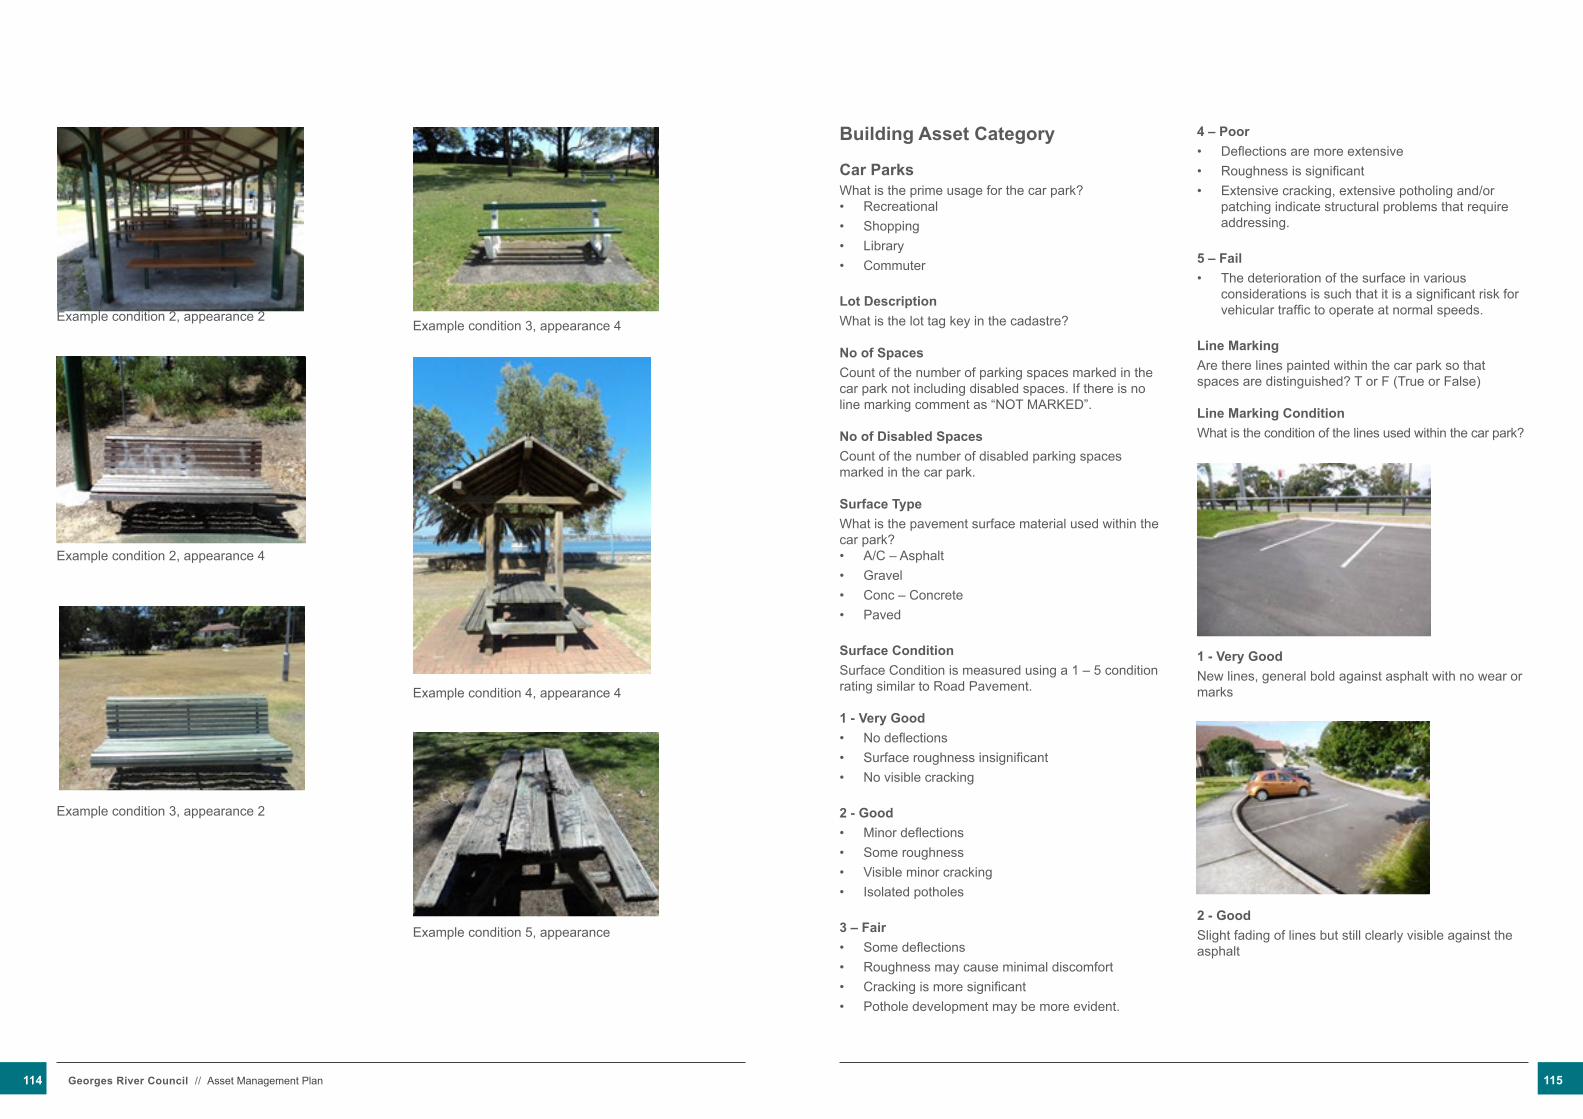
Example condition 2, appearance 2
Example condition 2, appearance 4
Example condition 3, appearance 2
Example condition 3, appearance 4
Example condition 4, appearance 4
Example condition 5, appearance
Building Asset Category Car ParksWhat is the prime usage for the car park?• Recreational• Shopping• Library• Commuter
Lot Description What is the lot tag key in the cadastre?
No of SpacesCount of the number of parking spaces marked in the car park not including disabled spaces. If there is no line marking comment as “NOT MARKED”.
No of Disabled Spaces Count of the number of disabled parking spaces marked in the car park.
Surface TypeWhat is the pavement surface material used within the car park?• A/C – Asphalt• Gravel• Conc – Concrete• Paved
Surface ConditionSurface Condition is measured using a 1 – 5 condition rating similar to Road Pavement.
1 - Very Good• No deflections• Surface roughness insignificant• No visible cracking
2 - Good• Minor deflections• Some roughness• Visible minor cracking• Isolated potholes
3 – Fair• Some deflections• Roughness may cause minimal discomfort• Cracking is more significant• Pothole development may be more evident.
4 – Poor • Deflections are more extensive• Roughness is significant• Extensive cracking, extensive potholing and/or
patching indicate structural problems that require addressing.
5 – Fail• The deterioration of the surface in various
considerations is such that it is a significant risk for vehicular traffic to operate at normal speeds.
Line MarkingAre there lines painted within the car park so that spaces are distinguished? T or F (True or False)
Line Marking ConditionWhat is the condition of the lines used within the car park?
1 - Very GoodNew lines, general bold against asphalt with no wear or marks
2 - GoodSlight fading of lines but still clearly visible against the asphalt
114 Georges River Council // Asset Management Plan 115
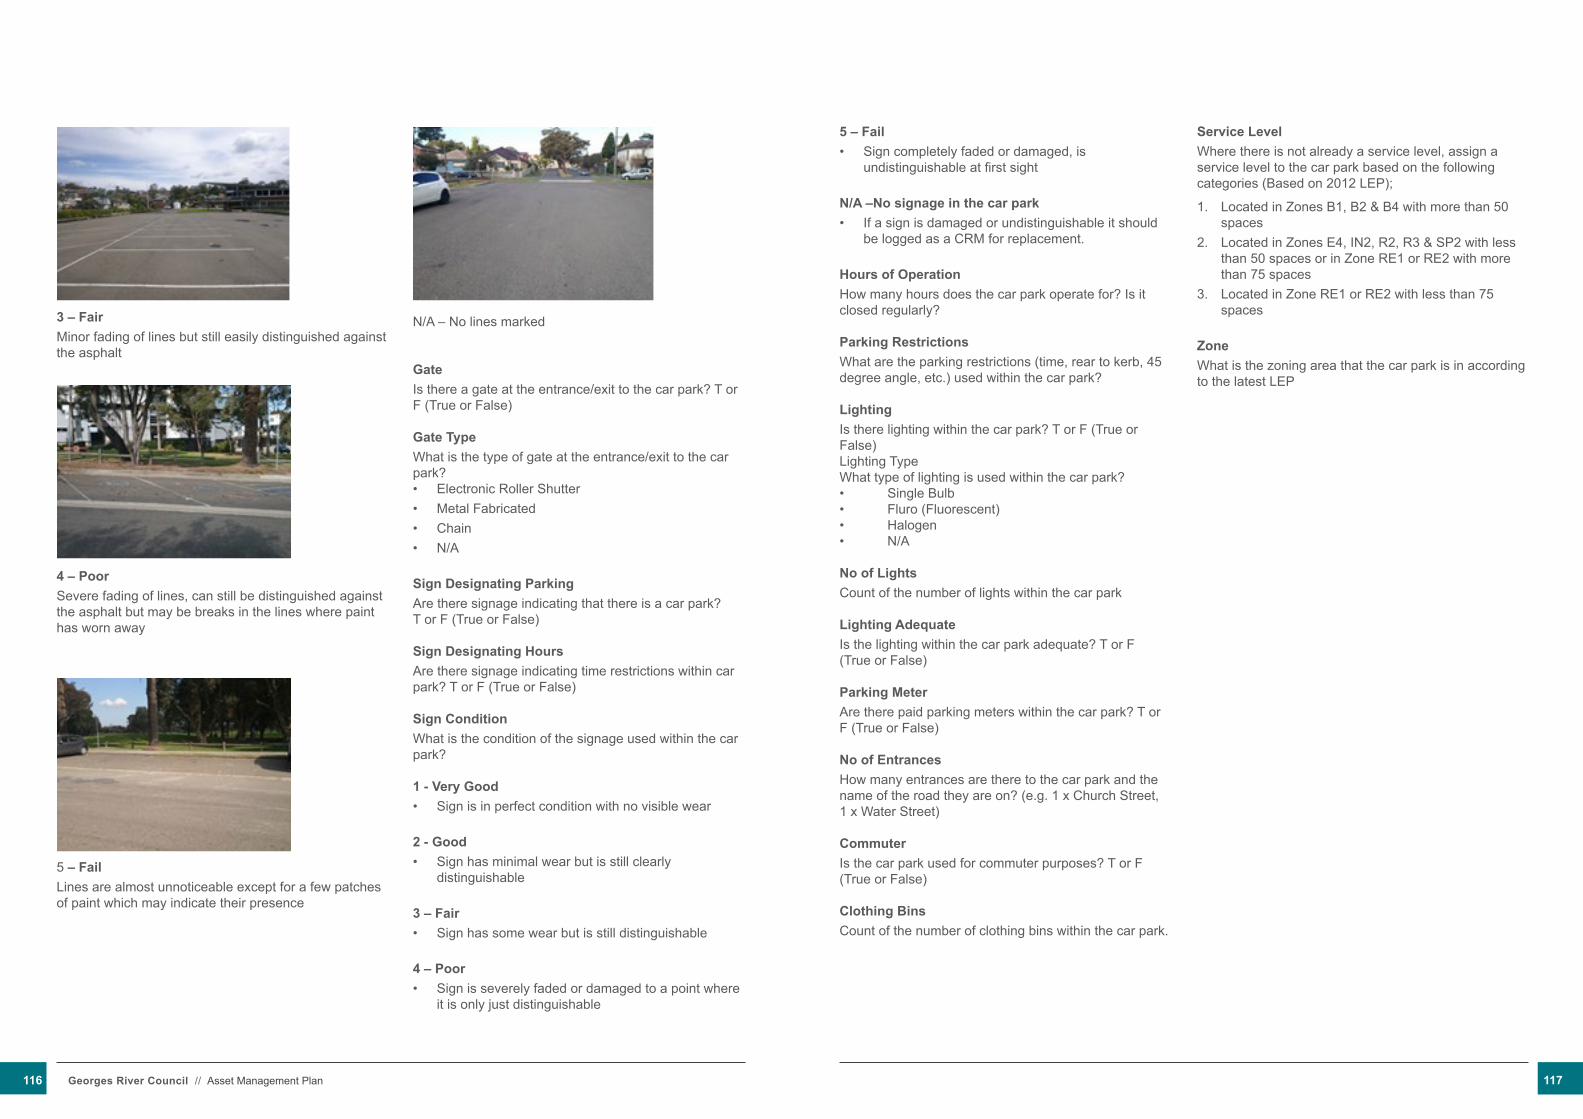
3 – Fair Minor fading of lines but still easily distinguished against the asphalt
4 – Poor Severe fading of lines, can still be distinguished against the asphalt but may be breaks in the lines where paint has worn away
5 – FailLines are almost unnoticeable except for a few patches of paint which may indicate their presence
N/A – No lines marked
GateIs there a gate at the entrance/exit to the car park? T or F (True or False)
Gate TypeWhat is the type of gate at the entrance/exit to the car park?• Electronic Roller Shutter• Metal Fabricated• Chain• N/A
Sign Designating ParkingAre there signage indicating that there is a car park? T or F (True or False)
Sign Designating HoursAre there signage indicating time restrictions within car park? T or F (True or False)
Sign ConditionWhat is the condition of the signage used within the car park?
1 - Very Good • Sign is in perfect condition with no visible wear
2 - Good• Sign has minimal wear but is still clearly
distinguishable
3 – Fair • Sign has some wear but is still distinguishable
4 – Poor • Sign is severely faded or damaged to a point where
it is only just distinguishable
5 – Fail• Sign completely faded or damaged, is
undistinguishable at first sight
N/A –No signage in the car park• If a sign is damaged or undistinguishable it should
be logged as a CRM for replacement.
Hours of OperationHow many hours does the car park operate for? Is it closed regularly?
Parking RestrictionsWhat are the parking restrictions (time, rear to kerb, 45 degree angle, etc.) used within the car park?
LightingIs there lighting within the car park? T or F (True or False)Lighting TypeWhat type of lighting is used within the car park?• Single Bulb• Fluro (Fluorescent)• Halogen• N/A
No of LightsCount of the number of lights within the car park
Lighting AdequateIs the lighting within the car park adequate? T or F (True or False)
Parking MeterAre there paid parking meters within the car park? T or F (True or False)
No of EntrancesHow many entrances are there to the car park and the name of the road they are on? (e.g. 1 x Church Street, 1 x Water Street)
CommuterIs the car park used for commuter purposes? T or F (True or False)
Clothing BinsCount of the number of clothing bins within the car park.
Service LevelWhere there is not already a service level, assign a service level to the car park based on the following categories (Based on 2012 LEP);
1. Located in Zones B1, B2 & B4 with more than 50 spaces
2. Located in Zones E4, IN2, R2, R3 & SP2 with less than 50 spaces or in Zone RE1 or RE2 with more than 75 spaces
3. Located in Zone RE1 or RE2 with less than 75 spaces
ZoneWhat is the zoning area that the car park is in according to the latest LEP
116 Georges River Council // Asset Management Plan 117

Appendix 4 - ASSET CONDITION AND LOCATION MAPSRoad Pavement Condition MapFootpath Condition MapKerb and Gutter Condition MapStormwater Pipes MapPublic Jetties Condition MapPlayground Condition MapCar Parks Location MapParks and Reserves Location MapStormwater Quality Improvement Device (SQID) Location MapCouncil Buildings Location Map
2016
/17
Res
ourc
ing
Stra
tegy
P
age
1
RO
AD
PA
VE
ME
NT
CO
ND
ITIO
N M
AP
118 Georges River Council // Asset Management Plan 119

2016
/17
Res
ourc
ing
Stra
tegy
P
age
2
FO
OT
PA
TH
CO
ND
ITIO
N M
AP
2016
/17
Res
ourc
ing
Stra
tegy
P
age
3
KE
RB
AN
D G
UT
TE
R C
ON
DIT
ION
MA
P
120 Georges River Council // Asset Management Plan 121
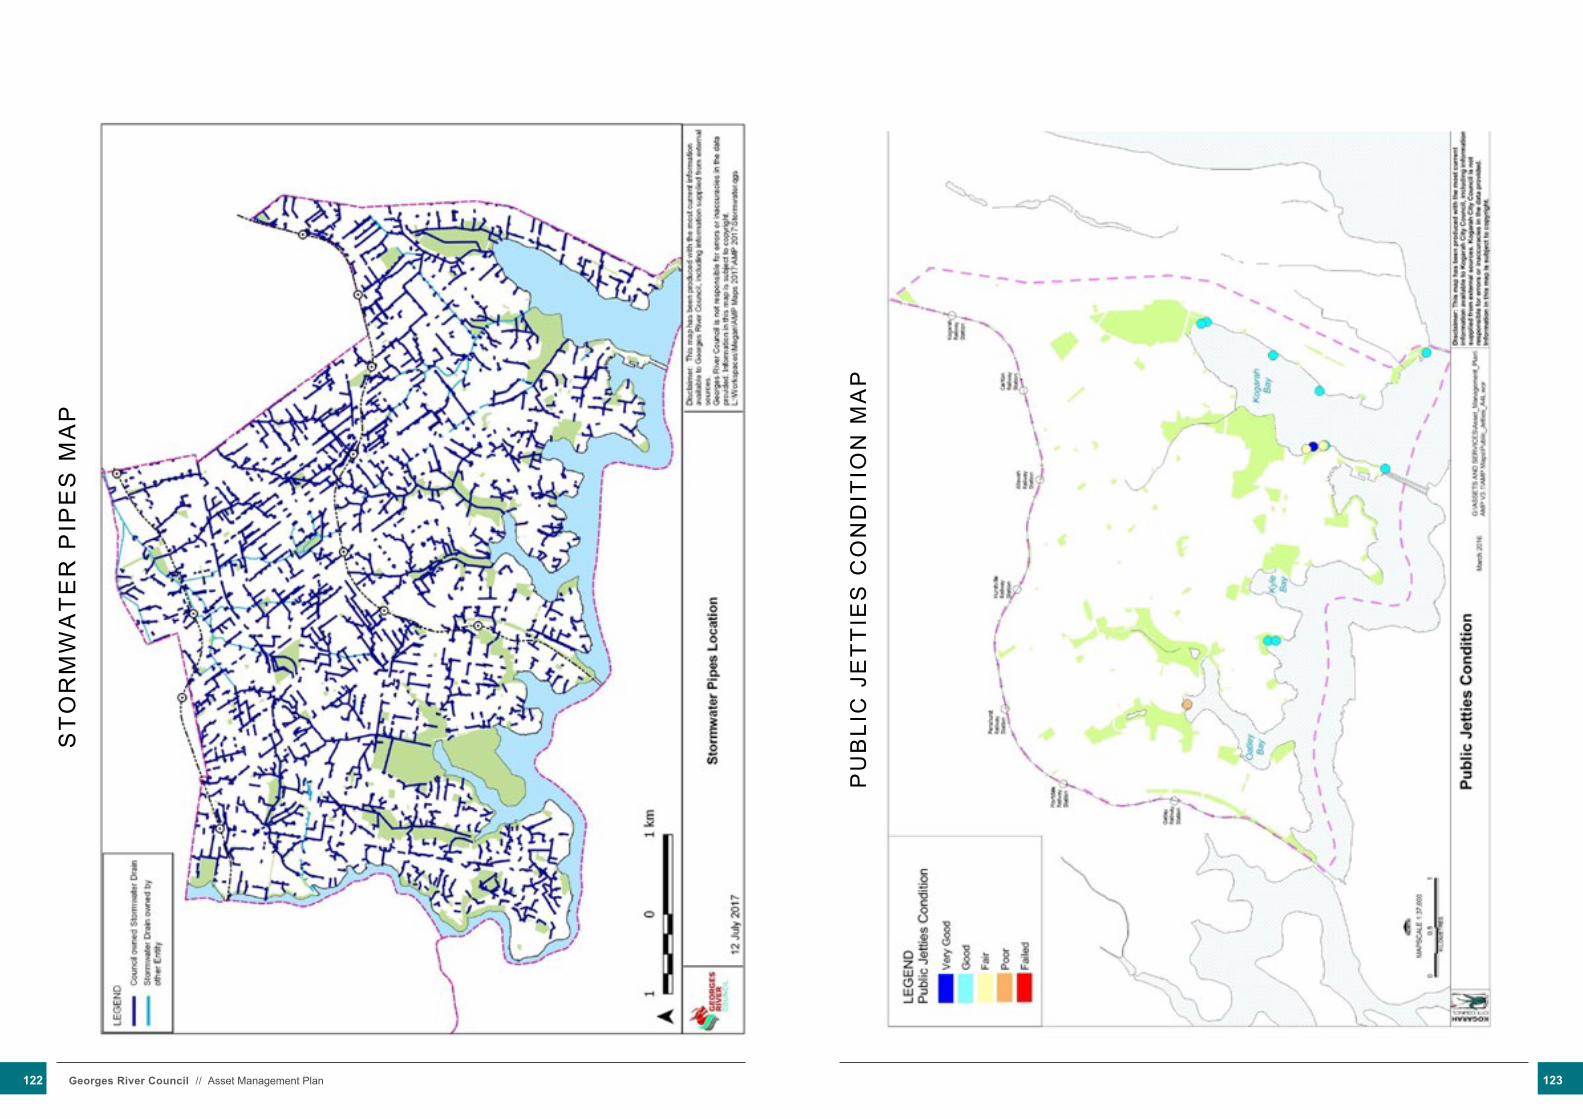
2016
/17
Res
ourc
ing
Stra
tegy
P
age
4
ST
OR
MW
AT
ER
PIP
ES
MA
P
2016
/17
Res
ourc
ing
Stra
tegy
P
age
5
PU
BLI
C J
ET
TIE
S C
ON
DIT
ION
MA
P
122 Georges River Council // Asset Management Plan 123
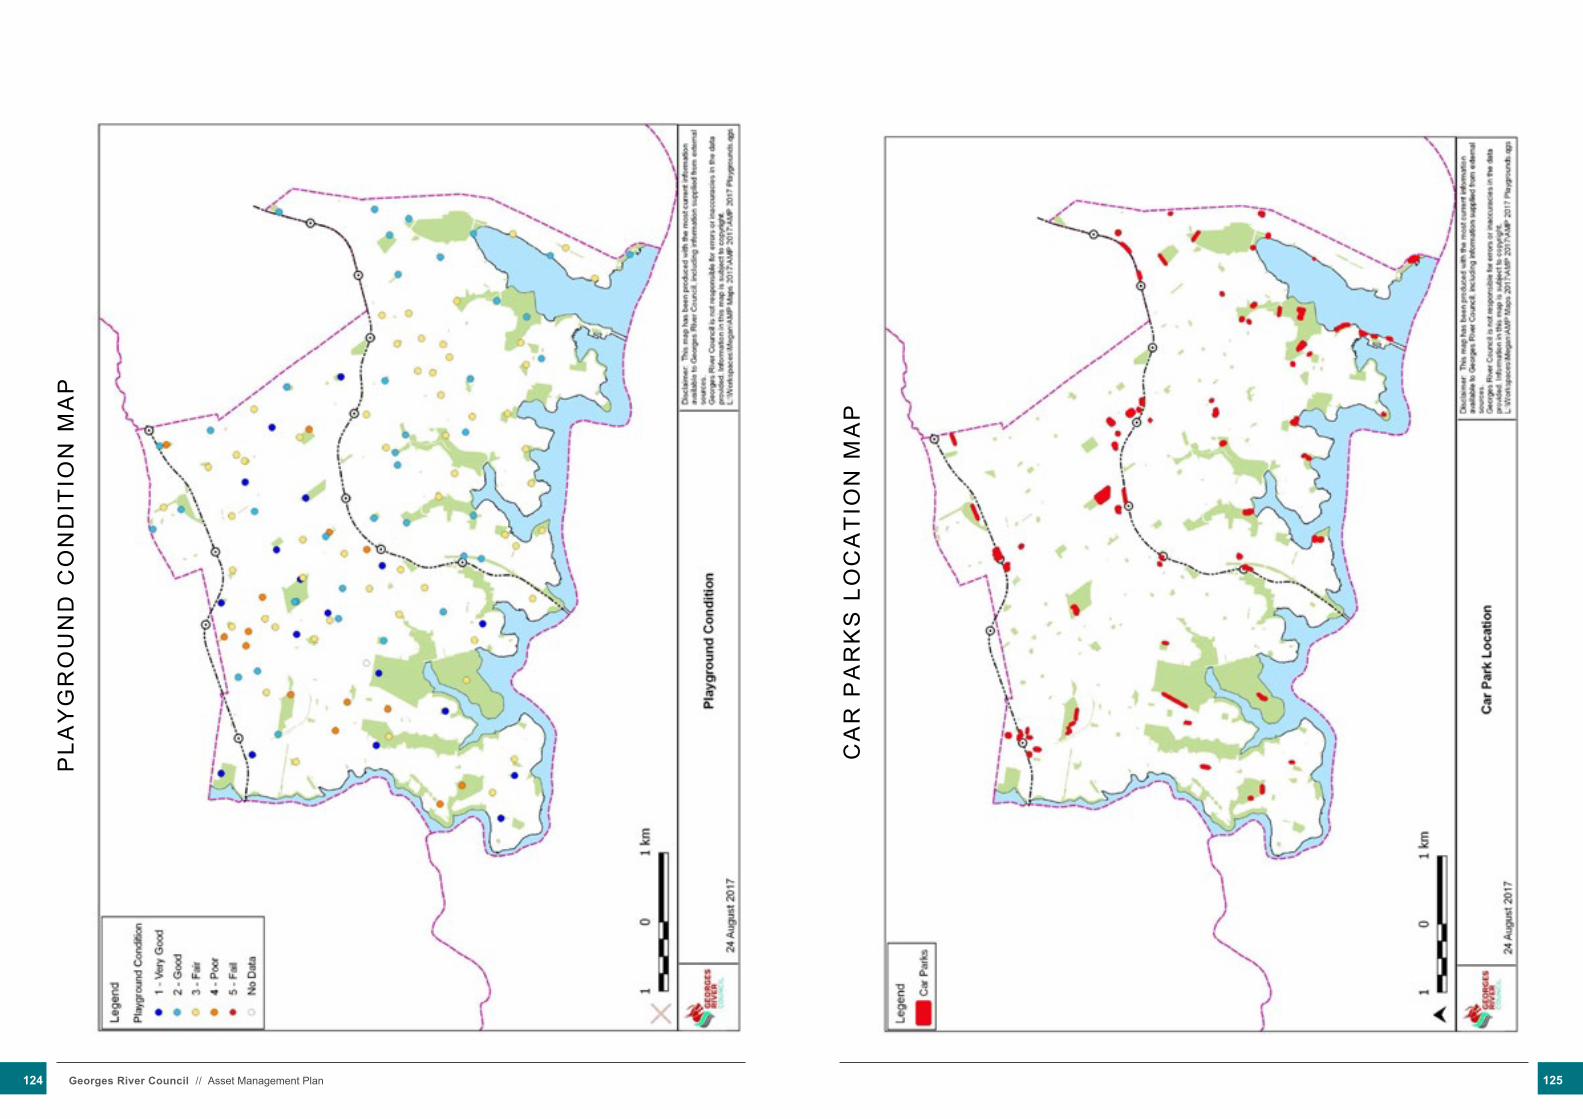
2016
/17
Res
ourc
ing
Stra
tegy
P
age
6
PLA
YG
RO
UN
D C
ON
DIT
ION
MA
P
2016
/17
Res
ourc
ing
Stra
tegy
P
age
7
CA
R P
AR
KS
LO
CA
TIO
N M
AP
124 Georges River Council // Asset Management Plan 125
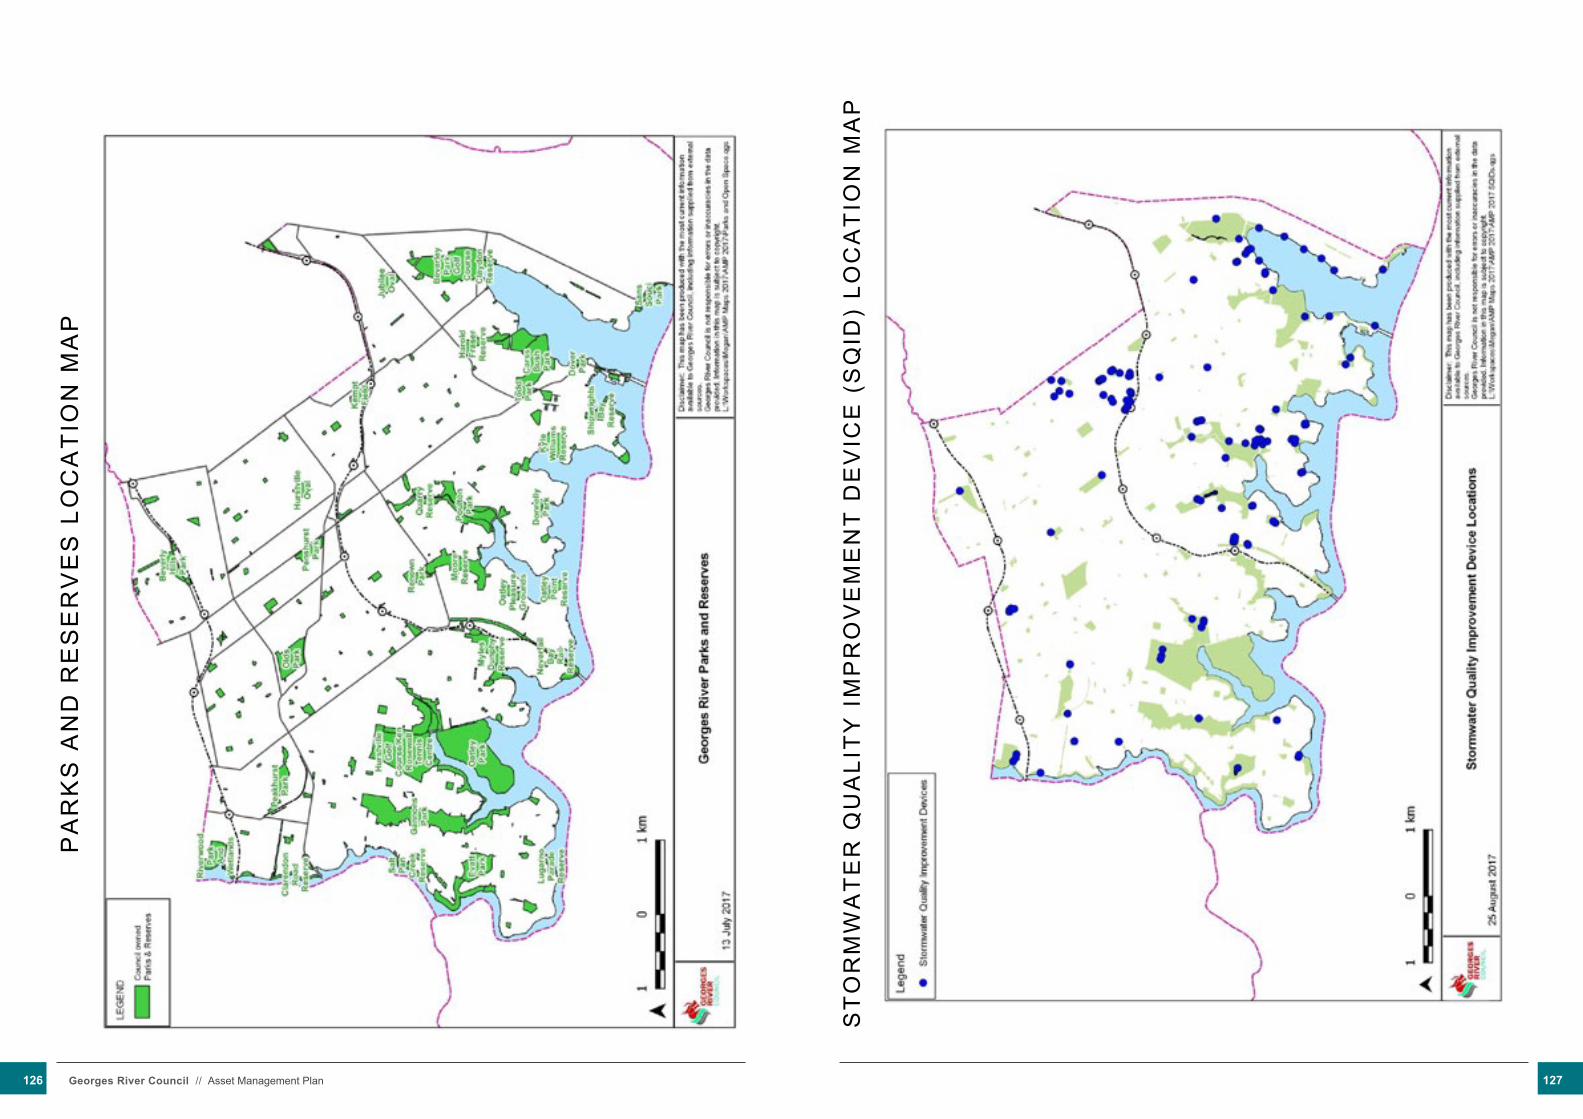
2016
/17
Res
ourc
ing
Stra
tegy
P
age
8
PA
RK
S A
ND
RE
SE
RV
ES
LO
CA
TIO
N M
AP
2016
/17
Res
ourc
ing
Stra
tegy
P
age
9
ST
OR
MW
AT
ER
QU
ALI
TY
IM
PR
OV
EM
EN
T D
EV
ICE
(S
QID
) LO
CA
TIO
N M
AP
126 Georges River Council // Asset Management Plan 127
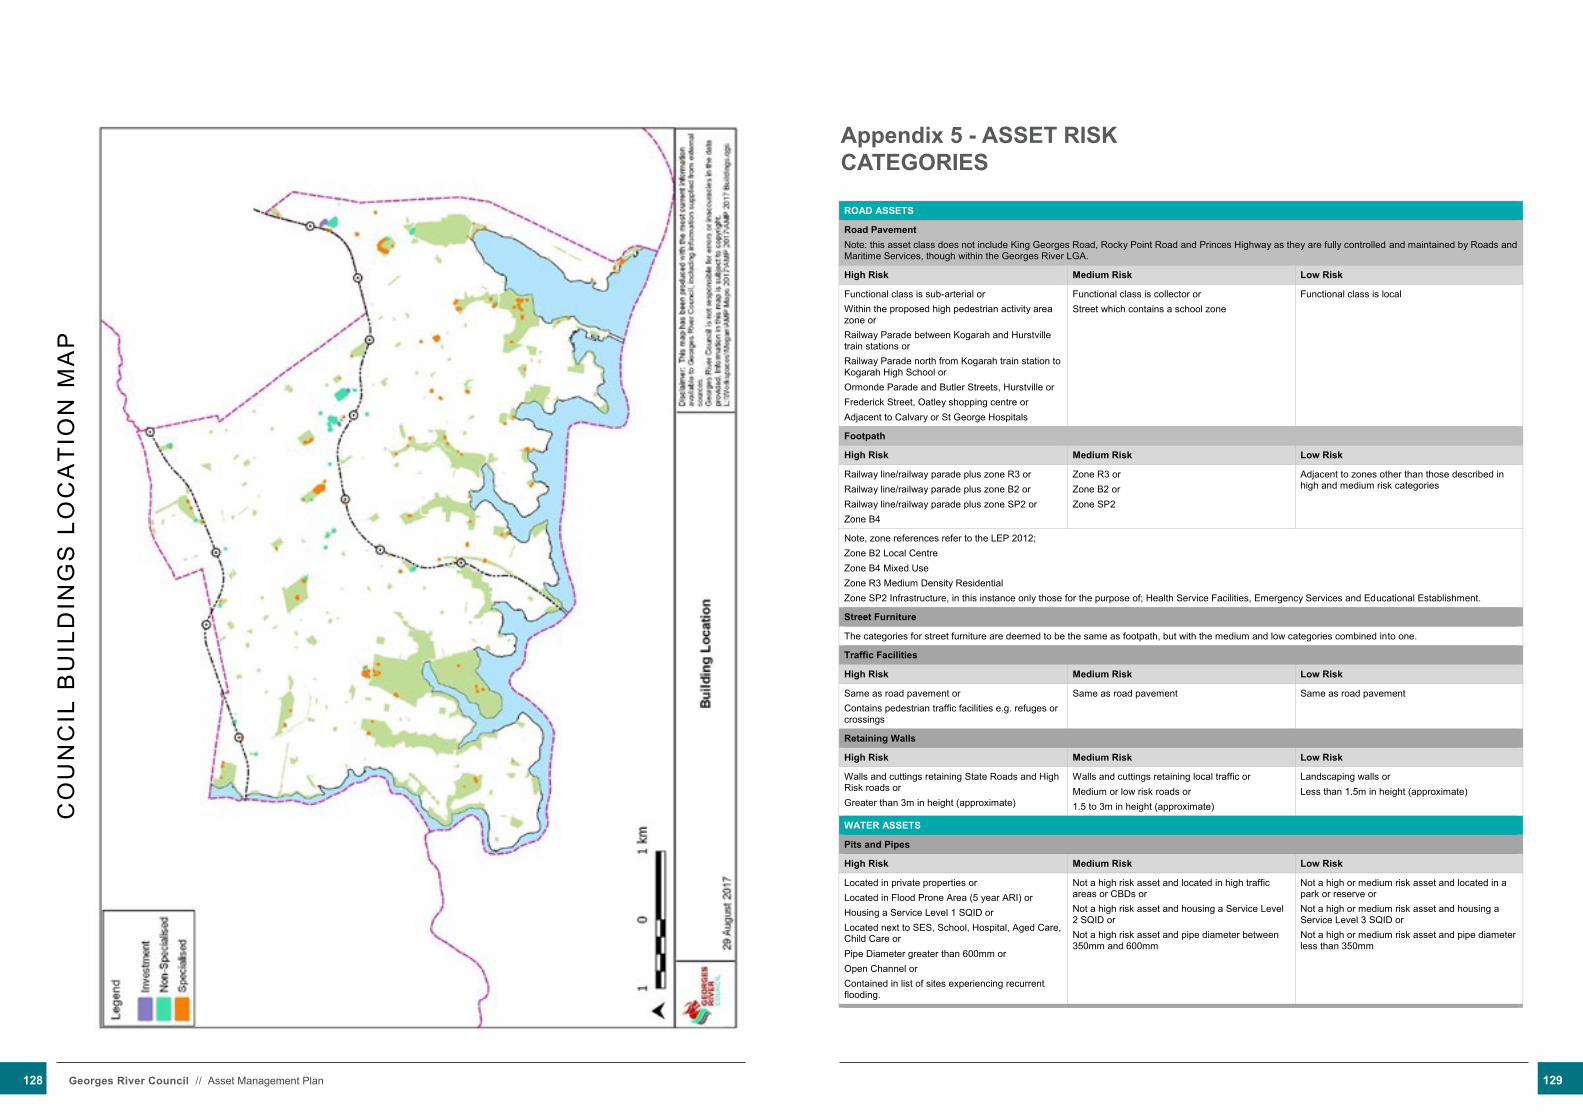
2016
/17
Res
ourc
ing
Stra
tegy
P
age
10
CO
UN
CIL
BU
ILD
ING
S L
OC
AT
ION
MA
P
Appendix 5 - ASSET RISK CATEGORIES
ROAD ASSETS
Road Pavement Note: this asset class does not include King Georges Road, Rocky Point Road and Princes Highway as they are fully controlled and maintained by Roads and Maritime Services, though within the Georges River LGA.
High Risk Medium Risk Low Risk
Functional class is sub-arterial or Within the proposed high pedestrian activity area zone or Railway Parade between Kogarah and Hurstville train stations or Railway Parade north from Kogarah train station to Kogarah High School or Ormonde Parade and Butler Streets, Hurstville or Frederick Street, Oatley shopping centre or Adjacent to Calvary or St George Hospitals
Functional class is collector or Street which contains a school zone
Functional class is local
Footpath
High Risk Medium Risk Low Risk
Railway line/railway parade plus zone R3 or Railway line/railway parade plus zone B2 or Railway line/railway parade plus zone SP2 or Zone B4
Zone R3 or Zone B2 or Zone SP2
Adjacent to zones other than those described in high and medium risk categories
Note, zone references refer to the LEP 2012; Zone B2 Local Centre Zone B4 Mixed Use Zone R3 Medium Density Residential Zone SP2 Infrastructure, in this instance only those for the purpose of; Health Service Facilities, Emergency Services and Educational Establishment.
Street Furniture
The categories for street furniture are deemed to be the same as footpath, but with the medium and low categories combined into one.
Traffic Facilities
High Risk Medium Risk Low Risk
Same as road pavement or Contains pedestrian traffic facilities e.g. refuges or crossings
Same as road pavement Same as road pavement
Retaining Walls
High Risk Medium Risk Low Risk
Walls and cuttings retaining State Roads and High Risk roads or Greater than 3m in height (approximate)
Walls and cuttings retaining local traffic or Medium or low risk roads or 1.5 to 3m in height (approximate)
Landscaping walls or Less than 1.5m in height (approximate)
WATER ASSETS
Pits and Pipes
High Risk Medium Risk Low Risk
Located in private properties or Located in Flood Prone Area (5 year ARI) or Housing a Service Level 1 SQID or Located next to SES, School, Hospital, Aged Care, Child Care or Pipe Diameter greater than 600mm or Open Channel or Contained in list of sites experiencing recurrent flooding.
Not a high risk asset and located in high traffic areas or CBDs or Not a high risk asset and housing a Service Level 2 SQID or Not a high risk asset and pipe diameter between 350mm and 600mm
Not a high or medium risk asset and located in a park or reserve or Not a high or medium risk asset and housing a Service Level 3 SQID or Not a high or medium risk asset and pipe diameter less than 350mm
Stormwater Quality Improvement Devices (SQID)
High Risk Medium Risk Low Risk
SQID located in high profile areas or SQID protecting swimming areas or environmentally sensitive areas or SQID identified as Critical Control Points by Water Quality Management Strategy
SQID located in parks or SQID protecting the bays of the Georges River
SQID located in the road reserve
Seawalls
High Risk Medium Risk Low Risk
Vertical seawalls retaining roads or car parks with a height greater than 1.5m
Vertical seawalls retaining roads or car parks with a height less than 1.5m or Non-vertical seawalls retaining roads or car parks or
Non-vertical seawalls not included in medium risk assets or Seawalls retaining footpaths with a height less than 1.5m or
128 Georges River Council // Asset Management Plan 129
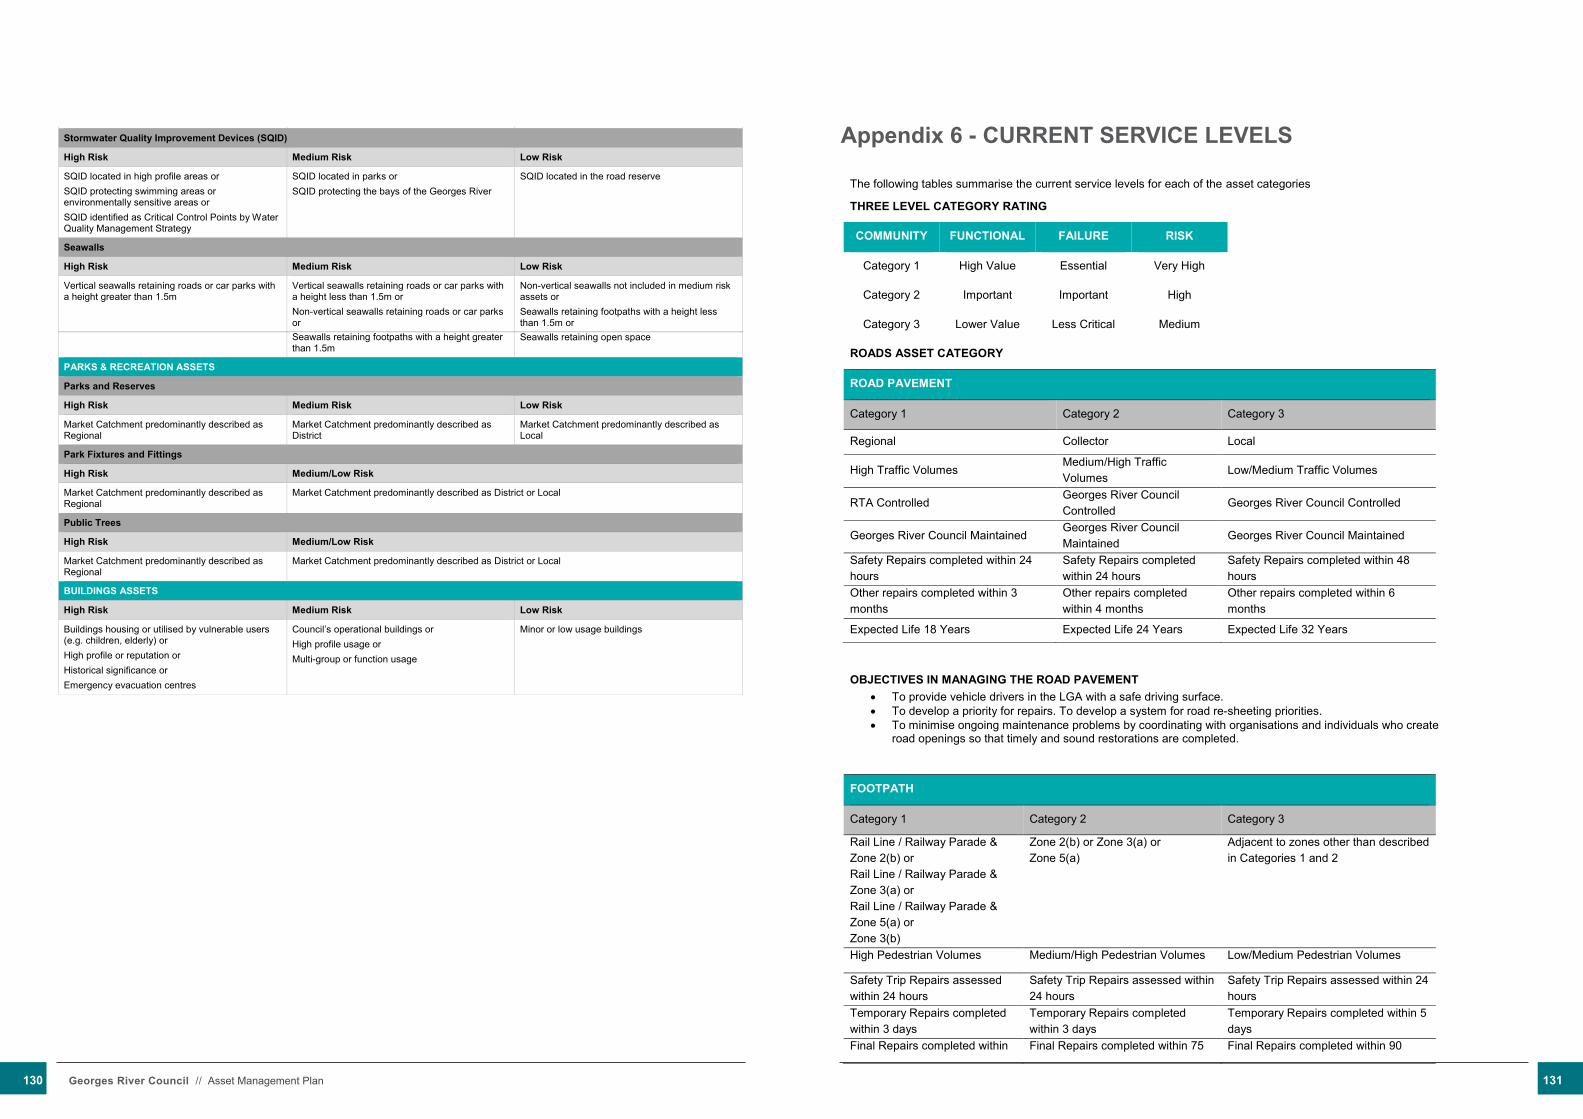
Seawalls retaining footpaths with a height greater than 1.5m
Seawalls retaining open space
PARKS & RECREATION ASSETS
Parks and Reserves
High Risk Medium Risk Low Risk
Market Catchment predominantly described as Regional
Market Catchment predominantly described as District
Market Catchment predominantly described as Local
Park Fixtures and Fittings
High Risk Medium/Low Risk
Market Catchment predominantly described as Regional
Market Catchment predominantly described as District or Local
Public Trees
High Risk Medium/Low Risk
Market Catchment predominantly described as Regional
Market Catchment predominantly described as District or Local
BUILDINGS ASSETS
High Risk Medium Risk Low Risk
Buildings housing or utilised by vulnerable users (e.g. children, elderly) or High profile or reputation or Historical significance or Emergency evacuation centres
Council’s operational buildings or High profile usage or Multi-group or function usage
Minor or low usage buildings
ROAD ASSETS
Road Pavement Note: this asset class does not include King Georges Road, Rocky Point Road and Princes Highway as they are fully controlled and maintained by Roads and Maritime Services, though within the Georges River LGA.
High Risk Medium Risk Low Risk
Functional class is sub-arterial or Within the proposed high pedestrian activity area zone or Railway Parade between Kogarah and Hurstville train stations or Railway Parade north from Kogarah train station to Kogarah High School or Ormonde Parade and Butler Streets, Hurstville or Frederick Street, Oatley shopping centre or Adjacent to Calvary or St George Hospitals
Functional class is collector or Street which contains a school zone
Functional class is local
Footpath
High Risk Medium Risk Low Risk
Railway line/railway parade plus zone R3 or Railway line/railway parade plus zone B2 or Railway line/railway parade plus zone SP2 or Zone B4
Zone R3 or Zone B2 or Zone SP2
Adjacent to zones other than those described in high and medium risk categories
Note, zone references refer to the LEP 2012; Zone B2 Local Centre Zone B4 Mixed Use Zone R3 Medium Density Residential Zone SP2 Infrastructure, in this instance only those for the purpose of; Health Service Facilities, Emergency Services and Educational Establishment.
Street Furniture
The categories for street furniture are deemed to be the same as footpath, but with the medium and low categories combined into one.
Traffic Facilities
High Risk Medium Risk Low Risk
Same as road pavement or Contains pedestrian traffic facilities e.g. refuges or crossings
Same as road pavement Same as road pavement
Retaining Walls
High Risk Medium Risk Low Risk
Walls and cuttings retaining State Roads and High Risk roads or Greater than 3m in height (approximate)
Walls and cuttings retaining local traffic or Medium or low risk roads or 1.5 to 3m in height (approximate)
Landscaping walls or Less than 1.5m in height (approximate)
WATER ASSETS
Pits and Pipes
High Risk Medium Risk Low Risk
Located in private properties or Located in Flood Prone Area (5 year ARI) or Housing a Service Level 1 SQID or Located next to SES, School, Hospital, Aged Care, Child Care or Pipe Diameter greater than 600mm or Open Channel or Contained in list of sites experiencing recurrent flooding.
Not a high risk asset and located in high traffic areas or CBDs or Not a high risk asset and housing a Service Level 2 SQID or Not a high risk asset and pipe diameter between 350mm and 600mm
Not a high or medium risk asset and located in a park or reserve or Not a high or medium risk asset and housing a Service Level 3 SQID or Not a high or medium risk asset and pipe diameter less than 350mm
Stormwater Quality Improvement Devices (SQID)
High Risk Medium Risk Low Risk
SQID located in high profile areas or SQID protecting swimming areas or environmentally sensitive areas or SQID identified as Critical Control Points by Water Quality Management Strategy
SQID located in parks or SQID protecting the bays of the Georges River
SQID located in the road reserve
Seawalls
High Risk Medium Risk Low Risk
Vertical seawalls retaining roads or car parks with a height greater than 1.5m
Vertical seawalls retaining roads or car parks with a height less than 1.5m or Non-vertical seawalls retaining roads or car parks or
Non-vertical seawalls not included in medium risk assets or Seawalls retaining footpaths with a height less than 1.5m or
Appendix 6 - CURRENT SERVICE LEVELS
The following tables summarise the current service levels for each of the asset categories
THREE LEVEL CATEGORY RATING
COMMUNITY FUNCTIONAL FAILURE RISK
Category 1 High Value Essential Very High
Category 2 Important Important High
Category 3 Lower Value Less Critical Medium
ROADS ASSET CATEGORY
ROAD PAVEMENT
Category 1 Category 2 Category 3
Regional Collector Local
High Traffic Volumes Medium/High Traffic Volumes
Low/Medium Traffic Volumes
RTA Controlled Georges River Council Controlled
Georges River Council Controlled
Georges River Council Maintained Georges River Council Maintained
Georges River Council Maintained
Safety Repairs completed within 24 hours
Safety Repairs completed within 24 hours
Safety Repairs completed within 48 hours
Other repairs completed within 3 months
Other repairs completed within 4 months
Other repairs completed within 6 months
Expected Life 18 Years Expected Life 24 Years Expected Life 32 Years
OBJECTIVES IN MANAGING THE ROAD PAVEMENT To provide vehicle drivers in the LGA with a safe driving surface. To develop a priority for repairs. To develop a system for road re-sheeting priorities. To minimise ongoing maintenance problems by coordinating with organisations and individuals who create
road openings so that timely and sound restorations are completed.
FOOTPATH
Category 1 Category 2 Category 3
Rail Line / Railway Parade & Zone 2(b) or Rail Line / Railway Parade & Zone 3(a) or Rail Line / Railway Parade & Zone 5(a) or Zone 3(b)
Zone 2(b) or Zone 3(a) or Zone 5(a)
Adjacent to zones other than described in Categories 1 and 2
High Pedestrian Volumes Medium/High Pedestrian Volumes Low/Medium Pedestrian Volumes
Safety Trip Repairs assessed within 24 hours
Safety Trip Repairs assessed within 24 hours
Safety Trip Repairs assessed within 24 hours
Temporary Repairs completed within 3 days
Temporary Repairs completed within 3 days
Temporary Repairs completed within 5 days
Final Repairs completed within Final Repairs completed within 75 Final Repairs completed within 90
130 Georges River Council // Asset Management Plan 131

60 days or subject to school timetables
days or subject to school timetables days
* Zone 2(b) – Residential (Medium Density) * Zone 3(a) – Business (Local Centre) * Zone 3(b) – Business (Town Centre) * Zone 5(a) – Special Uses (General). Includes schools and hospitals.
OBJECTIVES IN MANAGING FOOTPATHS To provide safe access for users of Council’s footpaths. To develop a priority for repairs. To develop a system for recording and reporting on the condition of Council’s footpaths and reported injuries. To minimise ongoing maintenance problems by considering footpath repair and replacement programs in
conjunction with the Street Tree Master Plan for tree planting and replacements in the road reserve. To develop a decision support tool for construction in areas without footpaths.
KERB & GUTTER
Category 1 Category 2 Category 3
Category 1 Roads (Regional) Category 2 Roads (Collector) Category 3 Roads (Local)
High Traffic Volumes Medium/High Traffic Volumes Low/Medium Traffic Volumes
Heritage Kerb (Brick, Stone)
Safety Repairs completed within 24 hours
Safety Repairs completed within 24 hours
Safety Repairs completed within 24 hours
OBJECTIVES IN MANAGING KERB AND GUTTER To maintain kerb and gutter to minimise the incidence of potential trip accidents. To maintain efficient stormwater flow via the kerb & gutter to stormwater pits. To retain and maintain the existing kerb & gutters that are valued as heritage items in accordance with the
Heritage Kerb and Gutter Policy. To provide an effective shoulder for the road pavement and basis for level control when re-sheeting roads.
STREET FURNITURE
Category 1 Category 2 Category 3
Zone 3(a) or Zone 3(b)
Zone 2(b) or Zone 5(a) Adjacent to zones other than described in Category 1 and Category 2
High Pedestrian Volumes, commercial, shopping, food outlets
Medium/High Pedestrian Volumes Low/Medium Pedestrian Volumes
Safety Repairs assessed within 24 hours
Safety Repairs assessed within 24 hours
Safety Repairs assessed within 24 hours
Final Repair/Replacement within 30 days
Final Repair/Replacement within 60 days
Final Repair/Replacement within 90 days
*Zone 2(b) - Residential (Medium Density) *Zone 3(a) - Business (Local Centre) *Zone 3(b) - Business (Town Centre) *Zone 5(a) - Special Uses (General)
OBJECTIVES IN MANAGING STREET FURNITURE To provide street furniture that is accessible, safe and comfortable. Ensure street furniture meets the needs of the community and is of an appropriate style for the location. Reduce the incidence and impact of vandalism and graffiti through appropriate choice of durable, low
maintenance furniture.
TRAFFIC FACILITIES
Category 1 Category 2 Category 3
All Regulatory Signs Parking or Restricted Parking Signs, Warning Signs
Information Signs
Traffic Structures in Regional Roads
Traffic Structures in Collector Roads or roads with Category 1 or 2 Footpath
Traffic Structures not covered in Category 1 and Category 2
Line Marking associated with Regulatory Signs
Line Marking on Regional and Collector Roads
Line Marking not covered in Category 1 and Category 2
Safety Repairs assessed within 24 hours
Safety Repairs assessed within 24 hours
Safety Repairs assessed within 24 hours
Final Repairs completed within 60 days
Final Repairs completed within 75 days
Final Repairs completed within 90 days
Replacement of signs and line marking relies on external contractors and custom made items. Response times are dependent upon contractor availability
OBJECTIVES IN MANAGING TRAFFIC FACILITIES Meet Australian Standards in terms of size, placement and condition. Provide safe paths for vehicles, cyclists and pedestrians. To maintain traffic flow with minimal disruptions.
RETAINING WALLS AND CUTTINGS
Category 1 Category 2 Category 3
Walls & cuttings retaining State Roads and Category 1 Roads or Walls & cuttings greater than approximately 3m in height
Walls & cuttings retaining local traffic and Category 2-3 Roads or Walls & cuttings approximately 1.5 to 3m in height
Landscaping walls or Walls & cuttings less than approximately 1.5m in height
Walls & cuttings retaining heavy load vehicles and buildings
Walls & cuttings retaining general vehicles and or pedestrians
Walls & cuttings retaining natural areas and landscaping
Emergency response 24 hours Emergency response 48 hours Emergency response 48 hours
Action: Close and secure area, safety assessment by geotechnical engineer
Action: Close and secure area, safety assessment by Council staff or geotechnical engineer
Action: Close and secure area, safety assessment by Council staff or geotechnical engineer
OBJECTIVES IN MANAGING RETAINING WALLS AND CUTTINGS Ensure retaining walls meet the structural requirements to protect retained land against erosion and down
slope movement. Undertake adequate inspection, maintenance and hazard response to ensure public safety. To determine the most effective maintenance and replacement methods for walls requiring repair.
132 Georges River Council // Asset Management Plan 133
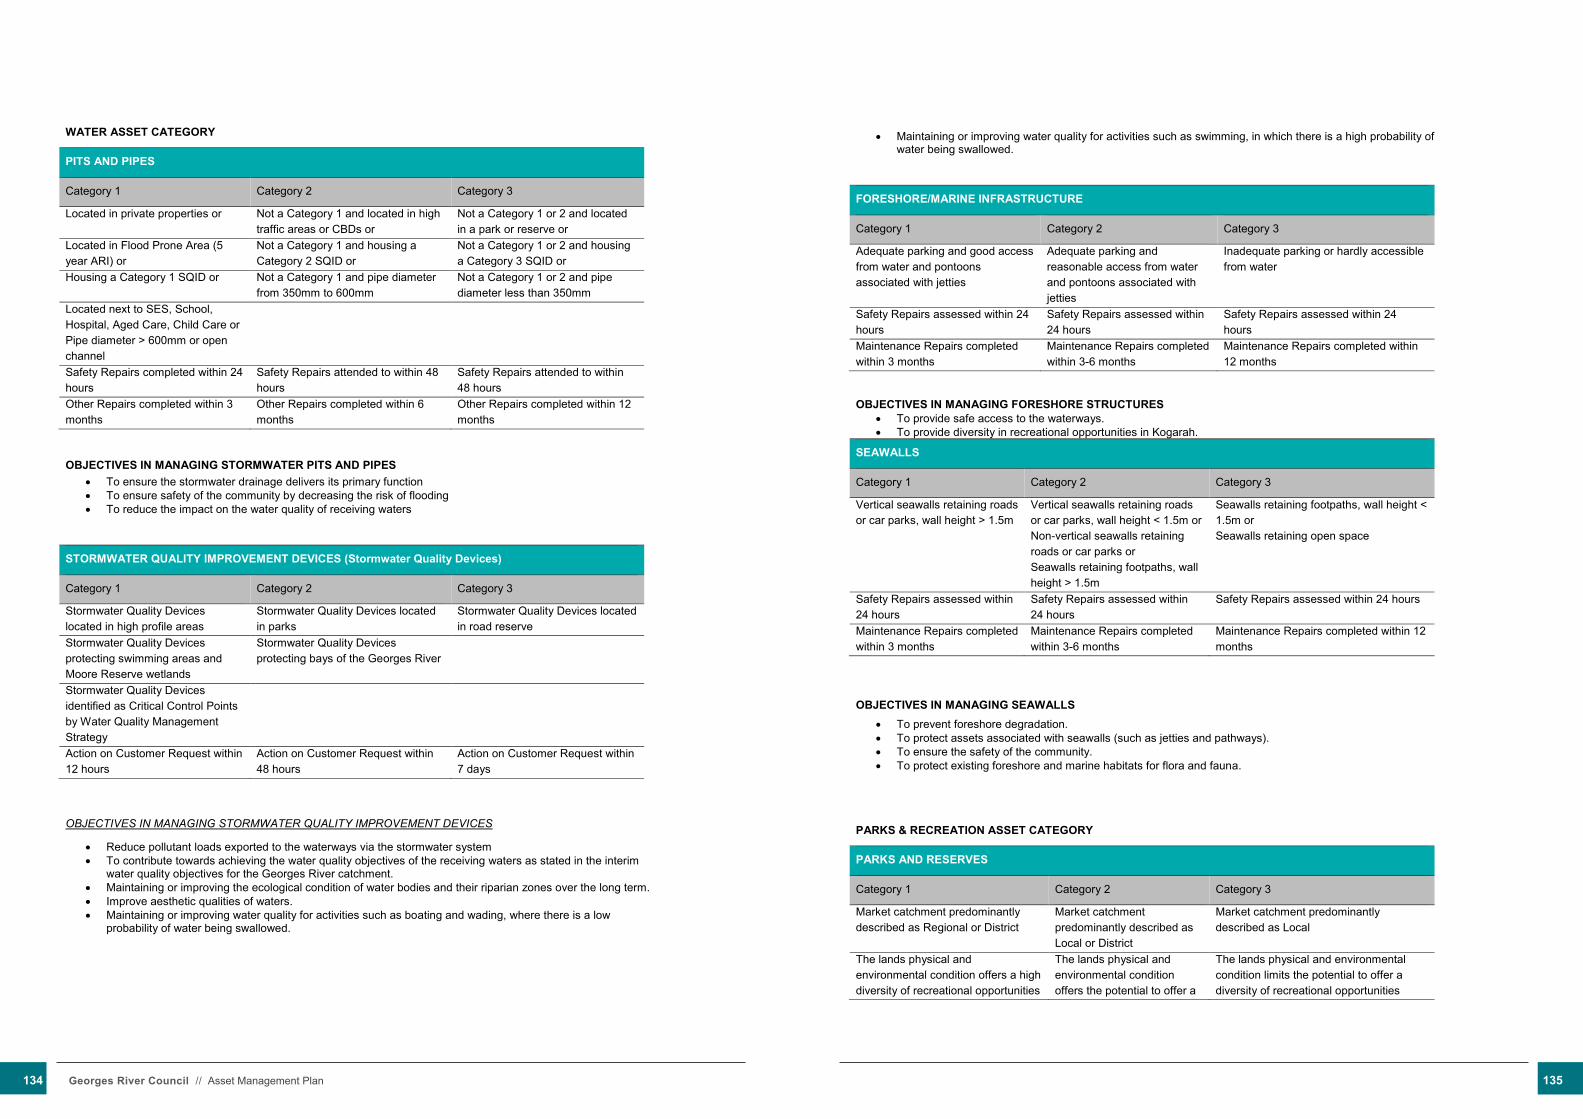
WATER ASSET CATEGORY
PITS AND PIPES
Category 1 Category 2 Category 3
Located in private properties or Not a Category 1 and located in high traffic areas or CBDs or
Not a Category 1 or 2 and located in a park or reserve or
Located in Flood Prone Area (5 year ARI) or
Not a Category 1 and housing a Category 2 SQID or
Not a Category 1 or 2 and housing a Category 3 SQID or
Housing a Category 1 SQID or Not a Category 1 and pipe diameter from 350mm to 600mm
Not a Category 1 or 2 and pipe diameter less than 350mm
Located next to SES, School, Hospital, Aged Care, Child Care or Pipe diameter > 600mm or open channel
Safety Repairs completed within 24 hours
Safety Repairs attended to within 48 hours
Safety Repairs attended to within 48 hours
Other Repairs completed within 3 months
Other Repairs completed within 6 months
Other Repairs completed within 12 months
OBJECTIVES IN MANAGING STORMWATER PITS AND PIPES To ensure the stormwater drainage delivers its primary function To ensure safety of the community by decreasing the risk of flooding To reduce the impact on the water quality of receiving waters
STORMWATER QUALITY IMPROVEMENT DEVICES (Stormwater Quality Devices)
Category 1 Category 2 Category 3
Stormwater Quality Devices located in high profile areas
Stormwater Quality Devices located in parks
Stormwater Quality Devices located in road reserve
Stormwater Quality Devices protecting swimming areas and Moore Reserve wetlands
Stormwater Quality Devices protecting bays of the Georges River
Stormwater Quality Devices identified as Critical Control Points by Water Quality Management Strategy
Action on Customer Request within 12 hours
Action on Customer Request within 48 hours
Action on Customer Request within 7 days
OBJECTIVES IN MANAGING STORMWATER QUALITY IMPROVEMENT DEVICES
Reduce pollutant loads exported to the waterways via the stormwater system To contribute towards achieving the water quality objectives of the receiving waters as stated in the interim
water quality objectives for the Georges River catchment. Maintaining or improving the ecological condition of water bodies and their riparian zones over the long term. Improve aesthetic qualities of waters. Maintaining or improving water quality for activities such as boating and wading, where there is a low
probability of water being swallowed.
Maintaining or improving water quality for activities such as swimming, in which there is a high probability of water being swallowed.
FORESHORE/MARINE INFRASTRUCTURE
Category 1 Category 2 Category 3
Adequate parking and good access from water and pontoons associated with jetties
Adequate parking and reasonable access from water and pontoons associated with jetties
Inadequate parking or hardly accessible from water
Safety Repairs assessed within 24 hours
Safety Repairs assessed within 24 hours
Safety Repairs assessed within 24 hours
Maintenance Repairs completed within 3 months
Maintenance Repairs completed within 3-6 months
Maintenance Repairs completed within 12 months
OBJECTIVES IN MANAGING FORESHORE STRUCTURES To provide safe access to the waterways. To provide diversity in recreational opportunities in Kogarah.
SEAWALLS
Category 1 Category 2 Category 3
Vertical seawalls retaining roads or car parks, wall height > 1.5m
Vertical seawalls retaining roads or car parks, wall height < 1.5m or Non-vertical seawalls retaining roads or car parks or Seawalls retaining footpaths, wall height > 1.5m
Seawalls retaining footpaths, wall height < 1.5m or Seawalls retaining open space
Safety Repairs assessed within 24 hours
Safety Repairs assessed within 24 hours
Safety Repairs assessed within 24 hours
Maintenance Repairs completed within 3 months
Maintenance Repairs completed within 3-6 months
Maintenance Repairs completed within 12 months
OBJECTIVES IN MANAGING SEAWALLS To prevent foreshore degradation. To protect assets associated with seawalls (such as jetties and pathways). To ensure the safety of the community. To protect existing foreshore and marine habitats for flora and fauna.
PARKS & RECREATION ASSET CATEGORY
PARKS AND RESERVES
Category 1 Category 2 Category 3
Market catchment predominantly described as Regional or District
Market catchment predominantly described as Local or District
Market catchment predominantly described as Local
The lands physical and environmental condition offers a high diversity of recreational opportunities
The lands physical and environmental condition offers the potential to offer a
The lands physical and environmental condition limits the potential to offer a diversity of recreational opportunities
134 Georges River Council // Asset Management Plan 135

diversity of recreational opportunities
Generally has access to nearby public transport and provisions for off street visitor parking
Generally has access to nearby public transport and limited or no off street visitor parking
Generally low access to public transport and limited or no off street visitor parking
Response: Extreme/High risk 24 – 48 hours Substantial/Medium risk 7 days – 3 months Moderate/Low risk 6 months – 12 months
Response: Extreme/High risk 24 – 48 hours Substantial/Medium risk 7 days – 3 months Moderate/Low risk 6 months – 12 months
Response: Extreme/High risk 24 – 48 hours Substantial/Medium risk 7 days – 3 months Moderate/Low risk 6 months – 12 months
OBJECTIVES IN MANAGING PARKS & RESERVES To implement Council’s Vision and Mission Statement for the health and safety of its citizens through best
practice management of it’s landscaped, sports and recreational assets. To provide a diversity of safe sports and recreational environments. To meet the community’s expectations in the management of parks & recreation assets.
BUSHLAND AREAS
Category 1 Category 2 Category 3
Market catchment predominantly described as Regional or District
Market catchment predominantly described as District or Local
Market catchment predominantly described as Local
Large risk to assets via bushfire. Indicated by the presence of an Asset Protection Zone within the reserve
Limited risk to assets via bushfire hazard. No Asset Protection Zone present
Minimal risk to assets via bushfire hazard
Species/population or ecological community present within the Reserve that is protected under the TSC Act 1995
Suspected presence or records of past presence of species, population or ecological community that are currently protected under the TSC Act 1995
No record of any species, population or ecological community protected under the TSC Act 1995
Physical and environmental conditions offer a high diversity of flora and fauna species in relation to restricted species found within Kogarah and the region
Physical and environmental conditions offer a moderate level of diversity of flora and fauna species
Physical and environmental conditions offer a low level of diversity of flora and fauna species
Falls within the Kogarah Greenweb Falls within one kilometre of the Kogarah Greenweb
Does not fall within one kilometre of the Kogarah Greenweb
OBJECTIVES IN MANAGING BUSHLAND AREAS To implement Council’s Vision and Mission Statement for the management and conservation of the Georges
River LGA’s biodiversity and urban amenity. To ensure the health and safety of our natural bushland reserves. To engage the community in understanding and care of our natural reserves while effectively managing our
natural reserves.
PLAYGROUNDS
Category 1 Category 2 Category 3
Market catchment predominantly described as Regional or District
Market catchment predominantly described as District or Local
Market catchment predominantly described as Local
High usage Medium usage Low usage
Generally has access to nearby public transport and provisions for off street visitor parking
Generally has access to nearby public transport and limited or no off street visitor parking
Generally low access to public transport and limited or no off street visitor parking
Response: Extreme/High risk 24 – 48 hours Substantial/Medium risk 7 days Moderate/Low risk 3 months
Response: Extreme/High risk 24 – 48 hours Substantial/Medium risk 7 days – 3 months Moderate/Low risk 6 months
Response: Extreme/High risk 24 – 48 hours Substantial/Medium risk 3 months Moderate/Low risk 12 months
OBJECTIVES IN MANAGING PLAYGROUNDS Ensure playgrounds are maintained in a safe condition Provide a diverse range of activities and accessible play experiences. Provide for the physical and social development of children. Meet the recreational needs of both local and visiting families. Enhance the recreational amenity of parkland and other facilities such as sportsgrounds. Reduce the incidence and impact of undesirable activities associated with playgrounds.
PUBLIC TREES
Category 1 Category 2 Category 3
Extreme/High Risk Substantial/Medium Risk Moderate/Low Risk
High potential for litigation and public health issues
Medium potential for litigation and public health issues
Low potential for litigation and public health issues
Response 24 – 48 hours Response 7 days – 3 months Response 6 – 12 months
Action: Close area and secure or remove hazard
Action: Secure or remove hazard and schedule action
Action: Schedule action
OBJECTIVES IN MANAGING PUBLIC TREES To implement Council’s Vision and Mission Statement for the management and conservation of the Georges
River Municipality’s biodiversity and urban amenity. To ensure the health and safety of public trees. To meet the community’s expectations in the management of trees on public land
BUILDINGS ASSET CATEGORY
The following descriptors are used for the categorisation of building “Category”:
136 Georges River Council // Asset Management Plan 137
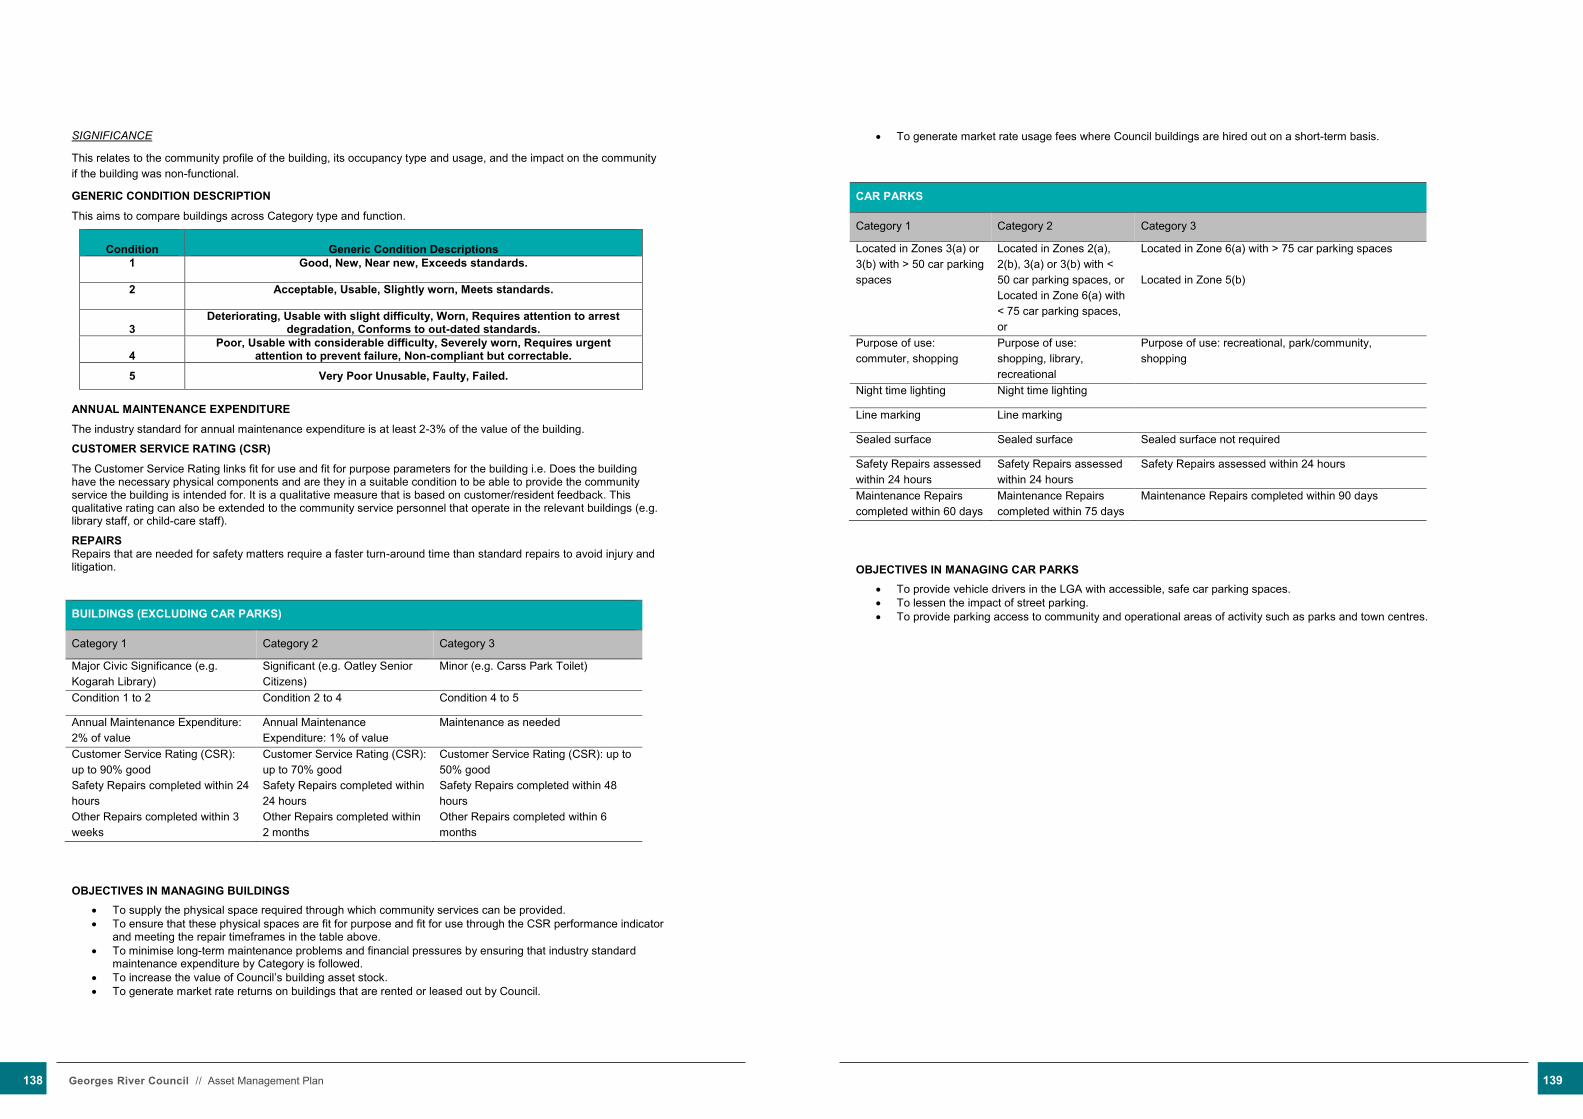
SIGNIFICANCE
This relates to the community profile of the building, its occupancy type and usage, and the impact on the community if the building was non-functional.
GENERIC CONDITION DESCRIPTION
This aims to compare buildings across Category type and function.
Condition
Generic Condition Descriptions
1 Good, New, Near new, Exceeds standards.
2 Acceptable, Usable, Slightly worn, Meets standards.
3
Deteriorating, Usable with slight difficulty, Worn, Requires attention to arrest degradation, Conforms to out-dated standards.
4
Poor, Usable with considerable difficulty, Severely worn, Requires urgent attention to prevent failure, Non-compliant but correctable.
5 Very Poor Unusable, Faulty, Failed.
ANNUAL MAINTENANCE EXPENDITURE
The industry standard for annual maintenance expenditure is at least 2-3% of the value of the building.
CUSTOMER SERVICE RATING (CSR)
The Customer Service Rating links fit for use and fit for purpose parameters for the building i.e. Does the building have the necessary physical components and are they in a suitable condition to be able to provide the community service the building is intended for. It is a qualitative measure that is based on customer/resident feedback. This qualitative rating can also be extended to the community service personnel that operate in the relevant buildings (e.g. library staff, or child-care staff).
REPAIRS Repairs that are needed for safety matters require a faster turn-around time than standard repairs to avoid injury and litigation.
BUILDINGS (EXCLUDING CAR PARKS)
Category 1 Category 2 Category 3
Major Civic Significance (e.g. Kogarah Library)
Significant (e.g. Oatley Senior Citizens)
Minor (e.g. Carss Park Toilet)
Condition 1 to 2 Condition 2 to 4 Condition 4 to 5
Annual Maintenance Expenditure: 2% of value
Annual Maintenance Expenditure: 1% of value
Maintenance as needed
Customer Service Rating (CSR): up to 90% good
Customer Service Rating (CSR): up to 70% good
Customer Service Rating (CSR): up to 50% good
Safety Repairs completed within 24 hours
Safety Repairs completed within 24 hours
Safety Repairs completed within 48 hours
Other Repairs completed within 3 weeks
Other Repairs completed within 2 months
Other Repairs completed within 6 months
OBJECTIVES IN MANAGING BUILDINGS To supply the physical space required through which community services can be provided. To ensure that these physical spaces are fit for purpose and fit for use through the CSR performance indicator
and meeting the repair timeframes in the table above. To minimise long-term maintenance problems and financial pressures by ensuring that industry standard
maintenance expenditure by Category is followed. To increase the value of Council’s building asset stock. To generate market rate returns on buildings that are rented or leased out by Council.
To generate market rate usage fees where Council buildings are hired out on a short-term basis.
CAR PARKS
Category 1 Category 2 Category 3
Located in Zones 3(a) or 3(b) with > 50 car parking spaces
Located in Zones 2(a), 2(b), 3(a) or 3(b) with < 50 car parking spaces, or Located in Zone 6(a) with < 75 car parking spaces, or
Located in Zone 6(a) with > 75 car parking spaces Located in Zone 5(b)
Purpose of use: commuter, shopping
Purpose of use: shopping, library, recreational
Purpose of use: recreational, park/community, shopping
Night time lighting Night time lighting
Line marking Line marking
Sealed surface Sealed surface Sealed surface not required
Safety Repairs assessed within 24 hours
Safety Repairs assessed within 24 hours
Safety Repairs assessed within 24 hours
Maintenance Repairs completed within 60 days
Maintenance Repairs completed within 75 days
Maintenance Repairs completed within 90 days
OBJECTIVES IN MANAGING CAR PARKS To provide vehicle drivers in the LGA with accessible, safe car parking spaces. To lessen the impact of street parking. To provide parking access to community and operational areas of activity such as parks and town centres.
138 Georges River Council // Asset Management Plan 139

Appendix 7 - LEGISLATIVE REQUIREMENTS
Legislation Requirement
Acts
Local Government Act 1993
Set out to provide the legal framework for an effective, efficient, environmentally responsible and open system of local government in New South Wales and, to regulate the relationships between the people and bodies comprising the system, and, to encourage and assist the effective participation of local communities in the affairs of local government.
Civil Liability Act 2002 Set out to make provision in relation to the recovery of damages for death or personal injury caused by the fault or negligent of a person or organisations. Liability of road authorities. Section 42, May 2004 inclusion into the Act to provide a replacement for the non-feasance defence consequence to the May 2001 High Court judgement.
Coastal Protection Act 1979
Sets out the responsibilities and powers of Council in protecting the quality of the coastal environment.
Roads Act 1993 Set out the rights of members of the public to pass along public roads, the rights of persons who own land adjoining a public road to have access to the public road, and to establish the procedures for the opening and closing of a public road, to provide for the classification of roads, to provide for the declaration public authorities as roads authorities for both classified and unclassified roads, to confer certain functions (in particular, the function of carrying out road work), and to regulate the carrying out of various activities on public roads.
Protection of the Environment Operations Act 1997
Sets out to protect, restore and enhance the quality of the environment in New South Wales, having regard to the need to maintain ecologically sustainable development, pollution prevention, the elimination of harmful wastes, the reduction in the use of materials and the re-use, recovery or recycling of materials.
Environmental Planning & Assessment Act 1979
Sets out to encourage the proper management, development and conservation of natural and artificial resources for the purpose of promoting the social and economic welfare of the community and a better environment and the protection of the environment, including the protection and conservation of native animals and plants, including threatened species, populations and ecological communities, and their habitats.
Natural Resources Management Act 2004
Sets out the role, purpose, responsibilities and powers of local government in controlling the use of natural resources.
Crown Lands Act 1989
Sets out the objectives and principals for Crown Land management.
Dividing Fences Act 1991
Exempts all Councils from payment of a contribution towards the installation or replacement of a fence on private land that adjoins public property in Council’s ownership, care, control and management.
National Parks and Wildlife Act 1974
Sets out objectives and principles for conserving the State's natural and cultural heritage, fostering public appreciation, understanding and enjoyment of the State’s natural and cultural heritage, and managing any lands reserved for the purposes of conserving and fostering public appreciation and enjoyment of the State's natural and/or cultural heritage.
Noxious Weeds Act 1993
Sets out to reduce the negative impacts of weeds on the economy, community and environment.
Threatened Species Act 1995
Sets out to conserve biodiversity and promote ecologically sustainable development.
State Environmental Planning Policy No.19 Bushland in Urban Areas
Sets out the objectives to protect and preserve bushland within the LGA.
Occupational Health and Safety Act 2000
Sets out the responsibilities of Council to secure and promote the health, safety and welfare of people at work.
Other relevant State and Federal Acts and Regulations
As appropriate.
Legislation Requirement
Standards
Australian Accounting Standards board
Accounting rules setting out Council requirements for the financial reporting of assets.
AASB 13 Fair Value Measurement
AASB 116 Property, Plant & Equipment
AASB 136 Impairment of Assets
AASB 138 Intangible Assets
AASB 140 Investment Properties
AASB 1031 Materiality
AASB 1051 Land under Roads
Building Code of Australia 2009
Contains technical provisions for the design and construction of buildings and other structures, covering such matters as structure, fire resistance, access and egress, services and equipment, and health and amenity.
Australian Standards The minimum requirements for Council for operational and design standards.
140 Georges River Council // Asset Management Plan 141
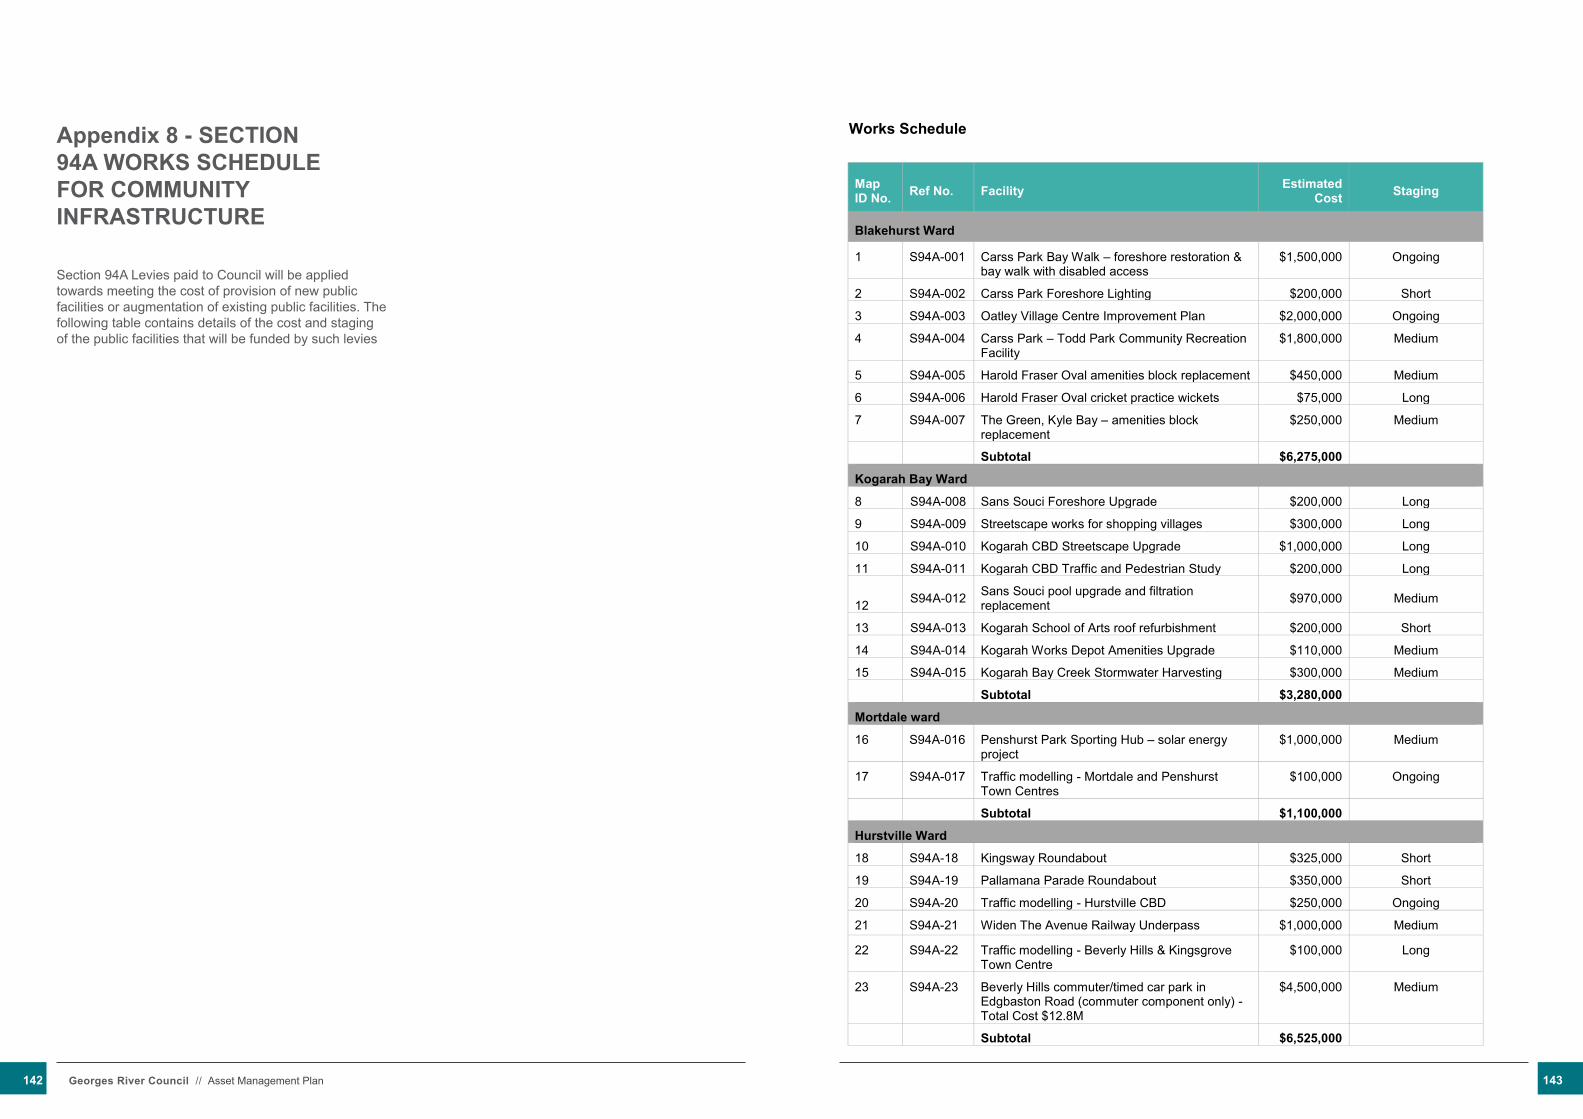
Appendix 8 - SECTION 94A WORKS SCHEDULE FOR COMMUNITY INFRASTRUCTURE
Section 94A Levies paid to Council will be applied towards meeting the cost of provision of new public facilities or augmentation of existing public facilities. The following table contains details of the cost and staging of the public facilities that will be funded by such levies
Page 1 of 2
Works Schedule
Map ID No. Ref No. Facility Estimated
Cost Staging
Blakehurst Ward
1 S94A-001 Carss Park Bay Walk – foreshore restoration & bay walk with disabled access
$1,500,000 Ongoing
2 S94A-002 Carss Park Foreshore Lighting $200,000 Short
3 S94A-003 Oatley Village Centre Improvement Plan $2,000,000 Ongoing
4 S94A-004 Carss Park – Todd Park Community Recreation Facility
$1,800,000 Medium
5 S94A-005 Harold Fraser Oval amenities block replacement $450,000 Medium
6 S94A-006 Harold Fraser Oval cricket practice wickets $75,000 Long
7 S94A-007 The Green, Kyle Bay – amenities block replacement
$250,000 Medium
Subtotal $6,275,000
Kogarah Bay Ward
8 S94A-008 Sans Souci Foreshore Upgrade $200,000 Long
9 S94A-009 Streetscape works for shopping villages $300,000 Long
10 S94A-010 Kogarah CBD Streetscape Upgrade $1,000,000 Long
11 S94A-011 Kogarah CBD Traffic and Pedestrian Study $200,000 Long
12 S94A-012 Sans Souci pool upgrade and filtration replacement $970,000 Medium
13 S94A-013 Kogarah School of Arts roof refurbishment $200,000 Short
14 S94A-014 Kogarah Works Depot Amenities Upgrade $110,000 Medium
15 S94A-015 Kogarah Bay Creek Stormwater Harvesting $300,000 Medium
Subtotal $3,280,000
Mortdale ward
16 S94A-016 Penshurst Park Sporting Hub – solar energy project
$1,000,000 Medium
17 S94A-017 Traffic modelling - Mortdale and Penshurst Town Centres
$100,000 Ongoing
Subtotal $1,100,000
Hurstville Ward
18 S94A-18 Kingsway Roundabout $325,000 Short
19 S94A-19 Pallamana Parade Roundabout $350,000 Short
20 S94A-20 Traffic modelling - Hurstville CBD $250,000 Ongoing
21 S94A-21 Widen The Avenue Railway Underpass $1,000,000 Medium
22 S94A-22 Traffic modelling - Beverly Hills & Kingsgrove Town Centre
$100,000 Long
23 S94A-23 Beverly Hills commuter/timed car park in Edgbaston Road (commuter component only) - Total Cost $12.8M
$4,500,000 Medium
Subtotal $6,525,000
142 Georges River Council // Asset Management Plan 143
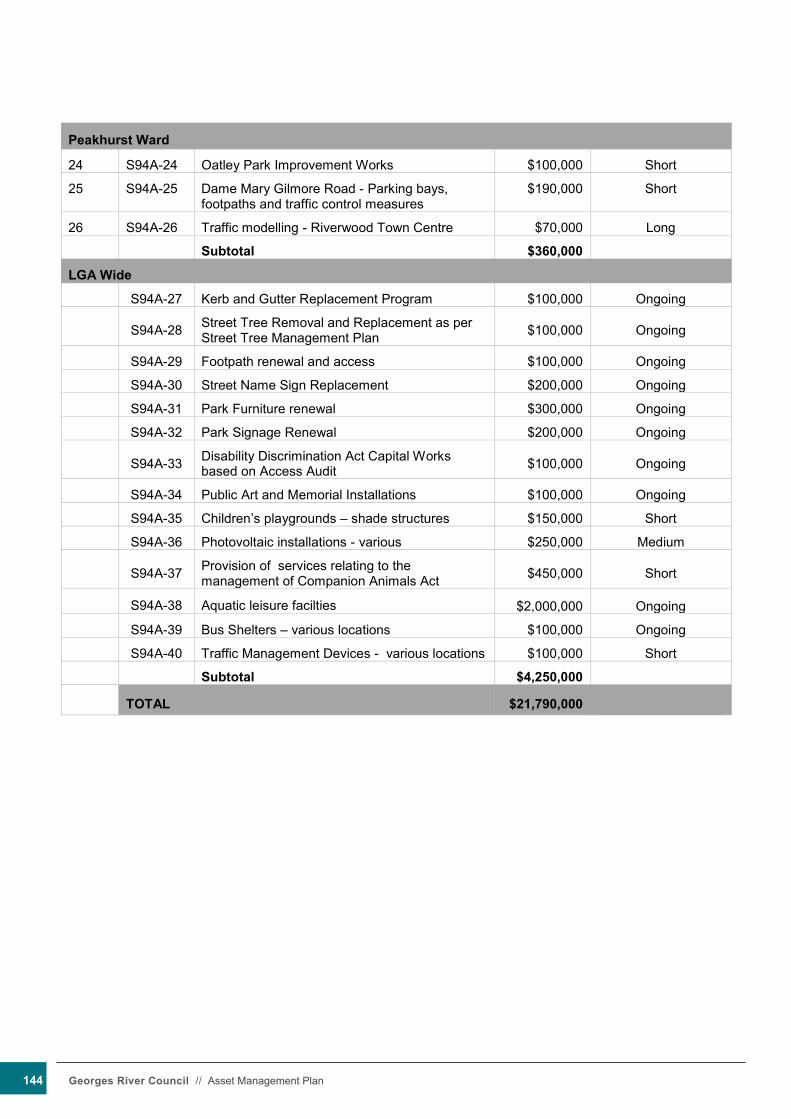
Page 2 of 2
Peakhurst Ward
24 S94A-24 Oatley Park Improvement Works $100,000 Short
25 S94A-25 Dame Mary Gilmore Road - Parking bays, footpaths and traffic control measures
$190,000 Short
26 S94A-26 Traffic modelling - Riverwood Town Centre $70,000 Long
Subtotal $360,000
LGA Wide
S94A-27 Kerb and Gutter Replacement Program $100,000 Ongoing
S94A-28 Street Tree Removal and Replacement as per Street Tree Management Plan $100,000 Ongoing
S94A-29 Footpath renewal and access $100,000 Ongoing
S94A-30 Street Name Sign Replacement $200,000 Ongoing
S94A-31 Park Furniture renewal $300,000 Ongoing
S94A-32 Park Signage Renewal $200,000 Ongoing
S94A-33 Disability Discrimination Act Capital Works based on Access Audit $100,000 Ongoing
S94A-34 Public Art and Memorial Installations $100,000 Ongoing
S94A-35 Children’s playgrounds – shade structures $150,000 Short
S94A-36 Photovoltaic installations - various $250,000 Medium
S94A-37 Provision of services relating to the management of Companion Animals Act $450,000 Short
S94A-38 Aquatic leisure facilties $2,000,000 Ongoing
S94A-39 Bus Shelters – various locations $100,000 Ongoing
S94A-40 Traffic Management Devices - various locations $100,000 Short
Subtotal $4,250,000
TOTAL $21,790,000
144 Georges River Council // Asset Management Plan