Resource mobilization for World War II: the U.S.A., U.K ... · PDF fileorder of magnitude. ......
26
Resource mobilization for World War II: the U.S.A., U.K., U.S.S.R., and Germany, 1938-1945* Mark Harrison** Department of Economics University of Warwick * Published in the Economic History Review, 41:2 (1988), pp. 171-192. ** Mail: Department of Economics, University of Warwick, Coventry CV4 7AL, UK. Email: [email protected]. A first draft of this paper was presented to the Annual Conference of the National Association for Soviet and East European Studies (Cambridge, March 1987) and the Colloquium of the Centre for Russian and East European Studies, University College of Swansea (Gregynog, April 1987). I am grateful to the participants, especially Wlodzimierz Brus (Oxford), Bob Davies (Birmingham), and Peter Wiles (LSE). I also owe special thanks to Volker Berghahn, Stephen Broadberry, and Annwen Jones (Warwick), Sir Alec Cairncross (Oxford), Michael Ellman (Amsterdam), Peter Fearon (Leicester), and Lynn Turgeon (Hofstra) for help across unfamiliar terrain, as well as to the editors for their constructive criticisms.
Transcript of Resource mobilization for World War II: the U.S.A., U.K ... · PDF fileorder of magnitude. ......

Resource mobilization for WorldWar II: the U.S.A., U.K., U.S.S.R., and
Germany, 1938-1945*
Mark Harrison**
Department of Economics
University of Warwick
* Published in the Economic History Review, 41:2 (1988), pp. 171-192.
** Mail: Department of Economics, University of Warwick, Coventry CV4 7AL,UK. Email: [email protected]. A first draft of this paper was presented tothe Annual Conference of the National Association for Soviet and East EuropeanStudies (Cambridge, March 1987) and the Colloquium of the Centre for Russian andEast European Studies, University College of Swansea (Gregynog, April 1987). I amgrateful to the participants, especially Wlodzimierz Brus (Oxford), Bob Davies(Birmingham), and Peter Wiles (LSE). I also owe special thanks to Volker Berghahn,Stephen Broadberry, and Annwen Jones (Warwick), Sir Alec Cairncross (Oxford),Michael Ellman (Amsterdam), Peter Fearon (Leicester), and Lynn Turgeon (Hofstra)for help across unfamiliar terrain, as well as to the editors for their constructivecriticisms.

2
Resource mobilization for WorldWar II: the U.S.A., U.K., U.S.S.R., and
Germany, 1938-1945
In 1946 Raymond Goldsmith (formerly head of the economics and planning division
of the U.S. War Production Board) published an estimated balance sheet of war
production of the major belligerent powers of World War II. His results are shown in
table 1. Goldsmith commented:
The cold figures ... probably tell the story of this war in its essentials as well as
extended discussion or more elaborate pictures: the initial disadvantage of the
Western Allies; the surprising stand of the U.S.S.R.; the rapid improvement in
the United Nations’ position in 1943; their decisive superiority over Nazi
Germany in 1944; and the rapid collapse of Japan once the theater of war was
restricted to the Pacific. They back to the full the thesis, dear to the economist’s
ear, that whatever may have saved the United Nations from defeat in the earlier
stages of the conflict, what won the war for them in the end was their ability to
produce more, and vastly more, munitions than the Axis.1
Table 1. Volume of combat munitions production of the major belligerents, 1935-44
(annual expenditure in $ billion, U.S. 1944 munitions prices)
1935-9 1940 1941 1942 1943 1944
U.S.A. 0.3 1.5 4.5 20 38 42
Canada 0 0 0.5 1 1.5 1.5
U.K. 0.5 3.5 6.5 9 11 11
U.S.S.R. 1.6 5 8.5 11.5 14 16
Germany 2.4 6 6 8.5 13.5 17
Japan 0.4 1 2 3 4.5 6
Note: Figures for 1935-9 are given as cumulative expenditure in the source, annualaverage expenditure in this table.
Source: Goldsmith, “Power of victory”, p. 75. (For explanation of Goldsmith’ssources and methods, and for discussion of reliability of his estimate of Sovietmunitions output, please apply to the author for appendix A.)
Granted the superior potential for war production of the Allied nations over
their enemies, what factors enabled this potential superiority to be realized in the
different economies under combat conditions? More than 40 years after the event,
a fully comprehensive answer to this question has not yet been compiled. Early
interest in the comparative economic history of World War II faded soon after the
1 Goldsmith, “Power of victory”, p. 69.

3
war. Since 1946, by tradition, comparative discussion of the war economies has
been largely limited to the German, British, and U.S. records.2
In contrast, Soviet experience has suffered neglect.3 The main reason is that
official release of significant detail relating to the Soviet war effort was delayed for
many years after the war.4 Thus, when British and American historians were
researching the histories of the British, American, German, and Japanese war
economies in the late 1940s and early 1950s, relevant Soviet materials were still on
the secret list. When they began to appear in the 1960s and 1970s, historians of
other countries had perhaps already lost interest.
How may the effectiveness of the Soviet economic war effort be compared with
that of her main allies and principal adversary? In this article I shall attempt to
outline some aspects of a comparative study of resource mobilization for war. These
include war preparations and mobilization needs (section I), political leadership and
the central coordination of resources (section II), and the intensity of resource
mobilization (section III).
2 The main contributors to the comparative history of the U.S., British, andGerman war economies have been Kaldor, “German war economy”; Hancock andGowing, British war economy; Klein, Germany’s preparations; Carroll, Design fortotal war; Milward, War, economy and society.
3 At the end of the war, apart from Goldsmith at the War Production Board, U.S.researchers made at least one other attempt to incorporate the U.S.S.R. into anoverall picture; see materials cited in U.S. president’s twentieth report, p. 41. Suchcomparisons were picked up and commented on by British official historians: seeHancock and Gowing, British war economy, pp. 369-70 and Hall, North Americansupply, pp. 420-1. More recently Milward, War, economy and society (mainly chs. 2,3) introduced the Soviet economy into a comparative perspective, but on the basisof very limited information. An attempted comparison of Soviet, British, and Germanworkforce controls and measures of resource mobilization can be found in Harrison,Soviet planning, pp. 153-4, 185-91, but this should now be considered preliminary –superseded by findings of the present article.
4 In 1947 a sparse account was published in Moscow by Voznesensky, thewartime planning chief, as Voennaya ekonomika. (An official translation appeared in1948, entitled War economy of the U.S.S.R. in the period of the patriotic war.) Afterthis nothing much happened until the revival of scholarly research on the wartimeperiod was authorized under Khrushchev’s thaw. The main significant events tofollow were publication of the 6-volume Istoriya VO voiny (History of the greatpatriotic war of the Soviet Union, 1941-5) (1961-5) and the still more detailed, butideologically somewhat more conservative 12-volume Istoriya VM voiny (History ofthe Second World War, 1939-45) (1973-82). For a short account of the phases ofSoviet historiography up to 1982 see Harrison, Soviet planning, pp. 235-42. At thepresent time a new official history, a 10-volume Velikaya Otechestvennaya voinaSovetskogo naroda, 1941-1945 (The great patriotic war of the Soviet people) is beingcommissioned; in line with today’s trends towards “openness” and “new thinking”,it is promised to be more interesting and less dry than its predecessors.

4
Addressing these issues on the basis of materials available today, even in
narrowly quantitative terms, proved an unexpectedly complex task. The
complications arose only partly from the need to establish comparability of the
Soviet record with better known materials for other countries. It soon became clear
that another task was involved as well – the need to eliminate distortions of concept
and measurement from the comparative statistical record already established for
the United States, Britain, and Germany.
I
How did the different powers prepare for war, and what were the economic
implications of their policies? The most extensive economic burdens of war
preparation were borne by Germany and the Soviet Union; British rearmament was
run on an altogether smaller scale, and in the United States war preparations were
almost nonexistent.
By the late 1930s Germany was in a position to deploy formidable military
assets. These assets depended only partly on her economy. A crucial ingredient in
her military successes up to 1942 was her aggressive strategy of surprise and
preemption in combined arms operations. The Blitzkrieg strategy helps to explain
how Germany was able to overrun half of Europe without major military loss.5
How cheap was Germany’s early military success? Germany’s prewar economic
preparations were very substantial. Table 1 shows that in the years 1935-9 Germany
had procured a volume of combat munitions far greater than any other power, and
equal in real terms to the munitions production of all her future adversaries
combined. Already in the last “peacetime” year of 1938 Germany’s military
expenditures were costing her one-sixth of her national income.6 Only the Soviet
Union had applied resources to rearmament on anything approaching the German
order of magnitude. Thus Germany had to devote major resources to her war effort,
even while she was still beginning her trail of victories. Nonetheless her successes
were cheap in at least two senses: first, because rearmament was initiated in an
underemployed economy, so that increases in military spending merely took up
slack and did not require the resources employed for war to be first withdrawn from
other commitments;7 second, because the resources devoted to war were employed
with relative efficiency, and Germany’s conquests brought major economic returns.
5 On the political economy of the Blitzkrieg, see Kaldor, “German war economy”;Klein, Germany’s preparations; Milward, German economy; Carroll, Design for totalwar. Whether or not Germany’s Blitzkrieg strategy was a deliberately chosen designor one forced upon her by circumstances is discussed by Overy, “Hitler’s war”.
6 For this and other national income shares cited in this section, see table 3below.
7 Not until 1938 did unemployment of the German working population fall below4 per cent, and over 1932-8 the increase in Germany’s GNP was almost three timesthe increase in military spending. See data cited by Overy, Nazi recovery, pp. 29, 50.

5
Germany’s opponents could not expect to deter or defeat her so inexpensively
in war, for Germany wielded the crucial advantages of the offensive. To deter
German aggression or (which may have come to the same thing) to be sure of
denying victory to Germany without major expenditure of resources in war, they
would have had to rearm in peacetime on a far larger scale than Germany herself. In
fact, the opposite was the case.
The British rearmament process began in 1935, in the wake of abandonment of
the “ten-year rule” (that there would be no major conflict within a rolling ten-year
horizon) which since 1919 had dominated British strategic planning, and with the
naming of Japan and Germany as potential aggressors. The main effort was devoted
to naval and air rearmament; as a whole, the defence budget remained tightly
constrained by both strategic and economic doctrines. Regardless of the domestic
background of widespread unemployment, official fears of financial instability still
exceeded the fear of external aggression. Until March 1938 British defence
preparations had to be carried on within the limits of the doctrine that “the course
of normal trade should not be impeded”. Strict financial constraints were soon
rationalized in military policy, in the theory of a “war of limited liability”, ruling out
the need for any major reconditioning of the ground forces. The perspective of a
limited war outlived the financial limitation of defence spending by one year, being
abandoned only in March 1939 with the fall of Prague.8
Thus, before 1939, Britain rearmed only at a low level, seeking to regulate
Germany’s behaviour primarily through negotiation; in 1938 defence spending still
claimed only 7 per cent of the national income. French preparations were similarly
limited, both in absolute terms and in relation to the size of the French economy.
The United States abstained altogether from the rearmament process, defence
allocations remaining insignificant in proportion to her national income as late as
1940.9
The only country to attempt the building of a true military counterweight to
German dispositions was the Soviet Union. Throughout the interwar years Soviet
military-economic doctrines had emphasized the permanent dangers of external
aggression (although Soviet leaders had also been slow to recognize the Nazi threat).
In Soviet rearmament was mirrored Germany’s drive toward a mass army possessing
military-technical superiority, backed up by the mass production facilities of
modernized and specialized defence industries. As a result, only in the Soviet Union
did defence production in the 1930s approach the same order of magnitude as that
of Germany, and of all Germany’s adversaries the Soviet economy devoted the
highest peacetime proportion of national income to defence – perhaps 20 per cent
in 1940, more than the proportional burden on Germany’s national economy in
1938. The Soviet economy, however, had to find resources for defence in a very
different context. The Soviet industrial base was at a much lower technical level;
moreover, by the late 1930s its resources were already strained by overfull
8 Hancock and Gowing, British war economy, pp. 62-72.
9 Milward, War, economy and society, pp. 38-44, 48.

6
employment.10 As a result, accelerated rearmament could only be financed by
subtracting resources from the civilian sector, especially from household
consumption. This meant that after gaining a head start over Germany at the
beginning of the 1930s the scale of the Soviet effort tended to lag behind.
Independently of the sheer physical scale of rearmament, there were important
differences between the rearmament processes of the different powers. The most
important difference lay in the time horizon of the economic plans. German
rearmament tended to emphasize the maximization of specific kinds of short-term
military power, reflected in the acquisition of particular weapons and combat stocks
for immediate campaigns. Her adversaries, unable to choose the time or place of
battle or the direction of the attack, were forced to plan for a more protracted
conflict and to prepare their forces to fight under all conditions. Whether they
rearmed at a low or a high level, their rearmament tended to display an all-round,
long-range character in which an immediate increase of munitions production was
combined with a military-industrial build-up aimed at maximizing military power
across a wide range in some future year.
This also meant that the pattern of rearmament differed between the powers in
terms of the balance of munitions and manpower. This balance is estimated in table
2, which is divided into two parts. Part (A) is based on budgetary or national income
accounts in domestic prices of each country (current prices for the U.K. and
Germany, constant prices for the U.S.A. and U.S.S.R.), and shows the relative priority
accorded by each country to munitions and military pay. Part (B) shows Goldsmith’s
estimates of the real munitions production of each country in proportion to the size
of its armed forces; based on the common value standard of 1944 U.S. munitions
prices, it removes the influence of differing national relativities of munitions prices
and military salaries (for example, the high munitions costs and low conscript pay of
the capital-scarce economy of the Soviet Union in comparison with the others), and
shows the extent to which different national priorities were successfully carried into
practice.
Table 2 (A) shows clearly that, already on the verge of war, the common policy
of the United States, United Kingdom, and U.S.S.R. was to follow a much more
“intensive” rearmament pattern than that adopted by Germany, stressing a
relatively high level of allocations to mechanization and reequipment, compared
with the German policy of creating a large fighting force based on only limited
military stockbuilding.11 Thereafter (at least, as late as 1942), the divergence
10 “Overfull employment” means that the economy was under strain at a macro-economic level. Microeconomic responses to permanent shortage, especially thehoarding of inputs, meant the maintenance of a considerable degree of slack withinenterprises. But the nature of this slack was such that the resources it representedwere normally inaccessible to planners and policy makers.
11 In both parts of table 2, some of the differences between Anglo-American andGerman expenditure patterns must be attributed to the differing importanceattached by the various powers to ground, air, and naval forces and the different

7
between Allied and German policy crystallized. After 1942 a fluctuation in the Allied
pattern becomes noticeable; the Soviet emphasis on munitions spending remained
pronounced, while that of the United States and United Kingdom was tending to
diminish.
Table 2. Munitions and men: the U.S.A, U.K., U.S.S.R., and Germany
(A) The ratio of spending on munitions to spending on military pay, 1939-45a
U.S.A. U.K. U.S.S.R. Germany
1939 … 3.6 ... 1.9
1940 4.2 4.1 3.3 1.0
1941 3.7 3.4 ... 0.8
1942 3.9 2.7 2.6 0.9
1943 3.0 2.3 3.3 ...
1944 2.4 1.9 3.6 …
1945 1.8 1.4 ... …
(B) Volume of combat munitions production compared to numbers of military
personnel (U.S. 1944 dollars per man), 1940-44b
U.S.A. U.K. U.S.S.R. Germany
1940 2,800 1,500 1,200 1,100
1941 2,800 1,900 ... 800
1942 5,400 2,200 1,100 900
1943 4,200 2,300 1,300 1,200
1944 3,700 2,200 1,400 1,400
Notes and sources:a Calculated or estimated from budgetary, national expenditure or output data
in Smith, Army, p. 5; Statistical digest, p. 200 and Hancock and Gowing, British wareconomy, pp. 75, 347; Bergson, Real national income, pp. 70, 99-100, 130, andHarrison, Soviet planning, pp. 119, 138, 259; Klein, Germany’s preparations, p. 91.The U.S. and Soviet ratios are calculated at constant 1945 domestic prices and 1937factor costs respectively; the British and German ratios are calculated at currentdomestic prices. A degree of uncertainty surrounds the Soviet data, but cautionmust also be exercised with regard to the British estimates. (For further detail anddiscussion, please apply to the author for appendix B.)
b Real munitions production, estimated in table t, is divided by series for armedforces personnel from American industry, P. 34; Hancock and Gowing, British wareconomy, pp. 203, 351; Harrison, Soviet planning, p. 138 (for 1943 a figure of 11million is interpolated); Michalka, ed., Weltmachtanspruch, p. 389.
technical proportions characterizing the three armed services. Thus, the U.S.A. andU.K. spent more on munitions relative to pay, and produced a greater dollar value ofarmament relative to personnel, partly because of their greater stress on acquisitionof the means of strategic naval and air power compared to reequipment of theground forces. But this cannot explain the full range of variation, especially when theSoviet advantage over Germany is noted, for the Soviet Union aspired to strategicpower neither on the sea nor in the air yet still spent more on munitions relative topersonnel than did Germany.

8
To what extent were policy and priority carried into practice? Table 2 (B) shows
a slightly different rank ordering of the powers by “intensity” of rearmament
measured in real terms per soldier. Again, already in 1940 the Anglo-American
pattern was quite distinct from the German, a substantial advantage of munitions
reequipment per soldier accruing to the Western Allies. This gap subsequently
widened into a deep chasm-at least until 1944, when the German acceleration of
war production narrowed it slightly. However, by this measure there was much less
of an advantage to the Soviet soldier. In terms of policy and priority, Soviet
rearmament and wartime military spending had shared the general Allied pattern of
“intensive” rearmament. However, it was much more difficult for the Soviets to
match the physical results of U.S. and U K military spending, given the low-
productivity, capital-scarce Soviet industrial base. The outcome of the Soviet
expenditure pattern was therefore nearer to German proportions (although there
was still a degree of Soviet advantage, at least until 1944) than to the Allied pattern.
The explanation for this difference between Soviet priorities and results was surely
the relatively high rouble costs of Soviet weaponry and low rouble pay of conscripts.
The low proportion of German military stockbuilding to armed forces personnel
reflected an essential weakness of Germany’s war preparations. Up to 1940
Germany led the world in the production of munitions. But at the same time her
rising military commitments of conquest and occupation, combined with limits on
her industrial mobilization, were forcing her military effort to rely more and more
upon personnel recruitment for additional resources. After 1940 German munitions
production rose only slowly whereas Allied production multiplied. As a result, when
German production finally accelerated in 1943-4, it was already too late to close the
gap.
The Allied pattern of preparation for a protracted war of productive effort and
economic mobilization yielded many benefits in wartime, in continuity of
programmes of weapons development and production, and of industrial
construction, mobilization, and dispersal. This was especially evident in the Soviet
case. Although the Soviets faced a bitter struggle to translate rearmament policies
into effective output, the more intensive character of their prewar military-
economic priorities gave rise to a more resilient, more mobilized wartime economic
system. Behind the Soviet emphasis on the industrial supply of defence
requirements lay the buildup of defence capacity not only in specialized plant but
also, by means of widespread subcontracting of defence orders, throughout civilian
industry; much of the latter comprised a reserve available for immediate conversion
to war production in the event of war.12 And here was one of the keys to the Soviet
wartime economic mobilization, which was achieved in spite of the unanticipated
character and crushing weight of the German military blow to the Soviet economy.13
12 See Cooper, “Defence production”; Tupper, “Red Army”.
13 On Soviet prewar contingency planning in relation to the economy, seeHarrison, Soviet planning, pp. 59-62.

9
II
The success of the German Blitzkrieg depended primarily upon military factors.
Success in sustaining a war of more protracted effort, however, depended ultimately
upon resources-their availability, the ability to mobilize them speedily and fully, and
their coordination in correct proportions between the front and rear and between
the military and civilian sectors of the rear. The Blitzkrieg was aimed primarily at
securing victory before such a resource mobilization could be effected by the
adversary.
German failure in the Blitzkrieg against the Soviet Union in 1941-2 was decisive
in the conversion of the war from a series of lightning campaigns to a prolonged war
of productive effort and economic mobilization. Beforehand, Hitler’s Wehrmacht
had blazed an unbroken trail of victories through Europe. Afterwards, the defeat of
Germany’s war aims was guaranteed (although its scale remained to be
determined).
Why did Hitler fail? Circumstantial factors played a certain part, of course.
Among the underlying reasons for German failure in 1941-2, however, are included
the counter-actions and initiatives of the Soviet government and people. German
military success in 1941-2 depended on stunning and paralyzing the Soviet military-
economic machine with a colossal blow. Soviet resilience stemmed partly from the
reactions and initiatives of Soviet leaders from above, partly from those of Soviet
people at a lower, less discernible level. At the highest level the Soviet military-
economic machine was only partially and momentarily stunned. The Kremlin’s first
clearsighted responses to the economic emergency can be found in the campaign
for industrial evacuation. It was this programme which saved Soviet specialized
defence plant and provided the essential context for the economy-wide mobilization
of war production.
Such early high-level initiatives to grapple seriously with the threatened
economic catastrophe depended heavily on the qualities of leading individuals. The
individualization of authority and responsibility, reinforced by dictatorial powers,
rapidly became a leading principle of wartime administration in the first eighteen
months.14 It was reflected in the division of labour within Stalin’s war cabinet where,
for example, Beriya was responsible for armament and ammunition procurement,
Malenkov for the aircraft industry, Molotov for tank building, Kaganovich for railway
transport. This adaptation of the Soviet political system to new tasks had peacetime
precedents in previous emergencies of confrontation with the peasantry and food
shortage, of international tension, and of industrial and defence mobilization.
However, in 1941-2 it was carried to a new extreme.
Thus in 1941 the central functions of the Soviet military-economic apparatus
were neither fully stunned nor paralyzed. Nor were people paralyzed at lower levels.
Even in the first, comparatively leaderless, days the conversion and mobilization of
the economy for war production were carried on in full swing. People knew what
14 Lieberman, “Evacuation of industry”, and “Crisis management”; Harrison,Soviet planning, pp. 93-100.

10
they were supposed to do and did it without having to be told directly. This was a
fact of colossal significance. The evacuation process, too, did not rely exclusively on
controls superimposed from above; much of it was carried through on the basis of
low-level initiative, without permission from Moscow or Moscow’s
representatives.15
In summary, there were two elements in Soviet economic resilience in 1941-2.
One was the capacity of Soviet leadership for high-level initiative and individual
improvisation, enforced by decrees and dictatorial powers, in the face of
emergency. The other was the popular response from below. This combined
response was sufficient for survival in the short term, when everything depended
upon munitions production for immediate combat. It did not, however, add up to a
fully centralized and coordinated war economy. Rather, in the first period of the war
control was exercised from the centre over a few fundamentals, and the rest of the
economy was instructed to show initiative and rely on “local resources”; the key
sectors controlled from the centre were not systematically coordinated with each
other or with the supporting civilian infrastructure, because of the system of divided
personal responsibilities. Coordination was a matter of crash programmes and
emergency measures to rectify imbalances only at the point where they became
intolerable.
Individual initiative based on rule by decree was not, however, sufficient for a
prolonged resource mobilization. This is convincingly demonstrated by the state of
the Soviet economy at the end of 1941. Defence plant had been saved and defence
output multiplied. But everything else was in an utter shambles. The resulting
imbalances soon became a vital threat to continuation of the war effort. Steel, coal,
electricity, machinery and transport capacities, workers to staff these industries,
housing and food for the workers, all became priorities of equal weight to war
production. The resulting complex allocation problem could only be resolved by
reassertion of bureaucratic order; “rule by decree” had to give way to law-governed
administration.16 By the end of 1942 this transition had been achieved. Victory at
Stalingrad was in sight. Within the crisis-torn economy a working balance had been
roughly restored. Within the war cabinet the responsibility for economic priorities
formerly divided between leading individuals had been centralized in a new
Operations Bureau.17 From now on the role of political leadership was no longer
crucial to Soviet survival, for the system as a whole was now fully mobilized for a
war which it could no longer lose.
How did Soviet political leadership compare with that of other war economies?
The U.K. economy also went through a phase of rapid reorientation for war. It
differed from the Soviet experience both in starting point (less than full employment
of both labour and fixed assets) and process (there was no invasion of British
15 Harrison, Soviet planning, pp. 74-5, 85-6.
16 Ibid., pp. 165-75.
17 Ibid., pp. 175-85.
11
territory and the national product expanded). The result, however, was not
dissimilar a resource-constrained, “shortage” economy subject to non-price
regulation of the working population (its participation and distribution), of
productive capacity and investment goods, of intermediate goods and raw
materials, and of most retail and all foreign trade.
While the British transition was marked by indispensable political change at the
top (the collapse of the Chamberlain administration and its replacement by
Churchill’s coalition in May 1940), personal leadership was relatively unimportant in
managing the economic conversion process. As far as the U.K. economy was
concerned, the rule was to fight the war by committee.
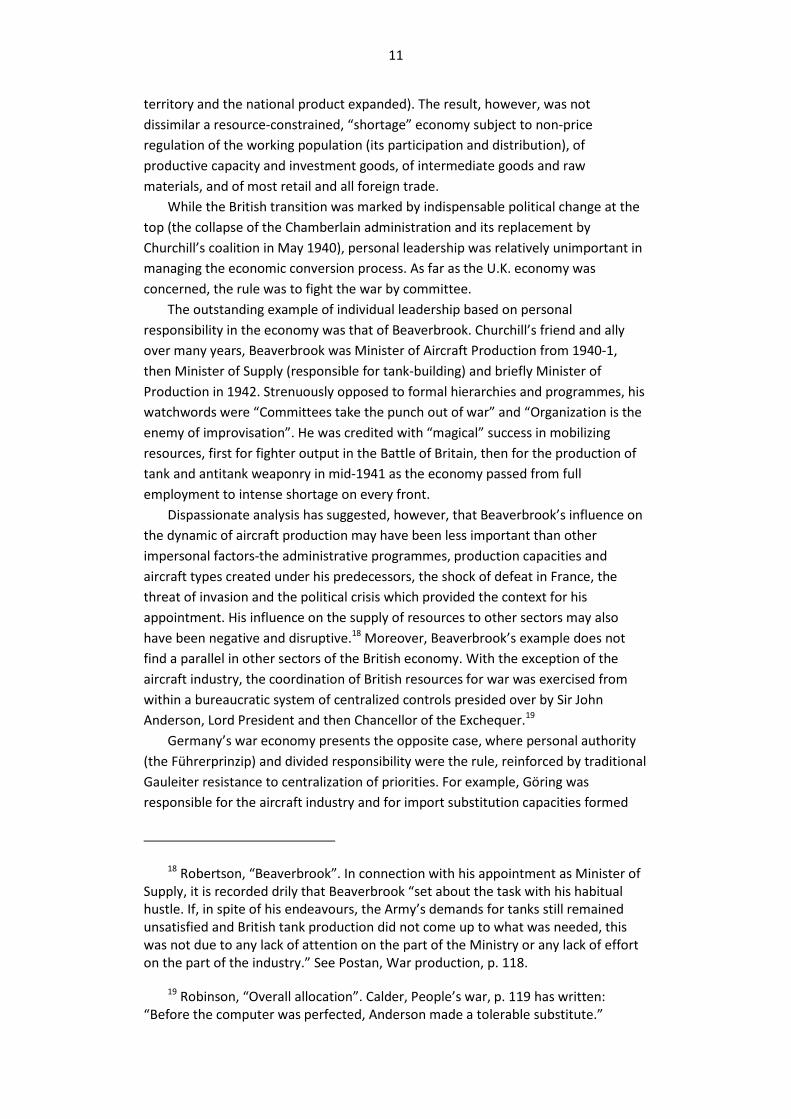
The outstanding example of individual leadership based on personal
responsibility in the economy was that of Beaverbrook. Churchill’s friend and ally
over many years, Beaverbrook was Minister of Aircraft Production from 1940-1,
then Minister of Supply (responsible for tank-building) and briefly Minister of
Production in 1942. Strenuously opposed to formal hierarchies and programmes, his
watchwords were “Committees take the punch out of war” and “Organization is the
enemy of improvisation”. He was credited with “magical” success in mobilizing
resources, first for fighter output in the Battle of Britain, then for the production of
tank and antitank weaponry in mid-1941 as the economy passed from full
employment to intense shortage on every front.
Dispassionate analysis has suggested, however, that Beaverbrook’s influence on
the dynamic of aircraft production may have been less important than other
impersonal factors-the administrative programmes, production capacities and
aircraft types created under his predecessors, the shock of defeat in France, the
threat of invasion and the political crisis which provided the context for his
appointment. His influence on the supply of resources to other sectors may also
have been negative and disruptive.18 Moreover, Beaverbrook’s example does not
find a parallel in other sectors of the British economy. With the exception of the
aircraft industry, the coordination of British resources for war was exercised from
within a bureaucratic system of centralized controls presided over by Sir John
Anderson, Lord President and then Chancellor of the Exchequer.19
Germany’s war economy presents the opposite case, where personal authority
(the Führerprinzip) and divided responsibility were the rule, reinforced by traditional
Gauleiter resistance to centralization of priorities. For example, Göring was
responsible for the aircraft industry and for import substitution capacities formed
18 Robertson, “Beaverbrook”. In connection with his appointment as Minister ofSupply, it is recorded drily that Beaverbrook “set about the task with his habitualhustle. If, in spite of his endeavours, the Army’s demands for tanks still remainedunsatisfied and British tank production did not come up to what was needed, thiswas not due to any lack of attention on the part of the Ministry or any lack of efforton the part of the industry.” See Postan, War production, p. 118.
19 Robinson, “Overall allocation”. Calder, People’s war, p. 119 has written:“Before the computer was perfected, Anderson made a tolerable substitute.”

12
under the Four Year Plan of 1936-40, Funk for the civilian economy under the
Economics Ministry, Thomas for military procurement under the Wehrmacht high
command and Todt, then Speer for the Ministry of Armaments. This system sufficed-
as long as the industrial requirements of Germany’s Blitzkrieg fell short of full-scale
mobilization of her economy, and while Germany could draw readily on the
resources and slave labour of her occupied territories.
After 1941 German economic leaders like Speer, the Minister of Armaments,
understood that this was no longer enough, and began to try to persuade Hitler of
the need for full centralization of controls on resource allocation.20 Ultimately,
however, they were unable to secure it; in particular, Speer could not extend his
influence over German labour, under the protection of Nazi traditionalists like
Sauckel (the protégé of Hitler’s personal secretary, Bormann) of the Reich Labour
Office. At the height of Germany’s economic mobilization the principle of divided
responsibilities meant that her economy remained full of untouched reserves-of
industrial capacity, of female labour, of Himmler’s SS resources.21
Comparison of Hitler’s Germany and Stalin’s Russia as convergent systems,
whether “totalitarian” or “shapeless”, fails to throw light on differences in their
styles of wartime resource mobilization. German leaders failed to secure centralized
coordination of resources for a protracted war; Soviet leaders were not finally
frustrated by similar ideological and institutional barriers to productive effort. The
Soviet path to a fully centralized and coordinated war economy was not a straight
line and took eighteen months to negotiate, but local traditions and bureaucratic
interests did not prevail against it.22 The Soviet and German paths did not converge.
The U.S. economy followed its own path of wartime mobilization. The huge
increase of war production which marked the first year of the war was almost
entirely unregulated. Multiple high-level agencies with overlapping responsibilities
competed with each other and with the private sector for access to industrial
resources. By mid-1942 war contracts had been issued to a sum exceeding the value
of the 1941 gross national product. It took eighteen months for a coherent pattern
of specialization of war agencies to emerge, based on controls over war contracts,
producer goods, wage and price controls, and consumer rationing. Central oversight
20 Speer’s attempt to centralize controls over input allocations should not beconfused with his policy (inherited from Fritz Todt) of decentralization ofmanagement of the procurement process from military administrators to industry-based production committees. See Milward, German economy, pp. 59-63; Speer,Third Reich, ch. 15 (“Organisational improvisation”), pp. 204-13.
21 See especially Klein, Germany’s preparations, chs. V, VI; Milward, Germaneconomy, chs. IV, VI; Carroll, Design for total war, chs. XI-XIII.
22 Thus, unlike Himmler’s SS, Beriya’s NKVD resources were coordinated with therequirements of the war economy and were not held apart as a “state within astate”; see Harrison, Soviet planning, pp. 590-1.

13
of policy also had to be secured, in May 1943, in the Office of War Mobilization
under Byrnes.23
Whether this amounted to a recipe for centralization by committee on the
British model was never really put to the test. Such was the increase in participation,
production, and productivity that the United States never experienced a “shortage”
economy. Household consumption continued to rise. Investment continued to be
regulated through financial criteria rather than on the British pattern of
administrative controls on labour allocation and a recoupment period governed by
the expected duration of the war.24 Full employment was restored, and manpower
became “the most critical factor in war production today”-the judgement of War
Production Board chairman Nelson in 1944; but he also wrote that there was “never
an actual over-all shortage of manpower” only “localized manpower shortages”.25
Alone of the major Allies, the United States never had to resort to direction of
industrial labour or a universal compulsory service law.
The qualities of Stalin, Churchill, Roosevelt, and Hitler also bear upon this issue.
Churchill, Stalin, and Hitler shared a taste for strategy and enthusiasm for
interference in operational decisions; each was often dictatorial towards
subordinates and intolerant of correction by them. Roosevelt disliked delegating
unified authority to subordinates, and preferred the rivalry of competing individuals
and agencies to the emergence of dominant centres of authority. The consequences
were quite different for their respective countries. For Hitler to make a single false
step was a disaster for Germany, since everything depended on Germany’s securing
military victory before the potential anti-German coalition could mobilize its full
resources. Much smaller risks were attached to the quality of judgement of Churchill
or Roosevelt-after the Battle of Britain and Pearl Harbor, anyway. For the Soviet
Union, Stalin’s mistakes were of diminishing importance after 1941; after the battle
of Stalingrad, they could no longer affect critically the outcome of the war, which
from now on depended mainly on superior Allied resources.26
III
The attempt to compare each nation’s war effort, as a proportion of its national
economy, has been characterized by many sources of confusion. Most obvious is the
problem of ensuring comparability of national income and war spending measures.
Consider the traditional view, which holds that the U.S. economy was less fully
23 Vatter, U.S. economy, chs. 3, 4 (“Wartime administration”, “Stabilization andthe OPA”), pp. 67-101.
24 Robinson, “Overall allocation”, p. 53.
25 Cited in Vatter, U.S. economy, p. 173n.
26 For the comparison of Stalin, Churchill, and Hitler, see Bialer, ed., Stalin, pp.42-4. On Roosevelt see Vatter, U.S. economy, p. 69 and Fearon, War, prosperity anddepression, p. 276.

14
mobilized at the wartime peak than the British economy.27 In relation to uses of the
national income this view was first advanced in detail by Carroll in her comparative
study of national income shares.28
Such national income shares are commonly measured in the current domestic
prices of each country; they indicate the ability of each country to commit available
resources to its war effort, and the sacrifice of non-war uses of national income
implied by wartime commitments. By this measure, each country’s share of national
income allocated to military spending may change through time for two reasons:
because of changes in the proportions of real war and non-war spending, and
because of changes in the relative prices of war and non-war products.
Quantification of relative price effects is lacking for the four powers in wartime,
except in the case of the United States for which they are known to have been
small.29 Underlying Carroll’s argument was the proposition that already by 1942 the
U.K. had committed no less than 64 per cent of her national income to the war
effort, compared to a maximum of 42 per cent in 1943-4 for the United States.30 This
finding is seriously misleading. Thus, for the United Kingdom Carroll’s national
income measure was net national product (NNP) at factor cost; for the United
States, gross national product (GNP) at market prices. In wartime, the difference
between American GNP at market prices and NNP at factor cost (capital
consumption and net indirect taxes) amounted to more than one-fifth of GNP.
Moreover, Carroll’s measure of U.K. military spending up to 1942 is inflated by
inclusion of “capital” items (repayment of pre-war defence loans). Her NNP data for
the U.K. are reported by calendar year, defence spending on a fiscal year basis.
Additionally, since publication of Carroll’s work, historical national income estimates
for the U.K. have been revised, with major effect.
When the distortions are eliminated and new estimates taken into account it
transpires that, at the wartime peak (which now falls in 1943 or 1944 for each
27 Weeks, “Anglo-American supply”, p. 71: “There were differences of opinion onthe method of calculation and on the precise answer, but there was no doubt that alarger proportion of the British economy was devoted to warlike purposes than inthe United States-and, of course, for a longer period.”
28 The proposition had previously been advanced by economists of the U.S.Foreign Economic Administration in a graph appended to U.S. president’s twentiethreport, p. 41, but sources, methods, and quantitative details were never madepublic. Allen, “Mutual aid”, p. 542 provided further estimates based on preliminarywartime national income and budget accounts, with somewhat greater foundation.
29 United States war outlays are estimated in proportion to GNP at current pricesat 41.9 per cent in 1944 (U.S. Department of Commerce data cited in Historicalstatistics, pp. 139, 142, series Fl and F83), or 39.9 per cent of GNP at constant 1939prices (Department of Commerce data deflated by the U.S. War Production Board,cited in American industry, p. 27).
30 Carroll, Design for total war, pp. 184-5; see also her statistical appendix (pp.262-7).

15
country), the two countries allocated similar shares of national income to reported
spending on goods and services for the war effort. Carroll’s conclusion that Germany
matched the U.K. peak of national income mobilization for war only in 1944 is also
mistaken; it is based on comparing German military spending with “total available
output” (GNP plus net imports, not GNP as claimed), which significantly understates
German war expenditures in proportion to national income. Removal of this
distortion shows that, by national income share, by 1943 Germany was the most
highly mobilized of the powers.
Now there arises a further complication-how to account correctly for the role of
wartime international transfers. Great Britain, the Soviet Union, and Germany all
relied on external resources to finance a significant share of their domestic war
expenditures. For Germany the source of these transfers was her conquered
territories in both western and eastern Europe; for the U.K. and the U.S.S.R. the
source was North American supply, especially from the United States (in addition,
the net imports of the U.K. were also financed in part out of overseas investment
incomes). When British and Soviet military expenditures are compared with those of
the United States, we find that U.S. Lend-Lease transfers were double counted.
United States military goods supplied to the other Allies were counted once by the
United States as federal spending on national security (not as exports);31 then they
were counted a second time by the recipient nations in their own budget revenues
and spending on the war. Thus, all the wartime partners claimed simultaneous credit
for allocating U.S. transfers to the common cause.
Table 3 shows measures of national income mobilization for the four powers on
a uniform basis. For comparability, military spending is shown in proportion to the
national product net of capital depreciation; the Soviet national income measure is
converted to a western basis. Whether the national or domestic product is used is
immaterial except for the U.K. where investment income from overseas was
significant; in the latter case overseas investment income is also netted out, leaving
net domestic product. All national income measures are at current factor cost,
except for the U.S.S.R. for which constant factor costs of 1937 are used. What this
means in principle is that the Soviet series give a more accurate impression of
relative changes in real magnitudes of war and non-war production, but do not
reflect the current sacrifice of non-war uses of national income with the same
accuracy as would calculations at current factor cost.
For each nation, two measures of the mobilization of its national income are
derived. Measure (I) shows the national utilization of resources supplied to the war
effort, irrespective of origin, in proportion to the national product. This is the
measure appropriate to the study of national priorities. For the U.K., U.S.S.R., and
Germany it is the traditional measure: the ratio of officially reported or estimated
defence expenditures to national income; for these countries it constitutes the
upper bound on national income mobilization. For the U.S.A. it means deducting
31 Shoup, Principles, p. 188.

16
those federal expenditures which supplied the war effort of other nations, and is the
lower bound on measured mobilization of national income.
Table 3. The mobilization of net national product for war: the U.S.A., U.K., U.S .S .R.,
and Germany, 1938-45 (per cent of national income)
U.S.A.a UKb U.S.S.R.c Germanyc
(I) (II) (I) (II) (I) (II) (I) (II)
1938 … … 7 2 … … 17 18
1939 1 2 16 8 … … 25 24
1940 1 3 48 31 20 20 44 36
1941 13 14 55 41 … … 56 44
1942 36 40 54 43 75 66 69 52
1943 47 53 57 47 76 58 76 60
1944 47 54 56 47 69 52 … …
1945 … 44 47 36 … … … …
Key: (I) National utilization of resources supplied to the war effort, regardless oforigin: military spending (for the United States, less net exports) as share of nationalproduct. (II) Domestic finance of resources supplied to the war effort, irrespective ofutilization: military spending (for the U.K., U.S.S.R., and Germany, less net imports)as share of national product.Notes and sources:a. For NNP at factor cost and federal military spending see Historical statistics, pp.
139, 142 (series F7 and F83). Net exports, including military transfers, are givenfor 1939-44 in American industry, p. 52.
b. NDP at factor cost and net imports of goods and services from Feinstein,National income, tables and 2. Military spending from Hancock and Gowing,British war economy, pp. 75, 347.
c. NNP at constant (1937) factor cost from Moorsteen and Powell, Capital stock,table T-47 (pp. 361-2), and Powell, “War years”, table T-47-X (p. 25). Militaryspending and net imports, also at 1937 factor cost, derived primarily fromBergson, Real national income, pp. 70, 99-100, and 130 by various means.
d. Klein, Germany’s preparations, p. 256. GNP at market prices is adjusted to NNPat factor cost by a deduction representing the share of capital depreciation andindirect taxes in 1938 GNP within pre-1939 boundaries (see p. 251).
(For further detail and discussion, please apply to the author for appendix C.)
Measure (II) shows the domestic finance of resources supplied to the war effort,
irrespective of utilization, in proportion to the national product. This is the measure
appropriate to the study of domestic mobilization. It is assumed that domestic
supply of military spending was eased by the full amount of net imports (for the
United States it means crediting her domestic war effort in full with U.S. resources
transferred to her allies’ fighting strength). For the United Kingdom, U.S.S.R., and
Germany net imports are deducted from reported or estimated military spending,
resulting in a lower bound of measured national income mobilization. For the U.S.A.
the traditional measure of reported defence expenditure is used, resulting in an
upper bound.
The economic war efforts of the main allied nations, in proportion to their
national incomes, peaked at different times in 1942, 1943, or 1944. Table 3 shows

17
that the peak percentages of net national income mobilized for war by the United
States and the United Kingdom differed. On a national utilization basis, the U.K.
allocated more resources (irrespective of origin) to the war (57 versus 47 per cent of
national income). When consideration is restricted to domestically financed supply
of the war effort, however, the balance of mobilization changes in favour of the U.S.
economy, which devoted 53-4 per cent of NNP to the war effort in 1943-4 compared
to the U.K. maximum of 47 per cent.
The U.S.S.R. showed a higher level of economic mobilization than either of her
allies at the peak. By 1942, after discounting the (as yet minor) role of external
supply, up to two-thirds of the Soviet national income was being allocated to the
war effort. When external resources are included, the proportion rises to three-
quarters. In 1943, on a national utilization basis, the 1942 record was perhaps even
exceeded with 76 per cent of Soviet NNP allocated to the war. From the standpoint
of domestic finance, however, the peak had already passed. The passing of the
maximum of Soviet domestic resource mobilization was associated with military
victory at Stalingrad, with recovery of national output, rising priority being attached
to restoration of the steel, energy, and transport sectors, and with increasing access
to imported military and civilian supplies under Lend Lease.
Table 4. Real national product of the U.S.A., U.K., U.S.S.R., and Germany, 1937-45
U.S.A.
GNPa
(1939 = 100)
U.K.
NDPb
(1938 = 100)
U.S.S.R.
NNPc
(1937 = 100)
Germany
GNPd
(1939 =100)
1937 … … 100 …
1938 … 100 101 …
1939 100 103 107 100
1940 108 120 117 100
1941 125 127 94 102
1942 137 128 66 105
1943 149 131 77 116
1944 152 124 93 …
1945 … 115 92 …
Notes and sources:a. GNP at 1939 market prices from American industry, p. 27.b. NDP at 1938 factor cost, calculated from Feinstein, National income, table 5.c. NNP at 1937 factor cost, derived from Moorsteen and Powell, Capital stock,
table T-47 (pp. 361-2), and Powell, “War years”, table T-47-X (p. 25).d. GNP at 1939 market prices, calculated from Klein, Germany’s preparations, p.
257.
In the case of the United Kingdom and United States the mobilization of outputs
was assisted by a significant increase in the real national product in wartime. Table 4
shows that, between the outbreak of war and the peak of her war effort, U.S.
national income grew by about one-half in real terms; the increase was sufficient to
supply all but one-third of the increase in domestically financed war outlays. The
U.K. position was only slightly less favourable. Between 1939 and 1943 U.K. national

18
income grew by more than a quarter, and this supplied just over half the domestic
finance required for supply of resources for combat. Very different, and far worse,
was the position faced by the Soviet Union; the real national income of the U.S.S.R.
fell by more than two-fifths in 1940-2 under the impact of invasion and territorial
loss.
Table 5 shows that the intensity of mobilization of labour also differed
significantly between the three Allies. On the British definition of fighting strength
plus war-related (“Group I”) employment, by 1943 the United States had diverted
one-third of its working population to the common war effort.
Table 5. Mobilization of the workforce for war: U.S.A., U.K., U.S.S.R., and Germany,
1939/40 and 1943 (per cent of working population)
Group Ia
industry
Armed
forces
Total
war-related
U.S.A.b 1940 8.4 1.0 9.4
1943 19.0 16.4 35.4
U.K.c 1939 15.8 2.8 18.6
1943 23.0 22.3 45.3
U.S.S.R.d 1940 8 5.9 14
1943 31 23 54
Germanyc 1939 14.1 4.2 18.3
1943 14.2 23.4 37.6
Notes and sources:a. Group I industry on the British definition comprised mainly the armament,
shipbuilding, engineering, metalworking, and chemical industries.b. Derived from American industry, pp. 34-5; employment in Group I industries on
the British definition was only slightly less than war employment by the U.S. WarProduction Board classification (ibid., p. 36).
c. Derived from Klein, Germany’s preparations, p. 144. Klein’s estimate ofWehrmacht personnel differs slightly from that underlying the German series intable 2 (B) above.
d. Derived from series for military personnel and the total working population for1940 and years adjacent to 1943 (Harrison, Soviet planning, p. 138), sectoralemployment shares for 1940 (Promyshlennost’, p. 24), national income shares ofdomestic supply of expenditure on munitions and other military procurement,and various assumptions about labour productivity in war and non-warproduction. For details see appendix 3, note to table C-3, available from theauthor on request.
The U.K. had achieved a higher degree of mobilization-45 per cent either in
uniform or in war work. An important difference between the United States and
United Kingdom was that, given the large-scale diversion of U.S. war goods to supply
British and Soviet soldiers, proportionally fewer Americans served in uniform. But a
somewhat smaller proportion of Americans also served in war production; as long as
relative price effects for war and non-war products were small, this must reflect the
high productivity and efficient organization of American defence plant at the height

19
of the war.32 The most intensive workforce mobilization among the Allies, however,
was that of the U.S.S.R., with nearly one-quarter of its workforce in uniform and a
further one-third engaged in war work by 1943.
The course of German wartime economic mobilization was different from any of
these. Table 3 shows that the mobilization of Germany’s national product for war
mounted steadily until 1943 (after which national accounts are no longer reliable),
when the requirements of domestically financed resource mobilization had already
claimed 60 per cent of her national income. On a national utilization basis, when
externally financed war expenditures are included, the proportion rises to three-
quarters. Here the German record was a close match for the Soviet mobilization of
national income in the same year.
In contrast to the Soviet case, supply for the German war effort was eased by
the fact that the years 1939-43 saw significant national income growth (although it
was less substantial than in either the U.K. or the U.S.A); up to one-third of the
increase in German military spending was financed in this way. Another sharp
contrast with the Soviet record-and with that of the Allies generally-is shown in table
5. Here we find that, while Germany’s commitment of national income to the war
effort mounted, the industrial mobilization of labour remained at a relatively low
leve1.33 Paradoxically, when Germany devoted such a large proportion of her
national income to war, the composition of her industrial workforce remained
largely untouched at this aggregate level and its measured mobilization remained far
less than that of other countries.
Part of the explanation for the paradox is surely statistical: as in other countries,
the years 1939-43 saw a substantial switch from civilian to war employment within
32 On a broader definition of war-related employment, by June 1944, 40 per centof the U.S. workforce had been absorbed into the armed forces and war workcompared to 55 per cent for the United Kingdom at the same time: see Allen,“Mutual aid”, p. 525. According to Allen’s estimate, most of the difference betweenU.S. and U.K. workforce mobilization lay in war employment (20.5 against 33 percent respectively), not military recruitment. Discrepancies of coverage and definitionmean that the workforce shares given in table 5 cannot be compared too closelywith national income shares given previously in table 3.
33 Moreover, the hours of work of German workers, and the participation inwork of German women, remained virtually unchanged in 1942 compared to 1939-astriking contrast to the British and Soviet records of labour mobilization. Overy in theTimes Literary Supplement (11 April 1986), p. 393 has pointed out that the share ofwomen in the German working population on the eve of war was already higher (36per cent) than Britain’s wartime peak (33 per cent). It remains true, however, thatemployment of German women, both in the economy as a whole and in industry inparticular, barely rose between 1939 and 1943; women contributed a mere fifth ofthe one million increase in the German working population between those years(see Michalka, ed., Weltmachtanspruch, pp. 389-90). In Great Britain, in contrast,between 1939 and 1943 the increase in female employment (2.2 million) was almostsix times the increase in the total working population (Hancock and Gowing, Britishwar economy, p. 78).
20
Germany’s Group I industrial classification. But the German failure to expand Group I
employment as a whole is in striking contrast to other countries’ success, and also to
Germany’s outstanding record of mobilization of her national income. This paradox
must correspond to the fact that increasingly the bulk of Germany’s war finance was
going to finance a privileged and bloated contingent of military personnel, at the
expense of its equipment and industrial supply (above, table 2). Behind the high
index of German national income mobilization lay a disproportion between soldiers,
industrial war workers and civilian employment which was ultimately
unsustainable.34
All the major combatants of World War II faced difficult problems of balancing
the input requirements of the armed forces and military supply against civilian
needs. For the U.K. and U.S.S.R. the war took the form of a constant struggle to
avoid excessive mobilization of labour and other inputs for war. The threatened
excessive mobilization was a consequence of the drive to divert resources from the
supply of the economy to the immediate requirements of combat. In the Soviet case
this threat was particularly acute in the frontline regions in 1941-2, where
unrestricted mobilization of industrial workers and even skilled workers in the
defence industries into both regular forces and the home guard militia was practised
at critical moments.35 Indeed, it seems likely that the domestic mobilization of Soviet
resources recorded for 1942 could not have been sustained for any longer than a
year, and that relaxation of the war’s claims on domestic output (although not on
employment) in 1943 was a necessary condition for continuation of the war effort.
In the United Kingdom the maximum degree of mobilization consistent with
sustained effort seems to have been reached with each soldier matched roughly by
one worker in the defence industries and two more workers retained in the civilian
economy producing food, clothing, and other necessities for the war worker and
soldier. Any further recruitment for fighting threatened to leave the war worker
without necessities or the soldier without the means of combat. In the British case
the threat was averted by rapid implementation of a complex, centralized system of
rationing labour between economic priorities, and by Churchill’s imposition of a
ceiling of two million on the size of the ground forces in March 1941.36 In the Soviet
34 Overy, “Hitler’s war”, p. 283 has argued that the high national income share ofGerman military spending achieved by 1943 shows the consistent character of theGerman military-industrial mobilization, which resulted in more significantconsumption losses to the German population than are conventionally accepted. Infact, with a rising share of German males being fed, clothed, and housed out of themilitary budget rather than out of household wage incomes, such consumptionlosses are not necessarily implied. On the other hand, the imbalance of military-industrial supply (table 2 above) was perfectly real.
35 Harrison, Soviet planning, pp. 143-4.
36 Hancock and Gowing, British war economy, p. 289 call this “a landmark ofmanpower history”. Later the ceiling was raised slightly to 2.4 million. See also pp.57-9, 300-54.

21
case similar institutional controls, and limits on military mobilization, had been
imposed by November 1942, but the process of establishing them was more costly,
complex, and pragmatic.37
The other threat of excessive input mobilization arose from the temptation to
aim too far into the future in expanding the country’s defence plant capacity. In both
the U.K. and U.S. economies this temptation was reflected in the wartime
establishment of new defence plant which, upon commissioning, could not be
operated because of unforeseen shortages of labour or materials. A Soviet
equivalent was the evacuation of defence plant which, upon relocation, could not be
operated for the same reasons. In each case, the effort of capital formation or
capital evacuation and relocation had been wasted; had it been redirected into
current production, more means of national survival and defence would have been
created.38 The evidence for the U.K. and Soviet economies suggests, however, that
these cases were not typical. In each country wartime investment was successfully
restricted and redirected to match defence priorities. In Germany, in contrast, the
private interests of capital goods producers ensured a relatively high commitment of
resources to capital formation despite the intensified struggle.
United States resources, and their wartime expansion, were such that the point
of excessive mobilization of labour and other inputs was never approached. The
German economy, in contrast, passed almost directly from undermobilization of
labour to overmobilization in 1944. Until D-Day the Reich Labour Office successfully
resisted all pressures to impose centralized controls and national service obligations
on German workers, preferring the option of importation of slave labour from
Germany’s occupied territories; after D-Day Wehrmacht conscription of German
armament workers began.39 Thereafter, until Hitler’s March 1945 order to destroy
remaining economic installations the unwinding of German economic mobilization
was virtually predetermined.
How important were external resources to the different war economies? In fact,
all except the United States relied heavily on external supply, and the degree of each
country’s dependence at its peak was strikingly similar to the others. Table 6 shows
that Britain relied most heavily on the foreign sector in 1941 when overseas supply
equalled nearly one-sixth of her national income; in 1942-5 her reliance was reduced
to around one-tenth, but by 1944 almost 40 per cent of Britain’s armaments came
from overseas.40 Over the war years as a whole, Britain imported net resources
valued at more than one year’s pre-war national income. Her main source of credit
was, of course, the U.S. Lend-Lease programme which amounted to about 15 per
37 Harrison, Soviet planning, pp. 185-91.
38 On British and American investment controls and results see Robinson,“Overall allocation”, pp. 42, 53-4; Vatter, U.S. economy, P. 73. On the Soviet recordsee Harrison, Soviet planning, pp. 133-5.
39 Milward, German economy, pp. 178-81
40 Hancock and Gowing, British war economy, pp. 357-78

22
cent of U.S. military spending and up to 6 per cent of her national income during the
war years.
Table 6. The supply of external resources: net imports of the U.S.A., U.K., U.S.S.R.,
and Germany, 1938-45 (per cent of national income)
U.S.A. U.K. U.S.S.R. Germany
1938 -2 5 … -1
1939 -1 8 … 1
1940 -2 17 … 7
1941 -2 14 … 12
1942 -4 11 9 17
1943 -6 10 18 16
1944 -6 9 17 …
1945 … 11 … …
Sources: See table 3.
The U.S.S.R. was also heavily dependent on Lend-Lease, which may have
supplied resources equal to one-sixth of Soviet NNP at 1937 factor cost in 1943-4.
While an overall measure of the role of external supply in Soviet arms availability is
not possible, it is estimated that overseas sources contributed up to one-quarter of
Soviet aircraft supplies (this was the peak recorded in late 1943) and up to one-fifth
of tank supplies (in 1942); throughout the war the Soviets were able to meet their
own armament and shell needs but, later on, American shipments of trucks,
tractors, and tinned food provided the Red Army with decisive mobility in its
westward pursuit of the retreating Wehrmacht.41 Thus at their respective peaks
British and Soviet dependence upon external supplies were roughly comparable.
Germany, too, imported major resources from abroad. These mounted rapidly
as German control spread through Europe, and by 1942-3 represented supplies
worth (again) nearly one-sixth of her national income. Not counted in the net
balance of resource transfers is another way in which Germany relied upon her
conquests, by the presence of millions of prisoners of war and labourers imported
by force from France and from Eastern Europe – 7.5 million by 1944. (The Soviet
economy, too, benefited from the forced labour of up to 4.3 million German and
Japanese prisoners of war.)42
IV
Comparison of national economies at war cannot escape the fact that, in time of war
as in peace time, economic performance is multi-faceted. As far as wartime
economics are concerned, two aspects are of primary significance: the efficiency and
41 Harrison, Soviet planning, appendix 3
42 Mikhalka, ed., Weltmachtanspruch, p. 389; Swianiewicz, Forced labour, pp.42-3. Swianiewicz suggests that a global figure for Soviet-held prisoners of war of allnationalities might rise to 5-6 million.

23
the intensity of resource use.43 Neither is sufficient on its own-a nation may be
highly efficient at transforming inputs into outputs, yet fall down because of the
high proportion of inputs and capacities left idle or devoted to non-war tasks; on the
other hand a nation may pour resources into its war effort, yet fail because the
effort does not produce results in terms of the means to resist or overcome the
enemy.
In this paper I have addressed only the dimension of resource mobilization-
intensity, rather than efficiency in the use of resources for warfare. By this standard,
Soviet wartime economic performance was clearly superior to that of Nazi Germany.
The Soviet mobilization of industry and labour was more intense. The Soviet
mobilization of the national product was probably excessive in 1942; it was
stabilized in 1943 and, matching Germany’s peak, proved now to be more balanced
and sustained. And this was in spite of the major demographic and territorial loss
imposed by Germany upon the Soviet Union; under comparable circumstances (in
1944-5) German resources swiftly became over-mobilized and military-economic
collapse followed.
The Soviet mobilization of resources may also be compared with that of its
wartime allies. In terms of domestic production and employment the mobilizations
of both the United States and United Kingdom rated lower in intensity than that of
the Soviet Union. Against historians’ conventional expectation, of the two western
Allies the output mobilization of the United States was greater in proportion to her
resources. To secure it, the Americans had to direct a significantly smaller
proportion of the U.S. working population into war work than did the British.
(Moreover, proportionally fewer Americans served in uniform.) The more limited
British output mobilization required a degree of workforce mobilization higher than
that of the United States, although still much less than that of the Soviet Union.
At the same time the burdens imposed by the war upon the U.S., British, and
Soviet economies were not the same; those faced by the U.S.S.R were much more
severe. Both the western allies started from a relatively high-level economic base,
and with spare capacity which allowed substantial expansion of economic activity
when war broke out. In contrast, the Soviet starting point was a lower-level
economic base and resources which were already fully employed; when war broke
out, a catastrophic decline in national economic activity was forced on the U.S.S.R.
by the loss of territory, assets and of population on a huge scale. The U.K. suffered
only aerial bombardment and attempted blockade, and the continental United
States encountered neither of these. The Soviet Union was, after all, the only
country of World War II to survive invasion as a nation state.
In measuring the intensity of resource mobilization for war, the share of
resources devoted to war is insufficient on its own. Also of relevance is the intensity
of use of the resources produced in combat. According to Goldsmith’s postwar
estimate the Germans produced over $50 billion of weaponry for use on the eastern
front, compared to Soviet supply (including external resources) totalling about $60
43 See Hanson, “East-West comparisons”, pp. 332-3.

24
billion. On the western front, in contrast, the Allies disposed of well over $100 billion
worth of munitions (excluding those supplied to the U.S.S.R.) for use against
Germany and Italy which, in their turn, disposed of only about $40 billion of
munitions in the western theatres.44 This corresponds to well-known data on the
balance of personnel along the two fronts, showing that from June 1941 to January
1944 the Soviet armed forces always faced at least 90 per cent of Germany’s
frontline ground forces, as well as about half of the (much less significant) frontline
ground forces of Germany’s allies.45Thus, in the years from mid-1941 to mid-1944
Soviet resources were employed in the cause of Germany’s military defeat with far
greater intensity than those of the United Kingdom or North America.
References
Allen, R. G. D., “Mutual aid between the U.S. and the British Empire, 1941-1945”,
Journal of the Royal Statistical Society, 109 (1946), reprinted as appendix III of R.
S. Sayers, Financial policy, 1939-1945 (1956), pp. 518-56.
American industry in war and transition, 1940-1950, part II, The effect of the war on
the industrial economy (U.S. War Production Board: Washington, D.C., 1945).
Bergson, A., The real national income of Soviet Russia since 1928 (Cambridge, Mass.,
1961).
Bialer, S., ed., Stalin and his generals: Soviet military memoirs of World War II
(1970).
Calder, A., The people’s war: Britain, 1939-1945 (1969).
Carroll, B. A., Design for total war: arms and economics in the Third Reich (The
Hague-Paris, 1968).
Cooper, J. M., “Defence production and the Soviet economy, 1929-1941”, Soviet
Industrialization Project series no. 3 (Centre for Russian and East European
Studies, University of Birmingham, 1976).
Fearon, P., War, prosperity and depression: the U.S. economy, 1917-45 (Oxford,
1987).
Feinstein, C. H., National income, expenditure and output of the United Kingdom,
1855-1965 (Cambridge, 1972).
Goldsmith, R. W., “The power of victory: munitions output in World War II”, Military
Affairs, 10 (1946), pp. 69-80.
Hall, H. D., North American supply (1955).
Hancock, W. K. and Gowing, M. M., The British war economy (1949).
Hanson, P., “East-West comparisons and comparative economic systems”, Soviet
Stud., 22 (1971), pp. 327-43.
Harrison, M. Soviet planning in peace and war, 1938-1945 (Cambridge, 1985).
Historical statistics of the United States: colonial times to 1957 (U.S. Department of
Commerce, Bureau of the Census: Washington, D.C., 1960).
44 Goldsmith, “Power of victory”, pp. 76-7.
45 Velikaya Otechestvennaya voina, p. 502.

25
Istoriya Velikoi Otechestvennoi voiny Sovetskogo Soyuza, 1941-1945, 6 vols.
(Moscow, 1961-5).
Istoriya Vtoroi Mirovoi voiny, 1939-1945, 12 vols. (Moscow, 1973-82).
Kaldor, N., The German war economy”, Review of Economic Studies, 13 (1946), pp.
33-52.
Klein, B. H., Germany’s economic preparations for war (Cambridge, Mass., 1959).
Lieberman, S. R., “The evacuation of industry in the Soviet Union during World War
II”, Soviet Studies, 35 (1983), pp. 90-102.
Lieberman, S. R., “Crisis management in the U.S.S.R.: the wartime system of
administration and control”, in S. J. Linz, ed., The impact of World War II on the
Soviet Union (Totowa, N. J., 1985), pp. 59-76.
Michalka, W., ed., Das Dritte Reich: Dokumente zur Innen- und Aussenpolitik, vol. 2:
Weltmachtanspruch und nationaler Zusammenbruch, 1939-45 (Munich, 1985).
Milward, A. S., The German economy at war (1965).
Milward, A. S., War, economy and society, 1939-1945 (1977).
Moorsteen, R. and Powell, R. P., The Soviet capital stock, 1928-1962 (Homewood,
Ill., 1962).
Overy, R. J., “Hitler’s war and the German economy: a reinterpretation”, Economic
History Review, 35 (1982), pp. 272-91.
Overy, R. J., The Nazi economic recovery, 1932-1938 (1982).
Postan, M. M., British war production (1952).
Powell, R. P., “The Soviet capital stock and related statistical series for the war
years”, in “Two supplements to R. Moorsteen and R. P. Powell, The Soviet
capital stock, 1928-1962” (The Economic Growth Center, Yale University: New
Haven, Conn., 1969), pp. 1-39.
Promyshlennost’ SSSR (Moscow, 1961).
Robertson, A. J., “Lord Beaverbrook and the supply of aircraft, 1940-1941”, in A.
Slaven and D. H. Aldcroft, eds., Business, banking and urban history: essays in
honour of S. G. Checkland (Edinburgh, 1982), pp. 80-100.
Robinson, E. A. G., “The overall allocation of resources”, in D. N. Chester, ed.,
Lessons of the British war economy (Cambridge, 1951), pp. 34-57.
Shoup, C. S., Principles of national income analysis (Cambridge, Mass., 1947).
Smith, R. E., The army and economic mobilization (Washington, D. C., 1959).
Speer, A., Inside the Third Reich (1970).
Statistical digest of the war (1951).
Swianiewicz, S., Forced labour and economic development: an enquiry into the
experience of Soviet industrialization (Oxford, 1965).
Tupper, S. M., “The Red Army and Soviet defence industry, 1934-1941” (unpublished
Ph.D. thesis, University of Birmingham, 1982).
United States president’s twentieth report to Congress on Lend-Lease operations
(Washington, D.C., 1945).
Vatter, H. G., The U.S. economy in World War II (New York, 1985).
Velikaya Otechestvennaya voina Sovetskogo Soyuza, 1941-1945, 3rd edn. (Moscow,
1984).

26
Voznesensky, N. A., Voennaya ekonomika SSSR v period Velikoi Otechestvennoi
voiny (Moscow, 1947).
Weeks, H., “Anglo-American supply relationships”, in D. N. Chester, ed., Lessons of
the British war economy (Cambridge, 1951), pp. 69-82.