Resolution of 176Yb and 176Lu interferences on 176Hf to ... · overlaps mean that accurate Hf...
6
Introduction Hafnium 176 Hf to 177 Hf isotope ratio analysis can provide insight into the different geological events and processes that a mineral underwent during its formation/metamorphosis; 176 Hf/ 177 Hf ratios are also used for geochronology dating studies. Isotope geochronology is a dating technique in which the age of a rock or mineral is derived from differences in the abundance of two isotopes of an element. Changes in isotopic abundance may be caused by isotopic (mass) fractionation, or by radioactive decay; in each case, the ratio acts as a geological clock, allowing the time that the mineral was formed to be estimated. Hf has lower mobility than lead (Pb) in metamict minerals such as zircon, xenotime, euxenite etc., so Hf isotope ratios can offer an alternative to Pb/Pb or Pb/U ratios for dating these minerals. Resolution of 176 Yb and 176 Lu interferences on 176 Hf to enable accurate 176 Hf/ 177 Hf isotope ratio analysis using ICP-QQQ with MS/MS Application note Author Glenn Woods Agilent Technologies, UK Geology, environmental
Transcript of Resolution of 176Yb and 176Lu interferences on 176Hf to ... · overlaps mean that accurate Hf...
Introduction
Hafnium 176Hf to 177Hf isotope ratio analysis can provide insight into the different geological events and processes that a mineral underwent during its formation/metamorphosis; 176Hf/177Hf ratios are also used for geochronology dating studies. Isotope geochronology is a dating technique in which the age of a rock or mineral is derived from differences in the abundance of two isotopes of an element. Changes in isotopic abundance may be caused by isotopic (mass) fractionation, or by radioactive decay; in each case, the ratio acts as a geological clock, allowing the time that the mineral was formed to be estimated. Hf has lower mobility than lead (Pb) in metamict minerals such as zircon, xenotime, euxenite etc., so Hf isotope ratios can offer an alternative to Pb/Pb or Pb/U ratios for dating these minerals.
Resolution of 176Yb and 176Lu interferences on 176Hf to enable accurate 176Hf/177Hf isotope ratio analysis using ICP-QQQ with MS/MS Application note
Author
Glenn Woods Agilent Technologies, UK
Geology, environmental

2
Of the Hf isotopes of interest, 177Hf is free from direct isobaric overlap from any other element and does not typically suffer from polyatomic interference from other co-existing elements. However, the second Hf isotope used in the isotope ratio calculation, 176Hf, suffers isobaric overlap from 176Lu and 176Yb, as shown in Figure 1. In order to obtain accurate Hf ratios, it is therefore necessary to separate the 176Hf signal from the overlapping Lu and Yb signals.
Figure 1. Hf (red peak template) in the presence of Lu and Yb matrix. The poor template fit for 176Hf (highlighted in blue outline) is due to the contribution from 176Lu and 176Yb to the signal at m/z 176.
The mass resolution required to separate 176Hf from the Lu and Yb isobaric interferences (M/ΔM of ~140,000 for 176Lu and >150,000 for 176Yb) is far beyond the capability of commercial High Resolution Sector Field ICP-MS (SF-ICP-MS), so sample preparation (chemical separation) is required prior to analysis. In cases where chemical separation cannot be performed, for example in-situ measurement by Laser Ablation (LA), the Lu/Yb overlaps mean that accurate Hf isotope ratio analysis is not possible, or must rely on mathematical corrections (and the errors they can introduce).
An alternative direct approach is “chemical” resolution within a collision/reaction cell (CRC), using specific gas phase ion-molecule reaction(s) that will either:
a) React with the interfering ion to neutralize it or move it to a new mass.
b) React with the analyte to create a new product ion at a different, non-interfered mass.
In this study, the second approach, known as “mass-shift”, was used. Hf reacts efficiently with ammonia cell gas to form Hf-ammonia cluster ions, while Lu and Yb
are relatively unreactive. However, ammonia will react with the other Hf isotopes and other co-existing ions present in a typical sample matrix. These other ions also form ammonia-adduct ions, creating new interferences that vary depending on the matrix composition. These ammonia-adduct ions would interfere with the original Hf isotope pattern, making Hf isotope analysis unreliable, so control over the reaction process is essential.
The solution to this problem is to use a tandem mass spectrometer, which has an additional mass filter before the CRC. This extra mass filter prevents all ions apart from the target mass from entering the CRC, so the reaction chemistry is precisely controlled and unwanted side-reactions are avoided. This double mass filter approach is only possible with a tandem MS (or MS/MS) configuration, which provides unprecedented control of the ion/molecule reaction chemistry used in CRC-ICP-MS methods.
The Agilent 8800 and 8900 Triple Quadrupole ICP-MS (ICP-QQQ) instruments have an additional quadrupole mass filter (Q1), positioned in front of the CRC, with the capability of operating at unit mass resolution (MS/MS mode). In MS/MS operation, only a single mass-to-charge ratio (m/z) is transmitted through Q1, so the other Hf isotopes and any co-existing elements are rejected before they can enter the CRC. Unwanted side-reactions and potentially overlapping product ions are therefore eliminated. This method was used to measure Hf isotope ratios in a variety of samples containing Lu, Yb and mixed rare earth elements (REE). For this proof of concept, all work was performed using solution sample introduction, which allowed a greater flexibility to test interference removal. However, the same cell gas and MS/MS method can also be applied successfully to sample analysis using laser ablation (LA-ICP-QQQ).
Experimental
InstrumentationThe Agilent 8800* ICP-QQQ was configured with an SPS 4 autosampler and the standard sample introduction system consisting of a Micromist nebulizer (free aspiration), quartz spray chamber & torch, and Ni interface cones. Table 1 shows the key instrument parameters used for the analysis.
176Hf cannot be measured, due
to 176Lu and 176Yb overlaps at m/z 176
*The Agilent 8800 ICP-QQQ has been superseded by the 890 ICP-QQQ

3
Table 1. Instrument parameters
Parameter Value
RF power 1550 WSampling depth 7.0 mmNebulizer gas 1.15 L/minSpray chamber temp 2 oCAmmonia (10% in He) cell gas 22% of full scale (~2.2 mL/min)Octopole bias -6.0 VEnergy discrimination -8.0 V
Samples and sample preparationDue to the reactivity of ammonia, its use as a cell gas leads to a complex population of product ions, even in a simple sample matrix. However, selection of the most appropriate adduct ion is relatively simple with ICP-QQQ, by performing a Product Ion Scan. Unique to the MS/MS mode of operation, a Product Ion Scan uses a fixed mass setting for Q1, combined with a Q2 scan across the selected mass range. To identify useful 176Hf- ammonia product ions, Q1 was fixed to mass (m/z) 176 amu, and Q2 was scanned across the mass range from m/z 170 to m/z 260, while aspirating a solution of 5 µg/L Hf. The resulting mass spectrum can be seen in Figure 2. Initially, the reaction product ion spectra may appear complex, but it should be noted that the use of a fixed mass setting for Q1 means that all these ammonia product ions are derived from the 176Hf isotope. The most abundant ammonia adduct ion was Hf(NH)(NH2)(NH3)3
+, which occurs at M + 82 amu (m/z 258 for the 176Hf isotope); this adduct was selected as the preferred mass transition.
It should be noted that the Hf adduct ion used is sensitive to CRC conditions, particularly the acceleration voltage applied from the Octopole Bias. This parameter was optimized to a lower value than is typically used, in order to favor the preferred transition and maximize the yield of the desired product ion. The cell gas flow rate was then re-optimized using the ICP-MS MassHunter autotune routines to further improve the product ion signal.
Figure 2. Product Ion Scan from m/z 170 to m/z 260 showing ammonia adduct reaction product ions formed from 176Hf precursor ion (Q1 set to m/z 176)
A graphical representation of the 176Hf transition can be seen in Figure 3; this schematic illustrates how Q1 (set to m/z 176) eliminates all ions apart from those at m/z 176, and Q2 (set to m/z 258) eliminates the unreacted 176Lu and 176Yb isotopes. The same mass transition is used for the other isotope of interest, 177Hf, using Q1 and Q2 settings of m/z 177 and m/z 259, respectively.
176Lu+
176Yb+
176Hf+
All other isotopes
NH3 reaction gas 176Lu+
176Yb+
Q1 176 amu Q2 258 amu Hf (NH)(NH2)(NH3)3+
passed to detector
Hf+ -> Hf(NH)(NH2)(NH3)3+
Figure 3. Schematic of the 176Hf isotope reaction with ammonia cell gas in MS/MS mode.
4
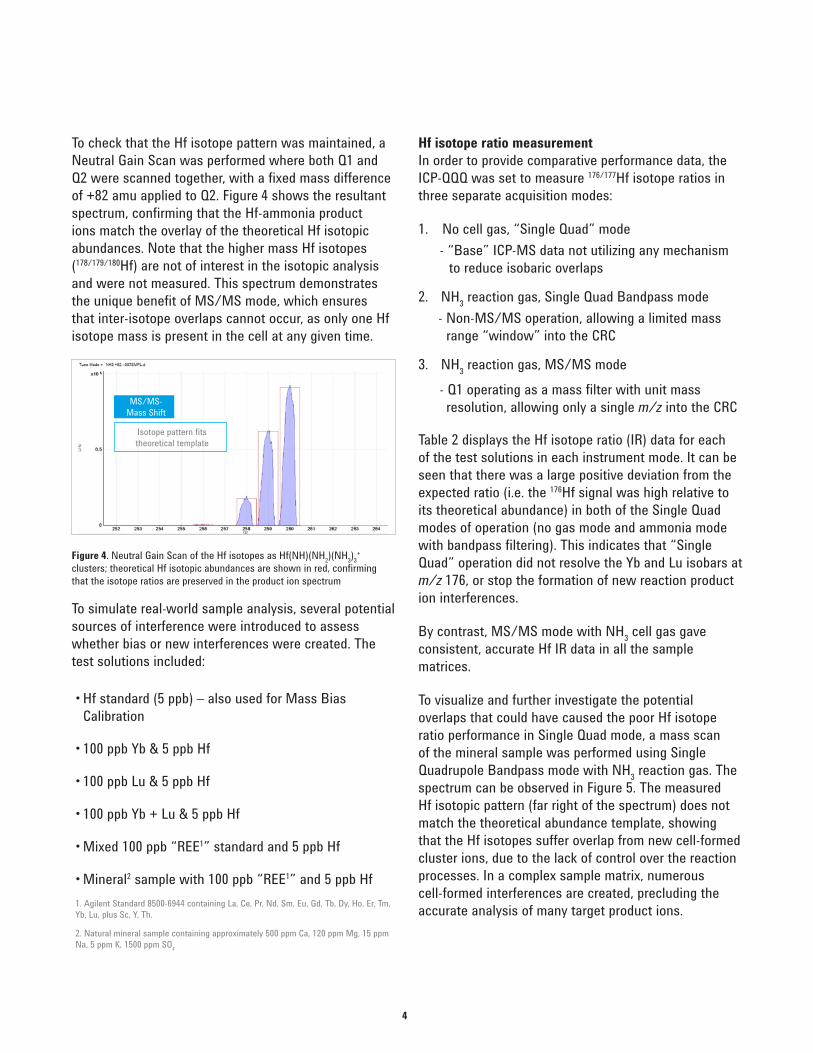
To check that the Hf isotope pattern was maintained, a Neutral Gain Scan was performed where both Q1 and Q2 were scanned together, with a fixed mass difference of +82 amu applied to Q2. Figure 4 shows the resultant spectrum, confirming that the Hf-ammonia product ions match the overlay of the theoretical Hf isotopic abundances. Note that the higher mass Hf isotopes (178/179/180Hf) are not of interest in the isotopic analysis and were not measured. This spectrum demonstrates the unique benefit of MS/MS mode, which ensures that inter-isotope overlaps cannot occur, as only one Hf isotope mass is present in the cell at any given time.
Figure 4. Neutral Gain Scan of the Hf isotopes as Hf(NH)(NH2)(NH3)3+
clusters; theoretical Hf isotopic abundances are shown in red, confirming that the isotope ratios are preserved in the product ion spectrum
To simulate real-world sample analysis, several potential sources of interference were introduced to assess whether bias or new interferences were created. The test solutions included:
• Hf standard (5 ppb) – also used for Mass Bias Calibration
• 100 ppb Yb & 5 ppb Hf
• 100 ppb Lu & 5 ppb Hf
• 100 ppb Yb + Lu & 5 ppb Hf
• Mixed 100 ppb “REE1” standard and 5 ppb Hf
• Mineral2 sample with 100 ppb “REE1” and 5 ppb Hf1. Agilent Standard 8500-6944 containing La, Ce, Pr, Nd, Sm, Eu, Gd, Tb, Dy, Ho, Er, Tm, Yb, Lu, plus Sc, Y, Th.
2. Natural mineral sample containing approximately 500 ppm Ca, 120 ppm Mg, 15 ppm Na, 5 ppm K, 1500 ppm SO4
Hf isotope ratio measurement In order to provide comparative performance data, the ICP-QQQ was set to measure 176/177Hf isotope ratios in three separate acquisition modes:
1. No cell gas, “Single Quad” mode - “Base” ICP-MS data not utilizing any mechanism
to reduce isobaric overlaps
2. NH3 reaction gas, Single Quad Bandpass mode - Non-MS/MS operation, allowing a limited mass
range “window” into the CRC
3. NH3 reaction gas, MS/MS mode - Q1 operating as a mass filter with unit mass
resolution, allowing only a single m/z into the CRC
Table 2 displays the Hf isotope ratio (IR) data for each of the test solutions in each instrument mode. It can be seen that there was a large positive deviation from the expected ratio (i.e. the 176Hf signal was high relative to its theoretical abundance) in both of the Single Quad modes of operation (no gas mode and ammonia mode with bandpass filtering). This indicates that “Single Quad” operation did not resolve the Yb and Lu isobars at m/z 176, or stop the formation of new reaction product ion interferences.
By contrast, MS/MS mode with NH3 cell gas gave consistent, accurate Hf IR data in all the sample matrices.
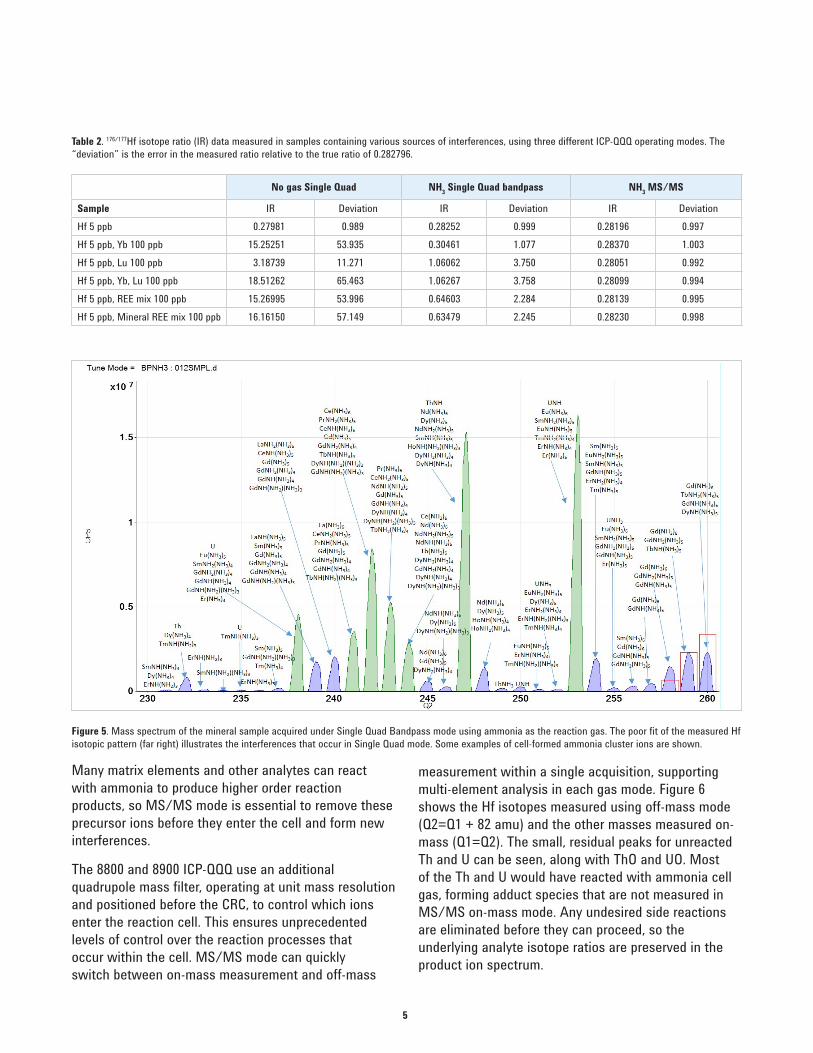
To visualize and further investigate the potential overlaps that could have caused the poor Hf isotope ratio performance in Single Quad mode, a mass scan of the mineral sample was performed using Single Quadrupole Bandpass mode with NH3 reaction gas. The spectrum can be observed in Figure 5. The measured Hf isotopic pattern (far right of the spectrum) does not match the theoretical abundance template, showing that the Hf isotopes suffer overlap from new cell-formed cluster ions, due to the lack of control over the reaction processes. In a complex sample matrix, numerous cell-formed interferences are created, precluding the accurate analysis of many target product ions.
Isotope pattern fits theoretical template
MS/MS- Mass Shift
5
Table 2. 176/177Hf isotope ratio (IR) data measured in samples containing various sources of interferences, using three different ICP-QQQ operating modes. The “deviation” is the error in the measured ratio relative to the true ratio of 0.282796.
No gas Single Quad NH3 Single Quad bandpass NH3 MS/MS
Sample IR Deviation IR Deviation IR DeviationHf 5 ppb 0.27981 0.989 0.28252 0.999 0.28196 0.997Hf 5 ppb, Yb 100 ppb 15.25251 53.935 0.30461 1.077 0.28370 1.003Hf 5 ppb, Lu 100 ppb 3.18739 11.271 1.06062 3.750 0.28051 0.992Hf 5 ppb, Yb, Lu 100 ppb 18.51262 65.463 1.06267 3.758 0.28099 0.994Hf 5 ppb, REE mix 100 ppb 15.26995 53.996 0.64603 2.284 0.28139 0.995Hf 5 ppb, Mineral REE mix 100 ppb 16.16150 57.149 0.63479 2.245 0.28230 0.998
Figure 5. Mass spectrum of the mineral sample acquired under Single Quad Bandpass mode using ammonia as the reaction gas. The poor fit of the measured Hf isotopic pattern (far right) illustrates the interferences that occur in Single Quad mode. Some examples of cell-formed ammonia cluster ions are shown.
Many matrix elements and other analytes can react with ammonia to produce higher order reaction products, so MS/MS mode is essential to remove these precursor ions before they enter the cell and form new interferences.
The 8800 and 8900 ICP-QQQ use an additional quadrupole mass filter, operating at unit mass resolution and positioned before the CRC, to control which ions enter the reaction cell. This ensures unprecedented levels of control over the reaction processes that occur within the cell. MS/MS mode can quickly switch between on-mass measurement and off-mass
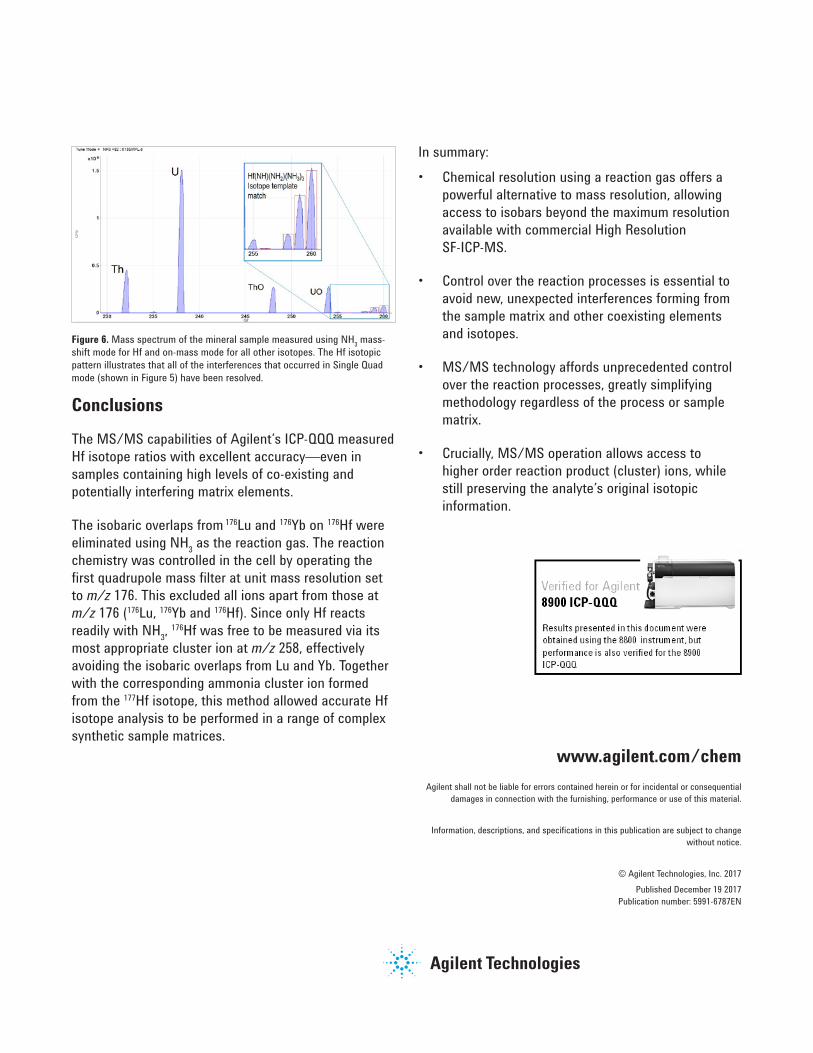
measurement within a single acquisition, supporting multi-element analysis in each gas mode. Figure 6 shows the Hf isotopes measured using off-mass mode (Q2=Q1 + 82 amu) and the other masses measured on-mass (Q1=Q2). The small, residual peaks for unreacted Th and U can be seen, along with ThO and UO. Most of the Th and U would have reacted with ammonia cell gas, forming adduct species that are not measured in MS/MS on-mass mode. Any undesired side reactions are eliminated before they can proceed, so the underlying analyte isotope ratios are preserved in the product ion spectrum.
www.agilent.com/chemAgilent shall not be liable for errors contained herein or for incidental or consequential
damages in connection with the furnishing, performance or use of this material.
Information, descriptions, and specifications in this publication are subject to change without notice.
© Agilent Technologies, Inc. 2017Published December 19 2017
Publication number: 5991-6787EN
Figure 6. Mass spectrum of the mineral sample measured using NH3 mass-shift mode for Hf and on-mass mode for all other isotopes. The Hf isotopic pattern illustrates that all of the interferences that occurred in Single Quad mode (shown in Figure 5) have been resolved.
Conclusions
The MS/MS capabilities of Agilent’s ICP-QQQ measured Hf isotope ratios with excellent accuracy—even in samples containing high levels of co-existing and potentially interfering matrix elements.
The isobaric overlaps from 176Lu and 176Yb on 176Hf were eliminated using NH3 as the reaction gas. The reaction chemistry was controlled in the cell by operating the first quadrupole mass filter at unit mass resolution set to m/z 176. This excluded all ions apart from those at m/z 176 (176Lu, 176Yb and 176Hf). Since only Hf reacts readily with NH3, 176Hf was free to be measured via its most appropriate cluster ion at m/z 258, effectively avoiding the isobaric overlaps from Lu and Yb. Together with the corresponding ammonia cluster ion formed from the 177Hf isotope, this method allowed accurate Hf isotope analysis to be performed in a range of complex synthetic sample matrices.
In summary:• Chemical resolution using a reaction gas offers a
powerful alternative to mass resolution, allowing access to isobars beyond the maximum resolution available with commercial High Resolution SF-ICP-MS.
• Control over the reaction processes is essential to avoid new, unexpected interferences forming from the sample matrix and other coexisting elements and isotopes.
• MS/MS technology affords unprecedented control over the reaction processes, greatly simplifying methodology regardless of the process or sample matrix.
• Crucially, MS/MS operation allows access to higher order reaction product (cluster) ions, while still preserving the analyte’s original isotopic information.