RESILIENCE. PARTNERSHIPS. REBUILDING.
228
dfcu GROUP ANNUAL REPORT AND FINANCIAL STATEMENTS RESILIENCE. PARTNERSHIPS. REBUILDING. 2020
Transcript of RESILIENCE. PARTNERSHIPS. REBUILDING.

dfcu ANNUAL REPORT AND FINANCIAL STATEMENTS 2020 dfcu ANNUAL REPORT AND FINANCIAL STATEMENTS 2020 1PB
dfcu GROUP ANNUAL REPORT
AND FINANCIAL STATEMENTS
RESILIENCE.PARTNERSHIPS.
REBUILDING.
2020

dfcu ANNUAL REPORT AND FINANCIAL STATEMENTS 2020 dfcu ANNUAL REPORT AND FINANCIAL STATEMENTS 2020 32

dfcu ANNUAL REPORT AND FINANCIAL STATEMENTS 2020 dfcu ANNUAL REPORT AND FINANCIAL STATEMENTS 2020 32
Our Vision and Mission 5List of Acronyms 6
About dfcu
Who we are 8Our Business 9Our Journey 10Our Footprint 11Operating Environment 12-13Strategic Snap Shot 14-16
Our Leadership
dfcu Limited Board of Directors and Management 19dfcu Bank Board of Directors 20dfcu Bank - Women Business Advisory Council 21dfcu Bank - Senior Management Team 22Chairman’s Statement 23-25Message from the Chairman, dfcu Bank Board of Directors 26Message from the Chief Executive Officer 27-29
Table of contents

dfcu ANNUAL REPORT AND FINANCIAL STATEMENTS 2020 dfcu ANNUAL REPORT AND FINANCIAL STATEMENTS 2020 54
Financial Review
Financial Definitions 312020 Financial Highlights 322020 at a Glance 33Chief Financial Officer’s Report 34-385 year performance highlights 39Key performance indicators 40Chief Commercial Officer’s Report on Business 41Supporting Lasting Interventions 42-49Supporting our Customers 50Supporting our Staff 51Digital Transformation|Key Achievements And Next Steps 52Risk Management and Control 53-60 Corporate Governance, Audit committee and Nominations report 61-80Sustainability Reporting 81-101Financial Statements 102-226

dfcu ANNUAL REPORT AND FINANCIAL STATEMENTS 2020 dfcu ANNUAL REPORT AND FINANCIAL STATEMENTS 2020 54
Our Missiondfcu seeks to grow shareholder value while playing a key role in transforming the economy and enhancing the well-being of the society. Through our dynamic and responsive teams, we will provide innovative financial solutions and maintain the highest level of customer service and professional integrity.
Our VisionTo be the preferred financial institution, providing a broad range of quality products to our chosen customer segments.
dfcu ANNUAL REPORT AND FINANCIAL STATEMENTS 2020 dfcu ANNUAL REPORT AND FINANCIAL STATEMENTS 2020 76
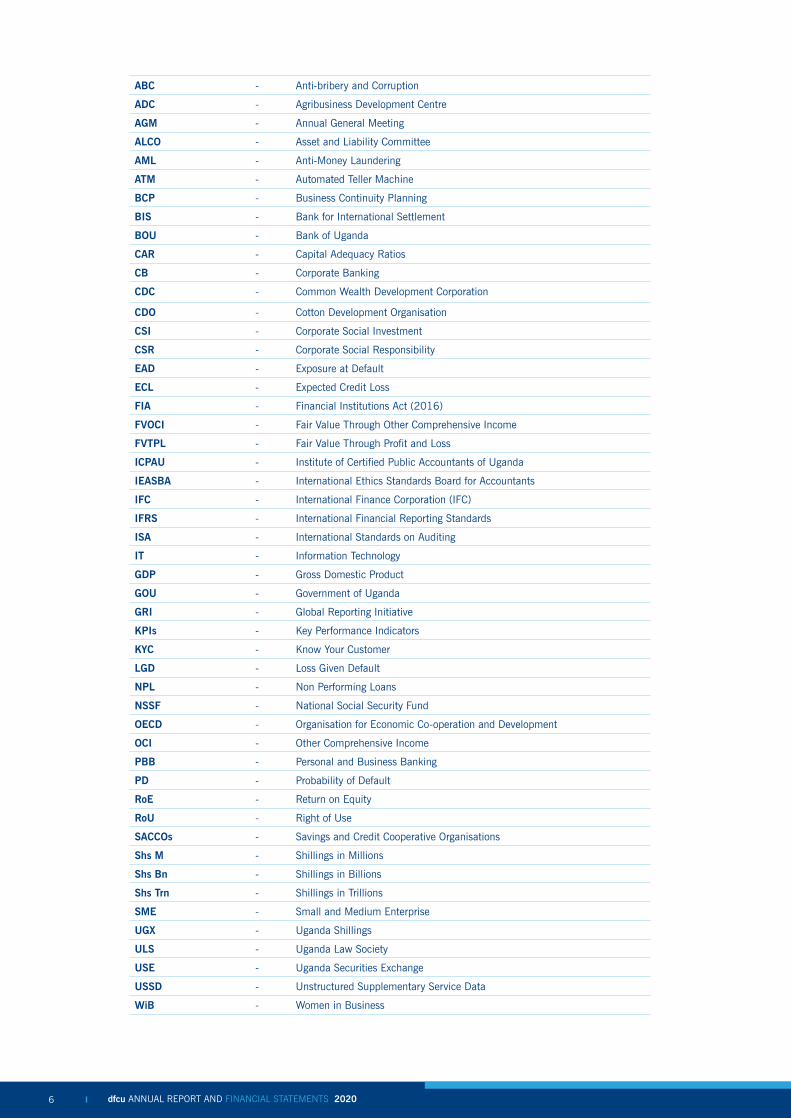
ABC - Anti-bribery and Corruption
ADC - Agribusiness Development Centre
AGM - Annual General Meeting
ALCO - Asset and Liability Committee
AML - Anti-Money Laundering
ATM - Automated Teller Machine
BCP - Business Continuity Planning
BIS - Bank for International Settlement
BOU - Bank of Uganda
CAR - Capital Adequacy Ratios
CB - Corporate Banking
CDC - Common Wealth Development Corporation
CDO - Cotton Development Organisation
CSI - Corporate Social Investment
CSR - Corporate Social Responsibility
EAD - Exposure at Default
ECL - Expected Credit Loss
FIA - Financial Institutions Act (2016)
FVOCI - Fair Value Through Other Comprehensive Income
FVTPL - Fair Value Through Profit and Loss
ICPAU - Institute of Certified Public Accountants of Uganda
IEASBA - International Ethics Standards Board for Accountants
IFC - International Finance Corporation (IFC)
IFRS - International Financial Reporting Standards
ISA - International Standards on Auditing
IT - Information Technology
GDP - Gross Domestic Product
GOU - Government of Uganda
GRI - Global Reporting Initiative
KPIs - Key Performance Indicators
KYC - Know Your Customer
LGD - Loss Given Default
NPL - Non Performing Loans
NSSF - National Social Security Fund
OECD - Organisation for Economic Co-operation and Development
OCI - Other Comprehensive Income
PBB - Personal and Business Banking
PD - Probability of Default
RoE - Return on Equity
RoU - Right of Use
SACCOs - Savings and Credit Cooperative Organisations
Shs M - Shillings in Millions
Shs Bn - Shillings in Billions
Shs Trn - Shillings in Trillions
SME - Small and Medium Enterprise
UGX - Uganda Shillings
ULS - Uganda Law Society
USE - Uganda Securities Exchange
USSD - Unstructured Supplementary Service Data
WiB - Women in Business

dfcu ANNUAL REPORT AND FINANCIAL STATEMENTS 2020 dfcu ANNUAL REPORT AND FINANCIAL STATEMENTS 2020 76
About dfcu

dfcu ANNUAL REPORT AND FINANCIAL STATEMENTS 2020 dfcu ANNUAL REPORT AND FINANCIAL STATEMENTS 2020 98
Who We Are
What we do
dfcu Limited was established in 1964 as a development finance institution. In 2000, dfcu diversified into commercial banking and established dfcu Bank to extend universal banking services alongside the pre-existing equity finance, long term development finance, leasing and working capital finance.
Over the years dfcu has been associated with many success stories in Uganda’s economy in various sectors including transport, education, floricultural, agricultural, manufacturing and agro-processing.
dfcu Limited is listed on the Uganda Securities Exchange (USE) enabling over 3,000 Ugandans to own part of the company.
The major shareholders of dfcu Limited with their shareholdings are as below:
58.70% 9.97%
7.46% 23.87%
dfcu Limited
dfcu ANNUAL REPORT AND FINANCIAL STATEMENTS 20208

dfcu ANNUAL REPORT AND FINANCIAL STATEMENTS 2020 dfcu ANNUAL REPORT AND FINANCIAL STATEMENTS 2020 98
Our strategic aspirations
Our purpose, vision and values are aligned to strategic aspirations that drive our competitive advantage in a changing business environment.
Our execution priorities are: • Become market leader• Transform from a niche to a universal
player • Become Bank 4.0• Superior financial performance
Our business areas
• Commercial Banking- Personal & Business - Corporate & Institutional- Global Financial Markets
• Bancassurance• Real Estate
Customer reach • 58 branches, 1,543 active agents• 450 ATM points (including Interswitch)• 66 Cash Deposit ATMs• Visa Contactless Credit and Debit Cards• Omni Online Banking Platform – Internet,
Mobile and App
• Savings App
Financial strength • Deposit funding of 70% • Tier 1 capital ratio of 19%
Talent
• 1,034 employees • Gender diversity – 52% female staff
Our Business
dfcu ANNUAL REPORT AND FINANCIAL STATEMENTS 2020 9
Our purpose is ‘making more possible’
Our values
We are guided by our values:

dfcu ANNUAL REPORT AND FINANCIAL STATEMENTS 2020 dfcu ANNUAL REPORT AND FINANCIAL STATEMENTS 2020 1110
Our Journey
1965 - dfcu Limited, Uganda Development Corporation and CDC jointly invest in Housing Finance Company, Nytil, Uganda Consolidated Properties, Uganda Cement Industries, Uganda Grain Milling, Uganda Distillers and Uganda Hotels.
1973 – Economic war resulting in significant scaling down of operations.
1982 - Full scale operations resume with company capitalisation.
1995 – Pioneering of the leasing business in Uganda as an alternative financing option for SME growth and expansion.
1999 – Rebranding of Development Finance Company of Uganda into dfcu Limited.
2000 – Start of commercial banking through acquisition and recapitalisation of the defunct Gold Trust Bank later rebranded to dfcu Bank.
2004 - dfcu Limited listed on Uganda Securities Exchange. Initial Public Offering sees IFC, DEG and the Ugandan Government divesting from the Company and NORFUND coming on board.
2007 – Establishment of the Women in Business (WIB) programme with support of the International Finance Corporation (IFC).
2008 – Rationalisation of the Group structure and consolidation of all financial service offerings into dfcu Bank.
2013 – Realigning dfcu Limited shareholding bringing on board Rabobank as a strategic banking partner resulting in intensified focus on supporting Agribusiness.
2014 – Consolidation of operations in one location at dfcu Towers, our wholly owned customised, state-of-the-art Head Office.
2017 – January - dfcu Bank acquires some assets and assumes certain liabilities of Crane Bank becoming one of the three leading banks on the market.
May 2017 - Rabobank, Norfinance A.S. and FMO consolidate their 58.70% stake in dfcu Limited into one major shareholder ARISE B.V.
September 2017 - dfcu Limited floats a successful Rights Issue to raise necessary capital for dfcu Bank to implement its aggressive growth strategy.
2019 - Danish Investment Fund for Development (IFU) buys Common Wealth Development Corporation (CDC) stake in dfcu limited and now owns 9.97% of the company.

dfcu ANNUAL REPORT AND FINANCIAL STATEMENTS 2020 dfcu ANNUAL REPORT AND FINANCIAL STATEMENTS 2020 1110
Ishaka
Rushere
Amuru
Kyengera Abayita Ababiri
Bigger and Stronger with 58 branches and over 100 ATMs
• 6th Street Branch• Acacia Branch• Banda Branch• Bugolobi Branch• Bwaise Branch• Entebbe Road Branch• Impala Branch• Jinja Road Branch• Kampala Road • Kawempe Branch• Kikuubo Branch
• Kireka Branch • Kyadondo Road Branch• Lugogo Branch• Luwum Street • Makerere Branch• Market Street Branch• Naalya Branch • Nabugabo Branch (Gagawala
Shauliyako)• Nateete Branch • Ndeeba Branch
• Nsambya Branch• Ntinda Branch(Capital
Shoppers)• Ntinda II Branch(Ntinda
Trading Centre)• Owino • Sun City Branch• William Street Branch• Wilson Lane • Kyengera Branch
OUR BRANCHES IN KAMPALA

dfcu ANNUAL REPORT AND FINANCIAL STATEMENTS 2020 dfcu ANNUAL REPORT AND FINANCIAL STATEMENTS 2020 1312
COVID-19 Impacts;Uncertainty regarding the duration and impact of Covid-19, and the associated disruption to both the domestic and global economy.
Macroeconomic environment;Contraction of both local and global economies, disruption in supply chains due to Covid, electoral cycle and increased political activity during the year, locusts invasion scare, few active sectors due to lock down associated with Covid-19.
• Emphasis on employee health and safety to guarantee continuity of the business
• Support to customers through loan restructures, rescheduling repayment holidays, to ensure their businesses survive
• Operational resilience -ensuring stability of critical bank operations to minimize service disruption, enhancement of alternative banking channels, facilitating work from home mechanisms for staff
• Financial strength -close monitoring of lending portfolios, maintaining liquidity buffers, continuous stress testing as the basis for re-assessment of provisioning levels as the situation evolves.
• Support to country interventions to mitigate the impacts of the pandemic.
• A strong balance sheet that is managed prudently to provide resilience and to support customers
• We also undertake regular stress tests to understand how our business performs and what actions to take in a variety of scenarios.
• Responsible credit decisions in line with the operating environment
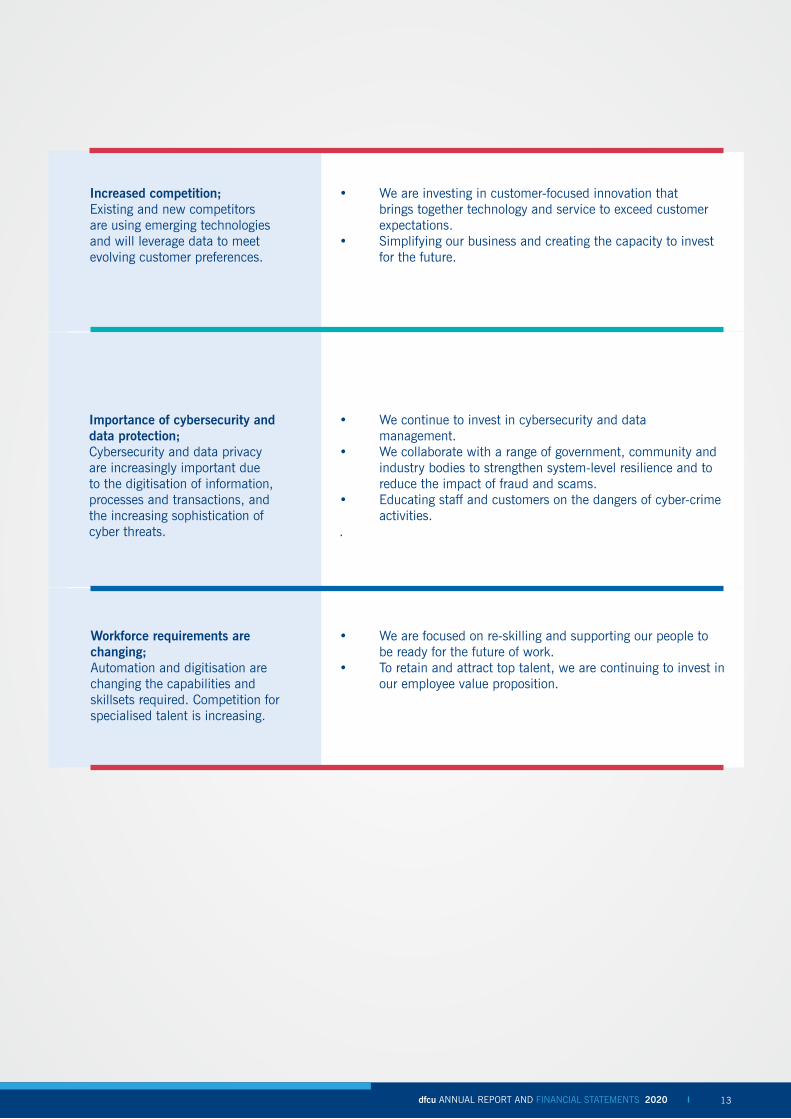
Operating Environment
Regulation driving change;The National Payment Systems Act came into force, Central Bank implemented primary dealer reforms, restricting competitive bidding in the primary auction to only primary dealer banks. The Financial Institutions (Capital Buffers and Leverage Ratio) Regulations, 2020 were gazetted.
• Continue to strengthen our risk management and compliance capabilities.
• We are engaging with regulators proactively and in an open and transparent way.
• Aligning to new regulations in business areas that are impacted
dfcu ANNUAL REPORT AND FINANCIAL STATEMENTS 202012
dfcu ANNUAL REPORT AND FINANCIAL STATEMENTS 2020 dfcu ANNUAL REPORT AND FINANCIAL STATEMENTS 2020 1312
Importance of cybersecurity and data protection; Cybersecurity and data privacy are increasingly important due to the digitisation of information, processes and transactions, and the increasing sophistication of cyber threats.
• We continue to invest in cybersecurity and data management.
• We collaborate with a range of government, community and industry bodies to strengthen system-level resilience and to reduce the impact of fraud and scams.
• Educating staff and customers on the dangers of cyber-crime activities.
.
Increased competition;Existing and new competitors are using emerging technologies and will leverage data to meet evolving customer preferences.
• We are investing in customer-focused innovation that brings together technology and service to exceed customer expectations.
• Simplifying our business and creating the capacity to invest for the future.
Workforce requirements are changing;Automation and digitisation are changing the capabilities and skillsets required. Competition for specialised talent is increasing.
• We are focused on re-skilling and supporting our people to be ready for the future of work.
• To retain and attract top talent, we are continuing to invest in our employee value proposition.
dfcu ANNUAL REPORT AND FINANCIAL STATEMENTS 2020 13

dfcu ANNUAL REPORT AND FINANCIAL STATEMENTS 2020 dfcu ANNUAL REPORT AND FINANCIAL STATEMENTS 2020 1514
Strategy Snapshotdfcu has a vision, “To be the preferred financial institution providing a broad range of quality products to our chosen customer segments;” with a mission “To grow shareholder value while playing a key role in transforming the economy and enhancing the well-being of people. The dfcu strategy is geared towards achievement of four broad winning aspirations in the areas of market leadership, retail transformation, digital banking, and superior financial performance, underpinned by strategic pillars and workstreams that drive how the bank will get towards achieving its strategy and ultimately the financial performance numbers.
Winning aspirations
Winning aspirations show the expected outcome of the strategy and are deliberate choices made to determine what success will look like for the organization, and where Team effort and resources will be invested to achieve the overall strategy. dfcu has set out four (4) winning aspirations which are; (1) Being the market leader (2) Transforming from a niche play to a universal bank, (3) Transitioning into Bank 4.0 (the next generation bank) and (4), Delivering superior financial performance.
Aspiration Description Performance Indicators Commentary
Market leader in Banking
Building value propositions for customers and stakeholders for mutual benefit that position us as an industry leader in our chosen segments.
Increasing share of industry Net Loans and Customer Deposits.Loans 11.6% (2019: 11.1%)Deposits 9.7% (2019: 9.0%)
In terms of the composition of growth in deposits, Current and Savings deposits increased by 7% and 2% respectively while fixed deposits decreased by 5%.
Transforming from a niche play to a Universal Bank
Embedding new ways of working and re-engineering business processes to serve the masses and grow a dynamic business.
Growth in Retail Business.Gross loans: 29% (2019: 38%)Deposits: 16% (2019: -2%)
The pandemic disrupted the pace of growth in the Retail business on the sales side, however, other sales options were leveraged such as the Call Centre.
Bank 4.0 (Next generation bank)
Building a digitally driven organization by redefining the operating model to deliver a seamless customer experience.
Percentage Transaction on Alternate Channels vs Branch (OTC).Alternate: 59% (2019: 67%)Branch: 41% (2019: 33%)
Waived fees and charges on some categories of digital transactions to drive digital banking and support customers during the lockdown.
Superior financial performance
Harnessing increased value from capabilities of new and existing assets and resources to deliver results.
Above Hurdle Rate Return on Equity (364 Treasury Bill)2020 Tbill 13.5%, dfcu: 4.1%2019 Tbill 11.8%, dfcu: 12.9%
The financial performance for 2020 was impacted by exceptional items amounting to 80 Billion mainly related to impact of COVID-19 on customers and impairment of the financial asset at FVTPL.
dfcu ANNUAL REPORT AND FINANCIAL STATEMENTS 2020 dfcu ANNUAL REPORT AND FINANCIAL STATEMENTS 2020 1514
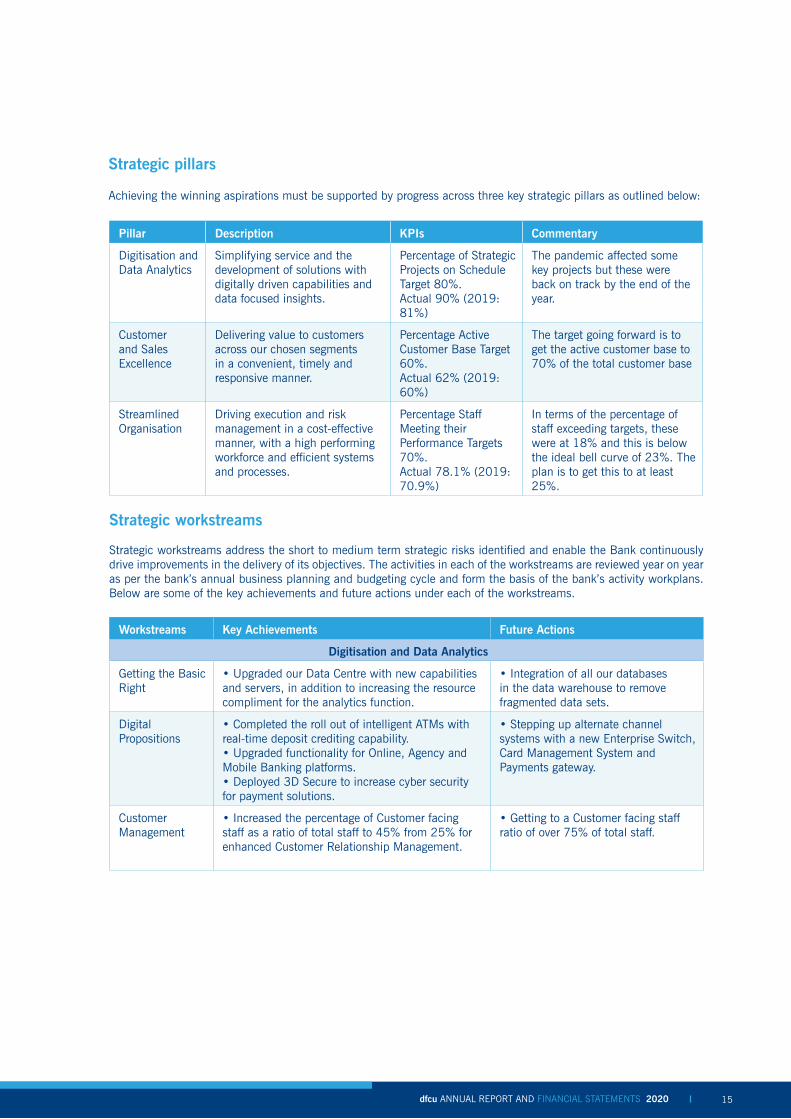
Strategic pillars
Achieving the winning aspirations must be supported by progress across three key strategic pillars as outlined below:
Pillar Description KPIs Commentary
Digitisation and Data Analytics
Simplifying service and the development of solutions with digitally driven capabilities and data focused insights.
Percentage of Strategic Projects on Schedule Target 80%. Actual 90% (2019: 81%)
The pandemic affected some key projects but these were back on track by the end of the year.
Customer and Sales Excellence
Delivering value to customers across our chosen segments in a convenient, timely and responsive manner.
Percentage Active Customer Base Target 60%. Actual 62% (2019: 60%)
The target going forward is to get the active customer base to 70% of the total customer base
Streamlined Organisation
Driving execution and risk management in a cost-effective manner, with a high performing workforce and efficient systems and processes.
Percentage Staff Meeting their Performance Targets 70%. Actual 78.1% (2019: 70.9%)
In terms of the percentage of staff exceeding targets, these were at 18% and this is below the ideal bell curve of 23%. The plan is to get this to at least 25%.
Strategic workstreams
Strategic workstreams address the short to medium term strategic risks identified and enable the Bank continuously drive improvements in the delivery of its objectives. The activities in each of the workstreams are reviewed year on year as per the bank’s annual business planning and budgeting cycle and form the basis of the bank’s activity workplans. Below are some of the key achievements and future actions under each of the workstreams.
Workstreams Key Achievements Future Actions
Digitisation and Data Analytics
Getting the Basic Right
• Upgraded our Data Centre with new capabilities and servers, in addition to increasing the resource compliment for the analytics function.
• Integration of all our databases in the data warehouse to remove fragmented data sets.
Digital Propositions
• Completed the roll out of intelligent ATMs with real-time deposit crediting capability.• Upgraded functionality for Online, Agency and Mobile Banking platforms.• Deployed 3D Secure to increase cyber security for payment solutions.
• Stepping up alternate channel systems with a new Enterprise Switch, Card Management System and Payments gateway.
Customer Management
• Increased the percentage of Customer facing staff as a ratio of total staff to 45% from 25% for enhanced Customer Relationship Management.
• Getting to a Customer facing staff ratio of over 75% of total staff.

dfcu ANNUAL REPORT AND FINANCIAL STATEMENTS 2020 dfcu ANNUAL REPORT AND FINANCIAL STATEMENTS 2020 1716
Customer and Sales Excellence
Standardised Servicing
•Continued engagement with our customers maintaining a Customer Satisfaction Index of 74%. (2019: 75%).
• Step up service quality and improve the Customer Satisfaction Index above the 80% level.
Product Optimisation
•Developed new product for the Small Business segment; “Baraka” targeting low income, mass market customers with non-traditional collateral such as ‘Kibanja’ and movable chattels.
• Onboarding new product options for remittances.• Enhancing bancassurance in the products suite.
Performance Metrics
•Over 78% of staff met performance objectives of which 18% exceeded their performance objectives, compared to 23% for the ideal bell curve.
• Continue developing our people capacity and productivity to increase those exceeding objectives above the ideal bell curve to at least 25% of staff.
A Streamlined Organisation
Business Process Re-engineering and Alignment
• Decentralised certain aspects of the Credit approval and management process to the regions and branches for closer monitoring and to improve service turnaround time.
• Comprehensive review and redesign of the customer journey and propositions across all the customer segments.
Capability Optimisation
• Completed the centralisation of the account opening and related back office processes to free up more resources for sales functions.
• Deepening existing business relationships as we mine value from customer eco-systems and value chains for mutual benefit.
Credit Management and Processing
• Implemented credit relief measures to support customers affected by the COVID-19 pandemic with restructures, reschedules and repayment holidays with over 45% of the loan book restructured.
•. Continue supporting and working with our customers as we wind down the credit relief program in line with Central Bank regulations.
Cost Reduction • Continued reduction in operating expenses year on year by 0.8% or UGX 1.5 billion despite the challenging operating environment. (2019: 4% or 9 billion Shillings reduction)
•.Continue optimising costs to further reduce the Cost to Income Ratio by over 5%.
You’ve got the power.
Call Centre: 0414 351 000 Toll Free: 0800 222 000 Email: [email protected]
dfcu Bank is regulated by the Central Bank of Uganda. Customer deposits are protected by the Deposit Protection Fund of Uganda.
+256 776 760 760 dfcugroup dfcu Bank
WE’RE RAISING THE PINNACLE.
Get the dfcu Visa Credit Card and sort out those things that just can’t wait.
Benefits:• Credit Limit of up to UGX 100 million• Retrenchment cover of up to UGX 50 million• Life and permanent disability insurance of up to UGX 100 million• Global discounts at restaurants, health and wellness clubs and airport lounges
Speak to your Relationship Manager or call 0800 222 000 for details.
Credit
4653EXPIRES 10/25ENDS
CARDHOLDER NAME
4653 7312 3456 7891
4653EXPIRES 10/25ENDS
CARDHOLDER NAME
4653 7312 3456 7891
Credit

dfcu ANNUAL REPORT AND FINANCIAL STATEMENTS 2020 dfcu ANNUAL REPORT AND FINANCIAL STATEMENTS 2020 1716
You’ve got the power.
Call Centre: 0414 351 000 Toll Free: 0800 222 000 Email: [email protected]
dfcu Bank is regulated by the Central Bank of Uganda. Customer deposits are protected by the Deposit Protection Fund of Uganda.
+256 776 760 760 dfcugroup dfcu Bank
WE’RE RAISING THE PINNACLE.
Get the dfcu Visa Credit Card and sort out those things that just can’t wait.
Benefits:• Credit Limit of up to UGX 100 million• Retrenchment cover of up to UGX 50 million• Life and permanent disability insurance of up to UGX 100 million• Global discounts at restaurants, health and wellness clubs and airport lounges
Speak to your Relationship Manager or call 0800 222 000 for details.
Credit
4653EXPIRES 10/25ENDS
CARDHOLDER NAME
4653 7312 3456 7891
4653EXPIRES 10/25ENDS
CARDHOLDER NAME
4653 7312 3456 7891
Credit

dfcu ANNUAL REPORT AND FINANCIAL STATEMENTS 2020 dfcu ANNUAL REPORT AND FINANCIAL STATEMENTS 2020 1918
Our Leadership

dfcu ANNUAL REPORT AND FINANCIAL STATEMENTS 2020 dfcu ANNUAL REPORT AND FINANCIAL STATEMENTS 2020 1918
Elly KaruhangaNon-Executive Director/Chairman dfcu Limited
Appointed Chairman of dfcu Limited: September, 2013. Appointed to the
Board: September, 2005.
Dr. Aminah ZaweddeNon-Executive Director
Appointed to the Board: August 2020.
Kironde LuleNon-Executive Director
Appointed to the Board: September, 2012.
George OchomGeneral Manager
Appointed General Manager: January, 2018.
Friedrich C. PelserNon-Executive Director
Appointed to the Board: October 2018.
Albert JonkergouwNon-Executive Director
Appointed to the Board: December, 2013.
Barbra Teddy ArimiNon-Executive Director
Appointed to the Board: June, 2019.
dfcu Limited Board of Directors and Management

dfcu ANNUAL REPORT AND FINANCIAL STATEMENTS 2020 dfcu ANNUAL REPORT AND FINANCIAL STATEMENTS 2020 2120
Jimmy D. MugerwaNon-Executive Director/
Chairman dfcu Bank
Appointed Chairman of dfcu Bank: September, 2014. Appointed to the
Board: September, 2012.
Albert JonkergouwNon-Executive Director
Appointed to the Board: December, 2013.
Mathias KatambaManaging Director
Since December, 2018.
Jackie Aneno Obol-Ochola
Non-Executive Director
Appointed to the Board: October 2020.
Willem CramerNon-Executive Director
Appointed to the Board: June, 2016.
Angelina Namakula-OfwonoCompany Secretary
Since October, 2019.
Dr. Winifred M. T. Kiryabwire
Non-Executive Director
Appointed to the Board: April 2019.
Grace MakokoNon-Executive Director
Appointed to the Board: July 2019.
William SekabembeExecutive Director
Since August, 2016.
Stephen CaleyNon-Executive Director
Appointed to the Board: June, 2016.
Øivind SolvangNon-Executive Director
Appointed to the Board: September 2019.
dfcu Bank Board of Directors

dfcu ANNUAL REPORT AND FINANCIAL STATEMENTS 2020 dfcu ANNUAL REPORT AND FINANCIAL STATEMENTS 2020 2120
dfcu Bank - Women Business Advisory Council
Dr. Gudula Naiga BasazaChairperson
Gudula is the Vice Chairperson of Private Sector Foundation Uganda (PSFU), a member of the Board of Trustees of Kampala City Traders Association (KACITA) provident fund scheme, a delegate of the Eastern African Women Entrepreneurs Exchange Network (EAWEExN) and a member of the 4th Governing Council of the National Agricultural Research Organisation (NARO). She is a Rotarian and the Managing Director of Gudie Leisure Farm located in Najjera, Kira.
Patricia Karugaba KyazzeManaging Director, Nina Interiors
Patricia is the Managing Director at Nina Interiors Ltd. She has over 20 years’ hands on experience in growing and managing a business as well as developing, overseeing and delivering company strategy.
Rosemary MutyabuleEnterprise Development Specialist
Rosemary is an Enterprise Development Specialist with over 18 years’ experience in small enterprise promotion and private sector development. She has professional expertise in the delivery of business solutions to SMEs, mentoring, coaching and nurturing of businesses, training of businesses in entrepreneurship, provision of business advisory services to SMEs and policy advocacy among others.
Belinda NamutebiCommunications Professional
Belinda Namutebi is a communications professional with over 15 years experience. She is an innovator who is passionate about the power of brands to cause meaningful change; Belinda has a knack for understanding the needs of target audiences and developing innovative campaigns to address challenges and drive change. She is the Founder/ Director of Ondaba World Limited, which is at the forefront of promoting Uganda’s local tourism through a social campaign called ‘I’m So Uganda #Ondaba’.
dfcu ANNUAL REPORT AND FINANCIAL STATEMENTS 2020 dfcu ANNUAL REPORT AND FINANCIAL STATEMENTS 2020 2322
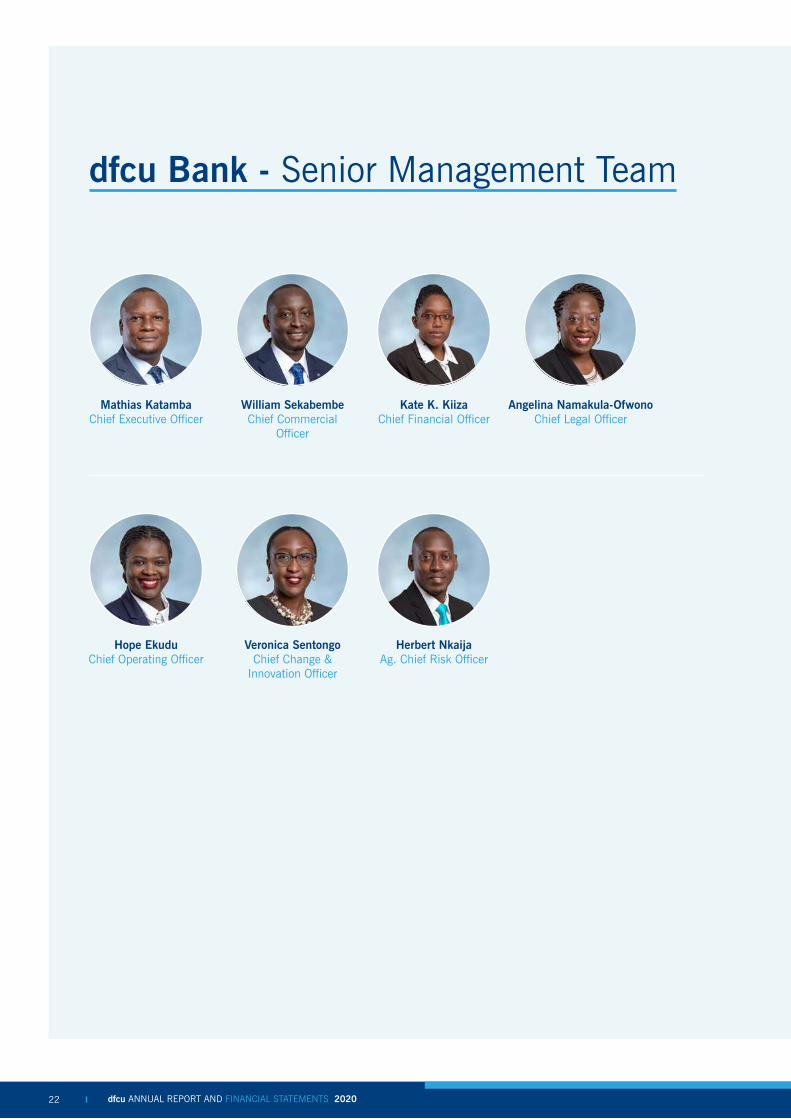
dfcu Bank - Senior Management Team
Mathias KatambaChief Executive Officer
Hope EkuduChief Operating Officer
Kate K. KiizaChief Financial Officer
Herbert NkaijaAg. Chief Risk Officer
William SekabembeChief Commercial
Officer
Veronica SentongoChief Change &
Innovation Officer
Angelina Namakula-OfwonoChief Legal Officer
dfcu ANNUAL REPORT AND FINANCIAL STATEMENTS 2020 dfcu ANNUAL REPORT AND FINANCIAL STATEMENTS 2020 2322
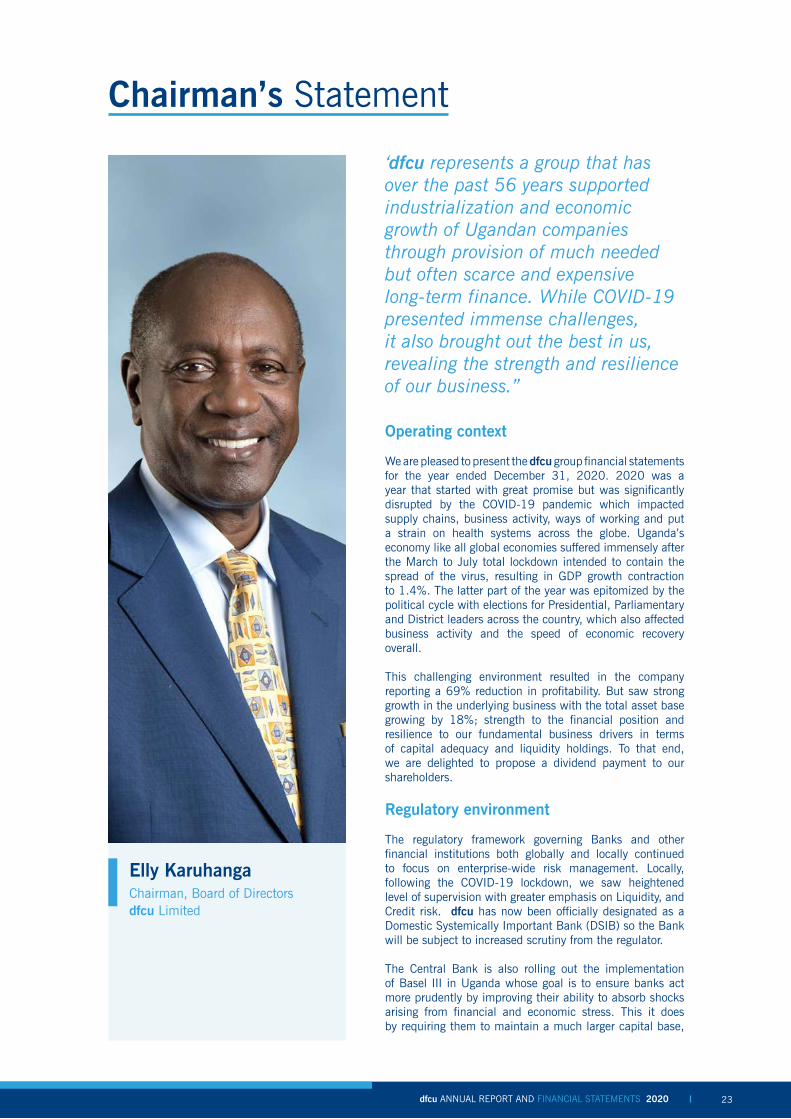
Chairman’s Statement
Operating context
We are pleased to present the dfcu group financial statements for the year ended December 31, 2020. 2020 was a year that started with great promise but was significantly disrupted by the COVID-19 pandemic which impacted supply chains, business activity, ways of working and put a strain on health systems across the globe. Uganda’s economy like all global economies suffered immensely after the March to July total lockdown intended to contain the spread of the virus, resulting in GDP growth contraction to 1.4%. The latter part of the year was epitomized by the political cycle with elections for Presidential, Parliamentary and District leaders across the country, which also affected business activity and the speed of economic recovery overall.
This challenging environment resulted in the company reporting a 69% reduction in profitability. But saw strong growth in the underlying business with the total asset base growing by 18%; strength to the financial position and resilience to our fundamental business drivers in terms of capital adequacy and liquidity holdings. To that end, we are delighted to propose a dividend payment to our shareholders.
Regulatory environment
The regulatory framework governing Banks and other financial institutions both globally and locally continued to focus on enterprise-wide risk management. Locally, following the COVID-19 lockdown, we saw heightened level of supervision with greater emphasis on Liquidity, and Credit risk. dfcu has now been officially designated as a Domestic Systemically Important Bank (DSIB) so the Bank will be subject to increased scrutiny from the regulator.
The Central Bank is also rolling out the implementation of Basel III in Uganda whose goal is to ensure banks act more prudently by improving their ability to absorb shocks arising from financial and economic stress. This it does by requiring them to maintain a much larger capital base,
‘dfcu represents a group that has over the past 56 years supported industrialization and economic growth of Ugandan companies through provision of much needed but often scarce and expensive long-term finance. While COVID-19 presented immense challenges, it also brought out the best in us, revealing the strength and resilience of our business.”
Elly KaruhangaChairman, Board of Directorsdfcu Limited

dfcu ANNUAL REPORT AND FINANCIAL STATEMENTS 2020 dfcu ANNUAL REPORT AND FINANCIAL STATEMENTS 2020 2524
increasing transparency and improving liquidity. We are compliant with our regulatory requirements and remain committed to working closely with regulators and stakeholders as these new regulations are rolled out.
Equity market and dividend payment
The performance of the equity market saw investors pull back from stocks leading to a 73.6% decline in the turnover on the Uganda Securities Exchange. Whereas there was a 95.1% reduction in turnover on the dfcu counter, this was due to the large transaction done in the year 2019 when we welcomed a new investor IFU as CDC exited from its pioneering journey that started with the inception of the company in 1964.
The equity markets have showed signs of a rebound this year and have picked up with a positive 2.3% price movement of the all share index (ALSI) in the first quarter of 2021 compared to a 27.9% decline in 2020. In 2019, the Central Bank instructed all supervised financial institutions to defer all discretionary contributions including dividends unless it explicitly authorised issuance of the same and the instruction remains in force. This instruction applies to dfcu Bank which is a subsidiary of dfcu Limited. Owing to the severity of the impact of the COVID-19 pandemic and taking into consideration the need to preserve the strength of the Company, the directors recommend that the dividend of UGX 17.38 per share (less withholding tax) be paid out for the year ended 31st December 2020
Delivering on our business objectives
The company remained focused on sustaining the business while supporting customers to recover during this challenging socio-economic environment. The pandemic reinforced the company’s prudence in the allocation and utilization of resources and cost control. We had to continually review our strategy, operating model, priorities, risk and compliance to ensure that the business survived during the most difficult of times.
We enhanced our digital capabilities, increased support to businesses and individuals with safe banking, funding and credit relief and deployed new ways of working in line with mandated standard operating procedures, while delivering greater convenience and flexibility for our customers. We remained alert to the increase in strategic, operational, enterprise and cyber risks and also enhanced our risk management policies and practices to provide adequate control and protection in our business and digital operations across the group.
Corporate governance
During the year, one of the longest serving members of the board Mr. Micheal Turner resigned from the Board of dfcu Limited on 1st July 2020 having been on the board from March 2010. The shareholders, directors, management and staff of dfcu Limited thank Mr. Turner for the contribution he made towards steering and providing oversight for the Company over the years in various capacities and on various committees as he served on the Boards of both dfcu Limited and dfcu Bank.
On 25th August 2020, the Shareholders of dfcu Limited appointed Dr. Aminah Zawedde as a Non-Executive Director of the Company. We welcome Dr. Zawedde who brings a wealth of experience to the Board in the area of Information Technology and Strategic leadership from the public and private sector as a Senior Researcher and Lecturer at the School of Computing and Informatics Technology of Makerere University, and a member of the National Information Technology Authority Uganda (NITA-U) Board of Directors.
69%
18%
17.38
reduction in profitability.
the total asset base growing by
Proposed dividendper share

dfcu ANNUAL REPORT AND FINANCIAL STATEMENTS 2020 dfcu ANNUAL REPORT AND FINANCIAL STATEMENTS 2020 2524
In the subsidiary, the shareholders appointed Ms. Jackie Aneno Obol-Ochola as a Non-Executive Director of the Bank on the 28th of October 2020. We welcome Jackie an Engineer who brings over 20 years of senior leadership experience in the digital space having served in various capacities in the telecommunications sector with Uganda Telecom, Nokia Telecom, Andela and currently is the Country Manager C-Squared Telecom and a member of the Uganda National Task Force on Emerging (4IR) Technologies.
Focusing on opportunities in the new business environment
dfcu represents a group that has over the past 56 years supported industrialization and economic growth of Ugandan companies through provision of much needed but often scarce and expensive long-term finance. While COVID-19 presented immense challenges it also brought out the best in us, revealing the strength and resilience of our busines.
The pandemic has irrevocably changed the traditional banking models, and we embrace this opportunity to improve on our processes, create efficiencies and reevaluate risks while enhancing customer relations and creating sustainable partnerships. The company will continue to play a transformative role in key sectors of the economy in addition to the emerging oil and gas sector and its associated value chain opportunities for agriculture, transport, construction, hospitality, medical and others.
Conclusion
I take this opportunity to thank the dfcu directors for guiding the company, ensuring that the business remained firmly rooted. I also thank our shareholders, regulators, customers, partners, and other stakeholders for your continued support and confidence which inspired the team to remain resilient and sail through an unprecedented year by all accounts. Additionally, none of the above could have been achieved without the dedicated efforts of our people and to them I say thank you. May you continue growing the company as we continue on our mission, “To grow shareholder value, while playing a key role in transforming the economy, and enhancing the well-being of people.”
I thank You
Hon. Elly KaruhangaChairman, Board of Directorsdfcu Limited

dfcu ANNUAL REPORT AND FINANCIAL STATEMENTS 2020 dfcu ANNUAL REPORT AND FINANCIAL STATEMENTS 2020 2726
Message from the Chairman, dfcu Bank Board of Directors
Navigating our way through an unprecedented year
It’s been a year like no other for dfcu Bank, just as it has been for the wider business community in Uganda and the world at large. The COVID-19 pandemic has posed significant unforeseen challenges for all businesses, including dfcu; but, the transformative organisational changes that we put into action more than 12 months ago and the resilience that we built into the business have enabled us to navigate the uncertainty with confidence and rigour.
Our strengthened Board and Executive team have demonstrated expert leadership, and for this, I wish to extend my gratitude. Thanks to their commitment and the effort of the entire dfcu team to deliver the objectives we set out last year, we are ready to emerge from the current situation as a nimble, growing business, with a more robust balance sheet, and with the tools and capabilities we need to achieve our strategic ambitions.
I want to take this opportunity to thank you all for your unwavering resolve during the most turbulent of times. The superb response from everyone at dfcu, at every level, as well as all of our business partners, has ensured that we have come through this stronger together. The resilience built in times of crisis and our strategic partnerships make us stronger together and better positioned to rebuild for the future.
Jimmy D. MugerwaChairman, dfcu Bank
dfcu ANNUAL REPORT AND FINANCIAL STATEMENTS 2020 dfcu ANNUAL REPORT AND FINANCIAL STATEMENTS 2020 2726
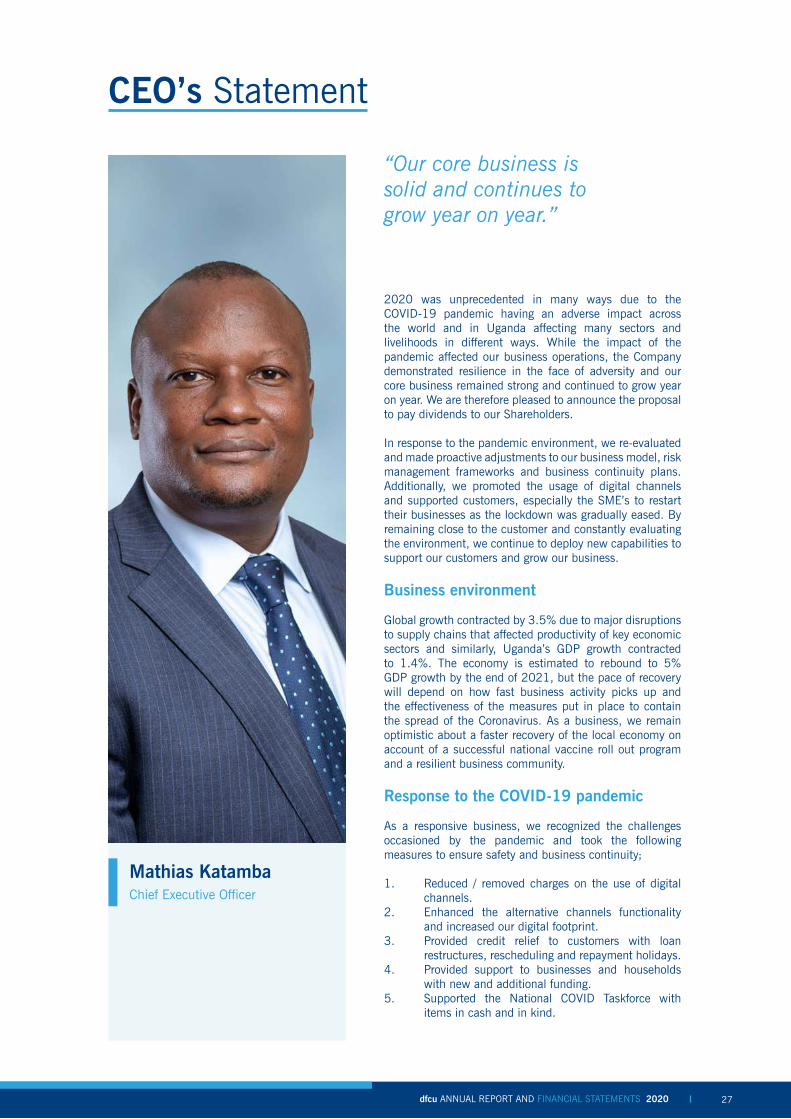
CEO’s Statement
2020 was unprecedented in many ways due to the COVID-19 pandemic having an adverse impact across the world and in Uganda affecting many sectors and livelihoods in different ways. While the impact of the pandemic affected our business operations, the Company demonstrated resilience in the face of adversity and our core business remained strong and continued to grow year on year. We are therefore pleased to announce the proposal to pay dividends to our Shareholders.
In response to the pandemic environment, we re-evaluated and made proactive adjustments to our business model, risk management frameworks and business continuity plans. Additionally, we promoted the usage of digital channels and supported customers, especially the SME’s to restart their businesses as the lockdown was gradually eased. By remaining close to the customer and constantly evaluating the environment, we continue to deploy new capabilities to support our customers and grow our business.
Business environment
Global growth contracted by 3.5% due to major disruptions to supply chains that affected productivity of key economic sectors and similarly, Uganda’s GDP growth contracted to 1.4%. The economy is estimated to rebound to 5% GDP growth by the end of 2021, but the pace of recovery will depend on how fast business activity picks up and the effectiveness of the measures put in place to contain the spread of the Coronavirus. As a business, we remain optimistic about a faster recovery of the local economy on account of a successful national vaccine roll out program and a resilient business community.
Response to the COVID-19 pandemic
As a responsive business, we recognized the challenges occasioned by the pandemic and took the following measures to ensure safety and business continuity;
1. Reduced / removed charges on the use of digital channels.
2. Enhanced the alternative channels functionality and increased our digital footprint.
3. Provided credit relief to customers with loan restructures, rescheduling and repayment holidays.
4. Provided support to businesses and households with new and additional funding.
5. Supported the National COVID Taskforce with items in cash and in kind.
“Our core business is solid and continues to grow year on year.”
Mathias KatambaChief Executive Officer

dfcu ANNUAL REPORT AND FINANCIAL STATEMENTS 2020 dfcu ANNUAL REPORT AND FINANCIAL STATEMENTS 2020 2928
In respect to the well-being of our employees, we provided personal protective equipment, regular mass testing, safe transport services to and from work and enabling tools for remote working.
Performance highlights
While the impact of the pandemic affected customers leading to higher provisions for loans and impairment of the financial asset, resulting in a 69% reduction in profitability, there were positive underlying trends in our core business as follows;
• Net loans and advances to customers grew by 15%.• Customer Deposits grew by 27%.• Total assets increased by 19%.• Proposed dividend to be paid to Shareholders
Earnings performance
Total revenue remained relatively stable year on year with a slight reduction of 4.6% despite the impact of the pandemic and a declining interest rate environment. The initiatives put in place to support customers during the lock down by reducing or waving fees on some categories of digital transactions, coupled with reduced transaction activity overall had an impact of a 22% reduction in our fees and commission income worth 14 Billion Shillings. On the cost side, we stepped up cost management measures with the deployment of new and agile ways of working and this enabled us to prevent an increase in operating costs year on year as we registered a 0.8% reduction in operating expenses for the year. However, the pandemic required us to place emphasis on liquidity contingency and raise our liquid assets holding which resulted in a 13% increase in interest expense worth 12 Billion Shillings.
From a customer perspective, provisions for loans and advances to customers increased by 107% or 16 Billion Shillings and impairment of the financial asset rose by 400% or 40 Billion Shillings to reach 50 Billion from 10 Billion the previous year 2019, with the Financial asset being composed of non-performing loans to customers that were taken over in the 2017 transaction. The summation of these exceptional items on our bottom line for the year ended 31st December 2020 amounted to more than 80 Billion Shillings, resulting in a net profit of 24 Billion shillings for the year.
Supporting business and individual customers
We extended support to personal, Small and Medium Enterprises across the country with credit funding and advisory services especially on business continuity, in addition to providing credit relief in terms of loan reschedules, restructures and repayment holidays. We continue to provide this relief as part of enabling customers to ‘Restart and Thrive’ post the 2020 pandemic challenges. Furthermore, customers who suffered job loss and had credit facilities were provided with insurance payments to meet their loan obligations. Our overall provision of credit to various sectors of the Economy resulted in a 15% growth in net loans and advances to customers.
15%
27%
Net loans and advances to customers grew by
Customer Deposits grew

dfcu ANNUAL REPORT AND FINANCIAL STATEMENTS 2020 dfcu ANNUAL REPORT AND FINANCIAL STATEMENTS 2020 2928
Harnessing the digital experience
In our continuous quest to enhance the customer experience, we further invested in digital capabilities that supported growth of new and existing business. We enhanced the functionality of our online and mobile banking platforms, expanded the agent banking network both in footprint and functionality and rolled out a new fleet of Intelligent ATMs with real time deposit acceptance. Furthermore, solutions were deployed for savings and investment groups that eased group administration and member savings via the mobile phone. Subsequently, the percentage volume of transactions done on our digital platforms as compared to the traditional over the counter points at branches increased by 8% during the year and our customer deposits grew by 27% for the year.
Financial strength
Sustaining our earning potential requires us to keep on growing our revenue generating assets which underpin the strength and viability of our underlying business. To that end, total assets grew by 19% to 3.534 Trillion Shillings and this robust growth in assets positions us uniquely to deliver improved earnings in the years ahead, as we continue mitigating the risks to our asset base with enhancements in our credit underwriting processes, operational and enterprise risk management frameworks and continued focus on our transformation from a niche play to a Universal Bank.
The future
Over the years, our company has made significant investments to shore up institutional capabilities that enabled us to navigate the pandemic and its resultant effects. Our endeavor to play an active role in transforming the economy and
enhancing the well-being of people is in line with the efforts of economic recovery in the new normal environment. Even though challenges remain for a number of sectors, we remain committed to supporting small and medium scale enterprises, advancing the cause of women in business, supporting key sectors of the economy in Agriculture, Manufacturing, Trade, Construction, Communications and Services. We have also laid the foundation to play an active role in the emerging Oil and Gas Sector particularly supporting players in the local content space.
We shall also continue to invest in capabilities that increase convenience for customers in the digital and alternative channels space and innovate products and services that improve the efficiency of our services and provide an all-round excellent customer experience.
Appreciation
We thank all our customers and stakeholders for choosing us as their preferred financial partner and we reiterate our commitment to “Making More Possible.”
Mathias KatambaChief Executive Officerdfcu Bank Limited
dfcu ANNUAL REPORT AND FINANCIAL STATEMENTS 2020 dfcu ANNUAL REPORT AND FINANCIAL STATEMENTS 2020 3130
Financial Review

dfcu ANNUAL REPORT AND FINANCIAL STATEMENTS 2020 dfcu ANNUAL REPORT AND FINANCIAL STATEMENTS 2020 3130
Financial Definitions
Profit for the year Annual statement of comprehensive income profit attributable to ordinary shareholders stated in Uganda Shillings.
Earnings per share Earnings attributable to ordinary shareholders divided by the weighted average number of ordinary shares in issue stated in Uganda Shillings.
Return on Equity (ROE) Earnings as a percentage of ordinary shareholders’ funds.
Return on Assets (ROA) Earnings as a percentage of total assets.
Net Interest Margin (NIM) Net interest income as a percentage of average total assets.
Cost to Income Ratio Operating expenses as a percentage of income before tax excluding income from subsidiaries.
Credit Loss Ratio Provision for credit losses per the Statement of Comprehensive Income as a percentage of gross loans and advances.
Effective Tax Rate The income tax charge as a percentage of income before tax.
Dividend per share Total ordinary dividends declared per share in respect of the year.
Core capital Permanent shareholder equity in the form of issued and fully paid up shares plus all disclosed reserves, less goodwill or any other intangible assets.
Supplementary capital General provisions which are held against future and current unidentified losses that are freely available to meet losses which subsequently materialize, and any other form of capital as may be determined from time to time by Bank of Uganda .
Total capital The sum of core capital and supplementary capital .
Core capital ratio Core capital divided by the total risk weighted assets.
Total capital ratio Total capital divided by the total risk weighted assets.
Credit Impairment Charge The amount by which the period profits are reduced to cater for the effect of credit impairment expressed in Uganda Shillings.
Lending Ratio Net loans and advances divided by total deposits expressed as a percentage.
dfcu ANNUAL REPORT AND FINANCIAL STATEMENTS 2020 dfcu ANNUAL REPORT AND FINANCIAL STATEMENTS 2020 3332
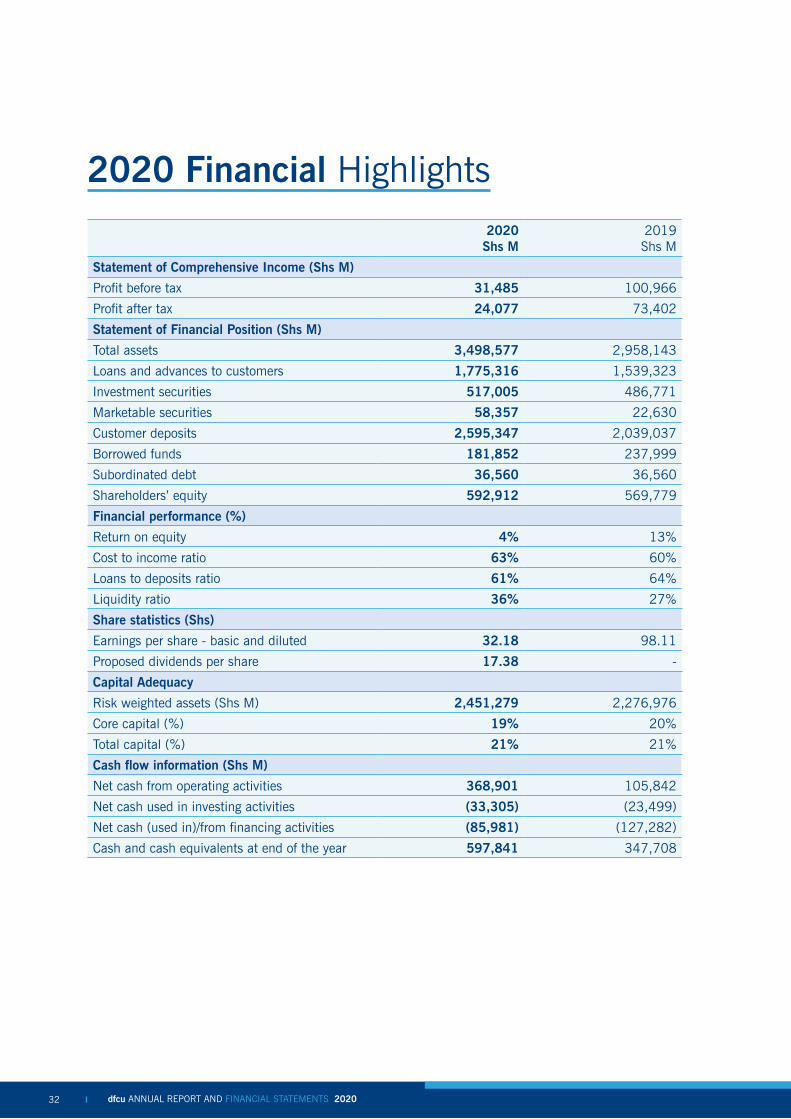
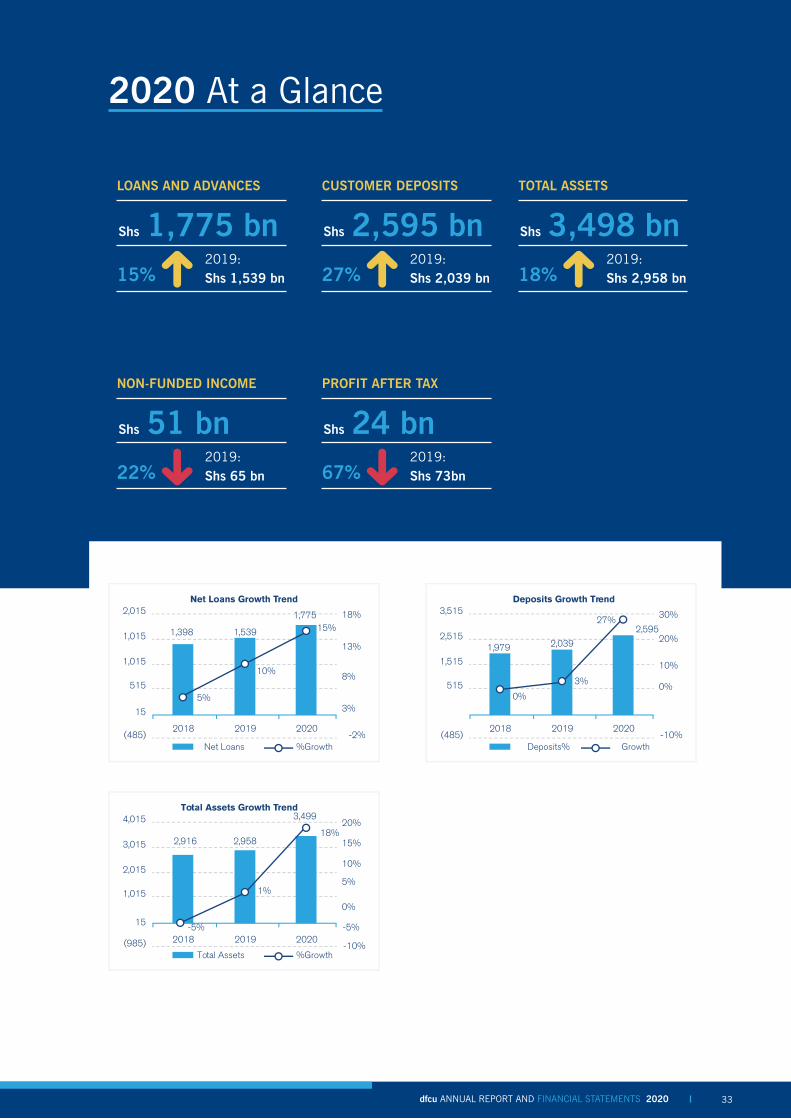
2020 Financial Highlights
2020Shs M
2019Shs M
Statement of Comprehensive Income (Shs M)
Profit before tax 31,485 100,966
Profit after tax 24,077 73,402
Statement of Financial Position (Shs M)
Total assets 3,498,577 2,958,143
Loans and advances to customers 1,775,316 1,539,323
Investment securities 517,005 486,771
Marketable securities 58,357 22,630
Customer deposits 2,595,347 2,039,037
Borrowed funds 181,852 237,999
Subordinated debt 36,560 36,560
Shareholders’ equity 592,912 569,779
Financial performance (%)
Return on equity 4% 13%
Cost to income ratio 63% 60%
Loans to deposits ratio 61% 64%
Liquidity ratio 36% 27%
Share statistics (Shs)
Earnings per share - basic and diluted 32.18 98.11
Proposed dividends per share 17.38 -
Capital Adequacy
Risk weighted assets (Shs M) 2,451,279 2,276,976
Core capital (%) 19% 20%
Total capital (%) 21% 21%
Cash flow information (Shs M)
Net cash from operating activities 368,901 105,842
Net cash used in investing activities (33,305) (23,499)
Net cash (used in)/from financing activities (85,981) (127,282)
Cash and cash equivalents at end of the year 597,841 347,708
dfcu ANNUAL REPORT AND FINANCIAL STATEMENTS 2020 dfcu ANNUAL REPORT AND FINANCIAL STATEMENTS 2020 3332
Shs 1,775 bn2019:Shs 1,539 bn15%
LOANS AND ADVANCES
Shs 51 bn2019:Shs 65 bn22%
NON-FUNDED INCOME
Shs 2,595 bn2019:Shs 2,039 bn27%
CUSTOMER DEPOSITS
Shs 24 bn2019:Shs 73bn67%
PROFIT AFTER TAX
Shs 3,498 bn2019:Shs 2,958 bn18%
TOTAL ASSETS
2018 2019 2020
8%
13%
18%
3%15
(485) -2%
515
1,015
1,015 1,398 1,539
5%
10%
15%1,7752,015
Net Loans Growth Trend
Net Loans %Growth
2018 2019 2020
20%
10%
0%
30%
(485) -10%
515
1,515
2,5151,979 2,039
0%
3%
27%2,595
3,515Deposits Growth Trend
Deposits% Growth
2018 2019 2020
15%
5%
10%
0%
20%
(985) -10%
-5%
1,015
15
2,015
3,015 2,9582,916
-5%
1%
18%
3,4994,015Total Assets Growth Trend
Total Assets %Growth
2020 At a Glance

dfcu ANNUAL REPORT AND FINANCIAL STATEMENTS 2020 dfcu ANNUAL REPORT AND FINANCIAL STATEMENTS 2020 3534
Kate K. KiizaChief Financial Officer
Chief Financial Officer’s Report
Business environment
In October 2020, the Bank of Uganda (BoU) maintained the eased monetary policy stance holding the Central Bank Rate (CBR) at 7% and continuing to offer liquidity support to supervised financial institutions (SFIs). The band on the CBR remained at +/-2 percentage points, while the margin on the rediscount rate and bank rate were also unchanged at 3 and 4 percentage points on the CBR respectively. Consequently, the rediscount rate and the bank rate stood at 10 percent and 11 percent, respectively.
GDP growth momentum in 12 to 24 months ahead was expected to be modest against sluggish external demand, subdued consumer expenditure, the weak performance of the service sector, commercial banks’ cautious lending, and uncertain economic outlook. Moreover, downside risks to the economic growth projection included the possibility of an increase in new infections and a longer period to get the virus under control, periodic spouts of global financial volatility that could lead to capital outflows from Uganda, as well as increasing protectionism. Further, Private Sector Credit (PSC) was likely to remain subdued due to commercial banks facing increasing non-performing Loans (NPLs), high lending interest rates, and an increase in domestic financing of the fiscal deficit. Economic growth would, however, recover more swiftly than projected if the threat from COVID-19 faded more quickly than envisaged and global economic growth strengthened.
Core inflation remained higher than target since June 2020 although the MPC noted that the gradual recovery in economy would bring inflation back to around target in the medium term. Cost-push pressures emanating from higher taxes on imported consumer and intermediate products and social distancing measures were expected to cause inflation to edge up further. In addition, price pressures were likely to increase, due to the further easing of lockdown measures as households increased spending on items that they had been forced to defer, for example expenditure on school fees. Price pressures were also expected to increase due to higher production costs from persistent supply disruptions. Overall, inflation was expected to be well contained over the medium-term, on the premise that both global and domestic risks did not materialize.
Generally, while yields on Government securities declined at the short end, increases were noted at the longer end of the spectrum to November 2020.
The decline in yields at the shorter end was partly due to increased liquidity, subdued loan demand by the private sector, and increased appetite for safe and liquid assets linked to the negative sentiments caused by the pandemic. The 91-day, 182-day and 364-day Treasury bill rates declined to 7.7%, 9.6% and 12.4%.
At the longer end, yields on the 2-year, 10-year and 15-year Treasury Bonds on average recorded an increase to 14.3%, 15.7% and 15.2% to November 2020. The yields are likely to rise further following increased fiscal

dfcu ANNUAL REPORT AND FINANCIAL STATEMENTS 2020 dfcu ANNUAL REPORT AND FINANCIAL STATEMENTS 2020 3534
financing requirements for the financial year and the need to frontload issuances. Furthermore, volatility in the financial markets although moderated, could be exacerbated by lingering concerns of a second wave of the pandemic that could weigh on risk sentiments and increase the costs of borrowing going forward.
Fiscal operations have been supported by a surplus in domestic revenue albeit hindered by lower-than-target financing (domestic & external) and slow execution of infrastructural projects. Total Government revenue (including grants) in the first four months of financial year (FY) 2020/21, amounted to Shs. 5,856.3 billion which was Shs. 437.9 billion higher than the amount in the approved budget, largely due to an over performance in domestic revenue partly reflecting tax administration reforms, higher import duty, and spill overs from FY2019/20. Indeed, higher taxes were recorded in international trade taxes on account of improved collections of VAT on imports, import duty and petroleum duty as well as direct and indirect taxes.
The Uganda Shilling remained relatively stable partly reflecting subdued aggregate demand. Activity in the interbank foreign exchange market (IFEM) was subdued with demand from telecom, energy and manufacturing sectors being matched to supply from offshores, NGOs, remittances, forex bureau and coffee export receipts.
Financial Performance Review
Below is brief review of the major assets and liabilities and how they affected the consolidated results and the drivers behind the variances year on year;
Cash and Balances with Banks
These are made up mainly of the cash we hold in our network, statutory cash reserves with Bank of Uganda, balances with other commercial Banks and repos and deposit auctions held with the Bank of Uganda for short periods awaiting suitable investment opportunities. The cash and balances with Banks increased by 58% from Shs 506,008 million in 2019 to Shs 802,191 million in 2020, as part of the deliberate contingency planning.
Government securities
The stock of Government securities increased, both on financial investment and trading books, year on year by 6% and 158% respectively. The increase was part of the liquidity management strategy.Loans and advances to customers
Loans and advances to customers grew by 15% from Shs 1,539,323 million in 2019 to Shs 1,775,316 million in 2020 as the Group continued to support customers and key sectors of the economy. Below is the composition of the loans and advances to customers by sector;
Credit by Sector 2020 2019 Trend
Agriculture 16% 22%
Manufacturing 9% 7%
Trade and Commerce 12% 17%
Communications and Transport 8% 3%
Building and Construction 17% 18%
Leisure, Hotels and Accommodation 4% 3%
Home Loans 3% 4%
Private Individual 9% 9%
Real Estate 14% 9%
Education 5% 5%
Other 1% 3%
Total 100% 100%
dfcu ANNUAL REPORT AND FINANCIAL STATEMENTS 2020 dfcu ANNUAL REPORT AND FINANCIAL STATEMENTS 2020 3736
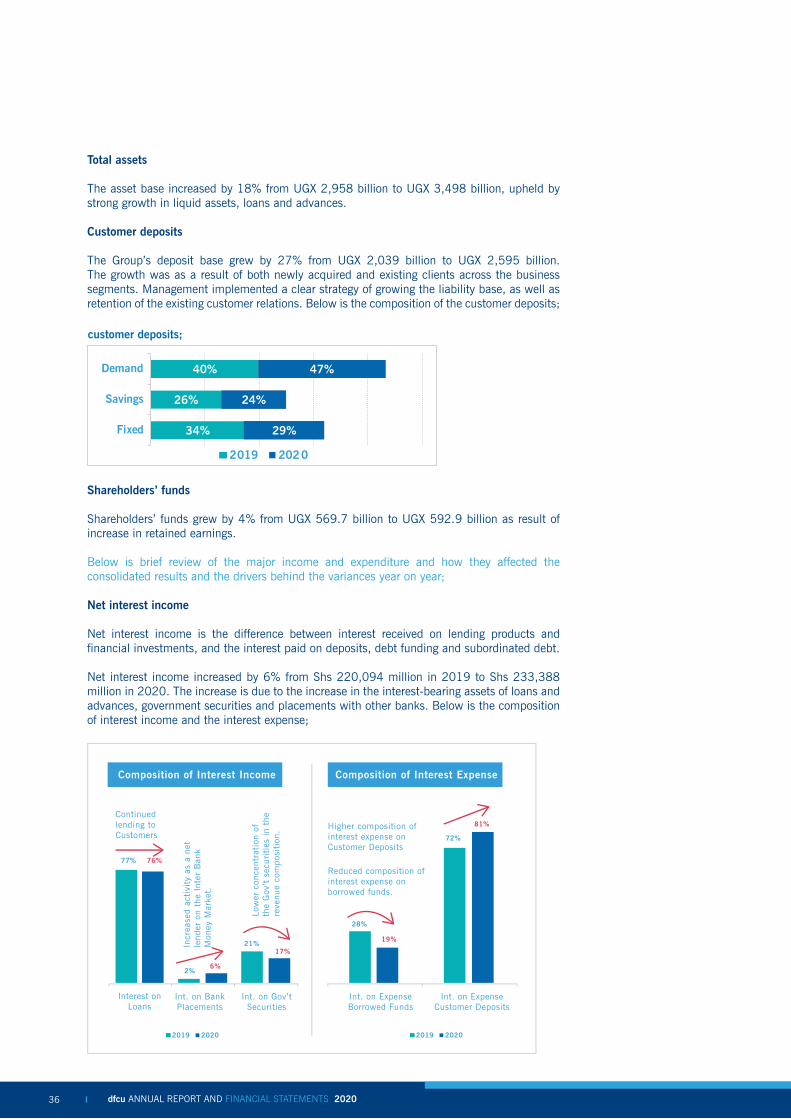
Total assets
The asset base increased by 18% from UGX 2,958 billion to UGX 3,498 billion, upheld by strong growth in liquid assets, loans and advances.
Customer deposits
The Group’s deposit base grew by 27% from UGX 2,039 billion to UGX 2,595 billion. The growth was as a result of both newly acquired and existing clients across the business segments. Management implemented a clear strategy of growing the liability base, as well as retention of the existing customer relations. Below is the composition of the customer deposits;
Shareholders’ funds
Shareholders’ funds grew by 4% from UGX 569.7 billion to UGX 592.9 billion as result of increase in retained earnings.
Below is brief review of the major income and expenditure and how they affected the consolidated results and the drivers behind the variances year on year;
Net interest income
Net interest income is the difference between interest received on lending products and financial investments, and the interest paid on deposits, debt funding and subordinated debt.
Net interest income increased by 6% from Shs 220,094 million in 2019 to Shs 233,388 million in 2020. The increase is due to the increase in the interest-bearing assets of loans and advances, government securities and placements with other banks. Below is the composition of interest income and the interest expense;
customer deposits;
34%
26%
40%
29%
24%
47%
Fixed
Savings
Demand
2019 2020

dfcu ANNUAL REPORT AND FINANCIAL STATEMENTS 2020 dfcu ANNUAL REPORT AND FINANCIAL STATEMENTS 2020 3736
Fee and commission income
Fee and commission income dropped by 22% year on year from Shs 65,449 million in 2019 to Shs 50,773 million in 2020. The drop is as a result of the impact of lowering transaction fees on digital banking during the lockdown and reduced transaction activity afterwards.
Net loan loss provisions and Financial asset impairment charge
Net loan loss provisions increased by 107% from UGX 14 billion in 2019 to UGX 30 billion in 2020. The increase in the net loan loss provisions is attributed to the negative impact of Covid-19 on our customers’ business operations. There was also a higher than anticipated impairment charge on the financial asset of UGX 50bn in 2020 compared to UGX 10bn in 2019.

dfcu ANNUAL REPORT AND FINANCIAL STATEMENTS 2020 dfcu ANNUAL REPORT AND FINANCIAL STATEMENTS 2020 3938
Operating expensesOperating expenses represent the costs that the incurred to support current and future revenues. Inflation and foreign exchange rates are key external indicators that contribute to the increase in such expenses. Many internal factors also affect the growth in operating expenses, such as our staff, investments in branches and IT infrastructure.
Operating expenses increased by 3% year on year from Shs 185,750 million in 2019 to Shs 191,639 million in 2020. Staff costs grew by 3% to Shs 60,938 million in 2020 from Shs 59,422 million in 2019. The growth was due to the annual inflation related increment and deliberate efforts to enhance the capacity and capability of the staff to enhance value created.
The other operating expenses increased by 3% to Shs 130,701 million in 2020 from Shs 126,328 million in 2019. The increase was due to increased impairment loss on the rescinded properties from the 2017 transaction and system upgrades of key banking systems.
Further detail on the cost performance on the various lines is included on Note 14 to the financial statements.

dfcu ANNUAL REPORT AND FINANCIAL STATEMENTS 2020 dfcu ANNUAL REPORT AND FINANCIAL STATEMENTS 2020 3938
5-year Financial Performance Overview
2020 2019 2018 2017 2016
Statement of comprehensive income (Shs’ m)
Net interest income 233,388 220,094 221,172 215,451 133,241
Non-interest income 50,773 65,449 51,285 39,655 29,305
Credit impairment charge and fair value losses on other financial assets
81,120 24,879 18,836 48,652 17,830
Operating expenses 191,639 185,750 202,213 189,520 96,900
Profit before tax 31,485 100,966 84,469 147,816 58,363
Profit after tax 24,077 73,402 60,908 106,892 45,325
Statement of financial position (Shs’ m)
Loans and advances 1,775,316 1,539,323 1,398,162 1,334,611 842,360
Total assets 3,498,577 2,958,143 2,915,582 3,057,476 1,757,725
Customer deposits 2,595,347 2,039,037 1,979,093 1,987,118 1,134,731
Borrowings 229,380 284,561 371,006 483,446 333,079
Shareholders’ equity 592,912 569,779 521,536 532,338 249,652
Financial performance (%)
Return on equity 4% 13% 12% 20% 18%
Return on assets 1% 2% 2% 3% 3%
Cost to income ratio 63% 60% 66% 49% 56%
Loans to deposits ratio 61% 64% 52% 43% 45%
Liquidity ratio 36% 27% 22% 24% 23%
Capital adequacy
Core capital ratio 19% 20% 19% 19% 20%
Total capital ratio 21% 21% 22% 23% 27%
Risk weighed assets (Shs’ m) 2,451,279 2,276,976 2,167,607 1,975,505 1,059,182
Share statistics
Number of shares in issue (in millions) 748 748 748 748 497
Earnings per share 32.18 98.11 81.41 189.33 91.16
Dividends per share 17.38 - 33.01 68.24 25.19
Other information:
Number of staff 1,034 1,078 1,200 1,158 756

dfcu ANNUAL REPORT AND FINANCIAL STATEMENTS 2020 dfcu ANNUAL REPORT AND FINANCIAL STATEMENTS 2020 4140
Key Performance Indicators
Strategic imperative
Key performance indicators
Target Results Trends performance
Financial Return on assets (RoA)
Minimum of 3%
The RoA was 1% in 2020 compared to 2% in 2019. The underperformance was due to the decline in the current year profits as a result of higher impairment losses on loans and advances and the fair value loss on the financial asset arising from the 2017 transaction.
Return on equity (RoE)
Minimum of 16%
The RoE was 4% in 2020 compared to 12% in 2019. The underperformance was due to the decline in the current year profits as a result of higher impairment losses on loans and advances and the fair value loss on the financial asset arising from the 2017 transaction.
Efficiency Cost to income ratio (C/I)
Maximum of 70%
The C/I ratio was 63% in 2020, registering an increase from 60% in 2019. The increase was due to a 3% increase in operating expenses due to increased impairment loss on the rescinded properties from the 2017 transaction and system upgrades of key banking systems.
Liquidity ratio
Minimum of 20%
The group maintained a healthy liquidity ratio of 36% in 2020 compared to 27% in 2019. The increase was due to increased liquidity assets as a deliberate contingency plan in 2020.
Capital adequacy
Core capital ratio (Tier 1 Capital)
Minimum of 8%
The core capital ratio remained above the statutory minimum of 8% at 19%. The position remains adequate to cover the asset growth registered during the year.
Total capital ratio (Tier 2 capital)
Minimum of 12%
The total capital ratio remained above the statutory minimum of 12% at 21%. The position remains strong and sufficient to cover the growth of the group.
dfcu ANNUAL REPORT AND FINANCIAL STATEMENTS 2020 dfcu ANNUAL REPORT AND FINANCIAL STATEMENTS 2020 4140
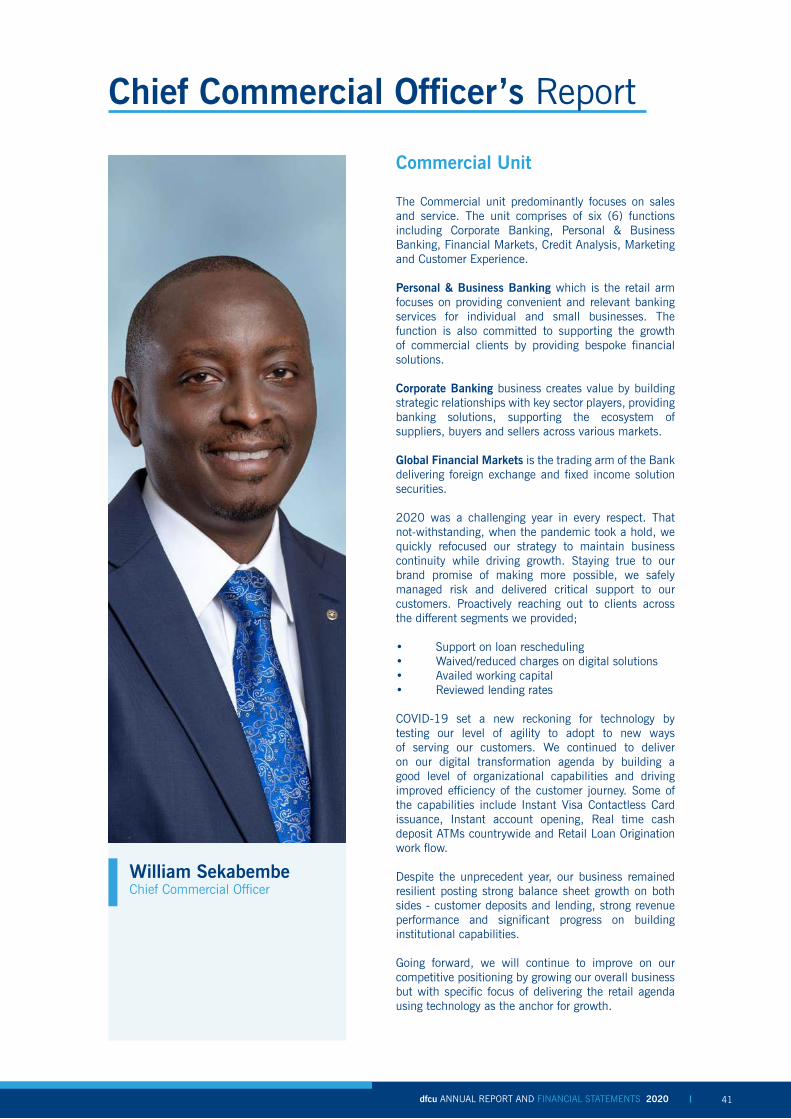
Chief Commercial Officer’s Report
Commercial Unit The Commercial unit predominantly focuses on sales and service. The unit comprises of six (6) functions including Corporate Banking, Personal & Business Banking, Financial Markets, Credit Analysis, Marketing and Customer Experience.
Personal & Business Banking which is the retail arm focuses on providing convenient and relevant banking services for individual and small businesses. The function is also committed to supporting the growth of commercial clients by providing bespoke financial solutions.
Corporate Banking business creates value by building strategic relationships with key sector players, providing banking solutions, supporting the ecosystem of suppliers, buyers and sellers across various markets.
Global Financial Markets is the trading arm of the Bank delivering foreign exchange and fixed income solution securities.
2020 was a challenging year in every respect. That not-withstanding, when the pandemic took a hold, we quickly refocused our strategy to maintain business continuity while driving growth. Staying true to our brand promise of making more possible, we safely managed risk and delivered critical support to our customers. Proactively reaching out to clients across the different segments we provided;
• Support on loan rescheduling• Waived/reduced charges on digital solutions• Availed working capital• Reviewed lending rates
COVID-19 set a new reckoning for technology by testing our level of agility to adopt to new ways of serving our customers. We continued to deliver on our digital transformation agenda by building a good level of organizational capabilities and driving improved efficiency of the customer journey. Some of the capabilities include Instant Visa Contactless Card issuance, Instant account opening, Real time cash deposit ATMs countrywide and Retail Loan Origination work flow.
Despite the unprecedent year, our business remained resilient posting strong balance sheet growth on both sides - customer deposits and lending, strong revenue performance and significant progress on building institutional capabilities.
Going forward, we will continue to improve on our competitive positioning by growing our overall business but with specific focus of delivering the retail agenda using technology as the anchor for growth.
William SekabembeChief Commercial Officer

dfcu ANNUAL REPORT AND FINANCIAL STATEMENTS 2020 dfcu ANNUAL REPORT AND FINANCIAL STATEMENTS 2020 4342
Supporting Lasting Interventions
In line with our purpose of ‘making more possible’, we are committed to partnerships that promote the financial transformation and wellbeing of communities where we operate. We continued to support the entrepreneurial spirit of Ugandans, enhanced the stability of families and provided a sustainable approach to promoting the savings.
Empowering women entrepreneurs through the Women in Business Program The dfcu Women in Business (WiB)program is about creating an enabling environment for women entrepreneurs to thrive in a highly competitive space where they ordinary may be faced with numerous challenges. The contribution of women to the economy has been steadily growing over the years. Today, women own approximately 40% of SMEs in Uganda and employ nearly two million people. This translates into considerable direct and indirect contribution to the Gross Domestic Product.Initiated in 2007, the WiB programme provides financial management training, networking opportunities, business coaching, mentoring and access to business finance on preferential terms.One of the flagship activities under the WiB program is the ‘Rising Women’ initiative. Now in its third year, the ‘Rising Woman’ initiative recognizes, celebrates and promotes a culture of mentorship among women in business in Uganda.
2020 activities
Given the face to face nature of WiB activities, the 2020 initiatives were impacted by the pandemic. The following activities were achieved:
• Carried out five regional trainings for influential women groups • Conducted six customer engagements on electronic (TV and Radio) and on-line media under the themes
below:
TOPICS THEMES
Leadership Skills Innovative leadership amidst business uncertainty – growing your business during turbulent times
Business IT Skills Digital skills as a major of business success – Leveraging Technology to grow your business
Proposal Writing Presenting unique solutions in a highly competitive environment
Communication and Negotiation Skills
Building the right customer engagement channels and modalities in a digital era.
Marketing, sales and Customer service
Creating a dynamic sales and marketing model that meets customer expectations
Strategic thinking and planning
Making the right and winning business choices – Re-imagine, Refocus & Reboot your business
• Profiled twenty (20) success stories from the Rising woman initiative both in the Daily Monitor (print and online) and Television (NTV).

dfcu ANNUAL REPORT AND FINANCIAL STATEMENTS 2020 dfcu ANNUAL REPORT AND FINANCIAL STATEMENTS 2020 4342
Impact of 2020 activities
Media Estimated audience reach
Daily Monitor Newspaper WiB success stories 3,033,750
NTV Television talk shows 19,235,000
Spark TV Television talk shows 15,085,000
KFM Radio Interviews 4,409,600
Dembe FM Radio Interviews 1,319,500
Strong partnerships to support agricultural transformation The Agribusiness Development Centre(ADC)
With the readjustment in the agricultural sector due to COVID 19 pandemic, access to educative agriculture information and training which is a key element for agricultural development became a challenge since we could not conduct the monthly trainings.
The Agribusiness Development Centre (ADC) believed farmers needed an opportunity for education at their own convenience with no restriction on time and location. The need to adopt a cost-effective means to facilitate trainings without necessarily endangering the lives of both our trainers and farmers was what inspired the ADC Innovations Department to develop SOMA, an E-learning platform which caters for learner preferences with inclusion of features like audio, video or text and allows learners choose their learning path and navigate at their own pace.
SOMA is a self-paced online portal tailored to the needs of individual farmers, Farmer Based Organizations (FBOs) and Co-operatives. SOMA is designed on a selfbased learning methodology where members can access the platform, register for accounts and choose any courses they may wish to learn. The platform currently has 1163 active users.www.soma.adc.ug
7,500+
1,163+
3,700
2,000
farmers trained
SOMAactive users
are women
on SIMU+ USSDtraining platform
Highlights in Numbers
Agriculture is the cornerstone of Uganda’s economy, yet it fails to live up to its potential due to challenges accessing finance. ADC in partnership with Laboremus, is leveraging technology for extension of financial products to farmers. eMATA App is the future of farmer financing. We have started by building a credit history through digitizing milk delivery systems in Uganda. Based on this credit history, eMATA can provide credit to farmers at interest rates that are low enough to finally allow farmers to use the power of loans to invest in the productivity of their farms. This made possible by utilizing end-to-end digital processes, data-backed risk analytics, and a mobile-based distribution model.
dfcu in partnership with Rabobank Foundation set up the Agribusiness Development Centre (ADC). The ADC complements the efforts towards improving the skills set within the sector, by providing technical support to Farmer Based Organization’s (FBOs) that have potential to contribute to the agricultural value chain. The training is intended to transform Farmer Based Organisations and Cooperatives and make them bankable to work as vehicles for delivery of financing to smallholder farmers in an economically viable model.

dfcu ANNUAL REPORT AND FINANCIAL STATEMENTS 2020 dfcu ANNUAL REPORT AND FINANCIAL STATEMENTS 2020 4544

dfcu ANNUAL REPORT AND FINANCIAL STATEMENTS 2020 dfcu ANNUAL REPORT AND FINANCIAL STATEMENTS 2020 4544
ADC – Some of the success stories
“I got to know SOMA from my mother who sent me a link via Facebook. All the processes of registering and learning were seamless, and I think it will change the lives of my village farmers.”
MARION MUSINGUZI – APPLE FARMER, KANUNGU
“The SIMU+ platform has not only helped me as a person but also my business. I’m right now encouraging other people to finish the training so that they know how to do book keeping and avoid misusing money.”
CISSY NALUGOTTI - FARMER
“Now we know our stand in the coffee market and the training helps us small producers to compete with the other big players since these people are conversant with market trends and dynamics, yet for us we are not. So, the ADC training is empowering us.”
MARY NALUKWATA – KIBINGE COFFEE FARMERS COOPERATIVE SOCIETY
“I first got Ushs 10 million then Ushs 25 million. I keep my records and keenly follow my loan repayment and I also know how much I have put in my farm just like I was taught by ADC. So, it is easier for me to repay the loan.”
ROBERT MUGABE – KIGARAMA PEOPLE’S COOPERATIVE & CREDIT SOCIETY
The Best Farmer Competition
For the last seven years, dfcu has partnered with other stakeholders on the Annual Best Farmers competition which is an opportunity to provide a platform where outstanding farmers are identified and supported with exposure from the Netherlands. The farmers in turn train other farmers on their farms which has proven to be a very effective and practical knowledge dissemination method as a supplement to the conventional extension. The event has not only identified and elevated such leaders for others to learn from but also generally improved public perception towards agriculture as a profitable and rewarding venture.
dfcu ANNUAL REPORT AND FINANCIAL STATEMENTS 2020 dfcu ANNUAL REPORT AND FINANCIAL STATEMENTS 2020 4746
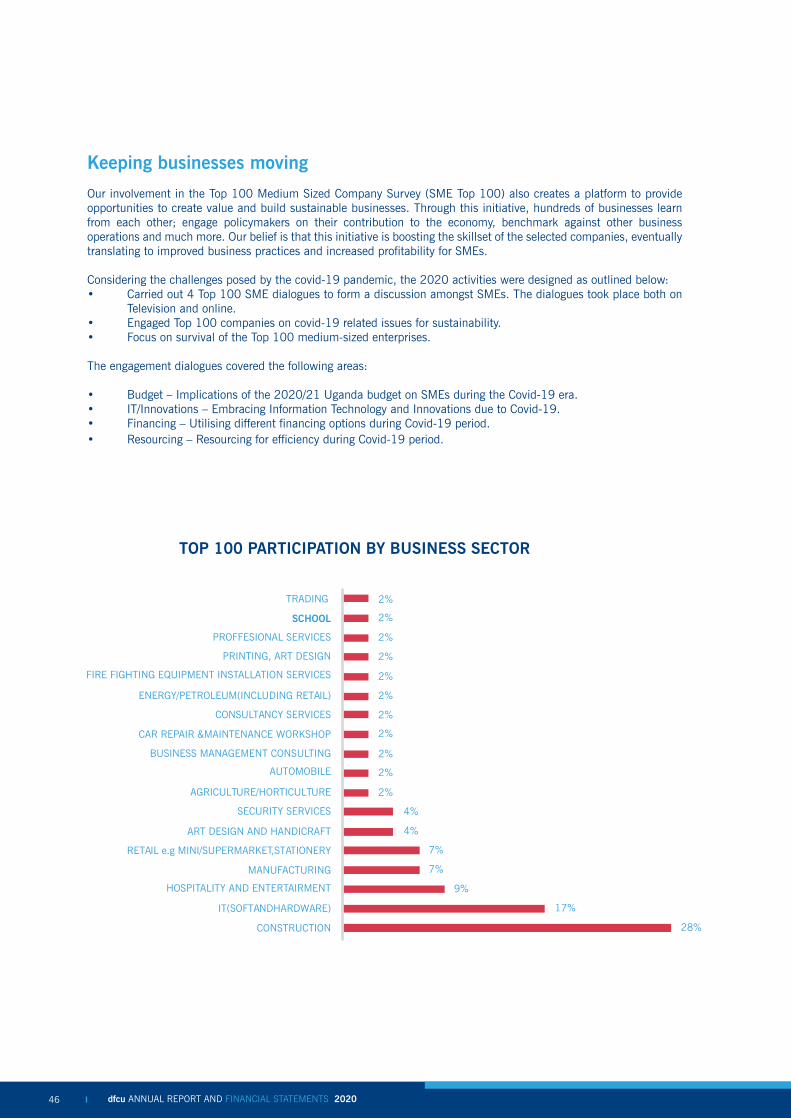
Keeping businesses moving Our involvement in the Top 100 Medium Sized Company Survey (SME Top 100) also creates a platform to provide opportunities to create value and build sustainable businesses. Through this initiative, hundreds of businesses learn from each other; engage policymakers on their contribution to the economy, benchmark against other business operations and much more. Our belief is that this initiative is boosting the skillset of the selected companies, eventually translating to improved business practices and increased profitability for SMEs.
Considering the challenges posed by the covid-19 pandemic, the 2020 activities were designed as outlined below: • Carried out 4 Top 100 SME dialogues to form a discussion amongst SMEs. The dialogues took place both on
Television and online.• Engaged Top 100 companies on covid-19 related issues for sustainability. • Focus on survival of the Top 100 medium-sized enterprises.
The engagement dialogues covered the following areas:
• Budget – Implications of the 2020/21 Uganda budget on SMEs during the Covid-19 era.• IT/Innovations – Embracing Information Technology and Innovations due to Covid-19.• Financing – Utilising different financing options during Covid-19 period.• Resourcing – Resourcing for efficiency during Covid-19 period.
2%
2%
2%
2%
2%
2%
2%
2%
2%
2%
2%
4%
4%
7%
7%
9%
17%
28%
TRADING
SCHOOL
PROFFESIONAL SERVICES
PRINTING, ART DESIGN
FIRE FIGHTING EQUIPMENT INSTALLATION SERVICES
ENERGY/PETROLEUM(INCLUDING RETAIL)
CONSULTANCY SERVICES
CAR REPAIR &MAINTENANCE WORKSHOP
BUSINESS MANAGEMENT CONSULTING
AUTOMOBILE
AGRICULTURE/HORTICULTURE
SECURITY SERVICES
ART DESIGN AND HANDICRAFT
RETAIL e.g MINI/SUPERMARKET,STATIONERY
MANUFACTURING
HOSPITALITY AND ENTERTAIRMENT
IT(SOFTANDHARDWARE)
CONSTRUCTION
TOP 100 PARTICIPATION BY BUSINESS SECTOR

dfcu ANNUAL REPORT AND FINANCIAL STATEMENTS 2020 dfcu ANNUAL REPORT AND FINANCIAL STATEMENTS 2020 4746
Contributing to financial inclusion and access Financial inclusion is a key driver of sustainable economic transformation. dfcu supports individuals to access finance; set up and grow their businesses; acquire skills to manage financesthrough financial education.
Our financial inclusion strategy focuses on three areas;
Deepening access to financial services
We want to give everyone access to financial services, regardless of factors such as income level, gender, educational attainment or geographic location. To achieve its goal of deepening financial access, dfcu deploys a mix of traditional and digital banking channels respectively.
Help the unbanked and financially underserved groups access and use basic financial services.
Offer tailored products and services to the underserved customer groups.
Programs and initiatives to improve financial knowledge and better financial decisions.
Branch network
We know that our customers value being able to walk into a local branch for face-to-face service, especially when making large deposits and when making major financial decisions. That’s why we are committed to keeping a well-balanced branch network spread across the country.
Agent Banking
Through Agent Banking, we are extending financial services to the unbanked and under banked in easy to access locations across the country. Services include making cash deposits and withdrawals; balance enquiries; generating mini-statements; paying utility bills; school fees payments and carrying out transfers. In line with the digitization agenda, the agent banking services are complemented with an instant account opening platform that enable customers to acquire dfcu Bank accounts in less than five minutes.
We also rolled out liquidation/cash out capability for MTN agents enabling the mobile money agents to purchase float or withdraw physical cash.
We partnered with NSSF and added social security transactions to the list of financial services. Members can submit their NSSF contributions at dfcu agent locations.
ACCESS
FINANCE
RESILIENCE

dfcu ANNUAL REPORT AND FINANCIAL STATEMENTS 2020 dfcu ANNUAL REPORT AND FINANCIAL STATEMENTS 2020 4948
24/7 ATM cash deposits
A new ATM fleet was deployed, and customers can now deposit cash into their accounts at any of the 66 dfcu ATM points across the network. The deposit taking functionality has provided added convenience for customers to make cash deposits 24/7.
Contactless cards
dfcu introduced upgraded contactless Visa card that allows customers to tap their cards to complete a low value payment transaction, instead of inserting the card into a point-of-sale machine and entering a PIN. The contactless card enables a seamless payment process with increased security to allow customers keep their card with them rather than handing in to the cashiers or entering a PIN or signing a slip.
Credit cards
dfcu introduced the reliable cost-effective Visa Contactless Credit Card that is a convenient way of offering short term finance support to its customers. The Contactless Credit Card comes with a range of benefits such as; Credit limit of up to Ushs 100,000,000, life and permanent disability insurance of up to Ushs 100,000,000, redundancy retrenchment of up to Ushs 50,000,000, access to a revolving limit, interest-free credit provided you pay back the full installment within 50 days, convenient purchasing of items with 24/7 access to credit, ATM withdrawals, acceptance to over 40 million outlets worldwide, free lost card protection and lifestyle benefits including discounts at restaurants, health and wellness clubs and airport lounges.
Online Banking
We are investing to stay at the leading edge of innovation, so that we can continue to offer compelling customer experiences and meet increasing competitive demands. The flagship digital platform Quick Banking helps us achieve this ambition, allowing us to overcome some of the barriers to accessing financial products and services. This omni channel digital platform enables customers access our banking services using the mobile phone (*240#), using the computer (dfcu QuickConnect) or through the mobile App (dfcu Quick App).

dfcu ANNUAL REPORT AND FINANCIAL STATEMENTS 2020 dfcu ANNUAL REPORT AND FINANCIAL STATEMENTS 2020 4948
Tailored products for underserved groups
dfcu offers specific banking products aimed at bringing the underserved customer groups into the banking system. Affordable savings products such as the Dembe and Group savings accounts are helping to inculcate a savings culture.
Small business owners especially in the informal sector have challenges accessing capital yet they comprise the largest part of the Ugandan economy. The Baraka loan enables small businesses to acquire credit more quickly without having to worry about loan security and property valuations which slow down the process of acquiring a loan. This loan is a welcome effort for many business owners at a time when the economy and businesses are suffering from the impact of Covid-19. Trade finance solutions like the Unsecured bid bonds of up to Ushs 500 million support traders and contractors in the management of their working capital and to secure business contracts.
Promoting financial education
dfcu Investment Club App
dfcu has a history of promoting a savings and investment culture that dates as far back as 2007 with the introduction of the Savings and Investment Clubs proposition to foster group savings. The Investment Club App is central to our ongoing financial inclusion drive by encouraging personal and group savings and investments in Uganda. The App simplifies the day to day management of group savings by providing a digital real time view of all financial activities. The App helps with tracking member contributions, managing group lending and collections; effective reporting and general administration anytime, anywhere.
Loan origination system
The Loan Origination System (LOS) was rolled out to specifically support the loan application processing needs of our customers. The process of issuing a loan involves a series of steps right from acquiring a borrower, processing their information, vetting their credit standing, documentation and then finally either approval and disbursal of funds or disapproving the loan. The LOS streamlines all these processes by offering a comprehensive solution to loan origination requirements while improving efficiency, mitigating risks and improving borrower relationships. Loans to individual borrowers are approved and disbursed within 24 hours.
50+
Financial literacy engagements
The dfcu financial inclusion strategy goes beyond providing access to bank accounts and other basic financial services, as we want people to have the skills to manage their finances, so they can make the right choices about what products and services meet their needs. The financial education initiatives are online as well as face-to-face through workshops and trainings. Over 50 financial literacy sessions were held during the year to target groups including women, savings groups and small enterprises.
4th LargestAgent Banking network
3rd LargestBranch network
3rd LargestATM network
Integration with TelcosInvestment Club App Online Banking
coming soon

dfcu ANNUAL REPORT AND FINANCIAL STATEMENTS 2020 dfcu ANNUAL REPORT AND FINANCIAL STATEMENTS 2020 5150
Supporting Our Customers
Delivering for our customers through COVID-19
dfcu has been there with its customers every step of the way throughout the COVID-19 pandemic. Making sure customers could access their money safely during difficult times was crucial.
As a responsive business, we recognised the challenges occasioned by the pandemic and took the following measures to ensure safety and business continuity.
• On average, over 90% of branches remained open, providing much needed services to customers in locations where we have presence.
• Enhanced the alternative channels functionality and increased our digital footprint. To drive usage, we reduced /waived charges on the use of digital channels.
• Launched a digital banking education campaign to raise awareness of the channels and help customers learn how to bank using the alternative channels.
• Provided credit relief to customers with loan restructures, rescheduling and repayment holidays.
• Extended support to businesses and households across the country with new and additional credit funding to sustain them through the period.
Listening to our customers
We prioritised direct engagements with customers to understand what is most important to them, get feedback and offer advice on business continuity during the pandemic.
The engagements included online forums and business webinars, individual customer meetings and customer calls.
Over Ushs 500 Billion in new credit funding extended to businesses and individuals.
Over 2,000 customer loans restructured or deferred at the peak of the pandemic.
Over 70 customer forums and
webinars held during 2020.

dfcu ANNUAL REPORT AND FINANCIAL STATEMENTS 2020 dfcu ANNUAL REPORT AND FINANCIAL STATEMENTS 2020 5150
Supporting Staff Wellbeing During COVID-19
Our people have demonstrated tremendous resilience over the past year, and have shown that, regardless of the circumstances, they will go over and above to support our customers, communities, and one another, while working to deliver value for our shareholders.
Being able to support our people over the course of 2020 was crucial. Team leaders and managers had a duty of care in protecting staff from chronic stress and poor mental health while driving productivity.
As we prioritised our employee wellness programs during COVID-19 with amping up mental health wellness initiatives, we also ramped up our business technology and internal operations to ensure that at least 70% of our non-core staff were able to work remotely relying on stable and secure systems.
The health and wellbeing of our employees continues to be of the utmost importance to us and we continue to
ensure their safety, as they support our customers.
Throughout the COVID-19 pandemic, dfcu has proactively and rapidly deployed extensive measures to ensure our premises remain as safe as possible while supporting the wellbeing of all employees. Some of these measures include the following:
Reconfigured workspaces to reduce density, increased sanitisation, regular deep cleaning and set up protective plexiglass dividers in busy areas.
Distributed Personal Protective Equipment including sanitiser, face masks, shields & gloves.
Support for employees transitioning to remote work arrangements, including new policies and best practices.Enabled 70% of non-branch employees to work remotely by providing internet and VPN access.
Distributed Personal Access to medical support and advice, including on-site and virtual consultations. Prioritisation of mental health including access to assistance plans and counselling services.

dfcu ANNUAL REPORT AND FINANCIAL STATEMENTS 2020 dfcu ANNUAL REPORT AND FINANCIAL STATEMENTS 2020 5352
Digital Transformation|Key Achievements And Next StepsIn 2020, as part of our overall digital strategy, we continued to prioritize efforts towards the Bank’s key market segments. We focused on evolving customer trends, changes in the competition landscape and appreciated the new technologies that are being introduced amidst regulatory changes. Our key achievements in the year were intended to create value for our customers, build scale and deliver service in a cost-effective manner.
Key achievements for 2020
a) Loan Origination System: To continue driving efficiency and reducing cost to serve for the retail customer segment, we have automated the Loan Origination back-end support process end-to-end.
b) To further increase focus on the quality of the loan book, we have automated monitoring and collection efforts
c) Self Service Channels: We have overhauled our ATM fleet and introduced intelligent (smart) ATMs. These ATMs now further provide 24/7 access to banking services for our customers with cash deposit and cash recycling abilities (this means that money that is deposited can be used immediately by a customer wishing to withdraw at the same machine).
d) Agent Banking: Through our Agent Banking Network, we have continued to offer additional services to our customers within their respective communities. Through our inaugural partnership with NSSF, payments can now to be made through our wide agent banking network. We also provide other utility payments, cash deposits, withdrawals and facilitate float top ups by MTN mobile money agents.
e) Quick Banking: We have upgraded our mobile banking and online banking capabilities to introduce enhanced functionality to our customers and enhance the experience.
f) Online Forex: Our forex dealing platform has been upgraded with straight-through processing of transactions, ability to input negotiated rates, and enhanced risk management capabilities.
g) Internal Process Efficiencies: By leveraging our existing investments in technology, we have also managed to reduce the turn-around time on Account Opening, Card Issuance, and increased service points for onboarding of new customers
h) Technical Assistance program: dfcu continued leveraging its strategic partnerships with Rabobank and Embassy of Kingdom of Netherlands (EKN) to focus on supporting the entire food and agriculture value chain. This has been achieved by increasing access to finance,
exploring digital ways to enhance distribution, build products and services for agri-business and also focus on enhancing digital inclusion by delivering value to customers through innovation.
Looking forward to 2021
a) Strategy Refresh: In collaboration with a leading global management consulting firm, the Bank will be charting the next phase of its five year strategy building on learnings from existing efforts, factoring the post-pandemic landscape with emphasis on customer centricity, digital enablement, cost efficiency and overall resilience.
b) Architectural Modernization: The Bank will also embark on a modernization journey for the payments architecture in the context of future-proofing the payments value chain to ensure that a flexible, agile, and cost-effective platform is installed to achieve the set out strategic objectives.
c) Loan Process Re-engineering: With an increased focus on the value that the Bank delivers to transform the economy and improve livelihoods of our people, a review of our Credit processes, structures, products and digitization of the loan disbursement channels will be critical in the journey ahead, taking into account the aftermath of the pandemic.
d) Investment Club Enhancements: Building on the success of the Investment Club App, exciting features are to be introduced to the Application following engagement and feedback from our customers.
e) Graduate Trainee Program: dfcu Bank, Makerere University and the Ministry of Finance, Planning & Economic Development through a strategic partnership intend to create a platform to support young entrepreneurs as they advance ideas on innovative solutions for enterprises that create socio-economic impact in Uganda.
f) Cyber Security: Security for our customers when they are transacting online will remain a priority for the Bank and providing more convenience with online payment capabilities that are embedded with the respective service points for taxes, school fees and other payments will be a focus in the short to medium term.
g) Payment Platform enhancements: We will continue to leverage our key strategic partnerships through direct host to host integrations, enabling seamless payments for transactions, and holding escrow accounts to support the telco ecosystem.

dfcu ANNUAL REPORT AND FINANCIAL STATEMENTS 2020 dfcu ANNUAL REPORT AND FINANCIAL STATEMENTS 2020 5352
1.0 Risk management
The Covid-19 pandemic was the largest single shock to the world economy and to the human society in recent times. However, our financial and human resources were very well able to withstand this shock. There were several business disruptions resulting from the abrupt lockdown that were easily managed by our resilient business continuity management. More specifically, pandemic related restrictions on workplaces and the desire for contactless services created the need to expedite our digitization strategy with heightened attention given to especially cyber risk.
dfcu Group defines risk as the danger of possible losses or profits foregone due to internal or external factors. In risk management, we normally distinguish between quantifiable and non-quantifiable types of risk. Quantifiable risks are those to which a value can normally be attached in financial statements or in regulatory capital requirements, while non quantifiable risks include risks such as compliance and reputational risk.
For agile performance through proper risk management, the Group has prepared and implemented a robust Enterprise risk management framework for identification, measurement, monitoring, management, control and reporting of the potential risks that the organization has to face. The Board of Directors also annually reviews the approved and implemented Enterprise Risk Management Framework as well as the Risk appetite statement to deal with underlying risks of special importance to the Group.
Executive management remained closely involved in important risk management initiatives, which focused particularly on preserving appropriate levels of liquidity and capital, and effectively managing the risk portfolios.
2.0 How we manage Risk
2.1 Risk Governance
dfcu Group is responsible for developing and implementing the Group-wide risk management policies and guidelines for quantifiable risks, laid down by the Board of Managing Directors, as well as for measuring these risks. The Chief Risk Officer) CRO periodically reports to the full Board of Managing Directors and the Management Risk Committee on the overall risk situation within the Group.Until 31st December 2020, the Risk and Investigations department comprised of the following units: Operational Risk Management, Credit Risk Management, Financial Crime Management, and Integrated Risk Management. The Board of Directors determines the strategic direction of the Group and agrees the nature and extent of the risks it is willing to take to achieve its strategic objectives. To ensure that the strategic direction recommended by the business represents the best of the strategic options open to it, the Board is supported by the Group’s Senior Management. Senior Management facilitates and informs the Board’s assessment of the risk landscape and development of potential strategies by which it can drive long-term shareholder value.
2.2 Reporting and Committee structures
The Board delegates its risk-related responsibilities primarily to specialized management committees which then focus on different aspects of risk management It then receives regular updates on the key risks of the company in comparison to risk appetite and defined goals.
Risk Management and Control

dfcu ANNUAL REPORT AND FINANCIAL STATEMENTS 2020 dfcu ANNUAL REPORT AND FINANCIAL STATEMENTS 2020 5554
2.3 Three lines of defense.
We leverage the lines of defense to maintain a strong and resilient risk culture. The business is viewed as the first line of responsibility. Operational managers own and manage risks. They are also responsible for implementing corrective actions to address processes and control deficiencies. Risk management serves as a second line and ensures control effectiveness. In this way, the business remains at all levels responsible for the risks taken. This ensures that the Group’s culture of risk awareness is widely held and respected across the whole organization. The third line of defense is Internal Audit, which validates the overall effectiveness of the framework.
2.4 Risk appetite
Risk appetite is the maximum level of residual risk that the group is prepared to accept to deliver its business objectives. The group has developed a robust framework that is used to articulate risk appetite throughout the group and to external stakeholders.
Risk appetite articulates the level of risk a company is prepared to accept to achieve its strategic objectives. Risk appetite frameworks help management understand a company’s risk profile, find an optimal balance between risk and return, and nurture a healthy risk culture in the organization. It explains the risk tolerance of the company both qualitatively and quantitatively. Qualitative measures specify major business strategies and business goals that set up the direction of the business and outline favorable risks. Quantitative measures provide concrete levels of risk tolerance and risk limits, critical in implementing effective risk management. Risk appetite represents the willingness and the ability to take risk. Due to the sophisticated nature of financial institutions, it requires a lot of effort to fully understand the constraints and the ability to assume risk.
The Group implements risk appetite in terms of various limits, thresholds risk adjusted performance measures on a number of indicators to determine its risk profile.
The board establishes the group’s parameters for risk appetite by:
• providing strategic leadership and guidance. • reviewing and approving annual budgets and
forecasts, under both normal and stressed conditions, for the group; and
• regularly reviewing and monitoring the group’s risk performance through quarterly board reports.
The board delegates the determination of risk appetite to the Board Risk and Credit Committee and ensures that risk appetite is in line with group strategy and the group’s desired balance between risk and reward.
2.5 Stress testing
The group’s overall stress testing program is a key management tool within the organization and facilitates a forward-looking perspective on risk management and business performance. Stress testing involves identifying possible events or future changes in economic conditions that could have an impact on the group. Stress tests are used in proactively managing the group’s risk profile, capital planning and management, strategic business planning and setting of capital buffers. Stress testing is an integral component of the group’s internal capital adequacy assessment process and is used to assess and manage the adequacy of regulatory capital.
Executive management considers the outcomes of stress testing on earnings and capital adequacy in determining an appropriate risk appetite, to ensure that these remain above the group’s minimum capital requirements. Management reviews the outcomes of stress tests and, where necessary, determines appropriate mitigating actions to minimize and manage the risks induced by potential stresses.
Stress tests are conducted frequently to enable early and proactive management of the potential impact of stress scenarios on the group’s risk profile.
3.0 Risk universe
Our risk universe represents the principle risks that are core to our business. We annually review these for changes to ensure the listing remains relevant.
3.1 Strategic Risk
This is the risk of current or prospective impact on an organization’s earnings, capital or reputation arising from changes in the environment the organization operates in and from adverse strategic decisions, improper implementation of decisions, or lack of responsiveness to industry, economic or technological changes.
Strategic Risk may arise from changes to the competitive landscape or regulatory framework or ineffective positioning in the macroeconomic environment. The Group enhanced its strategic risk key performance indicators which are measured and reviewed on a monthly basis by the Management Risk Committee and presented to the Board on a quarterly basis.
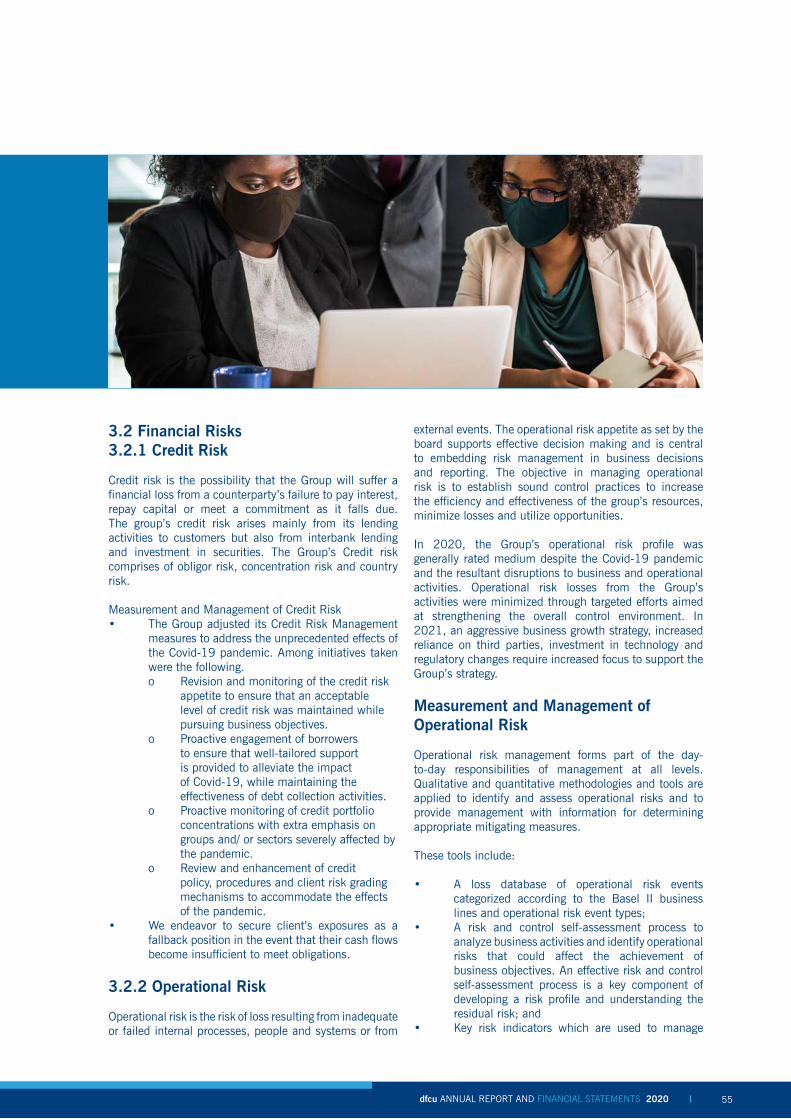
dfcu ANNUAL REPORT AND FINANCIAL STATEMENTS 2020 dfcu ANNUAL REPORT AND FINANCIAL STATEMENTS 2020 5554
3.2 Financial Risks3.2.1 Credit Risk
Credit risk is the possibility that the Group will suffer a financial loss from a counterparty’s failure to pay interest, repay capital or meet a commitment as it falls due. The group’s credit risk arises mainly from its lending activities to customers but also from interbank lending and investment in securities. The Group’s Credit risk comprises of obligor risk, concentration risk and country risk.
Measurement and Management of Credit Risk• The Group adjusted its Credit Risk Management
measures to address the unprecedented effects of the Covid-19 pandemic. Among initiatives taken were the following.o Revision and monitoring of the credit risk
appetite to ensure that an acceptable level of credit risk was maintained while pursuing business objectives.
o Proactive engagement of borrowers to ensure that well-tailored support is provided to alleviate the impact of Covid-19, while maintaining the effectiveness of debt collection activities.
o Proactive monitoring of credit portfolio concentrations with extra emphasis on groups and/ or sectors severely affected by the pandemic.
o Review and enhancement of credit policy, procedures and client risk grading mechanisms to accommodate the effects of the pandemic.
• We endeavor to secure client’s exposures as a fallback position in the event that their cash flows become insufficient to meet obligations.
3.2.2 Operational Risk
Operational risk is the risk of loss resulting from inadequate or failed internal processes, people and systems or from
external events. The operational risk appetite as set by the board supports effective decision making and is central to embedding risk management in business decisions and reporting. The objective in managing operational risk is to establish sound control practices to increase the efficiency and effectiveness of the group’s resources, minimize losses and utilize opportunities.
In 2020, the Group’s operational risk profile was generally rated medium despite the Covid-19 pandemic and the resultant disruptions to business and operational activities. Operational risk losses from the Group’s activities were minimized through targeted efforts aimed at strengthening the overall control environment. In 2021, an aggressive business growth strategy, increased reliance on third parties, investment in technology and regulatory changes require increased focus to support the Group’s strategy.
Measurement and Management of Operational Risk
Operational risk management forms part of the day-to-day responsibilities of management at all levels. Qualitative and quantitative methodologies and tools are applied to identify and assess operational risks and to provide management with information for determining appropriate mitigating measures.
These tools include:
• A loss database of operational risk events categorized according to the Basel II business lines and operational risk event types;
• A risk and control self-assessment process to analyze business activities and identify operational risks that could affect the achievement of business objectives. An effective risk and control self-assessment process is a key component of developing a risk profile and understanding the residual risk; and
• Key risk indicators which are used to manage

dfcu ANNUAL REPORT AND FINANCIAL STATEMENTS 2020 dfcu ANNUAL REPORT AND FINANCIAL STATEMENTS 2020 5756
operational risk on an ongoing basis. Key risk indicators contribute to an assessment of the operational risk profile. The main purpose is to assist management by providing an early-warning indicator of potential risk exposures and/or a potential breakdown of controls.
Operational Risk Management in 2020
The Group continued to implement and employ robust policies, processes, and tools to identify, monitor and manage operational risk in line with the strategic business objectives. This supported further embedment of the operational risk governance framework through application of principle-based methodologies. Despite business disruptions caused largely by the Covid-19 pandemic and the resultant effects on working arrangements, business and control activities, the Group was able to effectively manage operational risk within appetite. The Group adopted and commenced implementation of an agile approach to operational risk management in which the risk managers are present for advisory from introduction, through the life cycle of new products and projects to effectively identify and manage the new risks introduced into the Group’s environment. This approach ensures a more cost effective and efficient means to mitigate risks.
Throughout 2020, regular crisis meetings were held to analyze the threat landscape and the Group’s response to the evolving risk posed by the Covid-19 pandemic and any other external events, to ensure continuous high-quality service is delivered to customers and ensure health and safety of both staff and customers. The Group continued to reference and benchmark on best risk management practices in the industry through participation in relevant forums and analysis of industry data, in order to anticipate and respond to emerging risks.
The Group continued to put in place robust prevention and detection controls to manage both the known and emerging information and cyber security risks. Several measures were put in place to effectively anticipate, detect, and manage the increased exposure to cyber threats created partly by remote working that was adopted to comply with the standard operating procedures for the containment of the spread of Covid-19. Monitoring and management programs for the cyber security risks posed by the Group’s third parties were also put in place with oversight from the Business Technology (BT) Security and IT Risk Management functions.
The business continuity management policy and programs were revamped to include a pandemic response plan to guide the Group’s operational resilience activities throughout the current and any future incidences. Additionally, the Group conducted test simulations on its business continuity management, disaster recovery and
resolution plans and risk reporting readiness, which are important tools in preparation for times of stress.
The Group continued to invest in digitization to enhance customer experience however the digital channels present an ever-evolving threat to the Group. In order to enhance and improve the anti-fraud landscape, the Group invested in data capabilities to proactively predict, detect and prevent risk incidents such as fraud on the digital channels. Several monitoring tools and systems have been put in place to timely detect, monitor and report fraud incidents together with different channels for staff and customers to report unethical behavior. Additionally, the Group enhanced its technology and processes that enable detection, monitoring and intervention, to known threats and fraudulent activities on customers’ accounts.
The Group continues to partner with third party vendors to deliver innovative products and leverage efficiencies created by outsourcing. These partners are subjected to a rigorous onboarding due diligence and an ongoing periodic review process to ensure risks introduced by the vendors are understood and adequately mitigated. Annual vendor risk assessment programs are in place to facilitate segmentation of vendors based on their risk profile and criticality of services extended to the Group, which also determines the frequency and depth of periodic reviews conducted on the partners. Consequently, there were no major third-party risk incidents in 2020. A model governance framework is in place, together with a Model Approval Committee overseeing all activities in the development, validation, re-validation, monitoring and approval of all models used in the Group. A number of Group initiated, and vendor developed models were developed, validated, reviewed and approved by the committee for use in 2020 and the committee continues to ensure that all models used in the Group follow the governance processes and controls in place to mitigate model risk.
3.2.3 Market risk
Market risk refers to the risk of losses in the group’s trading and banking books due to changes in equity prices, interest rates, , foreign-exchange rates, , and other securities whose values are set in a public market.One of the primary objectives of Market Risk Management, a part of our independent Risk function, is to ensure that our business units’ risk exposure is within the approved appetite commensurate with the defined strategy. To achieve this objective, Integrated Risk management (but specifically Market risk) works closely together with the risk takers (“the business units”) and other control and support functions. This is aimed at ensuring timely identification, measurement, mitigation and reporting of Market risks to minimize losses.

dfcu ANNUAL REPORT AND FINANCIAL STATEMENTS 2020 dfcu ANNUAL REPORT AND FINANCIAL STATEMENTS 2020 5756
Measurement and Management of Market Risk
The Covid-19 pandemic presented itself with a number of challenges which resulted into high volatilities especially in January and February 2020 as different world economies begun to shut down. The Uganda shilling reached an all time high of 3960 against the USD as the country experienced a significant dip in foreign currency inflows. After the lockdown in June 2020, which was one of the stringent containment measures, the electioneering process kicked in as well and saw incremental government borrowing that caused interest rates to raise a bit. However, amidst this challenging operating environment, the Group was able to maintain its trading and banking book positions within the approved risk appetite and tolerance limits.
• Market Risk Management governance is designed and established to promote oversight of all market risks, effective decision-making and timely escalation to senior management
• We aim to accurately measure all types of market risks by a comprehensive set of risk metrics embedding accounting, economic and regulatory considerations. We measure market risks by several internally developed key risk metrics such as Stop Loss, Net Open Position (NOP), PV01 and Value-at-Risk (Var) and prudential regulatory defined market risk approaches. The bank upgraded it’s dealing platform to one that was able to measure all these risks and calibrate them against approved limits. Any breaches are automatically picked up and an explanation sought from the business owners. We also rationalize the market risk limit every year to ensure that business has a limit that is sufficient to achieve business aspirations at an acceptable level of risk.
• We also have policies in place for Interest rate risk, foreign exchange risk and market risk that
clearly set out the guidelines and responsibilities of all stakeholders in market risk management.
3.2.4 Liquidity risk
Liquidity risk is the risk that the group does not have sufficient cash and cash equivalents available at all times to meet its contractual and contingent cash flow obligations or can only secure these resources at excessive cost. Liquidity risk is monitored centrally by the Asset and Liability Committee (ALCO), whose responsibilities in relation to liquidity management include, but are not limited to: • Setting liquidity risk strategy for the Group. • Reviewing and enforcing dfcu’s funding and
liquidity policy. • Reviewing and monitoring dfcu’s contingency
funding plan. • Maintaining internal and external liquidity risk
limits. • Liquidity stress testing and scenario analysis;
and providing the Board and relevant Board Committees with regular liquidity updates.
Management of Liquidity risk
The Group manages liquidity in accordance with applicable regulations and international best practice. As part of a consistent liquidity management process, the group challenges itself to:
• maintain a sufficiently large liquidity buffer. • ensure a structurally sound statement of financial
position. • manage short- and long-term cash flow. • manage foreign currency liquidity. • preserve a diversified funding base. • undertake regular liquidity stress testing and
scenario analysis; and • maintain adequate contingency funding plans.

dfcu ANNUAL REPORT AND FINANCIAL STATEMENTS 2020 dfcu ANNUAL REPORT AND FINANCIAL STATEMENTS 2020 5958
The cumulative impact of these elements is monitored by Group ALCO and the process is underpinned by a system of extensive controls.
Independent oversight for liquidity risk is the responsibility of the Risk function and this involves a formal review of all liquidity risk parameters, procedures, reporting sources and compliance to limits and guidelines.
3.3 Non-Financial Risks
3.3.1 Business Continuity
Business continuity management is an integral component of the Group’s risk management framework. The various business units are continually exposed to deployment of updated methodologies as well as testing and training to ensure increased capability to deal with interruptions to business. This is achieved through active assessment of the changing business environment, reference to and incorporation of updated and emerging best practice standards worldwide, pre-planned simulation and desktop assessments and interrogation of identified risks and threats to the operational continuity of the Group.
Contingency and recovery plans for core services, key systems and priority business processes have been developed and are revisited as part of existing management processes to ensure that continuity strategies and plans remain relevant. The Group’s business continuity strategy is structured to ensure strong central monitoring and reporting and decentralized execution, and is supported by a framework of policies, procedures and tools to identify, assess, monitor, control and report such risks.
3.3.2 Compliance Risk
Compliance is an independent key risk management function that the Board and Management has prioritized in the wake of the Group being subject to extensive dynamic supervisory and regulatory regimes. Strategically,
the compliance framework is directly supervised at the executive level by the Chief Executive Officer and the Compliance function, for its independence, has a reporting requirement to the Board. The Group’s compliance risk framework is implemented through a centralised compliance risk management structure. This is a specialised unit that provides oversight on all compliance related matters such as compliance with all relevant laws, coordination of the Anti-Money Laundering and Counter TerrorisM financing (AML/CTF) program coordination of internal policy compliance and any other emerging legislative developments.
Core to the compliance functions is also the provision of requisite training and awareness on regulatory developments.
3.3.2.1 Money Laundering Control and Anti - Terrorism Financing
The past year has seen heightened focus on anti-money laundering and counter-terrorism financing with regulators focusing on how supervised entities are managing the associated risks. From a regulatory development perspective, the 2nd Schedule to the Anti-Money Laundering Act 2013 was amended to include virtual asset providers (such as cryptocurrencies) as accountable persons. This is in line with the 2019 Financial Action Task Force (FATF) amendment to its recommendations requiring that virtual asset service providers be regulated for anti-money laundering and combating the financing of terrorism (AML/CFT) purposes, licenced or registered, and subject to effective systems for monitoring or supervision.
Further, On the 7th of December 2020, Uganda assumed the Presidency of the Eastern and Southern Africa Anti-Money Laundering Group (ESAAMLG). Uganda took over the Presidency from the Kingdom of Eswatini. ESAAMLG’s purpose is to combat money laundering by implementing the Financial Action Task Force (FATF) Recommendations. This effort includes coordinating with other international organisations concerned with combating money laundering, studying emerging regional

dfcu ANNUAL REPORT AND FINANCIAL STATEMENTS 2020 dfcu ANNUAL REPORT AND FINANCIAL STATEMENTS 2020 5958
typologies, developing institutional and human resource capacities to deal with these issues, and coordinating technical assistance where necessary.
The Group continues work hand in hand with the regulator to build and maintain robust defences to combat money laundering, sanctions and terrorism financing in close collaboration with Bank of Uganda through the Uganda Bankers Association and the Financial Intelligence Authority.
3.3.2.2 Regulatory Landscape
The regulatory environment continues to evolve impacted by both global and local changes. A brief highlight is shared below.
On the local regulatory front, the National Payment Systems Act 2020 was passed by Parliament on 29 May 2020 and gazetted on 4 September 2020. The Act was prompted by an increase in the use of digital and electronic financial services by private entities in Uganda offering various electronic payment products. In addition, financial institutions were favouring electronic payments, adopting branchless banking systems and had introduced the automated clearing house for clearing cheques and high-volume electronic funds transfers. There was therefore a need to institute regulation and supervision of payment service providers by the Central Bank posing safety risks to customers’ funds and creating uncertainty. dfcu Group’s Management and Board have reviewed the Group’s business and operating models leading up to this change and can confirm our readiness for this transition.
3.3.3 Reputational Risk
Reputational risk results from damage to the group’s image among stakeholders, which may impair its ability to retain and generate business. Reputational risk relates to stakeholder perceptions whether fact-based or otherwise. Stakeholders’ expectations change constantly therefore reputational risk is dynamic and varies between groups and individuals.
The Group is committed to operating at the highest standards possible that we set for ourselves. Any lapse in standards of integrity, compliance customer service or operating efficiency represents a potential reputational risk.
Reputational risk is measured by reference to our reputation as indicated by our dealings with all relevant stakeholders including media, regulators, customers and employees; and by reference to identified metrics, incident assessments, regulatory feedback and judgement and assessment by the risk management team.
Reputational risk is monitored through our reputational risk assessments and metrics, the results of the second line of defense that is integrated into the Group’s broader risk management framework.
Safeguarding the Group’s reputation is of paramount importance to its continued success and is the responsibility of every member of staff. The Group strives to minimize reputational damage at all times. The shared values provide guidance on acceptable behavior for all staff members, and provide structure and guidance for non-quantifiable decision making, thereby assisting in the management of the Group’s reputation.
3.3.4 Environmental and Social Governance risk
dfcu is committed to conducting business in accordance with the highest ethical standards and regard to health and safety, environmental, Social and governance aspects of its banking and lending activities, and the principles of environmentally sound and sustainable development.
The nature of most of our activities means that we have an impact on society and the environment. In many cases this impact will be positive, for example when we are involved in financing projects beneficial to society e.g. education, infrastructure, hospitality, health, manufacturing among others. However, a potential negative impact during the execution of some projects by our customers cannot be ruled out. Environmental risks include the impact on vulnerability on ecosystems. dfcu has an Environmental Social and Governance (ESG) policy updated from time to time that provides guidance to the staff and clients on how to manage aspects related to the ESG and ensure that the projects are compliant.
The extent to which our activities have a social impact directly or indirectly through our clients is highly dependent on the type and/or location of a given project. Where relevant, we implement or ask our clients to implement a social impact program and work with our clients to mitigate the impact created by our / clients’ activities.
3.3.5 Model risk
Incorrect or inappropriate use of a model and fundamental errors in models that may produce inaccurate outputs that are not aligned to design objectives and intended business uses.
dfcu ANNUAL REPORT AND FINANCIAL STATEMENTS 2020 dfcu ANNUAL REPORT AND FINANCIAL STATEMENTS 2020 6160
Looking ahead
The economic impact of Covid-19 is expected to continue beyond 2021, with different levels of severity in various sectors where the Group is exposed to.
• Looking forward in 2021 and beyond, Risk Management function will focus on delivering timely risk data and insights to stakeholders to inform decision making and managing operational risk within appetite.
• The Group will continue to put the health and safety of staff and customers at the center of its activities through provision of innovative products and putting in place programs that ensure provision of sustainable options for customers and staff to remain safe. The business resilience programs will further be enhanced through a robust scenario analysis and stress testing framework that will be rolled out and the Group will continue to explore avenues that ensure sound operational resilience.
• The Group will regularly conduct internal third-party risk management maturity assessments to assess the third-party risk management programs and activities to ensure adequate oversight and depth of the activities, and to proactively anticipate and manage emerging risks in the area.
• 2020 saw unprecedented growth in popularity of digital and e-commerce transactions. These transactions provide opportunity for fraudsters to perpetuate fraud on customer accounts and breach sensitive card data. In 2021, the Group will strive to maintain a balance between customer experience and anti-fraud measures by analyzing data to establish behavior, further enabling the prediction, prevention, detection and rapid response to changes in the digital and card fraud threat landscape. The Group will also invest in 3D Secure technology to improve security
for customers while executing card not present transactions.
• The Group will continue to focus on improving service, availability, and stability of systems as well as its cyber security capabilities. The Business Technology (BT) Security and IT Risk Management functions will continue to monitor the Group’s cyber risk posture to ensure timely detection and adequate mitigation of cyber security threats. The Group will also explore opportunities to transfer of part of the residual cyber security risk.
• Additional focus will be placed on improving risk culture through investing in tooling and upskilling staff to effectively support the business. A robust training and awareness program will be put in place for all staff, and risk management activities linked to the performance management program of the Group to shift risk culture to become more proactive across the business.
• The Group will aim to comply with the evolving regulatory landscape through research on emerging laws, regulations and guidelines, enhancing internal policies and procedures and putting in place a robust training and awareness plus a risk-based monitoring program to ensure timely and effective compliance.
• Enhance our capabilities to monitor and frustrate fraudsters, including working with industry participants to prevent, detect and create awareness about fraud.
• Mature resilience against the expanding cyber threats and improve client security awareness and authentication controls by rolling out verified by Visa.
• Manage the risk of further Covid-19 infection surges and its impact on the mental and emotional wellbeing of our staff.

dfcu ANNUAL REPORT AND FINANCIAL STATEMENTS 2020 dfcu ANNUAL REPORT AND FINANCIAL STATEMENTS 2020 6160
Corporate governance statement 2020
The Primary aim of our governance is to provide guidance and support to the entire Management of dfcu in order to create sustainable value for our Shareholders through informed, collaborative and accountable decision-making. This statement indicates the governance aspects of the year. 2020 was an unprecedented year for all institutions and businesses with the surge of the COVID-19 pandemic. While a number of challenges were presented, the year also unfolded opportunities for more innovation and ushered in a new way of doing business.
dfcu’s 2020 Corporate Governance statement sets out the governance framework adopted by the company and the key activities during the 2020 financial year. Major focus was on the changes brought about by the COVID-19 pandemic.
The new normal
The COVID-19 pandemic had far-reaching impacts on businesses and societies around the world and in many ways, 2020 and 2021 have prompted the world to reach a turning point. The Board of Directors of dfcu Limited remained focused on the new normal in order to foster business continuity while ensuring the safety and health of the staff and customers.
Virtual Meetings;
The Public Health (Control of COVID - 19) Rules, 2020 restricted the number of people gathered to a maximum of ten (10), therefore making it impracticable for the Company to hold a fully physical Annual General Meeting as provided for in the Articles of Association. The Company held the very first virtual Annual General Meeting (AGM) in the history of its existence for the year ended 31st
December 2019. Following the grant of leave of court on 22nd July 2020 as required under the Companies Act No. 1 of 2012, and a ‘No objection’ from the Uganda Securities Exchange on 28th July 2020, a virtual AGM was held on 26th August, 2020. Considering the novelty of an AGM of this nature in the business of the Company, the AGM was very successful and opened up a world of possibilities amidst the hardships presented by the pandemic. The Board of directors was able to successfully call for an AGM in order to ensure that the Shareholders execute their mandate in the running of the business.
Furthermore, since March 2020, the Board has held virtual meetings which has fostered continuity of business and cut down on the cost of Board meetings associated with travel of Directors. The management of operational costs was greatly emphasized during the year on the basis that business sustainability and tenacity remains at the heart of success of the Company’s long term strategy.
Board’s Strategic Focus for the year 2020
In addition to its other duties, the main focus areas for the Board of dfcu Limited for the year 2020 included;(i) Monitoring the Company’s performance,
contingency planning and other measures taken by management due to the COVID-19 pandemic and resulting economic downturn;
(ii) Monitoring the Company’s financial results;(iii) Reviewing of risk projects and implementing
project management improvements;(iv) Financing and working capital management; and (v) Monitoring the implementation of the Strategy
and changes required due to the COVID-19 pandemic.
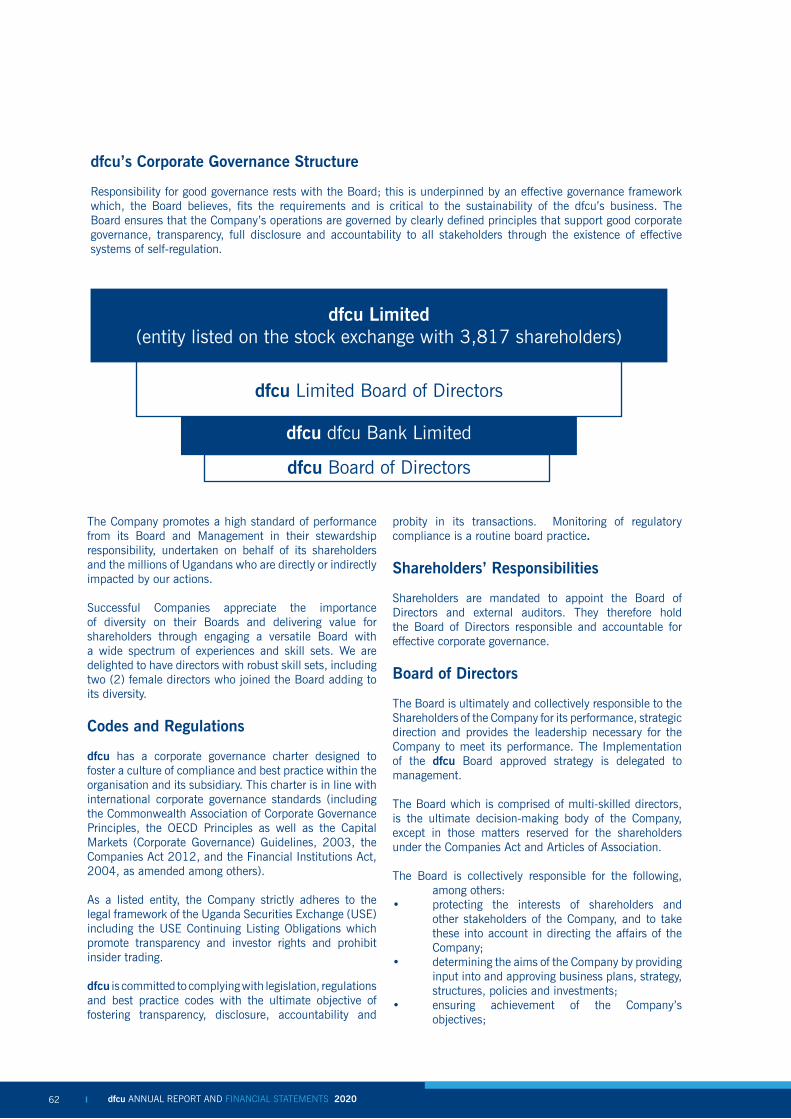
dfcu ANNUAL REPORT AND FINANCIAL STATEMENTS 2020 dfcu ANNUAL REPORT AND FINANCIAL STATEMENTS 2020 6362
dfcu’s Corporate Governance Structure
Responsibility for good governance rests with the Board; this is underpinned by an effective governance framework which, the Board believes, fits the requirements and is critical to the sustainability of the dfcu’s business. The Board ensures that the Company’s operations are governed by clearly defined principles that support good corporate governance, transparency, full disclosure and accountability to all stakeholders through the existence of effective systems of self-regulation.
dfcu Limited(entity listed on the stock exchange with 3,817 shareholders)
dfcu Limited Board of Directors
dfcu Board of Directors
dfcu dfcu Bank Limited
The Company promotes a high standard of performance from its Board and Management in their stewardship responsibility, undertaken on behalf of its shareholders and the millions of Ugandans who are directly or indirectly impacted by our actions.
Successful Companies appreciate the importance of diversity on their Boards and delivering value for shareholders through engaging a versatile Board with a wide spectrum of experiences and skill sets. We are delighted to have directors with robust skill sets, including two (2) female directors who joined the Board adding to its diversity.
Codes and Regulations
dfcu has a corporate governance charter designed to foster a culture of compliance and best practice within the organisation and its subsidiary. This charter is in line with international corporate governance standards (including the Commonwealth Association of Corporate Governance Principles, the OECD Principles as well as the Capital Markets (Corporate Governance) Guidelines, 2003, the Companies Act 2012, and the Financial Institutions Act, 2004, as amended among others).
As a listed entity, the Company strictly adheres to the legal framework of the Uganda Securities Exchange (USE) including the USE Continuing Listing Obligations which promote transparency and investor rights and prohibit insider trading.
dfcu is committed to complying with legislation, regulations and best practice codes with the ultimate objective of fostering transparency, disclosure, accountability and
probity in its transactions. Monitoring of regulatory compliance is a routine board practice.
Shareholders’ Responsibilities
Shareholders are mandated to appoint the Board of Directors and external auditors. They therefore hold the Board of Directors responsible and accountable for effective corporate governance.
Board of Directors
The Board is ultimately and collectively responsible to the Shareholders of the Company for its performance, strategic direction and provides the leadership necessary for the Company to meet its performance. The Implementation of the dfcu Board approved strategy is delegated to management.
The Board which is comprised of multi-skilled directors, is the ultimate decision-making body of the Company, except in those matters reserved for the shareholders under the Companies Act and Articles of Association.
The Board is collectively responsible for the following, among others:
• protecting the interests of shareholders and other stakeholders of the Company, and to take these into account in directing the affairs of the Company;
• determining the aims of the Company by providing input into and approving business plans, strategy, structures, policies and investments;
• ensuring achievement of the Company’s objectives;
dfcu ANNUAL REPORT AND FINANCIAL STATEMENTS 2020 dfcu ANNUAL REPORT AND FINANCIAL STATEMENTS 2020 6362
• providing oversight to and supervise management of the Company, operations and ensure the establishment of effective internal control systems; and
• ensuring that systems are established to ensure that the Company is managed with integrity and complies with all legal and regulatory requirements and that it conducts its business in accordance with high ethical standards;
The Board recognises that having a diverse range of skills, backgrounds and experience among its directors is important for robust decision-making and the effective governance of dfcu Group. The skills on the Board include Financial Services; Risk Management; Investment Banking; Assets and Liabilities; Fund Management; Marketing; Business Sustainability; Legal; and Technology, to mention but a few.
Appointment of Directors
In selecting directors, the Company seeks individuals who are of high integrity and with passion for the sectors the Company is involved with. Attention is given to the need to attract suitably qualified individuals with an appropriate balance of skills and exposure (both local and international) in various areas including financial, operations, risk management, digital and corporate governance, amongst others.
The appointment of directors is governed by the Company’s Memorandum and Articles of Association. Directors are appointed by shareholders in a General Meeting. The Board may fill casual vacancies on the Board and the directors are appointed at the next General Meeting. Such directors are required to retire and submit themselves for election at the next General Meeting. The General Meeting is availed with the required particulars about directors due for election to guide its decision. These particulars include the nominee director’s qualifications amongst others. Nominee directors must declare any conflicts of interest for due consideration. The Board members’ nominee identification and vetting process is conducted by the Board’s Nominations and Governance Committee.
Nominee directors of the subsidiary, dfcu Bank, are appointed through a similar process as outlined above, but in addition, are required by law to be cleared by the Central Bank which conducts a rigorous vetting process including a “fit and proper test” prior to issuance of its no objection to the appointment.
As at 31st December 2020, the Board of Directors of dfcu Limited comprised six (6) non-executive directors including the Chairman.
Director Skills and Experience
Mr. Elly Karuhanga Non-Executive Chairman
Advocate by Training and Founding Partner of Kampala Associated Advocates.
Founder, President and Chairman of the Governing Council of the Centre for Arbitration and Alternative Dispute Resolution.
He is the Chairman of BAT and the Uganda Chamber of Mines and Petroleum Practice.
He is also a director at the Private Sector Foundation.
Mr. Kironde LuleChairman- Audit and Risk Committee
A Chartered Accountant with over 30 years’ experience in financial management and auditing.
He is a fellow of the Institute of Chartered Accountants in England and Wales and a member of the American Institute of Certified Public Accountants.
He was a Finance Director in the Aga Khan Foundation (USA), ICF (Tanzania); Director Financial Reporting in the Global Fund for Vaccines (USA).
He served as the Commissioner Internal Audit -Uganda Revenue Authority
He was an Audit Partner in Deloitte & Touche (Swaziland & Cote d’Ivoire).
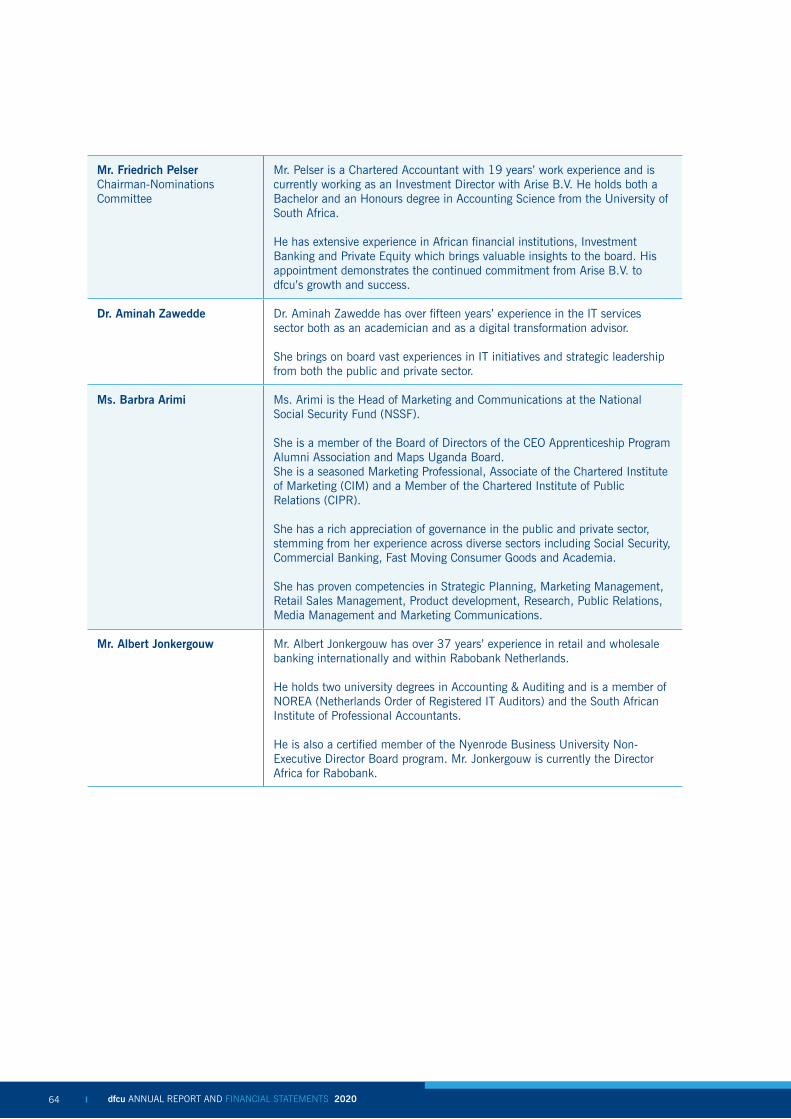
dfcu ANNUAL REPORT AND FINANCIAL STATEMENTS 2020 dfcu ANNUAL REPORT AND FINANCIAL STATEMENTS 2020 6564
Mr. Friedrich Pelser Chairman-Nominations Committee
Mr. Pelser is a Chartered Accountant with 19 years’ work experience and is currently working as an Investment Director with Arise B.V. He holds both a Bachelor and an Honours degree in Accounting Science from the University of South Africa.
He has extensive experience in African financial institutions, Investment Banking and Private Equity which brings valuable insights to the board. His appointment demonstrates the continued commitment from Arise B.V. to dfcu’s growth and success.
Dr. Aminah Zawedde Dr. Aminah Zawedde has over fifteen years’ experience in the IT services sector both as an academician and as a digital transformation advisor.
She brings on board vast experiences in IT initiatives and strategic leadership from both the public and private sector.
Ms. Barbra Arimi Ms. Arimi is the Head of Marketing and Communications at the National Social Security Fund (NSSF).
She is a member of the Board of Directors of the CEO Apprenticeship Program Alumni Association and Maps Uganda Board. She is a seasoned Marketing Professional, Associate of the Chartered Institute of Marketing (CIM) and a Member of the Chartered Institute of Public Relations (CIPR).
She has a rich appreciation of governance in the public and private sector, stemming from her experience across diverse sectors including Social Security, Commercial Banking, Fast Moving Consumer Goods and Academia.
She has proven competencies in Strategic Planning, Marketing Management, Retail Sales Management, Product development, Research, Public Relations, Media Management and Marketing Communications.
Mr. Albert Jonkergouw Mr. Albert Jonkergouw has over 37 years’ experience in retail and wholesale banking internationally and within Rabobank Netherlands.
He holds two university degrees in Accounting & Auditing and is a member of NOREA (Netherlands Order of Registered IT Auditors) and the South African Institute of Professional Accountants.
He is also a certified member of the Nyenrode Business University Non-Executive Director Board program. Mr. Jonkergouw is currently the Director Africa for Rabobank.

dfcu ANNUAL REPORT AND FINANCIAL STATEMENTS 2020 dfcu ANNUAL REPORT AND FINANCIAL STATEMENTS 2020 6564
On the other hand, as at 31st December 2020, dfcu Bank Limited, which is a fully owned subsidiary of dfcu Limited had ten (10) directors, eight (8) of whom are non-executive directors and two (2) are executive directors.
Director Skills and Experience
Mr. Jimmy Douglas Mugerwa Non-Executive Chairman
An Engineer with over 20 years of senior business leadership positions in the energy sector across Africa and Europe, leading teams, managing complex projects and building relationships with senior political and government leaders and tapping into the networks of African opinion leaders.
He has served in various capacities in Tullow Oil Plc.
He previously held various roles in Royal Dutch Shell, Plc.
He is an experienced Independent Non-Executive Director and Chair serving on boards in the Financial, FMCG and Oil Gas industry.
Mr. Albert Jonkergouw Chairman Business Development Committee and Acting Chairman Nominations and Governance Committee
Mr. Albert Jonkergouw has over 37 years’ experience in retail and wholesale banking internationally and within Rabobank Netherlands.
He holds two university degrees in Accounting & Auditing and is a member of NOREA (Netherlands Order of Registered IT Auditors) and the South African Institute of Professional Accountants.
He is also a certified member of the Nyenrode Business University Non-Executive Director Board program. Mr. Jonkergouw is currently the Director Africa for Rabobank.
Mr. Willem Cramer Chairman-Risk and Credit Committee
Has Banking experience of over 30 years.
Has served as director on various boards, such as:
a. Board Chairman, PC Hooft Group Amsterdamb. Chief Executive Officer, ASR Bank NV Utrecht.c. Chairman (Non-Executive), Doefonds Fryslan BV Leeuwarden d. NED, GarantiBank International BV, Amsterdam d. Member of Supervisory Board, Chair of Audit Committee, Unicef e. Netherlands National Committee Voorburg.f. Chairman Advisory Board, Credit Passport Foundation.
Mr. Stephen John Caley Chairman Audit Committee
Over 49 years of banking experience.
Has served in various capacities for various banks across Africa and Europe such as, Letshego Holdings Ltd, Khan Bank LLC Mongolia, Fina Bank sa Rwanda, NIC Bank Kenya.
Previous directorships include Stanbic Bank Nigeria, Stanchart Bank Botswana.
He is a member of the Institute for Financial Services.

dfcu ANNUAL REPORT AND FINANCIAL STATEMENTS 2020 dfcu ANNUAL REPORT AND FINANCIAL STATEMENTS 2020 6766
Dr. Winifred Mary Tarinyeba Kiryabwire – Chairperson Remunerations Committee
An experienced lawyer with over 20 years’ experience.
Has experience in capital markets, securities regulation and corporate governance.
Has served in various capacities as Associate Professor of Law - Makerere University, Manager Legal Policy and Compliance, Capital Markets Authority among others.
Has undertaken various consultancy entailing advisory work in regard to corporate governance, company law, capital markets, securities.
Has held directorships on several boards; International Ethics Standards Board for Accountants (IESBA), Financial Sector Deepening Uganda, Mbarara University of Science & Technology, dfcu Limited, Gatsby Microfinance Limited.
Ms. Grace Tibihikirra Makoko – Chairperson Assets and Liabilities Committee
Over 20 years in the banking industry in East African Region.
Has held various positions in Centenary Bank Uganda, Standard Chartered Bank Kenya, Standard Chartered Bank Uganda.
Has experience in Global and Financial markets.
Ms. Jackie Aneno Obol-Ochola An Engineer with over 20 years of senior business leadership positions in the telecommunications sector in Uganda.
He has served in various capacities in Uganda Telecom, Nokia Telecom, Alcatel Telecom and currently as the country Manager C Squared Telecom.
Mr. Øivind Solvang Over 40 years’ experience in the Banking and Finance industry.
Has served on various boards such as Tabular Management, Arise BV, Norfund Norway Investment, Kaupthing Bank Norway, Norwegian Ministry of Oil and Energy, Nordea Bank Norway.
Mr. Mathias Katamba An experienced Banker.
Has previously held various positions in Housing Finance Bank Ltd, Absa Bank Ltd and Pride Microfinance.
Current directorships include Uganda institute of Bankers, Central Broadcasting Services and UAP Old Mutual.
Mr. William Sekabembe An experienced Banker.
Has previously held various positions in Absa Bank Ltd and Stanbic Bank Limited.
Current directorships are Uganda Warehouse Receipt System Authority.

dfcu ANNUAL REPORT AND FINANCIAL STATEMENTS 2020 dfcu ANNUAL REPORT AND FINANCIAL STATEMENTS 2020 6766
The Directors who served on the dfcu Limited Board during the year under review are listed on page 19 whilst those who served on the Board of dfcu Bank are listed on page 20
Changes in the Board Membership:
We have welcomed new Directors and said farewell to long-serving Directors within dfcu over the year:
Director Resignations:
1. Mr. Micheal Turner resigned from the Board of dfcu Limited on 01st July 2020.
The shareholders, directors, management and staff of dfcu Limited thank the above director for the contribution made towards the Company.
2. Mr. Michael Turner, a Non-Executive Director resigned from the Board of dfcu Bank Limited with effect from 30th June 2020.
The shareholders, directors, management and staff of dfcu Bank Limited thank Mr. Turner for the contribution made towards the Company.
Director Appointments:
1. On 25th August 2020, the Shareholders of dfcu Limited appointed Dr. Aminah Zawedde as a Non-Executive Director of the Company. She had been previously appointed by the Board of Directors dfcu Limited to fill a casual vacancy.
2. The Board of Directors of dfcu Bank appointed Ms. Jackie Aneno Obol-Ochola as a Non-Executive Director on 28th October 2020 to fill the vacancy following the retirement of Mr. Michael Turner.
Board Meetings
The Board is mandated to steer the Company on behalf of the Shareholders by overseeing the administration and proper organisation of operations. The Board retains certain matters for its own preserve; other specific responsibilities are delegated to its principal Committees, namely the Audit Committee and the Nominations and Governance Committee. Each of these Committees operates within defined terms of reference. The Chair of each Committee reports to the Board on its proceedings.
The Board convenes according to a pre-determined schedule, or whenever it deems it necessary. The Board has an annual programme of meetings to monitor and review the Company’s strategy. The strategic priorities for 2021 are highlighted in the Chairman’s Statement.
The Board meets routinely as provided for in the Company’s Articles of Association. To facilitate efficient decision making, Senior Management and third-party professionals may be in attendance on a need basis. As a matter of course, all directors are required to declare any conflicts of interest prior to the commencement of each meeting for due consideration, if any.
The Board meetings are held on a quarterly basis. During the year of review, the Board of directors of dfcu Limited and its subsidiary dfcu Bank Limited held four mandatory meetings during the year. The Board meetings follow a pre-agreed calendar. In addition to the four mandatory meetings, the Board also held other special meetings.
The Board comprised the following persons, whose attendance of meetings during the year 2020 was as follows:

dfcu ANNUAL REPORT AND FINANCIAL STATEMENTS 2020 dfcu ANNUAL REPORT AND FINANCIAL STATEMENTS 2020 6968
(a) dfcu Limited
Name 26th March 01st July 14th September 11th December
Mr. Elly Karuhanga (Chairperson) √ √ √ √
Mr. Friedrich Pelser √ √ √ √
Mr. Michael Turner √ √ N N
Mr. Kironde Lule √ √ √ √
Mr. Albert Jonkergouw √ √ √ √
Dr. Aminah Zawedde x x √ √
Ms. Arimi Barbra Teddy √ √ √ √
N- Ceased to be a Board member X- Was not yet appointed as a member of the Board of Directors
(b) dfcu Bank Limited
Name 26th March 7th July 11th September 15th December
Mr. Jimmy Douglas Mugerwa (Chairperson)
√ √ √ √
Mr. Michael Turner √ √ N N
Mr. Albert Jonkergouw √ √ √ √
Mr. Willem Cramer √ √ √ √
Mr. Stephen John Caley √ √ √ √
Mr. Øivind Solvang √ √ √ √
Dr. Winifred Mary Tarinyeba Kiryabwire √ √ √ √
Ms. Grace Tibihikirra Makoko √ √ √ √
Ms. Jackie Aneno Obol-Ochola X X X √
Mr. Mathias Katamba √ √ √ √
Mr. William Sekabembe √ √ √ √
N- Ceased to be a Board member X- Was not yet appointed as a member of the Board of Directors
Board Committees
To give more detailed attention to key aspects of the Company business, the Board delegates some of its functions to Committees that subsequently avail feedback on the deliberations held. Each Board committee has terms of reference that define its roles and responsibilities. There is clear communication between the Board and the Committees.
The Directors’ attendance of Board Committee Meetings for the year 2020 was as follows: a) dfcu Limited
The Company has only two committees due to its nature as a holding company. The Board of Directors of dfcu Limited delegated some of its roles to the Audit Committee and the Nominations and Governance Committee. All matters other than the ones attended to by the Committees are discussed at the full Board.
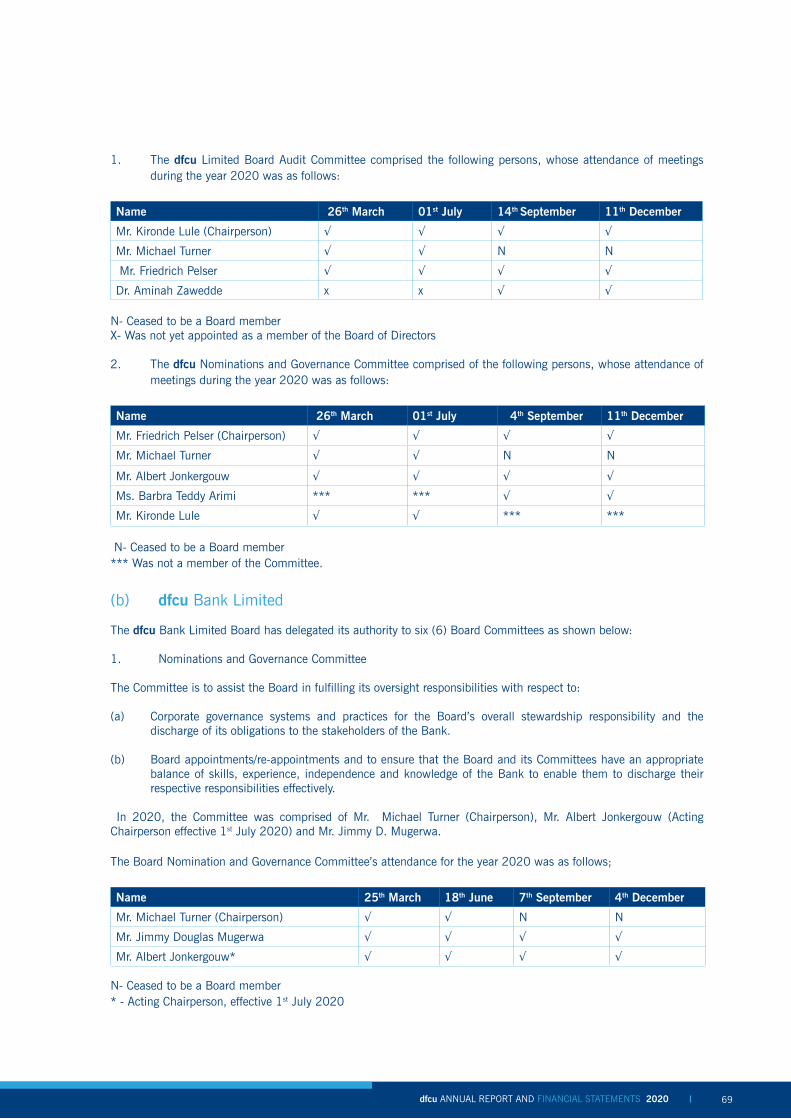
dfcu ANNUAL REPORT AND FINANCIAL STATEMENTS 2020 dfcu ANNUAL REPORT AND FINANCIAL STATEMENTS 2020 6968
1. The dfcu Limited Board Audit Committee comprised the following persons, whose attendance of meetings during the year 2020 was as follows:
Name 26th March 01st July 14th September 11th December
Mr. Kironde Lule (Chairperson) √ √ √ √
Mr. Michael Turner √ √ N N
Mr. Friedrich Pelser √ √ √ √
Dr. Aminah Zawedde x x √ √
N- Ceased to be a Board member X- Was not yet appointed as a member of the Board of Directors
2. The dfcu Nominations and Governance Committee comprised of the following persons, whose attendance of meetings during the year 2020 was as follows:
Name 26th March 01st July 14th September 11th December
Mr. Friedrich Pelser (Chairperson) √ √ √ √
Mr. Michael Turner √ √ N N
Mr. Albert Jonkergouw √ √ √ √
Ms. Barbra Teddy Arimi *** *** √ √
Mr. Kironde Lule √ √ *** *** N- Ceased to be a Board member*** Was not a member of the Committee.
(b) dfcu Bank Limited
The dfcu Bank Limited Board has delegated its authority to six (6) Board Committees as shown below:
1. Nominations and Governance Committee
The Committee is to assist the Board in fulfilling its oversight responsibilities with respect to:
(a) Corporate governance systems and practices for the Board’s overall stewardship responsibility and the discharge of its obligations to the stakeholders of the Bank.
(b) Board appointments/re-appointments and to ensure that the Board and its Committees have an appropriate balance of skills, experience, independence and knowledge of the Bank to enable them to discharge their respective responsibilities effectively.
In 2020, the Committee was comprised of Mr. Michael Turner (Chairperson), Mr. Albert Jonkergouw (Acting Chairperson effective 1st July 2020) and Mr. Jimmy D. Mugerwa.
The Board Nomination and Governance Committee’s attendance for the year 2020 was as follows;
Name 25th March 18th June 7th September 4th December
Mr. Michael Turner (Chairperson) √ √ N N
Mr. Jimmy Douglas Mugerwa √ √ √ √
Mr. Albert Jonkergouw* √ √ √ √ N- Ceased to be a Board member* - Acting Chairperson, effective 1st July 2020

dfcu ANNUAL REPORT AND FINANCIAL STATEMENTS 2020 dfcu ANNUAL REPORT AND FINANCIAL STATEMENTS 2020 7170
2. Board Audit Committee
The Committee is constituted as a statutory committee of the Bank to assist the Board in fulfilling its oversight responsibilities with respect to the effectiveness of the internal and external audit functions, internal controls, operating procedures and systems, management information systems, financial reporting, general operations of the Bank and practices in relation to insider transactions.
The Committee members for the year 2020 were Mr. Stephen John Caley (Chairperson), Mr. Michael Turner and Dr. Winifred Tarinyeba Kiryabwire and their attendance was as follows;
Name 24th March 30th June 3rd September 1st December
Mr. Steve Caley (Chairperson) √ √ √ √
Mr. Michael Turner √ √ N N
Dr. Winifred Mary Tarinyeba Kiryabwire √ √ √ √
N- Ceased to be a Board member
3. Board Risk and Credit Committee
The purpose of the Committee is to assist the Board in fulfilling its oversight responsibilities with respect to:a) The identification, measurement, monitoring and treatment of key risks within the Bank so as to ensure that
they support the Bank’s business strategy.
b) The establishment of the Bank’s credit policies and process and to ensure that the same are effective, efficient, and aligned to best practice in order to support business growth but at the same time ensure that credit risks are effectively managed.
The Committee members for the year 2020 were Mr. Willem Cramer (Chairperson), Mr. Stephen John Caley, Mr. Øivind Solvang and Dr. Winifred Mary Tarinyeba Kiryabwire.
The Board Risk and Credit Committee’s attendance for the year 2020 was as follows:
Name 25th March 24th June 4th September 2nd December
Mr. Willem Cramer (Chairperson) √ √ √ √
Mr. Stephen John Caley √ √ √ √
Dr. Winifred Mary Tarinyeba Kiryabwire √ √ √ √
Øivind Solvang √ √ √ √
4. Board Remuneration Committee
The purpose of the Committee is to assist the Board in fulfilling its oversight responsibilities with respect to human capital, and more specifically to provide oversight over the human capital affairs of the Bank so as to ensure that the Bank has in place an optimal organisational structure and appropriate policies to attract, retain and motivate staff needed to run the business successfully while at the same time retaining equity in the management of such staff.
The Committee’s members for the year 2020 were Dr. Winifred Mary Tarinyeba Kiryabwire (Chairperson), Mr. Michael Turner and Mr. Stephen John Caley.

dfcu ANNUAL REPORT AND FINANCIAL STATEMENTS 2020 dfcu ANNUAL REPORT AND FINANCIAL STATEMENTS 2020 7170
The Board Remuneration Committee’s attendance for the year 2020 was as follows;
Name 24th March 22nd June 3rd September 26th November
Dr. Winifred Mary Tarinyeba Kiryabwire (Chairperson)
√ √ √ √
Mr. Michael Turner √ √ N N
Mr. Stephen John Caley √ √ √ √
N- Ceased to be a Board member
5. Board Assets and Liabilities Committee
The purpose of the Committee is to assist the Board in fulfilling its oversight responsibilities with respect to:
a) The establishment of effective asset and liability management policies for the Bank.b) The establishment of key business performance indicators for the Bank, regularly reviewing performance
against such indicators.c) Ensuring that the Board is fully aware of the framework of the Bank’s balance sheet structure by setting polices
and guidelines for the Bank’s tolerance for risk and expectation from investment.
The Committee members for the year 2020 were Ms. Grace Tibihikirra Makoko (Chairperson with effect from 26th November 2019), Mr. Willem Cramer, Dr. Winifred Mary Tarinyeba Kiryabwire, Mr. Albert Jonkergouw and Mr. Øivind Solvang.
The Board Assets and Liabilities Committee’s attendance for the year 2020 was as follows;
Name 25th March 24th June 1st September 2nd December
Ms. Grace Tibihikirra Makoko (Chairperson)
√ √ √ √
Mr. Willem Cramer √ √ √ √
Mr. Øivind Solvang √ √ √ √
Mr. Albert Jonkergouw √ √ √ √
6. Board Business Development Committee
1.1 The purpose of the Committee is to assist the Board in fulfilling its oversight responsibilities with respect to business development.
1.2 More specifically, the Committee shall;(a) Review proposals and oversee the development of new products and new lines of business and make appropriate
recommendations for the Board’s approval.(b) Support Management by advising on projected market developments and related customer needs in relation to
the Bank’s products / service portfolio and channel approach.
The Committee members for the year 2020 were Mr. Albert Jonkergouw (Chairperson with effect from 12th June 2019), Mr. Willem Cramer, Ms. Grace Tibihikirra Makoko.
The Board Business Development Committee’s attendance for the year 2020 was as follows;
Name 24th March 25th June 4th Sept 3rd Dec
Mr. Albert Jonkergouw (Chairperson) √ √ √ √
Mr. Willem Cramer √ √ √ √
Ms. Grace Tibihikirra Makoko √ √ A √ A-Absent with apology
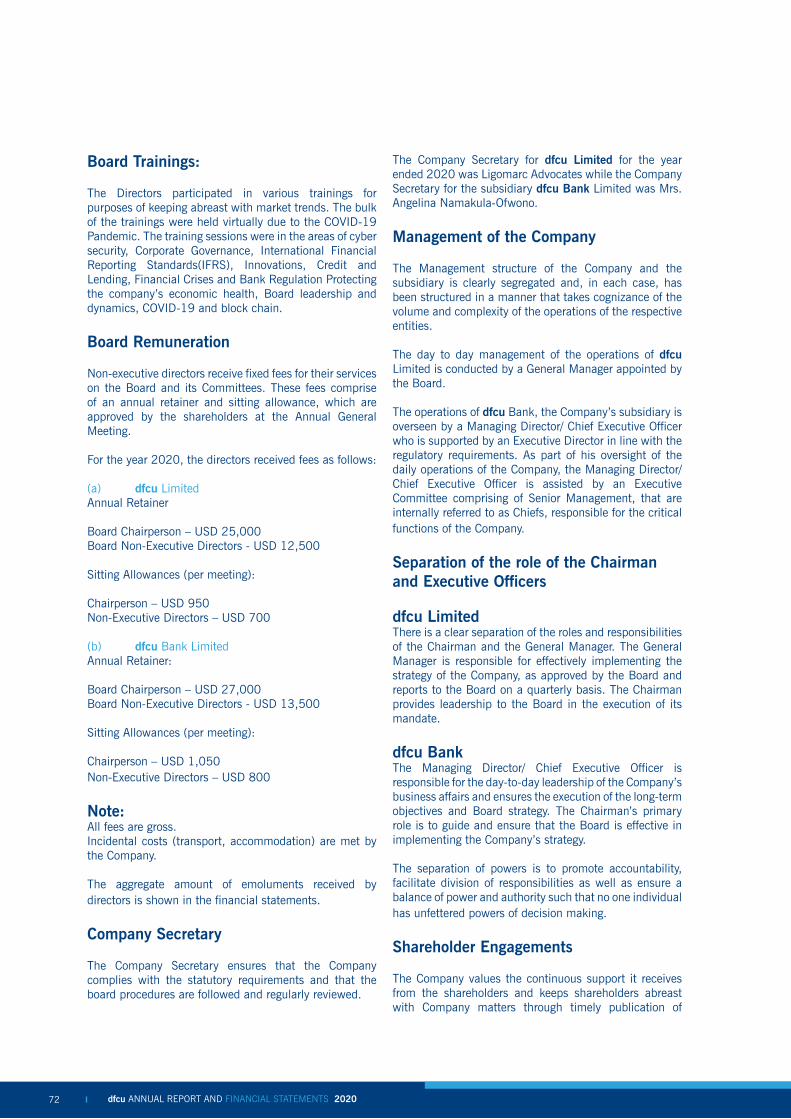
dfcu ANNUAL REPORT AND FINANCIAL STATEMENTS 2020 dfcu ANNUAL REPORT AND FINANCIAL STATEMENTS 2020 7372
Board Trainings:
The Directors participated in various trainings for purposes of keeping abreast with market trends. The bulk of the trainings were held virtually due to the COVID-19 Pandemic. The training sessions were in the areas of cyber security, Corporate Governance, International Financial Reporting Standards(IFRS), Innovations, Credit and Lending, Financial Crises and Bank Regulation Protecting the company’s economic health, Board leadership and dynamics, COVID-19 and block chain.
Board Remuneration
Non-executive directors receive fixed fees for their services on the Board and its Committees. These fees comprise of an annual retainer and sitting allowance, which are approved by the shareholders at the Annual General Meeting.
For the year 2020, the directors received fees as follows:
(a) dfcu LimitedAnnual Retainer
Board Chairperson – USD 25,000 Board Non-Executive Directors - USD 12,500
Sitting Allowances (per meeting):
Chairperson – USD 950Non-Executive Directors – USD 700
(b) dfcu Bank Limited Annual Retainer:
Board Chairperson – USD 27,000 Board Non-Executive Directors - USD 13,500
Sitting Allowances (per meeting):
Chairperson – USD 1,050Non-Executive Directors – USD 800
Note:All fees are gross.Incidental costs (transport, accommodation) are met by the Company.
The aggregate amount of emoluments received by directors is shown in the financial statements.
Company Secretary
The Company Secretary ensures that the Company complies with the statutory requirements and that the board procedures are followed and regularly reviewed.
The Company Secretary for dfcu Limited for the year ended 2020 was Ligomarc Advocates while the Company Secretary for the subsidiary dfcu Bank Limited was Mrs. Angelina Namakula-Ofwono.
Management of the Company
The Management structure of the Company and the subsidiary is clearly segregated and, in each case, has been structured in a manner that takes cognizance of the volume and complexity of the operations of the respective entities.
The day to day management of the operations of dfcu Limited is conducted by a General Manager appointed by the Board.
The operations of dfcu Bank, the Company’s subsidiary is overseen by a Managing Director/ Chief Executive Officer who is supported by an Executive Director in line with the regulatory requirements. As part of his oversight of the daily operations of the Company, the Managing Director/ Chief Executive Officer is assisted by an Executive Committee comprising of Senior Management, that are internally referred to as Chiefs, responsible for the critical functions of the Company.
Separation of the role of the Chairman and Executive Officers
dfcu LimitedThere is a clear separation of the roles and responsibilities of the Chairman and the General Manager. The General Manager is responsible for effectively implementing the strategy of the Company, as approved by the Board and reports to the Board on a quarterly basis. The Chairman provides leadership to the Board in the execution of its mandate.
dfcu BankThe Managing Director/ Chief Executive Officer is responsible for the day-to-day leadership of the Company’s business affairs and ensures the execution of the long-term objectives and Board strategy. The Chairman’s primary role is to guide and ensure that the Board is effective in implementing the Company’s strategy.
The separation of powers is to promote accountability, facilitate division of responsibilities as well as ensure a balance of power and authority such that no one individual has unfettered powers of decision making.
Shareholder Engagements
The Company values the continuous support it receives from the shareholders and keeps shareholders abreast with Company matters through timely publication of
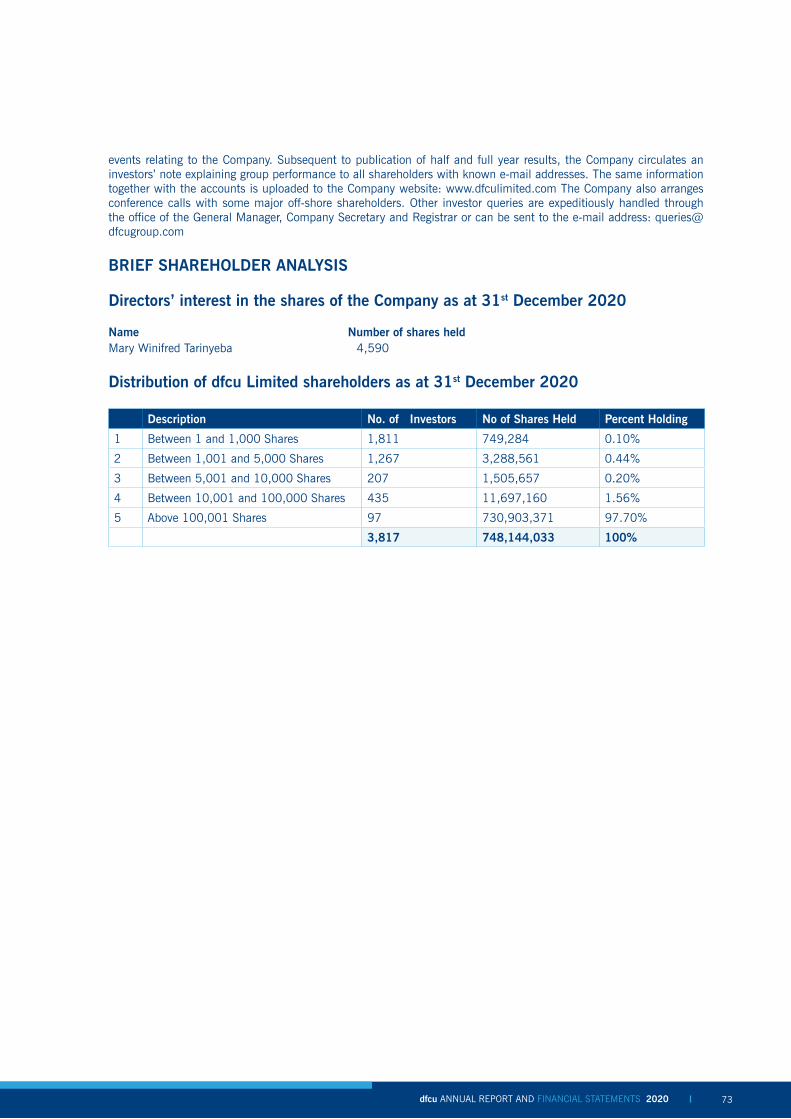
dfcu ANNUAL REPORT AND FINANCIAL STATEMENTS 2020 dfcu ANNUAL REPORT AND FINANCIAL STATEMENTS 2020 7372
events relating to the Company. Subsequent to publication of half and full year results, the Company circulates an investors’ note explaining group performance to all shareholders with known e-mail addresses. The same information together with the accounts is uploaded to the Company website: www.dfculimited.com The Company also arranges conference calls with some major off-shore shareholders. Other investor queries are expeditiously handled through the office of the General Manager, Company Secretary and Registrar or can be sent to the e-mail address: [email protected]
BRIEF SHAREHOLDER ANALYSIS
Directors’ interest in the shares of the Company as at 31st December 2020
Name Number of shares heldMary Winifred Tarinyeba 4,590
Distribution of dfcu Limited shareholders as at 31st December 2020
Description No. of Investors No of Shares Held Percent Holding
1 Between 1 and 1,000 Shares 1,811 749,284 0.10%
2 Between 1,001 and 5,000 Shares 1,267 3,288,561 0.44%
3 Between 5,001 and 10,000 Shares 207 1,505,657 0.20%
4 Between 10,001 and 100,000 Shares 435 11,697,160 1.56%
5 Above 100,001 Shares 97 730,903,371 97.70%
3,817 748,144,033 100%

dfcu ANNUAL REPORT AND FINANCIAL STATEMENTS 2020 dfcu ANNUAL REPORT AND FINANCIAL STATEMENTS 2020 7574
List of the 20 Largest Shareholders of dfcu Limited as at 31st December 2020
There were no changes in the twenty largest Shareholders of the Company during the year.
Investor Name Shares Held Percentage
1 ARISE B.V. 439,176,097 58.70%
2 SCB MAURITIUS A/C INVESTMENT FUND FOR DEVELOPING COUNTRIES 74,580,276 9.97%
3 NATIONAL SOCIAL SECURITY FUNDS 55,803,416 7.46%
4 KIMBERLITE FRONTIER AFRICA NASTER FUND, L.P.-RCKM 54,958,626 7.35%
5 SSB RUSSELL INVESTMENT COMPANY PLC FUND NAS5 14,428,700 1.93%
6 NATIONAL SOCIAL SECURITY FUND-PINEBRIDGE 10,440,437 1.40%
7 SSB-CONRAD N HILTON FOUNDATION -00FG 9,180,658 1.23%
8 VANDERBILT UNIVERSITY VANDERBILT UNIVERSITY 9,155,182 1.22%
9 THE JUBILEE INSUARANCE COMPANY OF UGANDA 7,296,339 0.98%
10 BANK OF UGANDA DEFINED BENEFITS SCHEME- GENEAFRICA 4,811,165 0.64%
11 BANK OF UGANDA STAFF RETIREMENT BENEFIT SCHEME AIG 4,481,491 0.60%
12 THE PARLIAMENTARY PENSION SCHEME-STANLIB 2,924,455 0.39%
13 UGANDA REVENUE AUTHORITY STAFF RETIREMENT BENEFITS 2,850,292 0.38%
14 CENTENARY BANK STAFF DEFINED CONTRIBUTION SCHEME 2,806,087 0.38%
15 MR. SUDHIR RUPARELIA 2,165,575 0.29%
16 MR RAKESH GADANI 1,977,748 0.26%
17 UAP INSURANCE UGANDA LTD 1,836,146 0.25%
18 HOUSING FINANCE BANK/ UAP INSURANCE- GEN LIFE FUND 1,557,256 0.21%
19 KEITH MUHAKANIZI 1,488,972 0.20%
20 BARCLAYS BANK UGANDA STAFF PENSION FUND 1,380,060 0.18%
703,298,978 94.01%
OTHER 3,797 SHAREHOLDERS 44,845,055 5.99%
TOTAL SHAREHOLDING 748,144,033 100.00%

dfcu ANNUAL REPORT AND FINANCIAL STATEMENTS 2020 dfcu ANNUAL REPORT AND FINANCIAL STATEMENTS 2020 7574
Director’s Report: Board Audit and Risk Committee ReportEnsuring the independence and effectiveness of the internal and external audit functions.
Introduction
This report is provided by the Audit and Risk Committee of dfcu Limited in respect of the year ended 31st December 2020. This Report takes into account the reports of the Audit Committee and Risk and Credit Committees of the subsidiary dfcu Bank. Each of the Committees operate under Terms of Reference approved by the Board. The Composition of the Committees has been indicated in the corporate governance statement.
(a) To review and monitor the integrity of the Company’s interim and annual financial statements and any other formal announcements relating to the Company’s financial performance (and, if requested by the Board, any other price-sensitive public reports by the Company, or reports by the Company to regulators);
(b) To discuss and resolve any significant problems or reservations arising from the interim and final audits and any matters the External Auditors wish to discuss (in the absence of Management, where necessary).
(c) To report its views to the Board where, following its review, the Committee is not satisfied with any aspect of the proposed financial reporting by the Company.
(d) To review and approve the appointment of the external auditors annually.
(e) To review and assess the appropriateness of the Company’s policies procedures for handling ethics breaches and whistleblowing, including the mandate to conduct internal investigations.
The Board of the subsidiary; dfcu Bank (“the Bank”) also operates an Audit Committee which is separate from the Risk Committee. The Audit Committee and the Risk and Credit Committees are subject to the regulatory requirements stipulated by the Bank of Uganda.
Membership of the committee
The Committee is comprised of Non-Executive Directors, with membership designed to provide the breadth of financial expertise and commercial acumen it needs to
fulfil its responsibilities. Its members as a whole have recent and relevant experience of the banking and financial services sector, in addition to general management and commercial experience; and are financially literate. The Biographies of all the members of the Committee are available under the Corporate Governance Statement. The terms of reference of the Committee are reviewed biennially with no changes having been made for the year 2020.
Following the appointment of a new Director at the Annual General Meeting for the year ended 31st December 2019, the Committee welcomed a new member; Dr. Aminah Zawedde who replaced Mr. Micheal Turner on the committee.
In 2020, the Bank’s Board Audit Committee was comprised of two (2) independent non-executive directors, following the retirement of Mr. Michael Turner who was previously a member of the Committee. On the other hand, Board Risk and Credit Committee of the Bank was comprised of four (4) independent non-executive directors. The details of the directors are set out in the Annual report.
Other attendees
The attendees of the Committee include the designated heads of business, the group Chief Finance Officer and the external auditors. The Committee reserves the right to extend an invitation for the attendance of a meeting.
Key highlights for the year 2020
dfcu Limited
Some key considerations of the Committee for the year ended 31st December 2020 included;
Cash Flow Management
Following the COVID-19 pandemic, management of cash flows was a key consideration of the Committee. The cash flows of the Company include rental income, property management fees, insurance commissions and dividend from the subsidiary dfcu Bank. Bank of Uganda issued a directive to all financial institutions directing them not to issue dividends for the year. Furthermore, the pattern of payment of rental income by tenants was also affected by the impact on the tenants’ business. Management was therefore urged to ensure that cash flows of the Company were effectively managed and non-critical expenditure deferred without compromising the operations of the Company.

dfcu ANNUAL REPORT AND FINANCIAL STATEMENTS 2020 dfcu ANNUAL REPORT AND FINANCIAL STATEMENTS 2020 7776
Appointment of an External Auditor
Ernst and Young was appointed as the External Auditor of the Company for the year 2020 by the Shareholders at the previous Annual General Meeting. The assessment for the appointment of the Auditors was undertaken jointly by the Committees of the Company and the subsidiary, dfcu Bank.
Audit Plan for the year 2020
The Audit Plan for the year 2020 was key in considering the appointment of a new external auditor for the Company. The key audit focus areas for the audit exercise to be undertaken as approved by the Committee included:
a) Impairment of goodwill and dfcu Limited as a cash generating unit;
i) The carrying amount of UGX 629 Million being the net assets of dfcu Limited was more than its market capitalization of UGX 471 million. This necessitated a formal estimate of the recoverable amount of dfcu Limited as a cash generating unit.
ii) There was an amount of UGX 463 million included in the intangible assets relating to goodwill. The existence of goodwill in the Company’s statement of financial position triggers.
b) Fair valuation of the investment property; The investment property of the Company had a
carrying amount of UGX 45,086 million as at 30 June 2020. The long-term rental yields are accounted for as investment property, and this is measured at cost less accumulated depreciation. International Accounting Standard (IAS) 40 Investment Property requires that, investment property is measured using the cost model and the disclosure of its fair value. As such, management needs to determine the fair value of the investment property and ensure that these disclosure requirements are complied with and correctly reflected in the financial statements.
The findings and conclusions for the above aspects are detailed in the External Auditors Report for the year ended 31st December 2020.
Assessing external auditor effectiveness, objectivity and independence and non-audit services
The Board Audit Committee is responsible for assessing the effectiveness, objectivity and independence of the External auditor, Ernst and Young. This responsibility was discharged throughout the year at formal Committee meetings, and through discussions with key executives. In addition to the matters noted above, the Committee also approved the terms of the audit engagement letter and
associated fees, on behalf of the Board.
Compliance Assessment
A review was undertaken on the Audit Committee’s Terms of Reference. Continuous monitoring of the compliance requirements is undertaken to ensure compliance with the listing obligations of the Company.
dfcu Bank
The key considerations for the year 2020 for the Bank’s Board Audit Committee included the following;
a) Reviewed the Bank’s quarterly, half-yearly and annual financial statements.
c) Reviewed with both the external auditor and management, the audit approach and methodology applied to the external audit of the Bank and the Key Audit Matters included in the Auditor’s report.
a) Reviewed the quarterly updates on internal audit and the Management Systems Information report.
d) Reviewed the updates on resolution of issues raised from the external audit Management Letter, the external audit ICT systems audit, internal audit and the Bank of Uganda on-site examination.
e) Reviewed the quarterly litigation reports.f) Reviewed quarterly reports and updates on
compliance matters, including anti-bribery and whistleblowing matters.
g) Reviewed the quarterly Fraud and Investigations reports.
h) Reviewed the updated Audit Committee’s Terms of Reference.
i) Approved the internal audit plan for 2020.j) Reviewed the 2020 external audit fees.
It is important to note that since the year 2020 is recognized as having been a particularly challenging one given the restrictions placed on the business by the COVID-19 pandemic, physical visits to branches of the subsidiary were very difficult. This led to development of and reliance on remote audit techniques which will likely change future audit performance.
Areas of focus for the year 2021
dfcu Limited
The areas of focus for dfcu Limited’s Board Audit Committee for the year 2021 are as follows;
a) Review of the Company’s quarterly, half-yearly and annual financial statements.
b) Review of the Cash flows;c) Review of the audit approach and methodology
applied to the external audit and the Key Audit Matters included in the Auditor’s report.

dfcu ANNUAL REPORT AND FINANCIAL STATEMENTS 2020 dfcu ANNUAL REPORT AND FINANCIAL STATEMENTS 2020 7776
The Committee is operating effectively and is constituted to provide an effective and appropriately broad level of challenge and oversight of the areas within its remit. In 2021, the Committee will continue to monitor the key International Financial Reporting Standard (IFRS) 9 processes, particularly in light of the development of the COVID-19 pandemic, the uncertain economic environment and related impact upon the Group.
dfcu Bank
In the early part of the year 2021, the Head of Internal Audit tendered in his resignation, which was accepted, and he left the Bank in mid-April. In addition to the issues highlighted below, the committee members have been active in interviewing (remotely) and appointing a replacement resource following short listing of applicants by an external consultant.
a) Review of the structure of the internal audit function. Review and approval of the internal audit charter.b) Review of quarterly reports.c) Review of the Bank’s quarterly, half-yearly and annual financial statements.d) Continued performance review of the efficacy of both external and internal auditor performance and monitoring
of corrective actions taken.
Kironde LuleOn behalf of the Board Audit and Risk Committeedfcu Limited

dfcu ANNUAL REPORT AND FINANCIAL STATEMENTS 2020 dfcu ANNUAL REPORT AND FINANCIAL STATEMENTS 2020 7978
Director’s Report: Board Nominations and Governance Committee Report
Introduction
The Board of Directors of dfcu limited (“the Company”) and the Board of its subsidiary, dfcu Bank (“the Bank”) are empowered to delegate some of their functions to Committees in order to ensure that they execute their mandate effectively and efficiently.
The Nominations and Governance Committee of dfcu limited (“the Company’s Nominations Committee”) is responsible for proposing new nominees for the Board and for assessing the performance and effectiveness of Directors to perform their role in the company. The Committee also offers oversight over any high-level governance matters affecting the operation of the Company or the performance of employees of the Company. Balancing decisions in a way that optimizes the Purpose of the Company requires a Board in which constructive challenge, openness and diversity of background and opinion are prized, along with a commitment to act fairly and in the interests of all stakeholders.
The Nominations and Governance Committee of dfcu Bank (the “Bank’s Nominations Committee”) assists the Board in fulfilling its oversight responsibilities with respect to:
(a) Corporate governance systems and practices for the Board’s overall stewardship responsibility and the discharge of its obligations to the stakeholders of the Bank.
(b) Board appointments/re-appointments and to ensure that the Board and its Committees have an appropriate balance of skills, experience, independence and knowledge of the Bank to enable them to discharge their respective responsibilities effectively.
Membership of the committee
The Nominations Committee of both dfcu Limited and dfcu Bank are currently comprised of non-executive Directors. The Biographies of all the members of the Committee are available under the Corporate Governance Statement.
It is important to note that in order to maintain impartiality and transparency, no Director attends any discussion in regard to their own appointment.
Key Highlights for the year 2020
Below we highlight some key considerations of the Committee both in the Company and its subsidiary for the year ended 31st December 2020;
Succession Planning
One of the key responsibilities of the Committee is to establish an adequate succession plan for both the Board of Directors for the Company and its subsidiaries and key executive staff. One of the main considerations in the course of the year was updating of the succession plan in respect to various Director positions.
The Company’s Nominations Committee considered a number of viable candidates for the positions who would ably fit into the dynamics of the Company and more importantly bring on a valuable skill set to the Board of Directors. Succession Planning is an ongoing consideration for the Committee which ensures that a versatile succession plan is always in place.
Upon her appointment as a director of the

dfcu ANNUAL REPORT AND FINANCIAL STATEMENTS 2020 dfcu ANNUAL REPORT AND FINANCIAL STATEMENTS 2020 7978
Company, an induction was undertaken for Dr Aminah Zawedde in order to enable her appreciate her new role as a member of the Board of Directors and give her a better understanding of the Company.
Furthermore, the Committee handled the appointment of Dr. James Ssemwanga as a Director to Agri Business Development Centre Limited (ADC), a Corporate Social Responsibility entity of the Company. This was successfully accomplished and a viable Director appointed to represent dfcu limited on the Board of Directors of ADC.
Notably, the Bank’s Nominations Committee also ensured that the newly appointed Director, Ms. Jackie Ochola was inducted to support her in her role as a member of the Board.
Remuneration
The Company’s Nominations Committee considered the remuneration of executive staff members of the Company. The goal of the Committee is to ensure reward of good performance and market alignment with respect to remuneration scales. The Committee considered bonus payments for specific staff in line with their performance and the diligence with which the staff served the mission of the Company.
The renewal of the contract of the General Manager of dfcu limited was also considered. The Company’s Nominations Committee critically considered the performance against the Key Performance Indicators agreed upon with the General Manager.
Diversity
The Bank’s Nominations Committee developed a Board Diversity Policy. The Policy sets the direction and approves the processes for the Company to attain the appropriate balance of knowledge, skills, experience, diversity and independence on the Board, to enable the Board to discharge its governance roles and responsibilities. It ensures an appropriate level of diversity on the Board, through the promotion of diversity across a variety of attributes relevant to promoting better decision making and effective governance.
Evaluation
We also note that in 2020, the Bank’s Nominations Committee ensured that the Board annual review and assessment of the performance of the Board as a whole, the Chairman, the Individual Directors, the Chief Executive Officer/ Managing Director, the Executive Director, the Company Secretary and Board Committees was conducted. The specific areas for improvement were identified, discussed by the Board and an action plan was developed. The Committee continues to monitor the implementation plan of the agreed actions aimed at enhancing the effectiveness of the Board.
The Board Evaluation for dfcu Limited is scheduled to take place in 2021.
Training and Development
Opportunities for in-person Director training were more limited in 2020 as a result of social distancing guidelines. Therefore, the Board and management focused on the response to the COVID-19 pandemic. However, some of the Directors in the Board of dfcu Bank attended training sessions in areas of as cyber security, Corporate Governance, International Financial Reporting Standards(IFRS), Innovations, Credit and Lending, Financial Crises and Bank Regulation Protecting the company’s economic health, Board leadership and dynamics, COVID and block chain.
Areas of focus for the year 2021
The areas of focus for the year 2021 for the Company’s Nominations Committee are as follows;
The enhancement of the succession Plan is key for the Committee in 2021 for both the Board and Management. The plan will take into account current and future business needs, balance of skills, experience and effectiveness.
Effective succession planning should take into account contingency planning (for any unforeseen departures or unexpected absences), medium-term planning (orderly refreshing of the Board, Committees and the ExCo) and long-term planning (looking ahead to the skills that may be required on the Board and the ExCo in the future).
dfcu ANNUAL REPORT AND FINANCIAL STATEMENTS 2020 dfcu ANNUAL REPORT AND FINANCIAL STATEMENTS 2020 8180
The areas of focus in 2021 for the Bank’s Nominations Committee are as follows;
Succession planning for the Board and Management, taking into account the company’s strategic priorities and the main trends and factors affecting the long-term success and future viability of the company.
Board training to ensure that Board members remain up-skilled in view of the changing business environment, to enhance governance practices within the Board itself and in the interest of the company.
Adoption and roll out of the Bank’s Code of Business Conduct and Ethics to provide guidance on how dfcu bank’s values and behaviour are put into practice, as well as management of ethical issues and the promotion of an ethical culture within the Company.
Friedrich PelserOn behalf of the Nominations and Governance Committeedfcu Limited

dfcu ANNUAL REPORT AND FINANCIAL STATEMENTS 2020 dfcu ANNUAL REPORT AND FINANCIAL STATEMENTS 2020 8180
Sust
aina
bilit
y R
epor
tReport ScopeThis report covers the economic, social and environmental performance of dfcu Group for the year ended 31 December 2020. In reporting both financial and non-financial matters, we have acted in compliance with the provisions stipulated by the Central Bank of Uganda, International Financial Reporting Standards, the Companies Act Cap 110 and the Listing Rules of Uganda Securities Exchange (USE). The report also adopts the Global Reporting Initiative (GRI) Guidelines, version G4 and the GRI’s G4 Financial Services Sector Supplement for sustainability reporting
InclusivityIn preparing this report, we considered key aspirations and concerns discovered through our structured stakeholder engagements, in our day-to-day interactions and from the community at large. It reviews dfcu Group’s direct impact on sustainability, as well as Corporate Social Responsibility (CSR) initiatives undertaken, which are designed to foster greater prosperity in the communities where we operate and to promote a healthier natural environment.
Report content and MaterialityIn drawing up content for this report, we have examined the topics that could have a material impact on our business, including risks, opportunities, regulations and sector trends. As a Group involved in the banking business, we recognise that we have a direct economic, social and environmental impact, but also a significant indirect impact through our lending and investment activities. dfcu Group’s non-financial data reporting protocol describes key performance indicators related to our material topics. We report data on these and other relevant key performance indicators in the value creation model section below. We continuously listen to our stakeholders and adapt our strategy and reporting to meet their evolving expectations. As part of our materiality analysis in 2019, we consulted key stakeholder groups - retail customers, business clients, investors, financial regulators, employees and senior management – in a qualitative and quantitative engagement process. The results of our materiality analysis were used to define the content of this report.
Reporting Cycledfcu Group’s sustainability footprints have been published in our Annual Reports since 2014. The Annual Report is published within the time frames stipulated by the Group’s Articles of Association, the Companies Act Cap 110, and the Listing Rules of Uganda Securities Exchange.

dfcu ANNUAL REPORT AND FINANCIAL STATEMENTS 2020 dfcu ANNUAL REPORT AND FINANCIAL STATEMENTS 2020 8382
Report Quality
We take every effort to ensure that our corporate reporting meets widely accepted quality criteria, including:
We include key material sustainability efforts within and under the direct control of Statutory regulations, impacts outside the organization that are indirectly influenced through our engagement with stakeholders; and broader sustainability initiatives undertaken through the CSR programs and other groups.
We provide results from both current and previous reporting periods.
Our information-gathering process includes verification by internal authorities and external assurance providers.
We provide both quantitative and qualitative information accompanied by tables and graphs where appropriate.
We report all relevant information; nothing is withheld.
We seek external confirmation from reputed assurance providers.
Completeness
Comparability
Clarity
Accuracy and Consistency
Balance
Credibility and Reliability
Precautionary Approach
dfcu Group manages the social and environmental impressions of its products and services through the Credit Bureau department and channels new product developments through the Products and Pricing Committee. The Group also manages the social and environmental impacts in the supply chain through the supplier selection and evaluation process. The process includes a technical review which encompasses social and environmental aspects.
Assurance We value the accuracy and reliability of all information and data in this report, both financial and non-financial. Therefore, assurance for the non-financial information in this report is drawn from published material from our regulators. Ernst and Young audited the financial statements of dfcu Group for the year 2020 (2019 financial statements were audited by KPMG).

dfcu ANNUAL REPORT AND FINANCIAL STATEMENTS 2020 dfcu ANNUAL REPORT AND FINANCIAL STATEMENTS 2020 8382
Sustainability highlights
Year 2020 2019
Shareholders and investors
Profit after tax Shs M 24,077 73,402
Return on equity % 4 13
Return on assets % 1 2
Earnings per share Shs per share 32.18 98.11
Proposed dividends Shs per share 17.38 -
Customers
Number of customers 1,022,200 1,000,000
Number of branches 58 63
Number of ATMs 100 100
Number of Agents 1,390 1009
Suppliers
Total procurement spend Shs Million 132,521 149,111
% of procurement spend with local suppliers % 89 86
Employees
Number of employees 1,034 1,078
Number of female employees 536 556
Training spend Shs Million 479 1,045
Society and Communities
Donations and CSR spend Shs Million 741 238
Environmental, Social and Governance (ESG) Sustainability
i. Policies, Codes and laws
dfcu Group strives to conduct its business in a responsible and sustainable manner both directly in its own business activities and indirectly through the financing it provides. The Group has developed an Environmental, Social and Governance Framework that forms part of its guiding principles. The dfcu ESG Framework provides an ESG Strategy articulating the Group’s position on Environmental, Social and Governance issues, policies, and Procedures. It guides the identification, assessment, management, and monitoring of ESG risks within all relevant activities of dfcu.
The Group adheres to applicable laws and regulations in Uganda and is further committed to adopting the United Nations Environment Programme (UNEP-FI) Finance Initiative codes, standards and guidelines and industrial best practice. dfcu Group recognizes that the significant milestones of the Paris Agreement on Climate Change and the ratification of the Sustainable Development Goals (SDGs) mean that every country and business sector have a role to play in the transition to a low-carbon economy. Therefore, dfcu Group is committed to working towards contributing to these goals through its core business activities (indirect footprint) and operations (direct footprint).

dfcu ANNUAL REPORT AND FINANCIAL STATEMENTS 2020 dfcu ANNUAL REPORT AND FINANCIAL STATEMENTS 2020 8584
ii. Objectives of the ESG Framework
The specific objectives of the ESG Framework are to:
• Establish the relevant business areas to which the ESG policy is applicable.
• Establish clear policies and procedures for identification, assessment, approval, monitoring and reporting of ESG risks within all such relevant business areas.
• Specify appropriate roles and responsibilities for managing and monitoring ESG risks.
• Ensure that ESG issues in relevant business areas are promptly identified and a management system is in place to assess and review such risks as well as advise client facing business units on how to work with clients to potentially mitigate the risks and identify opportunities for business.
• Determine the training and capacity building resources required to successfully implement the provisions of the ESG Framework.
• Provide practical resource materials for implementing the ESG Framework.
iii. dfcu ESG Strategy
At dfcu Group, we believe that finance should not only deliver a return to our shareholders but should also be socially relevant and environmentally responsible. This means that we take a “do no harm” approach in our financing decisions, but beyond that, where possible, we will also prioritize opportunities to create local benefits and revitalize communities. Consequently, we will take steps to ensure that our financing decisions take relevant ESG considerations into account.
Additionally, we understand that navigating ESG issues is a complex and evolving agenda and that clients will have different levels of experience and capacity needs. We are strongly supportive of building capacity in clients who demonstrate a strong commitment to managing ESG issues from the outset. In doing so, dfcu Group is better positioned to partner with clients and create a more resilient credit portfolio and value for all stakeholders.
The Group is committed to supporting specific and dedicated environmentally friendly financial investments and strategies including;
• Green investments relating to environmental goods and services that prevent or reduce any form of environmental degradation while conserving and maintaining natural resources.
• Investments relating to social good such as education, health care, infrastructure, waste management, housing, gender equality, financial inclusion and employment creation. The bank further supports strategies to reduce poverty, advance women and youth empowerment, drive development of rural areas, and grow small to medium enterprises.
• Public policies that support the green transformation of the economy (such as feed-in-tariffs for renewable energies) and clean water.
• Financial system components that protect the environment by utilising financial instruments such as green credit, green bonds, green stock indices, carbon finance, energy efficiency and related products.
The Health and Safety Policy
dfcu Group is committed to ensuring the safety of its operations to both workers and its customers. During the year, there were NIL fatal accidents (2019: NIL) to both dfcu workers and customers visiting dfcu premises. dfcu ensures that customers engage in activities that do not jeopardize the Health and Safety of their employees, taking into account the industrial sectors concerned. Businesses are encouraged to adopt appropriate Health & Safety measures and to comply with the national Employment laws.
Economic Sustainability
At dfcu Group, we always strive to honour the trust shareholders have placed in us by returning maximum value to them. At the same time, in our quest for sustainable growth, we work with a variety of stakeholders - including customers, employees and suppliers – to help them achieve their aspirations. We conduct the Group’s business in a transparent and ethical manner, managing risks and pursuing opportunities while adhering to the principles of good governance.
The Board of Directors guides dfcu Group’s approach to economic sustainability with a comprehensive corporate plan. This plan reflects the inputs of all key strategic business units – Personal and Business Banking (PBB), Development and Institutional Banking (DIB) and Global Financial Markets – as well as other support service units. The needs of each business unit are addressed in the annual budget, which is prepared according to a rolling five-year plan. Our detailed budgeting includes specific goals for each unit with resources allocated according to the Group’s overall strategic objectives.
The sections of this Annual Report devoted to ‘Corporate Governance’ and ‘Risk Management’ discuss in detail how we govern our business and manage risk, respectively.dfcu Group put in place various mechanisms to monitor progress towards goals set out in the Strategic Plan and Budget;
• Detailed management accounts, including key performance data, are submitted to the Board of Directors monthly with explanations of material variances. dfcu Group prepares interim and annual financial statements according to the requirements of the International Financial Reporting Standards (IFRS).
• There are quarterly board meetings at which the

dfcu ANNUAL REPORT AND FINANCIAL STATEMENTS 2020 dfcu ANNUAL REPORT AND FINANCIAL STATEMENTS 2020 8584
heads of the Group’s main strategic business units discuss recommended action plans to improve performance.
• The Board has established sub-committees which support them in their efforts and to ensure good governance. These committees are in turn backed by several other management committees headed by the Managing Director. The proceedings of these Board Committees are duly communicated to the Board. The composition of all Board Committees, their mandates and how each committee functions are disclosed in the section of Corporate Governance.
• An effective internal audit function covers entire scope of operations.
• Annual external audits of financial statements are conducted by reputable firms of chartered accountants. Other statutory audits are undertaken by Bank of Uganda.
Our economic impact:
dfcu Group recognises the role played by the private sector in the development of Uganda. As a business, we were able to contribute to the investments required to stimulate economic development and mitigate risks posed by global challenges. The value-added statement below shows the economic footprint of our operations in Uganda in 2020. It shows our impact on the economic conditions of our stakeholders and throughout society.
The most fundamental contribution of dfcu Group to the society in which we operate is maintaining a robust business. This allows us to pay dividends to our shareholders, salaries to our employees and tax to the Government of Uganda. As a buyer of goods and services, we play a role in supporting local businesses which provide employment and drives socioeconomic development in local communities. In addition, our corporate social responsibility activities make a measurable difference to recipients and communities that dfcu Group depends on to remain sustainable.
Credit concentration per sector
Credit by Sector 2020 2019 Trend
Agriculture 16% 22%
Manufacturing 9% 7%
Trade and Commerce 12% 17%
Communications and Transport 8% 3%
Building and Construction 17% 18%
Leisure, Hotels and Accommodation 4% 3%
Home Loans 3% 4%
Private Individual 9% 9%
Real Estate 14% 9%
Education 5% 5%
Other 1% 3%
Total 100% 100%

dfcu ANNUAL REPORT AND FINANCIAL STATEMENTS 2020 dfcu ANNUAL REPORT AND FINANCIAL STATEMENTS 2020 8786
Value Creation
Value added is calculated on the Group’s revenue performance minus payments such as cost of materials, depreciation, and amortization. The resulting amount is distributed to the stakeholders who include employees, shareholders, community
investments and government.
CapitalThe pool of funds – derived notably through shareholders’ equity as well as funding from investors and clients – that are used by dfcu Financial Group to underpin its operations and support business activities.
Human CapitalOur ability to invest in and leverage our people’s technical skills, competencies as well as their collective knowledge and motivation to innovate and develop customised solutions for clients.
Social and Relationship CapitalOur involvement in driving social progress and a thriving financial ecosystem by collaborating with relevant institutions and acting on relationships within and between communities as well as groups of stakeholders
Natural CapitalThe stocks of natural assets or renewable and non-renewable environmental resources, which are, directly or indirectly, impacted by our operations and business activities.
Intellectual CapitalOur knowledge-based intangibles–including our franchise and reputation, intellectual property and strategic partnerships–as well as ‘organisational capital’ such as tacit knowledge, procedures and protocols.
Manufactured CapitalThe operational paradigms, mechanisms and processes that provide a framework for our services delivery, including our physical infrastructure as well as our information technology and digital platforms.
Our relevance as a financial services provider today and in the future depends on our ability to apply forms of capital as inputs to achieve desired outputs and outcomes, for example, delivery of financial performance and sustainable value creation for our stakeholders.
We engage with our internal and external stakeholders in a systematic, coherent and meaningful manner, with a view to promptly respond to their needs/requirements.
Shareholders and investors
Customers
Societies and Communities
Authorities and economic agents
Employees

dfcu ANNUAL REPORT AND FINANCIAL STATEMENTS 2020 dfcu ANNUAL REPORT AND FINANCIAL STATEMENTS 2020 8786
Materiality and Material Matters
We apply the concept of materiality to evaluate and determine information reported in this report. The latter lays emphasis on opportunities, challenges and strategic intents that are material in impacting our ability to create value, our commercial viability, brand image, corporate culture and our inherent relevance in the societies and communities in which we operate. Our material matters are continuously assessed and, if need be, reviewed in light of the changing operating environment. In recent times, managing the implications associated with the COVID-19 pandemic has been a key focus area for dfcu Group, while in some ways, influencing the scale and depth of our priorities.
Supporting our stakeholders amidst challenging times and fostering resilient business activities.
Fostering operational excellence, innovation, and the digitalisation of our operations.
Proactively appraising risks,challenges and opportunities to underpin our endeavours.
Promoting the welfare of societies and preserving our environmental and cultural heritage.
Upholding ethical and goodgovernance standards in ouroperations.
Creating ecosystems to underpin vibrant and sustainable economies.
Providing customers with their preferred choices of financial services.
Harnessing the competence,empowerment and general welfare of our staff.

dfcu ANNUAL REPORT AND FINANCIAL STATEMENTS 2020 dfcu ANNUAL REPORT AND FINANCIAL STATEMENTS 2020 8988
Wealth Creation
Our value-creating business model
Our business model defines who we are and what we do. We believe in building resilient businesses and creating opportunities for our stakeholders to thrive, while harnessing positive outcomes for the sustained benefit of the societies and communities in which we live and operate.
Our Core Values
Our
Key
Str
ateg
ic O
rient
atio
ns
Financial capital
Human capital
Social and Relationship capital
Natural capital
Intellectual capital
Manufactured capital
Core financial roles
• Financial intermediation• Maturity transformation
• Converting deposits and other funds into lending facilities to our clients.
• Investing and trading in securities, forex, and other financial assets.
• Offering transactional, trade-related, and risk-mitigation facilities, as well as private banking and wealth management services.
• Undertaking dedicated actions to promote the welfare and development of the society.
Become a market leader
Transform from a niche player to a universal Bank
Become Bank 4.0
Superior financial performance
PROFESSIONALISM
INTEGRITY
COURAGECUSTOMER FOCUS
TEAMWORK
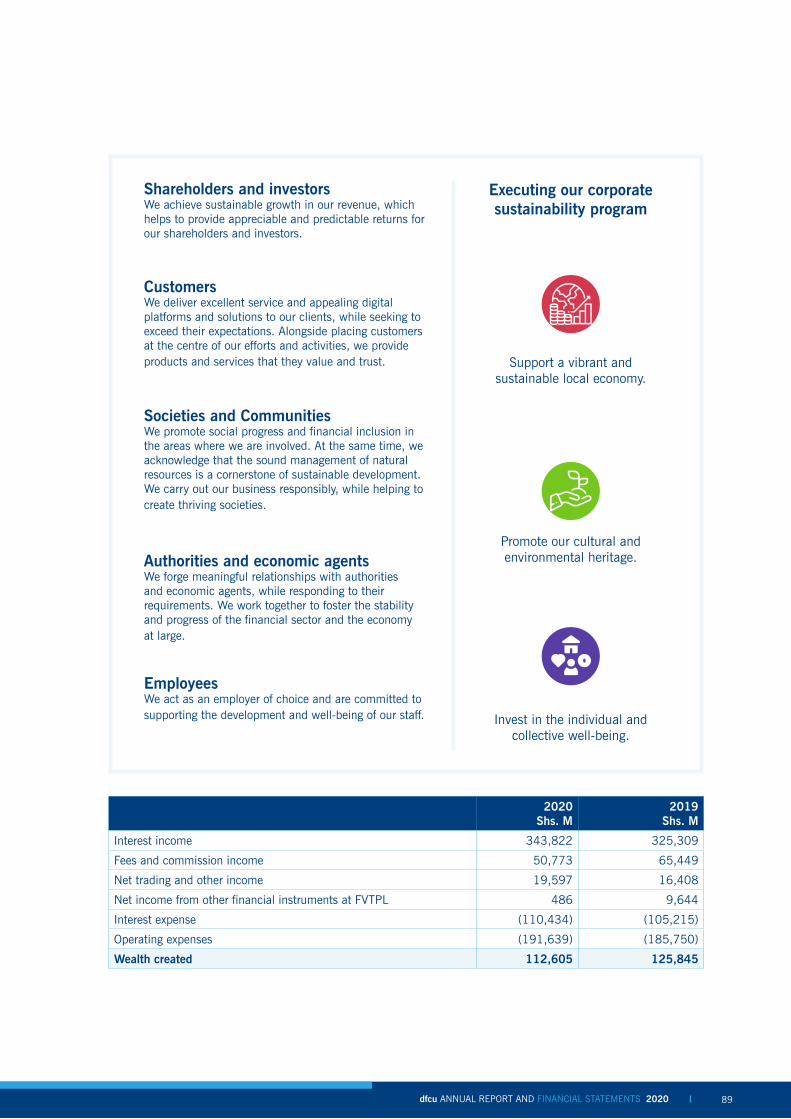
dfcu ANNUAL REPORT AND FINANCIAL STATEMENTS 2020 dfcu ANNUAL REPORT AND FINANCIAL STATEMENTS 2020 8988
Shareholders and investorsWe achieve sustainable growth in our revenue, which helps to provide appreciable and predictable returns for our shareholders and investors.
CustomersWe deliver excellent service and appealing digital platforms and solutions to our clients, while seeking to exceed their expectations. Alongside placing customers at the centre of our efforts and activities, we provide products and services that they value and trust.
Societies and CommunitiesWe promote social progress and financial inclusion in the areas where we are involved. At the same time, we acknowledge that the sound management of natural resources is a cornerstone of sustainable development. We carry out our business responsibly, while helping to create thriving societies.
Authorities and economic agentsWe forge meaningful relationships with authorities and economic agents, while responding to their requirements. We work together to foster the stability and progress of the financial sector and the economy at large.
EmployeesWe act as an employer of choice and are committed to supporting the development and well-being of our staff.
Executing our corporate sustainability program
2020Shs. M
2019Shs. M
Interest income 343,822 325,309
Fees and commission income 50,773 65,449
Net trading and other income 19,597 16,408
Net income from other financial instruments at FVTPL 486 9,644
Interest expense (110,434) (105,215)
Operating expenses (191,639) (185,750)
Wealth created 112,605 125,845
Support a vibrant and sustainable local economy.
Promote our cultural and environmental heritage.
Invest in the individual and collective well-being.

dfcu ANNUAL REPORT AND FINANCIAL STATEMENTS 2020 dfcu ANNUAL REPORT AND FINANCIAL STATEMENTS 2020 9190
How
we
dist
ribu
te v
alue
cre
ated
Dur
ing
the
year
, df
cu G
roup
con
tinue
d to
pro
vide
rel
evan
t an
d m
eani
ngfu
l way
s to
pro
mot
ing
the
inte
rest
s of
its
stak
ehol
ders
and
hel
p th
em p
rosp
er, su
ppor
ted
by it
s re
silie
nt fi
nanc
ial
resu
lts.
Eng
agin
g w
ith o
ur s
take
hold
ers
dfcu
Gro
up p
ursu
ed w
ide-
rang
ing
initi
ativ
es t
o un
derp
in t
he a
dvan
cem
ent
and
wel
fare
of k
ey s
take
hold
ers,
alo
ngsi
de r
espo
ndin
g to
the
ir ne
eds
and
requ
irem
ents
. A
s a
key
focu
s ar
ea, th
e G
roup
too
k de
dica
ted
actio
ns t
o m
eani
ngfu
lly r
einf
orce
its
stak
ehol
der
inte
ract
ions
in t
he w
ake
of t
he e
xige
nt o
pera
ting
envi
ronm
ent
trig
gere
d by
the
CO
VID
-19
pan
dem
ic.
Stak
ehol
ders
How
we
have
eng
aged
with
and
ser
ved
our
stak
ehol
ders
Res
pond
ing
to C
ovid
-19
Shar
ehol
ders
• W
e co
ntin
ued
to h
old
open
, co
nstr
uctiv
e, a
nd r
egul
ar
dial
ogue
s w
ith lo
cal a
nd in
tern
atio
nal a
genc
ies
with
a
view
to
repo
rtin
g on
the
per
form
ance
pro
spec
ts o
f the
G
roup
as
wel
l as
its s
trat
egic
orie
ntat
ions
. Alo
ng t
he
way
, w
e sh
ared
ded
icat
ed a
naly
ses
to p
rovi
de c
omfo
rt
as r
egar
ds o
ur r
isk
man
agem
ent
and
busi
ness
gro
wth
fo
unda
tions
.•
W
hile
kee
ping
our
ext
erna
l sta
keho
lder
s ab
reas
t of
mat
eria
l dev
elop
men
ts in
fluen
cing
the
Gro
up’s
op
erat
ions
and
act
iviti
es, w
e ha
ve r
egul
arly
info
rmed
th
em a
bout
spe
cific
initi
ativ
es t
aken
by
the
Gro
up t
o co
pe w
ith t
he im
pact
of t
he p
ande
mic
on
the
Gro
up
and
key
busi
ness
seg
men
ts.
•
We
uphe
ld the
imag
e an
d re
puta
tion
of the
Gro
up a
s a
stra
tegi
cally
impo
rtan
t pl
ayer
. In
20
20
, df
cu G
roup
pos
ted
a re
silie
nt fi
nanc
ial p
erfo
rman
ce b
acke
d by
its
robu
st b
usin
ess
mod
el. A
s a
key
prin
cipl
e, t
he G
roup
aim
s to
gen
erat
e co
mfo
rtab
le e
arni
ngs
to r
ewar
d its
sha
reho
lder
s an
d in
vest
ors.
The
refo
re,
dfcu
Gro
up h
as p
ropo
sed
a di
vide
nd o
f Sh
s 5
0.3
3 p
er s
hare
am
idst
the
cu
rren
t ex
cept
iona
l circ
umst
ance
s.•
W
e re
info
rced
our
com
mun
icat
ion
and
inte
ract
ions
with
cor
resp
onde
nt b
anks
to
reas
sure
the
m
of t
he in
here
nt r
esili
ence
of o
ur o
pera
tions
and
the
sou
ndne
ss o
f our
key
fina
ncia
l met
rics.
•
We
cont
inuo
usly
liai
sed
with
pla
yers
acr
oss
the
glob
al m
arke
ts a
mid
st o
ur e
ffort
s to
con
solid
ate
our
fore
ign
curr
ency
fund
ing
reso
urce
s.
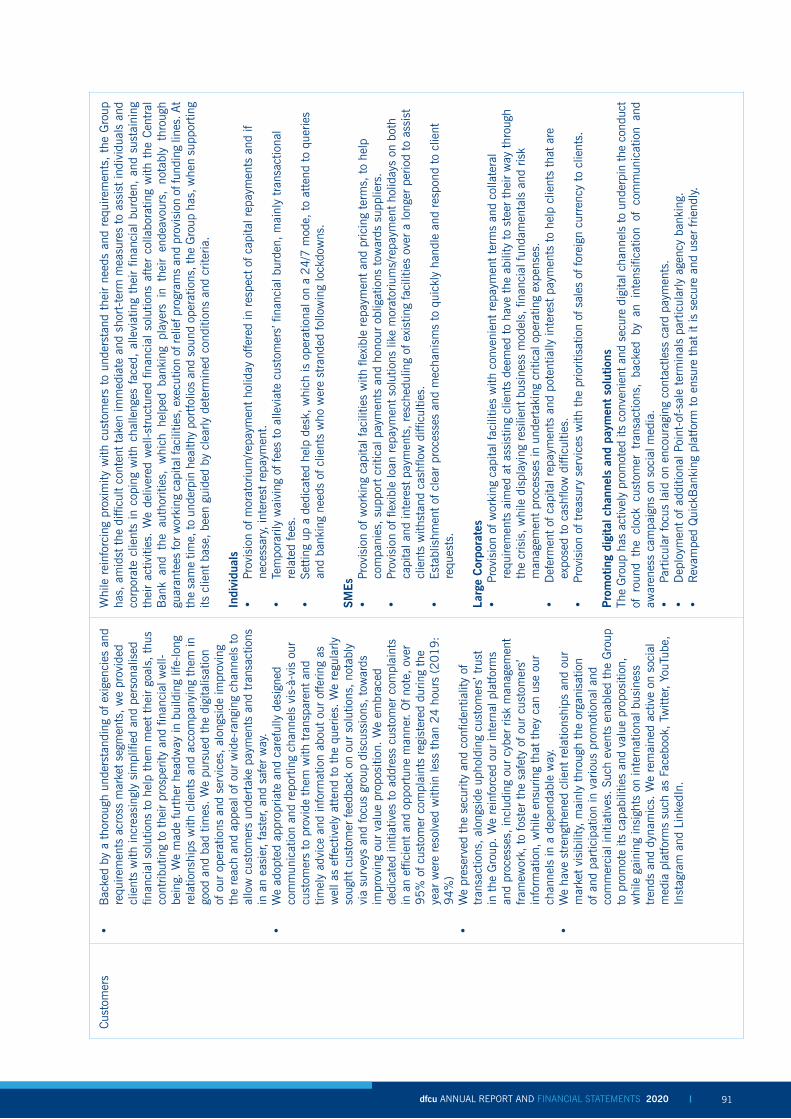
dfcu ANNUAL REPORT AND FINANCIAL STATEMENTS 2020 dfcu ANNUAL REPORT AND FINANCIAL STATEMENTS 2020 9190
Cus
tom
ers
• B
acke
d by
a t
horo
ugh
unde
rsta
ndin
g of
exi
genc
ies
and
requ
irem
ents
acr
oss
mar
ket
segm
ents
, w
e pr
ovid
ed
clie
nts
with
incr
easi
ngly
sim
plifi
ed a
nd p
erso
nalis
ed
finan
cial
sol
utio
ns t
o he
lp t
hem
mee
t th
eir
goal
s, t
hus
cont
ribut
ing
to t
heir
pros
perit
y an
d fin
anci
al w
ell-
bein
g. W
e m
ade
furt
her
head
way
in b
uild
ing
life-
long
re
latio
nshi
ps w
ith c
lient
s an
d ac
com
pany
ing
them
in
good
and
bad
tim
es. W
e pu
rsue
d th
e di
gita
lisat
ion
of o
ur o
pera
tions
and
ser
vice
s, a
long
side
impr
ovin
g th
e re
ach
and
appe
al o
f our
wid
e-ra
ngin
g ch
anne
ls t
o al
low
cus
tom
ers
unde
rtak
e pa
ymen
ts a
nd t
rans
actio
ns
in a
n ea
sier
, fa
ster
, an
d sa
fer
way
.•
W
e ad
opte
d ap
prop
riate
and
car
eful
ly d
esig
ned
com
mun
icat
ion
and
repo
rtin
g ch
anne
ls v
is-à
-vis
our
cu
stom
ers
to p
rovi
de t
hem
with
tra
nspa
rent
and
tim
ely
advi
ce a
nd in
form
atio
n ab
out
our
offe
ring
as
wel
l as
effe
ctiv
ely
atte
nd t
o th
e qu
erie
s. W
e re
gula
rly
soug
ht c
usto
mer
feed
back
on
our
solu
tions
, no
tabl
y vi
a su
rvey
s an
d fo
cus
grou
p di
scus
sion
s, t
owar
ds
impr
ovin
g ou
r va
lue
prop
ositi
on.
We
embr
aced
de
dica
ted
initi
ativ
es t
o ad
dres
s cu
stom
er c
ompl
aint
s in
an
effic
ient
and
opp
ortu
ne m
anne
r. O
f not
e, o
ver
95%
of c
usto
mer
com
plai
nts
regi
ster
ed d
urin
g th
e ye
ar w
ere
reso
lved
with
in le
ss t
han
24 h
ours
(2019:
94%
)•
W
e pr
eser
ved
the
secu
rity
and
conf
iden
tialit
y of
tr
ansa
ctio
ns, al
ongs
ide
upho
ldin
g cu
stom
ers’
tru
st
in t
he G
roup
. W
e re
info
rced
our
inte
rnal
pla
tform
s an
d pr
oces
ses,
incl
udin
g ou
r cy
ber
risk
man
agem
ent
fram
ewor
k, t
o fo
ster
the
saf
ety
of o
ur c
usto
mer
s’
info
rmat
ion,
whi
le e
nsur
ing
that
the
y ca
n us
e ou
r ch
anne
ls in
a d
epen
dabl
e w
ay.
• W
e ha
ve s
tren
gthe
ned
clie
nt r
elat
ions
hips
and
our
m
arke
t vi
sibi
lity,
mai
nly
thro
ugh
the
orga
nisa
tion
of a
nd p
artic
ipat
ion
in v
ario
us p
rom
otio
nal a
nd
com
mer
cial
initi
ativ
es. Su
ch e
vent
s en
able
d th
e G
roup
to
pro
mot
e its
cap
abili
ties
and
valu
e pr
opos
ition
, w
hile
gai
ning
insi
ghts
on
inte
rnat
iona
l bus
ines
s tr
ends
and
dyn
amic
s. W
e re
mai
ned
activ
e on
soc
ial
med
ia p
latfo
rms
such
as
Face
book
, Tw
itter
, Yo
uTub
e,
Inst
agra
m a
nd L
inke
dIn.
Whi
le r
einf
orci
ng p
roxi
mity
with
cus
tom
ers
to u
nder
stan
d th
eir
need
s an
d re
quire
men
ts,
the
Gro
up
has,
am
idst
the
diff
icul
t co
nten
t ta
ken
imm
edia
te a
nd s
hort
-ter
m m
easu
res
to a
ssis
t in
divi
dual
s an
d co
rpor
ate
clie
nts
in c
opin
g w
ith c
halle
nges
fac
ed,
alle
viat
ing
thei
r fin
anci
al b
urde
n, a
nd s
usta
inin
g th
eir
activ
ities
. W
e de
liver
ed w
ell-s
truc
ture
d fin
anci
al s
olut
ions
aft
er c
olla
bora
ting
with
the
Cen
tral
B
ank
and
the
auth
oriti
es,
whi
ch h
elpe
d ba
nkin
g pl
ayer
s in
the
ir en
deav
ours
, no
tabl
y th
roug
h gu
aran
tees
for w
orki
ng c
apita
l fac
ilitie
s, e
xecu
tion
of re
lief p
rogr
ams
and
prov
isio
n of
fund
ing
lines
. At
the
sam
e tim
e, to
und
erpi
n he
alth
y po
rtfo
lios
and
soun
d op
erat
ions
, the
Gro
up h
as, w
hen
supp
ortin
g its
clie
nt b
ase,
bee
n gu
ided
by
clea
rly d
eter
min
ed c
ondi
tions
and
crit
eria
.
Indi
vidu
als
•
P
rovi
sion
of m
orat
oriu
m/re
paym
ent
holid
ay o
ffere
d in
res
pect
of c
apita
l rep
aym
ents
and
if
nece
ssar
y, in
tere
st r
epay
men
t.•
Tem
pora
rily
wai
ving
of f
ees
to a
llevi
ate
cust
omer
s’ fi
nanc
ial b
urde
n, m
ainl
y tr
ansa
ctio
nal
rela
ted
fees
.•
Set
ting
up a
ded
icat
ed h
elp
desk
, w
hich
is o
pera
tiona
l on
a 2
4/7
mod
e, t
o at
tend
to
quer
ies
and
bank
ing
need
s of
clie
nts
who
wer
e st
rand
ed fo
llow
ing
lock
dow
ns.
SMEs
•
P
rovi
sion
of w
orki
ng c
apita
l fac
ilitie
s w
ith fl
exib
le r
epay
men
t an
d pr
icin
g te
rms,
to
help
co
mpa
nies
, su
ppor
t cr
itica
l pay
men
ts a
nd h
onou
r ob
ligat
ions
tow
ards
sup
plie
rs.
•
P
rovi
sion
of f
lexi
ble
loan
rep
aym
ent
solu
tions
like
mor
ator
ium
s/re
paym
ent
holid
ays
on b
oth
capi
tal a
nd in
tere
st p
aym
ents
, re
sche
dulin
g of
exi
stin
g fa
cilit
ies
over
a lo
nger
per
iod
to a
ssis
t cl
ient
s w
ithst
and
cash
flow
diff
icul
ties.
•
E
stab
lishm
ent
of c
lear
pro
cess
es a
nd m
echa
nism
s to
qui
ckly
han
dle
and
resp
ond
to c
lient
re
ques
ts.
Larg
e C
orpo
rate
s•
Prov
isio
n of
wor
king
cap
ital f
acili
ties
with
con
veni
ent
repa
ymen
t te
rms
and
colla
tera
l re
quire
men
ts a
imed
at
assi
stin
g cl
ient
s de
emed
to
have
the
abi
lity
to s
teer
the
ir w
ay t
hrou
gh
the
cris
is,
whi
le d
ispl
ayin
g re
silie
nt b
usin
ess
mod
els,
fina
ncia
l fun
dam
enta
ls a
nd r
isk
man
agem
ent
proc
esse
s in
und
erta
king
crit
ical
ope
ratin
g ex
pens
es.
•
D
efer
men
t of
cap
ital r
epay
men
ts a
nd p
oten
tially
inte
rest
pay
men
ts t
o he
lp c
lient
s th
at a
re
expo
sed
to c
ashf
low
diff
icul
ties.
•
Pr
ovis
ion
of t
reas
ury
serv
ices
with
the
prio
ritis
atio
n of
sal
es o
f for
eign
cur
renc
y to
clie
nts.
Pro
mot
ing
digi
tal c
hann
els
and
paym
ent
solu
tions
The
Gro
up h
as a
ctiv
ely
prom
oted
its
conv
enie
nt a
nd s
ecur
e di
gita
l cha
nnel
s to
und
erpi
n th
e co
nduc
t of
rou
nd t
he c
lock
cus
tom
er t
rans
actio
ns,
back
ed b
y an
int
ensi
ficat
ion
of c
omm
unic
atio
n an
d aw
aren
ess
cam
paig
ns o
n so
cial
med
ia.
•
Pa
rtic
ular
focu
s la
id o
n en
cour
agin
g co
ntac
tless
car
d pa
ymen
ts.
•
D
eplo
ymen
t of
add
ition
al P
oint
-of-
sale
ter
min
als
part
icul
arly
age
ncy
bank
ing.
•
R
evam
ped
Qui
ckB
anki
ng p
latfo
rm t
o en
sure
tha
t it
is s
ecur
e an
d us
er fr
iend
ly.
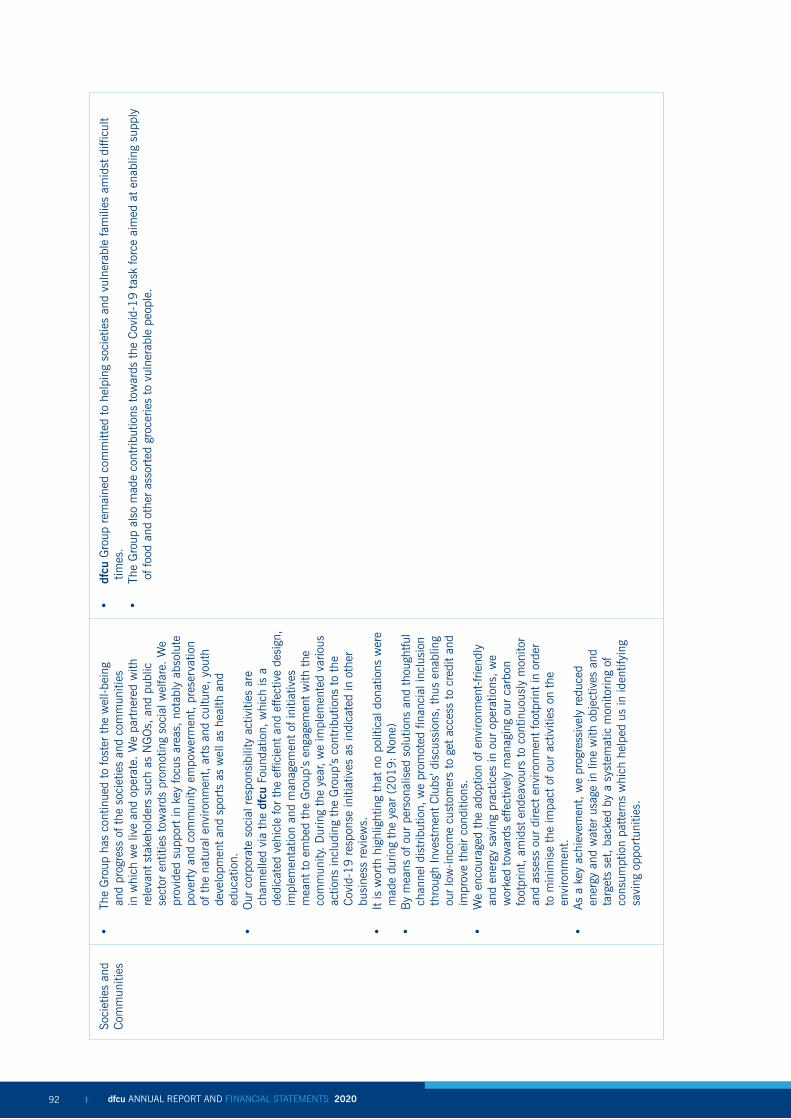
dfcu ANNUAL REPORT AND FINANCIAL STATEMENTS 2020 dfcu ANNUAL REPORT AND FINANCIAL STATEMENTS 2020 9392
Soci
etie
s an
d C
omm
uniti
es•
Th
e G
roup
has
con
tinue
d to
fost
er t
he w
ell-b
eing
an
d pr
ogre
ss o
f the
soc
ietie
s an
d co
mm
uniti
es
in w
hich
we
live
and
oper
ate.
We
part
nere
d w
ith
rele
vant
sta
keho
lder
s su
ch a
s N
GO
s, a
nd p
ublic
se
ctor
ent
ities
tow
ards
pro
mot
ing
soci
al w
elfa
re.
We
prov
ided
sup
port
in k
ey fo
cus
area
s, n
otab
ly a
bsol
ute
pove
rty
and
com
mun
ity e
mpo
wer
men
t, p
rese
rvat
ion
of t
he n
atur
al e
nviro
nmen
t, a
rts
and
cultu
re,
yout
h de
velo
pmen
t an
d sp
orts
as
wel
l as
heal
th a
nd
educ
atio
n.•
O
ur c
orpo
rate
soc
ial r
espo
nsib
ility
act
iviti
es a
re
chan
nelle
d vi
a th
e df
cu F
ound
atio
n, w
hich
is a
de
dica
ted
vehi
cle
for
the
effic
ient
and
effe
ctiv
e de
sign
, im
plem
enta
tion
and
man
agem
ent
of in
itiat
ives
m
eant
to
embe
d th
e G
roup
’s e
ngag
emen
t w
ith t
he
com
mun
ity. D
urin
g th
e ye
ar,
we
impl
emen
ted
vario
us
actio
ns in
clud
ing
the
Gro
up’s
con
trib
utio
ns t
o th
e C
ovid
-19 r
espo
nse
initi
ativ
es a
s in
dica
ted
in o
ther
bu
sine
ss r
evie
ws.
• It
is w
orth
hig
hlig
htin
g th
at n
o po
litic
al d
onat
ions
wer
e m
ade
durin
g th
e ye
ar (
20
19:
Non
e)•
B
y m
eans
of o
ur p
erso
nalis
ed s
olut
ions
and
tho
ught
ful
chan
nel d
istr
ibut
ion,
we
prom
oted
fina
ncia
l inc
lusi
on
thro
ugh
Inve
stm
ent
Clu
bs’ d
iscu
ssio
ns,
thus
ena
blin
g ou
r lo
w-in
com
e cu
stom
ers
to g
et a
cces
s to
cre
dit
and
impr
ove
thei
r co
nditi
ons.
• W
e en
cour
aged
the
ado
ptio
n of
env
ironm
ent-
frie
ndly
an
d en
ergy
sav
ing
prac
tices
in o
ur o
pera
tions
, w
e w
orke
d to
war
ds e
ffect
ivel
y m
anag
ing
our
carb
on
foot
prin
t, a
mid
st e
ndea
vour
s to
con
tinuo
usly
mon
itor
and
asse
ss o
ur d
irect
env
ironm
ent
foot
prin
t in
ord
er
to m
inim
ise
the
impa
ct o
f our
act
iviti
es o
n th
e en
viro
nmen
t.•
As
a ke
y ac
hiev
emen
t, w
e pr
ogre
ssiv
ely
redu
ced
ener
gy a
nd w
ater
usa
ge in
line
with
obj
ectiv
es a
nd
targ
ets
set,
bac
ked
by a
sys
tem
atic
mon
itorin
g of
co
nsum
ptio
n pa
tter
ns w
hich
hel
ped
us in
iden
tifyi
ng
savi
ng o
ppor
tuni
ties.
•
df
cu G
roup
rem
aine
d co
mm
itted
to
help
ing
soci
etie
s an
d vu
lner
able
fam
ilies
am
idst
diff
icul
t tim
es.
•
Th
e G
roup
als
o m
ade
cont
ribut
ions
tow
ards
the
Cov
id-1
9 t
ask
forc
e ai
med
at
enab
ling
supp
ly
of fo
od a
nd o
ther
ass
orte
d gr
ocer
ies
to v
ulne
rabl
e pe
ople
.

dfcu ANNUAL REPORT AND FINANCIAL STATEMENTS 2020 dfcu ANNUAL REPORT AND FINANCIAL STATEMENTS 2020 9392
Aut
horit
ies
and
econ
omic
ag
ents
• W
e fin
ance
d ke
y pr
ojec
ts s
hapi
ng t
he e
cono
mic
la
ndsc
ape
and
sust
aine
d ou
r co
ntrib
utio
n to
the
rea
l ec
onom
y an
d th
e co
ntin
ued
grow
th o
f the
cou
ntry
’s
busi
ness
es. df
cu G
roup
rem
aine
d a
dedi
cate
d an
d tr
uste
d pa
rtne
r fo
r la
rge
corp
orat
es a
nd in
vest
ors,
w
hile
uph
oldi
ng it
s co
mm
itmen
t to
sup
port
and
ac
com
pany
sm
all a
nd m
ediu
m e
nter
pris
es a
cros
s a
broa
d ra
nge
of e
cono
mic
sec
tors
by
mea
ns o
f our
pr
oact
ive,
tai
lore
d, a
nd m
odul
ar s
olut
ions
.•
W
e sa
fegu
ard
the
pere
nnity
and
sou
ndne
ss o
f our
op
erat
ions
, al
ongs
ide
fully
cop
ing
with
spe
cific
ities
an
d im
plic
atio
ns o
f evo
lvin
g m
anda
tory
pro
visi
ons
and
requ
irem
ents
. W
e en
sure
d st
rict
com
plia
nce
with
rel
evan
t re
gula
tory
lim
its a
nd g
uide
lines
rel
atin
g no
tabl
y to
bus
ines
s op
erat
ions
, pr
oduc
t de
velo
pmen
t,
mar
ket
deve
lopm
ent
and
risk
man
agem
ent
in t
he
juris
dict
ion
in w
hich
we
oper
ate.
We
assi
sted
in
stre
ngth
enin
g th
e re
gula
tory
fram
ewor
k ba
sed
on o
ur
clos
e co
llabo
ratio
n w
ith t
he r
egul
ator
s. W
e at
tend
ed t
o re
gula
tory
rev
iew
s w
ith n
otab
le a
tten
tion
to d
etai
l and
pr
ofes
sion
alis
m, w
hile
pro
mpt
ly r
eact
ing
to m
atte
rs
rais
ed. W
e su
bmitt
ed r
epor
ts in
a t
imel
y m
anne
r to
re
gula
tory
bod
ies
and
forg
ed t
rans
pare
nt r
elat
ions
hips
w
ith t
hem
to
prom
ote
adeq
uate
mon
itorin
g of
our
ac
tiviti
es a
nd in
form
ed d
iscu
ssio
ns a
bout
rel
evan
t is
sues
.•
W
e ac
ted
as t
ax a
gent
s fo
r U
gand
a R
even
ue A
utho
rity
(UR
A)
whe
re w
e co
llect
ed s
ever
al t
axes
on
thei
r be
half
from
our
cus
tom
ers.
Dur
ing
the
year
, Sh
s 51,9
31 m
illio
n (2
019:
48,2
64)
was
col
lect
ed a
nd
paid
to
UR
A.
•
W
e ac
com
pani
ed s
mal
l, m
ediu
m, an
d la
rge
size
d bu
sine
sses
faci
ng h
ards
hips
and
cas
hflo
w
diffi
culti
es t
o, a
s fa
r as
pos
sibl
e, r
emai
n af
loat
, pu
rsue
the
ir ac
tiviti
es a
nd m
itiga
te jo
b lo
sses
, th
us h
elpi
ng t
o un
derp
in r
esili
ent
soci
o-ec
onom
ic d
evel
opm
ent.
•
W
e in
tera
cted
and
col
labo
rate
d w
ith t
he C
entr
al B
ank,
UR
A a
nd o
ther
aut
horit
ies
(dire
ctly
or
thr
ough
ban
king
and
rel
evan
t bu
sine
ss a
ssoc
iatio
ns)
amid
st c
once
rted
end
eavo
urs
to
impl
emen
t m
acro
-fin
anci
al m
easu
res
that
are
dee
med
to
be m
ost
effe
ctiv
e to
und
erpi
n su
pply
of
cre
dit
and
the
deliv
ery
of d
edic
ated
clie
nts
solu
tions
, af
ter
mak
ing
allo
wan
ce fo
r ne
w
real
ities
and
req
uire
men
ts e
ngen
dere
d by
the
pan
dem
ic.

dfcu ANNUAL REPORT AND FINANCIAL STATEMENTS 2020 dfcu ANNUAL REPORT AND FINANCIAL STATEMENTS 2020 9594
Empl
oyee
s•
T
owar
ds e
mbe
ddin
g ou
r po
sitio
n as
an
empl
oyer
of
choi
ce, w
e pu
rsue
d ou
r ef
fort
s to
att
ract
, de
velo
p an
d re
tain
tal
ents
as
wel
l as
empo
wer
the
m t
o de
liver
the
ir be
st a
long
side
furt
her
deve
lopi
ng a
nd c
apita
lisin
g on
th
e co
llect
ive
skill
s, k
now
ledg
e an
d ex
perie
nce
of o
ur
empl
oyee
s. C
onco
mita
ntly,
the
Gro
up h
as e
ngag
ed
with
sta
ff to
ade
quat
ely
unde
rsta
nd a
nd r
espo
nd t
o th
eir
need
s th
roug
h vi
al s
urve
ys a
nd c
ultu
re a
udits
. W
ith a
vie
w t
o re
alis
ing
its s
trat
egic
obj
ectiv
es,
the
Gro
up c
ontin
ues
to im
plem
ent
dedi
cate
d pr
ojec
ts a
nd
prog
ram
s as
par
t of
its
ongo
ing
HR
Tra
nsfo
rmat
ion
Prog
ram
me.
Whi
le p
rom
otin
g an
env
ironm
ent
of t
rust
, hi
gh a
spira
tion
and
achi
evem
ent
as w
ell a
s fo
ster
ing
stra
tegi
c ta
lent
acq
uisi
tion,
the
und
erly
ing
aim
is t
o re
info
rce
hum
an r
esou
rce
fram
ewor
ks in
sup
port
of
enha
nced
ope
ratio
nal e
ffici
enci
es a
s w
ell a
s so
und
and
bala
nced
bus
ines
s gr
owth
.•
T
he s
ubje
ct m
atte
rs t
o w
hich
the
Ban
k is
exp
osed
to
are
get
ting
mor
e co
mpl
ex a
nd c
lient
sol
utio
ns
incr
easi
ngly
sop
hist
icat
ed.
Aga
inst
thi
s ba
ckdr
op a
nd
whi
le c
apita
lisin
g on
our
forw
ard-
look
ing
appr
oach
, w
e br
ough
t re
leva
nt u
pgra
des
to o
ur le
arni
ng a
nd
trai
ning
fram
ewor
k as
wel
l as
the
unde
rlyin
g cu
lture
. D
edic
ated
pro
gram
s w
ere
cond
ucte
d to
ste
p up
th
e qu
ality
of o
ur h
uman
cap
ital,
incl
udin
g tr
aini
ng
cour
ses.
•
T
he G
roup
too
k pr
ompt
mea
sure
s to
pre
serv
e th
e he
alth
and
saf
ety
of it
s em
ploy
ees
durin
g an
d af
ter
the
lock
dow
n pe
riod.
It p
rovi
ded
them
with
ded
icat
ed fa
cilit
ies
that
hel
ped
them
un
dert
ake
thei
r ac
tiviti
es,
back
ed b
y cl
ear
polic
ies
and
guid
elin
es.
•
P
hase
d an
d th
ough
tful a
dopt
ion
of w
ork
from
hom
e pr
actic
e an
d pr
ompt
reo
rgan
isat
ion
of w
ork
proc
esse
s w
ith t
he o
pera
tion
of s
plit/
rota
ting
team
s as
soo
n as
lock
dow
ns w
ere
anno
unce
d an
d de
pend
ing
on t
he c
ateg
ory
of a
ctiv
ities
, un
derp
inne
d by
the
del
iver
y of
de
dica
ted
tech
nolo
gica
l and
infr
astr
uctu
re s
uppo
rt, ke
y ob
ject
ive
purs
ued
is t
o m
aint
ain
cont
inui
ty o
f bus
ines
s op
erat
ions
, up
hold
the
del
iver
y of
min
imum
ser
vice
to
cust
omer
s an
d re
duce
ris
k of
con
tam
inat
ion
from
the
viru
s.•
Pro
visi
on o
f tra
nspo
rt s
hutt
les
to e
mpl
oyee
s w
orki
ng o
n-si
te d
urin
g th
e lo
ckdo
wn
perio
d an
d pr
ovis
ion
of a
ccom
mod
atio
n fa
cilit
ies
to k
ey s
taff
near
the
offi
ce p
rem
ises
to
faci
litat
e qu
icke
r su
ppor
t of
the
bus
ines
s op
erat
ions
.•
Uph
oldi
ng t
he a
dopt
ion
of s
tric
t he
alth
and
saf
ety
prot
ocol
s ac
ross
pre
mis
es a
nd a
t al
l tim
es,
that
is;
com
puls
ory
wea
ring
of m
asks
by
all s
taff
and
mai
ntai
ning
soc
ial d
ista
ncin
g in
all
bran
ches
; pr
ovis
ion
of h
ydro
-alc
ohol
ic s
olut
ions
upo
n en
try
in o
ur p
rem
ises
and
leve
ragi
ng
of a
con
trol
ent
ranc
e sy
stem
with
use
of c
alib
rate
d no
n-co
ntac
t th
erm
omet
ers
for
cust
omer
s,
and
set
up s
ocia
l dis
tanc
ing
mar
king
s at
ent
ranc
es a
nd s
ervi
ce c
ount
ers
to m
itiga
te c
onta
gion
ris
ks;
cond
uct
regu
lar
clea
nsin
g an
d di
sinf
ectio
n of
our
pre
mis
es a
nd e
quip
men
t ac
ross
fron
tline
spa
ces
and
com
mon
are
as.
•
C
ondu
ct c
ovid
-19 r
apid
tes
ts fo
r em
ploy
ees
havi
ng w
orke
d du
ring
the
lock
dow
n pe
riod.
•
D
edic
ated
com
mun
icat
ion
plat
form
s le
vera
ged
to k
eep
in t
ouch
with
em
ploy
ees
and
reas
sure
th
em d
urin
g an
d af
ter
the
lock
dow
n pe
riod,
whi
le d
isse
min
atin
g re
gula
r in
form
atio
n on
the
vi
rus
spre
ad a
nd p
rovi
ding
insi
ghts
on
step
s ta
ken
to p
rote
ct t
he h
ealth
of e
mpl
oyee
s an
d cu
stom
ers.
Cha
nnel
s fa
vour
ed in
clud
e W
hats
App
gro
ups
and
emai
ls fr
om t
he C
hief
Exe
cutiv
e O
ffice
r an
d ke
y pe
rson
nel.

dfcu ANNUAL REPORT AND FINANCIAL STATEMENTS 2020 dfcu ANNUAL REPORT AND FINANCIAL STATEMENTS 2020 9594
Business Continuity Management
Continuity of critical business operations is vital to dfcu Group’s success and continued growth. Our Business Continuity Management Steering Committee, which includes several representatives of corporate and senior management, provides overall guidance to the Business Continuity Planning (BCP) Committee, which is comprised of senior officers representing key business and service units of the Group.The BCP Committee developed a formal Business Continuity Plan in line with the requirements and guidelines of Bank of Uganda (BOU), which has been formally approved by the Board. The Business Continuity Plan addresses operational risks and strives to minimize any threats posed by shortcomings or failures of internal processes and systems, as well as external events, including natural disasters.As dfcu Group relies heavily on information technology, we have put in place disaster recovery sites at remote locations and periodic role swap exercises are carried out to test the Group’s ability to withstand any disaster situation. These exercises are aimed at identifying issues in switching machines, minimizing the down time and loss of data.
Procurement
dfcu Group subscribes to principles of openness, integrity, and fairness in its drive to implement international procurement best practices. We endeavour to give as many suppliers as possible an opportunity to tender. The Group is committed to excellent corporate governance and to a very high standard of ethics. In general, dfcu Group supports the purchase of goods and services on the local market. Whereas the Group applies standard procurement terms and conditions to all procurements, the Group strongly encourages protection of the environment and considers suppliers’ commitment to environmental issues. Our influence on the local economy goes beyond provision of direct jobs and payment of wages and taxes. dfcu Group also proactively supports local suppliers in the economy. By supporting local business in the supply chain, we play a role in attracting additional investment to the local economy. The proportion of local spending is also an important factor in contributing to the local economy and maintaining community relations. Our procurement policy gives priority to local suppliers, while at the same time ensuring alignment to the Group’s standards for solution quality, sustainability, and commercial viability.
Summary of procurement spend:
2019 2019
Total procurement spend Shs M 132,521 149,111
Amount spent on local suppliers Shs M 117,944 128,105
Amount spent on foreign suppliers Shs M 14,577 21,006
Percentage spent on local suppliers 89% 86%
Our employees
dfcu Group employed 1,034 employees (2019: 1,072) of which 52% are female (2017: 51%). The Group ensures that all staff train at least once in a calendar year to enhance skills and productivity. The Group spent a total of Shs 479 million (2019: Shs 1,045 million) on training staff. The amount reduced during the year because there was a reduction in the number of physical trainings due to the pandemic.
2020 2019
Total employees (number) 1,034 1,072
Total staff costs (Shs M) 60,938 59,422
Staff composition (Female: Male) 52%: 48% 51%: 49%
Staff training spend (Shs M) 479 1,045

dfcu ANNUAL REPORT AND FINANCIAL STATEMENTS 2020 dfcu ANNUAL REPORT AND FINANCIAL STATEMENTS 2020 9796
Financial enablement for staff
Through our employee value proposition, we enabled staff acquire homes and also acquire finances for their personal development. As at 31 December 2020, the total advances to employees amounted to Shs 29,814 Million (2019: Shs 24,762 Million). There was no credit to employees that was neither past due nor impaired.
2020 2019
Number of staff Shs M Number of staff Shs M
Staff personal development loans 557 14,006 567 10,126
Staff home loans 105 15,808 117 14,636
Total 662 29,814 684 24,762
Performance measurement
In order to monitor an employee’s contribution, dfcu Group developed a performance measurement tool which has a cycle that involves goal setting, performance monitoring conversations and performance reviews for the teams and all individuals. It’s an inclusive, two-way process that creates feedback and considers future capability requirements of the Bank, and personal development needs and aspirations. The performance measurement is done twice a year.
Staff feedback:
dfcu Group has regular online surveys through which staff views, ideas and value adding input is sought. This is done to track and evaluate progress made in identified employee work related challenges and risks. In addition, each department is allocated a human resource business partner to help coordinate the challenges identified by employees in that department.
Talent management and succession planning
dfcu Group’s people management philosophy is to progressively build its own talent pool to effectively support its growth. Branch successor pools including Branch Managers, Credit Managers, Credit Administrators and Branch Operation Managers are updated and approved by management. Development interventions for the identified staff are incorporated in the training budget and plan.
GRI Index Reference
The 2020 Sustainability Report was completed in reference to the Global Reporting Initiative (GRI) guidelines and supported by the G4 Financial Services Sector Supplement.
Disclosure number
Description Required for CORE
Page Reference
102-1 Name of the organisation Core 8
102-2 Activities, brands, products, and services Core 9
102-3 Location of headquarters Core 11
102-4 Location of operations Core 11
102-5 Ownership and legal form Core 8
102-6 Markets served Core 11
102-7 Scale of the organisation Core 9

dfcu ANNUAL REPORT AND FINANCIAL STATEMENTS 2020 dfcu ANNUAL REPORT AND FINANCIAL STATEMENTS 2020 9796
102-8 Information on employees and other workers Core 93
102-9 Supply chain Core 93
102-10 Significant changes to the organisation and its supply chain Core 93
102-11 Precautionary principles or approach Core N/A
102-12 External initiatives Core 42
102-13 Membership of associations Core N/A
Strategy
102-14 Statement from senior decision makers Core 23
102-15 Key impacts, risks, and opportunities 53
Ethics and integrity
102-16 Values, principles, standards, and norms of behaviour Core 9
102-17 Mechanisms for advice and concerns about ethics 9
Governance
102-18 Governance structure Core 19
102-19 Delegating authority 19
102-20 Executive-level responsibility for economic, environmental, and social topics
79
102-21 Consulting stakeholders on economic, environmental, and social topics
87
102-22 Composition of the highest governance body and its committees 61
102-23 Chair of the highest governance body 23
102-24 Nominating and selecting the highest governance body 61
102-25 Conflicts of interest 61
102-26 Role of highest governance body in setting purpose, values, and strategy
61
102-27 Collective knowledge of highest governance body N/A
102-28 Evaluating the highest governance body’s performance 77
102-29 Identifying and managing economic, environmental, and social impacts
87
102-30 Effectiveness of risk management processes 53
102-31 Review of economic, environmental, and social topics 87
102-32 Highest governance body’s role in sustainability reporting 87

dfcu ANNUAL REPORT AND FINANCIAL STATEMENTS 2020 dfcu ANNUAL REPORT AND FINANCIAL STATEMENTS 2020 9998
102-33 Communicating critical concerns N/A
102-34 Nature and total number of critical concerns N/A
102-35 Remuneration policies 77
102-36 Process for determining remuneration 77
Energy
302-1 Energy consumption within the organisation N/A
302-2 Energy consumption outside of the organisation N/A
303-3 Energy intensity N/A
303-4 Reduction of energy consumption N/A
303-5 Reductions in energy requirements of products and services N/A
Water
303-1 Water withdrawal by source N/A
303-2 Water sources significantly affected by withdrawal of water N/A
303-3 Water recycled and reused N/A
Biodiversity
304-1 Operational sites owned, leased, managed in, or adjacent to, protected areas and areas of high biodiversity value outside protected areas
N/A
304-2 Significant impacts of activities, products, and services on biodiversity
N/A
304-3 Habitats protected or restored N/A
304-4 IUCN Red List species and national conservation list species with habitats in areas affected by operations
N/A
Emissions
305-1 Direct (Scope 1) GHG emissions N/A
305-2 Energy indirect (Scope 2) GHG emissions N/A
305-3 Other indirect (Scope 3) GHG emissions N/A
305-4 GHG emissions intensity N/A
305-5 Reduction of GHG emissions N/A
305-6 Emissions of ozone-depleting substances (ODS) N/A
305-7 Nitrogen oxides (NOX), sulphur oxides (SOX), and other significant air emissions
N/A
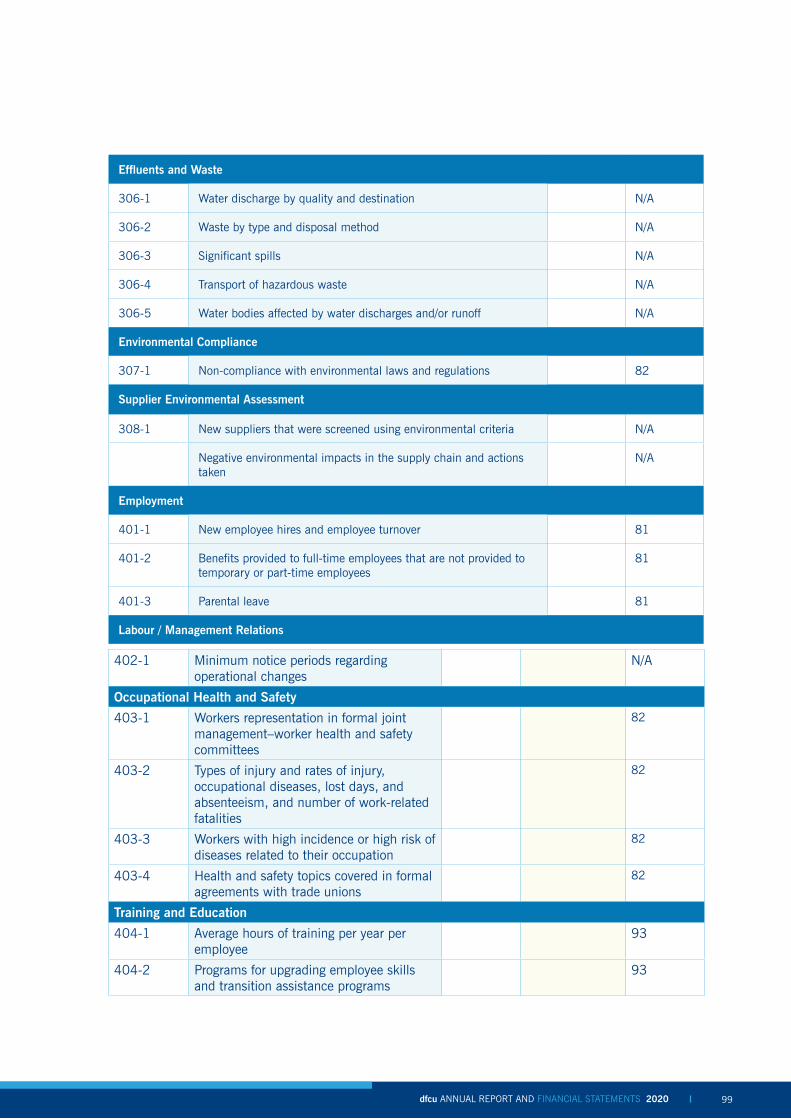
dfcu ANNUAL REPORT AND FINANCIAL STATEMENTS 2020 dfcu ANNUAL REPORT AND FINANCIAL STATEMENTS 2020 9998
Effluents and Waste
306-1 Water discharge by quality and destination N/A
306-2 Waste by type and disposal method N/A
306-3 Significant spills N/A
306-4 Transport of hazardous waste N/A
306-5 Water bodies affected by water discharges and/or runoff N/A
Environmental Compliance
307-1 Non-compliance with environmental laws and regulations 82
Supplier Environmental Assessment
308-1 New suppliers that were screened using environmental criteria N/A
Negative environmental impacts in the supply chain and actions taken
N/A
Employment
401-1 New employee hires and employee turnover 81
401-2 Benefits provided to full-time employees that are not provided to temporary or part-time employees
81
401-3 Parental leave 81
Labour / Management Relations
402-1 Minimum notice periods regarding operational changes
N/A
Occupational Health and Safety
403-1 Workers representation in formal joint management–worker health and safety committees
82
403-2 Types of injury and rates of injury, occupational diseases, lost days, and absenteeism, and number of work-related fatalities
82
403-3 Workers with high incidence or high risk of diseases related to their occupation
82
403-4 Health and safety topics covered in formal agreements with trade unions
82
Training and Education
404-1 Average hours of training per year per employee
93
404-2 Programs for upgrading employee skills and transition assistance programs
93
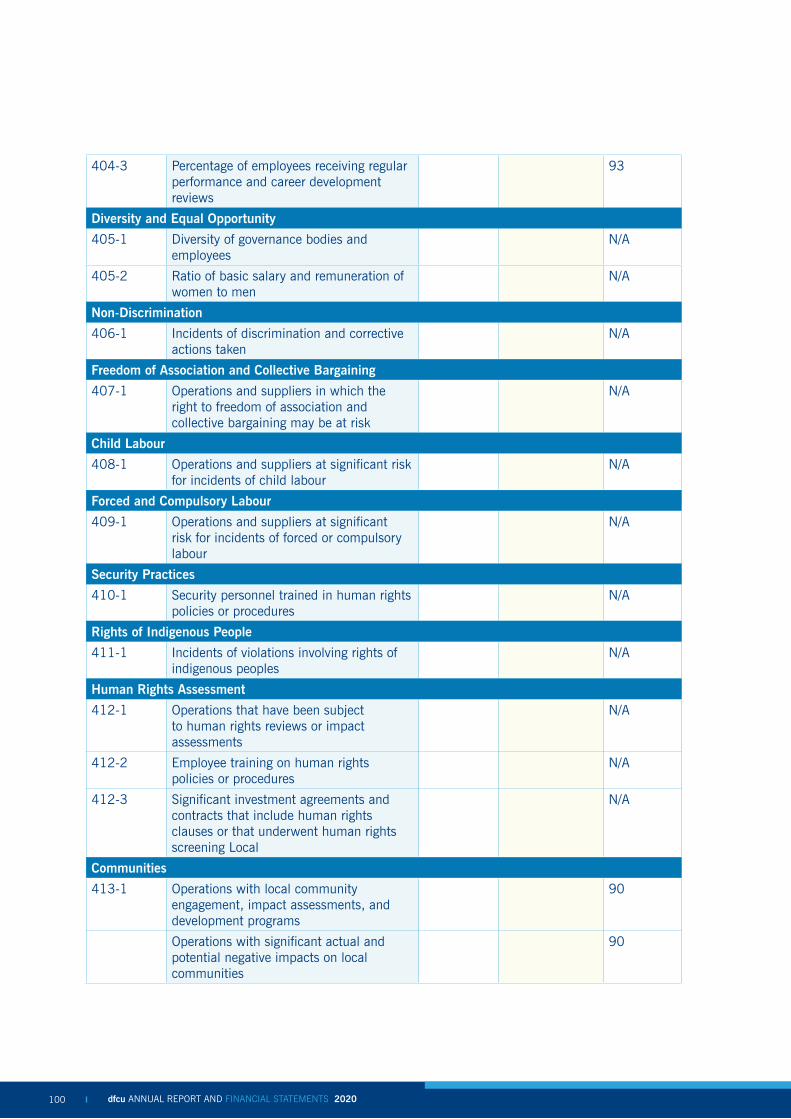
dfcu ANNUAL REPORT AND FINANCIAL STATEMENTS 2020 dfcu ANNUAL REPORT AND FINANCIAL STATEMENTS 2020 101100
404-3 Percentage of employees receiving regular performance and career development reviews
93
Diversity and Equal Opportunity
405-1 Diversity of governance bodies and employees
N/A
405-2 Ratio of basic salary and remuneration of women to men
N/A
Non-Discrimination
406-1 Incidents of discrimination and corrective actions taken
N/A
Freedom of Association and Collective Bargaining
407-1 Operations and suppliers in which the right to freedom of association and collective bargaining may be at risk
N/A
Child Labour
408-1 Operations and suppliers at significant risk for incidents of child labour
N/A
Forced and Compulsory Labour
409-1 Operations and suppliers at significant risk for incidents of forced or compulsory labour
N/A
Security Practices
410-1 Security personnel trained in human rights policies or procedures
N/A
Rights of Indigenous People
411-1 Incidents of violations involving rights of indigenous peoples
N/A
Human Rights Assessment
412-1 Operations that have been subject to human rights reviews or impact assessments
N/A
412-2 Employee training on human rights policies or procedures
N/A
412-3 Significant investment agreements and contracts that include human rights clauses or that underwent human rights screening Local
N/A
Communities
413-1 Operations with local community engagement, impact assessments, and development programs
90
Operations with significant actual and potential negative impacts on local communities
90

dfcu ANNUAL REPORT AND FINANCIAL STATEMENTS 2020 dfcu ANNUAL REPORT AND FINANCIAL STATEMENTS 2020 101100
Supplier Socio Assessment
414-1 New suppliers that were screened using social criteria
N/A
414-2 Negative social impacts in the supply chain and actions taken
N/A
Public Policy
415-1 Political contributions N/A
Customer health and Safety
416-1 Assessment of the health and safety impacts of product and service categories
N/A
Incidents of non-compliance concerning the health and safety impacts of products and services
N/A
Marketing and Labelling
417-1 Requirements for product and service information and labelling
N/A
417-2 Incidents of non-compliance concerning product and service information and labelling
N/A
417-3 Incidents of non-compliance concerning marketing communications
N/A
Customer Privacy
418-1 Substantiated complaints concerning breaches of customer privacy and losses of customer data
N/A
Socioeconomic Compliance
419-1 Non-compliance with laws and regulations in the social and economic area
N/A

dfcu ANNUAL REPORT AND FINANCIAL STATEMENTS 2020 dfcu ANNUAL REPORT AND FINANCIAL STATEMENTS 2020 103102
dfcu Limited
CONSOLIDATED AND SEPARATE FINANCIAL STATEMENTSFOR THE YEAR ENDED 31 DECEMBER 2020

dfcu ANNUAL REPORT AND FINANCIAL STATEMENTS 2020 dfcu ANNUAL REPORT AND FINANCIAL STATEMENTS 2020 103102

dfcu ANNUAL REPORT AND FINANCIAL STATEMENTS 2020 dfcu ANNUAL REPORT AND FINANCIAL STATEMENTS 2020 105104
GROUP INFORMATION
DIRECTORS
E. Karuhanga* - ChairmanM. Turner*** - Non-executive Director (Resigned 1 July 2020) L. Kironde* - Non-executive Director AJM. Jonkergouw** - Non-executive Director Fred Pelser***** - Non-executive DirectorBT Arimi* - Non-executive DirectorA. Zawedde* - Non-executive Director (Appointed 25 August 2020) *Ugandan **Dutch ***British ****Indian *****South African
CORPORATION SECRETARY
Ligomarc Advocates5th Floor Social Security House Plot 4, Jinja RoadP. O. Box 8230 Kampala, Uganda
AUDITOR
Ernst & YoungCertified Public AccountantsErnst & Young HousePlot 18 Clement Hill RoadShimoni Office VillageP. O. Box 7215Kampala, Uganda
REGISTERED OFFICE
Plot 26 Kyadondo RoadP. O. Box 2767 Kampala, Uganda

dfcu ANNUAL REPORT AND FINANCIAL STATEMENTS 2020 dfcu ANNUAL REPORT AND FINANCIAL STATEMENTS 2020 105104
GROUP INFORMATION (CONTINUED)
MAIN CORRESPONDENT BANKS
Citibank N.A New YorkInternational ServicesCitibank N.A New York399 Park Avenue, New York, NY10043 U.S.A
Citibank N.A LondonInternational ServicesCitibank N.A LondonCitigroup Centre, Canada square,Canary Wharf, London E14 5LB
First Rand Bank6th Floor, 1 Merchant Place,Corner Fredman & Rivonia RoadSandton, South Africa
Bank of ChinaZhongyin Tower,Yincheng Zhong RoadShangai, China
Kenya Commercial Bank (KCB)Kencom House, Moi Avenue,Nairobi, Kenya
dfcu Bank LimitedPlot 26 Kyadondo RoadP.O. Box 70 Kampala, Uganda
GROUP’S SOLICITORS
M/s MMAKS Advocates,4th Floor Redstone House,Plot 7 Bandali Rise-Bugolobi Kampala.
S& L Advocates (formerly Sebalu and Lule Advocates)14, MacKinnon Road, Nakasero,P.O Box 2255, Kampala.
M/s A.F Mpanga Advocates, Plot 26 Kyadondo Road, Nakasero, P.O. Box 1520 Kampala. K&K Advocates,K&K Chambers,Plot 5A2 Acacia Avenue,P.O. Box 6061, Kampala.
M/s Arcadia Advocates, 3rd Floor Acacia Place,Plot 6 Acacia Avenue,P.O. Box 28997, Kampala.
KTA Advocates,Plot 4 Hannington Road,P.O. Box 37366 ,Kampala
KSMO Advocates 5th Floor Crested Towers 17 Hannington RoadP.O Box 23064, Kampala
Kentaro Mugerwa & Company Advocates, 2nd Floor Mukwano Courts, Plot 13 Buganda Road, Kampala
Kalenge, Bwanika, Ssawa & Co. Advocates.,KBS Chambers,Plot 30, Lumumba Avenue,P.O. Box 8352, Kampala
Amber Solicitors & Advocates,6th Floor Lourdel Towers,Plot 1 Lourdel Road, Kampala
Muganwa Nanteza and Co Advocates,Plot 1-3 Coral- Crescent, Lower Kololo, Nice Apartments,P.O. Box 8543, Kampala
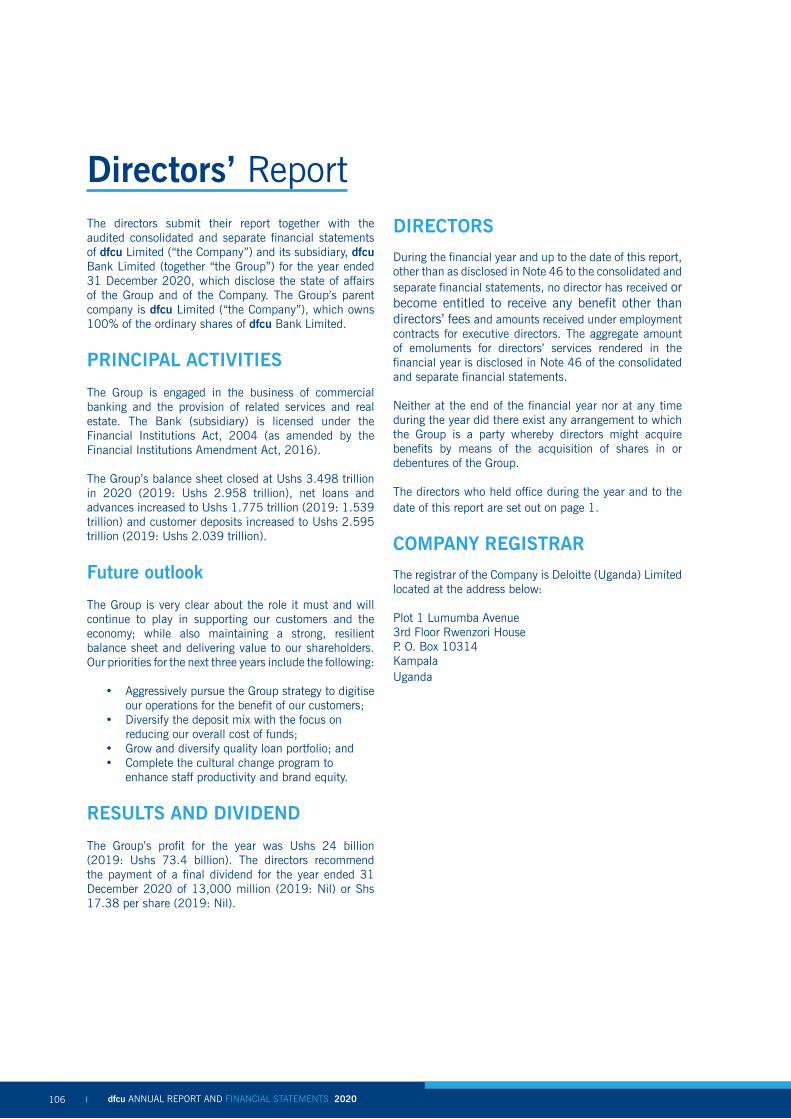
dfcu ANNUAL REPORT AND FINANCIAL STATEMENTS 2020 dfcu ANNUAL REPORT AND FINANCIAL STATEMENTS 2020 107106
Directors’ ReportThe directors submit their report together with the audited consolidated and separate financial statements of dfcu Limited (“the Company”) and its subsidiary, dfcu Bank Limited (together “the Group”) for the year ended 31 December 2020, which disclose the state of affairs of the Group and of the Company. The Group’s parent company is dfcu Limited (“the Company”), which owns 100% of the ordinary shares of dfcu Bank Limited.
PRINCIPAL ACTIVITIES
The Group is engaged in the business of commercial banking and the provision of related services and real estate. The Bank (subsidiary) is licensed under the Financial Institutions Act, 2004 (as amended by the Financial Institutions Amendment Act, 2016).
The Group’s balance sheet closed at Ushs 3.498 trillion in 2020 (2019: Ushs 2.958 trillion), net loans and advances increased to Ushs 1.775 trillion (2019: 1.539 trillion) and customer deposits increased to Ushs 2.595 trillion (2019: Ushs 2.039 trillion).
Future outlook
The Group is very clear about the role it must and will continue to play in supporting our customers and the economy; while also maintaining a strong, resilient balance sheet and delivering value to our shareholders. Our priorities for the next three years include the following:
• Aggressively pursue the Group strategy to digitise our operations for the benefit of our customers;
• Diversify the deposit mix with the focus on reducing our overall cost of funds;
• Grow and diversify quality loan portfolio; and• Complete the cultural change program to
enhance staff productivity and brand equity.
RESULTS AND DIVIDEND
The Group’s profit for the year was Ushs 24 billion (2019: Ushs 73.4 billion). The directors recommend the payment of a final dividend for the year ended 31 December 2020 of 13,000 million (2019: Nil) or Shs 17.38 per share (2019: Nil).
DIRECTORS
During the financial year and up to the date of this report, other than as disclosed in Note 46 to the consolidated and separate financial statements, no director has received or become entitled to receive any benefit other than directors’ fees and amounts received under employment contracts for executive directors. The aggregate amount of emoluments for directors’ services rendered in the financial year is disclosed in Note 46 of the consolidated and separate financial statements.
Neither at the end of the financial year nor at any time during the year did there exist any arrangement to which the Group is a party whereby directors might acquire benefits by means of the acquisition of shares in or debentures of the Group.
The directors who held office during the year and to the date of this report are set out on page 1.
COMPANY REGISTRAR
The registrar of the Company is Deloitte (Uganda) Limited located at the address below:
Plot 1 Lumumba Avenue3rd Floor Rwenzori HouseP. O. Box 10314KampalaUganda

dfcu ANNUAL REPORT AND FINANCIAL STATEMENTS 2020 dfcu ANNUAL REPORT AND FINANCIAL STATEMENTS 2020 107106
DIRECTORS’ REPORT (CONTINUED)
AUDITOR
The Group’s external auditor, Ernst & Young, being eligible for reappointment have expressed willingness to continue in office in accordance with Section 167(2) of the Companies Act, 2012 of Uganda.
ISSUE OF CONSOLIDATED AND SEPARATE FINANCIAL STATEMENTS
The consolidated and separate financial statements were authorised for issue in accordance with a resolution of the directors dated 29 March 2021.
By order of the Board
………………………………………Ligomarc Advocates5th Floor Social Security House Plot 4, Jinja RoadP O Box 8230 Kampala, Uganda
COMPANY SECRETARY
Date: 29 March 2021
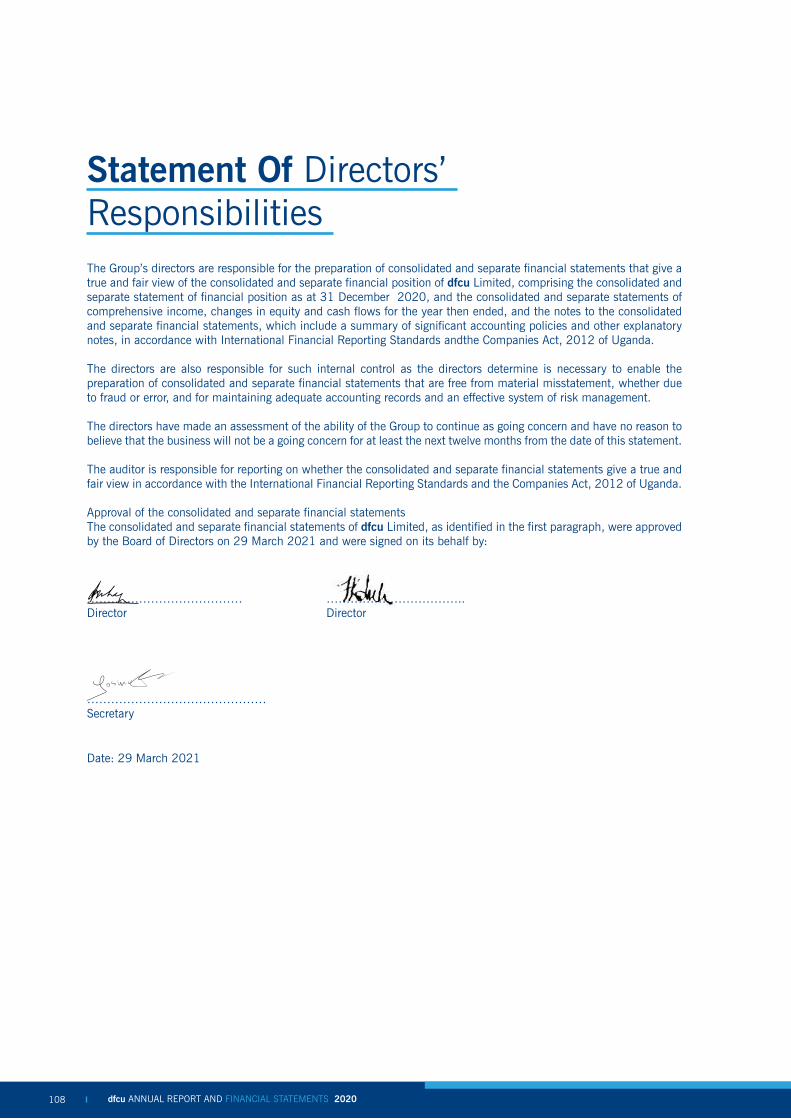
dfcu ANNUAL REPORT AND FINANCIAL STATEMENTS 2020 dfcu ANNUAL REPORT AND FINANCIAL STATEMENTS 2020 109108
Statement Of Directors’ Responsibilities The Group’s directors are responsible for the preparation of consolidated and separate financial statements that give a true and fair view of the consolidated and separate financial position of dfcu Limited, comprising the consolidated and separate statement of financial position as at 31 December 2020, and the consolidated and separate statements of comprehensive income, changes in equity and cash flows for the year then ended, and the notes to the consolidated and separate financial statements, which include a summary of significant accounting policies and other explanatory notes, in accordance with International Financial Reporting Standards andthe Companies Act, 2012 of Uganda.
The directors are also responsible for such internal control as the directors determine is necessary to enable the preparation of consolidated and separate financial statements that are free from material misstatement, whether due to fraud or error, and for maintaining adequate accounting records and an effective system of risk management.
The directors have made an assessment of the ability of the Group to continue as going concern and have no reason to believe that the business will not be a going concern for at least the next twelve months from the date of this statement.
The auditor is responsible for reporting on whether the consolidated and separate financial statements give a true and fair view in accordance with the International Financial Reporting Standards and the Companies Act, 2012 of Uganda.
Approval of the consolidated and separate financial statementsThe consolidated and separate financial statements of dfcu Limited, as identified in the first paragraph, were approved by the Board of Directors on 29 March 2021 and were signed on its behalf by:
………………………………… ……………………………..Director Director
………………………………………Secretary
Date: 29 March 2021

dfcu ANNUAL REPORT AND FINANCIAL STATEMENTS 2020 dfcu ANNUAL REPORT AND FINANCIAL STATEMENTS 2020 109108
REPORT OF THE INDEPENDENT AUDITOR TO THE MEMBERS OF dfcu LIMITED
REPORT ON THE AUDIT OF THE CONSOLIDATED AND SEPARATE FINANCIAL STATEMENTS
Our opinion
We have audited the separate financial statements of dfcu Limited (the ‘’Company’’) and the consolidated financial statements comprising the Company and its subsidiary (together, the ‘’Group’’) set out on pages 114 to 226, which comprise the consolidated and separate statements of financial position as at 31 December 2020, and the consolidated and separate statements of profit or loss and other comprehensive income, consolidated and separate statements of changes in equity and consolidated and separate statements of cash flows for the year then ended, and notes to the consolidated and separate financial statements, including a summary of significant accounting policies.
In our opinion, the consolidated and separate financial statements present fairly, in all material respects, the consolidated and separate financial position of the Group and Company as at 31 December 2020, and the consolidated and separate financial performance and consolidated and separate cash flows for the year then ended in accordance with International Financial Reporting Standards and the requirements of the Companies Act, 2012 of Uganda.
Basis for opinion
We conducted our audit in accordance with International Standards on Auditing (“ISAs”). Our responsibilities under those standards are further described in the Auditor’s responsibilities for the audit of the consolidated and separate financial statements section of our report. We are independent of the Group and the Company in accordance with the International Ethics Standards Board for Accountants’ Code of Ethics for Professional Accountants (IESBA Code) together with the ethical requirements that are relevant to our audit of the consolidated and separate financial statements of the Group and the Company in Uganda, and we have fulfilled our other ethical responsibilities in accordance with these requirements and the IESBA Code. We believe that the audit evidence we have obtained is sufficient and appropriate to provide a basis for our opinion.
Other matter
The consolidated and separate financial statements of the Group and the Company for the year ended 31 December 2019 were audited by another auditor who expressed an unmodified opinion on those statements on 30 March 2020.
Key audit matters
Key audit matters are those matters that, in our professional judgement, were of most significance in our audit of the financial statements of the current period. These matters were addressed in the context of our audit of the consolidated and separate financial statements as a whole, and in forming our opinion thereon, and we do not provide a separate opinion on these matters. For each matter below, our description of how our audit addressed the matter is provided in that context.
We have fulfilled the responsibilities described in the Auditor’s Responsibilities for the Audit of the consolidated and separate financial statements section of our report, including in relation to these matters. Accordingly, our audit included the performance of procedures designed to respond to our assessment of the risks of material misstatement of the consolidated and separate financial statements. The results of our audit procedures, including the procedures performed to address the matters below, provide the basis for our audit opinion on the accompanying consolidated and separate financial statements.
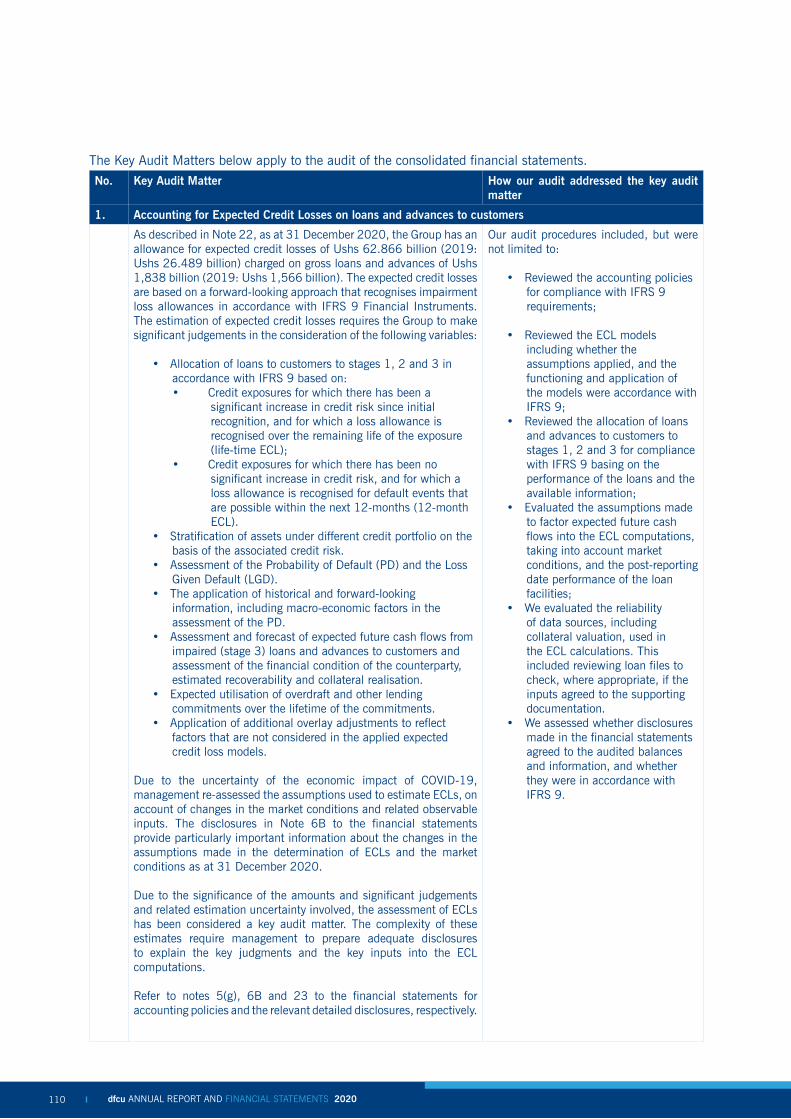
dfcu ANNUAL REPORT AND FINANCIAL STATEMENTS 2020 dfcu ANNUAL REPORT AND FINANCIAL STATEMENTS 2020 111110
The Key Audit Matters below apply to the audit of the consolidated financial statements.
No. Key Audit Matter How our audit addressed the key audit matter
1. Accounting for Expected Credit Losses on loans and advances to customers
As described in Note 22, as at 31 December 2020, the Group has an allowance for expected credit losses of Ushs 62.866 billion (2019: Ushs 26.489 billion) charged on gross loans and advances of Ushs 1,838 billion (2019: Ushs 1,566 billion). The expected credit losses are based on a forward-looking approach that recognises impairment loss allowances in accordance with IFRS 9 Financial Instruments. The estimation of expected credit losses requires the Group to make significant judgements in the consideration of the following variables:
• Allocation of loans to customers to stages 1, 2 and 3 in accordance with IFRS 9 based on:• Credit exposures for which there has been a
significant increase in credit risk since initial recognition, and for which a loss allowance is recognised over the remaining life of the exposure (life-time ECL);
• Credit exposures for which there has been no significant increase in credit risk, and for which a loss allowance is recognised for default events that are possible within the next 12-months (12-month ECL).
• Stratification of assets under different credit portfolio on the basis of the associated credit risk.
• Assessment of the Probability of Default (PD) and the Loss Given Default (LGD).
• The application of historical and forward-looking information, including macro-economic factors in the assessment of the PD.
• Assessment and forecast of expected future cash flows from impaired (stage 3) loans and advances to customers and assessment of the financial condition of the counterparty, estimated recoverability and collateral realisation.
• Expected utilisation of overdraft and other lending commitments over the lifetime of the commitments.
• Application of additional overlay adjustments to reflect factors that are not considered in the applied expected credit loss models.
Due to the uncertainty of the economic impact of COVID-19, management re-assessed the assumptions used to estimate ECLs, on account of changes in the market conditions and related observable inputs. The disclosures in Note 6B to the financial statements provide particularly important information about the changes in the assumptions made in the determination of ECLs and the market conditions as at 31 December 2020.
Due to the significance of the amounts and significant judgements and related estimation uncertainty involved, the assessment of ECLs has been considered a key audit matter. The complexity of these estimates require management to prepare adequate disclosures to explain the key judgments and the key inputs into the ECL computations.
Refer to notes 5(g), 6B and 23 to the financial statements for accounting policies and the relevant detailed disclosures, respectively.
Our audit procedures included, but were not limited to:
• Reviewed the accounting policies for compliance with IFRS 9 requirements;
• Reviewed the ECL models including whether the assumptions applied, and the functioning and application of the models were accordance with IFRS 9;
• Reviewed the allocation of loans and advances to customers to stages 1, 2 and 3 for compliance with IFRS 9 basing on the performance of the loans and the available information;
• Evaluated the assumptions made to factor expected future cash flows into the ECL computations, taking into account market conditions, and the post-reporting date performance of the loan facilities;
• We evaluated the reliability of data sources, including collateral valuation, used in the ECL calculations. This included reviewing loan files to check, where appropriate, if the inputs agreed to the supporting documentation.
• We assessed whether disclosures made in the financial statements agreed to the audited balances and information, and whether they were in accordance with IFRS 9.

dfcu ANNUAL REPORT AND FINANCIAL STATEMENTS 2020 dfcu ANNUAL REPORT AND FINANCIAL STATEMENTS 2020 111110
2. Valuation of non-performing loans acquired from Crane Bank Limited (In Liquidation)
As disclosed in Note 26 to the financial statements, the Group recognised a financial asset based on the fair valuation of written off and non-performing loans and advances acquired from Crane Bank Limited (In Liquidation). The financial asset is measured at fair value through profit or loss and amounts to Ushs 109.892 billion as at 31 December 2020 (2019: Ushs 166.283 billion). A fair value loss of Ushs 50.488 billion has been recognised for the year ended 31 December 2020 (2019: Ushs 10.105 billion).
The fair valuation of the financial asset is determined using the discounted cash flows method. The valuation of the financial asset is considered a key audit matter due to the significant amounts and judgments involved. The key judgements include estimating the future cashflows expected from the facilities, the time when the cash flows will be received and discount rate to apply in the computation. The estimation process is further complicated by the impact of the Covid-19 pandemic on the counterparties and general business environment.
We also considered that the related disclosures in Note 25 are significant to the understanding of these financial assets.
Our audit procedures included, but were not limited, to:
• Reviewed documentation supporting management’s assessment of the expected future cash flows including loan files, correspondence with the counterparties, payment plans agreed with the counterparties, collateral valuation reports, and legal reports.
• Basing on the information available in the documents reviewed, we evaluated the realizability and timing of cash flows expected from payments from counterparties and disposal of collateral, and where litigation is involved, the likely outcome of the litigation.
• Checked whether assumptions made in previous periods continue to be reasonable by reviewing actual outcomes during the year and subsequent to the reporting date.
• Checked that management considered the impact of the Covid-19 pandemic, for example, on the realizability of expected cash flows including the impact of the pandemic on the valuation of collaterals.
• Checked that the discount rates applied were reasonably supported.
• Assessed whether the disclosures made in the financial statements are complete.

dfcu ANNUAL REPORT AND FINANCIAL STATEMENTS 2020 dfcu ANNUAL REPORT AND FINANCIAL STATEMENTS 2020 113112
Other information
The directors are responsible for the other information. The other information comprises the information included on pages xx to xx which includes the Directors’ Report as required by the Companies Act, 2012 of Uganda, Corporate Information and the Statement of Directors’ Responsibilities which we obtained prior to the date of this report, and the Annual Report, which is expected to be made available to us after that date. Other information does not include the consolidated and separate financial statements and our auditor’s report thereon.
Our opinion on the consolidated and separate financial statements does not cover the other information and we do not express an audit opinion or any form of assurance conclusion thereon.
In connection with our audit of the consolidated and separate financial statements, our responsibility is to read the other information and, in doing so, consider whether the other information is materially inconsistent with the consolidated and separate financial statements or our knowledge obtained in the audit, or otherwise appears to be materially misstated. If, based on the work we have performed, we conclude that there is a material misstatement of this other information, we are required to report that fact. We have nothing to report in this regard.
Auditor’s responsibilities for the audit of the financial statements
Our objectives are to obtain reasonable assurance about whether the consolidated and separate financial statements as a whole are free from material misstatement, whether due to fraud or error, and to issue an auditor’s report that includes our opinion. Reasonable assurance is a high level of assurance but is not a guarantee that an audit conducted in accordance with ISAs will always detect a material misstatement when it exists. Misstatements can arise from fraud or error and are considered material if, individually or in the aggregate, they could reasonably be expected to influence the economic decisions of users taken on the basis of these consolidated and separate financial statements.
As part of an audit in accordance with ISAs, we exercise professional judgment and maintain professional scepticism throughout the audit. We also:
• Identify and assess the risks of material misstatement of the financial statements, whether due to fraud or error, design and perform audit procedures responsive to those risks, and obtain audit evidence that is sufficient and appropriate to provide a basis for our opinion. The risk of not detecting a material misstatement resulting from fraud is higher than for one resulting from error, as fraud may involve collusion, forgery, intentional omissions, misrepresentations, or the override of internal control.
• Obtain an understanding of internal control relevant to the audit in order to design audit procedures that are appropriate in the circumstances, but not for the purpose of expressing an opinion on the effectiveness of the Group’s internal control.
• Evaluate the appropriateness of accounting policies used and the reasonableness of accounting estimates and related disclosures made by management.
• Conclude on the appropriateness of the directors’ use of the going concern basis of accounting and, based on the audit evidence obtained, whether a material uncertainty exists related to events or conditions that may cast significant doubt on the Group’s ability to continue as a going concern. If we conclude that a material uncertainty exists, we are required to draw attention in our auditor’s report to the related disclosures in the financial statements or, if such disclosures are inadequate, to modify our opinion. Our conclusions are based on the audit evidence obtained up to the date of our auditor’s report. However, future events or conditions may cause the Group to cease to continue as a going concern.
• Evaluate the overall presentation, structure and content of the financial statements, including the disclosures, and whether the financial statements represent the underlying transactions and events in a manner that achieves fair presentation.
We communicate with the directors regarding, among other matters, the planned scope and timing of the audit and significant audit findings, including any significant deficiencies in internal control that we identify during our audit.
We also provide the directors with a statement that we have complied with relevant ethical requirements regarding independence, and to communicate with them all relationships and other matters that may reasonably be thought to bear on our independence, and where applicable, related safeguards.
From the matters communicated with the directors, we determine those matters that were of most significance in the audit of the consolidated and separate financial statements of the current year and are therefore the key audit matters. We describe these matters in our auditor’s report unless law or regulation precludes public disclosure about the matter or when, in extremely rare circumstances, we determine that a matter should not be communicated in our report because the adverse consequences of doing so would reasonably be expected to outweigh the public interest benefits of such communication.

dfcu ANNUAL REPORT AND FINANCIAL STATEMENTS 2020 dfcu ANNUAL REPORT AND FINANCIAL STATEMENTS 2020 113112
REPORT ON OTHER LEGAL AND REGULATORY REQUIREMENTS
The Companies Act, 2012 of Uganda, requires that in carrying out our audit we consider and report to you on the following matters. We confirm that:
i) we have obtained all the information and explanations which, to the best of our knowledge and belief, were necessary for the purposes of our audit;
ii) in our opinion, proper books of account have been kept by the Group and the Company, so far as appears from our examination of those books; and,
iii) the Group’s and the Company’s statement of financial position and statement of comprehensive income are in agreement with the books of account.
The Engagement Partner on the audit resulting in this independent auditor’s report is CPA Julius Rwajekare – P0307
……………………………………. ……………………………………..Ernst & Young Julius RwajekareCertified Public Accountants of Uganda PartnerKampala, Uganda
Date: 30 March 2021

dfcu ANNUAL REPORT AND FINANCIAL STATEMENTS 2020 dfcu ANNUAL REPORT AND FINANCIAL STATEMENTS 2020 115114
Consolidated statement of comprehensive income for the year ended 31 December
Note 2020 2019
Ushs M Ushs M
Interest income calculated using the effective interest method 9(a) 335,187 318,670
Other interest and similar income 9(b) 8,635 6,639
Interest expense calculated using the effective interest method 10 (110,434) (105,215)
Net interest income 233,388 220,094
Fees and commission income 13 50,773 65,449
Net trading and other income 11 19,597 16,408
Net income from other financial instruments at FVTPL 12 486 9,644
Total operating income 304,244 311,595
Operating expenses 14 (191,639) (185,750)
Fair value losses on other financial assets at fair value through profit or loss
26 (50,488) (10,105)
Credit loss expense on financial assets 22 (30,632) (14,774)
Profit before tax 31,485 100,966
Income tax expense 19(a) (7,408) (27,564)
Profit after tax for the year 24,077 73,402
Other comprehensive income to be reclassified to profit or loss in subsequent periods:
Net loss on FVOCI financial assets net of tax 41 (978) (452)
Changes in ECL on FVOCI financial instruments 41 34 (13)
Total other comprehensive income (944) (465)
Total comprehensive income for the year 23,133 72,937
Attributable to:
Equity holders of the Company 23,133 72,937
Non-controlling interest - -
23,133 72,937
Earnings per share:
Basic earnings per share 18 32.18 98.11
Diluted earnings per share 18 32.18 98.11

dfcu ANNUAL REPORT AND FINANCIAL STATEMENTS 2020 dfcu ANNUAL REPORT AND FINANCIAL STATEMENTS 2020 115114
Company statement of comprehensive income for the year ended 31 December
Note 2020 2019
Ushs M Ushs M
Interest income 9 13 232
Interest expense 10 (2,863) (2,687)
Net interest income (2,850) (2,455)
Fees and commissions 13 526 614
Dividend income - 24,694
Other income 11 6,235 5,908
Operating income 3,911 28,761
Operating expenses 14 (4,978) (4,691)
Profit before tax (1,067) 24,070
Income tax credit / (charge) 19(a) 827 (783)
(Loss) / profit for the year (240) 23,287
Other comprehensive income
(Loss) /profit for the year (240) 23,287
Other comprehensive income - -
Total comprehensive (loss) / income for the year
(240) 23,287
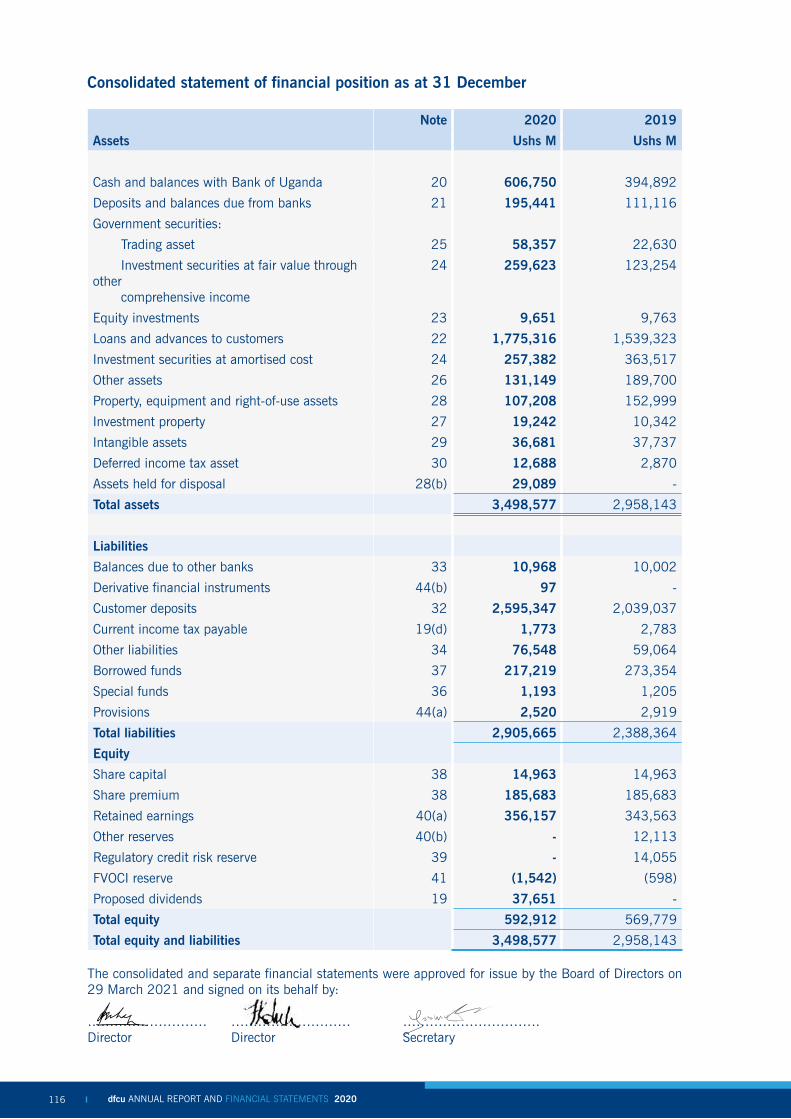
dfcu ANNUAL REPORT AND FINANCIAL STATEMENTS 2020 dfcu ANNUAL REPORT AND FINANCIAL STATEMENTS 2020 117116
Consolidated statement of financial position as at 31 December
Note 2020 2019
Assets Ushs M Ushs M
Cash and balances with Bank of Uganda 20 606,750 394,892
Deposits and balances due from banks 21 195,441 111,116
Government securities:
Trading asset 25 58,357 22,630
Investment securities at fair value through other comprehensive income
24 259,623 123,254
Equity investments 23 9,651 9,763
Loans and advances to customers 22 1,775,316 1,539,323
Investment securities at amortised cost 24 257,382 363,517
Other assets 26 131,149 189,700
Property, equipment and right-of-use assets 28 107,208 152,999
Investment property 27 19,242 10,342
Intangible assets 29 36,681 37,737
Deferred income tax asset 30 12,688 2,870
Assets held for disposal 28(b) 29,089 -
Total assets 3,498,577 2,958,143
Liabilities
Balances due to other banks 33 10,968 10,002
Derivative financial instruments 44(b) 97 -
Customer deposits 32 2,595,347 2,039,037
Current income tax payable 19(d) 1,773 2,783
Other liabilities 34 76,548 59,064
Borrowed funds 37 217,219 273,354
Special funds 36 1,193 1,205
Provisions 44(a) 2,520 2,919
Total liabilities 2,905,665 2,388,364
Equity
Share capital 38 14,963 14,963
Share premium 38 185,683 185,683
Retained earnings 40(a) 356,157 343,563
Other reserves 40(b) - 12,113
Regulatory credit risk reserve 39 - 14,055
FVOCI reserve 41 (1,542) (598)
Proposed dividends 19 37,651 -
Total equity 592,912 569,779
Total equity and liabilities 3,498,577 2,958,143
The consolidated and separate financial statements were approved for issue by the Board of Directors on 29 March 2021 and signed on its behalf by:
……………………… ……………………… …………………………. Director Director Secretary

dfcu ANNUAL REPORT AND FINANCIAL STATEMENTS 2020 dfcu ANNUAL REPORT AND FINANCIAL STATEMENTS 2020 117116
Company statement of financial position as at 31 December
Note 2020 2019
Ushs M Ushs M
Assets
Amounts due from Group companies 46(b) 197 1,714
Other assets 26 17 17
Current income tax recoverable 19(d) 949 1,519
Deferred income tax asset 30 1,164 -
Investment in subsidiaries 31 203,293 203,293
Investment property 27 43,605 46,337
Total assets 249,225 252,880
Liabilities and equity
Liabilities
Other liabilities 34 3,649 8,567
Borrowed funds 37 4,502 4,446
Amounts due to Group companies 46 (a) 15,932 14,252
Deferred income tax liability 30 - 233
Total liabilities 24,083 27,498
Equity
Share capital 38 14,963 14,963
Share premium 38 185,683 185,683
Accumulated losses 40(a) (13,155) 12,623
Proposed dividends 17 37,651 -
Other reserves 40(b) - 12,113
Total equity 225,142 225,382
Total equity and liabilities 249,225 252,880
The consolidated and separate financial statements were approved for issue by the Board of Directors on 29 March 2021 and signed on its behalf by:
……………………………………. ……………………………………….Director Director
…………………………………… Secretary

dfcu ANNUAL REPORT AND FINANCIAL STATEMENTS 2020 dfcu ANNUAL REPORT AND FINANCIAL STATEMENTS 2020 119118
Con
solid
ated
sta
tem
ent
of c
hang
es in
equ
ity for
the
yea
r en
ded
31
Dec
embe
r
Shar
e ca
pita
lSh
are
prem
ium
Ret
aine
d ea
rnin
gsO
ther
re
serv
esR
egul
ator
y re
serv
e
FVO
CI
Rev
alua
tion
rese
rve
Pro
pose
d di
vide
nds
Att
ribu
tabl
e to
eq
uity
hol
ders
of
the
pare
ntTo
tal
Not
eU
shs
MU
shs
MU
shs
MU
shs
MU
shs
MU
shs
MU
shs
MU
shs
MU
shs
M
At
1 J
anua
ry 2
019
14,9
63
185,6
83
276,1
92
12,1
13
8,0
24
(13
3)
24
,69
45
21
,53
65
21
,53
6
Prof
it fo
r th
e ye
ar-
-73,4
02
--
--
73
,40
27
3,4
02
Tran
sfer
s from
the
reg
ulat
ory
rese
rve
39
--
(6,0
31)
-6,0
31
--
--
Loss
allo
wan
ce F
V O
CI
--
--
-(1
3)
-(1
3)
23
FVO
CI r
eval
uatio
n-
--
--
(45
2)
-(4
52
)(4
88
)
Tran
sact
ions
with
sha
reho
lder
s
Div
iden
ds p
aid
--
--
--
(24
,69
4)
(24
,69
4)
(24
,69
4)
Div
iden
ds p
ropo
sed
17
--
--
--
--
-
At
31
Dec
embe
r 2019
14,9
63
185,6
83
343,5
63
12,1
13
14,0
55
(59
8)
-5
69
,77
95
69
,77
9
At
1 J
anua
ry 2
020
14
,96
31
85
,68
33
43
,56
31
2,1
13
14
,055
(598)
-569,7
79
569,7
79
Prof
it fo
r th
e ye
ar-
-2
4,0
77
--
--
24,0
77
24,0
77
Tran
sfer
s from
the
reg
ulat
ory
rese
rve
39
--
14
,05
5-
(14
,055)
--
--
Loss
allo
wan
ce F
V O
CI
--
--
-34
-34
34
FVO
CI r
eval
uatio
n-
--
--
(978)
-(9
78)
(978)
Tran
sfer
fro
m o
ther
res
erve
s-
-1
2,1
13
(12
,11
3)
--
--
-
Tran
sact
ions
with
sha
reho
lder
s
Div
iden
ds p
aid
--
--
--
--
-
Div
iden
ds p
ropo
sed
17
--
(37
,65
1)
--
-37,6
51
--
At
31
Dec
embe
r 2020
14
,96
31
85
,68
33
56
,15
7-
-(1
,542)
37,6
51
592,9
12
592,9
12

dfcu ANNUAL REPORT AND FINANCIAL STATEMENTS 2020 dfcu ANNUAL REPORT AND FINANCIAL STATEMENTS 2020 119118
Com
pany
sta
tem
ent
of c
hang
es in
equ
ity for
the
yea
r en
ded
31
Dec
embe
r
Shar
e ca
pita
l Sh
are
prem
ium
A
ccum
ulat
ed lo
sses
Pro
pose
d di
vide
nds
Oth
er r
eser
ves
Tota
l
Not
eU
shs
MU
shs
MU
shs
MU
shs
MU
shs
MU
shs
M
At
1 J
anua
ry 2
019
14,9
63
185,6
83
(10,6
64)
24
,69
41
2,1
13
22
6,7
89
Prof
it fo
r th
e ye
ar-
-23,2
87
--
23
,28
7
Tran
sact
ions
with
sha
reho
lder
s
Div
iden
ds p
aid
17
--
-(2
4,6
94
)-
(24
,69
4)
At
31
Dec
embe
r 2019
14,9
63
185,6
83
12,6
23
-1
2,1
13
22
5,3
82
At
1 J
anua
ry 2
020
14
,96
31
85
,68
31
2,6
23
-12,1
13
225,3
82
Prof
it fo
r th
e ye
ar-
-(2
40
)-
-(2
40)
Tran
sfer
from
oth
er r
eser
ves
--
12
,11
3-
(12,1
13)
-
Tran
sact
ions
with
sha
reho
lder
s
Div
iden
ds p
aid
17
--
(37
,65
1)
37,6
51
--
At
31
Dec
embe
r 2020
14
,96
31
85
,68
3(1
3,1
55
)37,6
51
-225,1
42
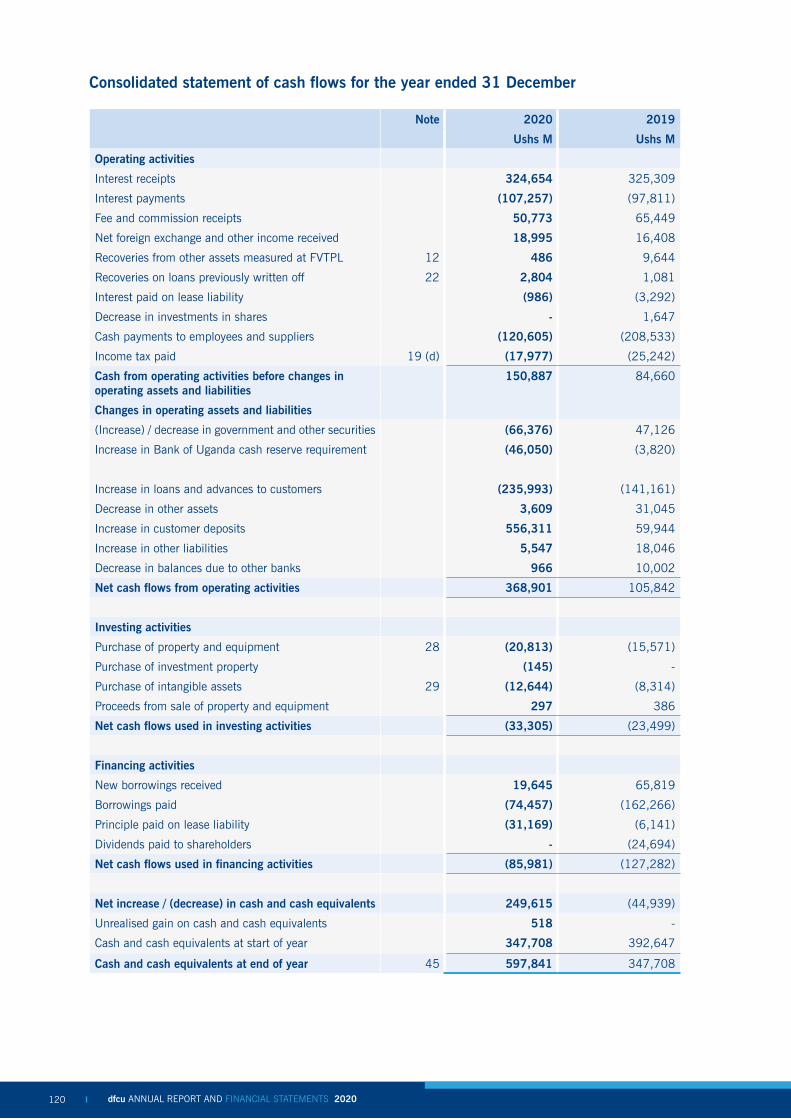
dfcu ANNUAL REPORT AND FINANCIAL STATEMENTS 2020 dfcu ANNUAL REPORT AND FINANCIAL STATEMENTS 2020 121120
Consolidated statement of cash flows for the year ended 31 December
Note 2020 2019
Ushs M Ushs M
Operating activities
Interest receipts 324,654 325,309
Interest payments (107,257) (97,811)
Fee and commission receipts 50,773 65,449
Net foreign exchange and other income received 18,995 16,408
Recoveries from other assets measured at FVTPL 12 486 9,644
Recoveries on loans previously written off 22 2,804 1,081
Interest paid on lease liability (986) (3,292)
Decrease in investments in shares - 1,647
Cash payments to employees and suppliers (120,605) (208,533)
Income tax paid 19 (d) (17,977) (25,242)
Cash from operating activities before changes in operating assets and liabilities
150,887 84,660
Changes in operating assets and liabilities
(Increase) / decrease in government and other securities (66,376) 47,126
Increase in Bank of Uganda cash reserve requirement (46,050) (3,820)
Increase in loans and advances to customers (235,993) (141,161)
Decrease in other assets 3,609 31,045
Increase in customer deposits 556,311 59,944
Increase in other liabilities 5,547 18,046
Decrease in balances due to other banks 966 10,002
Net cash flows from operating activities 368,901 105,842
Investing activities
Purchase of property and equipment 28 (20,813) (15,571)
Purchase of investment property (145) -
Purchase of intangible assets 29 (12,644) (8,314)
Proceeds from sale of property and equipment 297 386
Net cash flows used in investing activities (33,305) (23,499)
Financing activities
New borrowings received 19,645 65,819
Borrowings paid (74,457) (162,266)
Principle paid on lease liability (31,169) (6,141)
Dividends paid to shareholders - (24,694)
Net cash flows used in financing activities (85,981) (127,282)
Net increase / (decrease) in cash and cash equivalents 249,615 (44,939)
Unrealised gain on cash and cash equivalents 518 -
Cash and cash equivalents at start of year 347,708 392,647
Cash and cash equivalents at end of year 45 597,841 347,708

dfcu ANNUAL REPORT AND FINANCIAL STATEMENTS 2020 dfcu ANNUAL REPORT AND FINANCIAL STATEMENTS 2020 121120
Company statement of cash flows for the year ended 31 December
Note 2020 2019
Ushs M Ushs M
Operating activities
Interest receipts 13 232
Interest payments (2,821) (2,687)
Dividend income - 24,694
Fees and commissions 526 614
Net foreign exchange and other income received 6,235 5,908
Cash payments to employees and suppliers (1,908) (2,063)
Cash from operating activities before changes in operating assets and liabilities
2,045 26,698
Changes in operating assets and liabilities
Increase / (decrease) in amounts due to group companies
1,680 (3,060)
Increase in other assets - (1)
(Decrease)/ increase in other liabilities (4,932) 3,289
Net cash flows (used in) / generated from operating activities
(1,207) 26,926
Investing activities
Purchase of investment property 27 (360) (877)
Net cash flows generated from / (used in) investing activities
(360) (877)
Financing activities
Additional drawdowns on borrowings 37 10,000 -
Principle paid on borrowings (9,947) (421)
Dividends paid to shareholders - (24,694)
Net cash flows from financing activities 53 (25,115)
Net (decrease) / increase in cash and cash equivalents
(1,514) 934
Cash and cash equivalents at start of year 1,714 780
Unrealised loss on cash and cash equivalents (3) -
Cash and cash equivalents at end of year 45 197 1,714
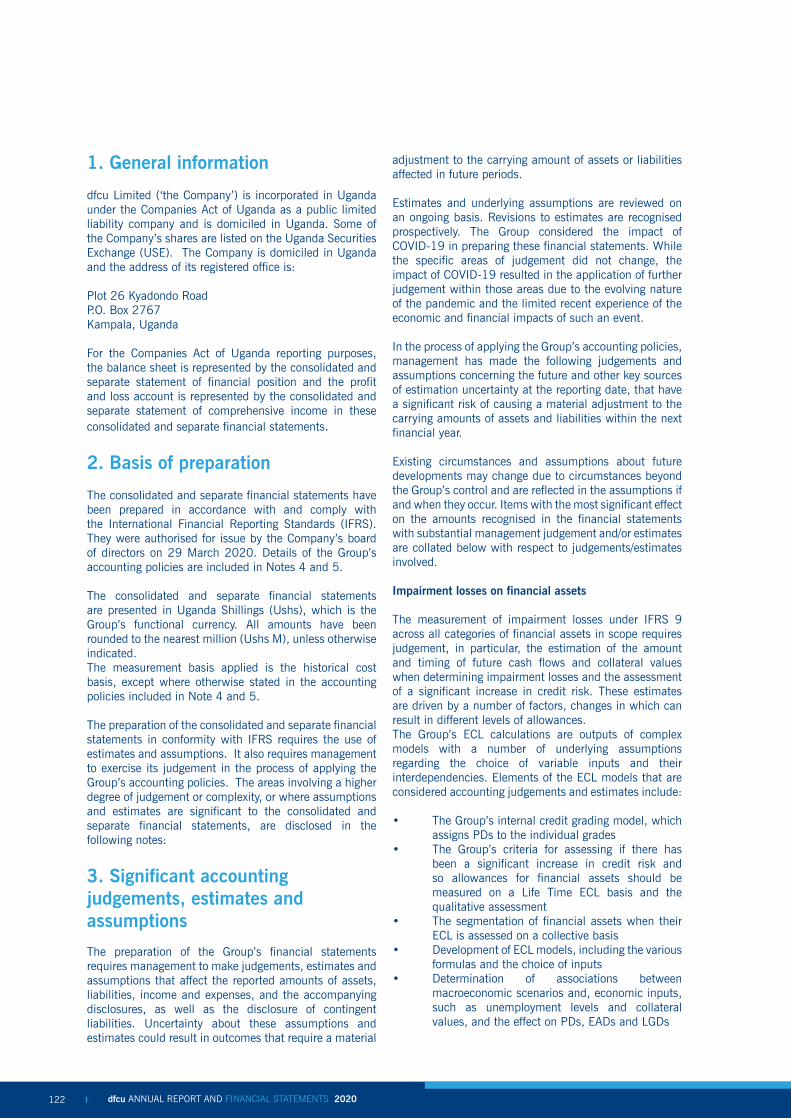
dfcu ANNUAL REPORT AND FINANCIAL STATEMENTS 2020 dfcu ANNUAL REPORT AND FINANCIAL STATEMENTS 2020 123122
1. General information
dfcu Limited (‘the Company’) is incorporated in Uganda under the Companies Act of Uganda as a public limited liability company and is domiciled in Uganda. Some of the Company’s shares are listed on the Uganda Securities Exchange (USE). The Company is domiciled in Uganda and the address of its registered office is:
Plot 26 Kyadondo RoadP.O. Box 2767 Kampala, Uganda
For the Companies Act of Uganda reporting purposes, the balance sheet is represented by the consolidated and separate statement of financial position and the profit and loss account is represented by the consolidated and separate statement of comprehensive income in these consolidated and separate financial statements.
2. Basis of preparation
The consolidated and separate financial statements have been prepared in accordance with and comply with the International Financial Reporting Standards (IFRS). They were authorised for issue by the Company’s board of directors on 29 March 2020. Details of the Group’s accounting policies are included in Notes 4 and 5.
The consolidated and separate financial statements are presented in Uganda Shillings (Ushs), which is the Group’s functional currency. All amounts have been rounded to the nearest million (Ushs M), unless otherwise indicated.The measurement basis applied is the historical cost basis, except where otherwise stated in the accounting policies included in Note 4 and 5.
The preparation of the consolidated and separate financial statements in conformity with IFRS requires the use of estimates and assumptions. It also requires management to exercise its judgement in the process of applying the Group’s accounting policies. The areas involving a higher degree of judgement or complexity, or where assumptions and estimates are significant to the consolidated and separate financial statements, are disclosed in the following notes:
3. Significant accounting judgements, estimates and assumptions
The preparation of the Group’s financial statements requires management to make judgements, estimates and assumptions that affect the reported amounts of assets, liabilities, income and expenses, and the accompanying disclosures, as well as the disclosure of contingent liabilities. Uncertainty about these assumptions and estimates could result in outcomes that require a material
adjustment to the carrying amount of assets or liabilities affected in future periods.
Estimates and underlying assumptions are reviewed on an ongoing basis. Revisions to estimates are recognised prospectively. The Group considered the impact of COVID-19 in preparing these financial statements. While the specific areas of judgement did not change, the impact of COVID-19 resulted in the application of further judgement within those areas due to the evolving nature of the pandemic and the limited recent experience of the economic and financial impacts of such an event.
In the process of applying the Group’s accounting policies, management has made the following judgements and assumptions concerning the future and other key sources of estimation uncertainty at the reporting date, that have a significant risk of causing a material adjustment to the carrying amounts of assets and liabilities within the next financial year.
Existing circumstances and assumptions about future developments may change due to circumstances beyond the Group’s control and are reflected in the assumptions if and when they occur. Items with the most significant effect on the amounts recognised in the financial statements with substantial management judgement and/or estimates are collated below with respect to judgements/estimates involved.
Impairment losses on financial assets
The measurement of impairment losses under IFRS 9 across all categories of financial assets in scope requires judgement, in particular, the estimation of the amount and timing of future cash flows and collateral values when determining impairment losses and the assessment of a significant increase in credit risk. These estimates are driven by a number of factors, changes in which can result in different levels of allowances. The Group’s ECL calculations are outputs of complex models with a number of underlying assumptions regarding the choice of variable inputs and their interdependencies. Elements of the ECL models that are considered accounting judgements and estimates include:
• The Group’s internal credit grading model, which assigns PDs to the individual grades
• The Group’s criteria for assessing if there has been a significant increase in credit risk and so allowances for financial assets should be measured on a Life Time ECL basis and the qualitative assessment
• The segmentation of financial assets when their ECL is assessed on a collective basis
• Development of ECL models, including the various formulas and the choice of inputs
• Determination of associations between macroeconomic scenarios and, economic inputs, such as unemployment levels and collateral values, and the effect on PDs, EADs and LGDs
dfcu ANNUAL REPORT AND FINANCIAL STATEMENTS 2020 dfcu ANNUAL REPORT AND FINANCIAL STATEMENTS 2020 123122
3. Significant accounting judgements, estimates and assumptions (continued)
• Selection of forward-looking macroeconomic scenarios and their probability weightings, to derive the economic inputs into the ECL models
It has been the Group’s policy to regularly review its models in the context of actual loss experience and adjust when necessary. Refer to Note 5(I) for further information on determination of inputs into the ECL measurement model, including key assumptions used in estimating recoverable cash flows and incorporation of forward-looking information.
Going concern
The Group’s directors have made an assessment of its ability to continue as a going concern and are satisfied that it has the resources to continue in business for the foreseeable future. Furthermore, the directors are not aware of any material uncertainties that may cast significant doubt on the Group’s ability to continue as a going concern. Therefore, the financial statements continue to be prepared on the going concern basis.
Fair value of financial instruments
The fair value of financial instruments is the price that would be received to sell an asset or paid to transfer a liability in an orderly transaction in the principal (or most advantageous) market at the measurement date under current market conditions (i.e., an exit price) regardless of whether that price is directly observable or estimated using another valuation technique. When the fair values of financial assets and financial liabilities recorded in the statement of financial position cannot be derived from active markets, they are determined using a variety of valuation techniques that include the use of valuation models. The inputs to these models are taken from observable markets where possible, but where this is not feasible, estimation is required in establishing fair values. Judgements and estimates include considerations of liquidity and model inputs related to items such as credit risk (both own and counterparty), funding value adjustments, correlation and volatility.
For further details about determination of fair value please see Note 6E.
Effective Interest Rate (EIR) method
The Group’s EIR method recognises interest income using a rate of return that represents the best estimate of a constant rate of return over the expected behavioural life of loans and deposits and recognises the effect of potentially different interest rates charged at various stages and other characteristics of the product life
cycle (including prepayments and penalty interest and charges). This estimation, by nature, requires an element of judgement regarding the expected behaviour and life-cycle of the instruments, as well expected changes to the Group’s base rate and other fee income/expense that are integral parts of the instrument. Refer to note 5(C) for further information on the Group’s policy.
Deferred tax assets
Deferred tax assets are recognised in respect of tax losses to the extent that it is probable that future taxable profit will be available against which the tax losses can be utilised. Although in Uganda tax losses can be utilised indefinitely, judgement is required to determine the amount of deferred tax assets that can be recognised, based on the likely timing and level of future taxable profits, together with future tax-planning strategies. Refer to Note 5(L) for further information on recognition of deferred tax assets.
Provisions and other contingent liabilities
The Group operates in a regulatory and legal environment that, by nature, has a heightened element of litigation risk inherent to its operations. As a result, it is involved in various litigation, arbitration and regulatory assessments, arising in the ordinary course of the Group’s business.
When the Group can reliably measure the outflow of economic benefits in relation to a specific case and considers such outflows to be probable, the Group records a provision against the case. Where the probability of outflow is considered to be remote, or probable, but a reliable estimate cannot be made, a contingent liability is disclosed. However, when the Group is of the opinion that disclosing these estimates on a case-by-case basis would prejudice their outcome, then the Group does not include detailed, case-specific disclosers in its financial statements.
Given the subjectivity and uncertainty of determining the probability and amount of losses, the Group takes into account a number of factors including legal advice, the stage of the matter and historical evidence from similar incidents. Significant judgement is required to conclude on these estimates.
For further details on provisions and other contingencies see Note 5(X).
Determination of the lease term for lease contracts with renewal and termination options (Group as a lessee)
The Group determines the lease term as the non-cancellable term of the lease, together with any periods covered by an option to extend the lease if it

dfcu ANNUAL REPORT AND FINANCIAL STATEMENTS 2020 dfcu ANNUAL REPORT AND FINANCIAL STATEMENTS 2020 125124
3. Significant accounting judgements, estimates and assumptions (continued)
is reasonably certain to be exercised, or any periods covered by an option to terminate the lease, if it is reasonably certain not to be exercised.
The Group has several lease contracts that include extension and termination options. The Group applies judgement in evaluating whether it is reasonably certain whether or not to exercise the option to renew or terminate the lease. That is, it considers all relevant factors that create an economic incentive for it to exercise either the renewal or termination. After the commencement date, the Group reassesses the lease term if there is a significant event or change in circumstances that is within its control that affects its ability to exercise or not to exercise the option to renew or to terminate (e.g., construction of significant leasehold improvements or significant customisation of the leased asset).
Estimating the incremental borrowing rate
The Group cannot readily determine the interest rate implicit in the lease, therefore, it uses its incremental borrowing rate (IBR) to measure lease liabilities. The IBR is the rate of interest that the Group would have to pay to borrow over a similar term, and with a similar security, the funds necessary to obtain an asset of a similar value to the right-of-use asset in a similar economic environment. The IBR therefore reflects what the Group ‘would have to pay’, which requires estimation when no observable rates are available or when they need to be adjusted to reflect the terms and conditions of the lease (for example, when leases are not in the Group’s functional currency).The Group estimates the IBR using observable inputs (such as market interest rates) when available and is required to make certain entity-specific adjustments.
4. Changes in significant accounting policies
The Group has not early adopted any standards, interpretations or amendments that have been issued but are not yet effective on or after 1 January 2020. Several other amendments and interpretations apply for the first time in 2020, but do not have an impact on the Group’s financial statements.
Standards issued but not yet effective
The new and amended standards and interpretations that are issued, but not yet effective, up to the date of issuance of the Group’s financial statements are disclosed below. The Group intends to adopt these standards, if
applicable, when they become effective.
Amendments to IAS 1: Classification of Liabilities as Current or Non-current
In January 2020, the IASB issued amendments to paragraphs 69 to 76 of IAS 1 to specify the requirements for classifying liabilities as current or non-current. The amendments clarify:
• What is meant by a right to defer settlement• That a right to defer must exist at the end of the
reporting period • That classification is unaffected by the likelihood
that an entity will exercise its deferral right • That only if an embedded derivative in a
convertible liability is itself an equity instrument would the terms of a liability not impact its classification.
The amendments are effective for annual reporting periods beginning on or after 1 January 2023 and must be applied retrospectively. The Group is currently assessing the impact the amendments will have on current practice and whether existing loan agreements may require renegotiation.
Onerous Contracts – Costs of Fulfilling a Contract – Amendments to IAS 37
In May 2020, the IASB issued amendments to IAS 37 to specify which costs an entity needs to include when assessing whether a contract is onerous or loss-making.The amendments apply a “directly related cost approach”. The costs that relate directly to a contract to provide goods or services include both incremental costs and an allocation of costs directly related to contract activities. General and administrative costs do not relate directly to a contract and are excluded unless they are explicitly chargeable to the counterparty under the contract.The amendments are effective for annual reporting periods beginning on or after 1 January 2022. The Group will apply these amendments to contracts for which it has not yet fulfilled all its obligations at the beginning of the annual reporting period in which it first applies the amendments.
IFRS 9 Financial Instruments – Fees in the ’10 per cent’ test for derecognition of financial liabilities
As part of its 2018-2020 annual improvements to IFRS standards process the IASB issued amendment to IFRS 9. The amendment clarifies the fees that an entity includes when assessing whether the terms of a new or modified financial liability are substantially different from the terms of the original financial liability. These fees include only those paid or received between the borrower and the lender, including fees paid or received
dfcu ANNUAL REPORT AND FINANCIAL STATEMENTS 2020 dfcu ANNUAL REPORT AND FINANCIAL STATEMENTS 2020 125124
4. Changes in significant accounting policies (continued)
by either the borrower or lender on the other’s behalf. An entity applies the amendment to financial liabilities that are modified or exchanged on or after the beginning of the annual reporting period in which the entity first applies the amendment.
The amendment is effective for annual reporting periods beginning on or after 1 January 2022 with earlier adoption permitted. The Group will apply the amendments to financial liabilities that are modified or exchanged on or after the beginning of the annual reporting period in which the entity first applies the amendment.
The Group is still assessing the impact the amendments will have on the financial statements.
Standards issued but not yet effective that are not expected to have a material impact on the Group’s financial statements include:
• IFRS 17 Insurance Contracts (effective for reporting periods beginning on or after 1 January 2023)
• Reference to the Conceptual Framework – Amendments to IFRS 3 (effective for annual reporting periods beginning on or after 1 January 2022)
• Property, Plant and Equipment: Proceeds before Intended Use – Amendments to IAS 16 (effective for annual reporting periods beginning on or after 1 January 2022)
• IFRS 1 First-time Adoption of International Financial Reporting Standards – Subsidiary as a first-time
• Adopter (effective for annual reporting periods beginning on or after 1 January 2022)
• IAS 41 Agriculture – Taxation in fair value measurements (effective on or after the beginning of the first annual reporting period beginning on or after 1 January 2022)
‘Interest Rate Benchmark Reform – Phase 2 Amendments to IFRS 9, IAS 39, IFRS 7, IFRS 4 and IFRS 16’ (IBOR reform Phase 2)
IBOR reform Phase 2 provides temporary reliefs that allow the Group’s hedging relationships to continue upon the replacement of an existing interest rate benchmark with an RFR. The reliefs require the Group to amend hedge designations and hedge documentation. This includes redefining the hedged risk to reference an RFR, redefining the description of the hedging instrument and
/ or the hedged item to reference the RFR and amending the method for assessing hedge effectiveness. Updates to the hedging documentation must be made by the end of the reporting period in which a replacement takes place. For the retrospective assessment of hedge effectiveness, the Group may elect on a hedge by hedge basis to reset the cumulative fair value change to zero. The Group may designate an interest rate as a non-contractually specified, hedged risk component of changes in the fair value or cash flows of a hedged item, provided the interest rate risk component is separately identifiable, e.g., it is an established benchmark that is widely used in the market to price loans and derivatives.
For new RFRs that are not yet an established benchmark, relief is provided from this requirement provided the Group reasonably expects the RFR to become separately identifiable within 24 months. For hedges of groups of items, the Group is required to transfer to subgroups those instruments that reference RFRs. Any hedging relationships that prior to application of IBOR reform Phase 2, have been discontinued solely due to IBOR reform and meet the qualifying criteria for hedge accounting when IBOR reform Phase 2 is applied, must be reinstated upon initial application. The amendments are effective for annual periods beginning on or after 1 January 2021 with earlier adoption permitted. The Group is still assessing the impact the amendments will have on the financial statements.
5. Summary of significant accounting policies
The principal accounting policies adopted in the preparation of these consolidated and seperat financial statements are set out below. These policies have been consistently applied to all years presented, unless otherwise stated.
A. Consolidation
The consolidated financial statements comprise the financial statements of dfcu Limited and its subsidiary, dfcu Bank Limited as at 31 December 2020.
Subsidiaries are all entities (including structured entities) over which the Group has control. The Group controls an entity when the Group is exposed to, or has rights to, variable returns from its involvement with the entity (investee) and has the ability to affect those returns through its power over the entity. The Group re-assesses whether or not it controls an investee if facts and circumstances indicate that there are changes to one or more of the three elements of control. Consolidation of a subsidiary begins when the Group obtains control over the subsidiary and ceases when the Group loses control of the subsidiary. Assets, liabilities, income and expenses of a subsidiary acquired or disposed of during the year
dfcu ANNUAL REPORT AND FINANCIAL STATEMENTS 2020 dfcu ANNUAL REPORT AND FINANCIAL STATEMENTS 2020 127126
5. Summary of significant accounting policies (continued)
are included in the consolidated financial statements from the date the Group gains control until the date the Group ceases to control the subsidiary.
Profit or loss and each component of OCI are attributed to the equity holders of the parent of the Group and to the non-controlling interests, even if this results in the non-controlling interests having a deficit balance. When necessary, adjustments are made to the financial statements of subsidiaries to bring their accounting policies in line with the Group’s accounting policies.
Inter-company transactions, balances, income and expenses on transactions between group companies are eliminated. Profits and losses resulting from intercompany transactions that are recognised in assets are also eliminated.
Separate financial statements
In the separate financial statements, investments in subsidiaries and associates are accounted for at cost less impairment. Cost is adjusted to reflect changes in consideration arising from contingent consideration amendments. Cost also includes direct attributable costs of investment. Dividend income is recognised when the right to receive payment is established.
B. Borrowing costs
General and specific borrowing costs directly attributable to the acquisition, construction or production of qualifying assets, which are assets that necessarily take a substantial period of time to get ready for their intended use or sale, are added to the cost of those assets, until such time as the assets are substantially ready for their intended use or sale. Investment income earned on the temporary investment of specific borrowings pending their expenditure on qualifying assets is deducted from the borrowing costs eligible for capitalisation. All other borrowing costs are recognised in profit or loss in the period in which they are incurred.
Specific borrowings are funds borrowed specifically for the purpose of obtaining a qualifying asset. For specific borrowings, the actual costs incurred are capitalised. If the Group temporarily reinvests some funds, investment income earned should be deducted from the borrowing costs eligible for capitalisation. All borrowings that are not specific represent general borrowings. Costs eligible for capitalisation are calculated by applying a capitalisation rate to the expenditures on qualifying assets. The capitalisation rate is the weighted average of the borrowing costs applicable to the borrowings of the entity that are outstanding during the period. The amount of borrowing costs eligible for capitalisation is always
limited to the amount of actual borrowing costs incurred during the period. Where the parent company finances the construction of a qualifying asset using an intra-group loan, the capitalisation rate is adjusted to reflect how the qualifying asset was financed from the perspective of the Group as a whole.
C. Operating income
i. Interest income and expense Interest income and expense are recognised in profit or loss using the effective interest method. The effective interest rate is the rate that exactly discounts the estimated future cash payments and receipts through the expected life of the financial instrument to:
- The gross carrying amount of the financial asset; or
- The amortised cost of the financial liability.
When calculating the effective interest rate for financial instruments other than purchased or originated credit-impaired assets, the Group estimates future cash flows considering all contractual terms of the financial instrument, but not ECL. For purchased or originated credit impaired financial assets, a credit-adjusted effective interest rate is calculated using estimated future cash flows including ECL.
The calculation of the effective interest rate includes transaction costs and fees and points paid or received that are an integral part of the effective interest rate. Transaction costs include incremental costs that are directly attributable to the acquisition or issue of a financial asset or financial liability.
Amortised cost and gross carrying amount
The ‘amortised cost’ of a financial asset or financial liability is the amount at which the financial asset or financial liability is measured on initial recognition minus the principal repayments, plus or minus the cumulative amortisation using the effective interest method of any difference between that initial amount and the maturity amount and, for financial assets, adjusted for any expected credit loss allowance.
The ‘gross carrying amount of a financial asset’ is the amortised cost of a financial asset before adjusting for any expected credit loss allowance.
Calculation of interest income and expense
The effective interest rate of a financial asset or financial liability is calculated on initial recognition of a financial asset or a financial liability. In calculating interest income and expense, the effective interest rate is applied to the
dfcu ANNUAL REPORT AND FINANCIAL STATEMENTS 2020 dfcu ANNUAL REPORT AND FINANCIAL STATEMENTS 2020 127126
5. Summary of significant accounting policies (continued)
gross carrying amount of the asset (when the asset is not credit impaired) or to the amortised cost of the liability. The effective interest rate is revised as a result of periodic re-estimation of cash flows of floating rate instruments to reflect movements in market rates of interest. The effective interest rate is also revised for fair value hedge adjustments at the date amortisation of the hedge adjustment begins.
However, for financial assets that have become credit-impaired subsequent to initial recognition, interest income is calculated by applying the effective interest rate to the amortised cost of the financial asset. If the asset is no longer credit-impaired, then the calculation of interest income reverts to the gross basis.
For financial assets that were credit-impaired on initial recognition, interest income is calculated by applying the credit-adjusted effective interest rate to the amortised cost of the asset. The calculation of interest income does not revert to a gross basis, even if the credit risk of the asset improves.
For information on when financial assets are credit-impaired, see Note 5(I)(vii).
Presentation
Interest income calculated using the effective interest method presented in the statement of profit or loss and OCI includes:
- interest on financial assets and financial liabilities measured at amortised cost;
- interest on debt instruments measured at FVOCI;
Other interest income presented in the statement of profit or loss and OCI includes interest income on finance leases. Interest expense presented in the statement of profit or loss and OCI includes financial liabilities measured at amortised cost
Interest income and expense on all trading assets and liabilities are considered to be incidental to the Group’s trading operations and are presented together with all other changes in the fair value of trading assets and liabilities in net trading income.
Interest income and expense on other financial assets and financial liabilities at FVTPL are presented in net income from other financial instruments at FVTPL.
The Effective Interest Rate method
Under IFRS 9, interest income is recorded using the EIR
method for all financial assets measured at amortised cost, interest rate derivatives for which hedge accounting is applied and the related amortisation/recycling effect of hedge accounting. Interest income on interest bearing financial assets measured at FVOCI under IFRS 9 is also recorded using the EIR method. Interest expense is also calculated using the EIR method for all financial liabilities held at amortised cost. The EIR is the rate that exactly discounts estimated future cash receipts through the expected life of the financial asset or liability or, when appropriate, a shorter period, to the gross carrying amount of the financial asset.
The EIR (and therefore, the amortised cost of the financial asset) is calculated by taking into account transaction costs and any discount or premium on the acquisition of the financial asset, as well as fees and costs that are an integral part of the EIR. The Bank recognises interest income using a rate of return that represents the best estimate of a constant rate of return over the expected life of the loan. Hence, the EIR calculation also takes into account the effect of potentially different interest rates that may be charged at various stages of the financial asset’s expected life, and other characteristics of the product life cycle (including prepayments, penalty interest and charges).
If expectations of fixed rate financial assets’ or liabilities’ cash flows are revised for reasons other than credit risk, then changes to future contractual cash flows are discounted at the original EIR with a consequential adjustment to the carrying amount. The difference from the previous carrying amount is booked as a positive or negative adjustment to the carrying amount of the financial asset or liability on the balance sheet with a corresponding increase or decrease in Interest revenue/expense calculated using the effective interest method.
For floating-rate financial instruments, periodic re-estimation of cash flows to reflect the movements in the market rates of interest also alters the effective interest rate, but when instruments were initially recognised at an amount equal to the principal, re-estimating the future interest payments does not significantly affect the carrying amount of the asset or the liability.
D. Fees and commission
Fee and commission income and expense that are integral to the effective interest rate on a financial asset or financial liability are included in the effective interest rate.
Other fee and commission income, which includes fees and commissions from ledger fees, money transfers, low balance fees, statement fees, unpaid cheques charges, URA licensing, ATM commissions, letters of credit fees, letters of guarantee, telegraphic transfer fees, and other fees and commissions- is recognised as the related services are performed. If a loan commitment is not expected to result in the draw-down of a loan, then the related loan commitment fee is recognised on

dfcu ANNUAL REPORT AND FINANCIAL STATEMENTS 2020 dfcu ANNUAL REPORT AND FINANCIAL STATEMENTS 2020 129128
5. Summary of significant accounting policies (continued)
a straight-line basis over the commitment period. Fee and commission income is recognised at an amount that reflects the consideration to which the Group expects to be entitled in exchange for providing the services.
A contract with a customer that results in a recognised financial instrument in the Group’s consolidated and separate financial statements may be partially in the scope of IFRS 9 and partially in the scope of IFRS 15. If this is the case, then the Group first applies IFRS 9 to separate and measure the part of the contract that is in the scope of IFRS 9 and then applies IFRS 15 to the residual. The performance obligations, as well as the timing of their satisfaction, are identified, and determined, at the inception of the contract. The Group’s revenue contracts do not include multiple performance obligations.
When the Group provides a service to its customers, consideration is invoiced and generally due immediately upon satisfaction of a service provided at a point in time or at the end of the contract period for a service provided over time.The Group has generally concluded that it is the principal in its revenue arrangements because it typically controls the services before transferring them to the customer. More details on the various type of fees and commissions recognised in the scope of IFRS 15 are included in Note 13.
Other fee and commission expenses relate mainly to transaction and service fees, which are expensed as the services are received.
Contract balances
The following are recognised in the statement of financial position arising from revenue from contracts with customers:
• ‘Fees and commissions receivables’ included under ‘Other assets’, which represent the Group’s right to an amount of consideration that is unconditional (i.e., only the passage of time is required before payment of the consideration is due). These are measured at amortised cost and subject to the impairment provisions of IFRS 9.
• ‘Unearned fees and commissions’ included under ‘Other liabilities’, which represent the Group’s obligation to transfer services to a customer for which the Group has received consideration (or an amount of consideration is due) from the customer. A liability for unearned fees and commissions is recognised when the payment is made or the payment is due (whichever is earlier). Unearned fees and commissions are recognised as revenue when (or as) the Group performs.
E. Net trading and other income
‘Net trading income’ comprises gains less losses related to trading assets and liabilities, and includes all fair value changes, interest, dividends and foreign exchange differences, for financial assets and financial liabilities held for trading.
F. Net income from other financial instruments at fair value through profit or loss
Net income from other financial instruments at FVTPL relates to non-trading derivatives held for risk management purposes that do not form part of qualifying hedging relationships, financial assets and financial liabilities designated as at FVTPL and non-trading assets mandatorily measured at FVTPL. The line item includes fair value changes, interest, dividends and foreign exchange differences.
G. Dividend income
Dividend income is recognised when the right to receive income is established. Usually, this is the ex-dividend date for quoted equity securities. Dividends are presented in net trading income, net income from other financial instruments at FVTPL or other revenue based on the underlying classification of the equity investment. Dividends on equity instruments designated as at FVOCI that clearly represent a recovery of part of the cost of the investment are presented in OCI.
H. Foreign currency translation
Items included in the consolidated and separate financial statements are measured using the currency of the primary economic environment in which the entity operates (`the functional currency’). The consolidated and separate financial statements are presented in Uganda Shillings which is the Group’s functional currency. Foreign currency transactions are translated into the functional currency at the spot exchange rates at the date of the transactions.
Monetary assets and liabilities denominated in foreign currencies are translated into the functional currency at the spot exchange rate at the reporting date. The foreign currency gain or loss on monetary items is the difference between the amortised cost in the functional currency at the beginning of the year, adjusted for effective interest and payments during the year, and the amortised cost in the foreign currency translated at the spot exchange rate at the end of the year.
Non-monetary assets and liabilities that are measured at fair value in a foreign currency are translated into the functional currency at the spot exchange rate at the date on which the fair value is determined. Non-monetary

dfcu ANNUAL REPORT AND FINANCIAL STATEMENTS 2020 dfcu ANNUAL REPORT AND FINANCIAL STATEMENTS 2020 129128
5. Summary of significant accounting policies (continued)
items that are measured based on historical cost in a foreign currency are translated using the spot exchange rate at the date of the transaction.
Foreign currency differences related to changes in amortised cost are recognised in profit or loss, and other changes in carrying amount are recognised in other comprehensive income.
I. Financial assets and liabilities
i. Recognition and initial measurement
Date of recognition
The Group initially recognises loans and advances, deposits, debt securities issued and subordinated liabilities on the date on which they are originated (e.g. Loans and advances to customers are recognised when funds are transferred to the customers’ accounts and the Bank recognises balances due to customers when funds are transferred to the Bank). All other financial instruments (including regular-way purchases and sales of financial assets) are recognised on the trade date, which is the date on which the Group becomes a party to the contractual provisions of the instrument.
Initial measurement of financial instruments
The classification of financial instruments at initial recognition depends on their contractual terms and the business model for managing the instruments. A financial asset or financial liability is measured initially at fair value plus or reduced by transaction costs that are directly attributable to its acquisition or issue respectively, for an item not at fair value through profit or loss. The fair value of a financial instrument at initial recognition is generally its transaction price. When the fair value of financial instruments at initial recognition differs from the transaction price, the Group accounts for the Day 1 profit or loss, as described below.
Day 1 profit or loss
When the transaction price of the instrument differs from the fair value at origination and the fair value is based on a valuation technique using only inputs observable in market transactions, the Bank recognises the difference between the transaction price and fair value in net trading income. In those cases where fair value is based on models for which some of the inputs are not observable, the difference between the transaction price and the fair value is deferred and is only recognised in profit or loss when the inputs become observable, or when the instrument is derecognised.
ii. Classification
On initial recognition, a financial asset is classified as measured at: amortised cost, FVOCI or FVTPL. A financial asset is measured at amortised cost if it meets both of the following conditions and is not designated as at FVTPL:
- the asset is held within a business model whose objective is to hold assets to collect contractual cash flows; and
- the contractual terms of the financial asset give rise on specified dates to cash flows that are SPPI.
A debt instrument is measured at FVOCI only if it meets both of the following conditions and is not designated as at FVTPL:
- the asset is held within a business model whose objective is achieved by both collecting contractual cash flows and selling financial assets; and
- the contractual terms of the financial asset give rise on specified dates to cash flows that are SPPI.
On initial recognition of an equity investment that is not held for trading, the Group may irrevocably elect to present subsequent changes in fair value in OCI. This election is made on an investment-by-investment basis.
All other financial assets are classified as measured at FVTPL.
In addition, on initial recognition, the Group may irrevocably designate a financial asset that otherwise meets the requirements to be measured at amortised cost or at FVOCI as at FVTPL if doing so eliminates or significantly reduces an accounting mismatch that would otherwise arise.
Business model assessment
- The Group makes an assessment of the objective of a business model in which an asset is held at a portfolio level because this best reflects the way the business is managed and information is provided to management. The information considered includes:
- the stated policies and objectives for the portfolio and the operation of those policies in practice. In particular, whether management’s strategy focuses on earning contractual interest revenue, maintaining a particular interest rate profile, matching the duration of the financial assets to the duration of the liabilities that are funding those assets or realising cash flows through the sale of the assets;
- how the performance of the portfolio is evaluated and reported to the Group’s management;
- the risks that affect the performance of the business model (and the financial assets held
dfcu ANNUAL REPORT AND FINANCIAL STATEMENTS 2020 dfcu ANNUAL REPORT AND FINANCIAL STATEMENTS 2020 131130
5. Summary of significant accounting policies (continued)
within that business model) and its strategy for how those risks are managed;
- how managers of the business are compensated (e.g. whether compensation is based on the fair value of the assets managed or the contractual cash flows collected); and
- the frequency, volume and timing of sales in prior periods, the reasons for such sales and its expectations about future sales activity. However, information about sales activity is not considered in isolation, but as part of an overall assessment of how the Group’s stated objective for managing the financial assets is achieved and how cash flows are realised.
Financial assets that are held for trading or managed and whose performance is evaluated on a fair value basis are measured at FVTPL because they are neither held to collect contractual cash flows nor held both to collect contractual cash flows and to sell financial assets.
Assessment of whether contractual cash flows are solely payments of principal and interest (SPPI)
For the purposes of this assessment, ‘principal’ is defined as the fair value of the financial asset on initial recognition. ‘Interest’ is defined as consideration RE the time value of money and for the credit risk associated with the principal amount outstanding during a particular period of time and for other basic lending risks and costs (e.g. liquidity risk and administrative costs), as well as profit margin.
In assessing whether the contractual cash flows are SPPI, the Group considers the contractual terms of the instrument. This includes assessing whether the financial asset contains a contractual term that could change the timing or amount of contractual cash flows such that it would not meet this condition. In making the assessment, the Group considers:
- contingent events that would change the amount and timing of cash flows;
- leverage features;- prepayment and extension terms;- terms that limit the Group’s claim to cash flows
from specified assets (e.g. non-recourse loans); and
- features that modify consideration of the time value of money (e.g. periodical reset of interest rates).
The Group holds a portfolio of long-term fixed-rate loans for which the Group has the option to propose to revise the interest rate at periodic reset dates. These reset rights are limited to the market rate at the time of revision. The borrowers have an option to either accept the revised rate or redeem the loan at par without penalty. The Group has determined that the contractual cash flows of these loans are SPPI because the option varies the interest rate in a
way that is consideration for the time value of money, credit risk, other basic lending risks and costs associated with the principal amount outstanding.
Non-recourse loans
In some cases, loans made by the Group that are secured by collateral of the borrower limit the Group’s claim to cash flows of the underlying collateral (non-recourse loans). The Group applies judgement in assessing whether the non-recourse loans meet the SPPI criterion. The Group typically considers the following information when making this judgement:
- whether the contractual arrangement specifically defines the amounts and dates of the cash payments of the loan;
- the fair value of the collateral relative to the amount of the secured financial asset;
- the ability and willingness of the borrower to make contractual payments, notwithstanding a decline in the value of collateral;
- whether the borrower is an individual or a substantive operating entity or is a special-purpose entity;
- the Group’s risk of loss on the asset relative to a full-recourse loan;
- the extent to which the collateral represents all or a substantial portion of the borrower’s assets; and
- whether the Group will benefit from any upside from the underlying assets.
Contractually linked instruments
The Group has some investments in securitisations that are considered contractually linked instruments. Contractually linked instruments each have a specified subordination ranking that determines the order in which any cash flows generated by the pool of underlying investments are allocated to the instruments. Such an instrument meets the SPPI criterion only if all of the following conditions are met:
- the contractual terms of the instrument itself give rise to cash flows that are SPPI without looking through to the underlying pool of financial instruments;
- the underlying pool of financial instruments (i) contains one or more instruments that give rise to cash flows that are SPPI; and (ii) may also contain instruments, such as derivatives, that reduce the cash flow variability of the instruments under (i) and the combined cash flows (of the instruments under (i) and (ii)) give rise to cash flows that are SPPI; or align the cash flows of the contractually linked instruments with the cash flows of the pool of underlying instruments under (i) arising as a result of differences in whether interest rates are fixed or floating or the currency or timing of cash flows; and
- the exposure to credit risk inherent in the

dfcu ANNUAL REPORT AND FINANCIAL STATEMENTS 2020 dfcu ANNUAL REPORT AND FINANCIAL STATEMENTS 2020 131130
5. Summary of significant accounting policies (continued)
contractually linked instruments is equal to or less than the exposure to credit risk of the underlying pool of financial instruments.
Reclassifications
Financial assets are not reclassified subsequent to their initial recognition, except in the period after the Group changes its business model for managing financial assets.
Financial liabilities
The Group classifies its financial liabilities, other than financial guarantees and loan commitments, as measured at amortised cost or FVTPL.
iii. Derecognition
Financial assets
The Group derecognises a financial asset when the contractual rights to the cash flows from the financial asset expire, or it transfers the rights to receive the contractual cash flows in a transaction in which substantially all of the risks and rewards of ownership of the financial asset are transferred or in which the Group neither transfers nor retains substantially all of the risks and rewards of ownership and it does not retain control of the financial asset.
On derecognition of a financial asset, the difference between the carrying amount of the asset (or the carrying amount allocated to the portion of the asset derecognised) and the sum of (i) the consideration received (including any new asset obtained less any new liability assumed) and (ii) any cumulative gain or loss that had been recognised in OCI is recognised in profit or loss.
Any cumulative gain/loss recognised in OCI in respect of equity investment securities designated as at FVOCI is not recognised in profit or loss on derecognition of such securities, as explained in (0). Any interest in transferred financial assets that qualify for derecognition that is created or retained by the Group is recognised as a separate asset or liability.
The Group enters into transactions whereby it transfers assets recognised on its statement of financial position but retains either all or substantially all of the risks and rewards of the transferred assets or a portion of them. In such cases, the transferred assets are not derecognised. Examples of such transactions are securities lending and sale-and-repurchase transactions.
When assets are sold to a third party with a concurrent total rate of return swap on the transferred assets, the
transaction is accounted for as a secured financing transaction similar to sale-and repurchase transactions, because the Group retains all or substantially all of the risks and rewards of ownership of such assets.
In transactions in which the Group neither retains nor transfers substantially all of the risks and rewards of ownership of a financial asset and it retains control over the asset, the Group continues to recognise the asset to the extent of its continuing involvement, determined by the extent to which it is exposed to changes in the value of the transferred asset.
In certain transactions, the Group retains the obligation to service the transferred financial asset for a fee. The transferred asset is derecognised if it meets the derecognition criteria. An asset or liability is recognised for the servicing contract if the servicing fee is more than adequate (asset) or is less than adequate (liability) for performing the servicing.
The Group securitises various loans and advances to customers and investment securities, which generally result in the sale of these assets to unconsolidated securitisation vehicles and in the Group transferring substantially all of the risks and rewards of ownership. The securitisation vehicles in turn issue securities to investors. Interests in the securitised financial assets are generally retained in the form of senior or subordinated tranches, or other residual interests (retained interests). Retained interests are recognised as investment securities.
Financial liabilities
The Group derecognises a financial liability when its contractual obligations are discharged or cancelled or expire.
iv. Modifications of financial assets and financial liabilities
Financial assets
If the terms of a financial asset are modified, then the Group evaluates whether the cash flows of the modified asset are substantially different.
If the cash flows are substantially different, then the contractual rights to cash flows from the original financial asset are deemed to have expired. In this case, the original financial asset is derecognised and a new financial asset is recognised at fair value plus any eligible transaction costs. Any fees received as part of the modification are accounted for as follows:
- fees that are considered in determining the fair value of the new asset and fees that represent reimbursement of eligible transaction costs are included in the initial measurement of the asset; and

dfcu ANNUAL REPORT AND FINANCIAL STATEMENTS 2020 dfcu ANNUAL REPORT AND FINANCIAL STATEMENTS 2020 133132
5. Summary of significant accounting policies (continued)
- other fees are included in profit or loss as part of the gain or loss on derecognition.
If cash flows are modified when the borrower is in financial difficulties, then the objective of the modification is usually to maximise recovery of the original contractual terms rather than to originate a new asset with substantially different terms. If the Group plans to modify a financial asset in a way that would result in forgiveness of cash flows, then it first considers whether a portion of the asset should be written off before the modification takes place (see below for write-off policy). This approach impacts the result of the quantitative evaluation and means that the derecognition criteria are not usually met in such cases.
If the modification of a financial asset measured at amortised cost or FVOCI does not result in derecognition of the financial asset, then the Group first recalculates the gross carrying amount of the financial asset using the original effective interest rate of the asset and recognises the resulting adjustment as a modification gain or loss in profit or loss. For floating-rate financial assets, the original effective interest rate used to calculate the modification gain or loss is adjusted to reflect current market terms at the time of the modification. Any costs or fees incurred and fees received as part of the modification adjust the gross carrying amount of the modified financial asset and are amortised over the remaining term of the modified financial asset.
If such a modification is carried out because of financial difficulties of the borrower, then the gain or loss is presented together with impairment losses. In other cases, it is presented as interest income calculated using the effective interest rate method.
Financial liabilities
The Group derecognises a financial liability when its terms are modified and the cash flows of the modified liability are substantially different. In this case, a new financial liability based on the modified terms is recognised at fair value. The difference between the carrying amount of the financial liability derecognised and consideration paid is recognised in profit or loss. Consideration paid includes non-financial assets transferred, if any, and the assumption of liabilities, including the new modified financial liability.
If the modification of a financial liability is not accounted for as derecognition, then the amortised cost of the liability is recalculated by discounting the modified cash flows at the original effective interest rate and the resulting gain or loss is recognised in profit or loss. For floating-rate financial liabilities, the original effective interest rate used to calculate the modification gain or
loss is adjusted to reflect current market terms at the time of the modification. Any costs and fees incurred are recognised as an adjustment to the carrying amount of the liability and amortised over the remaining term of the modified financial liability by re-computing the effective interest rate on the instrument.
Financial assets
If the terms of a financial asset were modified, then the Group evaluated whether the cash flows of the modified asset were substantially different. If the cash flows were substantially different, then the contractual rights to cash flows from the original financial asset were deemed to have expired. In this case, the original financial asset was derecognised and a new financial asset was recognised at fair value.
If the terms of a financial asset were modified because of financial difficulties of the borrower and the asset was not derecognised, then impairment of the asset was measured using the pre-modification interest rate.
v. Offsetting
Financial assets and financial liabilities are offset and the net amount presented in the statement of financial position when, and only when, the Group currently has a legally enforceable right to set off the amounts and it intends either to settle them on a net basis or to realise the asset and settle the liability simultaneously. Financial assets and financial liabilities are generally reported gross in the statement of financial position except when IFRS netting criteria are met.
Income and expenses are presented on a net basis only when permitted under IFRS, or for gains and losses arising from a group of similar transactions such as in the Group’s trading activity.
vi. Fair value measurement
‘Fair value’ is the price that would be received to sell an asset or paid to transfer a liability in an orderly transaction between market participants at the measurement date in the principal or, in its absence, the most advantageous market to which the Group has access at that date. The fair value of a liability reflects its non-performance risk.
When one is available, the Group measures the fair value of an instrument using the quoted price in an active market for that instrument. A market is regarded as ‘active’ if transactions for the asset or liability take place with sufficient frequency and volume to provide pricing information on an ongoing basis.
If there is no quoted price in an active market, then the Group uses valuation techniques that maximise the use of relevant observable inputs and minimise the use of unobservable inputs. The chosen valuation technique
dfcu ANNUAL REPORT AND FINANCIAL STATEMENTS 2020 dfcu ANNUAL REPORT AND FINANCIAL STATEMENTS 2020 133132
5. Summary of significant accounting policies (continued)
incorporates all of the factors that market participants would take into account in pricing a transaction.
The best evidence of the fair value of a financial instrument on initial recognition is normally the transaction price- i.e. the fair value of the consideration given or received. If the Group determines that the fair value on initial recognition differs from the transaction price and the fair value is evidenced neither by a quoted price in an active market for an identical asset or liability nor based on a valuation technique for which any unobservable inputs are judged to be insignificant in relation to the measurement, then the financial instrument is initially measured at fair value, adjusted to defer the difference between the fair value on initial recognition and the transaction price. Subsequently, that difference is recognised in profit or loss on an appropriate basis over the life of the instrument but no later than when the valuation is wholly supported by observable market data or the transaction is closed out.
If an asset or a liability measured at fair value has a bid price and an ask price, then the Group measures assets and long positions at a bid price and liabilities and short positions at an ask price.
Portfolios of financial assets and financial liabilities that are exposed to market risk and credit risk that are managed by the Group on the basis of the net exposure to either market or credit risk are measured on the basis of a price that would be received to sell a net long position (or paid to transfer a net short position) for the particular risk exposure. Portfolio-level adjustments- e.g. bid-ask adjustment or credit risk adjustments that reflect the measurement on the basis of the net exposure - are allocated to the individual assets and liabilities on the basis of the relative risk adjustment of each of the individual instruments in the portfolio.
The fair value of a financial liability with a demand feature (e.g. a demand deposit) is not less than the amount payable on demand, discounted from the first date on which the amount could be required to be paid.
The Group recognises transfers between levels of the fair value hierarchy as of the end of the reporting period during which the change has occurred.
vii. Impairment
The Group recognises loss allowances for ECL on the following financial instruments that are not measured at FVTPL:
- financial assets that are debt instruments;- lease receivables;- financial guarantee contracts issued; and- loan commitments issued.
No impairment loss is recognised on equity investments.
The Group measures loss allowances at an amount equal to lifetime ECL, except for the following, for which they are measured as 12-month ECL:
- debt investment securities that are determined to have low credit risk at the reporting date; and
- other financial instruments (other than lease receivables) on which credit risk has not increased significantly since their initial recognition.
Loss allowances for lease receivables are always measured at an amount equal to lifetime ECL.
The Group considers a debt investment security to have low credit risk when its credit risk rating is equivalent to the globally understood definition of ‘investment grade’. The Group does not apply the low credit risk exemption to any other financial instruments.
12-month ECL are the portion of ECL that result from default events on a financial instrument that are possible within the 12 months after the reporting date. Financial instruments for which a 12-month ECL is recognised are referred to as ‘Stage 1 financial instruments’.
Life-time ECL are the ECL that result from all possible default events over the expected life of the financial instrument. Financial instruments for which a lifetime ECL is recognised but which are not credit-impaired are referred to as ‘Stage 2 financial instruments’.
Measurement of ECL
ECL are a probability-weighted estimate of credit losses. They are measured as follows:
- financial assets that are not credit-impaired at the reporting date: as the present value of all cash shortfalls (i.e. the difference between the cash flows due to the entity in accordance with the contract and the cash flows that the Group expects to receive);
- financial assets that are credit-impaired at the reporting date: as the difference between the gross carrying amount and the present value of estimated future cash flows;
- undrawn loan commitments: as the present value of the difference between the contractual cash flows that are due to the Group if the commitment is drawn down and the cash flows that the Group expects to receive; and
- financial guarantee contracts: the expected payments to reimburse the holder less any amounts that the Group expects to recover.

dfcu ANNUAL REPORT AND FINANCIAL STATEMENTS 2020 dfcu ANNUAL REPORT AND FINANCIAL STATEMENTS 2020 135134
5. Summary of significant accounting policies (continued)
Restructured financial assets
If the terms of a financial asset are renegotiated or modified or an existing financial asset is replaced with a new one due to financial difficulties of the borrower, then an assessment is made of whether the financial asset should be derecognised and ECL are measured as follows.
- If the expected restructuring will not result in derecognition of the existing asset, then the expected cash flows arising from the modified financial asset are included in calculating the cash shortfalls from the existing asset.
- If the expected restructuring will result in derecognition of the existing asset, then the expected fair value of the new asset is treated as the final cash flow from the existing financial asset at the time of its derecognition. This amount is included in calculating the cash shortfalls from the existing financial asset that are discounted from the expected date of derecognition to the reporting date using the original effective interest rate of the existing financial asset.
Credit-impaired financial assets
At each reporting date, the Group assesses whether financial assets carried at amortised cost and debt financial assets carried at FVOCI, and finance lease receivables are credit-impaired (referred to as ‘Stage 3 financial assets’). A financial asset is ‘credit-impaired’ when one or more events that have a detrimental impact on the estimated future cash flows of the financial asset have occurred.
Evidence that a financial asset is credit-impaired includes the following observable data:
- significant financial difficulty of the borrower or issuer;
- a breach of contract such as a default or past due event;
- the restructuring of a loan or advance by the Group on terms that the Group would not consider otherwise;
- it is becoming probable that the borrower will enter bankruptcy or other financial reorganisation; or
- the disappearance of an active market for a security because of financial difficulties.
A loan that has been renegotiated due to a deterioration in the borrower’s condition is usually considered to be credit-impaired unless there is evidence that the risk of not receiving contractual cash flows has reduced significantly and there are no other indicators of impairment. In
addition, a retail loan that is overdue for 90 days or more is considered credit-impaired even when the regulatory definition of default is different.In making an assessment of whether an investment in sovereign debt is credit-impaired, the Group considers the following factors.
- The market’s assessment of creditworthiness as reflected in the bond yields.
- The rating agencies’ assessments of creditworthiness.
- The country’s ability to access the capital markets for new debt issuance.
- The probability of debt being restructured, resulting in holders suffering losses through voluntary or mandatory debt forgiveness.
- The international support mechanisms in place to provide the necessary support as ‘lender of last resort’ to that country, as well as the intention, reflected in public statements, of governments and agencies to use those mechanisms. This includes an assessment of the depth of those mechanisms and, irrespective of the political intent, whether there is the capacity to fulfil the required criteria.
Presentation of allowance for ECL in the statement of financial position
Loss allowances for ECL are presented in the statement of financial position as follows:
Financial assets measured at amortised cost: as a deduction from the gross carrying amount of the assets;
- loan commitments and financial guarantee contracts: generally, as a provision;
- where a financial instrument includes both a drawn and an undrawn component, and the Group cannot identify the EGL on the loan commitment component separately from those on the drawn component: the Group presents a combined loss allowance for both components. The combined amount is presented as a deduction from the gross carrying amount of the drawn component. Any excess of the loss allowance over the gross amount of the drawn component is presented as a provision; and
- debt instruments measured at FVOCI: no loss allowance is recognised in the statement of financial position because the carrying amount of these assets is their fair value. However, the loss allowance is disclosed and is recognised in the fair value reserve.
Write-off
Loans and debt securities are written off (either partially or in full) when there is no reasonable expectation of recovering a financial asset in its entirety or a portion thereof. This is generally the case when the Group
dfcu ANNUAL REPORT AND FINANCIAL STATEMENTS 2020 dfcu ANNUAL REPORT AND FINANCIAL STATEMENTS 2020 135134
5. Summary of significant accounting policies (continued)
determines that the borrower does not have assets or sources of income that could generate sufficient cash flows to repay the amounts subject to the write-off. This assessment is carried out at the individual asset level.
Recoveries of amounts previously written off are included in ‘impairment losses on financial instruments’ in the statement of profit or loss and OCI.
Financial assets that are written off could still be subject to enforcement activities in order to comply with the Group’s procedures for recovery of amounts due.
Non-integral financial guarantee contracts
The Group assesses whether a financial guarantee contract held is an integral element of a financial asset that is accounted for as a component of that instrument or is a contract that is accounted for separately. The factors that the Group considers when making this assessment include whether:
- the guarantee is implicitly part of the contractual terms of the debt instrument;
- the guarantee is required by laws and regulations that govern the contract of the debt instrument;
- the guarantee is entered into at the same time as and in contemplation of the debt instrument; and
- the guarantee is given by the parent of the borrower or another company within the borrower’s group.
If the Group determines that the guarantee is an integral element of the financial asset, then any premium payable in connection with the initial recognition of the financial asset is treated as a transaction cost of acquiring it. The Group considers the effect of the protection when measuring the fair value of the debt instrument and when measuring ECL.
If the Group determines that the guarantee is not an integral element of the debt instrument, then it recognises an asset representing any prepayment of guarantee premium and a right to compensation for credit losses. A prepaid premium asset is recognised only if the guaranteed exposure neither is credit-impaired nor has undergone a significant increase in credit risk when the guarantee is acquired. These assets are recognised in ‘other assets’. The Group presents gains or losses on a compensation right in profit or loss in the line item ‘impairment losses on financial instruments’.
Measurement of impairment
The Group calculates ECL based on a four probability-weighted scenarios to measure the expected cash shortfalls, discounted at an approximation to the EIR. A cash shortfall is the difference between the cash flows
that are due to an entity in accordance with the contract and the cash flows that the entity expects to receive. The mechanics of the ECL calculations are outlined below and the key elements are, as follows: • PD: The Probability of Default is an estimate of
the likelihood of default over a given time horizon. A default may only happen at a certain time over the assessed period, if the facility has not been previously derecognised and is still in the portfolio. Details are included in Note 6B.
• EAD: The Exposure at Default is an estimate of the exposure at a future default date, taking into account expected changes in the exposure after the reporting date, including repayments of principal and interest, whether scheduled by contract or otherwise, expected drawdowns on committed facilities, and accrued interest from missed payments. Details are included in Note 6B.
• LGD: The Loss Given Default is an estimate of the loss arising in the case where a default occurs at a given time. It is based on the difference between the contractual cash flows due and those that the lender would expect to receive, including from the realisation of any collateral or credit enhancements that are integral to the loan and not required to be recognised separately. It is usually expressed as a percentage of the EAD. Details are included in Note 6B.
When estimating the ECL, the Group considers three scenarios (a base case, an upside and a downside). Each of these is associated with different PDs, EADs and LGDs, as set out in 6B. When relevant, the assessment of multiple scenarios also incorporates how defaulted loans are expected to be recovered, including the probability that the loans will cure and the value of collateral or the amount that might be received for selling the asset.
With the exception of credit cards and other revolving facilities, the maximum period for which the credit losses are determined is the contractual life of a financial instrument unless the Group has the legal right to call it earlier. Impairment losses and releases are accounted for and disclosed separately from modification losses or gains that are accounted for as an adjustment of the financial asset’s gross carrying value.
Reversal of impairment
- For assets measured at amortised cost: If an event occurring after the impairment was recognised caused the amount of impairment loss to decrease, then the decrease in impairment loss was reversed through profit or loss.
- For debt security held at fair value through OCI (FVOCI): If in a subsequent period, the fair value of an impaired debt security increased and the increase could be related objectively to an event occurring after the impairment loss

dfcu ANNUAL REPORT AND FINANCIAL STATEMENTS 2020 dfcu ANNUAL REPORT AND FINANCIAL STATEMENTS 2020 137136
5. Summary of significant accounting policies (continued)
was recognised, then the impairment loss was reversed through profit or loss; otherwise, any increase in fair value was recognised through OCI.
Any subsequent recovery in the fair value of an impaired debt security at FVOCI was always recognised in OCI.
Presentation
Impairment losses were recognised in profit or loss and reflected in an allowance account against loans and receivables. Interest on the impaired assets continued to be recognised through the unwinding of the discount.Impairment losses on investment securities at FVOCI were recognised by reclassifying the losses accumulated in the fair value reserve in equity to profit or loss. The cumulative loss that was reclassified from equity to profit or loss was the difference between the acquisition cost, net of any principal repayment and amortisation, and the current fair value, less any impairment loss previously recognised in profit or loss. Changes in impairment attributable to the application of the effective interest method were reflected as a component of interest income.
Forborne and modified loans
The Group sometimes makes concessions or modifications to the original terms of loans as a response to the borrower’s financial difficulties, rather than taking possession or to otherwise enforce collection of collateral. The Group considers a loan forborne when such concessions or modifications are provided as a result of the borrower’s present or expected financial difficulties and the Group would not have agreed to them if the borrower had been financially healthy. Indicators of financial difficulties include defaults on covenants, or significant concerns raised by the Credit Risk Department. Forbearance may involve extending the payment arrangements and the agreement of new loan conditions. It is the Group’s policy to monitor forborne loans to help ensure that future payments continue to be likely to occur.
If modifications are substantial, the loan is derecognised. Once the terms have been renegotiated without this resulting in the derecognition of the loan, any impairment is measured using the original EIR as calculated before the modification of terms. The Group also reassesses whether there has been a significant increase in credit risk and whether the assets should be classified as Stage 3. Derecognition decisions and classification between Stage 2 and Stage 3 are determined on a case-by-case basis. If these procedures identify a loss in relation to a loan, it is disclosed and managed as an impaired Stage 3 forborne asset until it is collected or written off.
viii. Designation at fair value through profit or loss
Financial assets
At initial recognition, the Group has designated certain financial assets as at FVTPL because this designation eliminates or significantly reduces an accounting mismatch, which would otherwise arise.
Financial liabilities
The Group has designated certain financial liabilities as at FVTPL in either of the following circumstances:
- the liabilities are managed, evaluated and reported internally on a fair value basis; or
- the designation eliminates or significantly reduces an accounting mismatch that would otherwise arise.
Note 7 sets out the amount of each class of financial asset or financial liability that has been designated as at FVTPL. A description of the basis for each designation is set out in the note for the relevant asset or liability class.
Ugandan Financial Institutions Act 2004 requirements
In addition to the measurement of impairment losses on loans and advances in accordance with International Financial Reporting Standards as set out above, the Group is also required by the Financial Institutions Act, 2004 to estimate losses on loans and advances as follows:
i) A specific provision for those loans and advances considered to be non-performing based on criteria and classification of such loans and advances established by the Financial Institutions Credit Classification Regulations, 2005, as follows:
a) substandard assets with arrears period between 90 and 179 days – 20%;
b) doubtful assets with arrears period between 180 days and 364 days – 50%;
c) loss assets with arrears period over 365 days – 100%.
In addition to the arrears period, companies must follow subjective criteria in arriving at the classification attributable to the assets.
ii) A general provision of at least 1% of their total outstanding credit facilities net of specific provisions.
Where provisions for impairment of loans and advances determined in accordance with the Financial Institutions Act, 2004 exceed amounts determined in accordance with IFRS, the excess is taken to a regulatory reserve as an appropriation

dfcu ANNUAL REPORT AND FINANCIAL STATEMENTS 2020 dfcu ANNUAL REPORT AND FINANCIAL STATEMENTS 2020 137136
5. Summary of significant accounting policies (continued)
of retained earnings. Otherwise, the regulatory reserve is reduced to the extent that the provision for impairment determined in accordance with IFRS exceeds that determined in accordance with the Financial Institutions Act, 2004 and the amount taken back to retained earnings.
When a loan is uncollectible, it is written off against the related allowance for loan impairment. Such loans are written off after all the necessary procedures have been completed and the amount of the loss has been determined. Subsequent recoveries of amounts previously written off decrease the charge for loan impairment in profit or loss.
If, in a subsequent period, the amount of the impairment loss decreases and the decrease can be related objectively to an event occurring after the impairment was recognised (such as an improvement in the debtor’s credit rating), the previously recognised impairment loss is reversed by adjusting the allowance account. The amount of the reversal is recognised in profit or loss.
ix. Staff loans
In the normal course of business, the Group advances loans to employees at below market rate. These loans are measured initially at fair value. The favourable loan term offered to employees are dependent on the continued employment and therefore relate to services to be rendered in future periods.
The interest benefit is forfeited if the employee leaves the Group. The benefit is a long term benefit to the employees and the discount arising from the difference between the nominal value and the market value is treated as a prepayment and expensed in profit or loss in the period in which the services are rendered.
J. Property, equipment and right-of-use assets
i. Recognition and measurement
Property and equipment is stated at cost excluding the costs of day–to–day servicing, net of accumulated depreciation and/or accumulated impairment losses, if any. Changes in the expected useful life are accounted for by changing the amortisation period or methodology, as appropriate, and treated as changes in accounting estimates. Right-of-use assets are presented together with property and equipment in the statement of financial position.
Cost includes expenditures that are directly attributable to the acquisition of the asset. The cost of self-constructed assets includes the cost of materials and direct labour, any other costs directly attributable to bringing the asset to a working condition for its intended use, and the costs of dismantling and removing the items and restoring the site on which they are located. Purchased software that is integral to the functionality of the related equipment is capitalised as part of that equipment.
If significant parts of an item of property or equipment have different useful lives, then they are accounted for as separate items (major components) of property and equipment.
An item of property and equipment and any significant part initially recognised is derecognised upon disposal (i.e., at the date the recipient obtains control) or when no future economic benefits are expected from its use or disposal. Any gain or loss arising on de-recognition of the asset (calculated as the difference between the net disposal proceeds and the carrying amount of the asset) is included in profit or loss in the year the asset is derecognised.
ii. Subsequent cost
Subsequent expenditure is capitalised only when it is probable that the future economic benefits of the expenditure will flow to the Group. Ongoing repairs and maintenance are expensed as incurred.
iii. Depreciation
Depreciation of owned assets is calculated using the straight-line method over their estimated useful lives, and is recognised in profit or loss. Right-of-use assets are depreciated on a straight-line basis over the shorter of the lease term and the estimated useful lives of the assets. Land is not depreciated.
The estimated useful lives of significant items of property and equipment are as follows:
Buildings 40 yearsFurniture, fittings and equipment 6 – 7 yearsComputer equipment 3 – 5 yearsMotor vehicles 4 yearsSoftware 5 yearsWork-in-progress Not depreciated
Leasehold improvements are amortised over the shorter of the estimated useful life of the improvements, and the remaining lease term.
Management and directors review the residual value and useful life of an asset at the year end and any change considered to be appropriate in accounting estimate is prospectively adjusted.

dfcu ANNUAL REPORT AND FINANCIAL STATEMENTS 2020 dfcu ANNUAL REPORT AND FINANCIAL STATEMENTS 2020 139138
5. Summary of significant accounting policies (continued)
K. Intangible assets
i. Recognition and measurement
Intangible assets acquired separately are measured on initial recognition at cost. The cost of intangible assets acquired in a business combination is their fair value at the date of acquisition. Following initial recognition, intangible assets are carried at cost less any accumulated amortisation and accumulated impairment losses. Internally generated intangibles, excluding capitalised development costs, are not capitalised and the related expenditure is reflected in profit or loss in the period in which the expenditure is incurred.
The useful lives of intangible assets are assessed as either finite or indefinite.
Goodwill: that arises on the acquisition of subsidiaries is measured at cost less accumulated impairment losses.
Software: acquired by the Group is measured at cost less accumulated amortisation and any accumulated impairment losses.
Expenditure on internally developed software is recognised as an asset when the Group is able to demonstrate: that the product is technically feasible, its intention and ability to complete the development and use the software in a manner that will generate future economic benefits, and that it can reliably measure the costs to complete the development. The capitalised costs of internally developed software include all costs directly attributable to developing the software and capitalised borrowing costs, and are amortised over its useful life. Internally developed software is stated at capitalised cost less accumulated amortisation and any accumulated impairment losses.
ii. Subsequent expenditure
Subsequent expenditure is capitalised only when it increases the future economic benefits embodied in the specific asset to which it relates. All other expenditure on internally generated goodwill and brands, is recognised in profit or loss as incurred.
iii. Amortisation
Intangible assets with finite lives are amortised over their useful economic lives using the straight line method and are assessed for impairment whenever there is an indication that the intangible asset may be impaired. The amortization period and the amortization method for an intangible asset with a finite useful life is reviewed at least at the end of each reporting period.
Changes in the expected useful life or the expected pattern of consumption of future economic benefits embodied in the asset is accounted for by changing the amortization period or method, as appropriate, and are treated as changes in accounting estimates.
The amortization expense on intangible assets with finite lives is recognised in profit or loss in the expense category consistent with the function of the intangible assets.
Amortisation methods, residual values and useful lives are reviewed at each reporting period and adjusted if appropriate.
iv. Derecognition
An item of intangible assets is derecognised upon disposal or when no future economic benefits are expected from its use or disposal. Gains or losses arising from derecognition of an intangible asset are measured as the difference between the net disposal proceeds and the carrying amount of the asset and are recognised profit or loss when the asset is derecognised.
L. Income tax
Income tax expense comprises current and deferred tax. It is recognised in profit or loss except to the extent that it relates to items recognised directly in equity or in OCI.
i. Current tax
Current tax comprises the expected tax payable or receivable on the taxable income or loss for the year and any adjustment to the tax payable or receivable in respect of previous years. The amount of current tax payable or receivable is the best estimate of the tax amount expected to be paid or received that reflects uncertainty related to income taxes, if any. It is measured using tax rates enacted or substantively enacted at the reporting date. Current tax also includes any tax arising from dividends. Management periodically evaluates positions taken in the tax returns with respect to situations in which applicable tax regulations are subject to interpretation and establishes provisions where appropriate.
ii. Deferred tax
Deferred tax is recognised in respect of temporary differences between the carrying amounts of assets and liabilities for financial reporting purposes and the amounts used for taxation purposes.
Deferred tax assets are recognised for unused tax losses, unused tax credits and deductible temporary differences to the extent that it is probable that future
dfcu ANNUAL REPORT AND FINANCIAL STATEMENTS 2020 dfcu ANNUAL REPORT AND FINANCIAL STATEMENTS 2020 139138
5. Summary of significant accounting policies (continued)
taxable profits will be available against which they can be used. Future taxable profits are determined based on business plans for the Group and the reversal of temporary differences. Deferred tax assets are reviewed at each reporting date and are reduced to the extent that it is no longer probable that the related tax benefit will be realised; such reductions are reversed when the probability of future taxable profits improves.
Unrecognised deferred tax assets are reassessed at each reporting date and recognised to the extent that it has become probable that future taxable profits will be available against which they can be used.
Deferred tax is measured at the tax rates that are expected to be applied to temporary differences when they reverse, using tax rates enacted or substantively enacted at the reporting date.
The measurement of deferred tax reflects the tax consequences that would follow the manner in which the Group expects, at the reporting date, to recover or settle the carrying amount of its assets and liabilities.
Deferred tax assets and liabilities are offset if there is a legally enforceable right to offset current tax liabilities and assets, and they relate to taxes levied by the same tax authority on the same taxable entity, or on different tax entities, but they intend to settle current tax liabilities and assets on a net basis or their tax assets and liabilities will be realised simultaneously.
Additional taxes that arise from the distribution of dividends by the Group are recognised at the same time as the liability to pay the related dividend is recognised. These amounts are generally recognised in profit or loss because they generally relate to income arising from transactions that were originally recognised in profit or loss.
iii. Tax exposures
In determining the amount of current and deferred tax, the Group considers the impact of tax exposures, including whether additional taxes and interest may be due. This assessment relies on estimates and assumptions and may involve a series of judgements about future events. New information may become available that causes the Group to change its judgement regarding the adequacy of existing tax liabilities; such changes to tax liabilities would impact tax expense in the period in which such a determination is made. The Group considers IFRIC 23 Uncertainty over Income Tax Treatments in applying judgement for any open tax matters. The consideration is of whether it is probable that the tax authority will accept an uncertain tax treatment. If the Group concludes that the position is not probable of being accepted, the effect
of the uncertainty is reflected in the Group’s accounting for income taxes.
M. Cash and cash equivalents
For the purposes of the statement of cash flows, cash and cash equivalents comprise notes and coins on hand, unrestricted balances held with the Central Bank and highly liquid financial assets with original maturities of three months or less from the date of acquisition that are subject to an insignificant risk changes in fair value, and are used by the Group in management is its short-term commitments. Cash and cash equivalents excludes the cash reserves requirement held with the central Bank.
Cash and cash equivalents are carried at amortised cost in the statement of financial position.
N. Employee benefits
(i) Retirement benefit obligations
The Group makes contributions to a defined contribution benefit scheme for its eligible employees. A defined contribution benefit scheme is a post-employment benefit plan under which the Group pays fixed contributions into a separate entity (fund). The Group has no legal or constructive obligations to pay further contributions if the fund does not hold sufficient assets to pay all employees the benefits relating to employee service in the current and prior periods.
The assets of the scheme are held in a separate trustee administered fund, which is funded by contributions from both the Group and employees. The Group and all its employees also contribute to the National Social Security Fund, which is a defined contribution scheme. The Group’s contributions to the defined contribution scheme are charged to profit or loss in the year to which they relate. Prepaid contributions are recognised as an asset to the extent that a cash refund or a reduction in future payments is available.
(ii) Termination benefitsTermination benefits are expensed at the earlier of when the Group can no longer withdraw the offer of those benefits and when the Group recognises costs for a restructuring. If benefits are not expected to be wholly settled within 12 months of the reporting date, then they are discounted.
(iii) Other entitlementsShort-term benefits consist of salaries, bonuses and any non-monetary benefits such as medical aid contributions and free services; they exclude termination benefits.
Short-term employee benefit obligations are measured on an undiscounted basis and are expensed as the related service is provided. A provision is recognised for the

dfcu ANNUAL REPORT AND FINANCIAL STATEMENTS 2020 dfcu ANNUAL REPORT AND FINANCIAL STATEMENTS 2020 141140
5. Summary of significant accounting policies (continued)
amount expected to be paid under a short-term cash bonus only if the Group has a present legal or constructive obligation to pay this amount as a result of past services provided by the employee and if the obligation can be measured reliably.
The estimated monetary liability for employees’ accrued annual leave entitlement at the reporting date is recognised as an expense accrual.
O. Leases
At inception of a contract, the Group assesses whether a contract is, or contains, a lease. A contract is, or contains, a lease if the contract conveys the right to control the use of an identified asset for a period of time in exchange for consideration. To assess whether a contract conveys the right to control the use of an identified asset, the Group uses the definition of a lease in IFRS 16.
Group as a lessee
The Group applies a single recognition and measurement approach for all leases, except for short-term leases and leases of low-value assets. The Group recognises lease liabilities to make lease payments and right-of-use assets representing the right to use the underlying assets.
At commencement or on modification of a contract that contains a lease component, the Group allocates consideration in the contract to each lease component on the basis of its relative stand-alone price. However, for leases of branches and office premises the Group has elected not to separate non-lease components and accounts for the lease and non-lease components as a single lease component.
The Group recognises a right-of-use asset and a lease liability at the lease commencement date. The right-of-use asset is initially measured at cost, which comprises the initial amount of the lease liability adjusted for any lease payments made at or before the commencement date, plus any initial direct costs incurred and an estimate of costs to dismantle and remove any improvements made to branches or office premises.
Right-of-use assets
The Group recognises right-of-use assets at the commencement date of the lease (i.e., the date the underlying asset is available for use). Right-of-use assets are measured at cost, less any accumulated depreciation and impairment losses, and adjusted for any remeasurement of lease liabilities. The cost of right-of-use assets includes the amount of lease liabilities recognised, initial direct costs incurred, and lease payments made
at or before the commencement date less any lease incentives received. Right-of-use assets are depreciated on a straight-line basis over the lease term.
The right-of-use assets are presented within Note 28 Property, equipment and right-of-use assets and are subject to impairment in line with the Bank’s policy as described in Note 5(v) - Impairment of non-financial assets.
Lease liabilities
At the commencement date of the lease, the Group recognises lease liabilities measured at the present value of lease payments to be made over the lease term. The lease payments include fixed payments (less any lease incentives receivable), variable lease payments that depend on an index or a rate, and amounts expected to be paid under residual value guarantees. The lease payments also include the exercise price of a purchase option reasonably certain to be exercised by the Group and payments of penalties for terminating the lease, if the lease term reflects exercising the option to terminate. Variable lease payments that do not depend on an index or a rate are recognised as expenses in the period in which the event or condition that triggers the payment occurs.
The lease liability is measured at amortised cost using the effective interest method. It is remeasured when there is a change in future lease payments arising from a change in an index or rate, if there is a change in the Group’s estimate of the amount expected to be payable under a residual value guarantee, if the Group changes its assessment of whether it will exercise a purchase, extension or termination option or if there is a revised in-substance fixed lease payment.
When the lease liability is remeasured in this way, a corresponding adjustment is made to the carrying amount of the right-of-use asset, or is recorded in profit or loss if the carrying amount of the right-of-use asset has been reduced to zero.
The Group presents lease liabilities in ‘other liabilities’ in the consolidated statement of financial position.
Short-term leases and leases of low-value assets
The Group has elected not to recognise right-of-use assets and lease liabilities for leases of low-value assets and short-term leases. The Group recognises the lease payments associated with these leases as an expense on a straight-line basis over the lease term.
Group as a lessor Leases in which the Group does not transfer substantially all the risks and rewards incidental to ownership of an asset are classified as operating leases. Rental income arising is accounted for on a straight-line basis over the
dfcu ANNUAL REPORT AND FINANCIAL STATEMENTS 2020 dfcu ANNUAL REPORT AND FINANCIAL STATEMENTS 2020 141140
5. Summary of significant accounting policies (continued)
lease terms and is included in revenue in the statement of comprehensive income due to its operating nature. Initial direct costs incurred in negotiating and arranging an operating lease are added to the carrying amount of the leased asset and recognised over the lease term on the same basis as rental income.
P. Offsetting
Financial assets and liabilities are offset and the net amount reported in the consolidated and company statement of financial position when there is a legally enforceable right to set off the recognised amounts and there is an intention to settle on a net basis, or realise the asset and settle the liability simultaneously.
Q. Dividends
Dividends on ordinary shares are recognised as a liability and charged to equity in the period in which they are declared. Proposed dividends are shown as a separate component of equity until declared.
R. Earnings per share
The Group presents basic and diluted earnings per share (EPS) data for its ordinary shares. Basic EPS is calculated by dividing the profit or loss attributable to ordinary shareholders of the Group by the weighted average number of ordinary shares outstanding during the period. Diluted EPS is determined by adjusting the profit or loss attributable to ordinary shareholders and the weighted average number of ordinary shares outstanding for the effects of all any potentially dilutive ordinary shares which comprise share options granted to employees
S. Loans and advances
‘Loans and advances’ captions in the statement of financial position include:
- loans and advances measured at amortised cost; they are initially measured at fair value plus incremental direct transaction costs, and subsequently at their amortised cost using the effective interest method;
- loans and advances mandatorily measured at FVTPL or designated as at FVTPL; these are measured at fair value with changes recognised immediately in profit or loss; and
- finance lease receivables.
‘Loans and advances’ were non-derivative financial assets with fixed or determinable payments that were not quoted in an active market and that the Group did not intend to
sell immediately or in the near term.
Loans and advances to banks were classified as loans and receivables. Loans and advances to customers included:
- those classified as loans and receivables;- those designated as at FVTPL; and- finance lease receivables.
Loans and advances were initially measured at fair value plus incremental direct transaction costs, and subsequently measured at their amortised cost using the effective interest method. When the Group chose to designate the loans and advances as measured at FVTPL as described in (J)(viii), they were measured at fair value with face value changes recognised immediately in profit or loss.
Loans and advances also included finance lease receivables in which the Group was the lessor.
T. Financial guarantees and loan commitments
Loan commitments
‘Financial guarantees’ are contracts that require the Group to make specified payments to reimburse the holder for a loss that it incurs because a specified debtor fails to make payment when it is due in accordance with the terms of a debt instrument. ‘Loan commitments’ are firm commitments to provide credit under pre-specified terms and conditions.
Financial guarantees issued or commitments to provide a loan at a below-market interest rate are initially measured at fair value. Subsequently, they are measured as follows:
- at the higher of the loss allowance determined in accordance with IFRS 9 and the amount initially recognised less, when appropriate, the cumulative amount of income recognised in accordance with the principles of IFRS 15; and
The Group has issued no loan commitments that are measured at FVTPL.
For other loan commitments:
- the Group recognises a loss allowance;
Liabilities arising from financial guarantees and loan commitments are included within provisions
Contingent liabilitiesLetters of credit, acceptances, guarantees and performance bonds are accounted for as off statement of financial position transactions and disclosed as contingent liabilities. Estimates of the outcome and financial effect of contingent liabilities is made by management based on

dfcu ANNUAL REPORT AND FINANCIAL STATEMENTS 2020 dfcu ANNUAL REPORT AND FINANCIAL STATEMENTS 2020 143142
5. Summary of significant accounting policies (continued)
the information available up to the date the consolidated and separate financial statements are approved for issue by the directors. Any expected loss is charged to profit or loss.
U. Trading assets and liabilities
Trading assets and liabilities are those assets and liabilities that the Group acquires or incurs principally for the purpose of selling or repurchasing in the near term, or holds as part of a portfolio that is managed together for short-term profit or position taking.
Trading assets and liabilities are initially recognised and subsequently measured at fair value in the statement of financial position, with transaction costs recognised in profit or loss. All changes in fair value are recognised as part of net trading income in profit or loss.
V. Impairment of non-financial assets
At each reporting date, the Group reviews the carrying amounts of its non-financial assets (other than deferred tax assets) to determine whether there is any indication of impairment. If any such indication exists, then the asset’s recoverable amount is estimated.
For impairment testing, assets are grouped together into the smallest group of assets that generates cash inflows from continuing use that is largely independent of the cash inflows of other assets or CGUs. Goodwill arising from a business combination is allocated to CGUs or groups of CGUs that are expected to benefit from the synergies of the combination.
The ‘recoverable amount’ of an asset or CGU is the greater of its value in use and its fair value less costs to sell. ‘Value in use’ is based on the estimated future cash flows, discounted to their present value using a pre-tax discount rate that reflects current market assessments of the time value of money and the risks specific to the asset or CGU.
An impairment loss is recognised if the carrying amount of an asset or CGU exceeds its recoverable amount.
The Group’s corporate assets do not generate separate cash inflows and are used by more than one CGU. Corporate assets are allocated to CGUs on a reasonable and consistent basis and tested for impairment as part of the testing of the CGUs to which the corporate assets are allocated.
Impairment losses are recognised in profit or loss. They are allocated first to reduce the carrying amount of any goodwill allocated to the CGU, and then to reduce the carrying amounts of the other assets in the CGU on a pro rata basis.
An impairment loss in respect of goodwill is not reversed. For other assets, an impairment loss is reversed only to the extent that the asset’s carrying amount does not exceed the carrying amount that would have been determined, net of depreciation or amortisation, if no impairment loss had been recognised.
W. Deposits, debt securities issued and subordinated liabilities
Deposits, debt securities issued and subordinated liabilities are the Group’s sources of debt funding.
When the Group sells a financial asset and simultaneously enters into an agreement to repurchase the asset (or a similar asset) at a fixed price on a future date (sale-and-repurchase agreement), the arrangement is accounted for as a deposit, and the underlying asset continues to be recognised in the Group’s consolidated and separate financial statements.
The Group classifies capital instruments as financial liabilities or equity instruments in accordance with the substance of the contractual terms of the instruments.
Deposits, debt securities issued and subordinated liabilities are initially measured at fair value minus incremental direct transaction costs, and subsequently measured at their amortised cost using the effective interest method, except where the Group designates liabilities at FVTPL.
Deposits and Borrowings are the Group’s sources of debt funding.
Deposits and borrowings are recognised initially at fair value, net of transaction costs incurred. Borrowings are subsequently stated at amortised cost using the effective interest rate method; any difference between proceeds net of transaction costs and the redemption value is recognised in profit or loss over the period of the borrowing using the effective interest rate method.Amounts presented in the liability credit reserve are not subsequently transferred to profit or loss. When these instruments are derecognised, the related cumulative amount in the liability credit reserve is transferred to retained earnings.
X. Provisions
A provision is recognised if, as a result of a past event, the Group has a present legal or constructive obligation that can be estimated reliably, and it is probable that an outflow of economic benefits will be required to settle the obligation. Provisions are determined by discounting the expected future cash flows at a pre-tax rate that reflects current market assessments of the time value of money and, where appropriate, the risks specific to the liability. The unwinding of the discount is recognised as a finance cost.

dfcu ANNUAL REPORT AND FINANCIAL STATEMENTS 2020 dfcu ANNUAL REPORT AND FINANCIAL STATEMENTS 2020 143142
5. Summary of significant accounting policies (continued)
i. Restructuring
A provision for restructuring is recognised when the Group has approved a detailed and formal restructuring plan, and the restructuring either has commenced or has been announced publicly. Future operating losses are not provided for.
ii. Onerous contracts
A provision for onerous contracts is recognised when the expected benefits to be derived by the Group from a contract are lower than the unavoidable cost of meeting its obligations under the contract. The provision is measured at the present value of the lower of the expected cost of terminating the contract and the expected net cost of continuing with the contract. Before a provision is established, the Group recognises any impairment loss on the assets associated with that contract.
iii. Group levies
A provision for Group levies is recognised when the condition that triggers the payment of the levy is met. If a levy obligation is subject to a minimum activity threshold so that the obligating event is reaching a minimum activity, then a provision is recognised when that minimum activity threshold is reached.
Y. Investment securities
The ‘investment securities’ caption in the consolidated statement of financial position includes:
- debt investment securities measured at amortised cost; these are initially measured at fair value plus incremental direct transaction costs, and subsequently at their amortised cost using the effective interest method;
- debt and equity investment securities mandatorily measured at FVTPL or designated as at FVTPL; these are at fair value with changes recognised immediately in profit or loss;
- debt securities measured at FVOCI; and- equity investment securities designated as at
FVOCI.
For debt securities measured at FVOCI, gains and losses are recognised in OCI, except for the following, which are recognised in profit or loss in the same manner as for financial assets measured at amortised cost:
- interest revenue using the effective interest method;
- ECL and reversals; and
- foreign exchange gains and losses.
When debt security measured at FVOCI is derecognised, the cumulative gain or loss previously recognised in OCI is reclassified from equity to profit or loss.The Group elects to present in OCI changes in the fair value of certain investments in equity instruments that are not held for trading. The election is made on an instrument-by-instrument basis on initial recognition and is irrevocable.Fair value gains and losses on such equity instruments are never reclassified to profit or loss and no impairment is recognised in profit or loss. Dividends are recognised in profit or loss unless they clearly represent a recovery of part of the cost of the investment, in which case they are recognised in OCI. Cumulative gains and losses recognised in OCI are transferred to retained earnings on disposal of an investment.
Z. Share capital and reserves
i. Share issue costs
Incremental costs that are directly attributable to the issue of an equity instrument are deducted from the initial measurement of the equity instruments.
ii. Retained earnings / accumulated losses
Retained earnings relates to accumulated prior year earnings/ losses adjusted for profit or loss for the year, proposed dividend and transfers to and from the regulatory credit risk reserves.
AA. Comparatives
Where necessary the comparative figures have been adjusted to conform to changes in presentation in the current year. BB. Investment property
Property held for long term rental yields and not occupied by the Group is classified as investment property. A portion of the property at Plot 26 Kyadondo is occupied by the Company’s subsidiary, dfcu Bank Limited, and is classified as property, plant and equipment in the consolidated and separate financial statements. The remaining portion is held for long term rental yields and is accounted for as investment property.
An investment property is defined under IAS 40, Investment property, as a property (land or a building or part of a building or both) held (by the owner or by

dfcu ANNUAL REPORT AND FINANCIAL STATEMENTS 2020 dfcu ANNUAL REPORT AND FINANCIAL STATEMENTS 2020 145144
5. Summary of significant accounting policies (continued)
the lessee under a finance lease) to earn rentals or for capital appreciation or both, rather than for:
• use in the production or supply of goods or services or for administrative purposes; or• sale in the ordinary course of business.
Investment properties are measured initially at cost, including transaction costs. Subsequent to initial recognition, investment properties are stated at cost less accumulated depreciation. Depreciation of investment property is calculated using the straight-line method over their estimated useful lives at a rate of 2.5%, and is recognised in profit or loss.
Investment properties are derecognised either when they have been disposed of (i.e., at the date the recipient obtains control) or when they are permanently withdrawn from use and no future economic benefit is expected from their disposal. The difference between the net disposal proceeds and the carrying amount of the asset is recognised in profit or loss in the period of derecognition. In determining the amount of consideration from the derecognition of investment property the Group considers the effects of variable consideration, existence of a significant financing component, non-cash consideration, and consideration payable to the buyer (if any).
Transfers are made to (or from) investment property only when there is a change in use. For a transfer from investment property to owner-occupied property, the deemed cost for subsequent accounting is the net carrying amount at the date of change in use. If owner-occupied property becomes an investment property, the Group accounts for such property in accordance with the policy stated under property, plant and equipment up to the date of change in use.

dfcu ANNUAL REPORT AND FINANCIAL STATEMENTS 2020 dfcu ANNUAL REPORT AND FINANCIAL STATEMENTS 2020 145144
6. Financial risk management
The Group’s financial assets are classified as amortised cost, fair value through profit and loss, and fair value through other comprehensive income and all financial liabilities are measured at amortised cost. The carrying amounts for each class of financial assets and financial liabilities are included in the table below
Group
Note 2020 2019
Financial assets Ushs M Ushs M
Amortised cost
Cash and balances with Bank of Uganda 20 606,750 394,892
Loans and advances to other banks 21 195,441 111,116
Loans and advances to customers 22 1,775,316 1,539,323
Investment securities: Measured at amortised cost 24 257,382 363,517
Other assets: Measured at amortised cost excluding prepayments 26 9,748 7,455
2,844,637 2,416,303
FVOCI
Investment securities: Measured at fair value 24 259,623 123,254
259,623 123,254
FVTPL
Mandatorily at FVTPL
Trading assets 25 58,357 22,630
Equity investments 23 8,513 8,625
Designated at FVTPL
Other assets: Measured at fair value 24 109,892 166,283
176,762 197,538
3,281,022 2,737,095
Financial liabilities
Measured at FVTPL
Derivative financial instruments 44(b) 97 -
Measured at amortised cost:
Customer deposits 32 2,595,347 2,039,037
Balances due to other banks 33 10,968 10,002
Borrowed funds 37 217,219 273,354
Special funds 36 1,193 1,205
Other financial liabilities 34 58,175 45,414
2,882,902 2,369,012
2,882,999 2,369,012

dfcu ANNUAL REPORT AND FINANCIAL STATEMENTS 2020 dfcu ANNUAL REPORT AND FINANCIAL STATEMENTS 2020 147146
Company
Note 2020 2019
Financial assets Ushs M Ushs M
Amortised cost
Amounts due from group companies 46(b) 197 1,714
Other assets: Measured at amortised cost excluding prepayments 26 17 17
214 1,731
Financial liabilities
Measured at amortised cost:
Amounts due to Group Companies 46(a) 15,932 14,252
Borrowed funds 37 4,502 4,446
Other financial liabilities 34 3,517 8,509
23,951 27,207
6A Strategy in using financial instruments
By their nature, the Group’s activities are principally related to the use of financial instruments. The Group accepts deposits from customers at both fixed and floating rates, and for various periods, and seeks to earn above-average interest margins by investing these funds in high-quality assets. The Group seeks to increase these margins by consolidating short-term funds and lending for longer periods at higher rates, while maintaining sufficient liquidity to meet all claims that might fall due.
The Group also seeks to raise its interest margins by obtaining above-average margins, net of allowances, through lending to commercial and retail borrowers with a range of credit standings. Such exposures involve not just on-statement of financial position loans and advances; the Group also enters into guarantees and other commitments such as letters of credit, and performance and other bonds.The Group also trades in financial instruments. The Board places trading limits on the level of exposure that can be taken in relation to both overnight and intra-day market positions. The fair value gains or losses arising from trading in financial instruments are recognised in profit or loss under net trading and other income. Foreign exchange and interest rate exposures and associated derivatives are normally economically hedged by entering into counterbalancing positions, thereby controlling the variability in the net cash amounts required to liquidate market positions.
6B Credit risk
The Group takes on exposure to credit risk, which is the risk that a counter party will cause a financial loss to the Group by failing to pay amounts in full when due.
Impairment allowances are provided for losses that have been incurred at the reporting date. Credit risk is the most important risk for the Group’s business. Therefore, management carefully manages the exposure to credit risk. Credit exposures arise principally in lending and investment activities. There is also credit risk in off-statement of financial position financial instruments, such as loan commitments. Credit risk management and control is centralised in the credit risk management team, which reports regularly to management and the Board.
The Group structures the levels of credit risk it undertakes by placing limits on the amount of risk accepted in relation to one borrower, or groups of borrowers, and to industry segments. Such risks are monitored on a revolving basis and subject to annual or more frequent review. Exposure to credit risk is managed through regular analysis of the ability of borrowers and potential borrowers to meet interest and capital repayment obligations and by changing lending limits where appropriate. Exposure to credit risk is also managed in part by obtaining collateral and corporate and personal guarantees, but a portion is personal lending where no such facilities can be obtained.
Credit related commitments:
The primary purpose of these instruments is to ensure that funds are available to a customer as required. Guarantees and standby letters of credit represent irrevocable assurances that the Group will make payments in the event that a customer cannot meet its obligations to third parties. The Group’s policy is to hold cash cover for most of the commitments and hence the credit risk arising from such commitments is less than for direct borrowing. Documentary and commercial letters of credit, which are written
6. Financial risk management (continued)

dfcu ANNUAL REPORT AND FINANCIAL STATEMENTS 2020 dfcu ANNUAL REPORT AND FINANCIAL STATEMENTS 2020 147146
6. Financial risk management (continued)
6B Credit risk (continued)
undertakings by the Group on behalf of a customer authorising a third party to draw drafts on the Group up to a stipulated amount under specific terms and conditions, are collateralised by the underlying shipments of goods to which they relate and therefore carry less risk than for direct borrowing.
Commitments to extend credit represent unused portions of authorisations to extend credit in the form of loans, guarantees or letters of credit. The Group makes such commitments at market rates. With respect to credit risk on commitments to extend credit, the Group is potentially exposed to loss in an amount equal to the total unused commitments. However, the likely amount of loss is less than the total unused commitments, as most commitments to extend credit are contingent upon customers maintaining specific credit standards. The Group monitors the term to maturity of credit commitments because longer-term commitments generally have a greater degree of credit risk than shorter-term commitments.
Maximum exposure to credit risk before collateral held
Group
2020 2019
Ushs M Ushs M
Balances with Bank of Uganda (note 20) 454,611 259,842
Loans and advances to banks (note 21) 195,441 111,116
Loans and advances to customers (note 22) 1,775,316 1,539,323
Government securities (notes 24 and 25) 575,362 509,401
Equity investments at fair value through profit and loss (note 23) 8,513 8,625
Other assets excluding prepayments (note 26) 119,640 173,738
Credit risk exposures on off-statement of financial position items (note 42)
- Guarantee and performance bonds 271,869 541,845
- Commitments to lend 37,289 51,377
3,438,041 3,195,267
Company
2020 2019
Ushs M Ushs M
Amounts due from Group companies (note 46(b) 197 1,714
Other financial assets (note 26) 17 17
214 1,731
The above represents the worst-case scenario of the Group and Company’s credit risk exposure as at 31 December 2020 and 2019, without taking account collateral held or other credit enhancements attached. For on-statement of financial position assets, the exposures set out above are based on carrying amounts as reported in the statement of financial position.
As shown above, 56% of the total maximum exposure is derived from loans and advances to banks and customers (2019: 54%), whilst 17% represents investments in government securities (2019: 19%).Loans and advances to major corporate borrowers and to individuals borrowing more than Ushs 30 million are secured by collateral in the form of charges over land and buildings and / or plant and machinery or corporate guarantees.

dfcu ANNUAL REPORT AND FINANCIAL STATEMENTS 2020 dfcu ANNUAL REPORT AND FINANCIAL STATEMENTS 2020 149148
6. Financial risk management (continued)
6B Credit risk (continued)
Management is confident in its ability to continue to control and sustain minimal exposure of credit risk to the Group resulting from both its loan and advances portfolio and debt securities based on the following:
- The Group exercises stringent controls over the granting of new loans;- 82% of the loans and advances portfolio are neither past due nor impaired;- 96% of the loans and advances portfolio are backed by collateral; and- 99% of investments in debt securities are government securities and only 1% in a high quality corporate bond.
Loans and advances are summarised as follows: 2020 2019
Ushs M Ushs M
Neither past due nor impaired 1,501,335 1,342,743
Past due but not impaired 242,752 133,952
Impaired 94,095 89,117
Gross 1,838,182 1,565,812
Less: Allowance for impairment (note 22) (62,866) (26,489)
Net carrying amount 1,775,316 1,539,323
No other assets of the Group or Company are either past due or impaired.
Loans and advances neither past due nor impaired
The credit quality of loans and advances that were neither past due nor impaired can be analysed by reference to the internal rating system adopted by the Group:
2020 2019
Ushs M Ushs M
Grades 1-9 (Low-fair / higher risk) 1,501,335 1,399,813
Loans and advances past due but not impaired
Loans and advances less than 90 days past due are not considered impaired, unless other information is available to indicate the contrary. The gross amounts of loans and advances that were past due but not impaired were as follows:
2020 2019
Ushs M Ushs M
Past due up to 30 days 202,023 91,744
Past due 31 – 60 days 31,762 28,223
Past due 61 – 89 days 8,967 13,985
242,752 133,952

dfcu ANNUAL REPORT AND FINANCIAL STATEMENTS 2020 dfcu ANNUAL REPORT AND FINANCIAL STATEMENTS 2020 149148
6. Financial risk management (continued)6B Credit risk (continued)
Loans and advances individually impaired
The general credit worthiness of a customer tends to be the most relevant indicator of credit quality of a loan extended to it. However, collateral provides additional security and the Group generally requests that borrowers provide it. The Group may take collateral in the form of a first charge over real estate, machinery and equipment, automobiles and other liens and guarantees.
Because of the Group’s focus on customers’ credit worthiness, the Group does not routinely update the valuation of collateral held against all loans to customers. Valuation of collateral is updated when the credit risk of a loan deteriorates significantly and the loan is monitored more closely. For impaired loans, the Group obtains appraisals of collateral because the current value of the collateral is an input to the impairment measurement.
At 31 December 2020, the gross carrying amount of impaired loans and advances to customers amounted to Ushs 94,095 million (2019: Ushs 89,117 million) and the value of identifiable collateral held against those loans and advances amounted to Ushs 58,704 million (2019: Ushs 31,582 million).
Below is a summary of the impaired loans with the respective value of security;
Loans Overdrafts
2020 2019 2020 2019
Ushs M Ushs M Ushs M Ushs M
Loans and advances 93,529 88,630 566 487
Fair value of collateral 58,704 31,582 239 -
i. Credit quality analysis
The following table sets out information about the credit quality of financial assets measured at amortised cost, FVOCI debt investments. Unless specifically indicated, for financial assets, the amounts in the table represent gross carrying amounts. For loan commitments and financial guarantee contracts, the amounts in the table represent the amounts committed or guaranteed, respectively. The Group uses credit risk grades as a primary input into the determination of the term structure of the PD for exposures. The Group collects performance and default information about its credit risk exposures analysed by type of product and borrower as well as by credit risk grading. The information used is both internal and external depending on the portfolio assessed.
The table below provides a mapping of the Group’s internal credit risk grades.
Group’s internal rating grade Internal rating description IFRS 9 Staging
1-6 Low-fair risk Stage 1
7-9 Higher risk Stage 2
10 Substandard Stage 3
11 Doubtful Stage 3
12 Loss Stage 3

dfcu ANNUAL REPORT AND FINANCIAL STATEMENTS 2020 dfcu ANNUAL REPORT AND FINANCIAL STATEMENTS 2020 151150
6. Financial risk management (continued)6B Credit risk (continued)
Loans and advances to customers at amortised cost
2020
Ushs M
Stage 1 Stage 2 Stage 3 POCI Total
Grades 1-6 Low-fair risk 1,501,335 - - - 1,501,335
Grades 7-9 Higher risk - 242,752 - - 242,752
Grade 10: Sub standard - - 25,991 - 25,991
Grade 11: Doubtful - - 29,951 - 29,951
Grade 12: Loss - - 38,153 - 38,153
1,501,335 242,752 94,095 - 1,838,182
Loss allowance (10,603) (4,888) (47,375) - (62,866)
Carrying amount 1,490,732 237,864 46,720 - 1,775,316
2019
Ushs M
Stage 1 Stage 2 Stage 3 POCI Total
Grades 1-6 Low-fair risk 1,077,648 20,649 - - 1,098,297
Grades 7-9 Higher risk 322,165 56,233 - - 378,398
Grade 10: Sub standard - - 43,551 - 43,551
Grade 11: Doubtful - - 27,361 - 27,361
Grade 12: Loss - - 18,205 - 18,205
1,399,813 76,882 89,117 - 1,565,812
Loss allowance (7,488) (3,675) (15,326) - (26,489)
Carrying amount 1,392,325 73,207 73,791 - 1,539,323
Balances with Bank of Uganda
2020
Ushs M
Stage 1 Stage 2 Stage 3 Total
Grades 1-6 Low-fare risk454,829 - - 454,829
Loss Allowance (218) - - (218)
Carrying amount 454,611 - - 454,611
2019
Ushs M
Stage 1 Stage 2 Stage 3 Total
Grades 1-6 Low-fare risk 259,918 - - 259,918
Loss Allowance (76) - - (76)
Carrying amount 259,842 - - 259,842

dfcu ANNUAL REPORT AND FINANCIAL STATEMENTS 2020 dfcu ANNUAL REPORT AND FINANCIAL STATEMENTS 2020 151150
6. Financial risk management (continued)6B Credit risk (continued)
Loans and advances to other banks
2020
Ushs M
Stage 1 Stage 2 Stage 3 POCI Total
Grades 1-6 Low-fair risk 195,465 - - - 195,465
Grades 7-9 Higher risk - - - - -
Grade 10: Sub standard - - - - -
Grade 11: Doubtful - - - - -
Grade 12: Loss - - - - -
195,465 - - - 195,465
Loss allowance (24) - - - (24)
Carrying amount 195,441 - - - 195,441
2019
Ushs M
Stage 1 Stage 2 Stage 3 POCI Total
Grades 1-6 Low-fair risk 111,122 - - - 111,122
Grades 7-9 Higher risk - - - - -
Grade 10: Sub standard - - - - -
Grade 11: Doubtful - - - - -
Grade 12: Loss - - - - -
111,122 - - - 111,122
Loss allowance (6) - - - (6)
Carrying amount 111,116 - - - 111,116
Other Assets: Receivables excluding prepayments
2020
Ushs M
Lifetime ECL not credit impaired Credit impaired Total
Grades 1-6 Low-fair risk 120,183 - 120,183
Grades 7-9 Higher risk - - -
Grade 10-12: Credit Impaired - - -
120,183 - 120,183
Loss allowance (543) - (543)
Carrying amount 119,640 - 119,640
2019
Ushs M
Lifetime ECL not credit impaired Credit impaired Total
Grades 1-6 Low-fair risk 173,825 - 173,825
Grades 7-9 Higher risk - - -
Grade 10-12: Credit Impaired - - -
173,825 - 173,825
Loss allowance (87) - (87)
Carrying amount 173,738 - 173,738
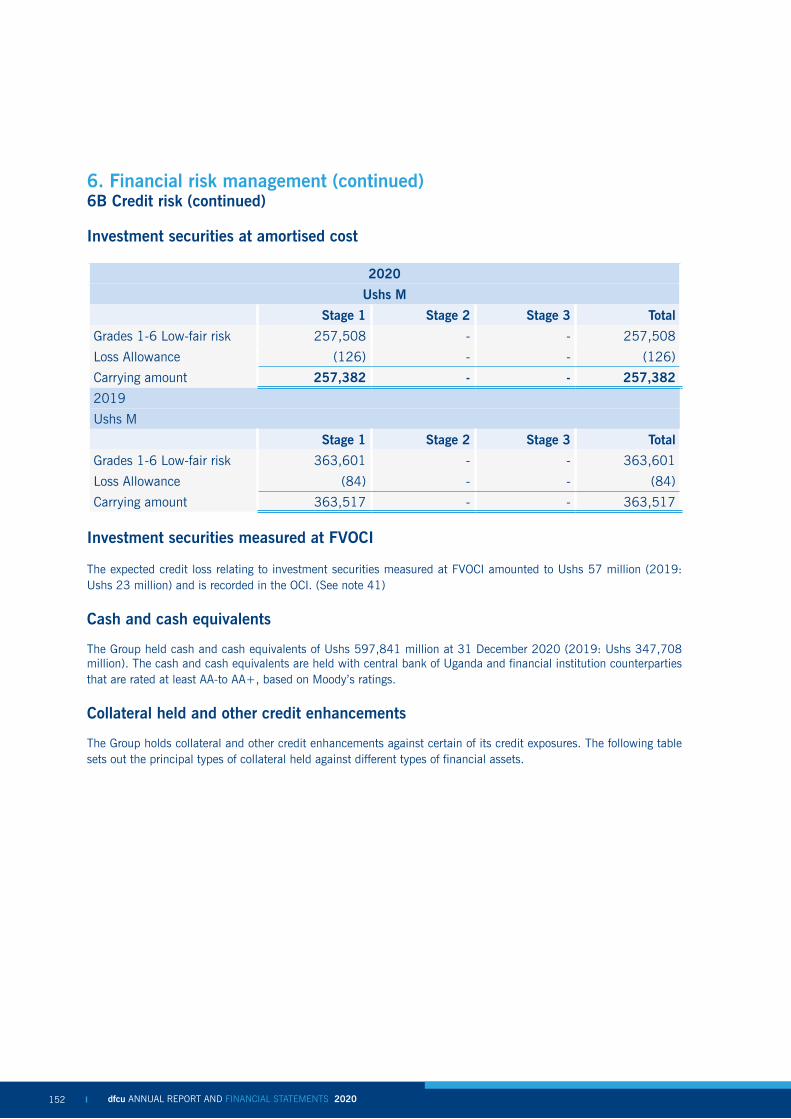
dfcu ANNUAL REPORT AND FINANCIAL STATEMENTS 2020 dfcu ANNUAL REPORT AND FINANCIAL STATEMENTS 2020 153152
6. Financial risk management (continued)6B Credit risk (continued)
Investment securities at amortised cost
2020
Ushs M
Stage 1 Stage 2 Stage 3 Total
Grades 1-6 Low-fair risk 257,508 - - 257,508
Loss Allowance (126) - - (126)
Carrying amount 257,382 - - 257,382
2019
Ushs M
Stage 1 Stage 2 Stage 3 Total
Grades 1-6 Low-fair risk 363,601 - - 363,601
Loss Allowance (84) - - (84)
Carrying amount 363,517 - - 363,517
Investment securities measured at FVOCI
The expected credit loss relating to investment securities measured at FVOCI amounted to Ushs 57 million (2019: Ushs 23 million) and is recorded in the OCI. (See note 41)
Cash and cash equivalents
The Group held cash and cash equivalents of Ushs 597,841 million at 31 December 2020 (2019: Ushs 347,708 million). The cash and cash equivalents are held with central bank of Uganda and financial institution counterparties that are rated at least AA-to AA+, based on Moody’s ratings.
Collateral held and other credit enhancements
The Group holds collateral and other credit enhancements against certain of its credit exposures. The following table sets out the principal types of collateral held against different types of financial assets.

dfcu ANNUAL REPORT AND FINANCIAL STATEMENTS 2020 dfcu ANNUAL REPORT AND FINANCIAL STATEMENTS 2020 153152
6. Financial risk management (continued)6B Credit risk (continued)
Type of credit exposure
Group
Note 31-Dec-20 31-Dec-19 Principal type of collateral held
Ushs M Ushs M
Balances with Bank of Uganda 20 454,611 259,842 -
Loans and advances to banks 21 195,441 111,116 -
Loans and advances to retail customers: 22
Mortgage lending 72,513 65,552 Residential property
Personal loans 174,363 131,626 -
Loans and advances to corporate customers:
22
Finance leases 69,721 51,001 Property and equipment
Others 1,458,719 1,291,144 Commercial property, floating charges over corporate assets
Equity investments at fair value through profit and loss
23 8,513 8,625 -
Trading assets 25 58,357 22,630 -
Investment debt securities 24 517,005 486,771 -
Other assets excluding prepayments 26 119,640 173,738 -
Company
Note 31-Dec-20 31-Dec-19 Principal type of collateral held
Ushs M Ushs M
Amounts due from Group companies 46(b) 197 1,714 -
Other assets excluding prepayments 26 17 17 -
Loans and advances to corporate customers
The general creditworthiness of a corporate customer tends to be the most relevant indicator of credit quality of a loan extended to it. However, collateral provides additional security and the Group generally requests that corporate borrowers provide it. The Group may take collateral in the form of a first charge over real estate, floating charges over all corporate assets and other liens and guarantees.
Because of the Group’s focus on corporate customers’ creditworthiness, the Group does not routinely update the valuation of collateral held against all loans to corporate customers. Valuation of collateral is updated when the loan is put on a watch list and the loan is monitored more closely. For credit-impaired loans, the Group obtains appraisals of collateral because it provides input into determining the management credit risk actions.
At 31 December 2020, the net carrying amount of credit-impaired loans and advances to corporate customers amounted to Ushs 1,528,440 million (2019: Ushs 1,342,145 million) and the value of identifiable collateral (mainly commercial properties) held against those loans and advances amounted to Ushs 185,556 million (2019: Ushs 31,582 million). For each loan, the value of disclosed collateral is capped at the nominal amount of the loan that it is held against.
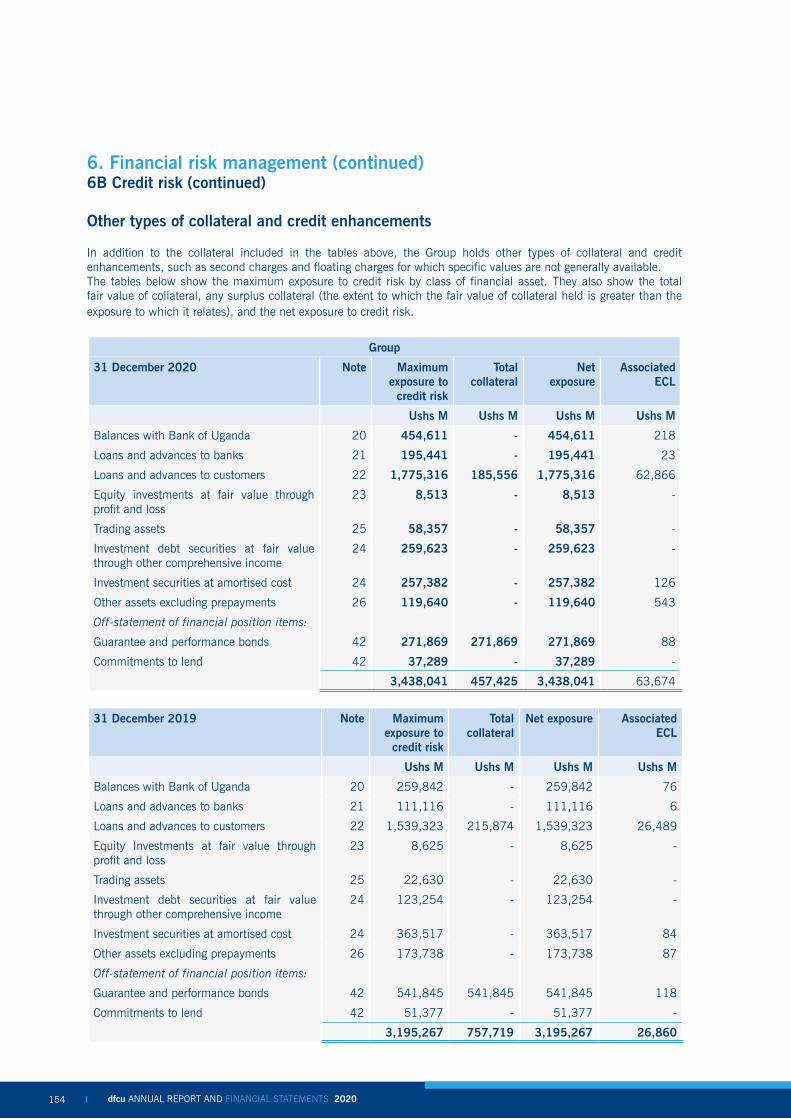
dfcu ANNUAL REPORT AND FINANCIAL STATEMENTS 2020 dfcu ANNUAL REPORT AND FINANCIAL STATEMENTS 2020 155154
6. Financial risk management (continued)6B Credit risk (continued)
Other types of collateral and credit enhancements
In addition to the collateral included in the tables above, the Group holds other types of collateral and credit enhancements, such as second charges and floating charges for which specific values are not generally available.The tables below show the maximum exposure to credit risk by class of financial asset. They also show the total fair value of collateral, any surplus collateral (the extent to which the fair value of collateral held is greater than the exposure to which it relates), and the net exposure to credit risk.
Group
31 December 2020 Note Maximum exposure to
credit risk
Total collateral
Net exposure
Associated ECL
Ushs M Ushs M Ushs M Ushs M
Balances with Bank of Uganda 20 454,611 - 454,611 218
Loans and advances to banks 21 195,441 - 195,441 23
Loans and advances to customers 22 1,775,316 185,556 1,775,316 62,866
Equity investments at fair value through profit and loss
23 8,513 - 8,513 -
Trading assets 25 58,357 - 58,357 -
Investment debt securities at fair value through other comprehensive income
24 259,623 - 259,623 -
Investment securities at amortised cost 24 257,382 - 257,382 126
Other assets excluding prepayments 26 119,640 - 119,640 543
Off-statement of financial position items:
Guarantee and performance bonds 42 271,869 271,869 271,869 88
Commitments to lend 42 37,289 - 37,289 -
3,438,041 457,425 3,438,041 63,674
31 December 2019 Note Maximum exposure to
credit risk
Total collateral
Net exposure Associated ECL
Ushs M Ushs M Ushs M Ushs M
Balances with Bank of Uganda 20 259,842 - 259,842 76
Loans and advances to banks 21 111,116 - 111,116 6
Loans and advances to customers 22 1,539,323 215,874 1,539,323 26,489
Equity Investments at fair value through profit and loss
23 8,625 - 8,625 -
Trading assets 25 22,630 - 22,630 -
Investment debt securities at fair value through other comprehensive income
24 123,254 - 123,254 -
Investment securities at amortised cost 24 363,517 - 363,517 84
Other assets excluding prepayments 26 173,738 - 173,738 87
Off-statement of financial position items:
Guarantee and performance bonds 42 541,845 541,845 541,845 118
Commitments to lend 42 51,377 - 51,377 -
3,195,267 757,719 3,195,267 26,860

dfcu ANNUAL REPORT AND FINANCIAL STATEMENTS 2020 dfcu ANNUAL REPORT AND FINANCIAL STATEMENTS 2020 155154
6. Financial risk management (continued)6B Credit risk (continued)
Company
31 December 2020 Note Maximum exposure to
credit risk
Total collateral
Net exposure
Associated ECL
Ushs M Ushs M Ushs M Ushs M
Amounts due from Group Companies 46(b) 197 - 197 -
Other assets excluding prepayments 26 17 - 17 -
214 - 214 -
31 December 2019
Amounts due from Group Companies 46(b) 1,714 - 1,714 -
Other assets excluding prepayments 26 17 - 17 -
1,731 - 1,731 -
ii. Amounts arising from ECL Inputs, assumptions and techniques used for estimating impairmentSee accounting policy in Note 5.
Significant increase in credit risk
When determining whether the risk of default on a financial instrument has increased significantly since initial recognition, the Group considers reasonable and supportable information that is relevant and available without undue cost or effort. This includes both quantitative and qualitative information and analysis, based on the Group’s historical experience and expert credit assessment and including forward-looking information.
Credit risk grades
The Group allocates each exposure to a credit risk grade based on a variety of data that is determined to be predictive of the risk of default and applying experienced credit judgement. Credit risk grades are defined using qualitative and quantitative factors that are indicative of risk of default. These factors vary depending on the nature of the exposure and the type of borrower.
Credit risk grades are defined and calibrated such that the risk of default occurring increases exponentially as the credit risk deteriorates so, for example, the difference in risk of default between credit risk grades 1 and 2 is smaller than the difference between credit risk grades 2 and 3.
Each exposure is allocated to a credit risk grade on initial recognition based on available information about the borrower. Exposures are subject to ongoing monitoring, which may result in an exposure being moved to a different credit risk grade. The monitoring typically involves use of the following data.
Corporate exposures Retail exposures All exposures
Information obtained during periodic review of customer files-e.g. audited financial statements, management accounts, budgets and projections. Examples of areas of particular focus are: gross profit margins, financial leverage ratios, debt service coverage, compliance with covenants, quality of management, senior management changes, data from credit reference agencies, press articles, changes in external credit ratings, actual and expected significant changes in the political, regulatory and technological environment of the borrower or in its business activities.
Internally collected data on customer behavior- e.g. utilisation of credit card facilities
Affordability metrics
External data from credit reference agencies, including industry-standard credit scores
Payment record - this includes overdue status as well as a range of variables about payment ratios
Utilisation of the granted limit
Requests for and granting of forbearance
Existing and forecast changes in business, financial and economic conditions

dfcu ANNUAL REPORT AND FINANCIAL STATEMENTS 2020 dfcu ANNUAL REPORT AND FINANCIAL STATEMENTS 2020 157156
6. Financial risk management (continued)6B Credit risk (continued)
Generating the term structure of PD
Credit risk grades are a primary input into the determination of the term structure of PD for corporate exposures. The Group collects performance and default information about its credit risk exposures analysed by jurisdiction or region and by type of product and borrower as well as by credit risk grading. For some portfolios, information purchased from external credit reference agencies is also used.
The Group employs statistical models to analyse the data collected and generate estimates of the remaining lifetime PD of exposures and how these are expected to change as a result of the passage of time.Determining whether credit risk has increased significantly
The Group has established a framework that incorporates both quantitative and qualitative information to determine whether the credit risk on a particular financial instrument has increased significantly since initial recognition. The framework aligns with the Group’s internal credit risk management process.
The Group will deem the credit risk of a particular exposure to have increased significantly since initial recognition if:
- Quantitative; the counterparty is past due for more than 30 days
- Qualitative; the account has been restructured for financial distress reasons
- Qualitative; Poor outlook for the specific sector or industry and any other relevant available information such as Credit Bureau data
In certain instances, using its expert credit judgement and, where possible, relevant historical experience, the Group may determine that an exposure has undergone a significant increase in credit risk if particular qualitative factors indicate so and those indicators may not be fully captured by its quantitative analysis on a timely basis.
As a backstop, and as required by IFRS 9, the Group presumptively considers that a significant increase in credit risk occurs no later than when an asset is more than 30 days past due. The Group will determine days past due by counting the number of days since the earliest elapsed due date in respect of which full payment has not been received.
If there is evidence that there is no longer a significant increase in credit risk relative to initial recognition, then the loss allowance on an instrument returns to being measured as 12-month ECL. Some qualitative indicators
of an increase in credit risk, such as delinquency or forbearance, may be indicative of an increased risk of default that persists after the indicator itself has ceased to exist. In these cases, the Group determines a probation period during which the financial asset is required to demonstrate good behavior to provide evidence that its credit risk has declined sufficiently. When contractual terms of a loan have been modified, evidence that the criteria for recognising lifetime ECL are no longer met includes a history of up-to-date payment performance against the modified contractual terms.
The Group monitors the effectiveness of the criteria used to identify significant increases in credit risk by regular reviews to confirm that:
- the criteria are capable of identifying significant increases in credit risk before an exposure is in default;
- the criteria do not align with the point in time when an asset becomes 30 days past due;
- the average time between the identification of a significant increase in credit risk and default appears reasonable;
- exposures are not generally transferred directly from 12-month ECL measurement to credit impaired; and
- there is no unwarranted volatility in loss allowance from transfers between 12-month PD (Stage 1) and lifetime PD (Stage 2).
Definition of defaultThe Group considers a financial asset to be in default when:
- the borrower is unlikely to pay its credit obligations to the Group in full, without recourse by the Group to actions such as realising security (if any is held);
- the borrower is more than 90 days past due on its contractual payments.
- Overdrafts are considered as being past due once the customer has breached an advised limit or been advised of a limit smaller than the current amount outstanding; or
- it is becoming probable that the borrower will restructure the asset as a result of bankruptcy due to the borrower’s inability to pay its credit obligations.
In assessing whether a borrower is in default, the Group considers indicators that are:
- qualitative: e.g. breaches of covenant;- quantitative: e.g. overdue status and non-
payment on another obligation of the same issuer to the Group; and
- based on data developed internally and obtained from external sources.

dfcu ANNUAL REPORT AND FINANCIAL STATEMENTS 2020 dfcu ANNUAL REPORT AND FINANCIAL STATEMENTS 2020 157156
6. Financial risk management (continued)6B Credit risk (continued)
As a part of a qualitative assessment of whether an exposure is credit-impaired, the Group also considers a variety of instances that may indicate unlikeliness to pay. When such events occur, the Group carefully considers whether the event should result in treating the customer as defaulted and therefore assessed as Stage 3 for ECL calculations or whether Stage 2 is appropriate. Such events include:
• An exposure is forborne or modified due to financial difficulties of the borrower
• Internal rating of the borrower indicating default or near-default
• The borrower requesting emergency funding from the Group
• The borrower having past due liabilities to public creditors or employees
• The borrower is deceased • A material decrease in the underlying collateral
value where the recovery of the loan is expected from the sale of the collateral
• A material decrease in the borrower’s turnover or the loss of a major customer
• A covenant breach not waived by the Group • The debtor (or any legal entity within the debtor’s
group) filing for bankruptcy application/protection The definition of default largely aligns with that applied by
the Group for regulatory capital purposes.
Incorporation of forward-looking
information
The Group incorporates forward-looking information into both the assessment of whether the credit risk of an instrument has increased significantly since its initial recognition and the measurement of ECL.
The Group formulates three economic scenarios: a base case, which is the median scenario reflecting a most-likely outcome, and two less likely scenarios, one upside and one downside. The base case is aligned with information used by the Group for other purposes such as strategic planning and budgeting.
Periodically, the Group carries out stress testing of more extreme shocks to calibrate its determination of the upside and downside representative scenarios. A comprehensive review is performed at least annually on the design of the scenarios by a panel of experts that advises the Group’s senior management.
The Group has identified and documented key drivers of credit risk and credit losses for each portfolio of financial instruments and, using an analysis of historical data, has estimated relationships between macro-economic variables and credit risk and credit losses.
The key driver for credit risk for the portfolio, retail unsecured and corporate models is the consumer price index (CPI).
The tables show the values of the key forward looking economic variables/assumptions used in each of the economic scenarios for the ECL calculations.
31 December 2020
Key drivers ECL Scenario 2021 2022 2023 2024 2025
CPI trends Upside 199 200 207 217 217
Base case 196 201 208 215 215
Downside 197 202 209 216 216
31 December 2019
Key drivers ECL Scenario 2020 2021 2022 2023 2024
CPI trends Upside 186 199 200 207 217
Base case 187 196 201 208 215
Downside 188 197 202 209 216
Since the beginning of the year, as the Group has reassessed the key economic indicators used in its ECL models. The Group reassessed the correlation with other macro economic variables (MEVs) with its default rates and found low correlations with other MEVs and on this basis continued to use only CPI trends. Long-term expectations however remain unchanged.

dfcu ANNUAL REPORT AND FINANCIAL STATEMENTS 2020 dfcu ANNUAL REPORT AND FINANCIAL STATEMENTS 2020 159158
6. Financial risk management (continued)6B Credit risk (continued)
Assessment and calculation of ECL
The calculation of ECL involves significant accounting judgements, estimates and assumptions. These are set out in Note 5(I) - Financial assets and liabilities under the Summary of significant accounting policies and Note 3 - Significant accounting judgements, estimates and assumptions. The level of estimation uncertainty has increased since 31 December 2019 as a result of the economic disruption and consequential impact of the Covid-19 pandemic. This includes significant judgements relating to:
• The selection and weighting of macro-economic scenarios;
• The uncertainty over the duration and severity of the effect of the pandemic as well as the timing and duration of the recovery;
• Determination of the impact of the macro-economic scenarios on ECL and whether the required parameters can be modelled given the unavailability of historical information for a similar
event; • Identification and assessment of significant
increases in credit risk and impairment especially for customers who have restructured their facilities and the inherent limitations in data availability to facilitate a reliable segmentation.
Impact on modelled ECL allowance
The Group’s models have been constructed and calibrated using historical trends and correlations as well as forward looking economic scenarios. The severity of the current macro-economic projections and the added complexity caused by the lack of experience of similar events could not be reliably modelled for the time being. As a consequence, the existing models may generate results that are either overly conservative or overly optimistic depending on the specific portfolio / segment. As a result, post-model adjustments are needed. Given model changes take a significant amount of time to develop and test and the data limitation issues noted above, the Group expects that post-model adjustments will be applied for the foreseeable future.
Post-model adjustments and management overlays made in estimating the reported ECL as at 31 December 2020 are set out in the following table:
31 December 2020 Modelled ECL Post-model adjustments
Management overlays
Total ECL Adjustments as a % of total ECL
Ushs m Ushs m Ushs m Ushs m
Total corporate and retail lending 49,036 7,544 6,286 62,866 28%
Post-model adjustments
Post-model adjustments (both positive and negative) represent adjustments in relation to data and model limitations as a result of the Covid-19 economic disruption. The adjustments are based on a combination of portfolio level credit risk analysis and an evaluation of ECL coverage at an exposure level.
Management overlays
Management overlays reflect the significant uncertainty as a consequence of the Covid-19 pandemic. Considerations included the potential severity and duration of the economic disruption and the heightened credit risk of specific sectors and loan classes.
Modified financial assets
The contractual terms of a loan may be modified for a number of reasons, including changing market conditions,
customer retention and other factors not related to a current or potential credit deterioration of the customer. An existing loan whose terms have been modified may be derecognised and the renegotiated loan recognised as a new loan at fair value in accordance with the accounting policy set out in Note 5(I)(iv).
When the terms of a financial asset are modified and the modification does not result in derecognition, the determination of whether the asset’s credit risk has increased significantly reflects comparison of:
- its remaining lifetime PD at the reporting date based on the modified terms; with
- the remaining lifetime PD estimated based on data on initial recognition and the original contractual terms.
When modification results in derecognition, a new loan is recognised and allocated to Stage 1 (assuming it is not credit-impaired at that time).

dfcu ANNUAL REPORT AND FINANCIAL STATEMENTS 2020 dfcu ANNUAL REPORT AND FINANCIAL STATEMENTS 2020 159158
6. Financial risk management (continued)6B Credit risk (continued)
The Group renegotiates loans to customers in financial difficulties (referred to as ‘forbearance activities’) to maximise collection opportunities and minimise the risk of default. Under the Group’s forbearance policy, loan forbearance is granted on a selective basis if the debtor is currently in default on its debt or if there is a high risk of default, there is evidence that the debtor made all reasonable efforts to pay under the original contractual terms and the debtor is expected to be able to meet the revised terms.
The revised terms usually include extending the maturity, changing the timing of interest payments and amending the terms of loan covenants. Both retail and corporate loans are subject to the forbearance policy. The Group Credit Committee regularly reviews reports on forbearance activities.
For financial assets modified as part of the Group’s forbearance policy, the estimate of PD reflects whether the modification has improved or restored the Group’s ability to collect interest and principal and the Group’s previous experience of similar forbearance action. As part of this process, the Group evaluates the borrower’s payment performance against the modified contractual terms and considers various behavioral indicators.
Generally, forbearance is a qualitative indicator of a significant increase in credit risk and an expectation of forbearance may constitute evidence that an exposure is credit-impaired. A customer needs to demonstrate consistently good payment behavior over a period of time before the exposure is no longer considered to be credit-impaired/in default or the PD is considered to have decreased such that the loss allowance reverts to being measured at an amount equal to Stage 1.
The following tables provide a summary of the Group’s forborne assets, which are all under Stage 2. There are none under Stage 3.
31 December 2020 Stage 2
Gross carrying amount
Temporary modification to
T&Cs
Permanent modification to
T&Cs
Refinancing Total performing restructured
loans
Ushs m Ushs m Ushs m Ushs m Ushs m
Corporate loans 163,986 8,199 19,678 11,479 39,357
Retail loans 78,766 14,966 11,027 6,301 32,294
242,752 23,165 30,706 17,780 71,651
31 December 2019 Stage 2
Gross carrying amount
Temporary modification to
T&Cs
Permanent modification to
T&Cs
Refinancing Total performing restructured
loans
Ushs m Ushs m Ushs m Ushs m Ushs m
Corporate loans 80,593 - 23,372 8,865 32,237
Retail loans 53,359 - 10,138 1,601 11,739
133,952 - 33,510 10,466 43,976

dfcu ANNUAL REPORT AND FINANCIAL STATEMENTS 2020 dfcu ANNUAL REPORT AND FINANCIAL STATEMENTS 2020 161160
6. Financial risk management (continued)6B Credit risk (continued)
The table below shows the gross carrying amount of previously modified financial assets for which loss allowance has changed to 12mECL measurement during the period:
31 December 2020
Post- modification Pre-modification
Gross carrying amount
Corresponding ECL
Gross carrying amount
Corresponding ECL
Ushs m Ushs m Ushs m Ushs m
Facilities that have cured since
modification and are now measured
using 12mECL (Stage 1) 59,523 874 42,524 579
Facilities that reverted to (Stage 2/3)
LTECL having once cured 23,527 758 19,527 258
Total 83,050 1,632 62,051 837
31 December 2019
Post- modification Pre-modification
Gross carrying amount
Corresponding ECL
Gross carrying amount
Corresponding ECL
Ushs m Ushs m Ushs m Ushs m
Facilities that have cured since
modification and are now measured
using 12mECL (Stage 1) 62,528 667 35,857 358
Facilities that reverted to (Stage 2/3)
LTECL having once cured 22,857 487 18,951 311
Total 85,385 1,154 54,808 669
Measurement of ECL
The key inputs into the measurement of ECL are the term structure of the following variables:
- probability of default (PD);- loss given default (LGD); and- exposure at default (EAD).
ECL for exposures in Stage 1 is calculated by multiplying the 12-month PD by LGD and EAD.
Lifetime ECL is calculated by multiplying the lifetime PD by LGD and EAD.
The methodology of estimating PDs is discussed above under the heading, ‘Generating the term structure of PD’.LGD is the magnitude of the likely loss if there is a default. The Group estimates LGD parameters based on the history of recovery rates of claims against defaulted counterparties. The LGD models consider the structure, collateral, seniority of the claim, counterparty industry and recovery costs of any collateral that is integral to the financial asset. For loans secured by retail property, LTV ratios are a key parameter in determining LGD. LGD estimates are recalibrated for different economic scenarios and, for real estate lending, to reflect possible changes in property prices. They are calculated on a discounted cash flow basis using the effective interest rate as the discounting factor.

dfcu ANNUAL REPORT AND FINANCIAL STATEMENTS 2020 dfcu ANNUAL REPORT AND FINANCIAL STATEMENTS 2020 161160
6. Financial risk management (continued)6B Credit risk (continued)
EAD represents the expected exposure in the event of a default. The Group derives the EAD from the current exposure to the counterparty and potential changes to the current amount allowed under the contract and arising from amortisation. The EAD of a financial asset is its gross carrying amount at the time of default. For lending commitments, the EADs are potential future amounts that may be drawn under the contract, which are estimated based on historical observations and forward-looking forecasts. For financial guarantees, the EAD represents the amount of the guaranteed exposure when the financial guarantee becomes payable. For some financial assets, EAD is determined by modelling the range of possible exposure outcomes at various points in time using scenario and statistical techniques.
As described above, and subject to using a maximum of a 12-month PD for Stage 1 financial assets, the Group measures ECL considering the risk of default over the maximum contractual period (including any borrower’s extension options) over which it is exposed to credit risk, even if, for credit risk management purposes, the Group considers a longer period. The maximum contractual period extends to the date at which the Group has the right to require repayment of an advance or terminate a loan commitment or guarantee.
However, for retail overdrafts and credit card facilities that include both a loan and an undrawn commitment component, the Group measures ECL over a period longer than the maximum contractual period if the Group’s
contractual ability to demand repayment and cancel the undrawn commitment does not limit the Group’s exposure to credit losses to the contractual notice period. These facilities do not have a fixed term or repayment structure and are managed on a collective basis. The Group can cancel them with immediate effect but this contractual right is not enforced in the normal day-to-day management, but only when the Group becomes aware of an increase in credit risk at the facility level. This longer period is estimated taking into account the credit risk management actions that the Group expects to take, and that serve to mitigate ECL. These include a reduction in limits, cancellation of the facility and/or turning the outstanding balance into a loan with fixed repayment terms.
Where modelling of a parameter is carried out on a collective basis, the financial instruments are grouped on the basis of shared risk characteristics that include:
- instrument type;- credit risk gradings;- loan amount- industry; and- geographic location of the borrower.
The groupings are subject to regular review to ensure that exposures within a particular Group remain appropriately homogeneous.
For portfolios in respect of which the Group has limited historical data, external benchmark information is used to supplement the internally available data. The portfolios for which external benchmark information represents a significant input into measurement of ECL are as follows.
2020 External benchmarks used
Exposure Ushs Moody’s Rating S&P Rating
2020 2019 PD LGD
Government securities – Amortised cost
257 bn 363 bn 2.8% - 21.4% 6%
Government securities - FVOCI 259 bn 123 bn 2.8% - 21.4% 6%
i. Impaired financial assets
Loans with renegotiated terms
Loans with renegotiated terms are defined as loans that have been restructured due to a deterioration in the borrower’s financial position, for which the Group has made concessions by agreeing to terms and conditions that are more favorable for the borrower than the Group had provided initially and that it would not otherwise consider. A loan continues to be presented as part of loans with renegotiated terms until maturity, early repayment or write-off.
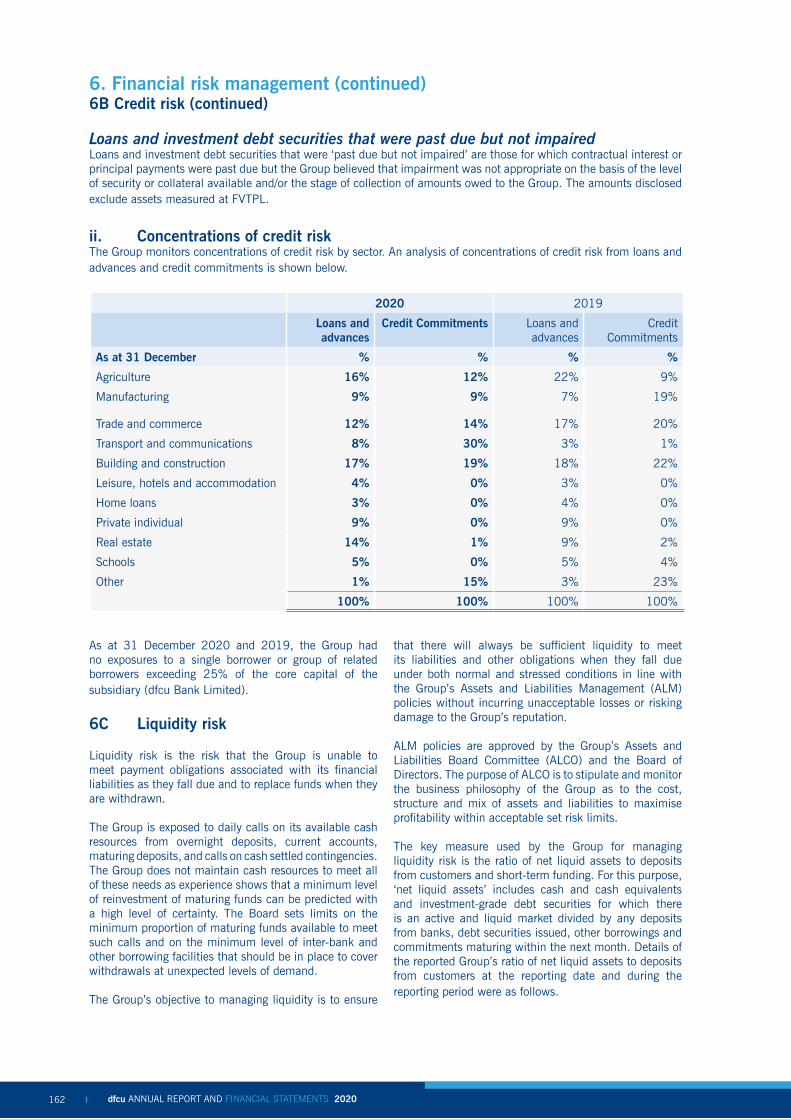
dfcu ANNUAL REPORT AND FINANCIAL STATEMENTS 2020 dfcu ANNUAL REPORT AND FINANCIAL STATEMENTS 2020 163162
6. Financial risk management (continued)6B Credit risk (continued)
Loans and investment debt securities that were past due but not impairedLoans and investment debt securities that were ‘past due but not impaired’ are those for which contractual interest or principal payments were past due but the Group believed that impairment was not appropriate on the basis of the level of security or collateral available and/or the stage of collection of amounts owed to the Group. The amounts disclosed exclude assets measured at FVTPL.
ii. Concentrations of credit riskThe Group monitors concentrations of credit risk by sector. An analysis of concentrations of credit risk from loans and advances and credit commitments is shown below.
2020 2019
Loans and advances
Credit Commitments Loans and advances
Credit Commitments
As at 31 December % % % %
Agriculture 16% 12% 22% 9%
Manufacturing 9% 9% 7% 19%
Trade and commerce 12% 14% 17% 20%
Transport and communications 8% 30% 3% 1%
Building and construction 17% 19% 18% 22%
Leisure, hotels and accommodation 4% 0% 3% 0%
Home loans 3% 0% 4% 0%
Private individual 9% 0% 9% 0%
Real estate 14% 1% 9% 2%
Schools 5% 0% 5% 4%
Other 1% 15% 3% 23%
100% 100% 100% 100%
As at 31 December 2020 and 2019, the Group had no exposures to a single borrower or group of related borrowers exceeding 25% of the core capital of the subsidiary (dfcu Bank Limited).
6C Liquidity risk
Liquidity risk is the risk that the Group is unable to meet payment obligations associated with its financial liabilities as they fall due and to replace funds when they are withdrawn.
The Group is exposed to daily calls on its available cash resources from overnight deposits, current accounts, maturing deposits, and calls on cash settled contingencies. The Group does not maintain cash resources to meet all of these needs as experience shows that a minimum level of reinvestment of maturing funds can be predicted with a high level of certainty. The Board sets limits on the minimum proportion of maturing funds available to meet such calls and on the minimum level of inter-bank and other borrowing facilities that should be in place to cover withdrawals at unexpected levels of demand.
The Group’s objective to managing liquidity is to ensure
that there will always be sufficient liquidity to meet its liabilities and other obligations when they fall due under both normal and stressed conditions in line with the Group’s Assets and Liabilities Management (ALM) policies without incurring unacceptable losses or risking damage to the Group’s reputation.
ALM policies are approved by the Group’s Assets and Liabilities Board Committee (ALCO) and the Board of Directors. The purpose of ALCO is to stipulate and monitor the business philosophy of the Group as to the cost, structure and mix of assets and liabilities to maximise profitability within acceptable set risk limits.
The key measure used by the Group for managing liquidity risk is the ratio of net liquid assets to deposits from customers and short-term funding. For this purpose, ‘net liquid assets’ includes cash and cash equivalents and investment-grade debt securities for which there is an active and liquid market divided by any deposits from banks, debt securities issued, other borrowings and commitments maturing within the next month. Details of the reported Group’s ratio of net liquid assets to deposits from customers at the reporting date and during the reporting period were as follows.

dfcu ANNUAL REPORT AND FINANCIAL STATEMENTS 2020 dfcu ANNUAL REPORT AND FINANCIAL STATEMENTS 2020 163162
6. Financial risk management (continued)6C Liquidity risk (continued)
2020 2019
At 31 December 36.0% 27.0%
Average for the period 31.0% 29.0%
Maximum for the period 39.0% 33.0%
Minimum for the period 27.0% 24.0%
The table below summarises the net position as at 31 December 2020 and 31 December 2019 based on contractual maturity.
Net position as at 31 December 2020 (Group)
Months Up to 1-3 3-12 >1
1 month months months Year
Long / (short) Gap (735,326) 38,140 (163,928) 943,479
Long / (short) Cumulative Gap (735,326) (697,186) (861,114) 82,365
Cumulative Gap / Total Assets (21%) (20%) (25%) 2% Net position as at 31 December 2019 (Group)
Months Up to 1-3 3-12 >1
1 month months months Year
Long / (short) Gap (726,500) 29,423 (182,462) 653,541
Long / (short) Cumulative Gap (726,500) (697,077) (879,539) (225,998)
Cumulative Gap / Total Assets (25%) (24%) (30%) (8%)
Net position as at 31 December 2020 (Company)
Months Up to 1-3 3-12 >1
1 month months months Year
Long / (short) Gap (1,234) (208) (4,852) (17,407)
Long / (short) Cumulative Gap (1,234) (1,442) (6,294) (23,701)
Cumulative Gap / Total Assets (1%) (1%) (3%) (11%) Net position as at 31 December 2019 (Company)
Months Up to 1-3 3-12 >1
1 month months months Year
Long / (short) Gap (459) (208) (4,824) (19,985)
Long / (short) Cumulative Gap (459) (667) (5,491) (25,476)
Cumulative Gap / Total Assets (0%) (0%) (2%) (11%)

dfcu ANNUAL REPORT AND FINANCIAL STATEMENTS 2020 dfcu ANNUAL REPORT AND FINANCIAL STATEMENTS 2020 165164
6. Financial risk management (continued)6C Liquidity risk (continued)
The following are the remaining contractual maturities financial liabilities at the reporting date. The amounts are gross and undiscounted and include contractual interest payments and exclude the impact of netting agreements.
Group
Contractual Cash flows
Carrying Gross nominal
Up to 1-3 3 – 12 Over
2020 Amount inflow/(outflow)
1 month months months 1 year
Ushs M Ushs M Ushs M Ushs M Ushs M
Financial liability by type
Customer deposits 2,595,347 2,906,789 2,196,352 143,495 565,261 1,681
Balances due to other banks 10,968 10,968 10,968 - - -
Derivative financial instruments
97 97 97 - - -
Other financial liabilities 58,175 97,975 6,380 15,331 38,561 37,703
Borrowed funds 217,219 231,862 4,324 1,241 67,580 158,717
Special funds 1,193 1,193 1,193 - - -
Total liabilities 2,882,999 3,248,884 2,219,314 160,067 671,402 198,101 Financial assets by type
Cash and balances with Bank of Uganda
606,750 606,750 606,750 - - -
Loans and advances to other banks
195,441 195,441 195,441 - - -
Loans and advances to customers
1,775,316 2,025,839 522,693 236,521 408,694 857,931
Government and other securities
575,362 644,860 148,783 54,054 148,832 293,191
Equity Investments at fair value through profit and loss
8,513 8,513 8,513 - - -
Other assets excluding prepayments
119,640 119,640 34,092 21,487 45,763 18,298
Total assets 3,281,022 3,601,043 1,516,272 312,062 603,289 1,169,420
Liquidity Gap 398,023 352,159 (703,042) 151,995 (68,113) 971,319

dfcu ANNUAL REPORT AND FINANCIAL STATEMENTS 2020 dfcu ANNUAL REPORT AND FINANCIAL STATEMENTS 2020 165164
6. Financial risk management (continued)6C Liquidity risk (continued)
Group
Contractual Cash flows
Carrying Gross nominal Up to 1-3 3 – 12 Over
2019 Amount inflow/(outflow)
1 month months months 1 year
Ushs M Ushs M Ushs M Ushs M Ushs M
Financial liability by type
Customer deposits 2,039,037 2,061,551 1,454,118 213,821 328,712 64,900
Balances due to other banks
10,002 10,002 10,002 - - -
Other liabilities excluding deferred income
61,223 66,177 1,390 11,215 29,687 23,885
Borrowed funds 273,354 276,839 2,102 563 4,582 269,592
Special funds 1,205 1,205 1,205 - - -
Total liabilities 2,384,821 2,415,774 1,468,817 225,599 362,981 358,377
Financial assets by type
Cash and balances with Bank of Uganda 394,892 394,892 394,892 - - -
Loans and advances to other banks 111,116 111,116 111,116 - - -
Loans and advances to customers 1,539,323 2,135,123 189,632 194,871 301,254 1,449,366
Government and other securities 509,401 555,221 48,521 32,571 98,254 375,875
Equity Investments at fair value through profit and loss 8,625 8,625 8,625 - - -
Other assets excluding prepayments 173,738 173,738 1,187 1,279 23,311 147,961
Total assets 2,737,095 3,378,715 753,973 228,721 422,819 1,973,202
Liquidity Gap 352,274 962,941 (714,844) 3,122 59,838 1,614,825

dfcu ANNUAL REPORT AND FINANCIAL STATEMENTS 2020 dfcu ANNUAL REPORT AND FINANCIAL STATEMENTS 2020 167166
6. Financial risk management (continued)6C Liquidity risk (continued)
Company
Contractual cash flows
Carrying Gross nominal
Up to 1-3 3 – 12 Over
2020 Amount inflow/(outflow)
1 month months months 1 year
Ushs M Ushs M Ushs M Ushs M Ushs M
Financial liability by type
Amounts due to Group Companies
15,932 18,640 - - 1,665 16,975
Other financial liabilities 3,517 3,517 1,448 208 936 925
Borrowed funds 4,502 5,268 - - 2,634 2,634
Total liabilities 23,951 27,425 1,448 208 5,235 20,534
Financial assets by type
Amounts due from Group companies
197 197 197 - - -
Other assets excluding prepayments
17 17 17 - - -
Total assets 214 214 214 - - -
Liquidity gap (23,737) (27,211) (1,234) (208) (5,235) (20,534)
Company
Contractual Cash flows
Carrying Gross nominal
Up to 1-3 3 – 12 Over
2019 Amount inflow/(outflow)
1 month months months 1 year
Ushs M Ushs M Ushs M Ushs M Ushs M
Financial liability by type
Amounts due to Group Companies 14,252 16,675 - - 1,665 15,010
Other financial liabilities 8,509 8,509 2,190 208 936 2,175
Borrowed funds 4,446 5,202 - - 2,601 2,601
Total liabilities 27,207 30,386 2,190 208 5,202 19,786
Financial assets by type
Amounts due from Group companies 1,714 1,714 1,714 - - -
Other assets excluding prepayments 17 17 17 - - -
Total assets 1,731 1,731 1,731 - - -
Liquidity Gap (25,476) (28,655) (459) (208) (5,202) (19,786)
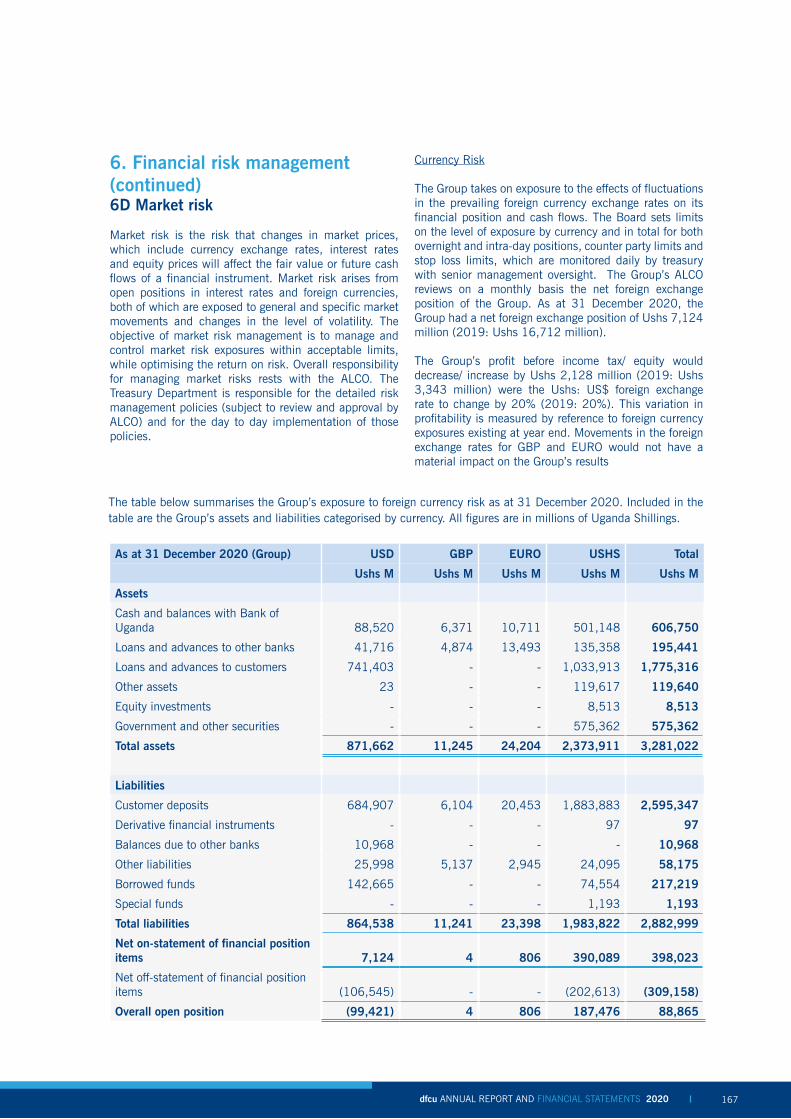
dfcu ANNUAL REPORT AND FINANCIAL STATEMENTS 2020 dfcu ANNUAL REPORT AND FINANCIAL STATEMENTS 2020 167166
6. Financial risk management (continued)6D Market risk
Market risk is the risk that changes in market prices, which include currency exchange rates, interest rates and equity prices will affect the fair value or future cash flows of a financial instrument. Market risk arises from open positions in interest rates and foreign currencies, both of which are exposed to general and specific market movements and changes in the level of volatility. The objective of market risk management is to manage and control market risk exposures within acceptable limits, while optimising the return on risk. Overall responsibility for managing market risks rests with the ALCO. The Treasury Department is responsible for the detailed risk management policies (subject to review and approval by ALCO) and for the day to day implementation of those policies.
Currency Risk
The Group takes on exposure to the effects of fluctuations in the prevailing foreign currency exchange rates on its financial position and cash flows. The Board sets limits on the level of exposure by currency and in total for both overnight and intra-day positions, counter party limits and stop loss limits, which are monitored daily by treasury with senior management oversight. The Group’s ALCO reviews on a monthly basis the net foreign exchange position of the Group. As at 31 December 2020, the Group had a net foreign exchange position of Ushs 7,124 million (2019: Ushs 16,712 million).
The Group’s profit before income tax/ equity would decrease/ increase by Ushs 2,128 million (2019: Ushs 3,343 million) were the Ushs: US$ foreign exchange rate to change by 20% (2019: 20%). This variation in profitability is measured by reference to foreign currency exposures existing at year end. Movements in the foreign exchange rates for GBP and EURO would not have a material impact on the Group’s results
The table below summarises the Group’s exposure to foreign currency risk as at 31 December 2020. Included in the table are the Group’s assets and liabilities categorised by currency. All figures are in millions of Uganda Shillings.
As at 31 December 2020 (Group) USD GBP EURO USHS Total
Ushs M Ushs M Ushs M Ushs M Ushs M
Assets
Cash and balances with Bank of Uganda 88,520 6,371 10,711 501,148 606,750
Loans and advances to other banks 41,716 4,874 13,493 135,358 195,441
Loans and advances to customers 741,403 - - 1,033,913 1,775,316
Other assets 23 - - 119,617 119,640
Equity investments - - - 8,513 8,513
Government and other securities - - - 575,362 575,362
Total assets 871,662 11,245 24,204 2,373,911 3,281,022
Liabilities
Customer deposits 684,907 6,104 20,453 1,883,883 2,595,347
Derivative financial instruments - - - 97 97
Balances due to other banks 10,968 - - - 10,968
Other liabilities 25,998 5,137 2,945 24,095 58,175
Borrowed funds 142,665 - - 74,554 217,219
Special funds - - - 1,193 1,193
Total liabilities 864,538 11,241 23,398 1,983,822 2,882,999
Net on-statement of financial position items 7,124 4 806 390,089 398,023
Net off-statement of financial position items (106,545) - - (202,613) (309,158)
Overall open position (99,421) 4 806 187,476 88,865

dfcu ANNUAL REPORT AND FINANCIAL STATEMENTS 2020 dfcu ANNUAL REPORT AND FINANCIAL STATEMENTS 2020 169168
6. Financial risk management (continued)6D Market risk
As at 31 December 2019 (Group) USD GBP EURO USHS Total
Ushs M Ushs M Ushs M Ushs M Ushs M
Assets
Cash and balances with Bank of Uganda
63,266 2,191 6,340 323,095 394,892
Loans and advances to other banks 86,576 1,769 6,618 16,153 111,116
Loans and advances to customers 647,838 21 51 891,413 1,539,323
Other assets 617 50 693 182,188 183,548
Equity investments - - - 8,625 8,625
Government and other securities - - - 509,401 509,401
Total assets 798,297 4,031 13,702 1,930,875 2,746,905
Liabilities
Customer deposits 593,086 3,837 10,929 1,431,185 2,039,037
Balances due to other banks - - - 10,002 10,002
Other liabilities 4,595 46 1,262 39,511 45,414
Borrowed funds 183,904 - - 89,450 273,354
Special funds - - - 1,205 1,205
Total liabilities 781,585 3,883 12,191 1,571,353 2,369,012
Net on-statement of financial position items
16,712 148 1,511 359,522 377,893
Net off-statement of financial position items
(328,879) - - (264,343) (593,222)
Overall open position (312,167) 148 1,511 95,179 (215,329)

dfcu ANNUAL REPORT AND FINANCIAL STATEMENTS 2020 dfcu ANNUAL REPORT AND FINANCIAL STATEMENTS 2020 169168
6. Financial risk management (continued)6D Market risk
As at 31 December 2020 (Company) USD GBP EURO USHS Total
Ushs M Ushs M Ushs M Ushs M Ushs M
Assets
Other assets - - - 17 17
Amounts due from Group companies 167 - - 30 197
Total assets 167 - - 47 214
Liabilities
Other liabilities - - - 3,517 3,517
Amounts due to Group companies - - - 15,932 15,932
Borrowed funds - - - 4,502 4,502
Total liabilities - - - 23,951 23,915
Overall open position 167 - - (23,904) (23,737)
As at 31 December 2019 (Company) USD GBP EURO USHS Total
Ushs M Ushs M Ushs M Ushs M Ushs M
Assets
Other assets - - - 17 17
Amounts due from Group companies 1,636 - - 30 1,714
Total assets 1,636 - - 47 1,683
Liabilities
Other liabilities - - - 8,509 8,509
Amounts due to Group companies - - - 14,252 14,252
Borrowed funds - - - 4,446 4,446
Total liabilities - - - 27,207 27,207
Overall open position 1,636 - - (27,160) (25,524)

dfcu ANNUAL REPORT AND FINANCIAL STATEMENTS 2020 dfcu ANNUAL REPORT AND FINANCIAL STATEMENTS 2020 171170
6. Financial risk management (continued)6D Market risk
Interest rate risk
The Group takes on exposure to the effects of fluctuations in the prevailing levels of market interest rates on both its fair value and cash flow risks. Interest margins may increase as a result of such changes but may reduce or create losses in the event that unexpected movements arise. The Board of Directors sets limits on the level of mismatch of interest rate re-pricing that may be undertaken, which is monitored monthly.
The Group faces fair value interest rate risk on its fixed interest financial assets that are measured at fair value. In addition, the Group faces cash flow interest rate risk on its variable rate financial instruments measured at amortised cost. Financial instruments with fair value interest rate risk comprise solely the held-for-trading portfolio of Government securities. Financial instruments with cash flow interest rate risk comprise deposits and balances due from other banks, loans and advances receivable/payable, customer deposits and amounts due to other group companies.
The table below summarises the Group’s fair value and cash flow interest rate risks at 31 December 2020 assuming a market interest rate decrease of 3% from the rates ruling at year-end (2019: 3%). This would have an impact on the profit before income tax of the Group as follows:
2020 2019
Ushs M Ushs M
Fair value interest rate risk 1,100 1,067
Cash flow interest rate risk 35,580 34,484
36,680 35,551
The tables below summarise the Group’s exposure to interest rate risk as at 31 December 2020 and 31 December 2019. Included in the table is the Group’s interest bearing assets and liabilities at carrying amounts categorised by the earlier of contractual re-pricing or maturity dates. The Group does not bear any interest rate risk on off-statement of financial position items like commitments to lend, guarantees and letters of credit. All figures are in millions of Uganda Shillings.

dfcu ANNUAL REPORT AND FINANCIAL STATEMENTS 2020 dfcu ANNUAL REPORT AND FINANCIAL STATEMENTS 2020 171170
6. Financial risk management (continued)6D Market risk
As at 31 December 2020 (Group)
Up to1 monthUshs M
1 – 3monthsUshs M
3 – 12monthsUshs M
Over1 year
Ushs M
Non - interest bearingUshs M
TotalUshs M
Financial assets
Cash and balances with Bank of Uganda
- - - - 606,750 606,750
Deposits and balances due from other banks
134,773 - - - 60,668 195,441
Loans and advances to customers
456,957 207,474 358,503 815,248 (62,866) 1,775,316
Government and other securities
128,446 48,697 134,083 264,136 - 575,362
Investment in shares - - - - 8,513 8,513
Other assets - - - - 119,640 119,640
720,176 256,171 492,586 1,079,384 732,705 3,281,022
Financial liabilities
Customer deposits 725,588 128,121 504,697 1,501 1,235,440 2,595,347
Derivative financial instruments
97 - - - - 97
Balances due to other banks 10,968 - - - - 10,968
Other liabilities - - - 26,631 31,544 58,175
Borrowed funds 2,202 1,138 52,416 107,283 54,180 217,219
Special funds - - - - 1,193 1,193
738,855 129,259 557,113 135,415 1,322,357 2,882,999
Interest re-pricing gap (18,679) 126,912 (64,527) 943,969 (589,652) 398,023

dfcu ANNUAL REPORT AND FINANCIAL STATEMENTS 2020 dfcu ANNUAL REPORT AND FINANCIAL STATEMENTS 2020 173172
6. Financial risk management (continued)6D Market risk
As at 31 December 2019 (Group)
Up to1 monthUshs M
1 – 3monthsUshs M
3 – 12monthsUshs M
Over1 year
Ushs M
Non - interest bearingUshs M
TotalUshs M
Financial assets
Cash and balances with Bank of Uganda
- - - - 394,892 394,892
Deposits and balances due from other banks
15,127 - - - 95,989 111,116
Loans and advances to customers
245,374 210,606 354,394 755,438 (26,489) 1,539,323
Government and other securities
62,386 91,433 75,838 279,744 - 509,401
Investment in shares - - - - 8,625 8,625
Other assets - - - - 177,893 177,893
322,887 302,039 430,232 1,035,182 650,910 2,741,250
Financial liabilities
Customer deposits 662,936 213,821 328,712 72 833,496 2,039,037
Balances due to other banks
10,002 - - - - 10,002
Other liabilities - - - 28,591 16,823 45,414
Borrowed funds 2,954 21 67,037 144,601 58,741 273,354
Special funds - - - - 1,205 1,205
675,892 213,842 395,749 173,264 910,265 2,369,012
Interest re-pricing gap (353,005) 88,197 34,483 861,918 (259,355) 372,238

dfcu ANNUAL REPORT AND FINANCIAL STATEMENTS 2020 dfcu ANNUAL REPORT AND FINANCIAL STATEMENTS 2020 173172
6. Financial risk management (continued)6D Market risk
As at 31 December 2020 (Company)
Up to 1 month
1-3months
3 – 12months
Over 1 year
Non -Interest bearing
Total
Assets Ushs M Ushs M Ushs M Ushs M Ushs M Ushs M
Other assets - - - - 17 17
Amounts due from Group companies
197 - - - - 197
Total assets 197 - - - 17 214
Liabilities
Other liabilities - - - - 3,517 3,517
Amounts due to Group companies - - 1,665 14,267 - 15,932
Borrowed funds - - 2,251 2,251 - 4,502
Total liabilities - - 3,916 16,518 3,517 23,915
Net liquidity position 197 - (3,916) (16,518) (3,500) (23,737)
As at 31 December 2019 (Company)
Assets
Other assets - - - - 17 17
Amounts due from Group companies
1,714 - - - - 1,714
Total assets 1,714 - - - 17 1,731
Liabilities
Other liabilities - - - - 8,509 8,509
Amounts due to Group companies - - 1,665 12,587 - 14,252
Borrowed funds - - 2,223 2,223 - 4,446
Total liabilities - - 3,888 14,810 8,509 27,498
Net liquidity position 1,714 - (3,888) (14,810) (8,492) (25,767)

dfcu ANNUAL REPORT AND FINANCIAL STATEMENTS 2020 dfcu ANNUAL REPORT AND FINANCIAL STATEMENTS 2020 175174
6. Financial risk management (continued)6E Fair values of financial assets and liabilities
i) Financial instruments measured at fair value
a) Valuation models
The Group measures fair values using the following fair value hierarchy, which reflects the significance of the inputs used in making the measurements.
- Level 1: Inputs that are quoted market prices (unadjusted) in active markets for identical instruments.
- Level 2: Inputs other than quoted prices included within Level 1 that are observable either directly (i.e. as prices) or indirectly (i.e. derived from prices). This category includes instruments valued using: quoted market prices in active markets for similar instruments; quoted prices for identical or similar instruments in markets that are considered less than active; or other valuation techniques in which all significant inputs are directly or indirectly observable from market data.
- Level 3: Inputs that are unobservable. This category includes all instruments for which the valuation technique includes inputs that are not observable and the unobservable inputs have a significant effect on the instrument’s valuation. This category includes instruments that are valued based on quoted prices for similar instruments for which significant unobservable adjustments or assumptions are required to reflect differences between the instruments.
Valuation techniques include net present value and discounted cash flow models, comparison with similar instruments for which observable market prices exist. Black-Scholes and polynomial option pricing models and other valuation models. Assumptions and inputs used in valuation techniques include risk-free and benchmark interest rates, credit spreads and other premiums used in estimating discount rates, bond and equity prices, foreign currency exchange rates, equity and equity index prices and expected price volatilities and correlations.The objective of valuation techniques is to arrive at a fair value measurement that reflects the price that would be received to sell the asset or paid to transfer the liability in an orderly transaction between market participants at the measurement date.
The Group uses widely recognised valuation models to determine the fair value of common and simple financial instruments, such as interest rate and currency swaps,
that use only observable market data and require little management judgement and estimation. Observable prices or model inputs are usually available in the market for listed debt and equity securities, exchange-traded derivatives and simple OTC derivatives such as interest rate swaps. The availability of observable market prices and model inputs reduces the need for management judgement and estimation and also reduces the uncertainty associated with determining fair values. The availability of observable market prices and inputs varies depending on the products and markets and is prone to changes based on specific events and general conditions in the financial markets.
For more complex instruments, the Group uses proprietary valuation models, which are usually developed from recognised valuation models. Some or all of the significant inputs into these models may not be observable in the market, and may be derived from market prices or rates or estimated based on assumptions. Examples of instruments involving significant unobservable inputs include certain OTC structured derivatives, certain loans, securities for which there is no active market and retained interests in securitisations (as discussed below). Valuation models that employ significant unobservable inputs require a higher degree of management judgement and estimation in the determination of fair value. Management judgement and estimation are usually required for the selection of the appropriate valuation model to be used, determination of expected future cash flows on the financial instrument being valued, determination of the probability of counterparty default and prepayments, determination of expected volatilities and correlations and selection of appropriate discount rates.
Fair value estimates obtained from models are adjusted for any other factors, such as liquidity risk or model uncertainties, to the extent that the Group believes that a third party market participant would take them into account in pricing a transaction. Fair values reflect the credit risk of the instrument and include adjustments to take account of the credit risk of the Group entity and the counterparty where appropriate. For measuring derivatives that might change classification from being an asset to a liability or vice versa - e.g. interest rate swaps - fair values take into account both credit valuation adjustment (CVA) and debit valuation adjustment (DVAJ when market participants would take this into consideration in pricing the derivatives.
Model inputs and values are calibrated against historical data and published forecasts and, where possible, against current or recent observed transactions in different instruments and against broker quotes. This calibration process is inherently subjective and it yields ranges of possible inputs and estimates of fair value, and management uses judgement to select the most appropriate point in the range.
dfcu ANNUAL REPORT AND FINANCIAL STATEMENTS 2020 dfcu ANNUAL REPORT AND FINANCIAL STATEMENTS 2020 175174
6. Financial risk management (continued)6E Fair values of financial assets and liabilities
Measurement on the basis of net exposures to risks
If the Group measures portfolios of financial assets and financial liabilities on the basis of net exposures to market risks, then it applies judgement in determining appropriate portfolio-level adjustments such as bid-ask spreads. These adjustments are derived from observable bid-ask spreads for similar instruments and adjusted for factors specific to the portfolio. Similarly, when the Group measures portfolios of financial assets and financial liabilities on the basis of net exposure to the credit risk of a particular counterparty, it takes into account any existing arrangements that mitigate the credit risk exposure - e.g. master netting agreements with the counterparty.Valuation techniques
Government debt securities
Government debt securities are financial instruments issued by sovereign governments and include both long-term bonds and short-term bills with fixed or floating rate interest payments. These instruments are generally highly liquid and traded in active markets. When active market prices are not available, the Group uses discounted cash flow models with observable market inputs of similar instruments and bond prices to estimate future index levels and extrapolating yields outside the range of active market trading, in which instances the Group classifies those securities as Level 2. The Group does not have Level 3 government securities where valuation inputs would be unobservable. The fair values of government securities are obtained from Bank of Uganda.
Equity instruments
The Group’s equity instruments are actively traded on public stock exchanges with readily available active prices on a regular basis. Such instruments are classified as Level 1.
Other assets at fair value through profit or loss
These comprise of loans and receivables designated at FVPL and mandatorily required to be measured at FVPL (those that did not meet the SPPI criteria), a discounted cash flow model is used based on various assumptions, including current and expected future credit losses, market rates of interest, prepayment rates and assumptions regarding market liquidity, where relevant. These assets are classified under Level 3 as the assessment of credit quality is based on unobservable data.
ii) Valuation framework
The Group has an established control framework for the measurement of fair values. This framework includes a Product Control function, which is independent of front office management and reports to the Chief Financial Officer, and which has overall responsibility for independently verifying the results of trading and investment operations and all significant fair value measurements.
Specific controls include:
- verification of observable pricing;- re-performance of model valuations;- a review and approval process for new models
and changes to models involving both Product Control and Group Market Risk;
- quarterly calibration and back-testing of models against observed market transactions;
- analysis and investigation of significant daily valuation movements; and
- review of significant unobservable inputs, valuation adjustments and significant changes to the fair value measurement of Level 3 instruments compared with the previous month, by a committee of senior Product Control and Group Market Risk personnel.

dfcu ANNUAL REPORT AND FINANCIAL STATEMENTS 2020 dfcu ANNUAL REPORT AND FINANCIAL STATEMENTS 2020 177176
6. Financial risk management (continued)6E Fair values of financial assets and liabilities
iii) Financial instruments measured at fair value - Fair value hierarchy
The following table analyses financial instruments measured at fair value at the reporting date, by the level in the fair value hierarchy into which the fair value measurement is categorised.
The amounts are based on the values recognised in the statement of financial position. The fair values include any deferred differences between the transaction price and the fair value on initial recognition when the fair value is based on a valuation technique that uses unobservable inputs.
The following are the financial instruments measured at fair value at the reporting date, by the level in the fair value hierarchy into which the fair value measurement is categorised. The amounts are based on the values recognised in the statement of financial position.
2020 Hierarchy Total
Level 1Ushs M
Level 2Ushs M
Level 3Ushs M Ushs M
Treasury bills and bonds - 58,357 - 58,357
Securities at fair value through OCI - 259,623 - 259,623
Other assets at fair value through profit and loss - - 109,892 109,892
Equity investments at fair value through profit and loss 8,513 - - 8,513
8,513 317,980 109,892 436,385
2019 Hierarchy Total
Level 1 Level 2 Level 3
Ushs M Ushs M Ushs M Ushs M
Treasury bills and bonds - 22,630 - 22,630
Securities at fair value through OCI - 123,254 - 123,254
Other assets at fair value through profit and loss - - 166,283 166,283
Equity investments at fair value through profit and loss
8,625 - - 8,625
8,625 145,884 166,283 320,792
During the year ended 31 December 2020, there were no transfers into or out of Level 2 and level 1 fair value measurements.
iv) Level 3 fair value measurements
The following table shows the reconciliation from the beginning balances to the ending balances for fair value measurements in level 3 of the fair value hierarchy;
2020 2019
Ushs M Ushs M
At 1 January 166,283 192,466
Recoveries during the year (5,903) (16,078)
Fair value (loss)/gain (50,488) (10,105)
At 31 December 109,892 166,283

dfcu ANNUAL REPORT AND FINANCIAL STATEMENTS 2020 dfcu ANNUAL REPORT AND FINANCIAL STATEMENTS 2020 177176
6. Financial risk management (continued)6E Fair values of financial assets and liabilities
v) Unobservable inputs used in measuring fair value
The following table sets out information about significant un-observable inputs used at 31 December 2020 and 2019 in measuring financial instruments categorised as Level 3 in the fair value hierarchy;
Type of financial instrument(Ushs M)
Fair value Valuation technique
Significant unobservable input
Fair value measurement sensitivity to unobservable input
2020 2019
Other Financial Asset at FVTPL
109,892 166,283 Discounted cash flows
Expected net cash flows derived from the entity (based on factors such as projected cash flows from business operations, fair value of collateral held, recovery rates, discount rates, time to realisation)
A 10% increase in expected net cash flows would result in a higher fair value
2020(Ushs M)
2019(Ushs M)
119,501 181,583
Estimated cash flows are derived from the entity’s business plan and historical comparison between plans and actual results.

dfcu ANNUAL REPORT AND FINANCIAL STATEMENTS 2020 dfcu ANNUAL REPORT AND FINANCIAL STATEMENTS 2020 179178
6. Financial risk management (continued)6E Fair values of financial assets and liabilities vi) Financial instruments not measured at fair value
The tables below sets out the fair values of financial assets and liabilities not measured at fair value and analyses them by the level in the fair value hierarchy into which each fair value measurement is categorised.
2020 (Group) Level 1 Level 2 Level 3 Fair value Carrying amount
Ushs M
Ushs M Ushs M Ushs M Ushs M
Cash and balances with Bank of Uganda
- 606,750 - 606,750 606,750
Loans and advances to other banks - 195,441 - 195,441 195,441
Loans and advances to customers - - 1,775,316 1,775,316 1,775,316
Investment securities at amortised cost - 257,382 - 257,382 257,382
Other assets excluding prepayments - - 9,748 9,748 9,748
Off balance sheet items:
Guarantees and performance bonds - - - 271,869 271,869
Undrawn commitments - - - 37,289 37,289
Customer deposits - (2,595,347) - (2,595,347) (2,595,347)
Balances due to other banks - (10,968) - (10,968) (10,968)
Other liabilities excluding accrued expenses and lease liability
- (22,246) (22,246) (22,246)
Borrowed funds - (217,219) - (217,219) (217,219)
Special funds - (1,193) - (1,193) (1,193)
2019 (Group) Level 1 Level 2 Level 3 Fair value Carrying amount
Ushs M Ushs M Ushs M Ushs M Ushs M
Cash and balances with Bank of Uganda
- 394,892 - 394,892 394,892
Loans and advances to other banks - 111,116 - 111,116 111,091
Loans and advances to customers - - 1,539,323 1,539,323 1,539,323
Investment securities at amortised cost - 351,252 - 351,252 363,517
Other assets excluding prepayments - - 7,455 7,455 7,455
Customer deposits - (2,039,037) - (2,039,037) (2,039,037)
Other liabilities excluding deferred income
- (61,223) (61,223) (61,223)
Borrowed funds - (273,354) - (273,354) (273,354)
Special funds - (1,205) - (1,205) (1,205)
The fair values of the Group’s and Company’s other financial assets and liabilities that are measured at amortised cost approximate the respective carrying amounts, due to the generally short periods to contractual re-pricing or maturity dates.
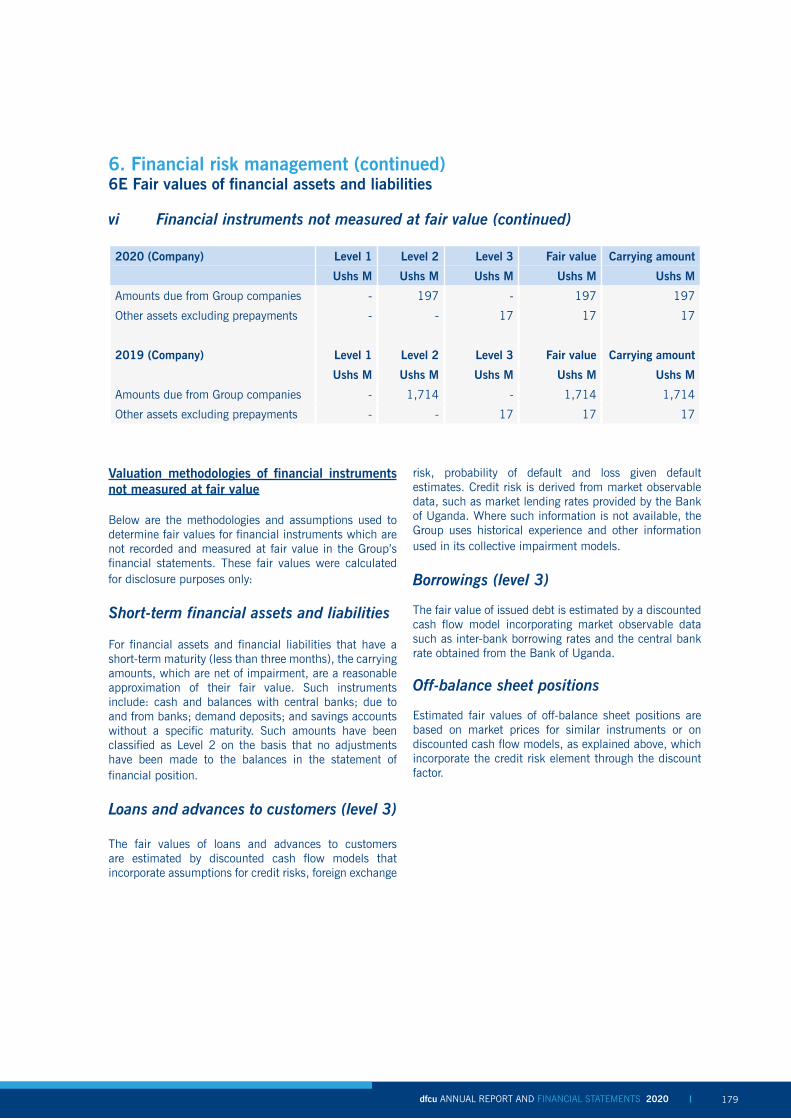
dfcu ANNUAL REPORT AND FINANCIAL STATEMENTS 2020 dfcu ANNUAL REPORT AND FINANCIAL STATEMENTS 2020 179178
6. Financial risk management (continued)6E Fair values of financial assets and liabilities
vi Financial instruments not measured at fair value (continued)
2020 (Company) Level 1 Level 2 Level 3 Fair value Carrying amount
Ushs M Ushs M Ushs M Ushs M Ushs M
Amounts due from Group companies - 197 - 197 197
Other assets excluding prepayments - - 17 17 17
2019 (Company) Level 1 Level 2 Level 3 Fair value Carrying amount
Ushs M Ushs M Ushs M Ushs M Ushs M
Amounts due from Group companies - 1,714 - 1,714 1,714
Other assets excluding prepayments - - 17 17 17
Valuation methodologies of financial instruments not measured at fair value
Below are the methodologies and assumptions used to determine fair values for financial instruments which are not recorded and measured at fair value in the Group’s financial statements. These fair values were calculated for disclosure purposes only:
Short-term financial assets and liabilities
For financial assets and financial liabilities that have a short-term maturity (less than three months), the carrying amounts, which are net of impairment, are a reasonable approximation of their fair value. Such instruments include: cash and balances with central banks; due to and from banks; demand deposits; and savings accounts without a specific maturity. Such amounts have been classified as Level 2 on the basis that no adjustments have been made to the balances in the statement of financial position.
Loans and advances to customers (level 3)
The fair values of loans and advances to customers are estimated by discounted cash flow models that incorporate assumptions for credit risks, foreign exchange
risk, probability of default and loss given default estimates. Credit risk is derived from market observable data, such as market lending rates provided by the Bank of Uganda. Where such information is not available, the Group uses historical experience and other information used in its collective impairment models.
Borrowings (level 3)
The fair value of issued debt is estimated by a discounted cash flow model incorporating market observable data such as inter-bank borrowing rates and the central bank rate obtained from the Bank of Uganda.
Off-balance sheet positions
Estimated fair values of off-balance sheet positions are based on market prices for similar instruments or on discounted cash flow models, as explained above, which incorporate the credit risk element through the discount factor.

dfcu ANNUAL REPORT AND FINANCIAL STATEMENTS 2020 dfcu ANNUAL REPORT AND FINANCIAL STATEMENTS 2020 181180
6. Financial risk management (continued)6FCapital management
The Group’s objectives when managing capital, which is a broader concept than the ‘equity’ on the statement of financial positions, are:
- To comply with the capital requirements set by the Financial Institutions Act 2004 for purposes of the subsidiary, dfcu Bank;
- To safeguard the Group’s ability to continue as a going concern, so that it can continue to provide returns for shareholders and benefits for other stakeholders; and
- To maintain a strong capital base to support the development of its business.
Capital adequacy and use of regulatory capital are monitored regularly by management employing techniques based on the guidelines developed by the Basel Committee, as adapted and implemented by Bank of Uganda for supervisory purposes under the Financial Institutions Act, 2004 (FIA). dfcu Bank (the Bank) is required to file information on capital adequacy with Bank of Uganda on a quarterly basis.
As of 31 December 2020, the Financial Institutions Capital Adequacy Requirements Regulations 2020 requires each bank to:
a) have a minimum paid up capital unimpaired by losses of Ushs 25 billion;
b) maintain core capital of not less than 10% of the total risk adjusted assets plus risk adjusted off statement of financial position items; and
c) maintain total capital of not less than 12% of the total risk adjusted assets plus risk adjusted off statement of financial position items.
The total regulatory capital to be held by the Bank is divided into two tiers:
- Tier 1 capital (core capital): share capital, share premium, plus retained earnings less goodwill and similar intangible assets, investments in unconsolidated subsidiaries and future income tax benefits.
- Tier 2 capital (supplementary capital): revaluation reserves, general provisions for losses not exceeding 1.25% of risk weighted assets, subordinated debt not exceeding 50% of Tier 1 capital and hybrid capital instruments. Qualifying Tier 2 capital is limited to 100% of Tier 1 capital.
The risk weighted assets are measured by means of a hierarchy of four risk weights classified according to the nature of – and reflecting an estimate of the credit risk associated with - each asset and counterparty. A similar treatment is adopted for off-statement of financial position exposure, with some adjustments to reflect the more contingent nature of the potential losses. The table below summarises the composition of regulatory capital and the ratios of dfcu Bank:
2020 2019
Ushs M Ushs M
Before dividend declaration
Tier 1 capital 521,810 493,825
Tier 1 + Tier 2 capital 561,796 538,638
After dividend declaration
Tier 1 capital 482,159 493,825
Tier 1 + Tier 2 capital 522,146 538,638
2020 2019
Tier 1 (FIA minimum – 10%) 20.93% 19.55%
Tier 1 + Tier 2 (FIA minimum – 12%) 22.53% 21.33%
FIA ratio (after dividend declaration)
Tier 1 (FIA minimum – 10%) 19.34% 19.55%
Tier 1 + Tier 2 (FIA minimum – 12%) 20.94% 21.33%

dfcu ANNUAL REPORT AND FINANCIAL STATEMENTS 2020 dfcu ANNUAL REPORT AND FINANCIAL STATEMENTS 2020 181180
6. Financial risk management (continued)6G Operational risk management
Operational risk is the risk of loss resulting from inadequate or failed internal processes, people and systems or from external events.
Recognising that operational risk cannot be entirely eliminated, the Group implemented risk mitigation controls including fraud prevention, contingency planning, information security and incident management and continues to enhance the same. Where appropriate, this strategy is further supported by risk transfer mechanisms such as insurance. Over the past year, the Group has continued to invest heavily in technology/systems to create more digital channels, increase operational efficiency in a bid to leverage on IT to drive its strategy.A failure to ensure this information is kept safe and used in a way that regulators and customers expect, may significantly impact relationships with these stakeholders and the broader community.The Group has put in place measures to address the operational risks as highlighted below;
- The Group has and continues to invest significantly in data, analytics and cyber-security capabilities to better meet evolving customer needs and expectations, and to reduce the potential for data breaches.
- The Group actively engages with regulators to ensure that there is appropriate mutual understanding of the technology space and that evolution in regulation appropriately balances the value of giving customers control of their data, with the Group’s duty to protect customers’ privacy and security.
- The Group continuously invests in IT system security and identifies and accesses management controls to secure the confidentiality, integrity and availability of the Group’s data.
- The employees undergo mandatory training modules to ensure they understand the importance of data security and their obligations in relation to the data they have access to.
- As the second line of defense, the Group’s risk department was boosted with officers with IT security skills to monitor the activities of the first line of defense by performing risk assurance reviews, monitoring all user activity on key systems in order to timely detect any irregularity and advise adequate response.
7 A. Classification of financial assets and financial liabilities
The Group’s accounting policies on the classification of financial instruments under IFRS 9 are indicated below. The application of these policies resulted in the classifications set out in the table above and explained below.
a) Certain loans and advances to customers held by the Group’s investment business are classified under IFRS 9 as mandatorily measured at FVTPL because they are held within a business model in which they are managed and their performance is evaluated on a fair value basis. Internal reporting and performance measurement of these loans and advances are on a fair value basis.
b) The investment securities are measured at FVTPL because the contractual cash flows of these securities are not SPPI on the principal outstanding.
c) Certain debt securities are held by the Group Central Treasury in a separate portfolio for long-term yield. These securities may be sold, but such sales are not expected to be more than infrequent. The Group considers that these securities are held within a business model whose objective is to hold assets to collect the contractual cash flows. These assets are classified as measured at amortised cost under IFRS 9.
d) Certain debt securities are held by the Group Central Treasury in separate portfolios to meet everyday liquidity needs. The Group Central Treasury seeks to minimise the costs of managing these liquidity needs and therefore actively manages the return on the portfolio. That return consists of collecting contractual payments as well as gains and losses from the sale of financial assets. The investment strategy often results in sales activity that is significant in value. The Group considers that under IFRS 9 these securities are held within a business model whose objective is achieved by both collecting contractual cash flows and selling financial assets.
e) Certain non-trading debt securities are held by the Group Central Treasury in separate portfolios and are managed with an objective of realising cash flows through sale. The Group primarily focuses on fair value information and uses that information to assess the securities’ performance and to make decisions. In addition, certain asset-backed securities have contractual cash flows that are not SPPI. These assets are therefore measured at FVTPL under IFRS 9.
f) Certain equity investments held by the Group for strategic purposes have been designated under IFRS 9 as at FVOCI.
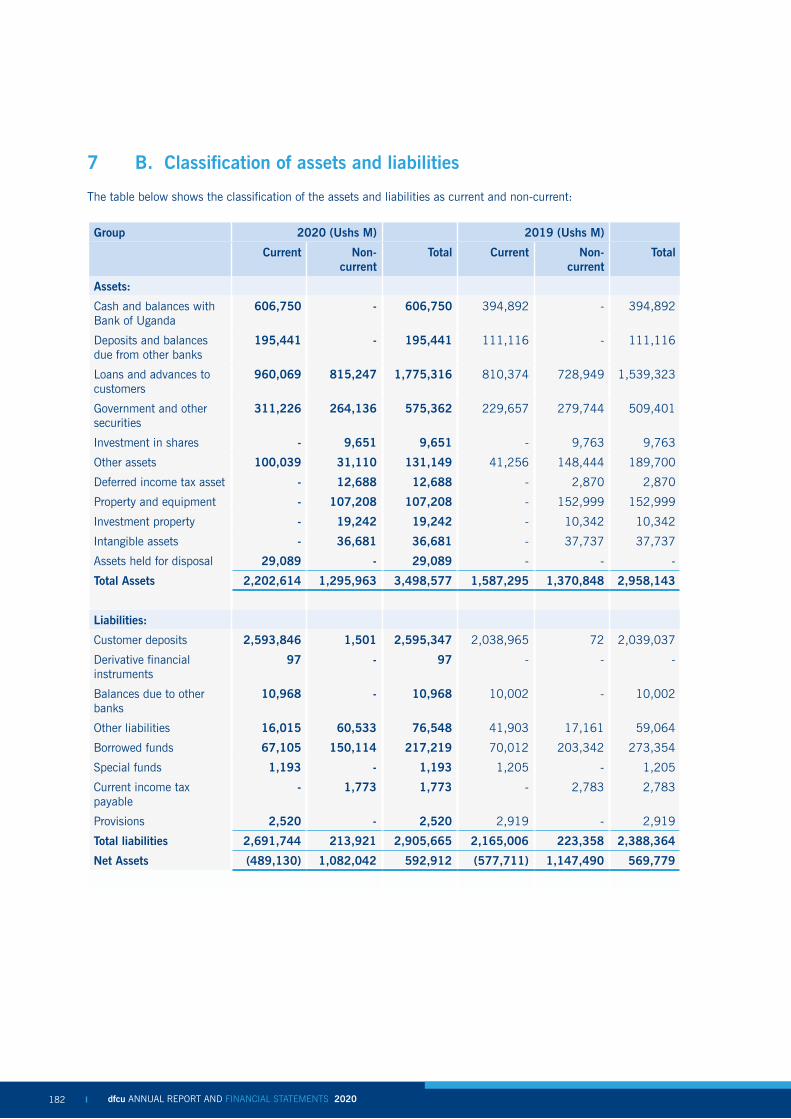
dfcu ANNUAL REPORT AND FINANCIAL STATEMENTS 2020 dfcu ANNUAL REPORT AND FINANCIAL STATEMENTS 2020 183182
7 B. Classification of assets and liabilities
The table below shows the classification of the assets and liabilities as current and non-current:
Group 2020 (Ushs M) 2019 (Ushs M)
Current Non-current
Total Current Non-current
Total
Assets:
Cash and balances with Bank of Uganda
606,750 - 606,750 394,892 - 394,892
Deposits and balances due from other banks
195,441 - 195,441 111,116 - 111,116
Loans and advances to customers
960,069 815,247 1,775,316 810,374 728,949 1,539,323
Government and other securities
311,226 264,136 575,362 229,657 279,744 509,401
Investment in shares - 9,651 9,651 - 9,763 9,763
Other assets 100,039 31,110 131,149 41,256 148,444 189,700
Deferred income tax asset - 12,688 12,688 - 2,870 2,870
Property and equipment - 107,208 107,208 - 152,999 152,999
Investment property - 19,242 19,242 - 10,342 10,342
Intangible assets - 36,681 36,681 - 37,737 37,737
Assets held for disposal 29,089 - 29,089 - - -
Total Assets 2,202,614 1,295,963 3,498,577 1,587,295 1,370,848 2,958,143
Liabilities:
Customer deposits 2,593,846 1,501 2,595,347 2,038,965 72 2,039,037
Derivative financial instruments
97 - 97 - - -
Balances due to other banks
10,968 - 10,968 10,002 - 10,002
Other liabilities 16,015 60,533 76,548 41,903 17,161 59,064
Borrowed funds 67,105 150,114 217,219 70,012 203,342 273,354
Special funds 1,193 - 1,193 1,205 - 1,205
Current income tax payable
- 1,773 1,773 - 2,783 2,783
Provisions 2,520 - 2,520 2,919 - 2,919
Total liabilities 2,691,744 213,921 2,905,665 2,165,006 223,358 2,388,364
Net Assets (489,130) 1,082,042 592,912 (577,711) 1,147,490 569,779

dfcu ANNUAL REPORT AND FINANCIAL STATEMENTS 2020 dfcu ANNUAL REPORT AND FINANCIAL STATEMENTS 2020 183182
Company 2020 (Ushs M) 2019 (Ushs M)
Current Non-current
Total Current Non-current
Total
Assets:
Other assets 17 - 17 17 - 17
Investment in subsidiaries - 203,293 203,293 - 203,293 203,293
Amounts due from Group companies
197 - 197 1,714 - 1,714
Current Income tax recoverable
949 - 949 1,519 - 1,519
Deferred income tax asset - 1,164 1,164 - - -
Investment property - 43,605 43,605 - 46,337 46,337
Total Assets 1,163 248,062 249,225 3,250 249,630 252,880
Liabilities:
Other liabilities 2,724 925 3,649 3,392 5,175 8,567
Amounts due to Group companies
1,665 14,267 15,932 1,665 12,587 14,252
Borrowed funds - 4,502 4,502 - 4,446 4,446
Deferred income tax liability
- - - - 233 233
Total Liabilities 4,389 19,694 24,083 5,057 22,441 27,498
Net Assets (3,226) 228,368 225,142 (1,807) 227,189 225,382
7 B. Classification of assets and liabilities (continued)
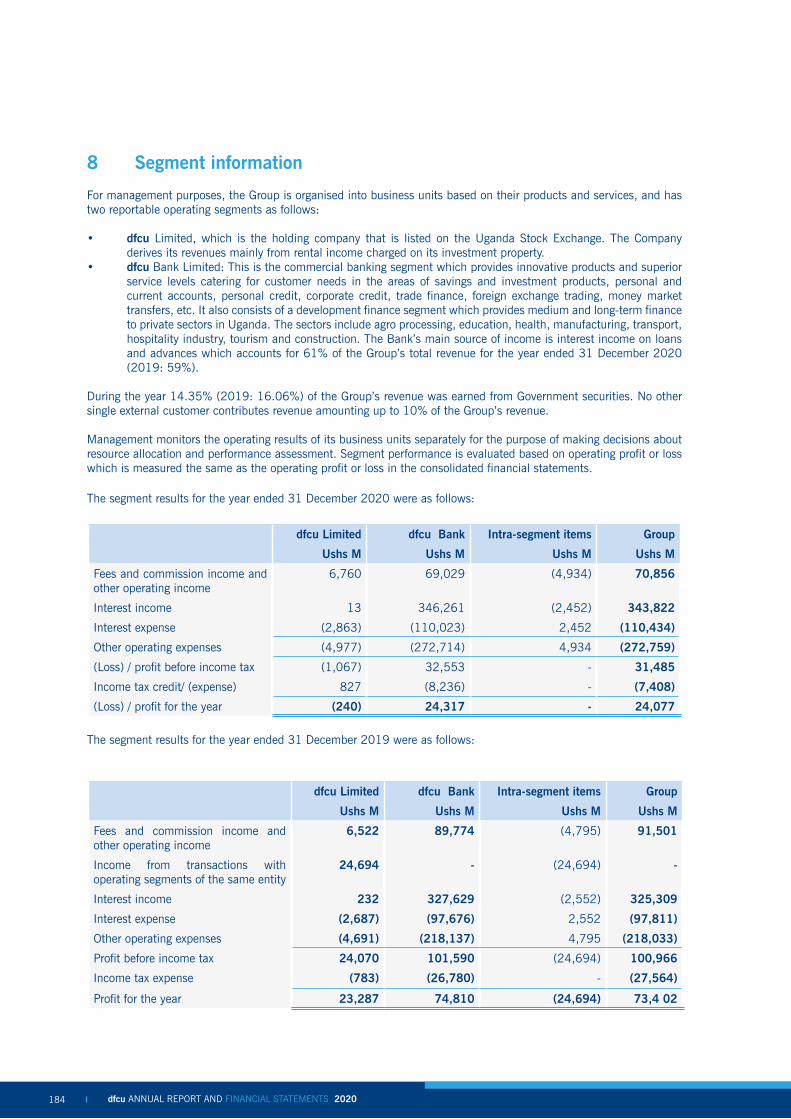
dfcu ANNUAL REPORT AND FINANCIAL STATEMENTS 2020 dfcu ANNUAL REPORT AND FINANCIAL STATEMENTS 2020 185184
8 Segment information
For management purposes, the Group is organised into business units based on their products and services, and has two reportable operating segments as follows:
• dfcu Limited, which is the holding company that is listed on the Uganda Stock Exchange. The Company derives its revenues mainly from rental income charged on its investment property.
• dfcu Bank Limited: This is the commercial banking segment which provides innovative products and superior service levels catering for customer needs in the areas of savings and investment products, personal and current accounts, personal credit, corporate credit, trade finance, foreign exchange trading, money market transfers, etc. It also consists of a development finance segment which provides medium and long-term finance to private sectors in Uganda. The sectors include agro processing, education, health, manufacturing, transport, hospitality industry, tourism and construction. The Bank’s main source of income is interest income on loans and advances which accounts for 61% of the Group’s total revenue for the year ended 31 December 2020 (2019: 59%).
During the year 14.35% (2019: 16.06%) of the Group’s revenue was earned from Government securities. No other single external customer contributes revenue amounting up to 10% of the Group’s revenue.
Management monitors the operating results of its business units separately for the purpose of making decisions about resource allocation and performance assessment. Segment performance is evaluated based on operating profit or loss which is measured the same as the operating profit or loss in the consolidated financial statements.
The segment results for the year ended 31 December 2020 were as follows:
dfcu Limited dfcu Bank Intra-segment items Group
Ushs M Ushs M Ushs M Ushs M
Fees and commission income and other operating income
6,760 69,029 (4,934) 70,856
Interest income 13 346,261 (2,452) 343,822
Interest expense (2,863) (110,023) 2,452 (110,434)
Other operating expenses (4,977) (272,714) 4,934 (272,759)
(Loss) / profit before income tax (1,067) 32,553 - 31,485
Income tax credit/ (expense) 827 (8,236) - (7,408)
(Loss) / profit for the year (240) 24,317 - 24,077
The segment results for the year ended 31 December 2019 were as follows:
dfcu Limited dfcu Bank Intra-segment items Group
Ushs M Ushs M Ushs M Ushs M
Fees and commission income and other operating income
6,522 89,774 (4,795) 91,501
Income from transactions with operating segments of the same entity
24,694 - (24,694) -
Interest income 232 327,629 (2,552) 325,309
Interest expense (2,687) (97,676) 2,552 (97,811)
Other operating expenses (4,691) (218,137) 4,795 (218,033)
Profit before income tax 24,070 101,590 (24,694) 100,966
Income tax expense (783) (26,780) - (27,564)
Profit for the year 23,287 74,810 (24,694) 73,4 02

dfcu ANNUAL REPORT AND FINANCIAL STATEMENTS 2020 dfcu ANNUAL REPORT AND FINANCIAL STATEMENTS 2020 185184
8 Segment information (Continued)
At 31 December 2020 dfcu Limited dfcu Bank Intra-
segment items
Group
Ushs M Ushs M Ushs M Ushs M
Total assets 249,225 3,539,365 (290,013) 3,498,577
Total liabilities 24,047 2,967,546 (85,928) 2,905,665
Capital expenditure 360 31,343 - 31,703
At 31 December 2019
Total assets 252,880 2,971,987 (266,724) 2,958,143
Total liabilities 27,498 2,423,541 (62,675) 2,388,364
Capital expenditure 877 22,978 - 23,855
The Group’s operations are all attributed to Uganda, the Company’s country of domicile.
The table below indicates the Group’s interest income for each group of similar products:
dfcu Limited dfcu Bank Group
Ushs M Ushs M Ushs M
Year ended 31 December 2020 13 346,261 343,822
Year ended 31 December 2019 232 327,629 325,309

dfcu ANNUAL REPORT AND FINANCIAL STATEMENTS 2020 dfcu ANNUAL REPORT AND FINANCIAL STATEMENTS 2020 187186
9 Interest and similar income
Group Company
2020 2019 2020 2019
Ushs M Ushs M Ushs M Ushs M
(a) Interest calculated using the effective interest method
Loans and advances 254,210 244,853 - -
Placements and investments with other banks 21,461 6,886 13 232
Government and other securities 59,516 66,931 - -
335,187 318,670 13 232
(b) Other interest and similar income
Interest income on finance leases 8,635 6,639 - -
Total interest income 343,822 325,309 13 232
10 Interest and similar expenses
Group Company
2020 2019 2020 2019
Ushs M Ushs M Ushs M Ushs M
Borrowed funds 14,437 21,805 2,863 2,687
Customer deposits 89,579 76,006 - -
Interest expense on lease liability 6,418 7,404 - -
110,434 105,215 2,863 2,687
11 Net trading and other income
Group Company
2020 2019 2020 2019
Ushs M Ushs M Ushs M Ushs M
Net unrealised foreign exchange gain/(loss) 601 139 11 (48)
Fixed trading income 16,913 14,530 - -
Rental income 1,786 1,622 6,224 5,956
Other income 297 117 - -
19,597 16,408 6,235 5,908
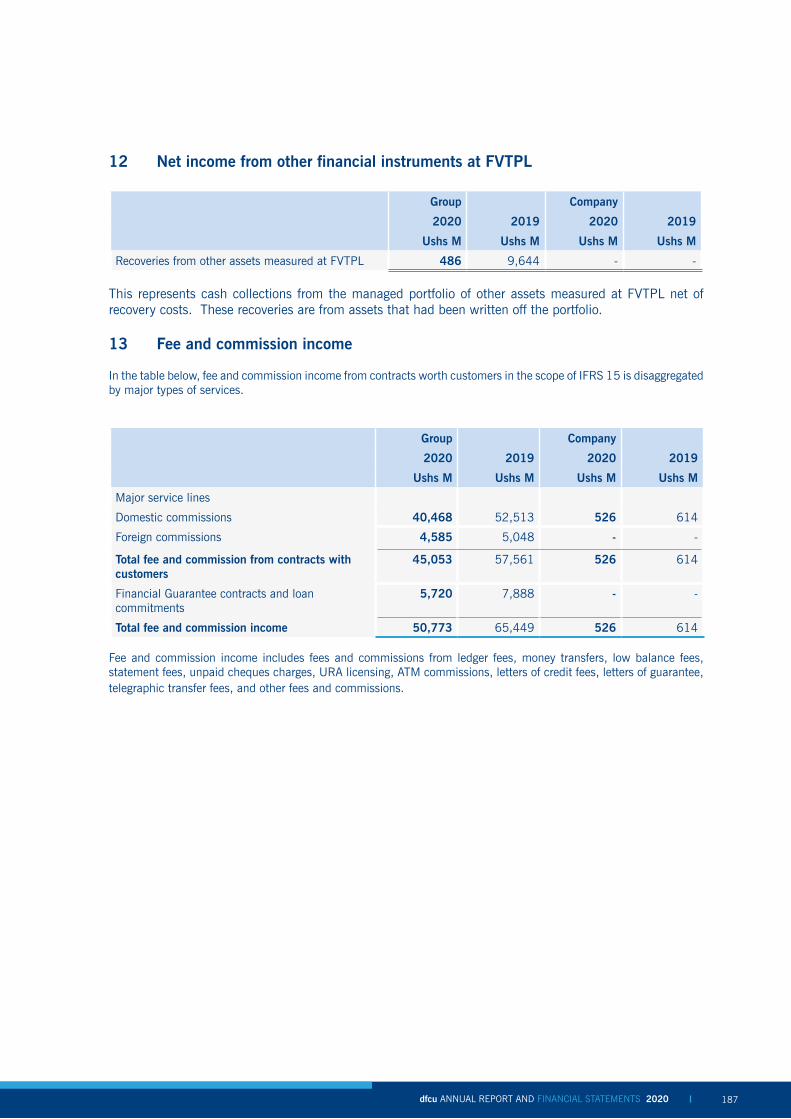
dfcu ANNUAL REPORT AND FINANCIAL STATEMENTS 2020 dfcu ANNUAL REPORT AND FINANCIAL STATEMENTS 2020 187186
12 Net income from other financial instruments at FVTPL
Group Company
2020 2019 2020 2019
Ushs M Ushs M Ushs M Ushs M
Recoveries from other assets measured at FVTPL 486 9,644 - -
This represents cash collections from the managed portfolio of other assets measured at FVTPL net of recovery costs. These recoveries are from assets that had been written off the portfolio.
13 Fee and commission income
In the table below, fee and commission income from contracts worth customers in the scope of IFRS 15 is disaggregated by major types of services.
Group Company
2020 2019 2020 2019
Ushs M Ushs M Ushs M Ushs M
Major service lines
Domestic commissions 40,468 52,513 526 614
Foreign commissions 4,585 5,048 - -
Total fee and commission from contracts with customers
45,053 57,561 526 614
Financial Guarantee contracts and loan commitments
5,720 7,888 - -
Total fee and commission income 50,773 65,449 526 614
Fee and commission income includes fees and commissions from ledger fees, money transfers, low balance fees, statement fees, unpaid cheques charges, URA licensing, ATM commissions, letters of credit fees, letters of guarantee, telegraphic transfer fees, and other fees and commissions.

dfcu ANNUAL REPORT AND FINANCIAL STATEMENTS 2020 dfcu ANNUAL REPORT AND FINANCIAL STATEMENTS 2020 189188
13
N
et fee
and
com
mis
sion
inco
me
(con
tinue
d)
Perf
orm
ance
obl
igat
ions
and
rev
enue
rec
ogni
tion
polic
ies
Fee
and
com
mis
sion
inco
me
from
con
trac
ts w
ith c
usto
mer
s is
mea
sure
d ba
sed
on t
he c
onsi
dera
tion
spec
ified
in a
con
trac
t w
ith a
cus
tom
er.
The
Gro
up r
ecog
nise
s re
venu
e w
hen
it tr
ansf
ers
cont
rol o
ver
a se
rvic
e to
a c
usto
mer
.
The
follo
win
g ta
ble
prov
ides
info
rmat
ion
abou
t the
nat
ure
and
timin
g of
the
satis
fact
ion
of p
erfo
rman
ce o
blig
atio
ns in
con
trac
ts w
ith c
usto
mer
s, in
clud
ing
sign
ifica
nt p
aym
ent
term
s, a
nd t
he r
elat
ed r
even
ue r
ecog
nitio
n po
licie
s.
Type
of se
rvic
eN
atur
e an
d tim
ing
of s
atis
fact
ion
of p
erfo
rman
ce
oblig
atio
ns,
incl
udin
g si
gnifi
cant
pay
men
t te
rms
2020
Rev
enue
rec
ogni
tion
unde
r IF
RS
15
Cat
egor
y A
Thes
e ar
e tr
ansa
ctio
nal f
ees
base
d on
rev
enue
th
at m
ainl
y co
mpr
ise
of b
ut n
ot li
mite
d to
co
mm
issi
ons
on c
hequ
es c
ashe
d, s
tate
men
t ch
arge
s, a
uxili
ary
char
ges,
man
agem
ent
fees
, pa
ymen
ts a
nd c
olle
ctio
n re
late
d fe
es.
•
Enfo
rcea
ble
arra
ngem
ent
with
cus
tom
er e
xist
s.•
Pe
rfor
man
ce o
blig
atio
n (P
O)
– th
e G
roup
pro
vide
s ac
coun
t tr
ansa
ctio
n se
rvic
es•
Tr
ansa
ctio
n pr
ice
– m
onth
ly fe
es in
line
with
the
con
trac
tual
agr
eem
ent.
•
Allo
catio
n of
pric
e to
PO
– s
ingl
e pe
rfor
man
ce o
blig
atio
n, n
o al
loca
tion
nece
ssar
y.•
PO
sat
isfie
d –
Rev
enue
is c
urre
ntly
rec
ogni
sed
at t
he e
nd o
f the
mon
th, fo
r th
e se
rvic
es p
rovi
ded
durin
g th
at m
onth
(op
erat
iona
l effi
cien
cy).
Cat
egor
y B
Ann
ual R
evie
w C
harg
e -
It’s
an a
nnua
l fee
cha
rged
ba
sing
on
the
loan
s he
ld in
the
yea
r. Th
is r
even
ue is
rec
ogni
sed
annu
ally
on
usua
lly
DIB
loan
s.
•
Enfo
rcea
ble
arra
ngem
ent
with
cus
tom
er e
xist
s.•
Pe
rfor
man
ce o
blig
atio
n (P
O)
– th
e G
roup
pro
vide
s lo
an r
evie
w s
ervi
ces.
•
Tr
ansa
ctio
n pr
ice
– co
mm
issi
on r
ecei
ved
as p
er a
gree
men
t w
ith t
he in
sure
r. •
Allo
catio
n of
pric
e to
PO
– s
ingl
e pe
rfor
man
ce o
blig
atio
n •
PO
sat
isfie
d –
at a
poi
nt in
tim
e in
the
yea
r w
hen
the
loan
rev
iew
has
bee
n pe
rfor
med
. •
R
even
ue s
houl
d be
spr
ead
over
the
per
iod
as s
ervi
ces
are
prov
ided
bef
ore
the
next
pa
ymen
t.
Cat
egor
y C
Thes
e ar
e fe
es c
harg
ed o
n ca
rd r
elat
ed
tran
sact
ion.
Thes
e co
mpr
ise
of A
TM c
omm
issi
ons,
Exp
ress
M
oney
com
mis
sion
, Vi
sa C
omm
issi
ons,
M
oney
Gra
m c
omm
issi
ons
and
issu
ance
fee
of
debi
t ca
rds.
It’
s a
stan
dard
fee
•
Enfo
rcea
ble
arra
ngem
ent
with
cus
tom
er e
xist
s.•
Pe
rfor
man
ce o
blig
atio
n (P
O)
– th
e G
roup
pro
vide
s ca
rd s
ervi
ces
at s
peci
fic p
oint
s of
tim
e an
d ov
er t
ime.
•
Tran
sact
ion
pric
e –
fee
char
ged
in t
erm
s of
the
arr
ange
men
t w
ith c
usto
mer
at
poin
t of
tra
nsac
tion.
•
Allo
catio
n of
pric
e to
PO
– s
ingl
e pe
rfor
man
ce o
blig
atio
n fo
r ea
ch o
f the
ser
vice
s, n
o al
loca
tion
nece
ssar
y.•
PO
sat
isfie
d –
Rev
enue
is c
urre
ntly
rec
ogni
sed
at a
poi
nt in
tim
e, a
fter
the
tr
ansa
ctio
n is
pro
cess
ed.

dfcu ANNUAL REPORT AND FINANCIAL STATEMENTS 2020 dfcu ANNUAL REPORT AND FINANCIAL STATEMENTS 2020 189188
Type
of se
rvic
eN
atur
e an
d tim
ing
of s
atis
fact
ion
of p
erfo
rman
ce
oblig
atio
ns,
incl
udin
g si
gnifi
cant
pay
men
t te
rms
2020
Rev
enue
rec
ogni
tion
unde
r IF
RS
15
Cat
egor
y D
Gua
rant
ees
and
com
mitm
ent
fees
This
is
a tr
ansa
ctio
nal
base
d fe
e on
gua
rant
ees
issu
ed.
Tim
ing
of r
even
ue f
or g
uara
ntee
s- Q
uart
erly
fee
co
llect
ion/
rec
ogni
tion
or u
pfro
nt f
ees
depe
ndin
g on
con
trac
t w
ith c
lient
. M
ost
CB
cus
tom
ers
pay
quar
terly
whi
le D
IB c
usto
mer
s ar
e la
rgel
y up
fron
t fe
es fo
r en
tire
teno
r of
faci
lity.
Te
rm /
teno
r of
Gua
rant
ees
rang
e from
1-5
yea
rs
•
Enfo
rcea
ble
arra
ngem
ent
with
cus
tom
er e
xist
s.
•
Perf
orm
ance
obl
igat
ion
(PO
) –
the
Gro
up p
rovi
des
guar
ante
es, cu
stod
y fe
es a
nd
com
mitm
ent
fees
•
Tran
sact
ion
pric
e –
fee
char
ged
in t
erm
s of
the
arr
ange
men
t w
ith c
usto
mer
•
Allo
catio
n of
pric
e to
PO
– E
ach
serv
ice
is a
sin
gle
perf
orm
ance
obl
igat
ion,
no
allo
catio
n ne
cess
ary.
PO
sat
isfie
d
•
Com
mitm
ent
fees
- R
even
ue c
urre
ntly
rec
ogni
sed
upfr
ont
•
Perf
orm
ance
gua
rant
ees-
Rev
enue
cur
rent
ly r
ecog
nise
d up
fron
t•
C
omm
itmen
t an
d G
uara
ntee
fees
-The
per
form
ance
obl
igat
ion
is s
atis
fied
over
the
ter
m o
f th
e gu
aran
tee,
thu
s re
venu
e sh
ould
be
defe
rred
ove
r th
e te
rm o
f the
gua
rant
ee•
W
here
dra
wdo
wn
of t
he fa
cilit
y is
not
pro
babl
e, fe
es s
houl
d be
def
erre
d ov
er t
he t
erm
of
the
agr
eem
ent,
on
a st
raig
ht-li
ne b
asis
and
rec
ogni
sed
in N
IR. W
here
dra
wdo
wn
is
prob
able
, fe
es s
houl
d be
def
erre
d an
d as
par
t of
the
EIR
and
rec
ogni
sed
in N
II
The
Gro
up r
ecog
nise
s th
e fe
e an
d co
mm
issi
ons
upfr
ont
beca
use
the
diffe
renc
e as
a r
esul
t of
de
ferr
ing
is im
mat
eria
l.
Cat
egor
y E
Thes
e ar
e fe
es
char
ged
on
elec
tron
ic
bank
ing
tran
sact
ions
like
Mon
ey T
rans
fers
, Fo
reig
n bi
lls,
Fx
sund
ries,
Tel
ex T
rans
fers
•
Enfo
rcea
ble
arra
ngem
ent
with
cus
tom
er e
xist
s.•
Pe
rfor
man
ce o
blig
atio
n (P
O)
– th
e G
roup
pro
vide
s a
serv
ice
(as
note
d al
ongs
ide,
for
elec
tron
ic b
anki
ng t
rans
actio
ns).
•
Tran
sact
ion
pric
e –
tran
sact
ion
base
d fe
es.
•
Allo
catio
n of
pric
e to
PO
– s
ingl
e pe
rfor
man
ce o
blig
atio
n (f
or e
ach
of t
he s
ervi
ce fe
es
liste
d),
no a
lloca
tion
nece
ssar
y.•
PO
sat
isfie
d –
Rev
enue
is c
urre
ntly
rec
ogni
sed
at a
poi
nt in
tim
e, a
fter
the
tra
nsac
tion
is
proc
esse
d.
Cat
egor
y F
It’s
a tr
ansa
ctio
nal b
ased
fee
on
Inco
min
g TT
s an
d LC
s de
pend
ing
on t
he t
rans
actio
n am
ount
with
a
capp
ed m
axim
um a
mou
ntLe
tter
s of
cre
dit
are
usua
lly le
ss t
han
one
year
•
Enfo
rcea
ble
arra
ngem
ent
with
cus
tom
er e
xist
s.•
Pe
rfor
man
ce o
blig
atio
n (P
O)
– G
roup
to
prov
ide
a se
rvic
e, p
rovi
de in
ter
acco
unt
tran
sfer
s th
at a
re d
one
by c
usto
mer
s an
d LC
s•
Tr
ansa
ctio
n pr
ice
– fe
e is
cha
rged
per
tra
nsac
tion
and
LCs
depe
ndin
g on
the
tra
nsac
tion
amou
nt w
ith a
cap
ped
max
imum
am
ount
•
Allo
catio
n of
pric
e to
PO
– s
ingl
e pe
rfor
man
ce o
blig
atio
n, n
o al
loca
tion
nece
ssar
y.

dfcu ANNUAL REPORT AND FINANCIAL STATEMENTS 2020 dfcu ANNUAL REPORT AND FINANCIAL STATEMENTS 2020 191190
Type
of se
rvic
eN
atur
e an
d tim
ing
of s
atis
fact
ion
of
perf
orm
ance
obl
igat
ions
, in
clud
ing
sign
ifica
nt p
aym
ent
term
s 2020
Rev
enue
rec
ogni
tion
unde
r IF
RS
15
PO
sat
isfie
d
•
TT’s
- R
even
ue r
ecog
nise
d at
a p
oint
in t
ime,
whe
n se
rvic
e ha
s be
en p
rovi
ded
•
Lett
ers
of c
redi
t-The
per
form
ance
obl
igat
ion
is s
atis
fied
over
the
ter
m o
f the
LC
, th
us r
even
ue s
houl
d be
def
erre
d ov
er t
he t
erm
of t
he lo
an•
Fe
es a
re c
urre
ntly
rec
ogni
sed
upfr
ont.
Bus
ines
s to
mon
itor
and
reas
sess
ac
coun
ting
trea
tmen
t w
hen
amou
nts
beco
me
mat
eria
l•
W
here
dra
wdo
wn
of t
he fa
cilit
y is
not
pro
babl
e, fe
es s
houl
d be
def
erre
d ov
er t
he
term
of t
he a
gree
men
t, o
n a
stra
ight
-line
bas
is a
nd r
ecog
nise
d in
NIR
. W
here
dr
awdo
wn
is p
roba
ble,
fees
sho
uld
be d
efer
red
and
as p
art
of t
he E
IR a
nd
reco
gnis
ed in
NII
The
Gro
up r
ecog
nise
s th
e fe
e an
d co
mm
issi
ons
upfr
ont b
ecau
se th
e di
ffere
nce
as a
res
ult
of d
efer
ring
is im
mat
eria
l.
Cat
egor
y G
Sund
ries
(BO
U C
hqs,
S/O
, U
RA,
Mgt
fee
s)
KCC
A C
omm
issi
onU
RA
Lic
enci
ng
•
Enfo
rcea
ble
arra
ngem
ent
with
cus
tom
er e
xist
s.•
Pe
rfor
man
ce o
blig
atio
n (P
O)
– G
roup
to
prov
ide
a se
rvic
e (a
s no
ted
alon
gsid
e, fo
r el
ectr
onic
ban
king
tra
nsac
tions
).•
Tr
ansa
ctio
n pr
ice
– tr
ansa
ctio
n ba
sed
fees
.•
Allo
catio
n of
pric
e to
PO
– s
ingl
e pe
rfor
man
ce o
blig
atio
n (f
or e
ach
of t
he s
ervi
ce
fees
list
ed),
no
allo
catio
n ne
cess
ary.
•
PO
sat
isfie
d –
Rev
enue
is c
urre
ntly
rec
ogni
sed
at a
poi
nt in
tim
e, a
fter
the
tr
ansa
ctio
n is
pro
cess
ed.

dfcu ANNUAL REPORT AND FINANCIAL STATEMENTS 2020 dfcu ANNUAL REPORT AND FINANCIAL STATEMENTS 2020 191190
14 Operating expenses
Group Company
2020 2019 2020 2019
Ushs M Ushs M Ushs M Ushs M
Employee benefits expenses (note 15) 60,938 59,422 774 718
Depreciation of property and equipment (note 28) 22,069 21,748 - -
Depreciation of the investment property (note 27) 276 416 2,667 2,631
Amortisation of intangible assets (note 29) 13,700 13,891 - -
Auditor’s remuneration 758 910 121 99
Occupancy expenses 12,057 12,857 - -
Professional and consultancy fees 6,071 7,159 177 179
Communication costs 25,979 26,050 29 27
Transport and travel costs 1,756 2,773 15 27
Advertising and publicity costs 3,482 3,560 2 26
Amortisation of deferred consideration - 17,518 - -
Impairment loss on rescinded properties (note 28(b))
15,283 - - -
Other administrative expenses 29,270 19,446 1,193 984
191,639 185,750 4,978 4,691
15 Employee benefits expenses
Group Company
2020 2019 2020 2019
Ushs M Ushs M Ushs M Ushs M
The following are included in employee benefits expenses:
Wages and salaries 53,258 52,014 664 616
Retirement benefit costs 2,379 2,250 43 40
National Social Security Fund contributions 5,301 5,158 67 62
60,938 59,422 774 718
The average number of employees of the group during the year was 1,034 (2019: 1,078)
16 Profit before tax
The following items have been charged in arriving at the profit before tax:
Group Company
2020 2019 2020 2019
Ushs M Ushs M Ushs M Ushs M
Employee benefits expenses (note 15) 60,938 59,422 774 718
Depreciation of property and equipment (note 28) 22,069 21,748 - -
Depreciation of investment property (note 27) 276 416 2,667 2,631
Amortisation of intangible assets (note 29) 13,700 13,891 - -
Impairment loss on rescinded properties (note 14) 15,283 - - -
Directors remuneration (note 46) 2,060 1,454 557 461

dfcu ANNUAL REPORT AND FINANCIAL STATEMENTS 2020 dfcu ANNUAL REPORT AND FINANCIAL STATEMENTS 2020 193192
17 Dividends
In 2019, the Central Bank instructed all supervised financial institutions to defer all discretionary contributions including dividends unless it explicitly authorised issuance of the same and the instruction remains in force. This instruction applies to dfcu Bank which is a subsidiary of dfcu Limited. Owing to the severity of the impact of the COVID-19 pandemic and taking into consideration the need to preserve the strength of the Company, the directors propose payment of dividend of Shs 13,000 million (2019: Nil) or Shs 17.38 per share less withholding tax be paid out for the year ended 31st December 2020 (2019: Nil). This is an adjustment from UGX 50.33 per share in the published financial statements of 30 March 2021.
18 Earnings per share - Group
Basic earnings per share is calculated by dividing the profit for the year attributable to shareholders by the weighted average number of ordinary shares in issue during the year.
2020 2019
Net profit attributable to equity holders of the Company (Ushs M) 24,077 73,402
Weighted average number of ordinary shares in issue 748,144,033 748,144,033
Basic earnings per share (Ushs) 32.18 98.11
Diluted earnings per share (Ushs) 32.18 98.11
Profit attributable to ordinary shareholders
2020 2019
Net profit attributable to equity holders of the Company (Ushs M) 24,077 73,402
There were no potentially dilutive shares outstanding at 31 December 2020 and 2019.
19 Income tax
a) Income tax expenseGroup Company
2020 2019 2020 2019
Ushs M Ushs M Ushs M Ushs M
Current income tax 15,783 28,028 570 -
Prior year over provision of corporation tax 1,184 - - -
Deferred income tax (credit) / charge (note 30) (9,559) (464) (1,397) 783
Income tax expense/(credit) 7,408 27,564 (827) 783
b) Amount recognised in OCI – Group2020
Ushs M
Before tax Tax(expense)/benefit
Net of tax
Movement on revaluation of FVOCI financial assets (1,237) 259 (978)
Movement in debt instrument at FVOCI 34 - 34
(1,203) 259 (945)
2019Ushs M
Before tax Tax(expense) Net of tax
/benefit
Movement on revaluation of FVOCI financial assets (660) 208 (452)
Movement in debt instrument at FVOCI (13) - (13)
(673) 208 (465)

dfcu ANNUAL REPORT AND FINANCIAL STATEMENTS 2020 dfcu ANNUAL REPORT AND FINANCIAL STATEMENTS 2020 193192
19 Income tax (continued)
c) Reconciliation of effective tax rate The tax on the Group’s and company’s profit before income tax differs from the theoretical amount that would arise using the basic tax rate of 30% as follows:
Group 2020 2019
Effective tax rate % Ushs M
Effective tax rate % Ushs M
Profit before income tax 31,485 100,966
Tax calculated at a tax rate of 30% (2019: 30%) 30.00 9,445 30.0 30,290
Prior year over provision of corporation tax (3.76) (1,184) - -
Tax effect of:
- Expenses not deductible for tax purposes1 8.90 2,801 2.76 2,788
- Income taxed at other rates2 (11.61) (3,654) (5.46) (5,514)
Income tax expense 23.53 7,408 27.30 27,564
1These include items like depreciation expenses in non-qualifying assets, donations, entertainment and unrealised loss on the transfer of non-qualifying assets.
2Interest income on government securities of Ushs 59,516 million (2019: Ushs 66,931 million) is subject to withholding tax, which is a final tax of 20% (2019: 20%) after making appropriate deductions. Further information on deferred income tax is presented in note 30.
Company 2020 2019
Effective tax rate%
Ushs M Effective tax rate %
Ushs M
Profit before income tax (1,067) 24,070
Tax calculated at a tax rate of 30% (2019: 30%)
30.00 (320) 30.00 7,221
Prior year over provision of corporation tax (1,239) - -
Tax effect of:
- Expenses not deductible for tax purposes 20.84 1,893 4.92 1,184
- Income taxed at other rates (8.75) (1,161) (31.67) (7,622)
Income tax expense/(credit) 29.59 (827) 3.25 783
Income taxed at other rates refers to rental income taxed separately from the other business income. Further information on deferred income tax is presented in note 30.
d) Current income tax payable/ (recoverable)
The movements in current tax payable are as follows:
Group Company
2020 2019 2020 2019
Ushs M Ushs M Ushs M Ushs M
At 1 January 2,783 (3) (1,519) (1,519)
Current income tax charge for the year 16,967 28,028 570 -
Income tax paid during year (17,977) (25,242) - -
At 31 December 1,773 2,783 (949) (1,519)

dfcu ANNUAL REPORT AND FINANCIAL STATEMENTS 2020 dfcu ANNUAL REPORT AND FINANCIAL STATEMENTS 2020 195194
20 Cash at hand and balances with Bank of Uganda - Group
2020 2019
Ushs M Ushs M
Cash in hand 152,139 135,050
Balances with Bank of Uganda 454,829 259,918
Expected Credit Loss adjustment (218) (76)
606,750 394,892
The fair value of cash and balances with Bank of Uganda approximates the carrying amount. As disclosed in note 45, the restricted cash balance (cash reserve requirement) with Bank of Uganda is Ushs 204,350 (2019: 158,300). The balance with Bank of Uganda was classified as high grade, under stage 1 as at 31 December 2020 and 2019. There were no transfers between stages for both years.
The movement in expected credit losses was as follows: 2020 2019
Ushs M Ushs M
At 1 January 76 -
Impairment recognized during the year: 142 76
At 31 December 218 76
21 Deposits and balances due from banks - Group
2020 2019
Ushs M Ushs M
Deposit auction with Bank of Uganda 100,087 -
Deposits with other banks 60,691 95,995
Placements with other banks 34,686 15,127
195,464 111,122
Expected Credit Loss adjustment (23) (6)
195,441 111,116
Deposits and balances due from other banks are short-term deposits made for varying periods of between one day and three months, depending on the immediate cash requirements of the Group, and earn interest at the respective short-term deposit rates. The weighted average effective interest rate on deposits and balances due from other banks was 7% (2019: 8%). The fair value of loans and advances to other banks approximates the carrying amount.
The deposits and balances due from other banks were classified as high grade, under stage 1 as at 31 December 2020 and 2019. There were no transfers between stages for both years.
The movement in expected credit losses was as follows: 2020 2019
Ushs M Ushs M
At 1 January 6 -
Impairment recognized during the year: 17 6
At 31 December 23 6
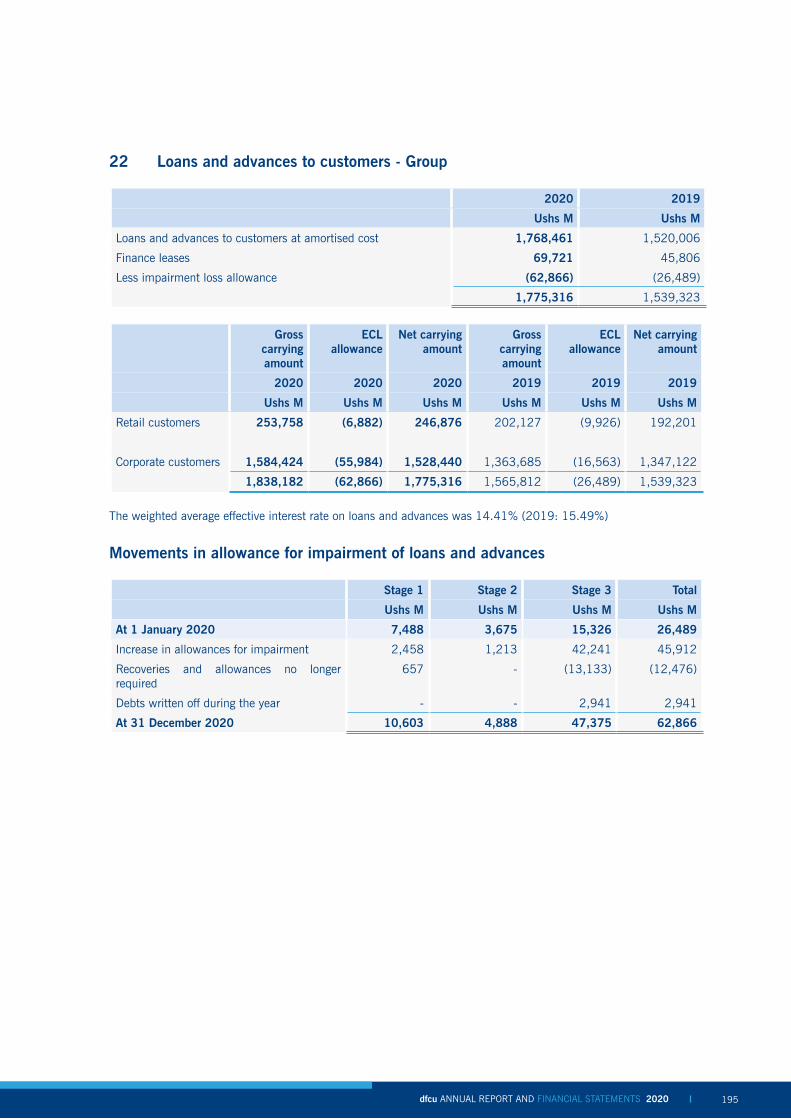
dfcu ANNUAL REPORT AND FINANCIAL STATEMENTS 2020 dfcu ANNUAL REPORT AND FINANCIAL STATEMENTS 2020 195194
22 Loans and advances to customers - Group
2020 2019
Ushs M Ushs M
Loans and advances to customers at amortised cost 1,768,461 1,520,006
Finance leases 69,721 45,806
Less impairment loss allowance (62,866) (26,489)
1,775,316 1,539,323
Gross carrying amount
ECL allowance
Net carrying amount
Gross carrying amount
ECL allowance
Net carrying amount
2020 2020 2020 2019 2019 2019
Ushs M Ushs M Ushs M Ushs M Ushs M Ushs M
Retail customers 253,758 (6,882) 246,876 202,127 (9,926) 192,201
Corporate customers 1,584,424 (55,984) 1,528,440 1,363,685 (16,563) 1,347,122
1,838,182 (62,866) 1,775,316 1,565,812 (26,489) 1,539,323
The weighted average effective interest rate on loans and advances was 14.41% (2019: 15.49%)
Movements in allowance for impairment of loans and advances
Stage 1 Stage 2 Stage 3 Total
Ushs M Ushs M Ushs M Ushs M
At 1 January 2020 7,488 3,675 15,326 26,489
Increase in allowances for impairment 2,458 1,213 42,241 45,912
Recoveries and allowances no longer required
657 - (13,133) (12,476)
Debts written off during the year - - 2,941 2,941
At 31 December 2020 10,603 4,888 47,375 62,866
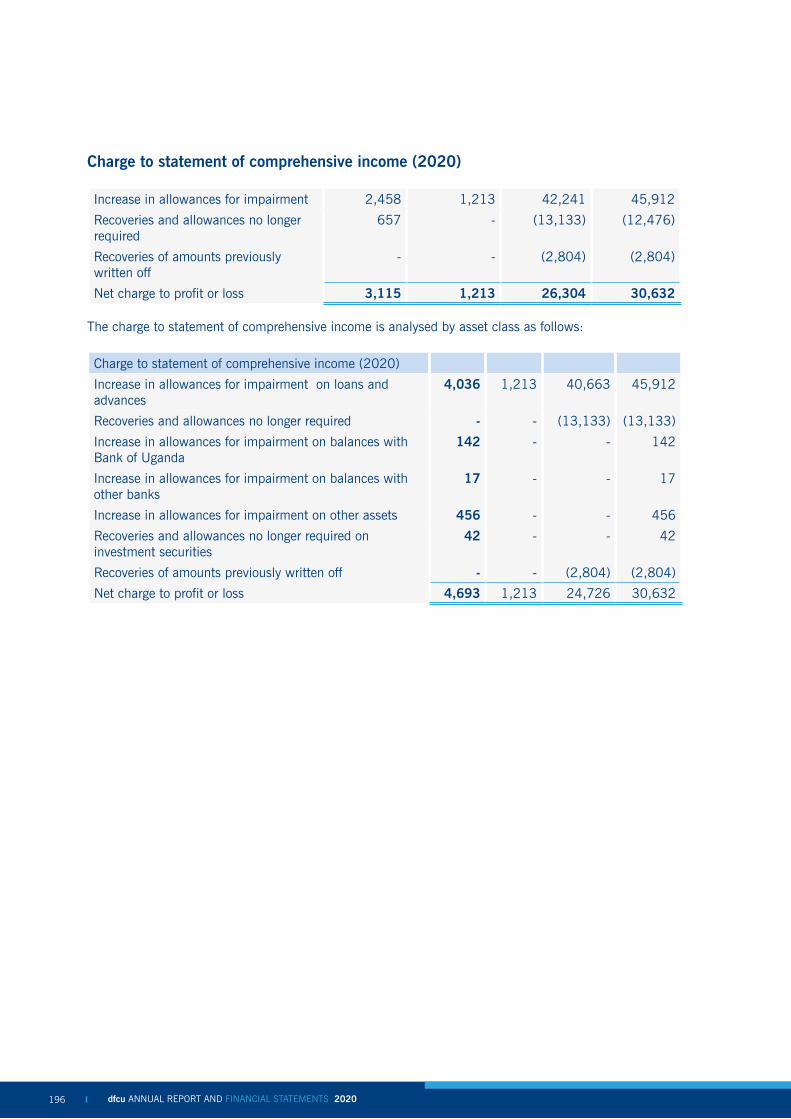
dfcu ANNUAL REPORT AND FINANCIAL STATEMENTS 2020 dfcu ANNUAL REPORT AND FINANCIAL STATEMENTS 2020 197196
Charge to statement of comprehensive income (2020)
Increase in allowances for impairment 2,458 1,213 42,241 45,912
Recoveries and allowances no longer required
657 - (13,133) (12,476)
Recoveries of amounts previously written off
- - (2,804) (2,804)
Net charge to profit or loss 3,115 1,213 26,304 30,632
The charge to statement of comprehensive income is analysed by asset class as follows:
Charge to statement of comprehensive income (2020)
Increase in allowances for impairment on loans and advances
4,036 1,213 40,663 45,912
Recoveries and allowances no longer required - - (13,133) (13,133)
Increase in allowances for impairment on balances with Bank of Uganda
142 - - 142
Increase in allowances for impairment on balances with other banks
17 - - 17
Increase in allowances for impairment on other assets 456 - - 456
Recoveries and allowances no longer required on investment securities
42 - - 42
Recoveries of amounts previously written off - - (2,804) (2,804)
Net charge to profit or loss 4,693 1,213 24,726 30,632

dfcu ANNUAL REPORT AND FINANCIAL STATEMENTS 2020 dfcu ANNUAL REPORT AND FINANCIAL STATEMENTS 2020 197196
22 Loans and advances to customers (continued)
Movements in allowance for impairment of loans and advances (continued)
Stage 1 Stage 2 Stage 3 Total
Ushs M Ushs M Ushs M Ushs M
At 1 January 2019 10,901 2,844 19,284 33,029
Increase in allowances for impairment - 831 35,763 36,594
Recoveries and allowances no longer required (3,413) - (7,221) (10,634)
Debts written off during the year - - (32,500) (32,500)
At 31 December 2019 7,488 3,675 15,326 26,489
Charge to statement of comprehensive income (2019)
Stage 1 Stage 2 Stage 3 Total
Ushs M Ushs M Ushs M Ushs M
Increase in allowances for impairment - 831 25,658 26,489
Recoveries and allowances no longer required (4,114) - (7,221) (11,335)
Recoveries of amounts previously written off - - (380) (380)
Net charge to profit or loss (4,114) 831 18,057 14,774
The charge to statement of comprehensive income is analysed by asset class as follows:
Charge to statement of comprehensive income (2019)
Stage 1 Stage 2 Stage 3 Total
Ushs M Ushs M Ushs M Ushs M
Increase in allowances for impairment on loans and advances
- 831 25,658 26,489
Recoveries and allowances no longer required on loans and advances
(3,413) - (7,221) (10,634)
Recoveries and allowances no longer required on other assets
(654) - - (654)
Recoveries and allowances no longer required on investment securities
(47) - - (47)
Recoveries of amounts previously written off - - (380) (380)
Net charge to profit or loss (4,114) 831 18,057 14,774
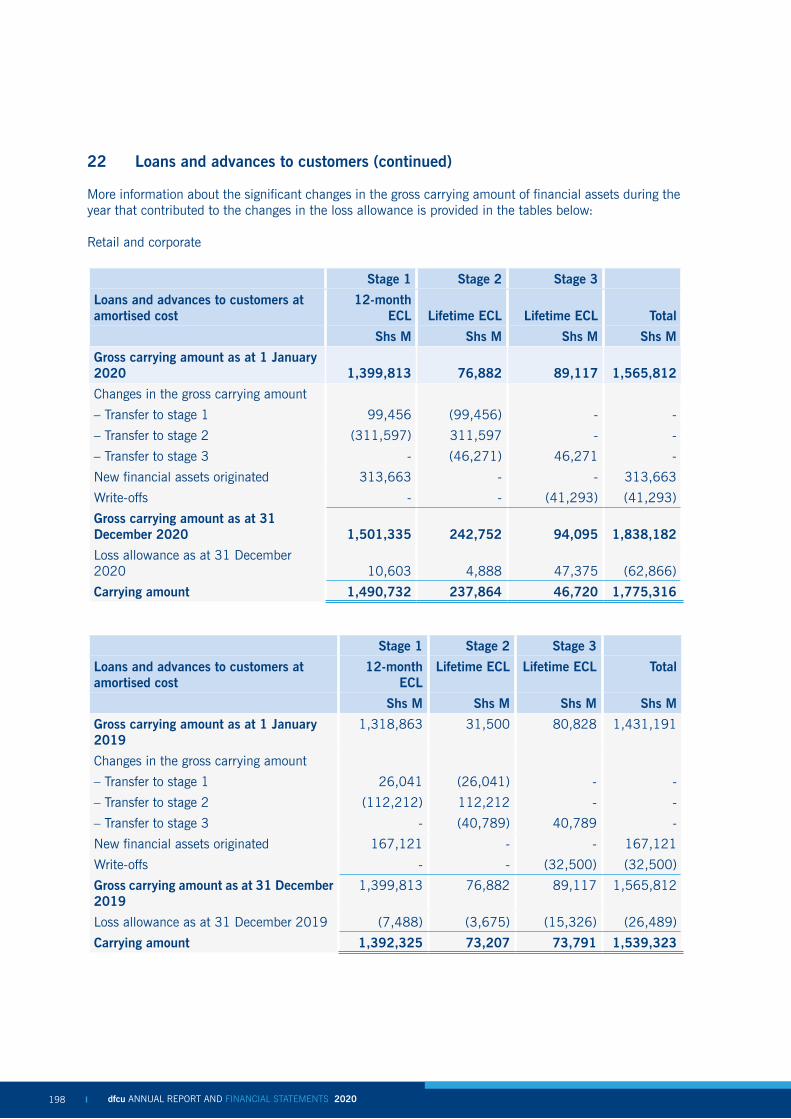
dfcu ANNUAL REPORT AND FINANCIAL STATEMENTS 2020 dfcu ANNUAL REPORT AND FINANCIAL STATEMENTS 2020 199198
22 Loans and advances to customers (continued)
More information about the significant changes in the gross carrying amount of financial assets during the year that contributed to the changes in the loss allowance is provided in the tables below:
Retail and corporate
Stage 1 Stage 2 Stage 3
Loans and advances to customers at amortised cost
12-month ECL Lifetime ECL Lifetime ECL Total
Shs M Shs M Shs M Shs M
Gross carrying amount as at 1 January 2020 1,399,813 76,882 89,117 1,565,812
Changes in the gross carrying amount
– Transfer to stage 1 99,456 (99,456) - -
– Transfer to stage 2 (311,597) 311,597 - -
– Transfer to stage 3 - (46,271) 46,271 -
New financial assets originated 313,663 - - 313,663
Write-offs - - (41,293) (41,293)
Gross carrying amount as at 31 December 2020 1,501,335 242,752 94,095 1,838,182
Loss allowance as at 31 December 2020 10,603 4,888 47,375 (62,866)
Carrying amount 1,490,732 237,864 46,720 1,775,316
Stage 1 Stage 2 Stage 3
Loans and advances to customers at amortised cost
12-month ECL
Lifetime ECL Lifetime ECL Total
Shs M Shs M Shs M Shs M
Gross carrying amount as at 1 January 2019
1,318,863 31,500 80,828 1,431,191
Changes in the gross carrying amount
– Transfer to stage 1 26,041 (26,041) - -
– Transfer to stage 2 (112,212) 112,212 - -
– Transfer to stage 3 - (40,789) 40,789 -
New financial assets originated 167,121 - - 167,121
Write-offs - - (32,500) (32,500)
Gross carrying amount as at 31 December 2019
1,399,813 76,882 89,117 1,565,812
Loss allowance as at 31 December 2019 (7,488) (3,675) (15,326) (26,489)
Carrying amount 1,392,325 73,207 73,791 1,539,323

dfcu ANNUAL REPORT AND FINANCIAL STATEMENTS 2020 dfcu ANNUAL REPORT AND FINANCIAL STATEMENTS 2020 199198
22 Loans and advances to customers (continued)
Loans and advances to customers include finance lease receivables, which may be analysed as follows:
2020 2019
Ushs M Ushs M
Gross investment in finance leases:
Not later than 1 year 45,967 27,220
Later than 1 year and not later than 5 years 45,638 24,587
Later than 5 years 3,064 638
94,669 52,445
Unearned future finance income on finance leases (8,635) (6,639)
Net investment in finance leases 86,034 45,806
The net investment in finance leases may be analysed as follows:
2020 2019
Ushs M Ushs M
Not later than 1 year 41,775 23,774
Later than 1 year and not later than 5 years 41,475 21,475
Later than 5 years 2,784 557
86,034 45,806
Included in the allowance for impairment of loans and advances as at 31 December 2020 is Ushs 184 million (2019: Ushs 2,552 million) attributable to impairment of finance lease receivables.
The carrying value of loans and advances to customers is approximately equal to its fair value.
23 Equity investments – Group
Equity investments at fair value through profit or loss: Ushs M Ushs M
New Vision Limited 113 122
Bank of Baroda (U) Limited 7,500 7,500
National Insurance Corporation 887 984
Kenya Commercial Bank Limited 13 19
8,513 8,625
Other equity investments:
Crane Financial Services 1,138 1,138
9,651 9,763

dfcu ANNUAL REPORT AND FINANCIAL STATEMENTS 2020 dfcu ANNUAL REPORT AND FINANCIAL STATEMENTS 2020 201200
23 Equity investments (continued)
All the equity investments at FVTPL are traded on the Uganda Securities Exchange (USE) except for Kenya Commercial Bank Limited shares which are traded in Nairobi Securities Exchange (NSE). The number of shares held at each reporting date is indicated below:
2020 2019
Number of shares Number of shares
New Vision Limited 359,693 359,693
Bank of Baroda (U) Limited 62,500,000 62,500,000
National Insurance Corporation 99,096,923 99,096,923
Kenya Commercial Bank Limited 10,000 10,000 The trading prices per share at the last date of trading for the years ended 31 December 2020 and 2019 were as follows:
2020 2019
Ushs Ushs
New Vision Limited 314 320
Bank of Baroda (U) Limited 120 120
National Insurance Corporation 9 10
Kenya Commercial Bank Limited 1,270 1,928
During the year, the Group did not purchase any additional shares. The changes in equity investments at FVTPL during the year were as follows:
2020 2019
Ushs M Ushs M
At 1 January 8,625 10,273
Fair value gains losses (112) (1,648)
8,513 8,625
The Group’s investment in equities that are designated at fair value through profit or loss represent equities for which there is an active market and where the Group holds less than 20% of the voting rights of the investee companies and the Group does not have significant influence over the financial and operating decisions of the investee companies.
The other equity investment relates to the Group’s investment in Crane Financial Services. This relates to the payment made by the Group for Crane Financial Services as part of the assets acquired from Crane Bank Limited (In Liquidation).

dfcu ANNUAL REPORT AND FINANCIAL STATEMENTS 2020 dfcu ANNUAL REPORT AND FINANCIAL STATEMENTS 2020 201200
24 Investments in securities – Group
Investment securities 2020 2019
Ushs M Ushs M
Amortised cost
Investment securities measured at amortised cost 257,370 363,382
Other bonds 138 219
Expected credit loss adjustment (126) (84)
257,382 363,517
Investment securities measured at FVOCI - debt instruments 259,623 123,254
517,005 486,771
Other bonds include corporate bonds amounting to Ushs 131 million (2019: Ushs 219 million) issued by Stanbic Bank Uganda Limited.
Movement in investment securities:
2020 2019
Shs M Shs M
At 1 January 486,771 515,412
Additions during the year 366,883 55,458
Maturities during the year (335,369) (84,351)
Fair value gain/(loss) during the year (1,237) (660)
Movement in expected credit loss (43) 912
At 31 December 517,005 486,771
Maturing as follows:
Maturing within 1 month 128,445 62,386
Maturing between 1–3 months 48,697 91,433
Maturing within 3-12 months 75,727 53,208
Maturing between 1-5 years 264,136 279,744
517,005 486,771
The investment securities were classified as high grade, under stage 1 as at 31 December 2020 and 2019. There were no transfers between stages for both years.
The movement in expected credit losses was as follows: 2020 2019
Ushs M Ushs M
At 1 January 84 996
Impairment recognized during the year 42 (912)
At 31 December 126 84
.

dfcu ANNUAL REPORT AND FINANCIAL STATEMENTS 2020 dfcu ANNUAL REPORT AND FINANCIAL STATEMENTS 2020 203202
25
Tr
adin
g as
sets
- G
roup
Tr
adin
g as
sets
Trad
ing
liabi
litie
s
20
20
2019
2020
2019
Ush
s M
Ush
s M
Ush
s M
Ush
s M
Non
-der
ivat
ives
57
,53
62
2,4
42
-
-
Trad
ing
asse
ts F
VTPL
82
11
88
--
58
,35
72
2,6
30
-
-
Mat
urin
g as
follo
ws:
Mat
urin
g w
ithin
1 m
onth
--
--
Mat
urin
g be
twee
n 1–3
mon
ths
--
--
Mat
urin
g w
ithin
3-1
2 m
onth
s5
8,3
57
22
,63
0-
-
Mat
urin
g be
twee
n 1-5
yea
rs-
- -
-
58
,35
72
2,6
30
-
-
Trad
ing
asse
ts
Ple
dged
tra
ding
as
set
Non
-ple
dged
tr
adin
g as
sets
Tota
l tra
ding
ass
ets
Ple
dged
tra
ding
as
set
Non
-ple
dged
tr
adin
g as
sets
Tota
l tra
ding
as
sets
20
20
20
20
20
20
2019
2019
2019
Ush
s M
Ush
s M
Ush
s M
Ush
s M
Ush
s M
Ush
s M
Gov
ernm
ent
bond
s-
39,5
25
39,5
25
-2
,74
02
,74
0
Trea
sury
bill
s
-18,8
32
18,8
32
-
19
,89
01
9,8
90
-
58,3
57
58,3
57
-
22
,63
02
2,6
30
Trea
sury
bill
s ar
e de
bt s
ecur
ities
issu
ed b
y th
e G
over
nmen
t of U
gand
a, a
nd a
dmin
iste
red
by th
e B
ank
of U
gand
a, fo
r a
term
of t
hree
mon
ths,
six
mon
ths,
nin
e m
onth
s or
a y
ear.
Trea
sury
bon
ds a
re d
ebt se
curit
ies
issu
ed b
y th
e G
over
nmen
t of
Uga
nda
and
adm
inis
tere
d by
the
Ban
k of
Uga
nda,
for
term
s of
tw
o ye
ars,
thr
ee y
ears
, fiv
e ye
ars,
ten
yea
rs a
nd
fifte
en y
ears
. T
he w
eigh
ted
aver
age
effe
ctiv
e in
tere
st r
ate
on g
over
nmen
t se
curit
ies
was
11.9
%.
(2019:
14.4
%)

dfcu ANNUAL REPORT AND FINANCIAL STATEMENTS 2020 dfcu ANNUAL REPORT AND FINANCIAL STATEMENTS 2020 203202
26 Other assets
Group Company
2020 2019 2020 2019
Other assets at amortised cost (except prepayments) Ushs M Ushs M Ushs M Ushs M
Prepaid expenses 11,509 15,962 - -
Sundry receivables 6,500 6,152 - -
Other assets 3,791 1,390 17 17
Expected credit loss adjustment (543) (87) - -
21,257 23,417 17 17
Other assets at FVTPL
Other financial assets at fair value through profit or loss
109,892 166,283 - -
131,149 189,700 17 17
Other financial assets at fair value through profit or loss relate to the fair valuation of written off and non-performing loans and advances acquired from Crane Bank Limited. The carrying value of other assets is approximately equal to its fair value.
The table below summarises the movement in other financial assets at fair value through profit or loss:
2020 2019
Ushs M Ushs M
At 1 January 2020 166,283 192,466
Settlements against the asset (5,903) (16,078)
Fair value loss (50,488) (10,105)
At 31 December 2020 109,892 166,283

dfcu ANNUAL REPORT AND FINANCIAL STATEMENTS 2020 dfcu ANNUAL REPORT AND FINANCIAL STATEMENTS 2020 205204
27 Investment property
Investment property comprises land and buildings at Plot 26 Kyadondo Road, Kampala. This property is held for its rental and capital appreciation. The investment property has been stated on the historical cost basis.
During 2020, the Company resolved to make available for rent to third parties, that part of the property that is not utilised by dfcu Group Limited. Consequently, that part of the property is held for rental purposes and has been reclassified to investment property in the consolidated financial statements as shown below. In the stand-alone financial statements of the Company, the entire property is held for rental purposes and is therefore retained as investment property in those financial statements.
Group Company
2020 2019 2020 2019
Shs M Shs M Shs M Shs M
Cost:
At 1 January 8,913 8,913 56,125 55,248
Additions 145 - 360 877
Transfer from work in progress 218 - - -
Transfers from own use (property and equipment) 12,369 - - -
Write offs (433) - (460) -
As at 31 December 21,212 8,913 56,024 56,125
Depreciation:
At 1 January 1,148 1,424 9,789 12,420
Charge for the year 276 - 2,667 -
Transfers from own use 575 - - -
Write offs (29) (276) (37) (2,632)
As at 31 December 1,970 1,148 12,419 9,788
Net Book Value 19,242 7,765 43,605 46,337
Amount allocated to investment property 19,242 7,765
Amount allocated to property and equipment 24,363 38,572
Total property & equipment 43,605 46,337
The fair value of the investment property is Ushs 58 billion. The Group has assessed that the highest and best use of its investment property does not differ from their current use.
The valuation was carried out using the investment method of valuation. The valuer utilised the income capitalisation approach by reference to the net cashflows / rental income from the commercial building portion that is being rented out.

dfcu ANNUAL REPORT AND FINANCIAL STATEMENTS 2020 dfcu ANNUAL REPORT AND FINANCIAL STATEMENTS 2020 205204
27 Investment property (continued)
The significant unobservable inputs used in the valuation were as follows:
Significant unobservable input
Range (weighted average)US$13 – US$ 18 per square metre depending on the attributes of the space. Gross annual rent is estimated at US$ 1,713,086.6 US$ 4 per square metre and is charged separately. The annual service charge is estimated at US$ 328,991.52Estimated annual rent of US$ 35,2806%- 8% (7%)Ushs 8 billion -Ushs 10 billion per acre
Building Estimated rental value
Land
Service chargeParkingDiscount ratePrice per acre
Significant increases (decreases) in estimated rental value and rent growth per annum in isolation would result in a significantly higher (lower) fair value of the properties. Significant increases (decreases) in the discount rate (and exit yield) in isolation would result in a significantly lower (higher) fair value. Generally, a change in the assumption made for the estimated rental value is accompanied by a directionally similar change in the rent growth per annum and discount rate (and exit yield).
Valuation techniques for investment properties:
Land Market Approach
Land was valued by the sales comparison method taking into account factors such as location, services and accessibility.
Buildings Income capitalisation approach
The valuer used this approach to estimate the value of income-producing portion of the building. It is based on the expectation of future benefits. This method of valuation relates value to the market rent that a property can be expected to earn and to the resale value.
The fair value measurement for the investment property has been categorised as a Level 3 fair value based on the inputs to the valuation technique used.
Key underlying assumptions in valuation of the investment property included:• The property and its value is unaffected by any statutory notice or condition of title where title deeds were
not inspected, and that neither the property nor its condition, nor its use, nor its intended use, is or will be unlawful.
• No onerous easements, rights of way or encroachments exist by or on the subject properties other than those in favour of statutory bodies, applicable to all such properties, or which could be regarded as customary.
• The market value referred to in the valuation report excludes Value Added Tax and transfer costs• The property is unaffected by environmental issues• The property is assumed to be free from any structural fault, rot, infestation or defects of any other nature
whether exposed or unexposed, including inherent weaknesses due to the use in construction of deleterious materials. There is also an assumption that there are no unidentified adverse ground or soil conditions and that the load bearing qualities of the site of each property are sufficient to support the building constructed or to be constructed thereon.
Group Company
2020 2019 2020 2019
Ushs M Ushs M Ushs M Ushs M
Rental income derived from investment properties 1,786 1,622 6,224 5,956
Direct operating expenses (including repairs and maintenance)
(181) (156) (181) (156)
Profit arising from investment properties 1,605 1,466 6,043 5,800

dfcu ANNUAL REPORT AND FINANCIAL STATEMENTS 2020 dfcu ANNUAL REPORT AND FINANCIAL STATEMENTS 2020 207206
28
(
a) P
rope
rty,
equ
ipm
ent
and
righ
t-of
-use
ass
et -
Gro
up
As
at 3
1 D
ecem
ber
2019
Fre
ehol
d la
nd
and
build
ing
Ope
ratin
g le
ase
prep
aym
ent
Mot
or
vehi
cle
Fur
nitu
re &
eq
uipm
ent
Com
pute
r eq
uipm
ent
Rig
ht-o
f-U
se
asse
t W
ork
in
prog
ress
Tot
al
Cos
t: U
shs
M
Ush
s M
U
shs
M
Ush
s M
U
shs
M
Ush
s M
Ush
s M
U
shs
M
At
1 J
anua
ry 2
019
65,7
94
14,5
86
2,7
40
112,6
10
31
,18
0-
9,8
79
23
6,7
89
Rec
lass
ifica
tion
to r
ight
-of-
use
asse
t (R
oU)
-(1
4,5
86)
--
-1
4,5
86
--
Rec
ogni
tion
of R
oU o
n in
itial
app
licat
ion
of IF
RS
16
--
--
-3
6,3
00
-3
6,3
00
Adj
uste
d ba
lanc
e at
1 J
anua
ry 2
019
65,7
94
-2,7
40
112,6
10
31
,18
05
0,8
86
9,8
79
27
3,0
89
Adj
ustm
ents
to
alig
n th
e fix
ed a
sset
s-
--
(25
)1
9-
-(6
)
Add
ition
s-
--
2,8
12
22
01
,18
81
1,3
51
15
,57
1
Tran
sfer
s from
wor
k in
pro
gres
s-
-1,0
31
95
32
,53
3-
(4,5
17
)-
Writ
e of
fs-
--
(41
1)
(3,9
70
)-
(52
8)
(4,9
09
)
Dis
posa
ls-
-(1
,318)
(38
)(2
63
)-
-
(1,6
19
)
As
at 3
1 D
ecem
ber
2019
65,7
94
-2,4
53
115,9
01
29
,71
95
2,0
74
16
,18
52
82
,12
6
Dep
reci
atio
n:
At
1 J
anua
ry 2
019
2,8
20
2,3
30
1,9
15
79,0
44
24
,68
2-
- 1
10
,79
1
Rec
lass
ifica
tion
to r
ight
of u
se a
sset
-(2
,330)
--
-2
,33
0-
-
Adj
ustm
ents
to
alig
n th
e fix
ed a
sset
s-
--
(2)
66
3-
- 6
61
Cha
rge
for
the
year
1,6
44
-438
12,5
54
2,5
30
4,5
82
- 2
1,7
48
Writ
e of
fs-
--
(25
5)
(2,3
96
)-
-(2
,65
1)
Dis
posa
ls-
-(1
,126)
(33
)(2
63
)-
- (1
,42
2)
As
at 3
1 D
ecem
ber
2019
4,4
64
-1,2
27
91,3
08
25
,21
66
,91
2-
12
9,1
27
Net
car
ryin
g am
ount
61
,33
0-
1,2
26
24
,593
4,5
03
45,1
62
16,1
85
152,9
99

dfcu ANNUAL REPORT AND FINANCIAL STATEMENTS 2020 dfcu ANNUAL REPORT AND FINANCIAL STATEMENTS 2020 207206
28
(a
) P
rope
rty,
equ
ipm
ent
and
righ
t-of
-use
ass
et –
Gro
up (
cont
inue
d)
As
at 3
1 D
ecem
ber
2020
Fre
ehol
d la
nd a
nd
build
ing
Ope
ratin
g le
ase
prep
aym
ent
Mot
or
vehi
cle
Fur
nitu
re &
eq
uipm
ent
Com
pute
r eq
uipm
ent
Rig
ht o
f U
se
asse
t W
ork
in
prog
ress
Tota
l
Cos
t: U
shs
M
Ush
s M
U
shs
M
Ush
s M
U
shs
M
Ush
s M
Ush
s M
U
shs
M
At
1 J
anua
ry 2
020
65
,79
4-
2,4
53
115,9
01
29,7
19
52,0
74
16,1
85
282,1
26
Add
ition
s4
,03
1-
-1,5
59
773
15,1
39
14,4
50
35,9
52
Tran
sfer
s from
wor
k in
pro
gres
s-
-6
46
12,8
19
--
(13,6
83)
(218)
Writ
e of
fs(8
7)
--
(218)
(184)
(28)
(149)
(666)
Tran
sfer
to
inve
stm
ent
prop
erty
(12
,36
9)
--
--
--
(12,3
69)
Dis
posa
ls-
--
(14,5
73)
(4,4
27)
- -
(19,0
00)
Res
cind
ed p
rope
rtie
s tr
ansf
erre
d to
ass
ets
held
for
sale
(N
ote
28b)
(33
,77
1)
--
(12,1
81)
-(1
4,0
04)
-(5
9,9
56)
As
at 3
1 D
ecem
ber
2020
23
,59
8-
3,0
99
103,3
07
25,8
81
53,1
81
16,8
03
225,8
69
Dep
reci
atio
n:
At
1 J
anua
ry 2
020
4,4
64
-1
,22
791,3
08
25,2
16
6,9
12
-129,1
27
Cha
rge
for
the
year
3,1
39
-4
71
11,4
58
2,2
57
7,6
67
- 22,0
69
Writ
e of
fs(1
5)
--
(208)
(184)
(8)
-(4
15)
Tran
sfer
to
inve
stm
ent
prop
erty
(57
5)
--
--
--
(575)
Res
cind
ed p
rope
rtie
s tr
ansf
erre
d (N
ote
27b)
(3,0
05
)-
-(9
,788)
-(2
,771)
-(1
5,5
17)
Dis
posa
ls-
--
(14,4
87)
(4,4
17)
--
(18,9
04)
As
at 3
1 D
ecem
ber
2020
4,0
08
-1
,69
878,2
83
22,8
72
11,8
00
-118,6
61
Net
car
ryin
g am
ount
19
,59
0-
1,4
01
25,0
24
3,0
09
41,3
81
16,8
03
107,2
08
Wor
k-In
-Pro
gres
s (W
IP)
rela
tes
to o
ngoi
ng w
orks
in
resp
ect
of v
ario
us p
roje
cts
the
Ban
k is
und
erta
king
. Th
ere
wer
e no
cap
italis
ed b
orro
win
g co
sts
rela
ted
to t
he a
cqui
sitio
n of
pla
nt a
nd
equi
pmen
t du
ring
the
year
(2019:
nil).
Adj
ustm
ents
to
alig
n th
e fix
ed a
sset
s re
late
s to
am
endm
ents
into
the
IFR
S 16-L
ease
s m
odel
with
act
ual p
aym
ents
and
pay
men
t fr
eque
ncie
s.

dfcu ANNUAL REPORT AND FINANCIAL STATEMENTS 2020 dfcu ANNUAL REPORT AND FINANCIAL STATEMENTS 2020 209208
(b) Assets held for disposal
dfcu Group acquired some assets and liabilities from former Crane Bank Limited (In Liquidation) under an Agreement signed with Bank of Uganda (as the Receiver) on 25 January 2017. As per the provisions of the Agreement, dfcu exercised the option not to purchase the reversionary interest of the properties. As of 31 December 2020, dfcu Group was in the process of returning the properties to Bank of Uganda (as the Receiver). The expected amount to be recovered is Ushs 29,089 million, which has been recorded under assets held for disposal. An impairment amount of Ushs 15,283 million has been recognised in other expenses.
29 Intangible assets
Goodwill Computer software
Other intangible assets
Work-In-Progress
Total
Ushs M Ushs M Ushs M Ushs M
Cost
At 1 January 2019 463 38,862 36,921 2,839 79,085
Additions - 841 - 7,473 8,314
Transfers from WIP - 2,328 - (2,328) -
At 31 December 2019 463 42,031 36,921 7,984 87,399
Amortisation
At 1 January 2019 - 18,683 17,750 - 36,433
Adjustment to align the assets - (662) - - (661)
Charge for the year - 6,258 7,633 - 13,891
At 31 December 2019 - 24,279 25,383 - 49,662
Net carrying amount 463 17,752 11,538 7,984 37,737
Cost
At 1 January 2020 463 42,031 36,921 7,984 87,399
Additions - 325 - 12,319 12,644
Transfers from WIP - 8,834 - (8,834) -
At 31 December 2020 463 51,190 36,921 11,469 100,043
Amortisation
At 1 January 2020 - 24,279 25,383 - 49,662
Charge for the year - 6,380 7,320 - 13,700
At 31 December 2020 - 30,659 32,703 - 63,362
Net carrying amount 463 20,531 4,218 11,469 36,681
Computer software comprises of software for the Group’s core banking systems.
Other intangible assets comprises fair valuations of customer relationships acquired from Global Trust Bank (U) Limited and Crane Bank Limited and fair valuations of customer deposits and ground rent.
Work-In-Progress (WIP) relates to ongoing works in respect of the various software projects.

dfcu ANNUAL REPORT AND FINANCIAL STATEMENTS 2020 dfcu ANNUAL REPORT AND FINANCIAL STATEMENTS 2020 209208
29 Intangible assets (continued)
Annual impairment test for goodwill
The Group performed its annual impairment test of goodwill during the year. Goodwill was acquired through the business combination of the subsidiary, dfcu Bank as the Cash Generating Unit (CGU). The Group considers the relationship between its market capitalization and its book value among other factors when reviewing for indicators of impairment. As at 31 December 2020, the market capitalization of the Group was below the book value of its entity, an indication of a potential impairment of goodwill.
Management performed a Value in Use (VIU) estimation using the Dividend Discount Model (DDM) as the primary approach and the Market Multiples as a secondary approach.
The DDM involves discounting the expected earnings to shareholders (the dividends stream) at the Equity Required Rate of Return.
The following were the inputs into the DDM;
• Management’s forecasts on equity capital requirements to satisfy Capital Adequacy Requirements (CAR) and derived the excess equity capital, distributable to shareholders as the forecast equity cashflows.
• The forecast cashflows were discounted at the low and high cost of equity of 23.12% and 24.36% (an average of 23.74%) derived using the Capital Asset Pricing Model.
• The terminal value was calculated using the long-term Ugandan inflation rate of 5.3%
Annual impairment test for goodwill (continued)The Market Multiples approach involved obtaining Price to Book (P/B) multiples of peer companies operating in the same industry as the company. The observed trading multiples were adjusted for country risk and size in order to arrive at an objective equity value. The implied P/B was calculated using the net asset value as at 31 December 2020.
Below is the summary of the valuation results:
Low High Average
Ushs M Ushs M Ushs M
Net assets as at 31 December 2020 592,912 592,912 592,912
Goodwill 463 463 463
Total 593,375 593,375 593,375
VIU (DDM) 701,000 754,000 727,000
Headroom/(impairment) 107,625 160,625 133,625
From the indicative valuation results based on the primary approach (DDM) and the corroborative approach, there is no impairment for goodwill as at 31 December 2020.

dfcu ANNUAL REPORT AND FINANCIAL STATEMENTS 2020 dfcu ANNUAL REPORT AND FINANCIAL STATEMENTS 2020 211210
30 Deferred income tax
Deferred tax is calculated on all temporary differences under the liability method using the principal tax rate of 30%), except for interest receivable on treasury bills and bonds where the enacted rate is 15% (2019: 15%). Deferred tax assets and liabilities and the deferred tax credit as at 31 December 2020 are attributed to the following items:
Group Company
2020 2019 2020 2019
Ushs M Ushs M Ushs M Ushs M
At 1 January (2,870) (2,198) 233 (550)
Charge/(credit) to income statement (9,559) (464) (1,397) 783
Charge to OCI (259) (208) - -
Deferred tax (asset)/liability (12,688) (2,870) (1,164) 233
Group
2020 At 1 January
2020
(Credit)/ Charge to
P&L
(Credit)/ Charge to
OCI
Credit)/ Charge to Retained earnings
At 31 December
2020
Ushs M Ushs M Ushs M Ushs M Ushs M
Property and equipment 3,276 (6,764) - - (3,488)
Tax losses carried forward (1,484) (43) - - (1,527)
Deferred fees and commissions income (2,253) 53 - - (2,200)
Fair value of treasury bills and bonds (5) 222 - - 217
Fair value of customer relationships 1,359 (989) - - 370
Unrealised foreign exchange loss (14) 18 - - 4
FVOCI Fair value loss (281) - (259) - (540)
Allowance for impairment of loans and advances
(3,468) (1,479) - - (4,947)
Provision for URA assessment - (450) - - (450)
Capped interest expense - (127) - - (127)
Net deferred tax asset (2,870) (9,559) (259) - (12,688)
Company
2020 At 1 January 2020 (Credit)/ Charge to SOCI
At 31 December 2020
Ushs M Ushs M Ushs M
Property and equipment 1,732 (1,245) 487
Tax losses carried forward (1,485) (43) (1,528)
Capped interest expense - (127) (127)
Unrealised foreign exchange loss (14) 18 4
Net deferred tax liability / (asset) 233 (1,397) (1,164)

dfcu ANNUAL REPORT AND FINANCIAL STATEMENTS 2020 dfcu ANNUAL REPORT AND FINANCIAL STATEMENTS 2020 211210
30 Deferred income tax (continued)
Group
2019 At 1 January
2019
(Credit)/ Charge to
P&L
(Credit)/ Charge to
OCI
Credit)/ Charge to Retained earnings
At 31 December
2019
Ushs M Ushs M Ushs M Ushs M Ushs M
Property and equipment 4,811 (1,535) - - 3,276
Tax losses carried forward (4,052) 2,568 - - (1,484)
Deferred fees and commissions income
(1,842) (411) - - (2,253)
Fair value of treasury bills and bonds 524 (529) - - (5)
Fair value of customer relationships 2,922 (1,563) - - 1,359
Unrealised foreign exchange loss - (14) - - (14)
FVOCI Fair value loss (73) - (208) - (281)
Allowance for impairment of loans and advances
(4,488) 1,020 - - (3,468)
Net deferred tax liability/(asset) (2,198) (464) (208) - (2,870)
Company
2019 At 1 January 2020
(Credit)/ Charge to SOCI
At 31 December 2020
Ushs M Ushs M Ushs M
Property and equipment 1,608 124 1,732
Tax losses carried forward (2,158) 673 (1,485)
Unrealised foreign exchange loss - (14) (14)
Net deferred tax asset (550) 783 233
31 Investment in subsidiaries
Shareholding Company
2020 2019
Ushs M Ushs M
dfcu Bank Limited 100%
As at 1 January and 31 December 203,293 203,293
dfcu Bank Limited is incorporated in Uganda under the Companies Act of Uganda as a limited liability company and licensed by Bank of Uganda to operate as a commercial bank. It is domiciled in Uganda and the address of its registered office is:
Plot 26 Kyadondo RoadP.O. Box 70 Kampala, Uganda.
The Group is engaged in the business of banking and the provision of related services and is licensed under the Financial Institutions Act.

dfcu ANNUAL REPORT AND FINANCIAL STATEMENTS 2020 dfcu ANNUAL REPORT AND FINANCIAL STATEMENTS 2020 213212
32 Customer deposits - Group
2020 2019
Ushs M Ushs M
Demand deposits 1,208,919 809,816
Savings deposits 624,039 527,246
Fixed deposits 762,389 701,975
2,595,347 2,039,037
The weighted average effective interest rates for the customer deposits are as follows:
2020 2019
% %
Demand deposits 1 1
Savings deposits 2 2
Fixed deposits 8 8
33 Deposits due to other banks - Group
2020 2019
Ushs M Ushs M
Balances due to other banks within 90 days 10,968 10,002
Balances due to other banks are short-term deposits made by other banks for varying periods of between one day and three months and earn interest at the respective short-term deposit rates. The weighted average effective interest rate was 7% (2019: 8%). The carrying value of deposits due to other banks is approximately equal to its fair value.
34 Other liabilities
Group Company
2020 2019 2020 2019
Ushs M Ushs M Ushs M Ushs M
Bills payable 279 571 - -
Unclaimed balances 834 789 - -
Other liabilities 20,315 14,506 1,183 1,889
Managed funds (Note 35) 197 197 197 197
Deferred grant income - 118 - -
Deferred rental income 621 642 2,137 6,423
IFRS 16 lease liability 35,929 28,591 - -
Accrued expenses and payables 18,373 13,650 132 58
76,548 59,064 3,649 8,567
Other liabilities
Other liabilities are non-interest bearing and normally settled within 30-90 days. The Group gives no collateral in respect to these payables. Other liabilities include the expected credit loss on contingent liabilities and commitments amounting to Ushs 88 million (2019: Ushs 118 million). The carrying value of other liabilities is approximately equal to its fair value.

dfcu ANNUAL REPORT AND FINANCIAL STATEMENTS 2020 dfcu ANNUAL REPORT AND FINANCIAL STATEMENTS 2020 213212
35 Managed funds - Group
dfcu Limited managed a number of funds on behalf of the Government of Uganda (“GoU”) under which GoU provided financing for on-lending to specified third party beneficiaries under the terms and conditions of each fund. The related loans and advances are not maintained on the statement of financial position of dfcu Limited to reflect the fact that the Group has neither rights to future economic benefits beyond management fees nor obligations to transfer economic benefits under the management agreements of the funds. These funds are due on demand. During the year, the Group had the GoU/CDO Fund and Gomba Daals Fund (GDF) under management. The un-disbursed balances on these funds are as follows:
(a) CDO/ GOU Fund
During 2004, dfcu Limited entered into a tripartite agreement with the Government of Uganda and Cotton Development Organisation (CDO) to set up a revolving fund of Ushs 2.5 billion in cash, Ushs 720 million worth of tractors and US$ 300,000 to finance leases for cotton farmers in Uganda. Under the terms of the agreement, dfcu Limited provided leasing administration and management services only and received fees in this respect of up to 4% of each lease facility. Interest on the facilities was chargeable to a maximum of 10% and was credited to the fund. No time limit was set for the fund under the terms of the agreement.
(b) Gomba Daals Fund
During 2007, dfcu Limited entered into a tripartite agreement with the Government of Uganda and Gomba Daals Spices (U) Limited to set up a revolving fund of Ushs 221 million. Under the terms of the agreement, dfcu Limited provided leasing administration and management services only and received fees in this respect of up to 2% of the lease facility. Interest on the facility was charged at 4% and is credited to the fund. No time limit was set for the fund under the terms of the agreement.
During the year there were no new lease facilities and no management fees earned on these funds.
36 Special funds - Group
Special funds represent liabilities created under the terms of borrowing agreements with Kreditanstalt Fur Wiederaufbau (KFW). These agreements require the Group to remit repayments of principal and interest due on loans issued out of the proceeds of these borrowings into a special fund controlled by the Government of Uganda to support the financing of SME and microfinance businesses.
2020 2019
Ushs M Ushs M
At 31 December 1,193 1,205
The carrying value of special funds is approximately equal to its fair value.

dfcu ANNUAL REPORT AND FINANCIAL STATEMENTS 2020 dfcu ANNUAL REPORT AND FINANCIAL STATEMENTS 2020 215214
37 Borrowed funds
Group Company
2020 2019 2020 2019
Ushs M Ushs M Ushs M Ushs M
Uganda Government (KFW V loan) 11,878 11,878 - -
Bank of Uganda (ACF loan) 39,344 24,080 - -
Bank of Uganda (Other borrowings) - - - -
Societe De Promotion Et De Participation Pour La Cooperation Economique (PROPARCO)
40,718 64,659 - -
Abi-Finance 11,699 14,918 - -
Nederlandse Financierings-Maatschappij Voor Ontwikkelingslanden N.V. (FMO)
30,848 43,254 - -
European Investment Bank – PEFF 31,431 49,343 - -
European Investment Bank – Microfinance - 1,844 - -
East African Development Bank 9,867 14,861 - -
Deutsche Investitions-Und Entwicklungsgesellschaft mbH (DEG) Senior loan
- 6,956 - -
Deutsche Investitions-Und Entwicklungsgesellschaft mbH (DEG)
36,560 36,660 - -
UN Habitat 372 455 - -
Jubilee Insurance 4,502 4,446 4,502 4,446
217,219 273,354 4,502 4,446
The maturity analysis for borrowed funds has been disclosed in Note 5C.
Deutsche Investitions-Und EntwicklungsgesellschaftmbH (DEG)
Included in borrowings is a subordinated debt from Deutsche Investitions-Und EntwicklungsgesellschaftmbH (DEG) whose tenure is 7 years and is due to mature in 2024. The interest rate on this debt is variable at an aggregate interest rate of 6.6% per annum plus the USD swap rate prevailing at the interest determination date. The debt is subordinated to ordinary liabilities of the Group and recognised by the Group as Tier 2 Capital for regulatory capital adequacy purposes of the Group in accordance with Bank of Uganda prudential regulations.
Agricultural Credit Facility (ACF)-BOU
The Government of Uganda through the central bank in partnership with commercial banks, Uganda Development Bank Ltd and micro-deposit taking institutions (MDIs) created the Agricultural Credit Facility. The facility was created for the provision of medium-term credit facilities to agriculture and agro-processing projects on more favorable terms as opposed to the open market. The credit facilities are advanced to customers at an interest rate of 12%. The other objectives of the facility include the promotion of commercial agriculture, increasing access to finance by agribusinesses, increased agricultural production thus food security as well as boosting the confidence of financial institution in lending to agriculture. The Group contributes 50% towards the lending and 50% is financed by the ACF. The Group repays the 50% financed by the ACF as and when the loans are repaid by the customers.
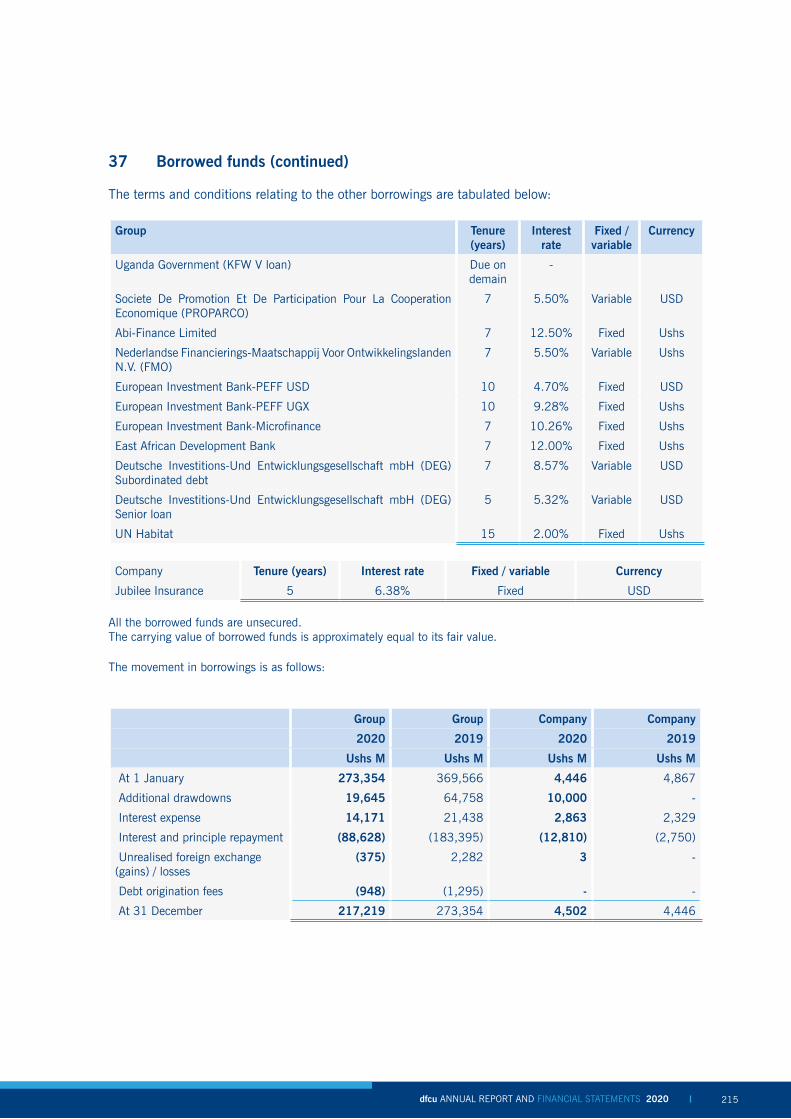
dfcu ANNUAL REPORT AND FINANCIAL STATEMENTS 2020 dfcu ANNUAL REPORT AND FINANCIAL STATEMENTS 2020 215214
37 Borrowed funds (continued)
The terms and conditions relating to the other borrowings are tabulated below:
Group Tenure (years)
Interest rate
Fixed / variable
Currency
Uganda Government (KFW V loan) Due on demain
-
Societe De Promotion Et De Participation Pour La Cooperation Economique (PROPARCO)
7 5.50% Variable USD
Abi-Finance Limited 7 12.50% Fixed Ushs
Nederlandse Financierings-Maatschappij Voor Ontwikkelingslanden N.V. (FMO)
7 5.50% Variable Ushs
European Investment Bank-PEFF USD 10 4.70% Fixed USD
European Investment Bank-PEFF UGX 10 9.28% Fixed Ushs
European Investment Bank-Microfinance 7 10.26% Fixed Ushs
East African Development Bank 7 12.00% Fixed Ushs
Deutsche Investitions-Und Entwicklungsgesellschaft mbH (DEG) Subordinated debt
7 8.57% Variable USD
Deutsche Investitions-Und Entwicklungsgesellschaft mbH (DEG) Senior loan
5 5.32% Variable USD
UN Habitat 15 2.00% Fixed Ushs
Company Tenure (years) Interest rate Fixed / variable Currency
Jubilee Insurance 5 6.38% Fixed USD
All the borrowed funds are unsecured.The carrying value of borrowed funds is approximately equal to its fair value.
The movement in borrowings is as follows:
Group Group Company Company
2020 2019 2020 2019
Ushs M Ushs M Ushs M Ushs M
At 1 January 273,354 369,566 4,446 4,867
Additional drawdowns 19,645 64,758 10,000 -
Interest expense 14,171 21,438 2,863 2,329
Interest and principle repayment (88,628) (183,395) (12,810) (2,750)
Unrealised foreign exchange (gains) / losses
(375) 2,282 3 -
Debt origination fees (948) (1,295) - -
At 31 December 217,219 273,354 4,502 4,446

dfcu ANNUAL REPORT AND FINANCIAL STATEMENTS 2020 dfcu ANNUAL REPORT AND FINANCIAL STATEMENTS 2020 217216
38 Share capital and share premium
Group Number of authorised
ordinary shared
Number of issued ordinary
shares
Share Capital
Share premium
Total
Ushs M Ushs M Ushs M
At 1 January and 31 December 2020 and 2019 1,250,000,000 748,144,033 14,963 185,683 200,646
The holders of ordinary shares are entitled to receive dividends as declared from time to time and are entitled to one vote per share at meetings of the Group. All ordinary shares rank equally with regard to the Group’s residual assets.
Share premium
2020
Ushs M
** 1 May 2000 2,878
*** 28 February 2017 182,805
Total 185,683
** Share premium relates to shares issued by the Group on 1 May 2000 amounting to 198,880,729 with a par value of Ushs 20 per share at approximately Ushs 95 per share which resulted into a share premium of Shs 2,878 million.
*** Share premium relates to additional capital from its shareholders through a rights issue done during the year. The capital was converted into 250.9 million ordinary shares giving rise to additional ordinary share capital of Ushs 5.5 billion and share premium of Ushs 182.8 billion.
39 Regulatory reserve - Group
2020 2019
Ushs M Ushs M
At 1 January 14,055 8,024
Transfer (to)/from retained earnings during the year (14,055) 6,031
At 31 December - 14,055
The regulatory credit risk reserve is analysed as follows:
Provision for impairment of loans and advances as per FIA 2004:
Specific provisions 36,513 25,060
General provisions 18,051 15,484
Total regulatory provision 54,564 40,544
Provision for impairment of loans and advances as per IFRS
Identified impairment (note 23) (47,375) (15,326)
Unidentified impairment (note 23)
Stage 1 (10,603) (7,488)
Stage 2 (4,888) (3,675)
Total IFRS provision (62,866) (26,489)
(Excess) / shortfall of IFRS provision over regulatory provision (8,302) 14,055

dfcu ANNUAL REPORT AND FINANCIAL STATEMENTS 2020 dfcu ANNUAL REPORT AND FINANCIAL STATEMENTS 2020 217216
The regulatory credit risk reserve represents amounts by which allowances for impairment of loans and advances determined in accordance with the Financial Institutions Act, 2004 exceed those determined in accordance with International Financial Reporting Standards. These amounts are appropriated from retained earnings in accordance with accounting policy 4c(v). The reserve is not distributable.
As of 31 December 2020, the allowance of impairment of loans and advances computed in accordance with IFRS exceeded the regulatory provision and therefore the credit risk reserve was nil (2019: the regulatory provision was higher than the IFRS by Ushs 14,055 million).
40 (a) Retained earnings/ accumulated losses
Retained earnings / accumulated losses comprises prior year brought forward earning plus current year profit less any dividends paid and proposed and transfers to credit risk reserve. As at 31 December 2020, retained earnings amounted to Ushs 354,157 million (2019: Ushs 343,563 million) for the group and accumulated losses of Ushs 15,119 million (2019: accumulated profits of Ushs 12,623 million) for the company. The movement in retained earnings / accumulated losses is shown in the statement of changes in equity.
(b) Other reserves
In accordance with the terms and conditions of certain grants received by the Group, amounts recognised either directly in equity or through the profit and loss account for such grants are included within non-distributable reserves until such time as the terms and conditions pertaining to those grants permit recognition within distributable reserves. As at 31 December 2020, the previously reported non-distributable reserves of Shs 12,113 million were transferred to distributable reserves.
41 Fair value reserve - Group
The fair value reserve comprises the cumulative net change in the fair value of equity securities and the cumulative net change in the fair value of debt securities are measured at FVOCI until the assets are derecognised or reclassified. This amount is increased by the amount of loss allowance.
Movement in FVOCI financial assets 2020 2019
Ushs M Ushs M
At 1 January (621) (169)
Net movement on revaluation of FVOCI financial assets (1,237) (660)
Deferred tax impact of FVOCI transactions 259 208
At 31 December (1,599) (621)
ECL on FVOCI financial assets
At 1 January net of deferred tax 23 36
Increase/(decrease) in ECL 34 (13)
At 31 December 57 23
Total fair value reserve (1,542) (598)

dfcu ANNUAL REPORT AND FINANCIAL STATEMENTS 2020 dfcu ANNUAL REPORT AND FINANCIAL STATEMENTS 2020 219218
42 Off statement of financial position financial instruments, contingent liabilities and commitments - Group
In common with other banks, the subsidiary of the Company, dfcu Bank Limited (the Bank), conducts business involving acceptances, letters of credit, guarantees, performance bonds and indemnities. The majority of these facilities are offset by corresponding obligations of third parties.
2020 2019
Ushs M Ushs M
Contingent liabilities
Guarantee and performance bonds 271,869 541,845
271,869 541,845
Commitments
Undrawn formal stand-by facilities, credit lines and other commitments to lend
37,289
51,377
309,158 593,222
43 Leases
Group as a lessee
The Group leases a number of branch and office premises. The leases typically run for a period of 7 years, with an option to renew the lease after that date. For some leases, payments are renegotiated every 3 years to reflect market rentals. Some leases provide for additional rent payments that are based on changes in local price indices.
43 Leases
Information about leases for which the Group is a lessee is presented below.
i. Right-of-use assets
Right-of-use assets relate to leased branch and office premises that are presented within property and equipment. As at 31 December 2020, the net carrying amount for the right-of-use assets is Ushs 41,381 million (2019: Ushs 45,162 million) (see Note 28).
ii. Lease liability
The lease liability arises out of the payment obligations from leased branch and office premises and this is presented within the other liabilities (see note 34).
2020 2019
(Shs M) (Shs M)
Balance at 1 January 28,591 29,386
New leases 34,530 11,321
Interest charge (note 10) 6,418 7,404
Unrealised gain on foreign currency denominated leases (1,455) -
Payments (32,155) (19,520)
Balance as at 31 December 35,929 28,591

dfcu ANNUAL REPORT AND FINANCIAL STATEMENTS 2020 dfcu ANNUAL REPORT AND FINANCIAL STATEMENTS 2020 219218
43 Leases (continued)
At 31 December 2019, the future minimum lease payments under non-cancellable operatingleases were payable as follows.
iii. Amounts recognized in profit or loss
2020 2019
(Shs M) (Shs M)
Leases under IFRS 16
Interest on lease liabilities 6,418 7,404
Depreciation on right-of-use asset 7,667 4,582
Unrealised gain on foreign currency denominated lease liabilities (1,455) -
12,630 11,986
iv. Extension options
Some leases of office premises contain extension options exercisable by the Group before the end of the non-cancellable contract period. Where practicable, the Group seeks to include extension options in new leases to provide operational flexibility. The extension options held are exercisable only by the Group and not by the lessors. The Group assesses at lease commencement date whether it is reasonably certain to exercise the extension options. The Group reassesses whether it is reasonably certain to exercise the options if there is a significant event or significant changes in circumstances within its control.
v. Discount rate
In determination of the implicit rate of the lease (Discount rate), the Group has evaluated its ability to raise funds with a similar term structure and determined the weighted average cost of the fixed deposits as the discount rate. The weighted average rate as at 31 December 2020 was 12% (2019: 12%).
Group as a lessor
The Group has entered into operating leases on its investment property portfolio consisting of certain office buildings (see Note 27). These leases have terms of between 3 and 5 years. All leases include a clause to enable upward revision of the rental charge on an annual basis according to prevailing market conditions. The lessee is also required to provide a residual value guarantee on the properties.
Rental income recognised by the Group during the year is Ushs 1,786 million (2019: Ushs 1,622 million). The rental income recognised by the Company was Ushs 6,224 million (2019: Ushs 5,956 million).
Future minimum rentals receivable under non-cancellable operating leases as at 31 December are as follows:
2020 2019
Ushs M Ushs M
Within one year 2,315 2,051
After one year but not more than five years 8,352 7,537
More than five years 25,262 19,003
35,929 28,591

dfcu ANNUAL REPORT AND FINANCIAL STATEMENTS 2020 dfcu ANNUAL REPORT AND FINANCIAL STATEMENTS 2020 221220
44 Other contingent liabilities - Group
(a) Provisions
The Group is a defendant in various legal actions in the normal course of business. The total estimated contingent liability arising from these cases is Ushs 254 billion (2019: Ushs 81 billion). Through legal advice management has determined that total expected losses to the Group are Ushs 2.5 billion (2019: Ushs 2.9 billion) for which a provision has been made in the consolidated financial statements. In the opinion of directors and after taking appropriate legal advice, no significant additional losses are expected to arise from these cases.The movement in litigation provisions during the year was as follows:
2020 2019
Ushs M Ushs M
At 1 January 2,919 4,567
Arising during the year - -
Utilised during the year (399) (1,648)
At 31 December 2,520 2,919
(b) Derivative financial instruments
The Group entered into derivatives for trading and risk management purposes. These include foreign exchange contracts with Absa Uganda amounting to USD 9.5 million as at 31 December 2020. The unrealised loss on these contracts amounts to Ushs 97 million (2019: Nil) recorded in the statement of financial position.
45 Cash and cash equivalents
Analysis of cash and cash equivalents as shown in the consolidated statement of cash flows.
Group Company
2020 2019 2020 2019
Ushs M Ushs M Ushs M Ushs M
Cash in hand (note 20) 152,139 135,050 - -
Balances with Bank of Uganda (note 20) 454,611 259,842 - -
Less: Cash reserve requirement (204,350) (158,300) - -
Amounts due from related companies (note 46(b)) - - 197 1,714
Deposits and balances due from banks (note 21) 195,441 111,116 - -
597,841 347,708 197 1,714
For purposes of the statement of cash flows, cash equivalents include short- term liquid investments which are readily convertible into known amounts of cash and with less than 90 days to maturity from the date of acquisition. Amounts due from related parties relate to cash deposits held in dfcu Group Limited which are due on demand.Bank of Uganda requires banks to maintain a prescribed minimum cash balance. This balance is available to finance the Group’s day-to-day activities; however, there are restrictions as to its use and sanctions for non-compliance. The amount is determined as a percentage of the average outstanding customer deposits held by dfcu Bank Limited, the subsidiary, over a cash reserve cycle period of fourteen days.

dfcu ANNUAL REPORT AND FINANCIAL STATEMENTS 2020 dfcu ANNUAL REPORT AND FINANCIAL STATEMENTS 2020 221220
45 Cash and cash equivalents (continued)
The table below shows a reconciliation of movements of liabilities to cash flows arising from financing activities.
2020
Group
Liabilities Equity Total
Borrowed Share Share Proposed
funds capital premium dividends
Ushs M Ushs M Ushs M Ushs M Ushs M
Balance as at 1 January 2020 273,354 14,963 185,683 - 474,000
Changes from financing cash flows
Dividends proposed - -
- 37,651 37,651
New borrowings 19,645 - - - 19,645
Interest expense 14,171 -
- - 14,171
Interest and principle paid (88,628) - - - (88,628)
Other* (1,323) - - - (1,323)
Total changes from financing cash flows 217,219 14,963 185,683 37,651 470,024
*Other includes unrealised foreign exchange (gains)/losses and debt origination fees
Liabilities Equity
Borrowed Share Share Proposed Total
funds capital premium dividends
Company Ushs M Ushs M Ushs M Ushs M Ushs M
Balance as at 1 January 2020 4,446 14,963 185,683 - 205,250
Changes from financing cash flows
Dividends proposed - - - 37,651 37,651
Interest expense 2,863 - - - 2,863
New borrowings 10,000 - - - 10,000
Interest and principle paid (12,810) - - - (12,810)
Other* 3 - - - 3
Total changes from financing cash flows
4,502 14,963 185,683 37,651 242,957

dfcu ANNUAL REPORT AND FINANCIAL STATEMENTS 2020 dfcu ANNUAL REPORT AND FINANCIAL STATEMENTS 2020 223222
45 Cash and cash equivalents (continued)
*Other includes unrealised foreign exchange (gains)/losses and debt origination fees
2019
Group
Liabilities Equity Total
Borrowed Share Share Proposed
funds capital premium dividends
Ushs M Ushs M Ushs M Ushs M Ushs M
Balance as at 1 January 2019 369,566 14,963 185,683 24,694 594,906
Changes from financing cash flows
Dividends paid - - (24,694) (24,694)
New borrowings 64,758 - - - 64,758
Interest expense 21,438 - - - 21,438
Interest and principle repayment (182,408) - - - (182,408)
Total changes from financing cash flows 273,354 14,963 185,683 - 474,000
Liabilities Equity Total
Borrowed Share Share Proposed
funds capital premium dividends
Company Ushs M Ushs M Ushs M Ushs M Ushs M
Balance as at 1 January 2019 4,867 14,963 185,683 24,694 230,207
Changes from financing cash flows
Dividends paid - - - (24,694) (24,694)
Interest expense 2,329 - - - 2,329
Interest and principle paid (2,750) - - - (2,750)
Total changes from financing cash flows 4,446 14,963 185,683 - 205,092
46 Related party disclosures
There are other companies that are related to dfcu Limited through common shareholdings or common directorships. National Social Security Fund is one of the top shareholders in dfcu Limited and it has significant shareholding in Umeme Limited. Transactions and balances with related parties are shown below:
a) Amounts due to related companies
Group Company
2020 2019 2020 2019
Ushs M Ushs M Ushs M Ushs M
dfcu Bank Limited – Overdraft and term finance - - 15,932 14,252
Umeme Limited – Demand deposits - 1,334 - -
National Social Security Fund – Demand deposits 964 152 - -
Amounts due to dfcu Bank Limited relate to term finance which earns interest at the prevailing market rates. Amounts due to other related companies include borrowings and deposits held with dfcu Limited and dfcu Bank Limited which both accrue interest at the prevailing market rates. The loans to related companies are neither past due nor impaired and bear an average interest rate of 17% per annum.

dfcu ANNUAL REPORT AND FINANCIAL STATEMENTS 2020 dfcu ANNUAL REPORT AND FINANCIAL STATEMENTS 2020 223222
46 Related party disclosures (continued)
b) Amounts due from related companies
2020 2019
Ushs M Ushs M
dfcu Bank Limited 197 1,714
Umeme Limited - 36,650
These include deposits held in dfcu Bank Limited which are due on demand and earn interest at the prevailing market rates. Amount due from Umeme Limited relates to an overdraft which earns interest at the prevailing market rates.
2020 2019
Ushs M Ushs M
Interest expense incurred
Interest expense incurred 13 232
Advances to customers include loans to directors and loans to employees as follows:
- At 31 December 2020, advances to employees amounted to Ushs 29,814 million (2019: Ushs 24,762 million).
- At 31 December 2020, there were no advances to non-executive directors and companies controlled by directors or closely connected persons (2019: Ushs Nil).
2020 2019
Ushs M Ushs M
Interest income earned on advances to employees and directors / companies connected to directors 1,191 2,505
c) Deposits by directors - Group
2020 2019
Ushs M Ushs M
At 1 January 136 25
Net increase/(decrease) 515 111
At 31 December 651 136
The interest expense thereon is Ushs 0.5 million (2019: Ushs 0.5 million).
d) Loans to directors - Group
The loans to directors indicated on page 1 amount to Ushs 1,336 million (2019: Ushs 1,466 million) at interest rates ranging from 8% to 10%. These facilities were performing as of 31 December 2020 and 2019.
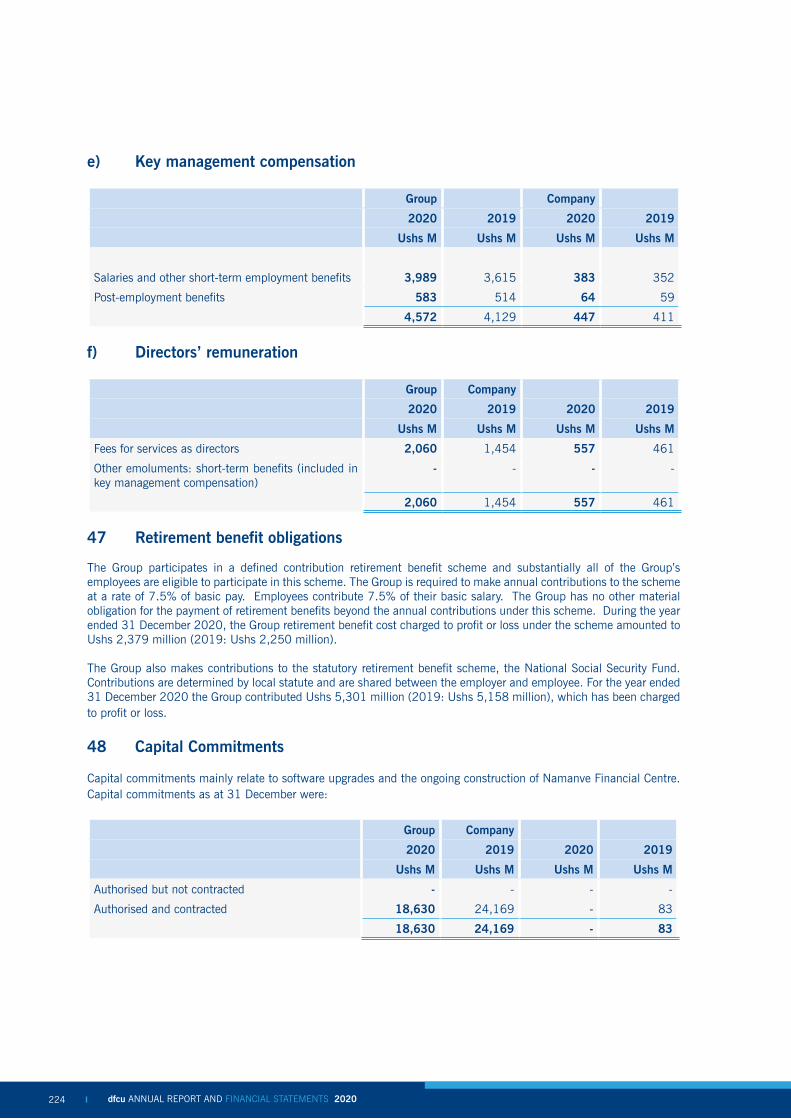
dfcu ANNUAL REPORT AND FINANCIAL STATEMENTS 2020 dfcu ANNUAL REPORT AND FINANCIAL STATEMENTS 2020 225224
e) Key management compensation
Group Company
2020 2019 2020 2019
Ushs M Ushs M Ushs M Ushs M
Salaries and other short-term employment benefits 3,989 3,615 383 352
Post-employment benefits 583 514 64 59
4,572 4,129 447 411
f) Directors’ remuneration
Group Company
2020 2019 2020 2019
Ushs M Ushs M Ushs M Ushs M
Fees for services as directors 2,060 1,454 557 461
Other emoluments: short-term benefits (included in key management compensation)
- - - -
2,060 1,454 557 461
47 Retirement benefit obligations
The Group participates in a defined contribution retirement benefit scheme and substantially all of the Group’s employees are eligible to participate in this scheme. The Group is required to make annual contributions to the scheme at a rate of 7.5% of basic pay. Employees contribute 7.5% of their basic salary. The Group has no other material obligation for the payment of retirement benefits beyond the annual contributions under this scheme. During the year ended 31 December 2020, the Group retirement benefit cost charged to profit or loss under the scheme amounted to Ushs 2,379 million (2019: Ushs 2,250 million).
The Group also makes contributions to the statutory retirement benefit scheme, the National Social Security Fund. Contributions are determined by local statute and are shared between the employer and employee. For the year ended 31 December 2020 the Group contributed Ushs 5,301 million (2019: Ushs 5,158 million), which has been charged to profit or loss.
48 Capital Commitments
Capital commitments mainly relate to software upgrades and the ongoing construction of Namanve Financial Centre. Capital commitments as at 31 December were:
Group Company
2020 2019 2020 2019
Ushs M Ushs M Ushs M Ushs M
Authorised but not contracted - - - -
Authorised and contracted 18,630 24,169 - 83
18,630 24,169 - 83
dfcu ANNUAL REPORT AND FINANCIAL STATEMENTS 2020 dfcu ANNUAL REPORT AND FINANCIAL STATEMENTS 2020 225224
49 Covid-19 Pandemic
The World Health Organisation declared coronavirus and COVID-19 a global health emergency on 30 January 2020. On 18 March 2020, the Government of Uganda announced lockdown and restrictions as a counter-measure against the spreading of COVID-19. By the year-end, some of the restrictions had been eased. As an essential service provider, the Group continued operations during the lockdown period but with some restrictions arising from the local and global disruptions caused by the pandemic. These include market, services and supply chain disruptions, non-performance by counter parties, unavailability of key people resources, inability to access some locations, among others.
Use of estimates and judgements
As disclosed in note 3, there have been no material revisions to the nature and estimates of amounts reported in prior periods. However, the effects of COVID-19 have required significant judgments and estimates to be made, including:
• Determining which information obtained subsequent to period end provides evidence of conditions that existed as at the end of the reporting period (‘adjusting events after the reporting period’) and which do not (‘non-adjusting events after the reporting period’).
• Estimates of expected credit losses attributable to accounts receivable arising from energy sales to customers on credit terms, including the incorporation of forward-looking information to supplement historical credit loss rates.
Use of assumptions
The COVID-19 pandemic continued to affect the Group, countries and businesses at the time of issuing these financial statements. The directors expect that considering that the Group is an essential service provider, the Group’s operations will continue despite the disruption caused by the pandemic. The directors have also assessed that:
• No adjusting events or conditions existed at the reporting date affecting the financial statements.
• The going concern status of the Group will not
be affected by this event in the foreseeable future and the Group will continue to operate as a going concern. The Group’s management and directors are closely monitoring the economic developments
in the key sectors including undertaking scenario analysis. This enables the Group’s management and directors to take appropriate actions where necessary, including enhanced monitoring and/or reducing limits and exposures.
• Management will continue to closely monitor
customer segments to ensure that exposures are mitigated.
• There are no conditions that would warrant
impairment of non-financial assets.
It is reasonably possible, based on existing knowledge, that outcomes within the next financial period that are different from the judgements and assumptions used, could require a material adjustment to the carrying amounts of the assets or liabilities reported in these financial statements. The directors and management will continue to monitor the measures taken by the Government of Uganda and adjust the Group’s business strategies and plans accordingly.
As the COVID-19 pandemic evolves, the Group has continued implementing the following measures to address minimise the impact.
Measures• The Group circulated to staff detailed guidelines
as part of dfcu’s COVID-19 response. These serve as a quick guide for employees to access all COVID-19 health and safety information, Standard Operating Procedures (SOPs) and processes. Adherence to these SOPs including Ministry of Health guidelines is being enforced in the Group.
• To further achieve adherence to SOPs and in compliance with Ministry of Health guidelines, all staff have been equipped with protective gear for their safety and for the safety of our customers. Sanitizers, thermometer guns and hand washing facilities are available and being used at all Group premises.
• Sensitization, surveys and online engagements regarding COVID-19 guidelines are being done regularly for both staff and customers.
• Close monitoring of staff welfare and health is being done, where COVID-19 cases have been confirmed amongst staff, quick medical assistance has been and continues to be availed. In such cases, further measures in line with COVID-19 guidelines are immediately implemented to mitigate spread of the virus to other staff and customers.

dfcu ANNUAL REPORT AND FINANCIAL STATEMENTS 2020 dfcu ANNUAL REPORT AND FINANCIAL STATEMENTS 2020 227226
Economic activities
• In the business fraternity and in partnership with Deloitte & Touche, dfcu Group led the conversation on the impact of COVID-19 on business operations; which empowered customers to remain afloat in the economic turbulent times.
• To reduce traffic in branches, customers are being encouraged to make use of digital channels, Agent Banking and to take advantage of the recently installed Deposit Cash ATMs.
• For customers whose businesses have been negatively impacted by the pandemic, the Group has proactively reached out to them to renegotiate and restructure their loan facilities as per the BOU guidelines.
Financing
The Group is not planning to source for any funding outside the normal business as usual activities in relation to COVID 19. There have been no amendments or waivers of covenants agreed with the lenders to accommodate any Covid-19 related concerns.
In line with ongoing international response to the COVID 19 crisis, dfcu Group recognizes
the significance of maintaining business continuity and has therefore embedded specific COVID-19 responses into the business continuity management framework to mitigate the impact of the pandemic businesses, employees and customers. Crisis Management Meetings headed by the Chief Executive Officer continue to be held for coordination of several work streams within the Group to address challenges related to the pandemic as and when they emerge.
50 Events after reporting date
There are no events after the reporting date that require disclosure in these financial statements.
51 Presentation currency
These consolidated and separate financial statements are presented in Uganda shillings rounded off to the nearest millions (Ushs M).
:

dfcu ANNUAL REPORT AND FINANCIAL STATEMENTS 2020 dfcu ANNUAL REPORT AND FINANCIAL STATEMENTS 2020 227226

dfcu ANNUAL REPORT AND FINANCIAL STATEMENTS 2020 dfcu ANNUAL REPORT AND FINANCIAL STATEMENTS 2020 PB228
Head Office: Plot 26 Kyadondo RoadTelephone: +256 (0) 312 300 152Website: www.dfculimited.comEmail address [email protected]