NREL RESILIENCE ANALYSIS & PARTNERSHIPS WITH LOCAL …
14
NREL RESILIENCE ANALYSIS & PARTNERSHIPS WITH LOCAL GOVERNMENTS Jeffrey J. Cook PhD Energy Analyst [email protected]
Transcript of NREL RESILIENCE ANALYSIS & PARTNERSHIPS WITH LOCAL …

NREL RESIL IENCE ANALYSIS &
PARTNERSHIPS WITH LOCAL
GOVERNMENTS
Jeffrey J. Cook PhD
Energy Analyst

NREL | 2
National economic impact
facilities, renowned technology experts
World-classwith industry,
academia, and government
Partnershipsoperates as a
living laboratory
Campus National economic
impact
National Renewable Energy Laboratory (NREL)
$872Mannually
1,800
Employees,
early-career researchers and visiting scientists
\
nearly
750National economic impact
plus more than
400

Disaster Recovery at NREL• NREL’s disaster recovery work has led to a deeper
understanding of resilience and how it can be built into nearly every project at the laboratory.
➤ Galena, AK
• Replacing 6, inherited diesel generators with more efficient generators and a biomass plant after NREL’s assessment of their energy system. They’ve also changed a substation and are replacing an overhead line to reduce transmission and distribution losses along their grid infrastructure.
➤New Jersey
• Has been implementing NREL’s recommendations through an Energy Resilience Bank which is funding alternative/RE technologies for critical infrastructure and assessment of facilities in the state.

“the ability to anticipate, prepare
for, and adapt to changing
conditions and withstand,
respond to, and recover rapidly
from disruptions through
adaptable and holistic planning
and technical solutions”.
WHAT IS RESIL IENCE?

“the ability to anticipate, prepare
for, and adapt to changing
conditions and withstand,
respond to, and recover rapidly
from disruptions through
adaptable and holistic planning
and technical solutions”.
WHAT IS RESIL IENCE?

NREL | 6
Technical Resilience Navigator

NREL | 7
Resilience Assessment and Data Explorer (RADE)
To help with risk assessments, solution identification, and solution prioritization NREL is developing the RADE tool:
• Identify hazards and threats
• Assess vulnerabilities
• Determine potential impacts
• Identify technical solutions
• Rank solutions

NREL | 8
Quantifying Resilience with REopt: Days of Survivability
Generator Solar PV Storage Lifecycle Cost Outage
1. Base case 2.5 MW - - $20 million 5 days
2. Lowest cost solution 2.5 MW 625 kW 175 kWh $19.5 million 6 days
3. Proposed system 2.5 MW 2 MW 500 kWh $20 million 9 days
0%
20%
40%
60%
80%
100%
1 2 3 4 5 6 7 8 9 10 11 12 13 14Pro
bab
ility
of S
urv
ivin
g O
uta
ge
[%]
Length of Outage [Days]
K. Anderson et al., “Increasing Resiliency Through Renewable Energy Microgrids”. SCTE Journal of Energy Management Vol.2 (2) August 2017 pp.22-38. https://www.nrel.gov/docs/fy17osti/69034.pdf

RESIL IENT ENERGY SYSTEM
ANALYSIS IN COASTAL NC
NREL | 10
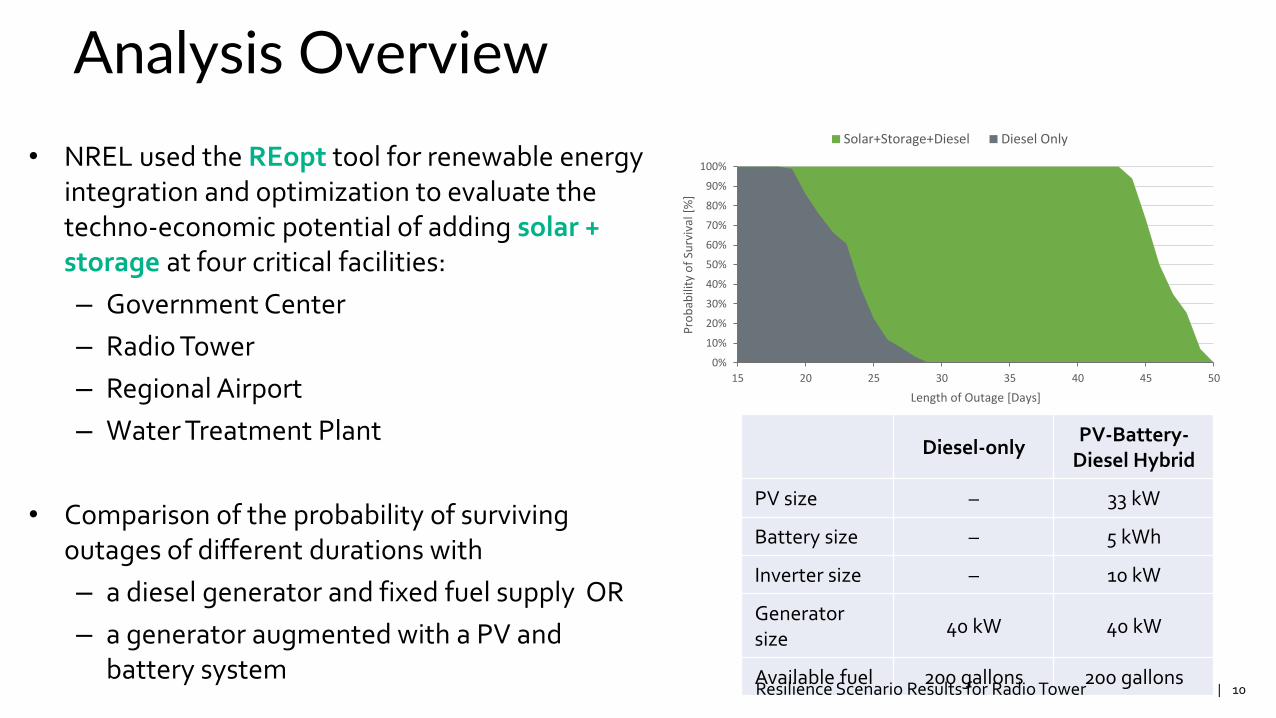
Analysis Overview
• NREL used the REopt tool for renewable energy integration and optimization to evaluate the techno-economic potential of adding solar + storage at four critical facilities:
– Government Center
– Radio Tower
– Regional Airport
– Water Treatment Plant
• Comparison of the probability of surviving outages of different durations with
– a diesel generator and fixed fuel supply OR
– a generator augmented with a PV and battery system
0%
10%
20%
30%
40%
50%
60%
70%
80%
90%
100%
15 20 25 30 35 40 45 50
Pro
bab
ility
of
Surv
ival
[%
]
Length of Outage [Days]
Solar+Storage+Diesel Diesel Only
Diesel-onlyPV-Battery-
Diesel Hybrid
PV size – 33 kW
Battery size – 5 kWh
Inverter size – 10 kW
Generator size
40 kW 40 kW
Available fuel 200 gallons 200 gallonsResilience Scenario Results for Radio Tower

NREL | 11
PV Installation Economical
• Deploying PV is economical at all four critical facilities, providing electricity bill savings during normal operation.
• When available, participation in net metering programs improves the net present value of PV, resulting in larger optimal PV sizes.
Summary Results for Certain PV Systems by Facility
Barco
Radio
Tower
Cape Hatteras
Water Treatment
Plant (full site)
Cape Hatteras
Water Treatment
Plant
(RO #4)
Currituck
County Regional
Airport
Hyde County
Government
Center
PV size (kW) 28.66 361.95 76.20 34 50
Battery size
(kWh) 0 0 0 0 0
Existing
Generator Size
(kW)
40 1530 100 0 135
Net present
value ($) $13,421 $201,540 $54,038 $11,720 $38,380
Life-cycle
savings (%) 16.3% 4.3% 1.2% 12.3% 2.0%
NREL | 12
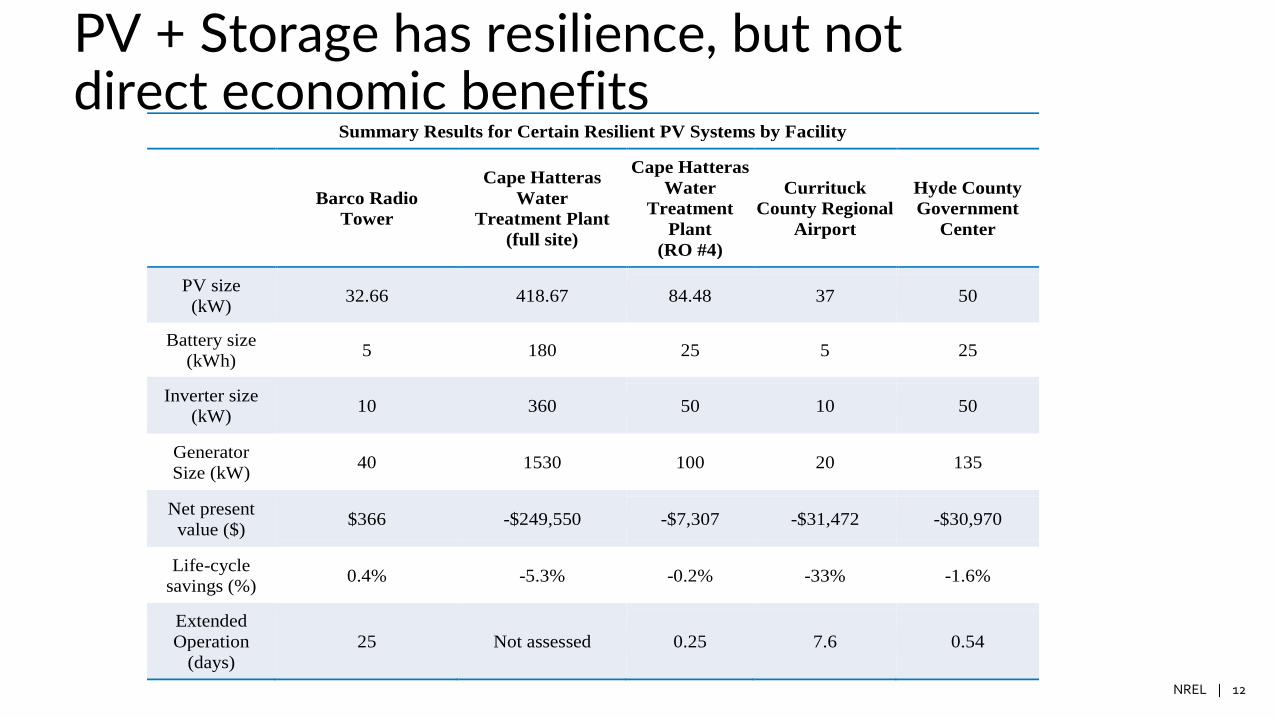
PV + Storage has resilience, but not direct economic benefits
Summary Results for Certain Resilient PV Systems by Facility
Barco Radio
Tower
Cape Hatteras
Water
Treatment Plant
(full site)
Cape Hatteras
Water
Treatment
Plant
(RO #4)
Currituck
County Regional
Airport
Hyde County
Government
Center
PV size
(kW) 32.66 418.67 84.48 37 50
Battery size
(kWh) 5 180 25 5 25
Inverter size
(kW) 10 360 50 10 50
Generator
Size (kW) 40 1530 100 20 135
Net present
value ($) $366 -$249,550 -$7,307 -$31,472 -$30,970
Life-cycle
savings (%) 0.4% -5.3% -0.2% -33% -1.6%
Extended
Operation
(days)
25 Not assessed 0.25 7.6 0.54

NREL | 13
Financing Considerations
• Public-private partnerships• Partnerships with federal and private sector
facilities
• Grant funding• FEMA hazard mitigation grants
• Municipal franchise funding
• Bond funding• Resilience bonds
0
50
100
150
200
250
300
350
Undergroundinginfrastructure
Streetlighting Energy Efficiency Renewable Energy OtherR
efer
ence
s