Ultimate Bearing Capacity of Soft Clays Reinforced by a Group of Columns
Residual Load Bearing Capacity of Reinforced Concrete Framesafter FireMohammad Mahdi Raouffard , Minehiro Nishiyama
Journal of Advanced Concrete Technology, volume ( ), pp.14 2016 625-633
An advanced transient concrete model for the determination of restraint in concrete structures subjectedto fireMartin Schneider , Ulrich SchneiderJournal of Advanced Concrete Technology, volume ( ), pp.7 2009 403-413
Fire Behaviour of Circular Concrete Columns with Restrained Thermal ElongationJoao Paulo C. Rodrigues , Luis Laim Manfred Korzen,Journal of Advanced Concrete Technology, volume ( ), pp.12 2014 289-298
Flexural behavior of fire-damaged reinforced concrete slabs repaired with near-surfaced mounted (NSM)carbon fiber reinforced polymer (CFRP) rodsCao Nguyen Thi, Withit Pansuk Lluis Torres,Journal of Advanced Concrete Technology, volume ( ), pp.13 2015 15-29
Fire Resistance of Reinforced Concrete Frames Subjected to Service Load: Part 1. Experimental StudyMohammad Mahdi Raouffard, Minehiro NishiyamaJournal of Advanced Concrete Technology, volume ( ), pp.13 2015 554-563

Journal of Advanced Concrete Technology Vol. 14, 625-633, October 2016 / Copyright © 2016 Japan Concrete Institute 625
Scientific paper
Residual Load Bearing Capacity of Reinforced Concrete Frames after Fire Mohammad Mahdi Raouffard1* and Minehiro Nishiyama2
Received 16 March 2016, accepted 9 October 2016 doi:10.3151/jact.14.625
Abstract Estimating the residual strength of fire-exposed reinforced concrete (RC) structures is of great importance in determin-ing whether the cooled structure is safely functional or immediate repair is needed. This paper describes the results of experimental and numerical investigations on fire and post-fire structural responses of a 2-story moment-resisting RC frame test specimen. The lower story of the test specimen, which was subjected to service loads, was heated for 60 min-utes in accordance with the ISO-834 standard fire test. The test specimen exhibited a satisfactory structural performance during the fire course and considerably recovered much of its pre-fire deflection state when cooled. To investigate the re-serviceability and residual load bearing capacity of the cooled test specimen, a destructive cyclic vertical loading was conducted. A detailed 2D finite element model was developed as well. By comparing the test and analysis results, it was found that due to the fire damage the test specimen lost 30% of its load bearing capacity. The proposed numerical mod-elling approach in this study predicted considerably well the post-fire residual strength of the test specimen.
1. Introduction
The destructive impact of building fires on post-fire structural performance of RC building structures has always been a matter of concern among building users, city authorities, and fire safety structural engineers. In-stallation of fire safety equipment, thermally insulating structural elements, and performing effective fire-extinguishing efforts can considerably contribute to pre-serving the pre-fire structural performance of the cooled structural elements. Technical reports on previous fire incidents in RC buildings and fire tests on RC structures have proven that the conventional seismic design guide-lines integrated with the prescriptive fire-resistive de-sign tables could well satisfy the required fire ratings indicated in the codes (Bailey 2002; Xiao 2008; Fang et al. 2012; Bisby et al. 2014; Raouffard and Nishiyama 2015). Such a superior fire-resistive performance of RC building structures is largely due to the excellent ther-mal barrier characteristics of concrete, i.e. relatively low thermal conductivity and high thermal capacity, which enables the structure to protect the embedded rein-forcements and core concrete. Nevertheless, as a result of severe fire exposures the building structure could experience significant reductions in strength and stiff-ness. Recovery of pre-fire structural response is largely depending on the extent of damage to concrete and steel reinforcing bars during fire and cooling stages. Previous
research by Japanese Society of Steel Construction (1969) has shown that steel reinforcements below 600℃ can almost fully recover their pre-fire mechanical prop-erties. On the other hand, it has been experimentally proven by Morita et al. (2000) that concrete does not only naturally recover its strength, but also exhibits ex-tra 10 to 20 % strength loss in following days after fire.
Such reductions in strength and stiffness of the cooled concrete are attributed to the occurrence of a series of irreversible chemical and physical changes in cement paste and aggregate of concrete hinders concrete strength recovery. Therefore, it is rational to expect a certain degree of loss in stiffness and load bearing per-formance of fire-exposed RC structures when cooled.
Estimating the abovementioned structural impact of fire damage on RC building structures after extinguish-ing the fire is a challenging task. The importance of this task is highlighted when the outcome estimation deter-mines whether the structure is safely functional or im-mediate repair (partially or thoroughly) is needed. Ac-cording to the in-place post-fire investigations by Alonso (2009), Anderberg (2009), and Venanzi et al. (2009), in most of the cases having known the most critical temperatures attained by the structural members and the extent of visible structural damages, an experi-enced fire safety structural engineer can issue a prelimi-nary safety judgement. However, performing accurate evaluation of the mechanical response of a cooled struc-ture requires further detailed investigations by means of either conducting destructive residual strength tests or numerical analysis or a combination of both. A number of experimental studies on post-fire residual load bear-ing capacity of reduced scaled RC structures can be found in the literature (Lin and Tsai 1990; El-Hawary et al. 1996; Lin et al. 1999; Jau and Huang 2008; Chen et al. 2009). Although the testing approach is the most
1PhD Candidate, Department of Architecture and Archi-tectural Engineering, Kyoto University, Kyoto, Japan.*Corresponding author, E-mail: [email protected] 2Professor, Department of Architecture and Architec-tural Engineering, Kyoto University, Kyoto, Japan.
M. M. Raouffard and M. Nishiyama / Journal of Advanced Concrete Technology Vol. 14, 625-633, 2016 626
reliable method, cost concerns and limitations in furnace space and loading facilities inevitably reduce the dimen-sion and/or boundary (support) conditions of the test specimens. Such inevitable limitations could in turn causes difficulties in drawing comprehensive compari-sons between the test and the real scale structures. On the other hand, owing to the development of numerical methods a great interest in employing such approaches for evaluating fire and post-fire structural responses of RC structures can be seen in the literature as well (Kodur 2010; Kodur and Agrawal 2016). These methods could be adopted as an alternative residual strength es-timation approach; however, as these methods are gen-erally developed and verified for isolated members ex-posed to standard fires, the produced results for com-pound structures such as in moment bearing frames should be analysed and handled with special care.
In this paper in an attempt to investigate the residual load bearing capacity of a cooled moment-bearing RC frame, the authors carried out the ISO-831 standard fire test (1999) on a 2-story compound test specimen sub-jected to service loads in the first place. The fire test ended in 60 minutes when the beam’s bottom longitudi-nal reinforcement bars of the test specimen exceeded the predefined critical temperature 500℃ in this study. Six months later, the cooled test specimen underwent a cy-clic residual strength test. As no identical test specimen was constructed for the purpose of measuring the ulti-mate load bearing capacity before heating, the pre-fire load bearing capacity of the test specimen was numeri-cally investigated through performing finite element (FE) analysis. By proposing an analytical framework in this study, the authors enabled the FE model to predict the residual structural response of the test specimen with considerably good accuracy.
2. Experimental program
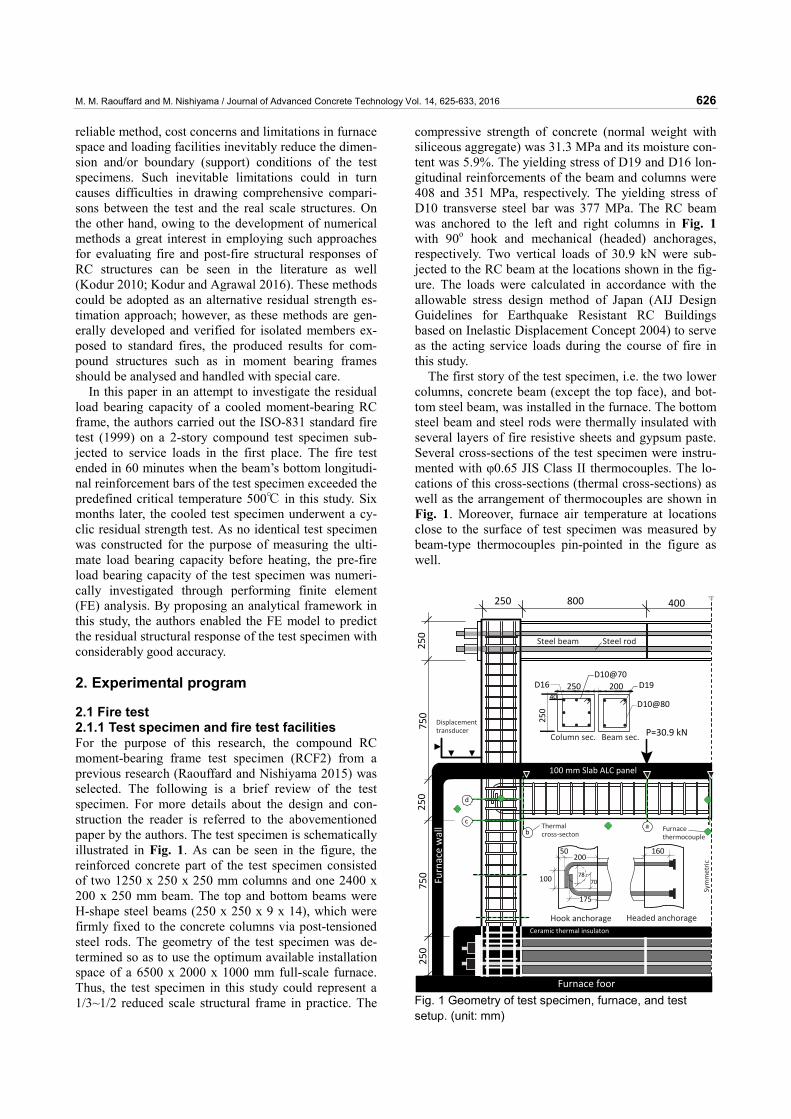
2.1 Fire test 2.1.1 Test specimen and fire test facilities For the purpose of this research, the compound RC moment-bearing frame test specimen (RCF2) from a previous research (Raouffard and Nishiyama 2015) was selected. The following is a brief review of the test specimen. For more details about the design and con-struction the reader is referred to the abovementioned paper by the authors. The test specimen is schematically illustrated in Fig. 1. As can be seen in the figure, the reinforced concrete part of the test specimen consisted of two 1250 x 250 x 250 mm columns and one 2400 x 200 x 250 mm beam. The top and bottom beams were H-shape steel beams (250 x 250 x 9 x 14), which were firmly fixed to the concrete columns via post-tensioned steel rods. The geometry of the test specimen was de-termined so as to use the optimum available installation space of a 6500 x 2000 x 1000 mm full-scale furnace. Thus, the test specimen in this study could represent a 1/3~1/2 reduced scale structural frame in practice. The
compressive strength of concrete (normal weight with siliceous aggregate) was 31.3 MPa and its moisture con-tent was 5.9%. The yielding stress of D19 and D16 lon-gitudinal reinforcements of the beam and columns were 408 and 351 MPa, respectively. The yielding stress of D10 transverse steel bar was 377 MPa. The RC beam was anchored to the left and right columns in Fig. 1 with 90o hook and mechanical (headed) anchorages, respectively. Two vertical loads of 30.9 kN were sub-jected to the RC beam at the locations shown in the fig-ure. The loads were calculated in accordance with the allowable stress design method of Japan (AIJ Design Guidelines for Earthquake Resistant RC Buildings based on Inelastic Displacement Concept 2004) to serve as the acting service loads during the course of fire in this study.
The first story of the test specimen, i.e. the two lower columns, concrete beam (except the top face), and bot-tom steel beam, was installed in the furnace. The bottom steel beam and steel rods were thermally insulated with several layers of fire resistive sheets and gypsum paste. Several cross-sections of the test specimen were instru-mented with φ0.65 JIS Class II thermocouples. The lo-cations of this cross-sections (thermal cross-sections) as well as the arrangement of thermocouples are shown in Fig. 1. Moreover, furnace air temperature at locations close to the surface of test specimen was measured by beam-type thermocouples pin-pointed in the figure as well.
750
750
250
250 400800
250
250
P=30.9 kN
Furnacethermocouple
100 mm Slab ALC panel
Thermalcross‐secton
D10@70
D10@80
Displacementtransducer
Symmetric
Hook anchorageCeramic thermal insulaton
Headed anchorage
Furnace foor
250
Column sec.
Steel beam Steel rod
20040
250
Beam sec.
D16 D19
175
100 7078
50200
160
Furnace wall
d
c
ba
Fig. 1 Geometry of test specimen, furnace, and test setup. (unit: mm)
M. M. Raouffard and M. Nishiyama / Journal of Advanced Concrete Technology Vol. 14, 625-633, 2016 627
2.1.2 Fire test and results Heating: 60 minutes before commencing the fire test, the concrete beam was gradually loaded to the design load level. After checking the stability and safety of the test specimen and test facilities the test specimen was once unloaded and reloaded prior to commencing the fire test. The furnace heated the test specimen in accor-dance with ISO-834 standard fire curve. Figure 5a shows a photo of the beam-column assembly of test specimen taken from 100x100 mm observation window of the furnace. The heating finished after approximately 60 minutes when the bottom tensile reinforcements of beam exceeded the predefined critical temperature, 500℃ , in this study. At this temperature steel rein-forcing bars exhibit 45% loss of room temperature yield strength (see Table 2). Beyond this temperature, a sim-ply supported RC beam carrying 50% of its bending moment capacity could hardly resist the flexural de-mands and fail.
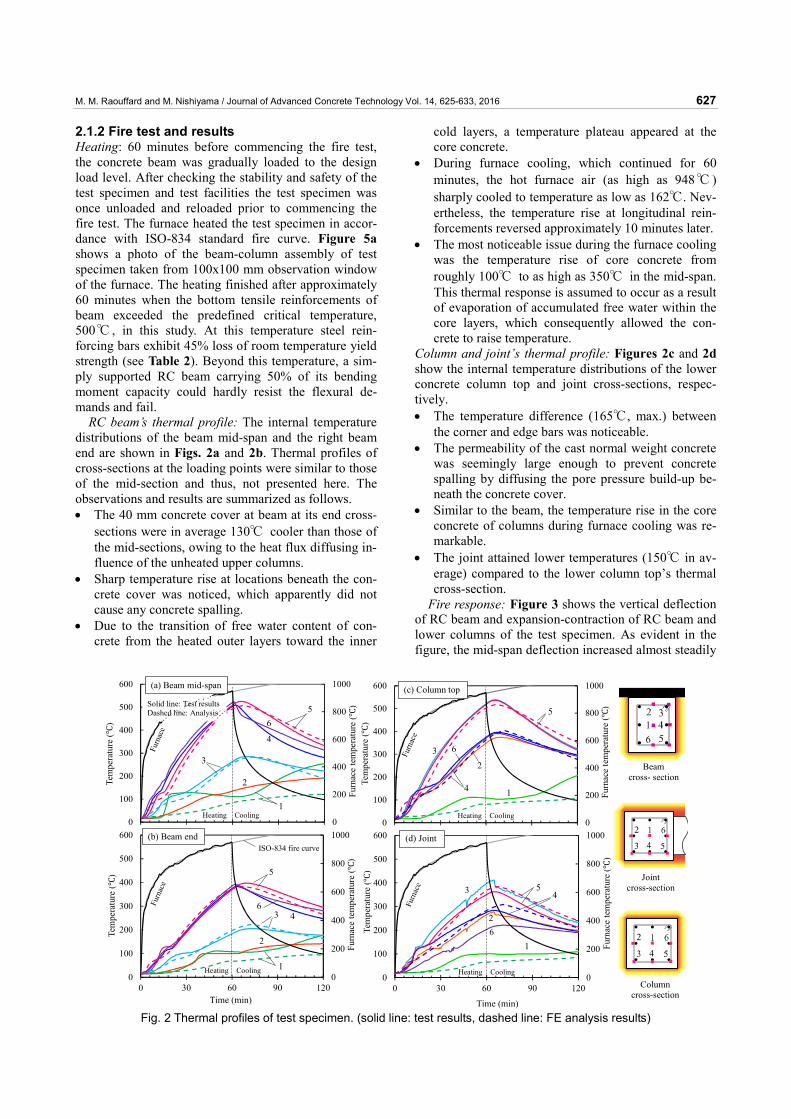
RC beam’s thermal profile: The internal temperature distributions of the beam mid-span and the right beam end are shown in Figs. 2a and 2b. Thermal profiles of cross-sections at the loading points were similar to those of the mid-section and thus, not presented here. The observations and results are summarized as follows. • The 40 mm concrete cover at beam at its end cross-
sections were in average 130℃ cooler than those of the mid-sections, owing to the heat flux diffusing in-fluence of the unheated upper columns.
• Sharp temperature rise at locations beneath the con-crete cover was noticed, which apparently did not cause any concrete spalling.
• Due to the transition of free water content of con-crete from the heated outer layers toward the inner
cold layers, a temperature plateau appeared at the core concrete.
• During furnace cooling, which continued for 60 minutes, the hot furnace air (as high as 948℃ ) sharply cooled to temperature as low as 162℃. Nev-ertheless, the temperature rise at longitudinal rein-forcements reversed approximately 10 minutes later.
• The most noticeable issue during the furnace cooling was the temperature rise of core concrete from roughly 100℃ to as high as 350℃ in the mid-span. This thermal response is assumed to occur as a result of evaporation of accumulated free water within the core layers, which consequently allowed the con-crete to raise temperature.
Column and joint’s thermal profile: Figures 2c and 2d show the internal temperature distributions of the lower concrete column top and joint cross-sections, respec-tively. • The temperature difference (165℃, max.) between
the corner and edge bars was noticeable. • The permeability of the cast normal weight concrete
was seemingly large enough to prevent concrete spalling by diffusing the pore pressure build-up be-neath the concrete cover.
• Similar to the beam, the temperature rise in the core concrete of columns during furnace cooling was re-markable.
• The joint attained lower temperatures (150℃ in av-erage) compared to the lower column top’s thermal cross-section.
Fire response: Figure 3 shows the vertical deflection of RC beam and expansion-contraction of RC beam and lower columns of the test specimen. As evident in the figure, the mid-span deflection increased almost steadily
0
200
400
600
800
1000
0
100
200
300
400
500
600
0 30 60 90 120
Furn
ace
tem
pera
ture
()
Tem
pera
ture
()
Time (min)
1
23
(c) Column top
Heating Cooling
4
6
5
0
200
400
600
800
1000
0
100
200
300
400
500
600
0 30 60 90 120
Furn
ace
tem
pera
ture
()
Tem
pera
ture
()
Time (min)
1
3
6
4
2
5
(d) Joint
Heating Cooling
0
200
400
600
800
1000
0
100
200
300
400
500
600
0 30 60 90 120
Furn
ace
tem
pera
ture
()
Tem
pera
ture
()
Time (min)
2
6
4
(a) Beam mid-span
Heating Cooling
5
1
3
Solid line: Test resultsDashed line: Analysis
0
200
400
600
800
1000
0
100
200
300
400
500
600
0 30 60 90 120
Furn
ace
tem
pera
ture
()
Tem
pera
ture
()
Time (min)
1
2
46
5
3
(b) Beam end
Heating Cooling
ISO-834 fire curve
Joint cross-section
Column cross-section
Beam cross- section
Fig. 2 Thermal profiles of test specimen. (solid line: test results, dashed line: FE analysis results)
M. M. Raouffard and M. Nishiyama / Journal of Advanced Concrete Technology Vol. 14, 625-633, 2016 628
under the fire exposure and peaked at 19.02 mm ap-proximately 10 minutes during the furnace cooling. Fol-lowing that, a relatively slow deflection recovery was observed. Although the tensile reinforcements of the beam’s mid-sections exceeded the critical temperature 500℃, the test specimen could satisfactory sustain the vertical loads. The detrimental impact of fire damage to the beam was noticeably compensated by the axial and rotational restraints at the beam ends. The former in-creased the flexural moment capacity of the beam by self-generated prestressing forces and the latter bene-fited the beam to encounter the mid-span deflection. Meanwhile, the side columns and joints could appar-ently bear the external demands imposed by the beam.
2.2 Post-fire residual load bearing capacity test As it was mentioned earlier, the first sign of strength recovery of the test specimen was the reverse deflection of the RC beam. Strength recovery of the embedded steel bars is attributed to such structural response during cooling phase. However, the beam was unlikely to fully bounce back to its pre-fire deflection state due to the extensive accommodated crack damages, irrecoverable compressive strength loss of concrete, and deterioration of bond strength between the steel bars and concrete.
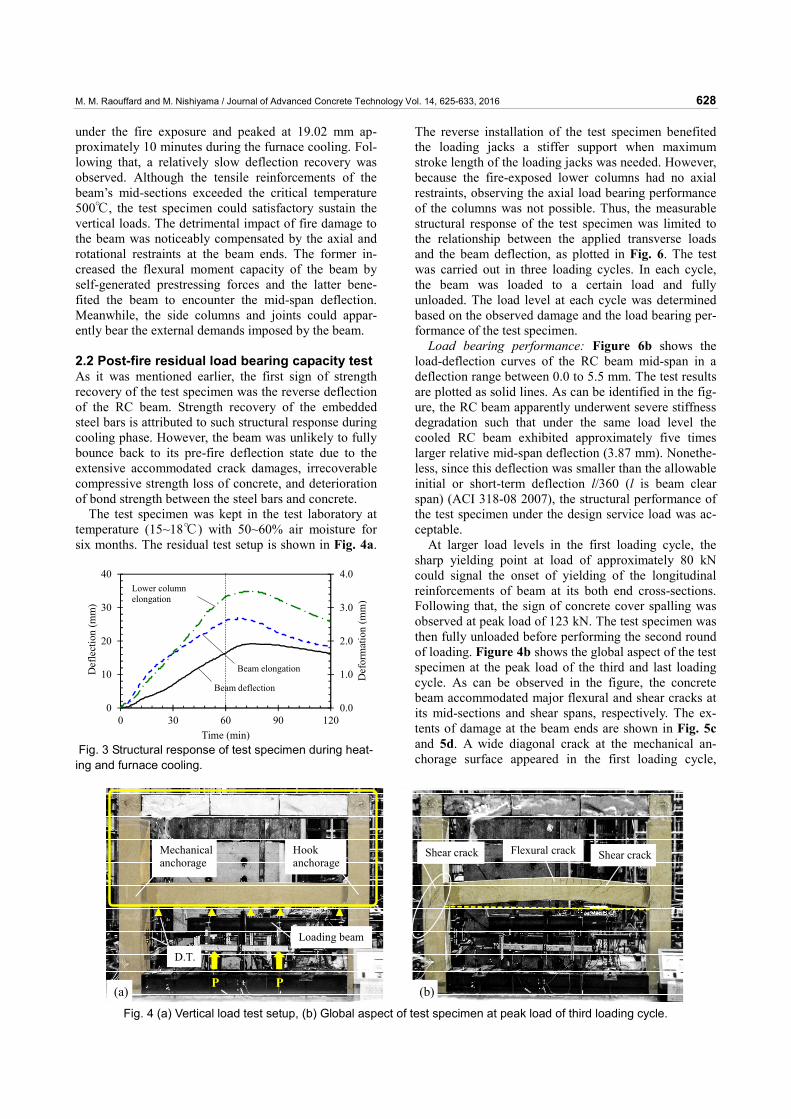
The test specimen was kept in the test laboratory at temperature (15~18℃) with 50~60% air moisture for six months. The residual test setup is shown in Fig. 4a.
The reverse installation of the test specimen benefited the loading jacks a stiffer support when maximum stroke length of the loading jacks was needed. However, because the fire-exposed lower columns had no axial restraints, observing the axial load bearing performance of the columns was not possible. Thus, the measurable structural response of the test specimen was limited to the relationship between the applied transverse loads and the beam deflection, as plotted in Fig. 6. The test was carried out in three loading cycles. In each cycle, the beam was loaded to a certain load and fully unloaded. The load level at each cycle was determined based on the observed damage and the load bearing per-formance of the test specimen.
Load bearing performance: Figure 6b shows the load-deflection curves of the RC beam mid-span in a deflection range between 0.0 to 5.5 mm. The test results are plotted as solid lines. As can be identified in the fig-ure, the RC beam apparently underwent severe stiffness degradation such that under the same load level the cooled RC beam exhibited approximately five times larger relative mid-span deflection (3.87 mm). Nonethe-less, since this deflection was smaller than the allowable initial or short-term deflection l/360 (l is beam clear span) (ACI 318-08 2007), the structural performance of the test specimen under the design service load was ac-ceptable.
At larger load levels in the first loading cycle, the sharp yielding point at load of approximately 80 kN could signal the onset of yielding of the longitudinal reinforcements of beam at its both end cross-sections. Following that, the sign of concrete cover spalling was observed at peak load of 123 kN. The test specimen was then fully unloaded before performing the second round of loading. Figure 4b shows the global aspect of the test specimen at the peak load of the third and last loading cycle. As can be observed in the figure, the concrete beam accommodated major flexural and shear cracks at its mid-sections and shear spans, respectively. The ex-tents of damage at the beam ends are shown in Fig. 5c and 5d. A wide diagonal crack at the mechanical an-chorage surface appeared in the first loading cycle,
0.0
1.0
2.0
3.0
4.0
0
10
20
30
40
0 30 60 90 120
Def
orm
atio
n (m
m)
Def
lect
ion
(mm
)
Time (min)
Beam deflection
Beam elongation
Lower column elongation
Fig. 3 Structural response of test specimen during heat-ing and furnace cooling.
(a)
D.T.
Loading beam
Flexural crack Shear crackShear crack Hook anchorage
Mechanicalanchorage
P (b)
P
Fig. 4 (a) Vertical load test setup, (b) Global aspect of test specimen at peak load of third loading cycle.
M. M. Raouffard and M. Nishiyama / Journal of Advanced Concrete Technology Vol. 14, 625-633, 2016 629
which extended to the upper column in the subsequent loading levels. On the other hand, the hook anchorage could apparently well sustain the integrity of the joint.
3. Numerical analysis
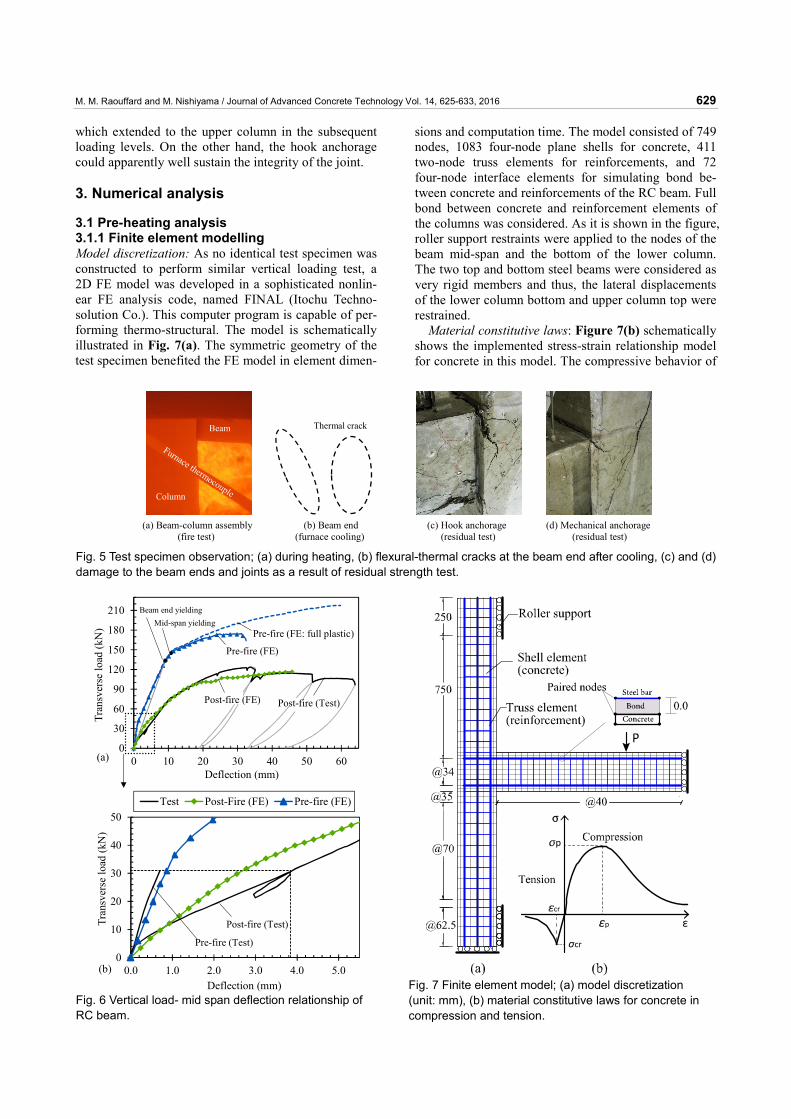
3.1 Pre-heating analysis 3.1.1 Finite element modelling Model discretization: As no identical test specimen was constructed to perform similar vertical loading test, a 2D FE model was developed in a sophisticated nonlin-ear FE analysis code, named FINAL (Itochu Techno-solution Co.). This computer program is capable of per-forming thermo-structural. The model is schematically illustrated in Fig. 7(a). The symmetric geometry of the test specimen benefited the FE model in element dimen-
sions and computation time. The model consisted of 749 nodes, 1083 four-node plane shells for concrete, 411 two-node truss elements for reinforcements, and 72 four-node interface elements for simulating bond be-tween concrete and reinforcements of the RC beam. Full bond between concrete and reinforcement elements of the columns was considered. As it is shown in the figure, roller support restraints were applied to the nodes of the beam mid-span and the bottom of the lower column. The two top and bottom steel beams were considered as very rigid members and thus, the lateral displacements of the lower column bottom and upper column top were restrained.
Material constitutive laws: Figure 7(b) schematically shows the implemented stress-strain relationship model for concrete in this model. The compressive behavior of
Column
Beam Thermal crack
(a) Beam-column assembly(fire test)
(b) Beam end(furnace cooling)
(c) Hook anchorage (residual test)
(d) Mechanical anchorage (residual test)
Fig. 5 Test specimen observation; (a) during heating, (b) flexural-thermal cracks at the beam end after cooling, (c) and (d) damage to the beam ends and joints as a result of residual strength test.
0
10
20
30
40
50
0.0 1.0 2.0 3.0 4.0 5.0
Tran
sver
se lo
ad (k
N)
Deflection (mm)
Test Post-Fire (FE) Pre-fire (FE)
(b)
Post-fire (Test)
Pre-fire (Test)
0
30
60
90
120
150
180
210
0 10 20 30 40 50 60
Tran
sver
se lo
ad (k
N)
Deflection (mm)
Pre-fire (FE: full plastic)
(a)
Pre-fire (FE)
Mid-span yieldingBeam end yielding
Post-fire (FE) Post-fire (Test)
Fig. 6 Vertical load- mid span deflection relationship of RC beam.
p
cr
p
cr
Fig. 7 Finite element model; (a) model discretization (unit: mm), (b) material constitutive laws for concrete in compression and tension.

M. M. Raouffard and M. Nishiyama / Journal of Advanced Concrete Technology Vol. 14, 625-633, 2016 630
concrete was modeled based on the modified Ahmad stress-strain model (recited in Naganuma 1999), de-noted as
2
2
[ . ( 1). ]1 ( 2) .
PA X D XA X D X
σσ
+ −=
+ − + (1)
0 / PA E E= (1-a)
/ for
( / ) forP P
nP P
Xε ε ε ε
ε ε ε ε
⎧ <⎪= ⎨≥⎪⎩
(1-b)
219.6 1 for
1771 1 for
BP
B P
PP
B B
EE
Dε ε
σ
σε ε
σ σ
⎧ ⎛ ⎞⎪ − <⎜ ⎟⎪ ⎝ ⎠= ⎨
⎛ ⎞⎪ + − ≥⎜ ⎟⎪⎝ ⎠⎩
(1-c)
1771 1P
B B
nσ
σ σ⎛ ⎞
= + −⎜ ⎟⎝ ⎠
(1-d)
where σP and εP: stress and strain at the peak point un-der multi axial stress, respectively, σB: uniaxial com-pressive strength, E0: the elastic modulus and EB & EP: secant moduli corresponding to σP and σB, respectively.
Strain εP in the above equations was calculated based on Amemiya and Noguchi (1990) proposed equation, which is expressed as
6(0.134 1690) 10P Pε σ −= + × (2)
For the failure in biaxial compression Kupfer-Gerstle (1973) failure criterion was adopted. The stress-strain relationship of concrete in tension was assumed to be linear elastic up to the concrete tensile strength at which beyond this point concrete cracks. The tension stiffening model proposed by Izumo (1987) in Eq. (3) was used to formulate the nonlinear decreasing tensile branch. By using a smeared crack model the abovementioned post-crack behavior of concrete was taken into account.
/ ( / )ct cr cr tε ε ε ε= (3)
where σt: tensile stress of concrete, σcr: tensile strength under biaxial loading, εcr: average tensile strain when crack occurs, εt: average tensile strain in the direction perpendicular to crack and c: a factor accounting for the tension stiffening phenomenon (c=0.4 in this study).
The steel reinforcement model was a bilinear model with 0.01% slope strain hardening, denoted as
0.01( )s y
y y y
Eσ σ
σ σ
ε ε εσ
σ ε ε ε ε
<⎧⎪= ⎨ + − ≥⎪⎩ (4)
where Es is modulus of steel elasticity, σy is yield stress, and εy is yield strain.
The bond element in this study was considered to
solely bear shear stress between concrete and steel ele-ments. The employed bond stress-slip relationship, which is recommended by fib Code Model (2010), was consisted of an ascending branch until reaching slip s1 at bond strength and a constant bond strength plateau at larger slip values, defined as
0.4max 1 1
max 1
( / ) 0s s s ss s
ττ
τ⎧ ≤ <⎪= ⎨
≤⎪⎩ (5)
where τ and s are bond stress and slip, respectively. In Eq. (5) based on the recommendation by fib Code
Model (2010), bond strength maxτ and slip s1 were de-fined as 2.5 Bσ and 1.0 mm, respectively.
3.1.2 FE results and discussion The analysis results are plotted in Figs. 6a and 6b. The initial load-deflection curve of the pre-fire loading test is plotted in Fig. 6b. Good agreement between the pre-fire loading test and analysis results can be seen. At larger load levels of 133 and 144 kN the analysis results showed the onset of tensile reinforcements yielding at beam ends and mid-span, respectively. At larger deflec-tions the FE model exhibited concrete softening behav-ior until the model could no longer sustain the excessive numerical instabilities. Based on the FE results, the test specimen could lose approximately 50% and 30% of its stiffness and load bearing strength, respectively. The term stiffness here is defined as the line connecting the zero load-deflection state to the load and deflection at which the beam ends yielded. The dashed curve in the figure (Pre-fire: FE full plastic) represents the analysis results in which the softening behavior of concrete in compression after exceeding compressive strength was neglected and instead, full plastic model was adopted. Although this material modeling approach resulted in minor numerical instabilities, at deflections greater than 20 mm considerably large discrepancies between the two curves occurred. Thus, to avoid overestimated pre-dictions employing robust material constitutive laws for concrete is recommended. 3.2 Post-heating analysis In order to evaluate the residual load carrying capacity of the cooled test specimen, equivalent temperature gra-dients of the test specimen were derived in the first place. By doing this, the non-uniform 3D temperature gradients of the test specimen at different cross-sections were equalized to a series of representative 2D equiva-lent temperature curves. To do so, the recorded internal temperature distributions of the test specimen were combined with the analytical thermal contours derived from 3D thermal analysis on this section. Having calcu-lated the equivalent temperature distributions along the elevations of the cross-sections, the authors assigned appropriate material properties to the previously devel-oped model in this study. As a result, the modified FE model could produce very satisfactory results.
M. M. Raouffard and M. Nishiyama / Journal of Advanced Concrete Technology Vol. 14, 625-633, 2016 631
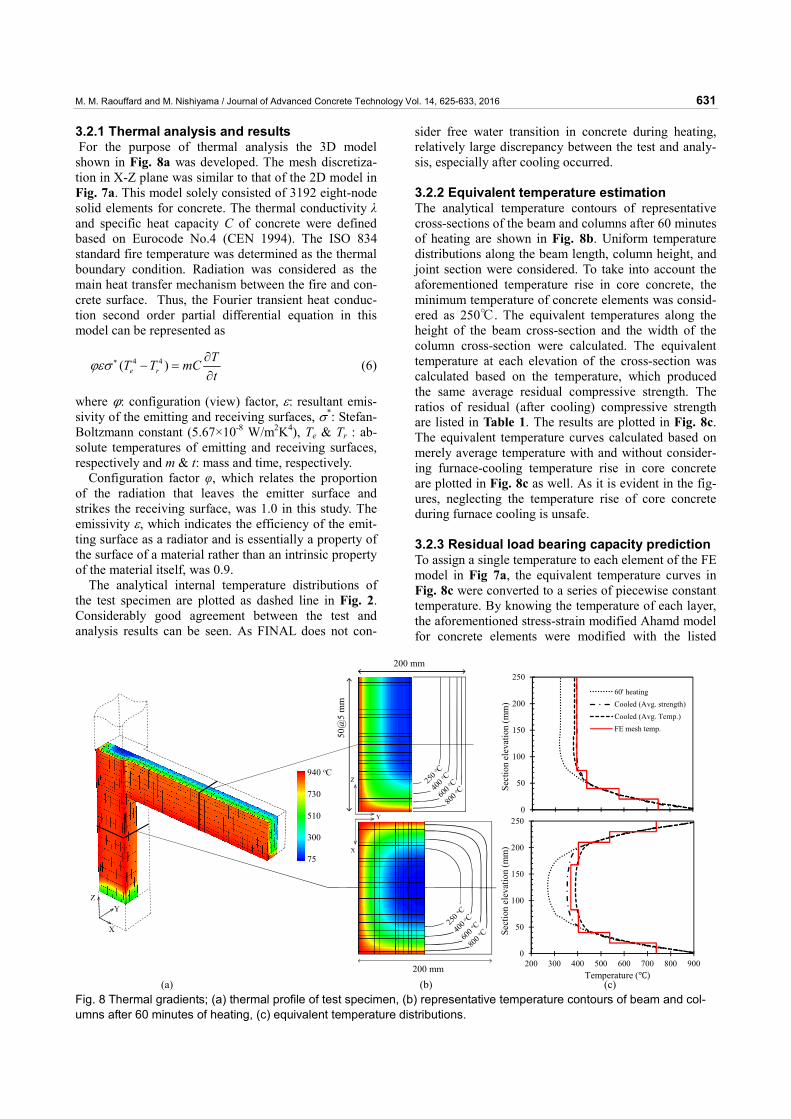
3.2.1 Thermal analysis and results For the purpose of thermal analysis the 3D model shown in Fig. 8a was developed. The mesh discretiza-tion in X-Z plane was similar to that of the 2D model in Fig. 7a. This model solely consisted of 3192 eight-node solid elements for concrete. The thermal conductivity λ and specific heat capacity C of concrete were defined based on Eurocode No.4 (CEN 1994). The ISO 834 standard fire temperature was determined as the thermal boundary condition. Radiation was considered as the main heat transfer mechanism between the fire and con-crete surface. Thus, the Fourier transient heat conduc-tion second order partial differential equation in this model can be represented as
4 4( )e rTT T mCt
ϕεσ ∗ ∂− =
∂ (6)
where φ: configuration (view) factor, ε: resultant emis-sivity of the emitting and receiving surfaces, σ*: Stefan-Boltzmann constant (5.67×10⁻⁸ W/m2K4), Te & Tr : ab-solute temperatures of emitting and receiving surfaces, respectively and m & t: mass and time, respectively.
Configuration factor φ, which relates the proportion of the radiation that leaves the emitter surface and strikes the receiving surface, was 1.0 in this study. The emissivity ε, which indicates the efficiency of the emit-ting surface as a radiator and is essentially a property of the surface of a material rather than an intrinsic property of the material itself, was 0.9.
The analytical internal temperature distributions of the test specimen are plotted as dashed line in Fig. 2. Considerably good agreement between the test and analysis results can be seen. As FINAL does not con-
sider free water transition in concrete during heating, relatively large discrepancy between the test and analy-sis, especially after cooling occurred.
3.2.2 Equivalent temperature estimation The analytical temperature contours of representative cross-sections of the beam and columns after 60 minutes of heating are shown in Fig. 8b. Uniform temperature distributions along the beam length, column height, and joint section were considered. To take into account the aforementioned temperature rise in core concrete, the minimum temperature of concrete elements was consid-ered as 250℃. The equivalent temperatures along the height of the beam cross-section and the width of the column cross-section were calculated. The equivalent temperature at each elevation of the cross-section was calculated based on the temperature, which produced the same average residual compressive strength. The ratios of residual (after cooling) compressive strength are listed in Table 1. The results are plotted in Fig. 8c. The equivalent temperature curves calculated based on merely average temperature with and without consider-ing furnace-cooling temperature rise in core concrete are plotted in Fig. 8c as well. As it is evident in the fig-ures, neglecting the temperature rise of core concrete during furnace cooling is unsafe. 3.2.3 Residual load bearing capacity prediction To assign a single temperature to each element of the FE model in Fig 7a, the equivalent temperature curves in Fig. 8c were converted to a series of piecewise constant temperature. By knowing the temperature of each layer, the aforementioned stress-strain modified Ahamd model
for concrete elements were modified with the listed
200 mm
200 mm
50@
5 m
m
(a) (b) (c)
940 oC
730
510
300
75
250
o C
400
o C
600
o C
800
o C
250
o C
400
o C
600
o C
800
o C
0
50
100
150
200
250
200 300 400 500 600 700 800 900
Sect
ion
elev
atio
n (m
m)
60' heatingCooled (Avg. strength)Cooled (Avg. Temp.)FE mesh temp.
0
50
100
150
200
250
200 300 400 500 600 700 800 900
Sect
ion
elev
atio
n (m
m)
Temperature ( )
Fig. 8 Thermal gradients; (a) thermal profile of test specimen, (b) representative temperature contours of beam and col-umns after 60 minutes of heating, (c) equivalent temperature distributions.

M. M. Raouffard and M. Nishiyama / Journal of Advanced Concrete Technology Vol. 14, 625-633, 2016 632
temperature dependent factors (residual) in Table 1. As the temperatures of steel bars were below 600℃, mate-rial properties of steel at room temperature were not modified (see Table 2). Regarding the bond elements, based on the equivalent temperatures at the elevations of the top and bottom longitudinal bars of the RC beam, 30 and 70% bond strength reduction values (Morley & Royles 1983) were adopted, respectively. To reduce the numerical instabilities, a full elastoplastic stress-strain model for concrete in compression was employed. The load-displacement curve of the analysis is plotted in Figs. 6a and 6b. As can be seen in the figures, the model could trace well the test results. The model pre-dicted approximately 10% lower ultimate load bearing capacity, which stands on the safe side. 4. Conclusion
In this paper, fire and post-fire structural response of a reinforced concrete moment-resisting frame was ex-perimentally and numerically investigated. The follow-ing conclusions and remarks can be drawn: • The fire test revealed that considerable temperature
rise could happen within the inner cold layers of con-crete during cooling. Such a phenomenon might not be fully captured by computer programs and thus, special care should be taken.
• The fire test results showed that owing to the natural strength recovery of the steel reinforcement when cooled, the excessively deflected mid-span could con-siderably bounced back (not fully) to its initial deflec-tion state. The unrecovered deflection was due to the occurrence of thermal cracks during cooling and lack
of strength recovery of concrete. • By comparing the analysis and the vertical loading
test results on the cooled test specimen it was found the beam could lose 30% of load bearing capacity. Moreover, the mid-span deflection under the same de-sign load before fire and after cooling implied 50% stiffness loss. Nevertheless, the residual mid-span de-flection was below the serviceability deflection limits.
• The proposed analytical approach in estimating the post-fire result strength of the test specimen in this study could predict the residual strength test results with considerably good accuracy.
Acknowledgements Part of the investigation work were supported by Grant-in-Aids for Scientific Research (A) of Japan (23246101 and 26630263). The authors would like to thank Dr. Sungjun Lim, Mr. Zhong Hui, and Mr. Ota Shohei for their great contribution to this research. We thank the GBRC for assisting the research with the proper fire test facilities. References ACI 318-08, (2007). Building Code Requirements for
Structural Concrete and Commentary, American Concrete Institute, Farmington Hills, MI, 124.
AIJ, (2004). “Design guidelines for earthquake resistant RC buildings based on inelastic displacement concept.” 399.
AIJ, (2009). “Guidebook for fire resistive performance of structural materials.” 34-171.
Alonso, C., (2009). “Assessment of post-fire reinforced concrete structures: Determination of depth of
Table 1 Temperature-dependant factors for mechanical properties of normal-weight siliceous aggregate concrete (JSSC 1969, AIJ Fire Resistance Guidebook 2009)
T (℃) Condition 20 100 200 300 400 500 600 700 800 Hot 1.00 0.80 0.97 0.94 0.85 0.66 0.51 0.39 0.15 Comp. strength ratio*
Residual 1.00 0.94 0.87 0.80 0.64 0.48 0.32 0.16 0.00 Hot 1.00 1.00 1.10 1.47 1.84 2.21 2.58 2.95 4.30 Strain ratio at peak stress
Residual 1.00 1.00 1.00 1.38 1.76 2.14 2.52 2.90 3.28 Hot 1.00 0.80 0.68 0.57 0.45 0.35 0.25 0.15 0.075Elastic modulus ratio
Residual 1.00 0.85 0.70 0.50 0.30 0.15 0.08 0.04 0.00 Tensile strength ratio** Hot 1.00 0.96 0.89 0.79 0.66 0.50 0.32 0.25 0.22
* w/c=0.65
**Similar values are applied for residual condition.
Table 2 Reduction factors at elevated temperatures for steel reinforcing SD345. (Morita et al. 1969, 2000; AIJ Fire Resistance Guidebook 2009)
T (℃) Condition 20 100 200 300 400 500 600 700 800 Hot 1.00 0.93 0.92 0.82 0.76 0.65 0.41 0.25 0.10
Yield strength ratio*
Residual 1.00 1.00 1.00 1.00 1.00 1.00 0.98 0.88 0.86 Hot 1.00 0.94 1.02 1.04 0.91 0.65 0.37 0.22 0.08
Tensile strength ratio Residual 1.00 1.00 1.00 1.00 1.00 0.98 0.96 0.87 0.88
Proportional limit ratio** Hot 1.00 1.00 0.91 0.83 0.75 0.58 0.42 0.10 0.05 * 0.2% proof stress ** Full recovery of Young’s Modulus after cooling is considered.
M. M. Raouffard and M. Nishiyama / Journal of Advanced Concrete Technology Vol. 14, 625-633, 2016 633
temperature penetration and associated damage.” In: M. Alexander, H -D. Beushausen, F. Dehn and P. Moyo, Eds. Concrete repair, rehabilitation and retrofitting II- Taylor & Francis, London, 471-477.
Amemiya. A. and Noguchi. H., (1990). “Development of finite element analytical program for high strength reinforced concrete members: Part1.” Summaries of Technical Papers of Annual Meeting Architectural Institute of Japan. Structures II, 639-640. (in Japanese)
Anderberg, Y., (2009). “Assessment of fire-damaged concrete structures and the corresponding repair measures.” In: M. Alexander, H -D. Beushausen, F. Dehn and P. Moyo, Eds. Concrete repair, rehabilitation and retrofitting II- Taylor & Francis, London, 631-636.
Bailey, C. G., (2002). “Holistic behaviour of concrete buildings in fire.” Structures and Buildings, 152(3), 199-212.
Bisby, L., Mostafaei, H. and Pimienta, P., (2014). “State-of-the-art on fire resistance of concrete structure Structure-Fire Model Validation.” http://www.nist.gov/el/fire_research/upload/Microsoft-Word-NIST-White-Paper-on-Concrete_DRAFT_25-03-14-Copy.pdf
Chen, Y. H., Chang, Y. F., Yao, G. C., and Sheu, M. S. (2009). “Experimental research on post-fire behaviour of reinforced concrete columns.” Fire safety journal, 44(5), 741-748.
CEN - Committee of European Normalization, (1994-2005), “EN 1994-1-2-2005, Eurocode 4, Design of composite steel and concrete structures, Part 1.2: Structural Fire Design.” CEN, Brussels.
EI-Hawary, M. M., Ragab, A. M., EI-Azim, A. A. and Elibiari, S., (1996). “Effect of fire on flexural behaviour of RC beams.” Construction Building Materials, 10(2), 147-150.
Fang, I.-K., Sullivan, P. J. E., Lee, C.-C., Fang. I.-C., Yeh, T.-Y. and Wu, M.-Y., (2012). “Fire resistance of beam-column subassemblage.” ACI Structural Journal, 109, 31-40.
fib, (2013). “Model code for concrete structures 2010.” vols. 1&2, final draft.
ISO 834-1, (1999). “Fire-resistance tests -Elements of building constructions- Part1: General requirements.” 1st edition.
Izumo, J., (1987). “Analytical model for RC plate element subjected to in-plane loading.” Journal of Concrete Research and Technology, 25(9), 107-120. (in Japanese)
Japanese Society of Steel Construction, (1969). “Mechanical characteristics of steel reinforcement, PC rods, and steel fibres at elevated temperatures and post fire.” JSSC, 5(45), 1-62. (in Japanese).
Jau, W. C. and Huang, K. L., (2008). “A study of reinforced concrete corner columns after fire.” Cement and Concrete Composites, 30(7), 622-638.
Kodur, V. K. R., Dwaikat, M. B. and Fike, R. S., (2010). “An approach for evaluating the residual strength of fire-exposed RC beams.” Magazine of Concrete Research, 62(7), 479-488.
Kodur, V. K. R., and Agrawal, A., (2016). “An approach for evaluating residual capacity of reinforced concrete beams exposed to fire.” Engineering Structures, 110, 293-306.
Kupfer, H. B. and Gerstle, K. H., (1973). “Behavior of concrete under biaxial stress.” ASCE J. Eng. Mech. Div., 99(EM4), 853-866.
Lin, C. H. and Tsai, C. S., (1990). “Deterioration of strength and stiffness of reinforced concrete columns after fire.” Journal of China Institute Engineering, 13(3), 273-283.
Lin, I. J., Chen, S. T. and Lin, C. J., (1999). “The shear strength of RC beam after fire damage.” Structure safety Evaluation after fire damage, Scientific & technical publishing Co., Ltd. Taiwan, 117-136.
Morita, T., Nishida, A. and Yamazaki, T., (2000): “Post fire residual strength of high strength concrete (120 MPa).” JAFSE, 338-341. (in Japanese).
Morley, P. D. and Royles, R., (1983). “Response of the bond in reinforced concrete to high temperatures.” Magazine of Concrete Research, 35(123), 67-74.
Naganuma. K., (1995). “Stress-strain relationship for concrete under triaxial compression.” Journal of Structural and Construction Engineering, AIJ, 474, 163-170. (in Japanese)
Raouffard, M. M. and Nishiyama, M., (2015). “Fire resistance of reinforced concrete frames subjected to service loads: Part 1: Experimental study.” Journal of Advanced Concrete Technology, 13(12), 554-563.
Venanzi, I., Materazzi, A. L. and Zappia, M., (2009), “Residual strength of RC buildings after a fire: A case study.” In: M. Alexander, H -D. Beushausen, F. Dehn and P. Moyo, Eds. Concrete repair, rehabilitation and retrofitting II- Taylor & Francis, London, 623-629.
Xiao, J. Z., Li, J. and Huang, A. F., (2008). “Fire response of high-performance concrete frames and their post-fire seismic performance.” ACI Structural Journal, 105, 531-540.