Reservoir Characteristics & Geological Controls on ...€¦ · Reservoir Characteristics &...
50
Reservoir Characteristics & Geological Controls on Permeability of the Triassic Doig-Montney Shales of NEBC Gareth Chalmers, Marc Bustin & Amanda Bustin Earth and Ocean Sciences University of British Columbia - Comparison with the Devonian Horn River Shale
Transcript of Reservoir Characteristics & Geological Controls on ...€¦ · Reservoir Characteristics &...
Reservoir Characteristics & Geological Controls on
Permeability of the Triassic Doig-Montney Shales of NEBC
Gareth Chalmers, Marc Bustin & Amanda Bustin
Earth and Ocean Sciences University of British Columbia
- Comparison with the Devonian Horn River Shale
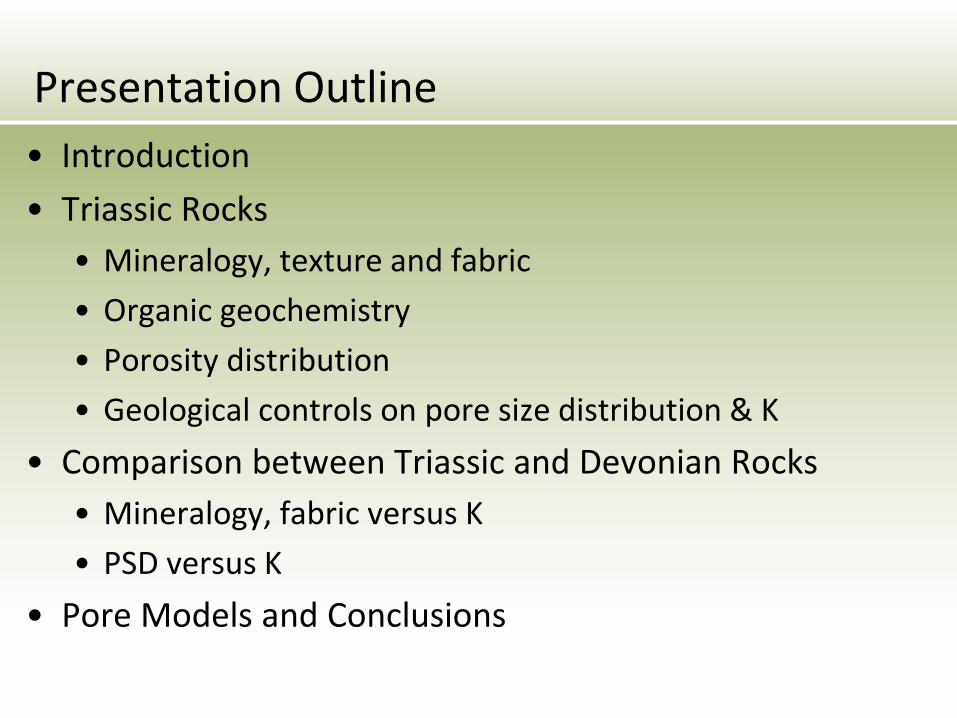
Presentation Outline • Introduction • Triassic Rocks
• Mineralogy, texture and fabric • Organic geochemistry • Porosity distribution • Geological controls on pore size distribution & K
• Comparison between Triassic and Devonian Rocks • Mineralogy, fabric versus K • PSD versus K
• Pore Models and Conclusions

Introduction • Large TCF gas-in-place estimates for unconventional
reservoirs • What controls the fluid flow?
• Fracture porosity is important BUT so is matrix flow • Porosity models include
• Dual porosity model • Coal – micropores (<2nm)1 & cleat fractures (Lu and
Connell, 2007) • Triple porosity model (Wei & Zhang, 2010)
• Coal and shale reservoirs • Micropores, mesopores1 and macropores (>50nm)1
1 International Union of Pure and Applied Chemistry (IUPAC) pore classification (Rouquerol et al., 1994).

Introduction: street-map-pore analogy
Woodford Shale: FE-SEM micrograph
100 nm
Fracture Plane mesopores
Google Maps 2012.

Geological Setting Summary • Triassic Montney-Doig-Halfway Fms
• Westward thickening, siliciclastic prograding wedge in a passive margin setting (Edwards et al., 1994; Davies 1997; Walsh et al., 2006; Dixon, 2009a and b).
• 2 of 3 T-R cycles
• Devonian Horn River Basin Fms • Reef-dominated shale basin (Kent, 1994)
• Shales & carbonates deposited within a embayments (shale rich) & salients (carbonate platforms) due to faulting & unconformity development (Morrow et al., 2002).

Devonian Shale - Liard (LB) and Horn River (HRB) Basins
Facies from Ross (2008) PhD Thesis, UBC.
Study Areas Triassic Doig-Montney Shales
Palaeogeog. by Kent (1994)
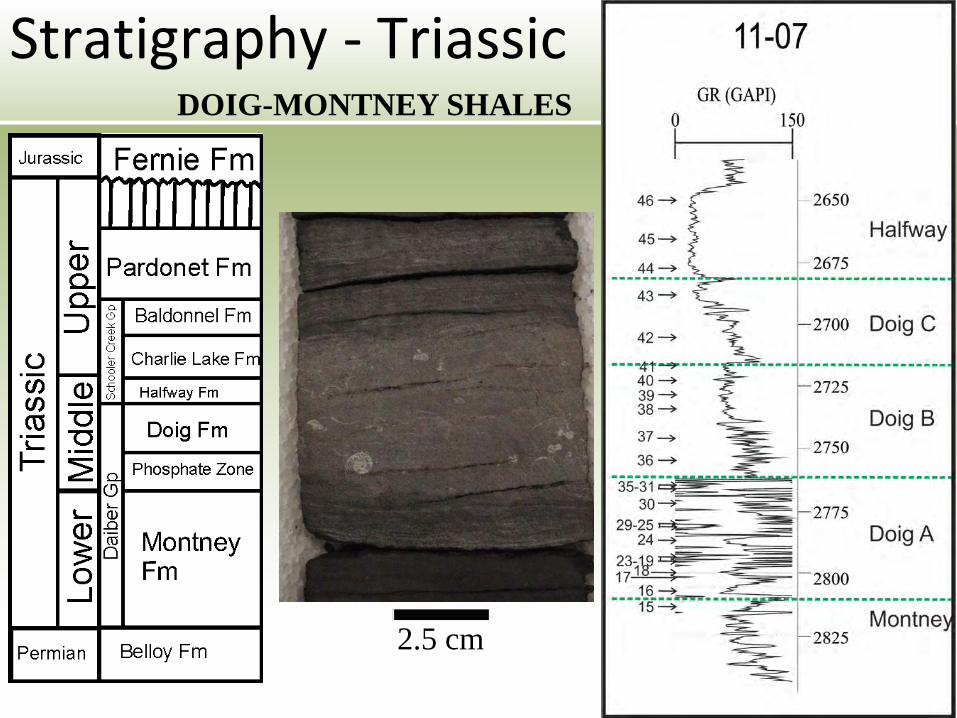
Stratigraphy - Triassic DOIG-MONTNEY SHALES
2.5 cm

Stratigraphy - Devonian
Liard Basin Deeper target Shallower target
Bovie Fault
Ferri et al., (2011)
More siliceous
Horn River Basin East West

Geological parameters studied
• Mineralogy – XRD & Rietveld, EDX + petrology • TOC Content – Rock Eval II + organic petrology • Porosity – He Pycnometry & Hg Porosimetry • Pore Size Distribution (PSD) – Hg porosimetry & low P gas adsorption analyses • Matrix Permeability – pulse decay permeameter • Texture and fabric – qualitative, thin sections & back scatter electron microscopy (BSEM)
• Future use of EBSD analysis
EBSD Boudier et al, (2009)
http://www.ingrainrocks.com/shale/

Mineralogy
• Poor to moderate clay in both Devonian and Triassic rocks
• Vary between high and low quartz, carbonates (feldspar is important Triassic) Triassic Doig/Montney Shales
Devonian LB/HRB Shales
Mineralogy, Texture & Fabric of Triassic shales
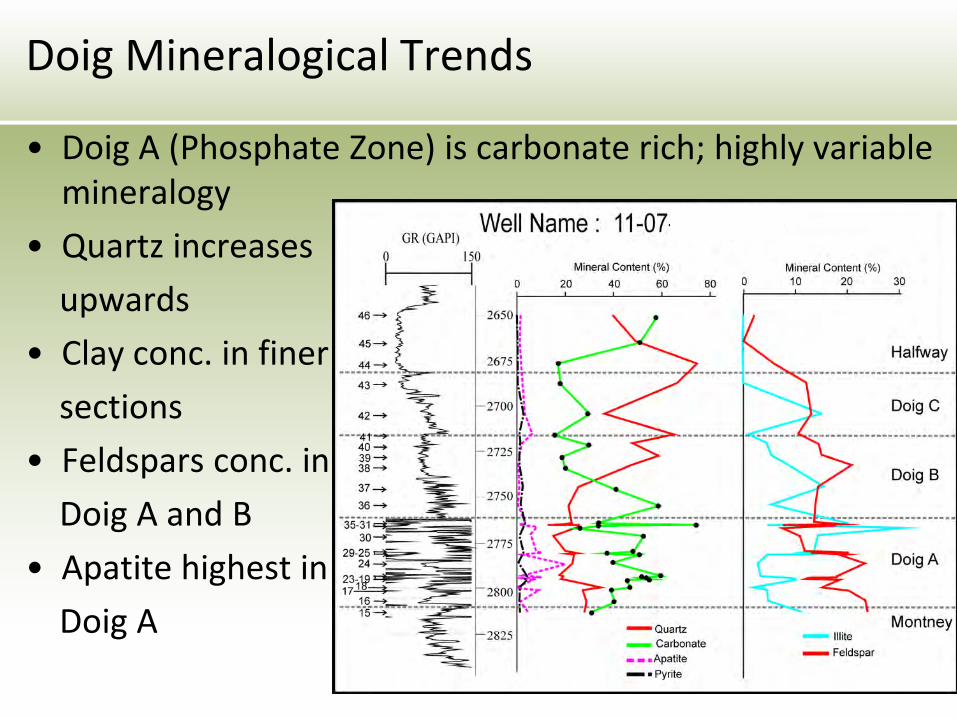
Doig Mineralogical Trends
• Doig A (Phosphate Zone) is carbonate rich; highly variable mineralogy
• Quartz increases upwards • Clay conc. in finer sections • Feldspars conc. in Doig A and B • Apatite highest in Doig A

Doig/ Halfway Petrology
125 µm

Doig “A” Textural Analysis – BSEM
Darker mins = quartz+dolomite Lighter mins = calcite+feldspar+muscovite

Montney Mineralogical Trends
• Carbonate, quartz & feldspar are significant • Illite < 20% • Carbonate & Qtz are highly variable • Apatite locally significant

Montney Textural Analysis - BSEM
5 cm apart

100 µm
Mod clay/qtz/CaCO3
Anisotropic;11-7-34 Mod Qtz/CaCO3 Isotropic;11-7-16
Fabric – Degree of anisotropy • qualitative measurement of the degree of crystal/clast
alignment • Controlled by mineralogy & paragenesis
• Clay-rich samples are more anisotropic than quartz & carbonate rich samples
Bedding
Direction

Mineralogy, fabric & texture summary
• 3 coarsening upward packages for Montney-Doig-Halfway
• Mineralogy, texture & fabric varies significantly within the Doig A (phosphate zone) and in parts of the Montney
• Higher carbonate or higher quartz contents reduce gamma log response
• Carbonate in the form of cement or detrital grains • Apatite locally important coating grains, cement or
nodule

Organic geochemistry of Triassic Shales

Organic Geochemistry of Doig Shale
• Kerogen is carbon rich • Reflectance & Tmax
indicate maturity is beyond oil window
• Majority have low HI and OI; due to either primary kerogen type &/or maturity

Tmax, Reflectance & HCs generation
• Averaged pyrobitumen equivalent* %Ro is 2.058 (dry gas)
• S2 peak too low for most sample for Tmax value
• Tmax = 457°C; wet to dry gas generation
y = 955.4x + 752.96 R² = 0.9036
1800
2000
2200
2400
2600
2800
3000
3200
34001.0 1.5 2.0 2.5 3.0
Dept
h (m
)
Vitrinite Reflectance (%) *Schoenherr et al. (2007)
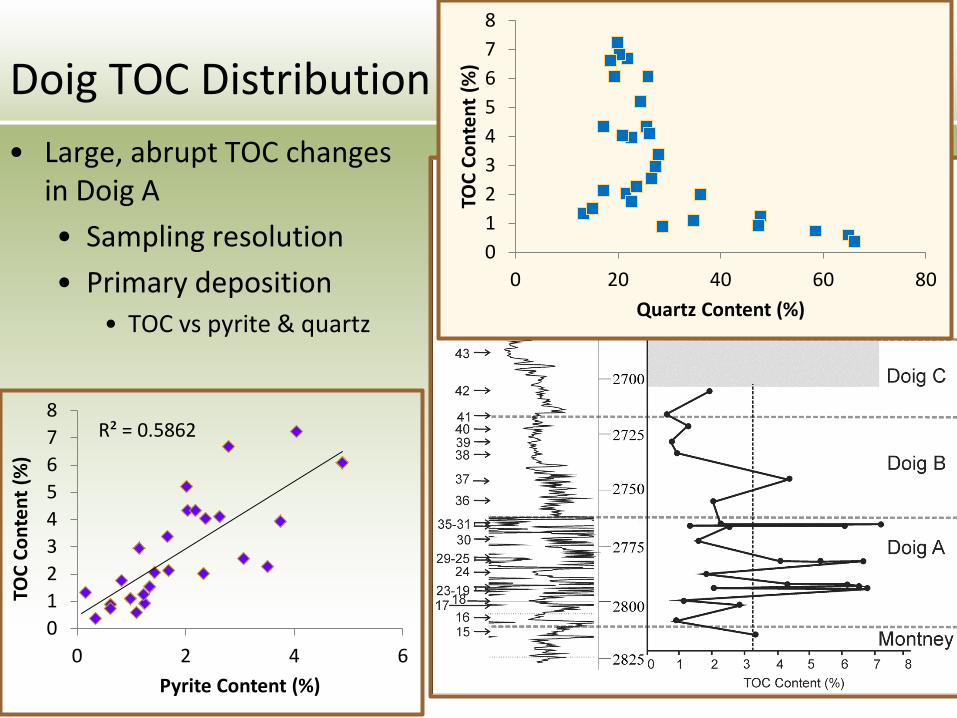
Doig TOC Distribution • Large, abrupt TOC changes
in Doig A • Sampling resolution • Primary deposition
• TOC vs pyrite & quartz
R² = 0.5862
012345678
0 2 4 6
TOC
Cont
ent (
%)
Pyrite Content (%)
012345678
0 20 40 60 80
TOC
Cont
ent (
%)
Quartz Content (%)

Doig Organic Petrology 41 µm
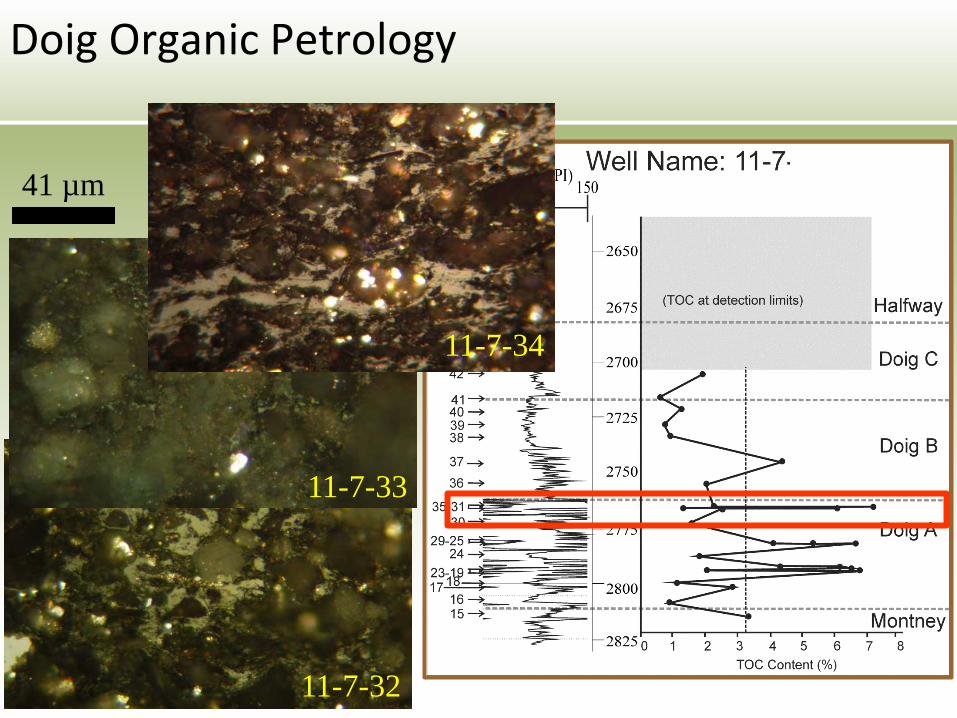
Doig Organic Petrology
41 µm
11-7-32
11-7-33
11-7-34

Montney Organic Petrology
41 µm

HC generation summary
• From observations, kerogen has been converted to bitumen (oil) • Flow textures • Oil migration (Riediger et al., 1990)
• Inefficient oil migration resulted in secondary cracking of remaining bitumen to pyrobitumen • No fluorescence • degassing (macro) pores • Increasing TOC maturity =
increasing micropores & storage of methane (Chalmers & Bustin, 2008)

Porosity Distribution of Triassic Rocks
100 nm

Porosity Measurements
• 2 porosity methods • Hg Porosimetry – measures greater than 3 nm • He pycnometry – measures greater than 0.26 nm
• Any difference between measurements highlights pore
sizes between 0.26 – 3.0 nm (mostly micropores)
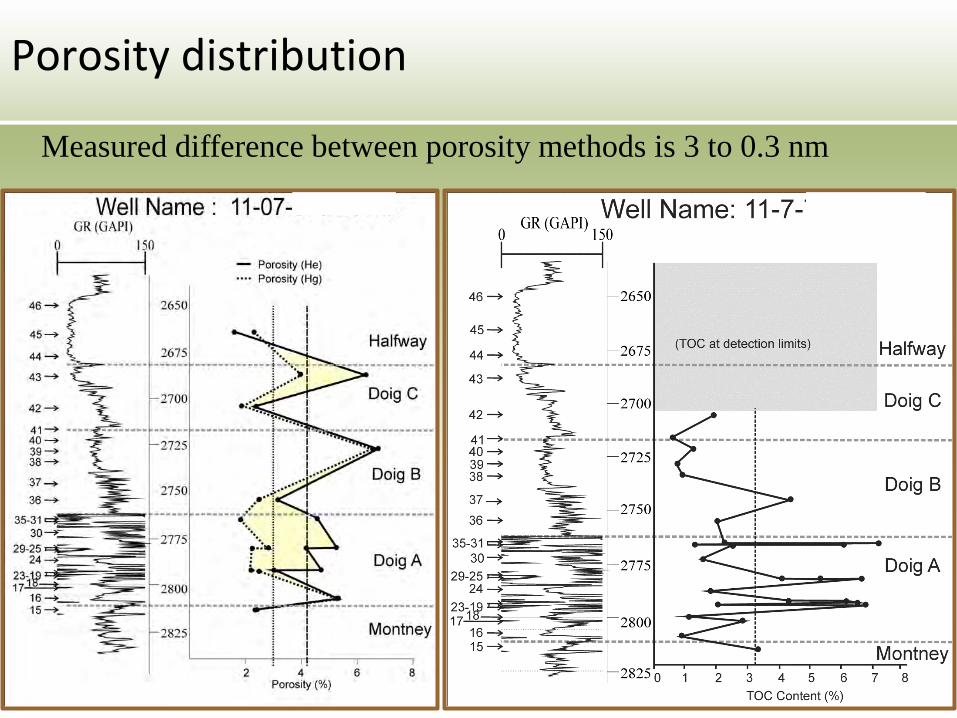
Porosity distribution
Measured difference between porosity methods is 3 to 0.3 nm

Geological Controls on Pore Size Distribution & Permeability for Triassic Rocks

Geological Controls on Pore Size Distribution (PSD)
• Combination of: •Mineralogy •TOC content •Texture and fabric •Degree of anisotropy
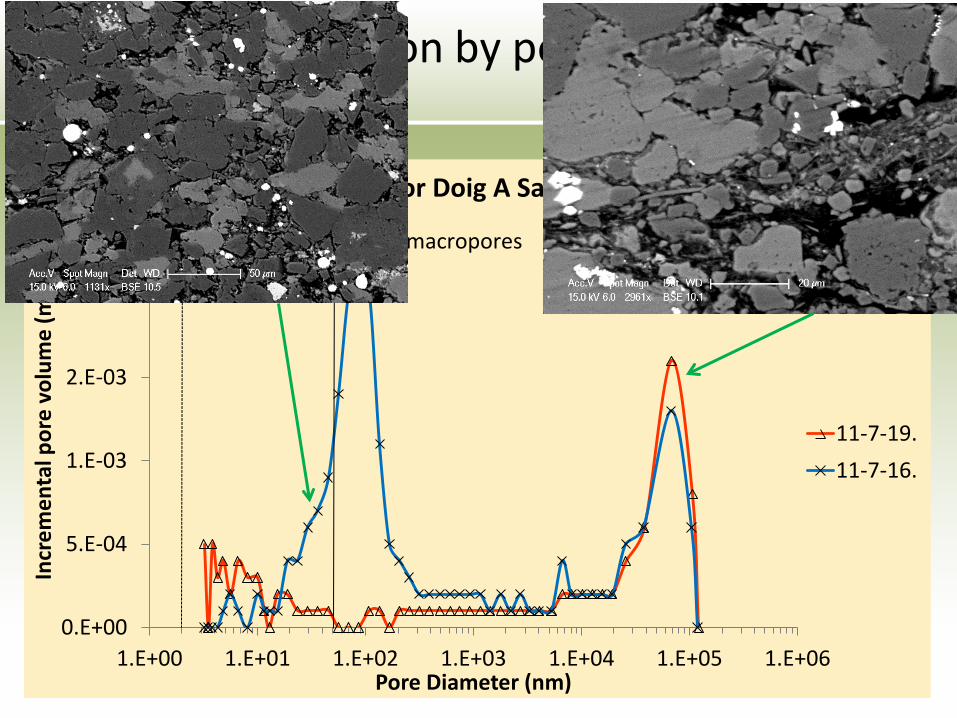
Pore Size Distribution by porosimetry
0.E+00
5.E-04
1.E-03
2.E-03
2.E-03
3.E-03
1.E+00 1.E+01 1.E+02 1.E+03 1.E+04 1.E+05 1.E+06
Incr
emen
tal p
ore
volu
me
(mL/
g)
Pore Diameter (nm)
PSD for Doig A Samples
11-7-19.11-7-16.
mesopores macropores

Why are mesopores & micropores important?
0.E+00
5.E-04
1.E-03
2.E-03
2.E-03
3.E-03
1.E+00 1.E+01 1.E+02 1.E+03 1.E+04 1.E+05 1.E+06
Incr
emen
tal p
ore
volu
me
(mL/
g)
Pore Diameter (nm)
PSD for Doig A Samples
11-7-19.11-7-16.
mesopores macropores
0
0.1
0.2
0.3
0.4
0.5
0.6
0.7
1 10 100 1000 10000 100000 1000000
Incr
emen
tal S
urfa
ce A
rea
(m2 /
g)
Pore Diameter (nm)
P.S.D for Doig A Samples
11-7-19.
11-7-16.
GREATER AMOUNT OF SMALLER PORES = GREATER SURFACE AREA Greater surface area = greater sorbed methane = greater GIP
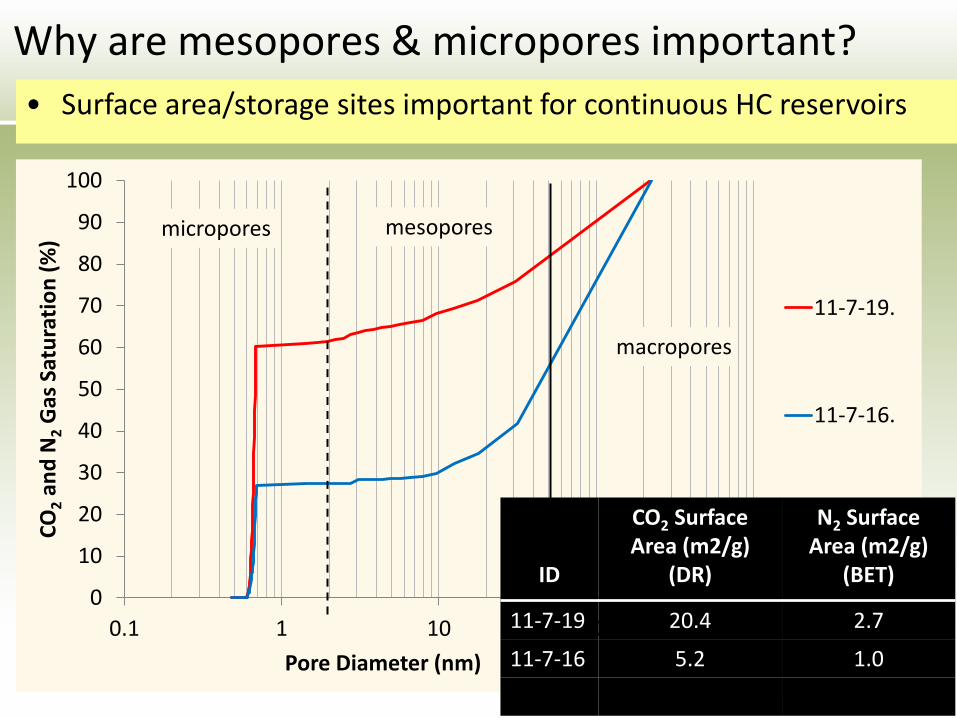
Why are mesopores & micropores important? • Surface area/storage sites important for continuous HC reservoirs
0
10
20
30
40
50
60
70
80
90
100
0.1 1 10 100 1000
CO2 a
nd N
2 Gas
Sat
urat
ion
(%)
Pore Diameter (nm)
11-7-19.
11-7-16.
ID
CO2 Surface Area (m2/g)
(DR)
N2 Surface Area (m2/g)
(BET)
11-7-19 20.4 2.7
11-7-16 5.2 1.0
macropores
micropores mesopores
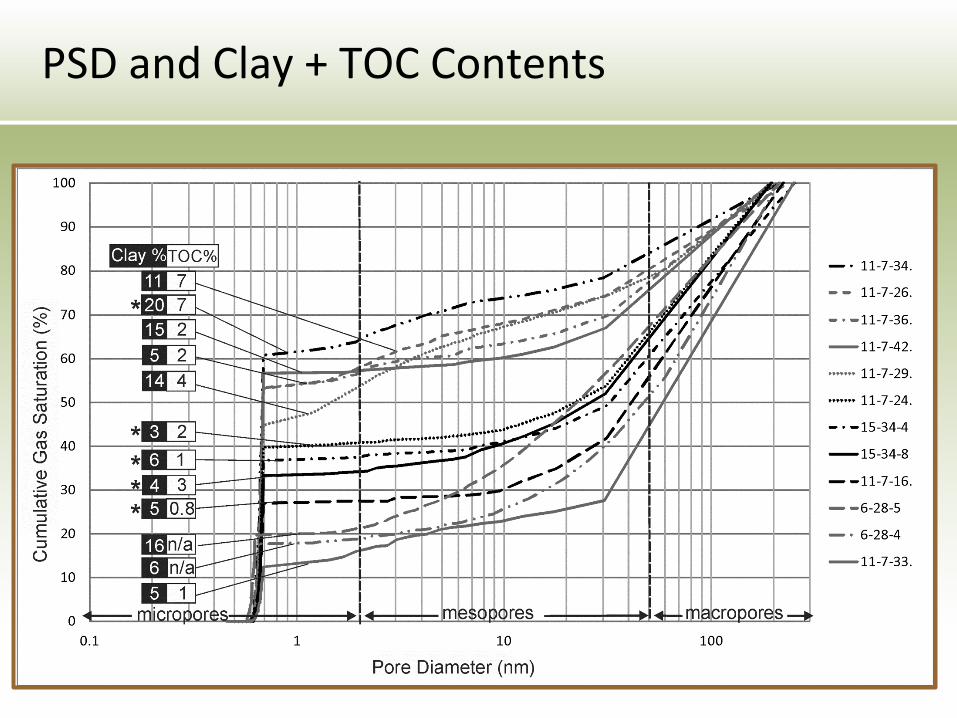
PSD and Clay + TOC Contents
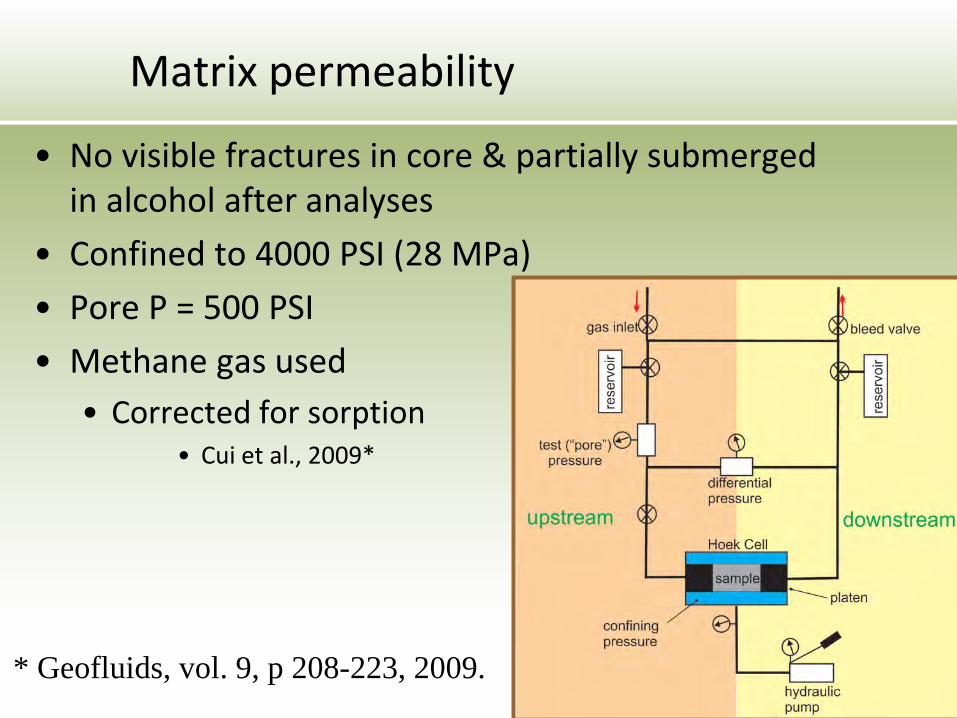
Matrix permeability
• No visible fractures in core & partially submerged in alcohol after analyses
• Confined to 4000 PSI (28 MPa) • Pore P = 500 PSI • Methane gas used
• Corrected for sorption • Cui et al., 2009*
* Geofluids, vol. 9, p 208-223, 2009.
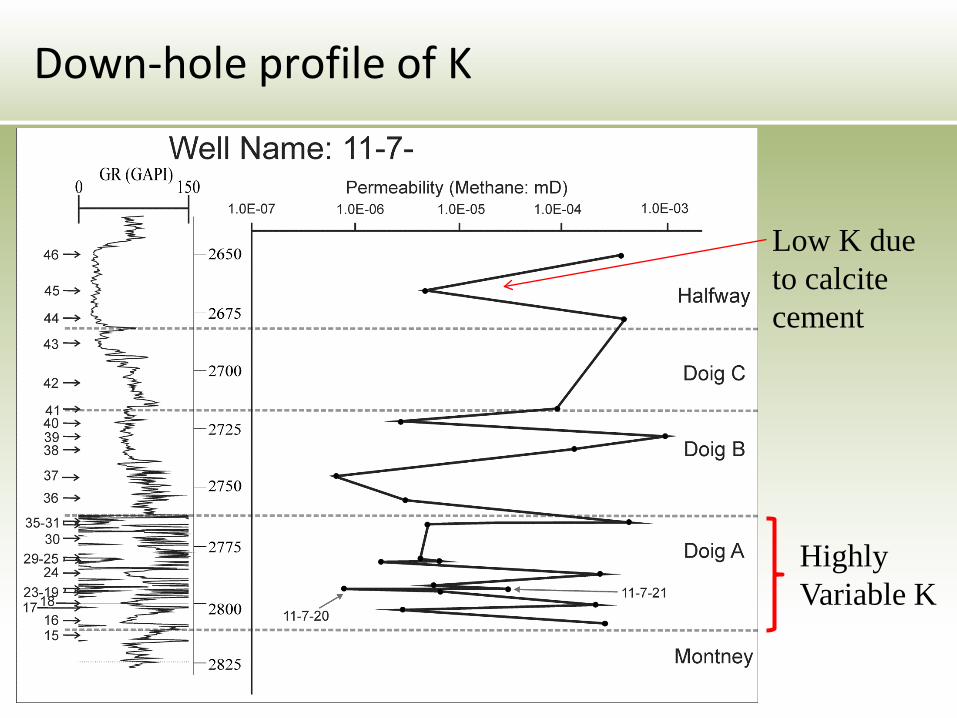
Down-hole profile of K
Highly Variable K
Low K due to calcite cement

Mineralogy & fabric vs Permeability for Triassic and Devonian Rocks

Variability of Matrix Permeability
1.E-07
1.E-06
1.E-05
1.E-04
1.E-03
1.E-02
1.E-01
1.E+00
0 20 40 60 80 100
Met
hane
Per
mea
bilit
y, co
rrec
ted
(mD
)
Quartz+Feldspar Content
LB/HRBDoig/MontneyHorn River

Comparing High & Low K – Triassic
Mod Qtz/clay/CaCO3 11-7-34
250 µm
High K (>1E-04 mD) Low K (< 1E-5 mD)
Mod Qtz/CaCO3 11-7-16
250 µm
Mod Qtz/CaCO3 11-7-19
250 µm
Mod Qtz/CaCO3 11-7-45
500 µm
Bedding
Direction
11-7-34
50 µm
11-7-19
50 µm
11-7-16
500 µm
Calcite cemented
Calcite cemented
less cemented
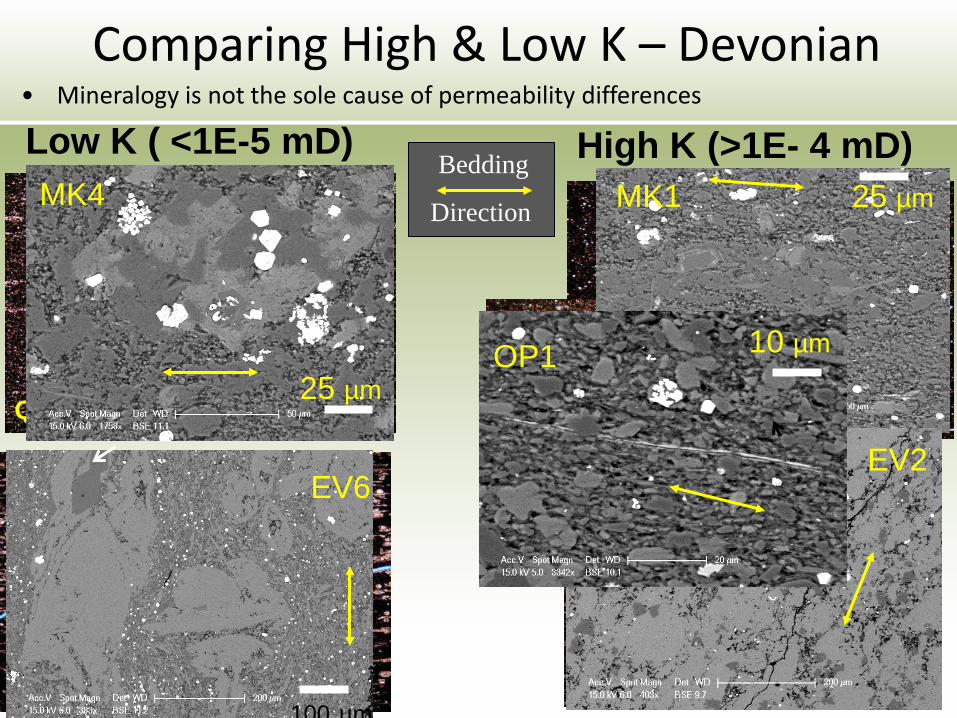
Comparing High & Low K – Devonian • Mineralogy is not the sole cause of permeability differences
Quartz-rich MK1
250 µm
CaC03-rich EV2
500 µm
Low K ( <1E-5 mD) High K (>1E- 4 mD)
250 µm
Qtz-rich MK4
250 µm
CaCO3-rich EV6
EV6
100 µm
Mod Qtz/clay/CaCO3 OP1
250 µm
MK1 25 µm
EV2 100 µm
OP1 10 µm
Bedding
Direction MK4
25 µm

Mineralogy, fabric vs K Sensitivity
OP1: anisotropic, clay rich, sensitive EV6: isotropic, carbonate rich, less sensitive
y = 7E-07e7E-06x
y = 0.4101e-8E-04x
1.E-07
1.E-06
1.E-05
1.E-04
1.E-03
1.E-02
1.E-01
1.E+00
0 2000 4000 6000 8000
Mat
rix P
erm
eabi
lity
(mD)
Effective Pressure (PSI)
EV6
OP1
Ø = 1.5% Ø = 2.5%
10 µm 10 µm
bedding
direction
Bedding
Direction

Fabric vs K - summary
• Anisotropic • Greater content of clay, kerogen,
long axis of elliptical clasts parallel with lamination
• High K • K more sensitive to varying E.P.
• Isotropic – High proportion of equant
grains – calcite or quartz – High or low K – Less sensitive
100 µm
87% carbonate Mod clay/qtz/CaCO3
Doig:11-7-34 Muskwa: MK5 200 µm
bedding
direction
Bedding
Direction

PSD vs Permeability

Hg intrusion curves and K
• PSD by incremental pore volume
0
0.0005
0.001
0.0015
0.002
0.0025
1 10 100 1000 10000 100000 1000000
Incr
emen
tal p
ore
volu
me
(mL/
g)
Pore Diameter (nm)
P.S.D for Doig A Samples
11-7-19.
11-7-16.
mesopores macropores
K = 2.5E-4 mD K = 6.5E-6 mD
better communication
poorer communication

PSD by Gas Adsorption
Ratio of Micro-, meso-, macropore:
DOIG/Montney
Horn River Doig 38: 22: 40
HRB 45: 25: 30
Higher K samples have similar ratio & shape
* = high K
Balanced ratio
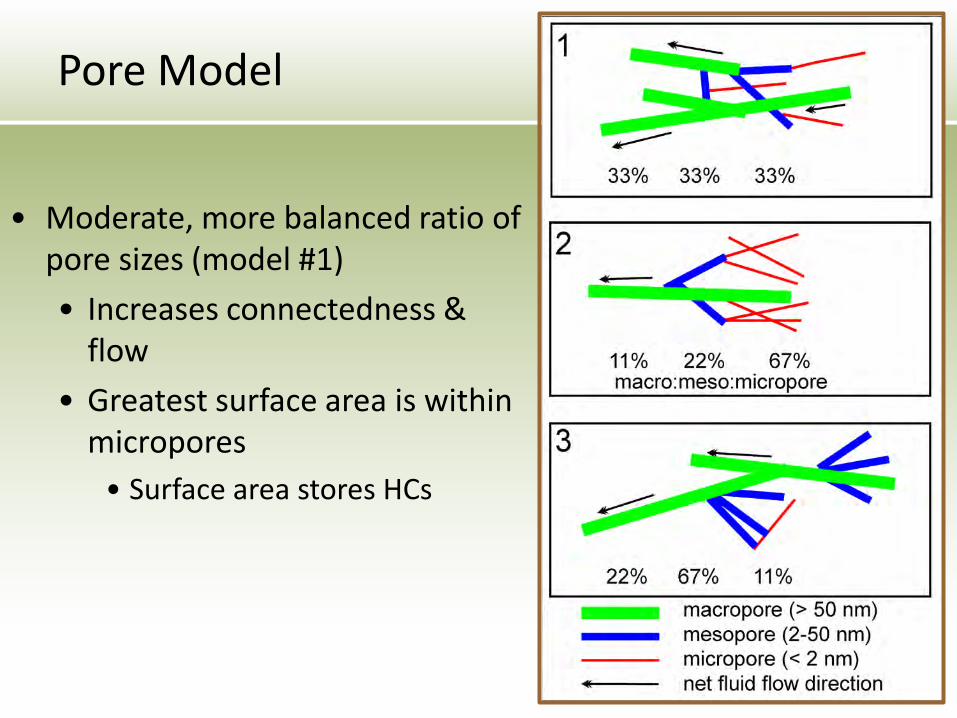
Pore Model
• Moderate, more balanced ratio of pore sizes (model #1) • Increases connectedness &
flow • Greatest surface area is within
micropores • Surface area stores HCs

Conclusions: Controls on Matrix Permeability
• PSD controls permeability • PSD
• Mineralogy • TOC content • Texture • Fabric and degree of
anisotropy
Google Maps 2012.

Conclusions • Triassic rocks show small scaled heterogeneity in TOC
and mineralogy and PSD • Increases the reservoir’s complexity with respect to
storage of methane and permeability • Kerogen (TOC) distribution due to deposition &
conversion of bitumen to pyrobitumen has produced gas & storage site within reservoir
• Although Devonian rocks differ from Triassic rocks, higher K values have similar PSD • More balanced ratios of micro-, meso and macropores

Acknowledgements
• Geosciences BC • Shell Oil Company • CBM Solutions & Trican • “Your name here” • “Geological Controls on Permeability of the Devonian Horn River Shales”
• In review, International Journal of Coal Geology, special issue of gas shales
• “Geological Controls on Permeability of Triassic Doig/Montney Shales” • In review, Journal of Marine and Petroleum Geology