RESEARCHARTICLE GenomicAncestry,Self-RatedHealthandIts ... Per Estrang... ·...
14
RESEARCH ARTICLE Genomic Ancestry, Self-Rated Health and Its Association with Mortality in an Admixed Population: 10 Year Follow-Up of the Bambui-Epigen (Brazil) Cohort Study of Ageing M. Fernanda Lima-Costa 1 *, James Macinko 2 , Juliana Vaz de Melo Mambrini 1 , Cibele C. Cesar 3 , Sérgio V. Peixoto 1 , Wagner C. S. Magalhães 4 , Bernardo L. Horta 5 , Mauricio Barreto 6 , Erico Castro-Costa 1 , Josélia O. A. Firmo 1 , Fernando A. Proietti 1 , Thiago Peixoto Leal 4 , Maira R. Rodrigues 4 , Alexandre Pereira 7 , Eduardo Tarazona-Santos 4 1 Fundação Oswaldo Cruz, Instituto de Pesquisas Rene Rachou, Belo Horizonte, Minas Gerais, Brazil, 2 University of California, Los Angeles, Fielding School of Public Health, Departments of Health Policy and Management and Community Health Sciences, Los Angeles, California, United States, 3 Universidade Federal de Minas Gerais, Departamento de Estatística, Belo Horizonte, Minas Gerais, Brazil, 4 Universidade Federal de Minas Gerais, Departamento de Biologia Geral, Belo Horizonte, Minas Gerais, Brazil, 5 Universidade Federal de Pelotas, Departamento de Medicina Social, Pelotas, Rio Grande do Sul, Brasil, 6 Fundação Oswaldo Cruz, Instituto de Pesquisas Gonçalo Muniz, Bahia, Salvador, Brasil, 7 Universidade de São Paulo, Instituto do Coração, São Paulo, Brazil * [email protected] Abstract Background Self-rated health (SRH) has strong predictive value for mortality in different contexts and cultures, but there is inconsistent evidence on ethnoracial disparities in SRH in Latin Amer- ica, possibly due to the complexity surrounding ethnoracial self-classification. Materials/Methods We used 370,539 Single Nucleotide Polymorphisms (SNPs) to examine the association between individual genomic proportions of African, European and Native American ances- try, and ethnoracial self-classification, with baseline and 10-year SRH trajectories in 1,311 community dwelling older Brazilians. We also examined whether genomic ancestry and eth- noracial self-classification affect the predictive value of SRH for subsequent mortality. Results European ancestry predominated among participants, followed by African and Native Amer- ican (median = 84.0%, 9.6% and 5.3%, respectively); the prevalence of Non-White (Mixed and Black) was 39.8%. Persons at higher levels of African and Native American genomic ancestry, and those self-identified as Non-White, were more likely to report poor health than PLOS ONE | DOI:10.1371/journal.pone.0144456 December 17, 2015 1 / 14 OPEN ACCESS Citation: Lima-Costa MF, Macinko J, Mambrini JVdM, Cesar CC, Peixoto SV, Magalhães WCS, et al. (2015) Genomic Ancestry, Self-Rated Health and Its Association with Mortality in an Admixed Population: 10 Year Follow-Up of the Bambui-Epigen (Brazil) Cohort Study of Ageing. PLoS ONE 10(12): e0144456. doi:10.1371/journal.pone.0144456 Editor: Tom R. Gaunt, University of Bristol, UNITED KINGDOM Received: June 19, 2015 Accepted: November 18, 2015 Published: December 17, 2015 Copyright: © 2015 Lima-Costa et al. This is an open access article distributed under the terms of the Creative Commons Attribution License, which permits unrestricted use, distribution, and reproduction in any medium, provided the original author and source are credited. Data Availability Statement: Genome-wide data are deposited in the EBI-ENA Archive (EGA, http://www. ebi.ac.uk.ega/) under EPIGEN-Committee Controlled Access mode (accession number EGAS00001001245). However, The study data contain personally identifiable information, not limited to lab results (including genomic ancestry), and other physical and mental health tests. They also include extensive individual data on income and family structure. For these reasons and according to the permissions given with the existing human subjects
Transcript of RESEARCHARTICLE GenomicAncestry,Self-RatedHealthandIts ... Per Estrang... ·...

RESEARCH ARTICLE
Genomic Ancestry, Self-Rated Health and ItsAssociation with Mortality in an AdmixedPopulation: 10 Year Follow-Up of theBambui-Epigen (Brazil) Cohort Study ofAgeingM. Fernanda Lima-Costa1*, James Macinko2, Juliana Vaz de Melo Mambrini1, CibeleC. Cesar3, Sérgio V. Peixoto1, Wagner C. S. Magalhães4, Bernardo L. Horta5,Mauricio Barreto6, Erico Castro-Costa1, Josélia O. A. Firmo1, Fernando A. Proietti1, ThiagoPeixoto Leal4, Maira R. Rodrigues4, Alexandre Pereira7, Eduardo Tarazona-Santos4
1 Fundação Oswaldo Cruz, Instituto de Pesquisas Rene Rachou, Belo Horizonte, Minas Gerais, Brazil,2 University of California, Los Angeles, Fielding School of Public Health, Departments of Health Policy andManagement and Community Health Sciences, Los Angeles, California, United States, 3 UniversidadeFederal de Minas Gerais, Departamento de Estatística, Belo Horizonte, Minas Gerais, Brazil, 4 UniversidadeFederal de Minas Gerais, Departamento de Biologia Geral, Belo Horizonte, Minas Gerais, Brazil,5 Universidade Federal de Pelotas, Departamento de Medicina Social, Pelotas, Rio Grande do Sul, Brasil,6 Fundação Oswaldo Cruz, Instituto de Pesquisas Gonçalo Muniz, Bahia, Salvador, Brasil, 7 Universidadede São Paulo, Instituto do Coração, São Paulo, Brazil
Abstract
Background
Self-rated health (SRH) has strong predictive value for mortality in different contexts and
cultures, but there is inconsistent evidence on ethnoracial disparities in SRH in Latin Amer-
ica, possibly due to the complexity surrounding ethnoracial self-classification.
Materials/Methods
We used 370,539 Single Nucleotide Polymorphisms (SNPs) to examine the association
between individual genomic proportions of African, European and Native American ances-
try, and ethnoracial self-classification, with baseline and 10-year SRH trajectories in 1,311
community dwelling older Brazilians. We also examined whether genomic ancestry and eth-
noracial self-classification affect the predictive value of SRH for subsequent mortality.
Results
European ancestry predominated among participants, followed by African and Native Amer-
ican (median = 84.0%, 9.6% and 5.3%, respectively); the prevalence of Non-White (Mixed
and Black) was 39.8%. Persons at higher levels of African and Native American genomic
ancestry, and those self-identified as Non-White, were more likely to report poor health than
PLOSONE | DOI:10.1371/journal.pone.0144456 December 17, 2015 1 / 14
OPEN ACCESS
Citation: Lima-Costa MF, Macinko J, MambriniJVdM, Cesar CC, Peixoto SV, Magalhães WCS, et al.(2015) Genomic Ancestry, Self-Rated Health and ItsAssociation with Mortality in an Admixed Population:10 Year Follow-Up of the Bambui-Epigen (Brazil)Cohort Study of Ageing. PLoS ONE 10(12):e0144456. doi:10.1371/journal.pone.0144456
Editor: Tom R. Gaunt, University of Bristol, UNITEDKINGDOM
Received: June 19, 2015
Accepted: November 18, 2015
Published: December 17, 2015
Copyright: © 2015 Lima-Costa et al. This is an openaccess article distributed under the terms of theCreative Commons Attribution License, which permitsunrestricted use, distribution, and reproduction in anymedium, provided the original author and source arecredited.
Data Availability Statement: Genome-wide data aredeposited in the EBI-ENA Archive (EGA, http://www.ebi.ac.uk.ega/) under EPIGEN-Committee ControlledAccess mode (accession numberEGAS00001001245). However, The study datacontain personally identifiable information, not limitedto lab results (including genomic ancestry), and otherphysical and mental health tests. They also includeextensive individual data on income and familystructure. For these reasons and according to thepermissions given with the existing human subjects

other groups, even after controlling for socioeconomic conditions and an array of self-
reported and objective physical health measures. Increased risks for mortality associated
with worse SRH trajectories were strong and remarkably similar (hazard ratio ~3) across all
genomic ancestry and ethno-racial groups.
Conclusions
Our results demonstrated for the first time that higher levels of African and Native American
genomic ancestry—and the inverse for European ancestry—were strongly correlated with
worse SRH in a Latin American admixed population. Both genomic ancestry and ethnora-
cial self-classification did not modify the strong association between baseline SRH or SRH
trajectory, and subsequent mortality.
IntroductionSelf-rated health (SRH) is one of the most widely used epidemiologic variables because of itssimplicity, its validity in different contexts and cultures, and its strong predictive power forfuture mortality. [1–4] While there is considerable evidence of ethnoracial disparities in SRHin the USA [5–7], studies conducted in Latin American countries have reported inconsistentresults. [8–10] One possible explanation for these inconsistencies is the complexity surround-ing ethnoracial classification in Latin American populations. [11]
Brazil, the world’s fifth most populous nation [12], offers a unique opportunity to explorethe extent of agreement among objective measures of ethnoracial background (genome-wideancestry) and ethnoracial identity on SRH disparities. The Brazilian population originatedfrom African, European and Native American ancestral roots. [11, 13] The slave trade to Brazilwas the largest in the Americas; 3.6 million African slaves were brought to Brazil, seven timesmore than to the United States. [11] The absence of legal segregation and other factors resultedin the construction of a complex, fluid system of ethnoracial classification. [11, 13] A recentpopulation-based multicenter study concluded that ethnoracial self-classification in Brazil isaffected by both genomic ancestry and non-biological factors [13]
To our knowledge, no previous study has examined the association between genome-wideancestry and SRH in an admixed Western population. We used 370,539 SNPs to examine theassociation between individual genomic proportions of African, European and Native Ameri-can ancestry, as well as that of ethnoracial self-classification, with SRH in a population-basedcohort of older adults in Brazil. Additionally, we examined whether genomic ancestry and eth-noracial self-classification affect the predictive value of SRH for subsequent mortality.
Materials and Methods
Ethics StatementThe Bambui cohort study of aging was fully approved by the Comissão de Ética em Pesquisa(Institutional Review Board) at Oswaldo Cruz Foundation, Rio de Janeiro, Brazil. Writteninformed consent was obtained from all participants at baseline and at all follow-up interviews.Genotyping was approved by Brazil’s national research ethics committee, as part of the Epigen-Brazil protocol (CONEP, resolution 15895).
Genomic Ancestry, Self-Rated Health and Mortality
PLOS ONE | DOI:10.1371/journal.pone.0144456 December 17, 2015 2 / 14
review board, it is not possible to make public thedata used for this study. Requests may be made outto Maria Fernanda Lima-Costa, ([email protected]).
Funding: This work was supported by theDepartment of Science and Technology (DECIT,Ministry of Health) and National Fund for Scientificand Technological Development (FNDCT, Ministry ofScience and Technology), Funding of Studies andProjects (FINEP, Ministry of Science and Technology,Brazil), Coordination of Improvement of HigherEducation Personnel (CAPES, Ministry of Education,Brazil). MFLC, SVP, JOAF, FAP, CCC and ETS arefellow researchers of the National Council forResearch and Technological Development (CNPq).
Competing Interests: The authors have declaredthat no competing interests exist.

Study design and populationThe Bambui cohort study of aging is ongoing in Bambuí, a city of approximately 15,000 inhabi-tants in the state of Minas Gerais in Southeast Brazil. [14] The population eligible for thecohort consisted of all residents aged 60 years and over on 1 January 1997 (1,606 out of 1,742of whom participated). Cohort members undergo annual follow-up visits, which consist of aninterview and verification of death certificates (98.8% of which have been verified). All deathsfrom any cause occurring from study enrollment to December 31, 2007, were included in thisanalysis. At baseline, 1,442 participants had their DNA stored and authorized its use for futureinvestigation. Genotyping were performed in 2012, as part of the Epigen-Brazil Initiative. [13]
Self-rated healthInformation on SRH was obtained during the household interview at baseline and at each sub-sequent wave. SRH was measured by asking the question, ‘‘In general, would you say yourhealth is . . .,” and five response categories ranged from ‘‘excellent,” to “very poor”. Languageplays a role in an individual´s choice on the SRH scale [15, 16] and we have shown that for theBambui cohort population, whose language is Portuguese, the middle option (“fair”) seems todescribe normal health and is viewed as similar to the “good” option. [4, 17] Thus, we catego-rized SRH as a binary variable, comprising poor/very poor (exposure category) versus fair/good/excellent.
Genotyping and external parental populationsParticipants were genotyped by the Illumina facility, using the Omni 2.5M array (Illumina,San Diego, California). We performed the unsupervised tri-hybrid (k = 3) admixture analysesbased on 370,539 SNPs shared between samples from the Epigen-Brazil study population, theHapMap Project, and the Human Genome Diversity Project (HGDP). [18, 19] As external pan-els, we used the following HapMap samples: 266 Africans, 262 Europeans (American and Ital-ian), 77 admixed Mexican Americans, 83 African Americans, and 93 Native Americans fromthe HGDP. Further details can be seen elsewhere. [13]
Ethnoracial self-classificationThe Brazilian census uses ethnoracial self-classification with five groups: White, Brown/Mixed (“pardo” in official Portuguese), Black, “Yellow” (Asian) and Indigenous (NativeAmerican). [12] At baseline, cohort participants categorized themselves into the above men-tioned ethnoracial groups, according to standard photographs of Brazilians; no individualscategorized themselves as Native American or Asian. Those self-classified as Black or Brown/Mixed were considered as Non-White in the current analysis.
Other baseline measuresSRH is affected by several main factors [2] and variables selected for this study followed thisframework, including: 1) socio demographic characteristics (age, sex, schooling and householdincome); 2) lifestyle (current smoking and leisure-time physical activity); 3) mental symptoms(common mental disorders); 4) physical functioning (disability in activities of daily living); and5) objective measures of health (described below).
Based on its distribution, we categorized schooling into incomplete primary school (<4years) and complete primary and higher (4 years and more). We categorized monthly house-hold income per capita into equal or superior to the median value (median = 1.5 Brazilian min-imum wage or USD 180.00 at baseline) and lower. Current smokers were persons who had
Genomic Ancestry, Self-Rated Health and Mortality
PLOS ONE | DOI:10.1371/journal.pone.0144456 December 17, 2015 3 / 14
smoked at least 100 cigarettes during their lifetime and who were still smokers. Leisure-timephysical activity was defined as activity of any intensity for 20–30 minutes at least 3 times aweek during the previous 3 months. Assessment of common mental disorders was based onparticipants’ answers to the 12-item version of the General Health Questionnaire. A score of 4/5 was used to define exposure status, as recommended for the study population. [20] Partici-pants were considered to have a disability in activities of daily living if they reported much dif-ficulty or inability in at least one of the following: feeding oneself, dressing oneself, bathing orshowering, using the toilet, getting in and out of the bed to a chair, and/or walking across aroom. [17]
Objective measures of health were those previously found to be associated with increasedrisk of mortality among cohort participants. [21–25] Systolic blood pressure was defined as themean of 2 out of 3 measures according to standard protocols. Body mass index was defined asweight in kilograms divided by the square of height in meters. Blood fasting glucose, total cho-lesterol, and lipoprotein cholesterol were determined by using standard enzymatic methods(Merck, Darmstadt, Germany). Plasma Brain Natriuretic Peptide (BNP) was measured using amicro particle-based immunoassay (AxSYMMEIA; Abbott Laboratories, Inc., Abbott Park,Illinois). White blood cell count and hemoglobin level were assessed using an electroniccounter (Coulter Counter T 890; Coulter Electronics, Hialeah, Florida). Infection with Trypa-nosoma cruzi was assessed by means of 1 hemagglutination assay (Biolab Mérieux SA, Rio deJaneiro, Brazil) and 2 enzyme-linked immunosorbent assays (Abbott Laboratories, Inc., andWiener Laboratories, Rosario, Argentina) performed concurrently. Blood samples were col-lected after a 12-hour fast. Further details are described elsewhere. [14]
Statistical analysisTo estimate the genetic ancestry of the study population, we applied the methodology imple-mented in the software Admixture [26] and used an unsupervised mode to identify clusterscorresponding to the 3 ancestral populations (African, European and Native American) fromthe genetic structure of our dataset. We estimated kinship coefficients for each possible pair ofindividuals, using the Related Estimation in Admixed Populations (REAP) software. [27] Weconsidered a related pair if their coefficient was� 0.1 (first- and second-degree relatives).Based on this cut-off, we identified 885 participants as related. Since excluding them wouldlead to loss of power and possible selection bias, we kept related individuals in the sampleand used robust variance estimators to correct results of all multivariate analysis for familystructure.
Principal component analysis [28] was used to create a physical health score that includedthe following measures: systolic blood pressure, body mass index, ratio of total cholesterolto high density lipoprotein cholesterol, hemoglobin value, white blood cell count, log-trans-formed blood glucose value, log-transformed plasma BNP value (all continuous variables),and T. cruzi infection (yes or no). Scores may range from -1 to +1. Higher scores indicatedworse health.
We used negative binomial regression (for dichotomous variables) and ordinary leastsquares regression (for continuous variables) to examine the age and sex (plus family structure)adjusted association between genomic ancestry and ethnoracial self-classification with school-ing, household income, health behaviors, physical functioning (all dichotomous variables) andthe physical health score (a continuous variable) defined above.
We used mixed-effects logistic regression to estimate odds ratios and 95% confidence inter-vals to model baseline and 10-year SRH trajectory, using poor SRH as the reference category.[29] To take into account dropouts that could be related to the outcome, we applied the pattern
Genomic Ancestry, Self-Rated Health and Mortality
PLOS ONE | DOI:10.1371/journal.pone.0144456 December 17, 2015 4 / 14
mixture model. [30] This entailed creating a factor variable representing the time of the lastvalid observation and including it in statistical models as both a main effect and an interactionterm with the time variable. We examined the significance of the effect of multiplicative inter-actions between ancestry in tertiles and self-classification on SRH trajectories, by means ofcross-product terms with time. Models were adjusted for the sociodemographic and health fac-tors identified above.
We estimated adjusted hazard ratios and 95% confidence intervals for the associationbetween baseline SRH and time dependent SRH, and subsequent mortality, using Cox pro-portional hazards models [31] after confirming that the assumption of proportionalityamong the hazards was met; time scale was number of years since the baseline We examinedseparately the influence of each genome-wide ancestry and ethnoracial self-classification onthis association. All hazard ratios were adjusted for age, sex, schooling, household income,health behaviors, physical functioning and physical health score, as previously described.Additionally, we examined the significance of the effect of multiplicative interactionsbetween each genomic ancestry tertile and baseline and SRH trajectories on subsequent mor-tality by means of cross-product terms in fully adjusted Cox proportional hazards regressionmodels. We used a clustered robust variance estimate in these analyses to take into accountclustering of individuals within families. Finally, we conducted supplementary analyses,based on R squared estimates, to quantify how much of the variation in the outcome (survivaltime) is explained by baseline SRH and SRH trajectory, respectively [32].
The multivariable models (described above) were build separately for each tertile of genomicancestry and for ethnoracial self-classification. Separate analyses were performed because Afri-can, Native American and European ancestry proportions are complementary measures,whose sum is equal to 1. Further, ethnoracial self-classification showed a strong correlationwith each of the genomic ancestries in exploratory analysis. Thus, we opted for not controllingself-classification for ancestry and vice-versa.
Statistical analyses were conducted using Stata 13.1 statistical software. All p-values were2-tailed (alpha = 0.05).
Results
DescriptiveOf the 1,606 baseline cohort participants, complete data on all study variables were availablefor 1,311 persons, who were included in the current analysis. As can be seen in Table 1, themean age of participants at baseline was 68.1 years and 61.4% were women. European ancestrypredominated, followed by African and Native American (median = 84.0%, 9.6% and 5.3%,respectively), and prevalence of self-identified Non-White (Mixed or Black) was 39.8%. Mostparticipants had some degree of admixture of African, European and Native American ances-try, as shown in Fig 1.
Overall, 18.5% of participants rated their health as poor or very poor. As shown in Table 2,there was a significant increase (p<0.001 in the chi-squared test for trend) in the prevalence ofpoor SRH ranging from 13.3% among people at the lowest levels of African ancestry to 19.5%among those at intermediate levels to 19.5% among those at the highest tertile of African ances-try (28.9%); a similar trend (p<0.001) was found for tertiles of Native American ancestry(12.8%, 18.8%, 24.0%; p<0.001). In contrast, persons at the highest tertile of European ancestrywere significantly (p<0.001) less likely to report poor health (13.0%) relative to those at theintermediate (19.5%) and lowest tertiles (23.1%). Self-classified Non-White persons were sig-nificantly (p<0.05) more likely to report poor health (21.8%) compared to those who self-clas-sified as White (16.4%).
Genomic Ancestry, Self-Rated Health and Mortality
PLOS ONE | DOI:10.1371/journal.pone.0144456 December 17, 2015 5 / 14
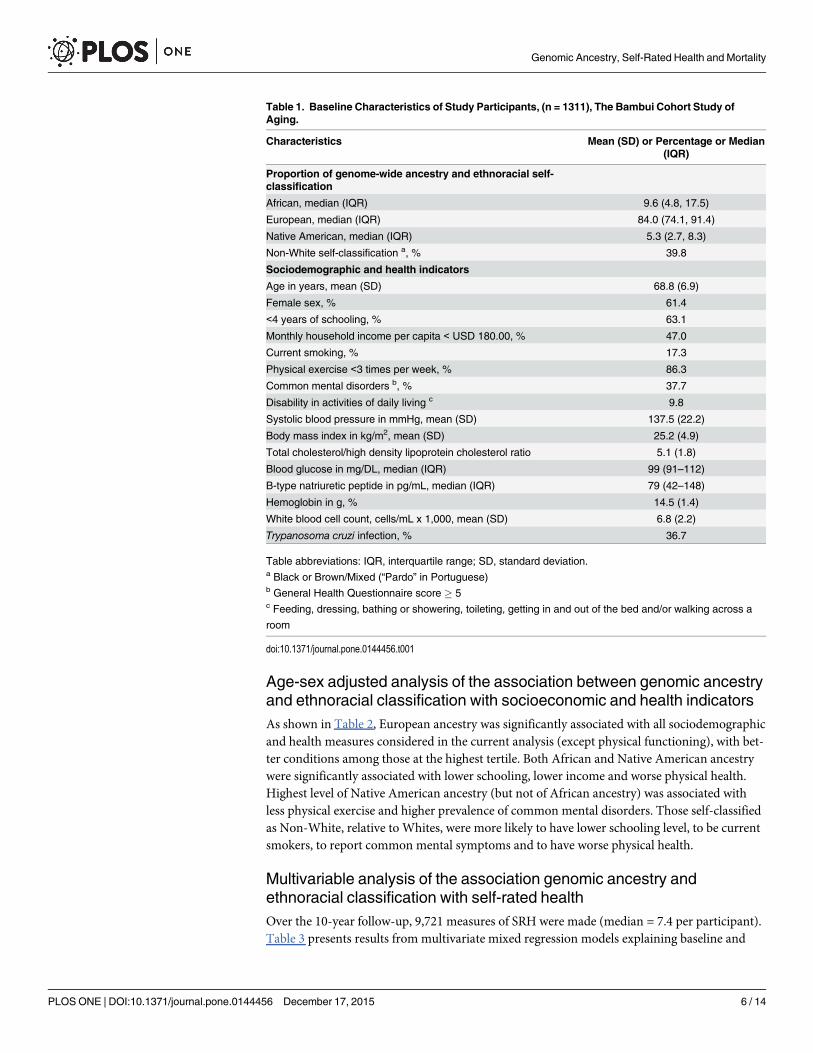
Age-sex adjusted analysis of the association between genomic ancestryand ethnoracial classification with socioeconomic and health indicatorsAs shown in Table 2, European ancestry was significantly associated with all sociodemographicand health measures considered in the current analysis (except physical functioning), with bet-ter conditions among those at the highest tertile. Both African and Native American ancestrywere significantly associated with lower schooling, lower income and worse physical health.Highest level of Native American ancestry (but not of African ancestry) was associated withless physical exercise and higher prevalence of common mental disorders. Those self-classifiedas Non-White, relative to Whites, were more likely to have lower schooling level, to be currentsmokers, to report common mental symptoms and to have worse physical health.
Multivariable analysis of the association genomic ancestry andethnoracial classification with self-rated healthOver the 10-year follow-up, 9,721 measures of SRH were made (median = 7.4 per participant).Table 3 presents results from multivariate mixed regression models explaining baseline and
Table 1. Baseline Characteristics of Study Participants, (n = 1311), The Bambui Cohort Study ofAging.
Characteristics Mean (SD) or Percentage or Median(IQR)
Proportion of genome-wide ancestry and ethnoracial self-classification
African, median (IQR) 9.6 (4.8, 17.5)
European, median (IQR) 84.0 (74.1, 91.4)
Native American, median (IQR) 5.3 (2.7, 8.3)
Non-White self-classification a, % 39.8
Sociodemographic and health indicators
Age in years, mean (SD) 68.8 (6.9)
Female sex, % 61.4
<4 years of schooling, % 63.1
Monthly household income per capita < USD 180.00, % 47.0
Current smoking, % 17.3
Physical exercise <3 times per week, % 86.3
Common mental disorders b, % 37.7
Disability in activities of daily living c 9.8
Systolic blood pressure in mmHg, mean (SD) 137.5 (22.2)
Body mass index in kg/m2, mean (SD) 25.2 (4.9)
Total cholesterol/high density lipoprotein cholesterol ratio 5.1 (1.8)
Blood glucose in mg/DL, median (IQR) 99 (91–112)
B-type natriuretic peptide in pg/mL, median (IQR) 79 (42–148)
Hemoglobin in g, % 14.5 (1.4)
White blood cell count, cells/mL x 1,000, mean (SD) 6.8 (2.2)
Trypanosoma cruzi infection, % 36.7
Table abbreviations: IQR, interquartile range; SD, standard deviation.a Black or Brown/Mixed (“Pardo” in Portuguese)b General Health Questionnaire score � 5c Feeding, dressing, bathing or showering, toileting, getting in and out of the bed and/or walking across a
room
doi:10.1371/journal.pone.0144456.t001
Genomic Ancestry, Self-Rated Health and Mortality
PLOS ONE | DOI:10.1371/journal.pone.0144456 December 17, 2015 6 / 14

changes in SRH over time. The results show that the association between poor SRH at thebaseline and each genomic ancestry group remains largely significant after adjustments forschooling, education, lifestyle, mental health, physical functioning and physical health score,besides age and sex. Those in the highest tertile of African ancestry were about twice as likelyto report poor health (Odds ratio [OR] = 1.98; 95% CI 1.34, 2.93) compared with those in thelowest tertile of African ancestry. For Native American ancestry, both intermediate and high-est ancestry levels were significant and suggested a graded relationship (OR = 1.71; 95% CI1.13, 2.60 and OR = 2.28; 95% CI 1.54, 3.38, respectively). European ancestry showed theinverse relationship with negative and statistically significant associations with poor SRHamong those at the intermediate and highest tertile levels (OR = 0.68; 95% CI 0.47, 0.99 andOR = 0.51; 95% CI 0.35, 0.74). The corresponding analysis for ethnoracial self-classificationrevealed a significant association between Non-White classification and the likelihood of poorSRH at baseline (OR = 1.47; 95% CI 1.08, 1.99).
With regards to SRH trajectories, Table 4 shows a significant but modest improvement inSRH trajectories among those at the highest tertile of African ancestry relative to those in thelowest tertile (OR = 0.92; 95% CI 0.86, 0.99), and a modest worsening in SRH among those atthe highest European ancestry level (OR = 1.07; 95% CI 1.00, 1.15). No significant associationwas found for Native American ancestry or ethno-racial self-classification.
Multivariable analysis of the association between self-rated health andmortalityDuring a mean follow-up period of 8.9 years, 522 participants died and 84 were lost, leading to11,725 person-years of observation. Overall, the mortality rate was 65.6 per 1,000 person-yearsamong persons who reported poor SRH at baseline compared to 43.3 per 1,000 among those
Fig 1. Tri-Hybrid Genome-Wide Individual Proportion of Ancestry (n = 1,311), Bambui Cohort Study of Ageing. The red, blue and green colorsrepresent the European, African and Native American ancestry proportions, respectively.
doi:10.1371/journal.pone.0144456.g001
Genomic Ancestry, Self-Rated Health and Mortality
PLOS ONE | DOI:10.1371/journal.pone.0144456 December 17, 2015 7 / 14
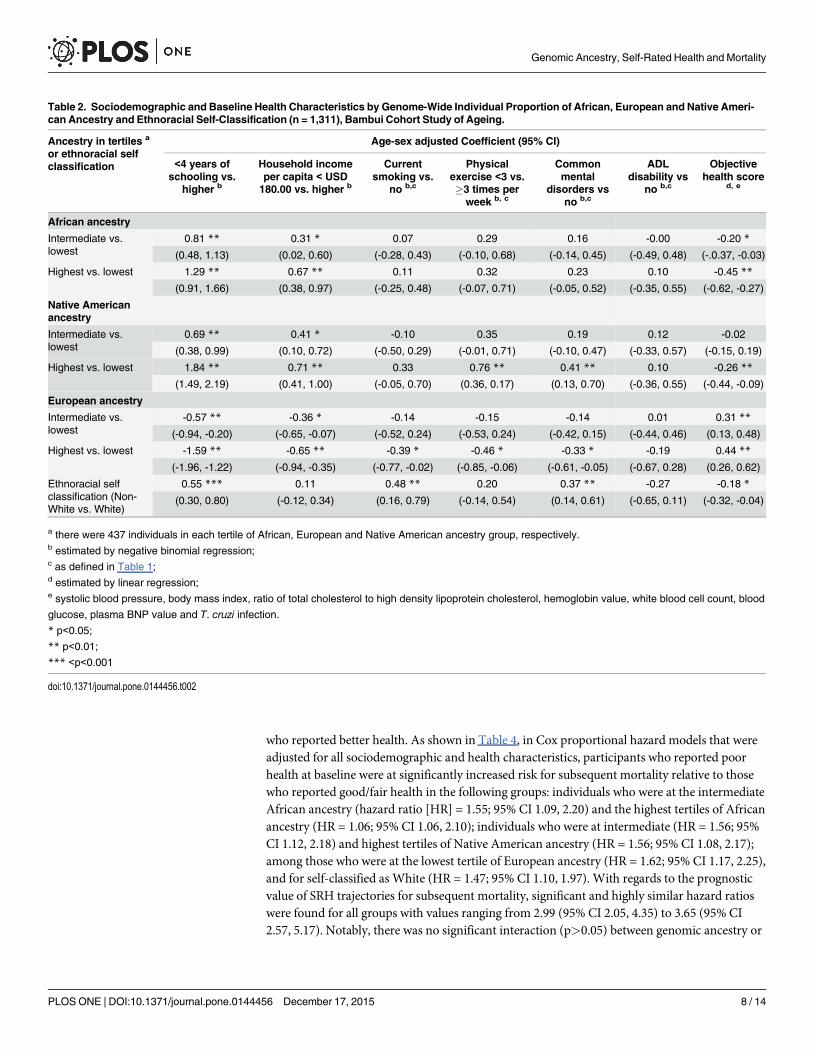
who reported better health. As shown in Table 4, in Cox proportional hazard models that wereadjusted for all sociodemographic and health characteristics, participants who reported poorhealth at baseline were at significantly increased risk for subsequent mortality relative to thosewho reported good/fair health in the following groups: individuals who were at the intermediateAfrican ancestry (hazard ratio [HR] = 1.55; 95% CI 1.09, 2.20) and the highest tertiles of Africanancestry (HR = 1.06; 95% CI 1.06, 2.10); individuals who were at intermediate (HR = 1.56; 95%CI 1.12, 2.18) and highest tertiles of Native American ancestry (HR = 1.56; 95% CI 1.08, 2.17);among those who were at the lowest tertile of European ancestry (HR = 1.62; 95% CI 1.17, 2.25),and for self-classified as White (HR = 1.47; 95% CI 1.10, 1.97). With regards to the prognosticvalue of SRH trajectories for subsequent mortality, significant and highly similar hazard ratioswere found for all groups with values ranging from 2.99 (95% CI 2.05, 4.35) to 3.65 (95% CI2.57, 5.17). Notably, there was no significant interaction (p>0.05) between genomic ancestry or
Table 2. Sociodemographic and Baseline Health Characteristics by Genome-Wide Individual Proportion of African, European and Native Ameri-can Ancestry and Ethnoracial Self-Classification (n = 1,311), Bambui Cohort Study of Ageing.
Ancestry in tertiles a
or ethnoracial selfclassification
Age-sex adjusted Coefficient (95% CI)
<4 years ofschooling vs.
higher b
Household incomeper capita < USD180.00 vs. higher b
Currentsmoking vs.
no b,c
Physicalexercise <3 vs.�3 times perweek b, c
Commonmental
disorders vsno b,c
ADLdisability vs
no b,c
Objectivehealth score
d, e
African ancestry
Intermediate vs.lowest
0.81 ** 0.31 * 0.07 0.29 0.16 -0.00 -0.20 *
(0.48, 1.13) (0.02, 0.60) (-0.28, 0.43) (-0.10, 0.68) (-0.14, 0.45) (-0.49, 0.48) (-.0.37, -0.03)
Highest vs. lowest 1.29 ** 0.67 ** 0.11 0.32 0.23 0.10 -0.45 **
(0.91, 1.66) (0.38, 0.97) (-0.25, 0.48) (-0.07, 0.71) (-0.05, 0.52) (-0.35, 0.55) (-0.62, -0.27)
Native Americanancestry
Intermediate vs.lowest
0.69 ** 0.41 * -0.10 0.35 0.19 0.12 -0.02
(0.38, 0.99) (0.10, 0.72) (-0.50, 0.29) (-0.01, 0.71) (-0.10, 0.47) (-0.33, 0.57) (-0.15, 0.19)
Highest vs. lowest 1.84 ** 0.71 ** 0.33 0.76 ** 0.41 ** 0.10 -0.26 **
(1.49, 2.19) (0.41, 1.00) (-0.05, 0.70) (0.36, 0.17) (0.13, 0.70) (-0.36, 0.55) (-0.44, -0.09)
European ancestry
Intermediate vs.lowest
-0.57 ** -0.36 * -0.14 -0.15 -0.14 0.01 0.31 **
(-0.94, -0.20) (-0.65, -0.07) (-0.52, 0.24) (-0.53, 0.24) (-0.42, 0.15) (-0.44, 0.46) (0.13, 0.48)
Highest vs. lowest -1.59 ** -0.65 ** -0.39 * -0.46 * -0.33 * -0.19 0.44 **
(-1.96, -1.22) (-0.94, -0.35) (-0.77, -0.02) (-0.85, -0.06) (-0.61, -0.05) (-0.67, 0.28) (0.26, 0.62)
Ethnoracial selfclassification (Non-White vs. White)
0.55 *** 0.11 0.48 ** 0.20 0.37 ** -0.27 -0.18 *
(0.30, 0.80) (-0.12, 0.34) (0.16, 0.79) (-0.14, 0.54) (0.14, 0.61) (-0.65, 0.11) (-0.32, -0.04)
a there were 437 individuals in each tertile of African, European and Native American ancestry group, respectively.b estimated by negative binomial regression;c as defined in Table 1;d estimated by linear regression;e systolic blood pressure, body mass index, ratio of total cholesterol to high density lipoprotein cholesterol, hemoglobin value, white blood cell count, blood
glucose, plasma BNP value and T. cruzi infection.
* p<0.05;
** p<0.01;
*** <p<0.001
doi:10.1371/journal.pone.0144456.t002
Genomic Ancestry, Self-Rated Health and Mortality
PLOS ONE | DOI:10.1371/journal.pone.0144456 December 17, 2015 8 / 14

ethnoracial classification on the predictive value of both baseline and SRH trajectories for subse-quent mortality.
Overall, the variation in mortality (survival time) explained by repeated measures of SRHwas about 40% higher (R2 = 0.41; 95% CI 0.35, 0.49) compared with a single measure of SRH atthe baseline (R2 = 0.29; 95% CI = 0.24, 0.36). The corresponding values ranged from 0.38 (95%CI 0.28, 0.53) to 0.45 (95%CI 0.36, 0.59) across genome-wide ancestry and ethno-racial selfidentified groups for SRH trajectory, and from 0.25 (95% CI 0.17, 0.40) to 0.34 (95% CI 0.26,0.49) for a single baseline measure of SRH.
DiscussionMajor results of this study demonstrate that: first, persons at higher levels of African andNative American genomic ancestry, as well as those self-identified as Non-White, were morelikely to report poor health at baseline than other groups, even after controlling for socioeco-nomic conditions, health behaviors, mental health, physical functioning and a wide array ofobjective measures of physical health; second, given that baseline SRH was the strongest pre-dictor of health assessment trajectories, those with higher African and Native American
Table 3. Results of the Multivariable Analysis of the Association Between Baseline and 10-year Trajectory of Self-Rated Health (SRH)WithGenome-Wide Individual Proportion of African, European and Native American Ancestry and Ehnoracial Self-Classification (n = 1,311), BambuiCohort Study of Ageing.
Ancestry in tertiles a or ethnoracial selfclassification
Mixed-Model Odds Ratio Estimate (95% CI) b
Time c Baseline SRH(Poor vs.Better)
10 Year of SRH Trajectory(Poor vs.Better) d
African ancestry
Lowest 1.08 (0.82,1.42)
1.0 1.0
Intermediate - 1.30 (0.85, 1.98) 0.98 (0.91, 1.06)
Highest - 1.98 (1.34, 2.93) * 0.92 (0.86, 0.99) *
Native American ancestry
Lowest 1.10 (0.84,1.45)
1.0 1.0
Intermediate - 1.71 (1.13, 2.60) * 0.94 (0.87, 1.02)
Highest - 2.28 (1.54, 3.38) ** 0.94 (0.87, 1.01)
European ancestry
Lowest 1.02 (0.78,1.33)
1.0 1.0
Intermediate - 0.68 (0.47, 0.99) * 1.01 (0.94, 1.10)
Highest - 0.51 (0.35, 0.74) ** 1.07 (1.00, 1.15) *
Ethno-racial self-classification
White 1.04 (0.80,1.36)
1.0 1.0
Non-White - 1.47 (1.08, 1.99) 0.99 (0.93, 1.05)
a there were 437 individuals in each tertile of African, European and Native American ancestry group, respectively;b Adjusted for age, sex, schooling, household income per capita, current smoking, physical exercises, common mental disorders and activity of daily living
disability (all dichotomous variables) and health score (a continuous variable) as defined in Table 2. Time scale was number of years since baseline.c Reference for each ancestry group;d interaction between ancestry tertile and time on SRH trajectory
* p<0.05;
** p<0.01
doi:10.1371/journal.pone.0144456.t003
Genomic Ancestry, Self-Rated Health and Mortality
PLOS ONE | DOI:10.1371/journal.pone.0144456 December 17, 2015 9 / 14
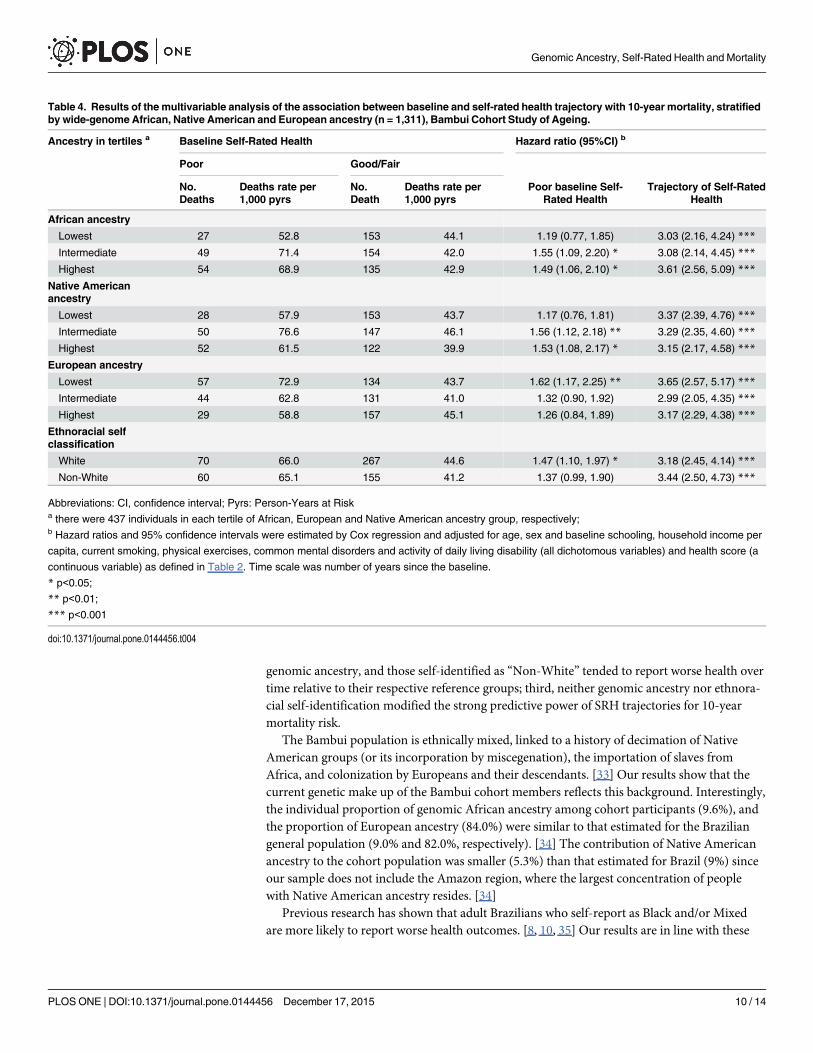
genomic ancestry, and those self-identified as “Non-White” tended to report worse health overtime relative to their respective reference groups; third, neither genomic ancestry nor ethnora-cial self-identification modified the strong predictive power of SRH trajectories for 10-yearmortality risk.
The Bambui population is ethnically mixed, linked to a history of decimation of NativeAmerican groups (or its incorporation by miscegenation), the importation of slaves fromAfrica, and colonization by Europeans and their descendants. [33] Our results show that thecurrent genetic make up of the Bambui cohort members reflects this background. Interestingly,the individual proportion of genomic African ancestry among cohort participants (9.6%), andthe proportion of European ancestry (84.0%) were similar to that estimated for the Braziliangeneral population (9.0% and 82.0%, respectively). [34] The contribution of Native Americanancestry to the cohort population was smaller (5.3%) than that estimated for Brazil (9%) sinceour sample does not include the Amazon region, where the largest concentration of peoplewith Native American ancestry resides. [34]
Previous research has shown that adult Brazilians who self-report as Black and/or Mixedare more likely to report worse health outcomes. [8, 10, 35] Our results are in line with these
Table 4. Results of the multivariable analysis of the association between baseline and self-rated health trajectory with 10-year mortality, stratifiedby wide-genome African, Native American and European ancestry (n = 1,311), Bambui Cohort Study of Ageing.
Ancestry in tertiles a Baseline Self-Rated Health Hazard ratio (95%CI) b
Poor Good/Fair
No.Deaths
Deaths rate per1,000 pyrs
No.Death
Deaths rate per1,000 pyrs
Poor baseline Self-Rated Health
Trajectory of Self-RatedHealth
African ancestry
Lowest 27 52.8 153 44.1 1.19 (0.77, 1.85) 3.03 (2.16, 4.24) ***
Intermediate 49 71.4 154 42.0 1.55 (1.09, 2.20) * 3.08 (2.14, 4.45) ***
Highest 54 68.9 135 42.9 1.49 (1.06, 2.10) * 3.61 (2.56, 5.09) ***
Native Americanancestry
Lowest 28 57.9 153 43.7 1.17 (0.76, 1.81) 3.37 (2.39, 4.76) ***
Intermediate 50 76.6 147 46.1 1.56 (1.12, 2.18) ** 3.29 (2.35, 4.60) ***
Highest 52 61.5 122 39.9 1.53 (1.08, 2.17) * 3.15 (2.17, 4.58) ***
European ancestry
Lowest 57 72.9 134 43.7 1.62 (1.17, 2.25) ** 3.65 (2.57, 5.17) ***
Intermediate 44 62.8 131 41.0 1.32 (0.90, 1.92) 2.99 (2.05, 4.35) ***
Highest 29 58.8 157 45.1 1.26 (0.84, 1.89) 3.17 (2.29, 4.38) ***
Ethnoracial selfclassification
White 70 66.0 267 44.6 1.47 (1.10, 1.97) * 3.18 (2.45, 4.14) ***
Non-White 60 65.1 155 41.2 1.37 (0.99, 1.90) 3.44 (2.50, 4.73) ***
Abbreviations: CI, confidence interval; Pyrs: Person-Years at Riska there were 437 individuals in each tertile of African, European and Native American ancestry group, respectively;b Hazard ratios and 95% confidence intervals were estimated by Cox regression and adjusted for age, sex and baseline schooling, household income per
capita, current smoking, physical exercises, common mental disorders and activity of daily living disability (all dichotomous variables) and health score (a
continuous variable) as defined in Table 2. Time scale was number of years since the baseline.
* p<0.05;
** p<0.01;
*** p<0.001
doi:10.1371/journal.pone.0144456.t004
Genomic Ancestry, Self-Rated Health and Mortality
PLOS ONE | DOI:10.1371/journal.pone.0144456 December 17, 2015 10 / 14

reports and add to them by showing that; 1) ethnoracial disparities in health may occur even insmall, tightly-knit populations with relatively small differences in education and income levels;and 2) ethnoracial disparities were apparent not only in schooling and income, health behav-iors and mental health-factors that can be observed by individuals themselves and by otherpeople around them, but also in laboratory and other objective health measures.
A major explanation for socioeconomic disparities associated with African ancestry in Bra-zil is the cumulative effect of the lack of social policies designed to support the newly freedslaves and their descendants since the abolition of slavery in 1888 up to the last decades of the20th century. [11,36] As a consequence, persons of African origin are more likely to have lowerincome and education [8, 11]. They also experience race-based discrimination in other realmsof life. [37, 38] The most comprehensive studies in Latin American investigating the associa-tion between SRH and ethnoracial classification concluded that socio economic differencesfully mediate this association. [8, 9] Our results show a different picture. In the current analysis,based on older adults with low socioeconomic and educational levels, poor SRH remained asso-ciated with higher levels of African and Native American ancestries and non-White self-identi-fication, independent of education, household income and several health indicators.
As a consequence of sustained marginalization, indigenous populations through LatinAmerica tend to live in more isolated communities and experience higher rates of mortalityand morbidity than the general population. [37, 38] Individuals with indigenous parentagemay sometimes prefer to self-identify as White or Mixed (“pardo”in Portuguese ormestizo inSpanish), especially if they live in urban areas. [9, 38] Therefore, self-reports tend to underesti-mate Native American ancestry. This is true for the Brazilian population as a whole (only 1%of the total population declared being indigenous in the most recent census [12]), as well as forthe Bambui cohort population, in which no participant identified himself as being Indigenous.Previous studies showed poorer SRH in persons self-identified as indigenous and/or havingindigenous parentage. [9, 38] Our results showed a graded increase in the likelihood of poorSRH among people with increasing levels of Native American ancestry, independent of otherrelevant factors.
Self-rated health appears to be a universal predictor of mortality. This association has beenreported in very different populations and countries [1–3], including Brazil. [4,17] Why SRHhas prognostic value for mortality is not well understood [2]. The most intuitive explanation isthat SRH reflects an individual’s awareness of symptoms, diagnoses, or diminished function-ing, all of which are associated with mortality risk. [2] Others argue that SRH represents abroader dimension of health than do these domains, and its ability to predict mortality isbecause SRH reflects the general state of the human organism [2]. There are within group dif-ferences in the ability of SRH to predict mortality. SRH seems to be a stronger predictor forWhites than for other groups, at least in the United States. [39] SRH appears to be a weakerpredictor of mortality in older compared to younger age groups, possibly because of new and/or life-threatening health events with advancing age [2, 40, 41]. To our knowledge, no previousstudy has investigated the influence of genomic ancestry, as well as that of ethnoracial self-clas-sification, on the ability of SRH to predict mortality in Latin America. To approach the subjectwe used to two measures of SRH, i.e. a single measure of SRH at baseline and SRH trajectory ameasure that captures changes over time. Our results indicate that SRH trajectory is a strongerpredictor of mortality for all genomic ancestry and ethnoracial categories than the traditionalSRH single baseline measure. Increased risks for mortality associated with worse SRH trajec-tory were strong and remarkably similar (hazard ratio ~3) across all genomic ancestry and eth-noracial groups.
This study has strengths and limitations. Strengths of the study include the community-based sample, standardized and systematic measurement of parameters at baseline, annual
Genomic Ancestry, Self-Rated Health and Mortality
PLOS ONE | DOI:10.1371/journal.pone.0144456 December 17, 2015 11 / 14

measures of SRH, continuous surveillance of mortality according to standardized criteria, andminimal loss of participants to follow-up. Another major strength is the use of genome-widemeasures of ancestry. Genomic ancestry does not change over time, while self-classification isprone to misclassification, particularly in admixed populations, and can even fluctuate overtime, due to changing social norms. [11] Previous Latin American studies were cross sectionalin nature and considered few health conditions as potential confounders (all of them self-reported) for the association between ethnoracial classification and SRH. [8–10] Our studyincorporated a much more robust set of measures of determinants of SRH, allowing us to makemore meaningful estimates of ancestry/ethnoracial classification and its association with SRHand mortality over time. However, even given the range of health and health-related variablesincluded in this study, there may be additional unmeasured factors that confound our results.Thus, we cannot discard the possibility of the existence of other variables affecting our results,including unknown genetic factors that might predispose an individual towards poor SRH.
In conclusion, our analyses provide new insights based on solid data on the associationbetween genomic ancestry/ethnoracial and SRH, as well as on its prognostic value for mortal-ity. Our results demonstrate for the first time that higher levels of African and Native Americangenomic ancestry–and the inverse for European ancestry–were strongly correlated with worseSRH in a Latin American admixed population. Further, genomic ancestry/ethnoracial classifi-cation did not modify the strong predictive power of SRH for mortality. Further research isneeded to identify the set of mechanisms by which ethnoracial ancestry and the social con-structions of ethnoracial ethnic identities may interact to cause the observed disparities inSRH.
AcknowledgmentsThis work was supported by the Department of Science and Technology (DECIT, Ministry ofHealth) and National Fund for Scientific and Technological Development (FNDCT, Ministryof Science and Technology), Funding of Studies and Projects (FINEP, Ministry of Science andTechnology, Brazil), Coordination of Improvement of Higher Education Personnel (CAPES,Ministry of Education, Brazil). MFLC, SVP, JOAF, FAP, CCC and ETS are fellow researchersof the National Council for Research and Technological Development (CNPq).
Author ContributionsConceived and designed the experiments: MFFLC JM JVMM ETS. Performed the experiments:MFLC JM JVdMM CCC SVPWCSM BLHMB ECC JOAF FAP TPL MRR AP ETS. Analyzedthe data: MFFLC JM JVMMMLCL. Wrote the paper: MFLC JM JVdMM CCC SVPWCSMBLHMB ECC JOAF FAP TPL MRR AP ETS.
References1. Idler EL, Benyamini Y. Self-rated health and mortality: a review of twenty-seven community studies.
Journal of health and social behavior 1997; 38(1):21–37. PMID: 9097506
2. Jylha M. What is self-rated health and why does it predict mortality? Towards a unified conceptualmodel. Social science & medicine 2009; 69(3):307–16.
3. DeSalvo KB, Bloser N, Reynolds K, Jiang He, Muntner P. Mortality prediction with a single general self-rated health question. A meta-analysis. Journal of general internal medicine 2006; 21(3):267–75.PMID: 16336622
4. Lima-Costa MF, Steptoe A, Cesar CC, De Oliveira C, Proietti FA, Marmot M. The influence of socioeco-nomic status on the predictive power of self-rated health for 6-year mortality in English and Brazilianolder adults: the ELSA and Bambui cohort studies. Annals of epidemiology 2012; 22(9):644–8. doi: 10.1016/j.annepidem.2012.06.101 PMID: 22819435
Genomic Ancestry, Self-Rated Health and Mortality
PLOS ONE | DOI:10.1371/journal.pone.0144456 December 17, 2015 12 / 14

5. Lopez R. Income inequality and self-rated health in USmetropolitan areas: a multi-level analysis. Socialscience & medicine 2004; 59(12):2409–19.
6. Meyer OL, Castro-Schilo L, Aguilar-Gaxiola S. Determinants of mental health and self-rated health: amodel of socioeconomic status, neighborhood safety, and physical activity. American journal of publichealth 2014; 104(9):1734–41. doi: 10.2105/AJPH.2014.302003 PMID: 25033151
7. Kwate NO, Goodman MS. An empirical analysis of White privilege, social position and health. Socialscience & medicine 2014; 116:150–60.
8. Travassos C, Laguardia J, Marques PM, Mota JC, Szwarcwald CL. Comparison between two race/skincolor classifications in relation to health-related outcomes in Brazil. International journal for equity inhealth 2011; 10:35. doi: 10.1186/1475-9276-10-35 PMID: 21867522
9. Perreira KM, Telles EE. The color of health: skin color, ethnoracial classification, and discrimination inthe health of Latin Americans. Social science & medicine 2014; 116:241–50.
10. Oliveira BL, Thomaz EB, Silva RA. The association between skin color/race and health indicators inelderly Brazilians: a study based on the Brazilian National Household Sample Survey (2008). Cadernosde saude publica 2014; 30(7):1438–52. PMID: 25166941
11. Telles EE. Race in Another America: The Significance of Skin Color in Brazil. Princeton, NJ: PrincetonUniversity Press; 2004.
12. Instituto Brasileiro de Geografia e Estatistica—IBGE. Atlas do Censo Demografico de 2010. Rio deJaneiro, Brazil: Instituto Brasileiro de Geografia e Estatistica—IBGE, 2013.
13. Lima-Costa MF, Rodrigues LC, Barreto ML, Gouveia M, Horta BL, Mambrini J, et al. Genomic-wideancestry and ethnoracial self-classification based on 5,871 community-dwelling Brazilians (The EpigenInitiative). SREP 5: 9812 | doi: 10.1038/srep09812
14. Lima-Costa MF, Firmo JO, Uchoa E. Cohort profile: the Bambui (Brazil) Cohort Study of Ageing. Inter-national journal of epidemiology 2011; 40(4):862–7. doi: 10.1093/ije/dyq143 PMID: 20805109
15. Viruell-Fuentes EA, Morenoff JD, Williams DR, House JS. Language of interview, self-rated health, andthe other Latino health puzzle. American journal of public health 2011; 101(7):1306–13. doi: 10.2105/AJPH.2009.175455 PMID: 21164101
16. Jurges H. True health vs response styles: exploring cross-country differences in self-reported health.Health economics 2007; 16(2):163–78. PMID: 16941555
17. Lima-Costa MF, Cesar CC, Chor D, Proietti FA. Self-rated health compared with objectively measuredhealth status as a tool for mortality risk screening in older adults: 10-year follow-up of the BambuiCohort Study of Aging. American journal of epidemiology 2012; 175(3):228–35. doi: 10.1093/aje/kwr290 PMID: 22193172
18. International HapMap C, Altshuler DM, Gibbs RA, et al. Integrating common and rare genetic variationin diverse human populations. Nature 2010; 467(7311):52–8. doi: 10.1038/nature09298 PMID:20811451
19. Li JZ, Absher DM, Tang H, Southwick AM, Casto AM, Ramachandran S, et al. Worldwide human rela-tionships inferred from genome-wide patterns of variation. Science 2008; 319(5866):1100–4. doi: 10.1126/science.1153717 PMID: 18292342
20. Costa E, Barreto SM, Uchoa E, Firmo JO, Lima-Costa MF, Prince M. Is the GDS-30 better than theGHQ-12 for screening depression in elderly people in the community? The Bambui Health Aging Study(BHAS). International psychogeriatrics / IPA 2006; 18(3):493–503. PMID: 16478572
21. Beleigoli AM, Boersma E, Diniz Mde F, Lima-Costa MF, Ribeiro AL. Overweight and class I obesity areassociated with lower 10-year risk of mortality in Brazilian older adults: the Bambui Cohort Study ofAgeing. PloS one 2012; 7(12):e52111. doi: 10.1371/journal.pone.0052111 PMID: 23251690
22. Beleigoli AM, Boersma E, Diniz Mde F, Vidigal PG, Lima-Cost MF, Ribeiro AL. C-reactive protein andB-type natriuretic peptide yield either a non-significant or a modest incremental value to traditional riskfactors in predicting long-term overall mortality in older adults. PloS one 2013; 8(9):e75809. doi: 10.1371/journal.pone.0075809 PMID: 24244755
23. Lima-Costa MF, Matos DL, Ribeiro AL. Chagas disease predicts 10-year stroke mortality in community-dwelling elderly: the Bambui cohort study of aging. Stroke; a journal of cerebral circulation 2010; 41(11):2477–82. doi: 10.1161/STROKEAHA.110.588061 PMID: 20864663
24. Lima-Costa MF, Cesar CC, Peixoto SV, Ribeiro AL. Plasma B-type natriuretic peptide as a predictor ofmortality in community-dwelling older adults with Chagas disease: 10-year follow-up of the BambuiCohort Study of Aging.American journal of epidemiology 2010; 172(2):190–6. doi: 10.1093/aje/kwq106PMID: 20581155
25. Silva CL, Lima-Costa MF, Firmo JO, Peixoto SV. Anemia e nível de hemoglobina como fatores prog-nósticos da mortalidade entre idosos residentes na comunidade: evidências da Coorte de Idosos deBambuí, Minas Gerais, Brasil. Cadernos de saude publica 2013; 29(11):2241–50.
Genomic Ancestry, Self-Rated Health and Mortality
PLOS ONE | DOI:10.1371/journal.pone.0144456 December 17, 2015 13 / 14

26. Alexander DH, Novembre J, Lange K. Fast model-based estimation of ancestry in unrelated individuals.Genome research 2009; 19(9):1655–64. doi: 10.1101/gr.094052.109 PMID: 19648217
27. Thornton T, Tang H, Hoffmann TJ Ochs-Balcom HM, Caan BJ, Risch N. Estimating kinship in admixedpopulations. American journal of human genetics 2012; 91(1):122–38. doi: 10.1016/j.ajhg.2012.05.024PMID: 22748210
28. Ismail K. Unraveling factor analysis. Evidence-based mental health 2008; 11(4):99–102. doi: 10.1136/ebmh.11.4.99 PMID: 18952952
29. Fitzmaurice GM, Laird NM, Ware JH (2011) Applied Longitudinal Analysis ( 2nd ed.). New Jersey:JohnWiley and Sons.
30. Diggle PJ, Heagerty P, Liang K-Y, Zeger S. Analysis of Longitudinal Data ( 2nd edition). New York:Oxford University Press Inc,; 2002.
31. Cox DR. Regression models and life tables. J Royal Stat Soc Ser B 1972; 34:187–220.
32. Royston P. Explained variation for survival models. The Stata Journal 2006; 6(1):83–96.
33. Prefeitura Municipal de Bambui. Historia da cidade. Bambui, MG, Brazil: Webpage Prefeitura Munici-pal de Bambui. Available: http://www.bambui.mg.gov.br/portal/htdocs/modules/mastop_publish/?tac=Hist%C3%B3ria_da_cidade. Accessed 12 January 2015.
34. Ruiz-Linhares A, Kaustubh A, Acuña-Alonso V, Quinto-Sanchez M, Jaramillo C, Arias W, et al. Admix-ture in Latin America: geographic structure, phenotypic diversity and self-perception of ancestry basedon 7,342 individuals. PLoS Genet 10: e1004572 (2014). doi: 10.1371/journal.pgen.1004572 PMID:25254375
35. Chor D, Faerstein E, Kaplan GA, Lynch JW, Lopes CS. Association of weight change with ethnicity andlife course socioeconomic position among Brazilian civil servants. International journal of epidemiology2004; 33(1):100–6. PMID: 15075153
36. Fernandes F. O Negro no Mundo dos Brancos. Sao Paulo, Brazil: Difusão Europeia no Livro; 1972.
37. Telles EE, Flores RD. Not Just Color: Whiteness, Nation, and Status in Latin America. Hispanic Ameri-can Historical Review 2013; 93(3):411–49.
38. Montenegro RA, Stephens C. Indigenous health in Latin America and the Caribbean. The Lancet 2006;367(9525):1859–69.
39. Lee SJ, Moody-Ayres SY, Landefeld CS, Walter LC, Lindquist K, Segal MR, et al. The relationshipbetween self-rated health and mortality in older black and white Americans. Journal of the AmericanGeriatrics Society 2007; 55(10):1624–9. PMID: 17697102
40. Benyamini Y, Blumstein T, Lusky A, Modan B. Gender differences in the self-rated-health mortalityassociation: is it poor self-rated health that predicts mortality or excellent self-rated health that predictssurvival? Gerontologist 2003; 43(3):396–405. PMID: 12810904
41. Franks P, Gold MR, Fiscella K. Sociodemographic, self-rated health, and mortality in the US. Social Sci-ence and Medicine 2003; 56(12): 2505–14. PMID: 12742613
Genomic Ancestry, Self-Rated Health and Mortality
PLOS ONE | DOI:10.1371/journal.pone.0144456 December 17, 2015 14 / 14