Research report: Banking market in Poland, 2017
12
BANKING MARKET IN POLAND 2017-2019 CEE BANKING SERIES by Inteliace Research May 2017 Version: 17.4
-
Upload
inteliace-research -
Category
Economy & Finance
-
view
101 -
download
2
Transcript of Research report: Banking market in Poland, 2017
BANKING MARKET IN POLAND 2017-2019CEE BANKING SERIES
by Inteliace ResearchMay 2017
Version: 17.4

Inteliace Research
Ban
king M
arket in P
olan
d,2017-2019
Banking asset penetration in Poland is close to CEE averages
2
Banking assets/capita, 2016EUR `000
Banking assets/GDP, 2016percent
20.9
19.5
18.6
15.0
13.6
13.0
11.2
10.1
8.9
6.6
4.4
4.3
3.7
3.6
3.4
Czech Rep.
Slovenia
Estonia
Latvia
Slovak Rep.
Croatia
Hungary
Poland
Lithuania
Bulgaria
Romania
Macedonia
Albania
Serbia
BiH
CEE 15* weighted
average: 93
CEE 15* weighted
average: 9.7
126.5
120.5
117.9
116.7
101.0
99.4
97.7
97.4
92.4
90.9
89.4
86.5
75.5
66.7
52.1
Czech Rep.
Croatia
Latvia
Estonia
Slovenia
Bulgaria
Hungary
Albania
Poland
Slovak Rep.
Macedonia
BiH
Serbia
Lithuania
Romania
BASED ON PRELIMINARY 2016 DATA
* Major 15 CEE countries. Russia, Ukraine and Belarus not included** Assets as of Q3 2016Source: Central banks, IMF, Inteliace Research

Inteliace Research
Ban
king M
arket in P
olan
d,2017-2019
Growth in banking assets accelerated again in 2016
3
CAGR*
Total
* Compound Annual Growth Rate** Banks registered in PolandSource: KNF, NBP, Inteliace Research
Banking assets by group of banks, 2011-2016
Foreign bank branches
in PLN billion
IN PLN Domestic commercial banks**
Cooperative banks
% change in the period
1,295 1,350 1,4061,532 1,600
1,711
2011 2012 2013 2014 2015 2016
+7%
1,188 1,236 1,2771,394 1,458 1,554
2011 2012 2013 2014 2015 2016
78 86 97 105 110 121
2011 2012 2013 2014 2015 2016
28 28 32 33 32 37
2011 2012 2013 2014 2015 2016
+10%
+15%
+7%
+9
+5
+6
+6

Inteliace Research
Ban
king M
arket in P
olan
d,2017-2019
Market interest rates have stabilized since 2015
4
0
1
2
3
4
5
6
7
8
9
10
11
12
0.0
0.5
1.0
1.5
2.0
2.5
3.0
3.5
4.0
4.5
5.0
5.5
Jan-10 Jan-11 Jan-12 Jan-13 Jan-14 Jan-15 Jan-16 Jan-17
* Warsaw Interbank Offered Rate – rate used frequently for loan indexing** Polonia rate indicates the real cost of short term funds (O/N), derived from market transactionsSource: NBP, Inteliace Research
Daily O/N deposits turnover (bar chart, right scale in PLN billion)
POLONIA rate(left scale)
% %
0.0
0.5
1.0
1.5
2.0
2.5
3.0
3.5
4.0
4.5
5.0
5.5
Jan-10 Jan-11 Jan-12 Jan-13 Jan-14 Jan-15 Jan-16 Jan-17
• Since Q4 2008, the WIBOR* rate has ceased to represent real cost of moneyin the market, as deposit-rich banks have not been eager to lend money formaturities over 1W to other banks. Most banks have imposed strictcounterparty limits.
• Banks with deficit of own deposits have been forced to look for alternativefunding or to pay for deposits much more than before.
• Polonia rate has become a better indicator for price of o/n funds.
PLN billion
Rates below 1.5%
Warsaw Interbank Offered Rate 6-months [WIBOR6M]
In percent
POLONIA O/N RATE**
In percent
Inteliace Research
Ban
king M
arket in P
olan
d,2017-2019
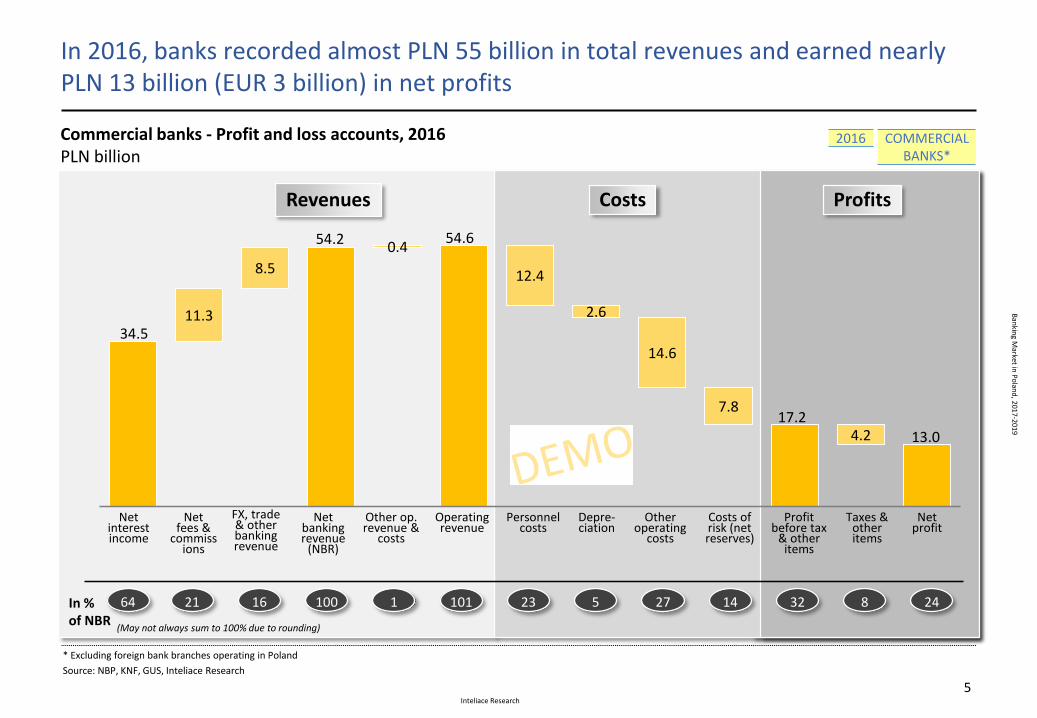
In 2016, banks recorded almost PLN 55 billion in total revenues and earned nearly PLN 13 billion (EUR 3 billion) in net profits
5
Commercial banks - Profit and loss accounts, 2016PLN billion
* Excluding foreign bank branches operating in Poland
Source: NBP, KNF, GUS, Inteliace Research
CostsRevenues
COMMERCIAL BANKS*
2016
34.511.3
8.5
54.20.4
54.6
12.4
2.6
14.6
7.817.2
4.2 13.0
Net interest income
Netfees &
commissions
FX, trade & other banking revenue
Net bankingrevenue
(NBR)
Personnel costs
Other operating
costs
Costs of risk (net reserves)
Profit before tax
& other items
Taxes & other items
Net profit
In %of NBR
Depre-ciation
Other op. revenue &
costs
Operating revenue
(May not always sum to 100% due to rounding)
64 21 16 100 1 101 23 5 27 14 32 8 24
Profits
Inteliace Research
Ban
king M
arket in P
olan
d,2017-2019
6
For a full version of this report please visit:
http://www.inteliace.com/en/00153_Banking_market_in_Poland_2017-2019.html
Inteliace Research
Ban
king M
arket in P
olan
d,2017-2019
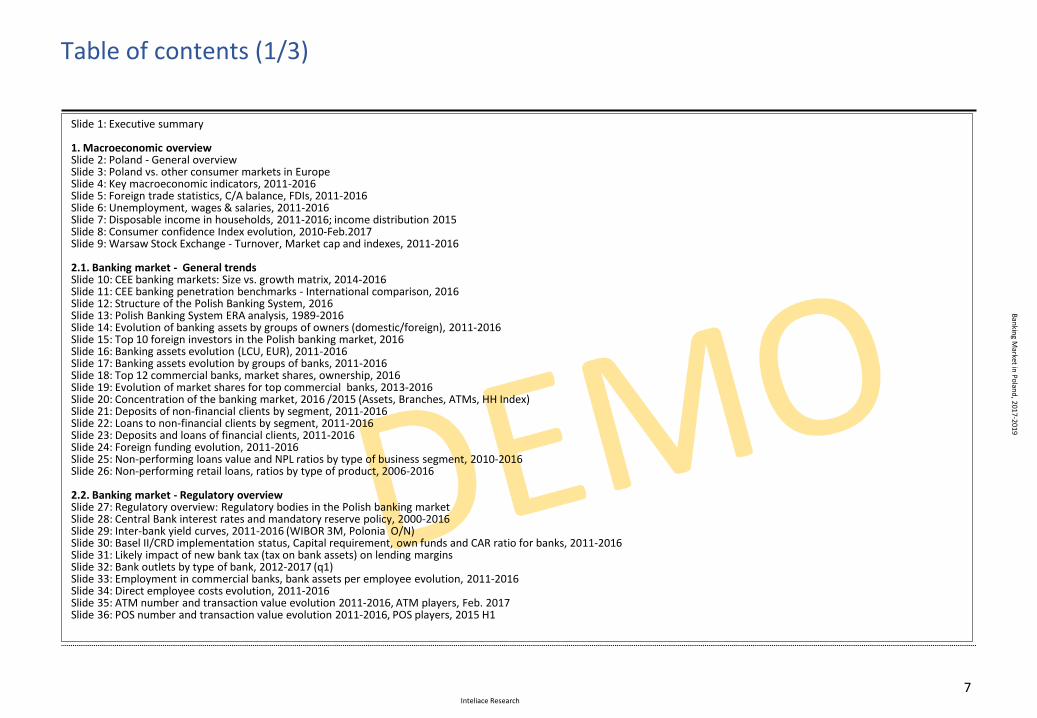
Table of contents (1/3)
7
Slide 1: Executive summary
1. Macroeconomic overviewSlide 2: Poland - General overviewSlide 3: Poland vs. other consumer markets in EuropeSlide 4: Key macroeconomic indicators, 2011-2016Slide 5: Foreign trade statistics, C/A balance, FDIs, 2011-2016Slide 6: Unemployment, wages & salaries, 2011-2016Slide 7: Disposable income in households, 2011-2016; income distribution 2015Slide 8: Consumer confidence Index evolution, 2010-Feb.2017Slide 9: Warsaw Stock Exchange - Turnover, Market cap and indexes, 2011-2016
2.1. Banking market - General trendsSlide 10: CEE banking markets: Size vs. growth matrix, 2014-2016Slide 11: CEE banking penetration benchmarks - International comparison, 2016Slide 12: Structure of the Polish Banking System, 2016Slide 13: Polish Banking System ERA analysis, 1989-2016Slide 14: Evolution of banking assets by groups of owners (domestic/foreign), 2011-2016Slide 15: Top 10 foreign investors in the Polish banking market, 2016Slide 16: Banking assets evolution (LCU, EUR), 2011-2016Slide 17: Banking assets evolution by groups of banks, 2011-2016Slide 18: Top 12 commercial banks, market shares, ownership, 2016Slide 19: Evolution of market shares for top commercial banks, 2013-2016Slide 20: Concentration of the banking market, 2016 /2015 (Assets, Branches, ATMs, HH Index)Slide 21: Deposits of non-financial clients by segment, 2011-2016Slide 22: Loans to non-financial clients by segment, 2011-2016Slide 23: Deposits and loans of financial clients, 2011-2016Slide 24: Foreign funding evolution, 2011-2016Slide 25: Non-performing loans value and NPL ratios by type of business segment, 2010-2016Slide 26: Non-performing retail loans, ratios by type of product, 2006-2016
2.2. Banking market - Regulatory overviewSlide 27: Regulatory overview: Regulatory bodies in the Polish banking marketSlide 28: Central Bank interest rates and mandatory reserve policy, 2000-2016Slide 29: Inter-bank yield curves, 2011-2016 (WIBOR 3M, Polonia O/N)Slide 30: Basel II/CRD implementation status, Capital requirement, own funds and CAR ratio for banks, 2011-2016Slide 31: Likely impact of new bank tax (tax on bank assets) on lending marginsSlide 32: Bank outlets by type of bank, 2012-2017 (q1)Slide 33: Employment in commercial banks, bank assets per employee evolution, 2011-2016Slide 34: Direct employee costs evolution, 2011-2016Slide 35: ATM number and transaction value evolution 2011-2016, ATM players, Feb. 2017Slide 36: POS number and transaction value evolution 2011-2016, POS players, 2015 H1

Inteliace Research
Ban
king M
arket in P
olan
d,2017-2019
Table of contents (2/3)
8
3. Retail bankingSlide 37: Demographic trends determining future number of bank clients, 2015-2030FSlide 38: Retail banking clients by segment - pyramid (mass market, affluent, personal and private banking), 2016Slide 39: Cash in circulation, cash vs. deposits ratio, 2011-2016Slide 40: Household deposits evolution, split local vs. foreign currency, 2011-2016Slide 41: Household deposits by sub-segments, 2015-2016Slide 42: TOP banks serving household sector, market shares, 2016Slide 43: Current account penetration in Poland, Bank account holders demography, 2016Slide 44: Bank account penetration gap: Poland vs. Europe, 2014Slide 45: Current accounts of individuals (ROR) at major banks, 2014-2016Slide 46: Internet use and Internet users in Poland, 2016Slide 47: Number of accounts with online access and number of online accounts actively used, 2011-2016Q3Slide 48: Mobile devices and mobile banking, top banks and number of users, 2015/2016Slide 49: Innovation in payments – digital wallets /mobile payments: MasterPass, PayPal, Visa, PKO IKO, BLIK, PayU, SkyCash, mPay etc.Slide 50: Investment funds assets evolution, domestic and foreign funds, 2011-2016Slide 51: Investment funds - top 10 players, 2016Slide 52: Personal Financial Assets (PFA) structure and evolution, 2013-2016Slide 53: Loans to household sector by type, evolution, 2011-2016Slide 54: Mortgage to household sector by currency, 2011-2016Slide 55: Mortgage to household sector – new sales, outstanding contracts, 2011-2016Slide 56: Consumer lending evolution, 2011-2016Slide 57: Consumer lending – new loans, 2013-2016Slide 58: Financial intermediaries: Value and number of loans sold, 2014-2015
3.1. Payment cardsSlide 59: Cards issued by type, 2011-2016Slide 60: Cards payments: Poland vs. Europe, growth vs. market development stage, 2015Slide 61: Cards payments: International comparison, card payments value, volume, cards issued, 2015Slide 62: Card transactions by type (cashless, cash), share of cash transactions, 2011-2016Slide 63: Credit card transactions , values, volumes, per card evolution, 2011-2016Slide 64: Top players in credit cards business, co-branding partners, 2016
4. Corporate bankingSlide 65: Corporate subjects by size, number, employment, revenues and profits, 2015Slide 66: Corporate subjects, revenue and profit evolution, 2011-2016Slide 67: Number of firms by turnover (with 10+ employees), 2015Slide 68: Corporate subjects, regional distribution, 2016Slide 69: Corporate deposits and loans evolution, 2011-2016Slide 70: Top players in the corporate banking market, market shares in deposits and loans, 2016Slide 71: Brokerage business, top players, shares of investors groups, 2011-2016Slide 72: Leasing market, structure by industry, top players, 2011-2016Slide 73: Factoring market, top players, 2011-2016Slide 74: Non-treasury debt securities market, 2011-2016
Inteliace Research
Ban
king M
arket in P
olan
d,2017-2019
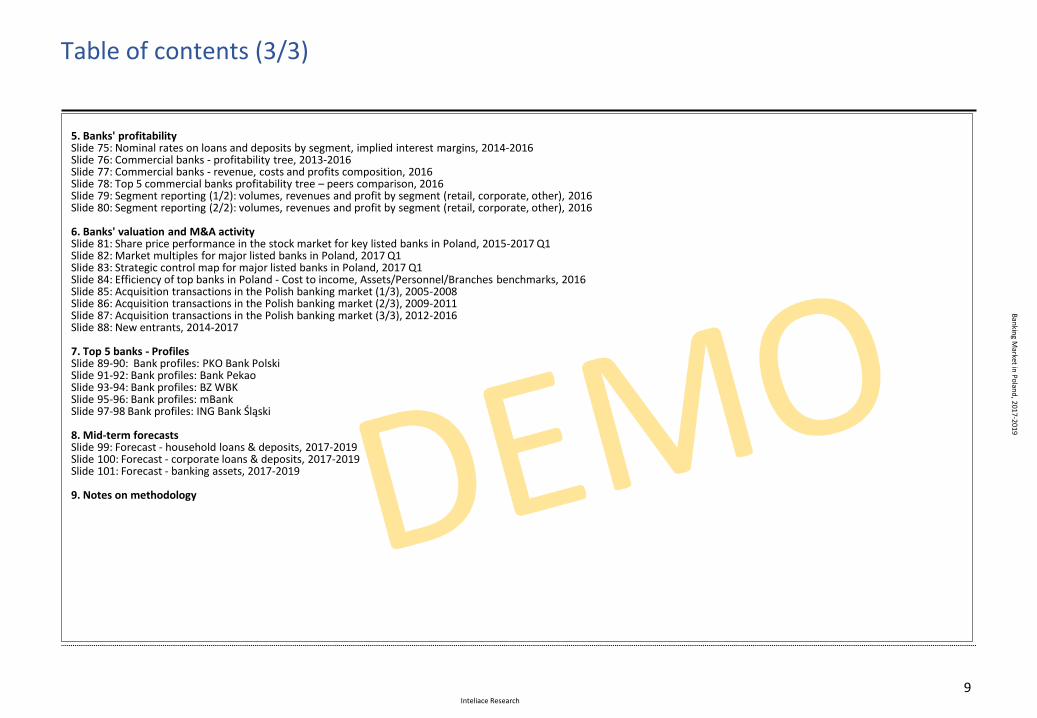
Table of contents (3/3)
9
5. Banks' profitabilitySlide 75: Nominal rates on loans and deposits by segment, implied interest margins, 2014-2016Slide 76: Commercial banks - profitability tree, 2013-2016Slide 77: Commercial banks - revenue, costs and profits composition, 2016Slide 78: Top 5 commercial banks profitability tree – peers comparison, 2016Slide 79: Segment reporting (1/2): volumes, revenues and profit by segment (retail, corporate, other), 2016Slide 80: Segment reporting (2/2): volumes, revenues and profit by segment (retail, corporate, other), 2016
6. Banks' valuation and M&A activitySlide 81: Share price performance in the stock market for key listed banks in Poland, 2015-2017 Q1Slide 82: Market multiples for major listed banks in Poland, 2017 Q1Slide 83: Strategic control map for major listed banks in Poland, 2017 Q1Slide 84: Efficiency of top banks in Poland - Cost to income, Assets/Personnel/Branches benchmarks, 2016Slide 85: Acquisition transactions in the Polish banking market (1/3), 2005-2008Slide 86: Acquisition transactions in the Polish banking market (2/3), 2009-2011Slide 87: Acquisition transactions in the Polish banking market (3/3), 2012-2016Slide 88: New entrants, 2014-2017
7. Top 5 banks - ProfilesSlide 89-90: Bank profiles: PKO Bank Polski Slide 91-92: Bank profiles: Bank PekaoSlide 93-94: Bank profiles: BZ WBKSlide 95-96: Bank profiles: mBankSlide 97-98 Bank profiles: ING Bank Śląski
8. Mid-term forecastsSlide 99: Forecast - household loans & deposits, 2017-2019Slide 100: Forecast - corporate loans & deposits, 2017-2019Slide 101: Forecast - banking assets, 2017-2019
9. Notes on methodology

Inteliace Research
Ban
king M
arket in P
olan
d,2017-2019
Notes on methodology
10
FX rates:
• As a general rule all “end of year” balances like: assets, deposits, loans and similar volumes have been converted from the local currency into Euro using end of year exchange rate
• All results achieved during a period of time like: profits, revenues, new sales etc. have been converted from the local currencyinto Euro using average exchange rate
• Exchange rates used in the report:
Estimates and Forecasts:
• In some cases, recent or verified data was not available. Therefore, necessary short-term estimations have been done to fill thegaps. Estimates are always indicated with the letter “E”
• When preparing forecasts “F” we have built models using latest observed trends, available forecasts of main economic indicators, seasonal changes observed in the past and other specific factors considered important.
Multiple sources:
• In some cases multiple sources of similar data exist. In this situation we always try to select the most appropriate one /in ourview/. The source is indicated in the footer area of each slide. Nevertheless in specific cases, before interpreting the data it is recommended to get a good understanding on the methodology of data collection by contacting the authors.
EUR / PLN 2008 2009 2010 2011 2012 2013 2014 2015 2016
End of year 4.17 4.11 3.96 4.42 4.09 4.15 4.26 4.26 4.42
Average 3.52 4.33 3.99 4.12 4.19 4.20 4.19 4.18 4.36
Source: NBP

Inteliace Research
Ban
king M
arket in P
olan
d,2017-2019
About the report and its authors
11
About Inteliace Research
Inteliace Research is an independent and privately ownedresearch firm based in the heart of Eastern Europe inWarsaw / Poland.
Our company specializes in value-added research servicesand tailored business intelligence solutions.
Through our customized research services we help ourclients to better understand their customers, competitorsand overall market dynamics.
The lead researcher and founder of Inteliace Research isMarcin Mazurek.
Our contact details:Inteliace ResearchFoksal 17B / 31, 00-372 Warszawa, Poland
Tel. +48 22 408 66 20, Tel. +48 502 512 178Fax. +48 22 349 21 40
mail: info @ inteliace.comwww: http://www.inteliace.com/en/publications.html
About this report
This report has been prepared using Inteliace Researchproprietary research and publicly available sources,including: financial reports, press publications, industrymagazines, directories, financial databases and expertopinions.
Views presented in this report reflect solely theindependent and unbiased opinion of Inteliace Researchand authors.
All due care has been taken in the production of thisreport. However, Inteliace Research does not accept anyresponsibility or liability for any omissions or inaccuraciesof the information contained in this publication.
This report is copyrighted. Any distribution, storage,replication and usage is restricted to Inteliace Researchclients only. In case of any doubt please contact us at:info @ inteliace.com
Inteliace Research
Ban
king M
arket in P
olan
d,2017-2019
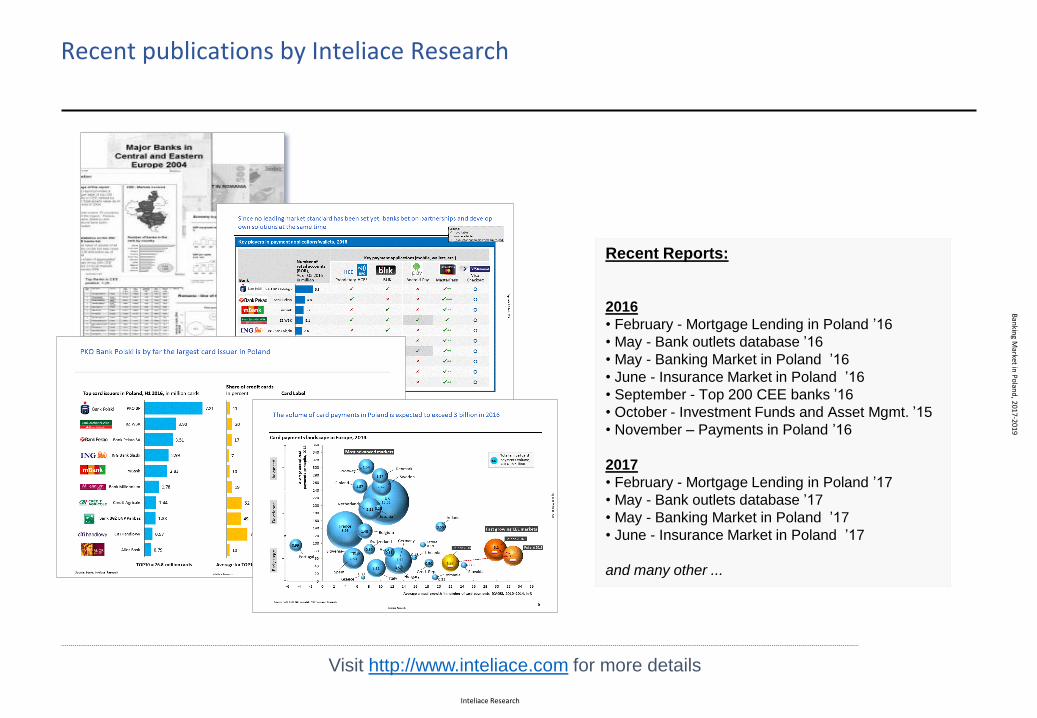
Recent publications by Inteliace Research
12
Visit http://www.inteliace.com for more details
Recent Reports:
2016
• February - Mortgage Lending in Poland ’16
• May - Bank outlets database ’16
• May - Banking Market in Poland ’16
• June - Insurance Market in Poland ’16
• September - Top 200 CEE banks ’16
• October - Investment Funds and Asset Mgmt. ’15
• November – Payments in Poland ’16
2017
• February - Mortgage Lending in Poland ’17
• May - Bank outlets database ’17
• May - Banking Market in Poland ’17
• June - Insurance Market in Poland ’17
and many other ...
![Poland Market Overview - Bord Bia · Polish Market Overview ... • Supermarkets -Tesco, Carrefour, Intermarche, ... Microsoft PowerPoint - Poland Market Overview.ppt [Read-Only]](https://static.fdocuments.in/doc/165x107/5ad8c38f7f8b9a5b538e50ed/poland-market-overview-bord-bia-market-overview-supermarkets-tesco-carrefour.jpg)