Research on informal employment in Viet Nam: current ... · PDF fileemployment in Viet Nam:...
83
DISCUSSION PAPER Hanoi National Economics University Hanoi, December 2011 Research on informal employment in Viet Nam: current situation and solution
-
Upload
nguyenphuc -
Category
Documents
-
view
223 -
download
0
Transcript of Research on informal employment in Viet Nam: current ... · PDF fileemployment in Viet Nam:...

DISCUSSION PAPER
Hanoi National Economics University
Hanoi, December 2011
Research on informalemployment in Viet Nam:
current situation and solution

0
DISCUSSION PAPER
RESEARCH OF INFORMAL EMPLOYMENT IN VIETNAM
CURRENT SITUATION AND SOLUTIONS
Hanoi National Economics University References of this study should be approved by the authors

1
FOREWORD
Research on informal employment in Viet Nam: current sutiation and solution is
the title of the research paper on labour market issues by the Center for Socioeconomic
Data Processing and Forecasting, National Economy University, Hanoi, Vietnam. The
research was carried out under the overall supervision of PhD. Ngô Văn Thứ, with the
technical work conducted by Vice Prof. Dr Hoàng Đình Tuấn; Vice Prof. Dr Nguyễn Cao
Văn; MA. Nguyễn Thùy Trang; and MA. Phạm Thị Nga. The research received technical
support from officers of the Bureau of Employment and the Ministry of Labour, Invalids
and Social Affairs (MoLISA).
The study provides a review of concepts and definitions of informal employment
provided by national researchers and Vietnamese institutions. It proposes a framework of
policies and programmes to address the complex issue of informality in the world of work
in Viet Nam.
The funding for this research came from the EU funded Labour Market Project
which was the focal point for the technical monitoring and support of the field-work. On
behalf of the research team, we would like to express our sincere thanks for the
cooperation of international experts, officers of the Labour Market Projects (ILO), the
Bureau of Employment (MoLISA), officials of DoLISAs, staff of ESCs and other team
members from the Research Institute of Vocational Training Science for helping to
finalize this project.

2
ACKNOWLEDGEMENT
Informal employment and informal sector have become common incident in all countries in the world. Informal employment contributes a bigger share to the total outcomes and the gross national products (GDP) of a country. Therefore, it has drawn great attention from the government, state management agencies, and organizations, especially the International Labour Office (ILO). As a social and economic factor, informal employment relates to the majority of workers, mainly low paid and less protected ones. This research does not cover all aspects of informal employment and informal sector in Vietnam, but rather focuses on defining their characteristics and their impacts on communities. The paper aims to put forwards policy recommendations on the labour market to government management agencies, contributing to the formulation of the policies and interventions in the direction of providing further support to informal workers, moving forward to the process of shifting labour from informal sector to formal sector, and minimizing their bad impacts to the communities. The research, which provides support to the formulation of evidence-based policies, is among few researches conducted in Vietnam on informal employment and informal sector. The findings thus are not comprehensive and persuasive. However, we hope the paper is helpful in offering new research topics and offerings modest suggestions and recommendations for the Government of Vietnam in formulating policies.
We would like to express our sincere thanks to the International Labour Organization (ILO), the ILO Country office in Hanoi, the Bureau of Employment and Ministry of Labour, Invalids and Social Affairs for their support to the research implementation. We also would like to thank academias and researchers internal and external who have provided inputs and ideas for us to complete this work.
Dr. Ngô Văn Thứ
Research Team Leader
3
Contents FOREWORD................................................................................................................. 1 ACKNOWLEDGEMENT............................................................................................. 2 INTRODUCTION......................................................................................................... 5 PART ONE.................................................................................................................... 6 OVERVIEW OF LABOUR INFORMALITY AND POLICY COVERAGE.............. 6 1. CONCEPTUAL FRAMEWORK......................................................................... 6
1.1. International practices and application in Vietnam....................................... 6 1.2. Identifying informal employment in Vietnam............................................... 7 1.3. Policy approaches based on labour and employment data ............................ 8
2. POLICY COVERAGE OF INFORMAL LABOUR............................................ 9 2.1. Labour law and its amendments and supplements ........................................ 9 2.2. Cooperative Law ......................................................................................... 10 2.3. Trade Union Law......................................................................................... 11 2.4. Social Insurance Law .................................................................................. 12 2.5. Health Insurance Law.................................................................................. 13 2.6. Voluntary health insurance.......................................................................... 14
3. BASIC INFORMATION ON INFORMAL LABOURERS .............................. 16 3.1. Existence and role of informal labourers in Vietnam.................................. 16 3.2. Identification and distribution of informal labourers .................................. 17
3.2.1. Participation in Social Insurance by Employees.................................. 17 3.2.2. Occupation, status and income............................................................. 21
3.3. Participation in health insurance of informal labourers .............................. 25 PART TWO................................................................................................................. 25 CURRENT SITUATION AND POLICY ISSUES..................................................... 25 4. PROPOSAL OF CONTENT AND PLANS FOR A SURVEY ......................... 26
4.1. Purpose and Scope....................................................................................... 26 5. SURVEY PREPARATION................................................................................ 26
5.1. Survey plan.................................................................................................. 26 5.1.1. Survey location .................................................................................... 27 5.1.2. Personnel and plan for survey implementation.................................... 27 5.1.3. Model distribution................................................................................ 27 5.1.4. Support for the survey.......................................................................... 29
5.2. Expected results of survey........................................................................... 29 6. SYNTHESIS and ANALYSIS of SURVEY DATA.......................................... 30
6.1. Database ...................................................................................................... 30 6.2. Scale and distribution of informal labour under survey .............................. 31
6.2.1. Distribution by work location .............................................................. 31 6.2.2. Distribution by gender and age ............................................................ 31 6.2.3. Marital status........................................................................................ 34 6.2.4. Educational and technical qualifications of the people surveyed ........ 36
4
6.3. Work status of informal workers................................................................. 41 6.3.1. Current work of informal workers ....................................................... 41 6.3.2. Work stability and professional suitability .......................................... 43 6.3.3. Position of informal employees ........................................................... 47 6.3.4. Particular features of work establishments .......................................... 49
6.4. Labour contract of working time and pay ................................................... 50 6.4.1. Form of labour contract........................................................................ 50 6.4.2. Pay and method of paying.................................................................... 51 6.4.3. Working time ....................................................................................... 55 6.4.4. Training for informal workers.............................................................. 56
6.5. Informal workers’ understanding and need of insurance ............................ 57 6.5.1. Awareness and understanding of policy .............................................. 57 6.5.2. Accessing social insurance and health insurance................................. 58 6.5.3. Voluntary health insurance at work place............................................ 60 6.5.4. Providing voluntary medical insurance for community groups........... 60
6.6. Law and desire to find formal employment ................................................ 60 6.6.1. Update of regulations and laws........................................................... 60 6.6.2. Desire ................................................................................................... 61
6.7. Information from group discussion and local governments ........................ 63 6.7.1. Information from group discussions .................................................... 63 6.7.2. Information from discussions with local authorities............................ 64
PART III POLICY RECOMMENDATIONS............................................................. 65 7. INITIAL CONCLUSIONS AND RECOMMENDATIONS ............................. 65
7.1. Trend of official employment diversification ............................................. 65 7.2. Ability and status of informal workers........................................................ 66 7.3. Policy system is less accessible to informal labour..................................... 66 7.4. Some provisions of labour law, social insurance and health insurance laws
remain impractical due to lack of implementation mechanisms ................................... 66 7.5. Inadequacy in awareness of labour rights ................................................... 67 7.6. Economic sectors/work using informal labour............................................ 67 7.7. Some recommendations in favor of informal workers and local governments
68 APPENDICES............................................................................................................. 70 APPENDIX 1 .............................................................................................................. 70 APPENDIX 2 .............................................................................................................. 78 APPENDIX 3 ............................................................................................................. 79

5
INTRODUCTION
The term "informal sector" was first used by ILO 30 years ago to describe the
activities of employees or the self-employed who were neither recognized, protected, nor
managed by state management agencies. At the 1991 International Labour Organization
Conference, it was emphasized that “there can be no question of the ILO helping to
‘promote’ or ‘develop’ an informal sector as a convenient, low-cost way of creating
employment unless there is at the same time an equal determination to eliminate
progressively the worst aspects of exploitation and inhuman working conditions in the
sector”.
Eventhough the ILO, government and international organizations have differring
points of view that continue to evolve over time, informal workers and informal
employment issues are increasingly regarded as an integral part of the socio-economic
development process. The International Labour Organisation (ILO) has given this issue
the most thorough attention. Issues raised by the ILO are more comprehensive and
relevant to social management work than those raised by other entities.
In Vietnam, informal employment opportunities and informal labourers have
existed for a long time. However, these issues have only attracted the attention of the state
management agencies, organizations and individuals since the first years of 21st century.
For a concrete identification of the current Vietnamese labour market and in
preparation for developments in the years to come, specific research must be done to
provide a basis for the planning and implementation of relevant policies. This will ensure
the healthy movement of the labour market in general and informal labour in particular.
Through research of the Vietnamese legal system and Vietnamese government
policies related to informal employment, as well as analysis of labour market data in
recent years, this study will clarify confusing items in order to help policy makers, build,
adjust and implement policies more effectively. This report will provide a basis for the
creation of an information gathering survey on informal labour and employment in
Vietnam in the coming years.

6
PART ONE
OVERVIEW OF LABOUR INFORMALITY AND POLICY COVERAGE
1. CONCEPTUAL FRAMEWORK
1.1. International practices and application in Vietnam
The formal workforce, (employees in the structural unit of the economy), is
controlled by Labour Law and other relevant policies. On the other hand, informal
laborers work without specific remedy of law or full protection of the legal system.
Today, the informal sector in Vietnam has a strong impact on socio-economic life.
As a result, state management agencies must not only concern themselves with ensuring
the interests of informal labour but must also strive to manage, support and organize this
sector to a certain degree.
The discussion of “informal labour” gives rise to many different theoretical
frameworks in research and policy. This article limits the discussion to issues relating to
the identification and systematic division of informal labour, as well as initial policy
developments and approaches.
For labour statisticians in developing countries, the basic concepts related to
"informal labour" and "informal employment" come from the 17th ICLS (2003).
Conceptual frameworks can have different levels of application from country to country.
For developing countries, where the majority of employees are agricultural workers, the
scope determination should be studied closely.
The conceptual framework of the 17th ICLS (Fig. 1.1) has the international
uniformity and flexibility to be applied to the specific conditions of a country. In
Vietnam, it is entirely possible to combine this framework with some specific views
about the actual policy coverage for the labour market, organizations and individual
workers.

7
Figure 1.1: The conceptual framework of informal labour
Within this framework, informal employment officially exists at all three levels of
the economy. There are nine cells in all to categorize jobs and informal labour. This
structure allows us to observe the interrelationship between different sectors.
1.2. Identifying informal employment in Vietnam
Talking about the division of labour in Vietnam, Mr. Nguyen Thanh Hoa, deputy
minister of MOLISA, began his speech at an international symposium on informal
employment with a photo of an executive sipping coffee at a small streetside restaurant.
"The formal and informal sectors are intertwined,” Mr Thanh reminded, “both should be
treated equally.”
The truth is that the equal treatment of both sectors and access to social services and
welfare policies has been the goal in Vietnam for many years. Formerly regarded as the
"black economy" or "sinking economy," the “informal sector” has earned its far less
pejorative title as a result of its contribution to economic development.
Jobs in term of employment status
Self-employment Unit
/enterprise owners
Assistant of family labour
Rented labour Member of
coorperatives
Type of bussiness
Formal
Informal
Formal
Informal
Informal
Formal
Informal
Formal
Informal
Formal sector
no no 1
2
no
Informal sector*
3
no
4 no
5
6
7
no
Household
8 no no no no
9
no no
8
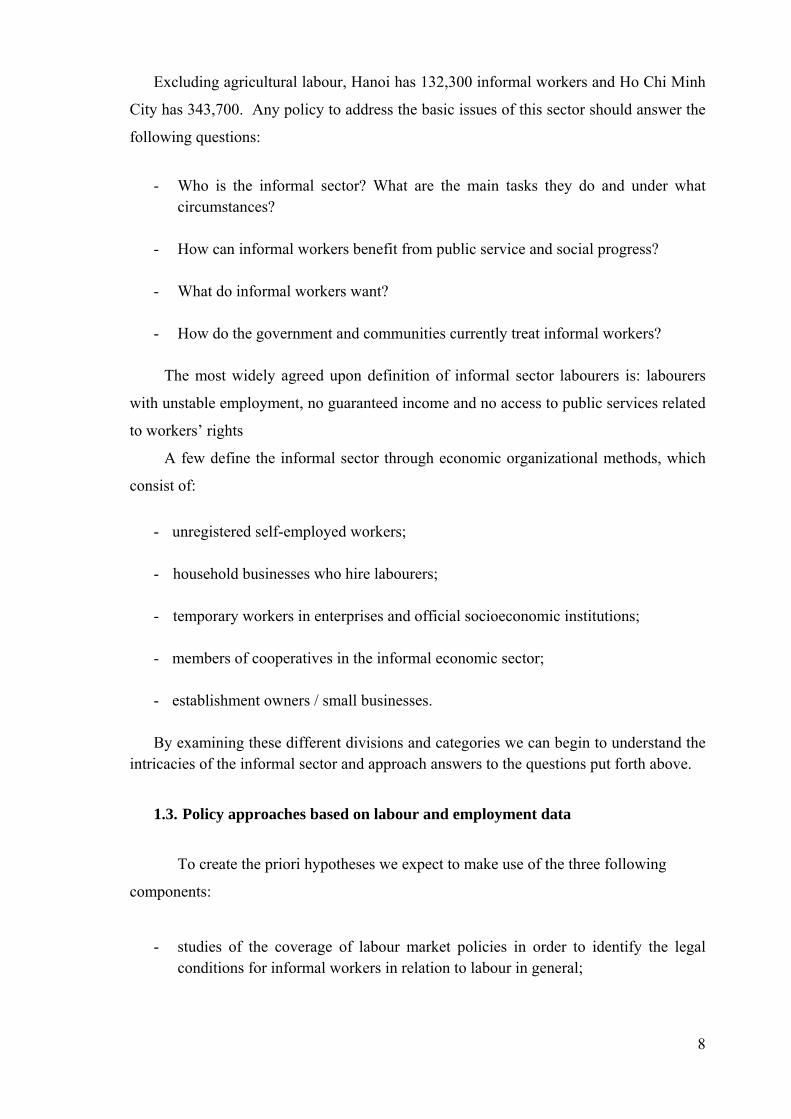
Excluding agricultural labour, Hanoi has 132,300 informal workers and Ho Chi Minh
City has 343,700. Any policy to address the basic issues of this sector should answer the
following questions:
- Who is the informal sector? What are the main tasks they do and under what
circumstances?
- How can informal workers benefit from public service and social progress?
- What do informal workers want?
- How do the government and communities currently treat informal workers? The most widely agreed upon definition of informal sector labourers is: labourers
with unstable employment, no guaranteed income and no access to public services related
to workers’ rights
A few define the informal sector through economic organizational methods, which
consist of:
- unregistered self-employed workers;
- household businesses who hire labourers;
- temporary workers in enterprises and official socioeconomic institutions;
- members of cooperatives in the informal economic sector;
- establishment owners / small businesses.
By examining these different divisions and categories we can begin to understand the intricacies of the informal sector and approach answers to the questions put forth above.
1.3. Policy approaches based on labour and employment data
To create the priori hypotheses we expect to make use of the three following
components:
- studies of the coverage of labour market policies in order to identify the legal conditions for informal workers in relation to labour in general;

9
- the information from the survey of Employment and Labour Force Survey (LFS) for the years 2007 & 2009 in order to identify occupation, geographical location and other information about informal labour;
- surveys designed to fill in any necessary information not sufficiently collected by
other sources.
The technical proposal of this study will be the basis for a number of advisory
policies to support informal labour. We will test and evaluate potential policies in order to
improve and expand them in the future.
2. POLICY COVERAGE OF INFORMAL LABOUR
This research has focused on surveying almost all legislation and policies relating to
employment modes. Some resolutions of the Communist Party of Vietnam related to the
poverty reduction process were also assessed as the basis for understanding the legal,
political and social environment of informal labour.
2.1. Labour law and its amendments and supplements
In 1994 the Labour Laws of the Socialist Republic of Vietnam were promulgated
consistent with the Vietnamese Constitution of 1992. To date, these laws have been
amended four times. However, the basic purpose of these laws has remained constant:
- Labour law defines the rights and obligations of workers and employers; it establishes the labour standards and principles to be used in order to manage labour and help boost production. Thus, labour law has an important position in society and in the legal system of the country.
- The Labour Code protects a labourer’s right to work. It also protects the
legitimate rights and interests of the employer. The Labour Code makes labour relations harmonious and stable, and helps promote the creativity and talent of intellectual and manual labour, while allowing labour management to achieve productivity, quality and social progress. The Labour Code ensures efficient use of labour and management. It contributes to the industrialization, modernization and prosperity of the country.
Up to now, the labour laws of The Socialist Republic of Vietnam have most of the
standard regulations for workers in place. Although there are no official laws yet for

10
informal employment, it has been recognized as a form of employment inside the
regulatory scope of the Labour Code.
2.2. Cooperative Law
Broadly defined, Vietnam is an agricultural country with nearly 70% of the
workforce engaged in agricultural production. Over the past 20 years agricultural
production has undergone many transformations in structure, organization and
technology, but the basic nature of this sector has remained the same. Like many other
agricultural countries in the developing world, agriculture,forestry and fishery are
considered essential.
The state has development strategies in the short and medium term. In the
development process, new forms of production organization have emerged. Labour and
employment in these organizations has semi-agricultural properties as the organizations
engage in both agricultural production and commercial service activities.
On November 26, 2003, the Cooperative Law was enacted and included the basic
contents of the official recognition of the organization of cooperatives as businesses in
general. This law also announced the specific policies for cooperatives, which are:
- to promulgate and implement policies and programs to support the cooperative development of staff training, human resources, land, finance, credit, a building fund for cooperative development assistance, the application of science and technology, marketing and market expansion, investment in infrastructure development, and opportunities for cooperatives to participate in the national socio-economic development program;
- to encourage and create favorable conditions for cooperative development;
- to ensure legal status and business/production conditions for cooperatives that equal those available in other types of enterprises;
- to protect the rights and legitimate interests of the cooperative under the provisions of law;
- to respect the autonomy, self-determination and self-responsibility in the cooperative's production and business;
- not to interfere in the internal management and lawful operation of cooperatives.
This law has created avenues for workers in the cooperative to participate in forms of
insurance. Individual households may also be entitled to participate in cooperatives, set
up companies and participate in social insurance.
11
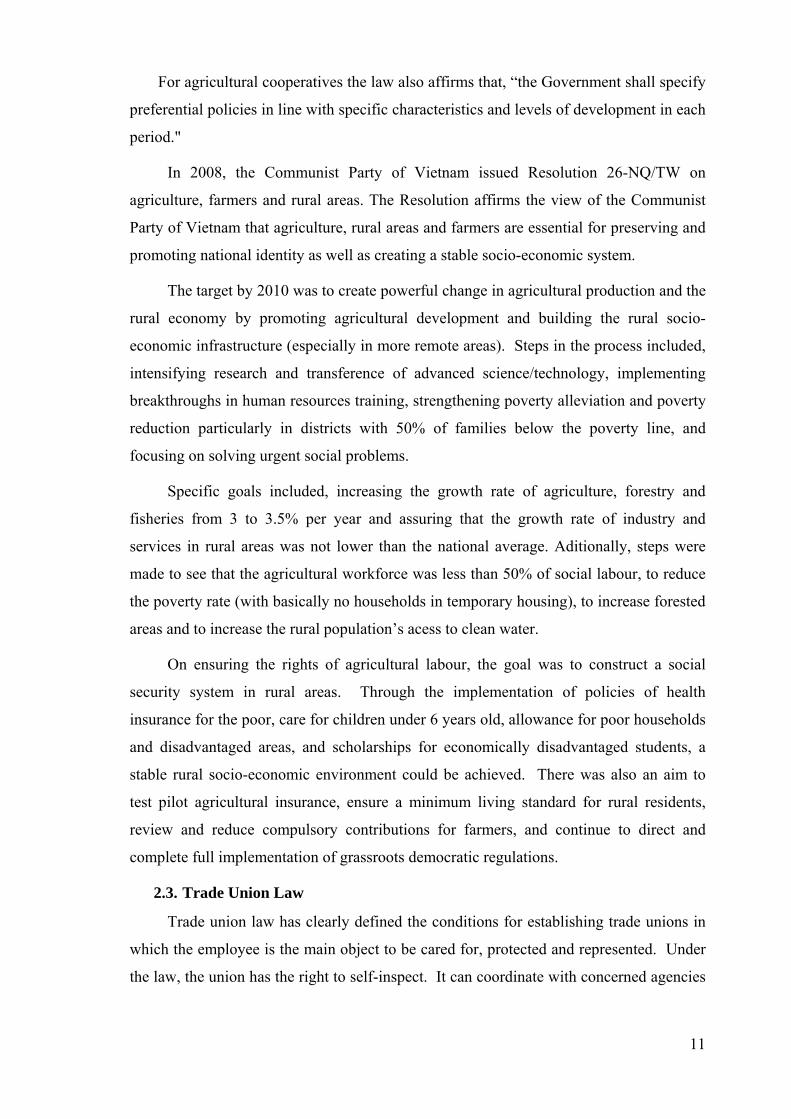
For agricultural cooperatives the law also affirms that, “the Government shall specify
preferential policies in line with specific characteristics and levels of development in each
period."
In 2008, the Communist Party of Vietnam issued Resolution 26-NQ/TW on
agriculture, farmers and rural areas. The Resolution affirms the view of the Communist
Party of Vietnam that agriculture, rural areas and farmers are essential for preserving and
promoting national identity as well as creating a stable socio-economic system.
The target by 2010 was to create powerful change in agricultural production and the
rural economy by promoting agricultural development and building the rural socio-
economic infrastructure (especially in more remote areas). Steps in the process included,
intensifying research and transference of advanced science/technology, implementing
breakthroughs in human resources training, strengthening poverty alleviation and poverty
reduction particularly in districts with 50% of families below the poverty line, and
focusing on solving urgent social problems.
Specific goals included, increasing the growth rate of agriculture, forestry and
fisheries from 3 to 3.5% per year and assuring that the growth rate of industry and
services in rural areas was not lower than the national average. Aditionally, steps were
made to see that the agricultural workforce was less than 50% of social labour, to reduce
the poverty rate (with basically no households in temporary housing), to increase forested
areas and to increase the rural population’s acess to clean water.
On ensuring the rights of agricultural labour, the goal was to construct a social
security system in rural areas. Through the implementation of policies of health
insurance for the poor, care for children under 6 years old, allowance for poor households
and disadvantaged areas, and scholarships for economically disadvantaged students, a
stable rural socio-economic environment could be achieved. There was also an aim to
test pilot agricultural insurance, ensure a minimum living standard for rural residents,
review and reduce compulsory contributions for farmers, and continue to direct and
complete full implementation of grassroots democratic regulations.
2.3. Trade Union Law
Trade union law has clearly defined the conditions for establishing trade unions in
which the employee is the main object to be cared for, protected and represented. Under
the law, the union has the right to self-inspect. It can coordinate with concerned agencies

12
to check the observance of legislation on policies related to the obligations, rights and
interests of workers.
Article 12 of the Union Law Code clearly states:
The State management agency on social insurance and other social insuarance organizations must closely coordinate with trade unions in the construction of law and social insurance policy. They must submit to the proper authorities to promulgate and implement policies on social insurance for workers.
Agencies and organizations must coordinate closely with trade unions to take care
of workers’ needs. They must support workers’ cultural lives, fitness, sports, leisure and
travel, as well as care for retired and injured employees.
2.4. Social Insurance Law
The Social Insurance Law issued on 29/6/2006 regulates all issues relating to social insurance. This law does not apply to health insurance, deposit insurance or other insurance for business purposes. According to this law:
- The employee involved in social insurance must be a citizen of Vietnam. - All organizations operating in the territory of Vietnam, including cooperatives,
individual households or any other organizations that hire, use and pay for workers must participate in social insurance.
- Employees participating in unemployment insurance must be Vietnamese citizens
working under a labour contract as specified in this article. - Employers participating in unemployment insurance must employ 10 or more
workers of working age. The employee who has had time to participate in compulsory social insurance and voluntary social insurance is entitled to retirement and immediate death allowances based on time of social insurance contribution.
The law has a chapter (chapter 4, Article 69 -79) for voluntary social insurance.
This chapter specifies the benefits received from social insurance during retirement and in
the case of death.

13
Some important points in Chapter 4 include, conditions for pensions, allowances on
retirement, amounts of one-time social insurance, the reserve period of social insurance
and the average monthly amount of social insurance contributions.
The state has created a legal framework for employees in any field, with an income
not less than the minimum wage, to participate in mandatory or voluntary social
insurance. It is now necessary to commit to adding these same benefits to the informal
sector.
2.5. Health Insurance Law
Health Insurance Law was put in place by the Vietnamese National Assembly on
November 14, 2008. The subjects eligible for participatoin in health insurance as per
Article 12 are as follows:
Article 12. Subjects participating in health insurance
- labourers working under labour contracts in accordance with the labour law; - professional commissioned officers technical commissioned officers and officers
working in People's Police Force; - pension beneficiaries; - people receiving social security benefits monthly due to occupational accidents
and/or occupational diseases; - people receiving monthly allowances from the state budget but without monthly
allowances due to loss of working capacity; - officials of communes, wards and towns who are retired and receiving social
security benefits each month; - the cadres of communes, wards and towns who have been off work but receiving
allowances from the state budget every month; - people receiving unemployment allowances; - people who have contributed to the national revolution;

14
- veterans as prescribed by the veterans’ law; - people directly involved in the resistance against the Americans as prescribed by
the government; - National Assembly deputies and People's Council delegates at all levels; - people eligible for receiving social welfare allowances each month as prescribed
by law; - people belonging to poor households and ethnic minorities living in areas with
particularly difficult socio-economic conditions; - relatives of people having contributed to the national revolution in accordance
with the law on preferential treatment; - relatives of the people's army officers, military service, public security forces,
and the cipher; - children under 6 years old; - organ donors; - foreign students studying in Vietnam who were granted a scholarship from the
state budget; - economically disadvantaged households; - students; - persons in farming, forestry, fishery and salt production households; - dependants of employees specified in paragraph 1 who live in the same
household; - members of social cooperatives and small business households; - other subjects as prescribed by the government.
2.6. Voluntary health insurance

15
According to article 12 of health insurance law, employees signing unlimited time
contracts or contracts longer than 3-months can participate in mandatory health insurance.
Ineligible employees may participate in voluntary health insurance.
The Ministry of Health and the Ministry of Finance have developed specific
recommendations to guide the way and deliniate conditions for participation in voluntary
health insurance.
Decree no. 63/2009/ND-CP guides the enforcement of health insurance law.
Under this decree, subjects participating in voluntary health insurance can buy health
insurance as follows:
Article 6 Premium rate and payment methods of voluntary health insurance are defined in
clause 3, article 50 of Health Insurance Law and clause 3 and 4 of article 1 of this decree.
1. From July 1, 2009 to December 31, 2009, the premium rates were as follows:
a. The premium rate for six months for participants defined in clause 21, article 12 of the law on health insurance who are enrolled in school is VND60,000.00/person for urban areas and VND50,000.00/person for rural and mountains areas
b. The premium rate for six months of the subjects specified in clause 22, 23 and 24, of article 12 of the law on health insurance and those defined in clause 3 and 4 of article 1 of this decree is VND160,000.00/person for urban areas and VND120,000.00/person for rural and mountainous areas
2. From January 01, 2010, the monthly premium rate for those participating in voluntary health insurance is 4.5% of the minimum wage. For cases in which, voluntary health insurance participants are households, the premium rate is implemented in accordance with clause 6 of article 3 of this decree.
3. Based on health insurance premiums, subjects participating in voluntary health insurance pay every six months or pay once for the whole year to the health insurance fund.
Thus, according to legal documents and guiding decrees, informal labourers can
fully participate in health insurance either individually or as a household.
In conclusion, it can be said that, at a policy level, the Socialist Republic of
Vietnam has created an adequate legal framework and conditions for securing basic rights
for informal labourers. With the trade union law, the cooperative law and other programs,
16
the state guarantees labourers (including informal labourerers) the ability to participate in
socio-economic organizations to represent their interests.
Questions here are:
- How are policies and programs aimed at informal labourers implemented?
- How can labourers approach and utilize public services?
- Is it necessary to organize forms of support for informal labourers to enhance their success rate?
It is crucial that the state assess more fully the role of informal labour, the
implications of this sector, and how to support the management of informal labourers in
such a way that formalizes their work, if possible. Such issues, at first, will be assessed
through the data about the informal sector compliled over recent years and studies that
have been carried out by individuals, government organizations, and NGOs.
3. BASIC INFORMATION ON INFORMAL LABOURERS
3.1. Existence and role of informal labourers in Vietnam
Listen At the February 2010 MOLISA workshop at the Sunway Hotel Hanoi, there were
12 presentations on informal labourers in Vietnam. Teams from the IRD, Woldbank,
University of National Economy in Hanoi, Vietnam GSO, and domestic DOLISAs
presented compelling research. At this workshop, some basic conceptual frameworks
were agreed as upon that form a good foundation for developing further studies on
informal employment and labour in Vietnam.
Most studies presented found that informal employment and labour had been an
indespensible part of the process of economic development in many countries, Vietnam
included. Reports from the GSO and IRD showed the variability of informal employment.
Based on surveys conducted in Hanoi and Ho Chi Minh City, the reports show that the
level of contribution of the informal sector increases with the size of the locality. These
studies also indicate that state management agencies need to pay more attention to the
informal sector.
Additionally, the University of National Economy, Hanoi, conducted a study
documenting the structure and movement of the informal labour force. The study
examined legal issues of determination and mobilization.
17
A second workshop was held in Hanoi in May 2010. The workshop was
organized by the Institute of Social Sciences of Vietnam, the French Development
Research Institute coordinating with the GSO, the Ministry of Labour, Invalids and Social
Affairs and other international organizations such as the Agency for French International
Development, the International Labour Organization, the World Bank and the UN
Development Programme (UNDP).
This workshop was aimed at discussing statistical measurement methods and
analyzing the economic impact of the existence and development of informal economic
sector. Other goals of the workshop included: summarizing informal sector experiences,
analyzing opportunities and challenges posed by informal employment, and studying
current measures to be taken to develop this sector.
At the workshop, some questions arose about whether to narrow this sector to
better fit the ILO’s viewpoints or to accept the objective movement of this sector
according to the standpoint of a number of other organizations and research groups.
3.2. Identification and distribution of informal labourers
Based on the conceptual framework outlined in section 1 of this paper (and
referring to research results presented and discussed at workshops), we will present
information from the analysis of the 2007 & 2009 Labour Force Surveys (LFS) in order
to specifically identify the informal workforce.
The two surveys were conducted with nearly the same sample size (about 62,000
observations) and with corresponding expansion coefficients. Analysis results were
calculated with these expansion coefficients.
Two groups of indicators given added attention were the number of labourers and
the percentage of labourers who do not participate in social insurance, health insurance or
other forms of work agreement. These indicator groups were divided in different ways
(urban, rural, economic industries, ownership area, etc.).
3.2.1. Participation in Social Insurance by Employees
Conditions for social insurance participation can be considered open to all
workers having a stable income and earning no less than minimum wage. Firstly, we can
consider this rate at a national level according to different groups.

18
+ Rate of participation in social insurance according to work area
Rate (%) 2007 Rate (%) 2009 Area No Yes No Yes Non-agriculture 73.6 26.4 82.2 17.8
Total 100 100 Agriculture* 99.5 0.5 99.7 0.3
Total 100 General 85.4 14.4 89.5 10.5
Total 100 *Unskilled labour in agriculture – forestry- salt production industries (only calculating provided data)
Of the 25 million labourers (2007) in different forms of non-agricultural economic
activity, only 26.4% participated in social insurance. The percentage participating in
social insurance from the agriculture, forestry, fishery and salt production industries
(hereinafter referred to as agriculture) was only about 0.5%.
73.6% of employees in other industries did not participate in social insurance and
had no guaranteed conditions with respect to the accumulation of their income from the
insurance system of the state. In 2007 there were approximately 5.5 million people of
working age participating in non-agricultural economic activities who did not participate
in social insurance. That accounted for 20% of workers in this area. Information
from LFS 2009 shows a similar situation. In fact, a somewhat higher percentage of the
agricultural sector did not participate in social insurance. This does not necessarily reflect
a trend of decreasing participation rates in social insurance since after 2008 many
labourers lost their jobs and received new jobs in the formal sector but were not eligible
to participate in social insurance.
Distribution of employees opting out of social insurance
+ Distribution by age group
Statistics from the 2007 & 2009 LFS show that the employment rate of those
having no social insurance was distributed fairly evenly over 5 age groups. The rate was
higher in the 34-44 age group in 2007 and 30-39 in 2009. This may just be a temporary
phenomenon in the period following the global economic crisis. The general rate was
more stable with about 73% - 82% of non-agricultural labours having no social insurance.
Labourers not benefited from social insurance
(distributed by age group)

19
2007 2009 Age Group Number of
people
Percentage
(%)
Number of
people
Percentage
(%)
15 - 19 3016552 7.4% 3039320 7.5
20 -24 4305596 10.6% 4177922 10.3
25 - 29 4397991 10.8% 4724505 11.7
30 - 34 4906635 12.0% 4921128 12.2
35 - 39 5329609 13.1% 5113383 12.6
40 - 44 5318462 13.0% 4732603 11.7
45 - 49 4588857 11.2% 4744734 11.7
50 - 54 3502778 8.6% 3630121 9.0
55 - 60 2558081 6.3% 2791860 6.9
> 60 2869498 7.0% 2621513 6.5
Total 40794059 100.0% 40497091 100.0
+ Distribution by types of workplace ownership
Rate (by organization) of non-agricultural labourers not participating in social insurance (only those of working age)
Organization Form 2007 2009 Self-made households 99.89% 99.82% Individual business households* 98.69% 98.76% Cooperatives 68.09% 63.49% Private enterprises 58.16% 58.22% Offices 10.48% 10.35% Foreign Investment organizations 18.32% 19.21% Others 36.29% 37.62% General 84.75% 72.45%
20
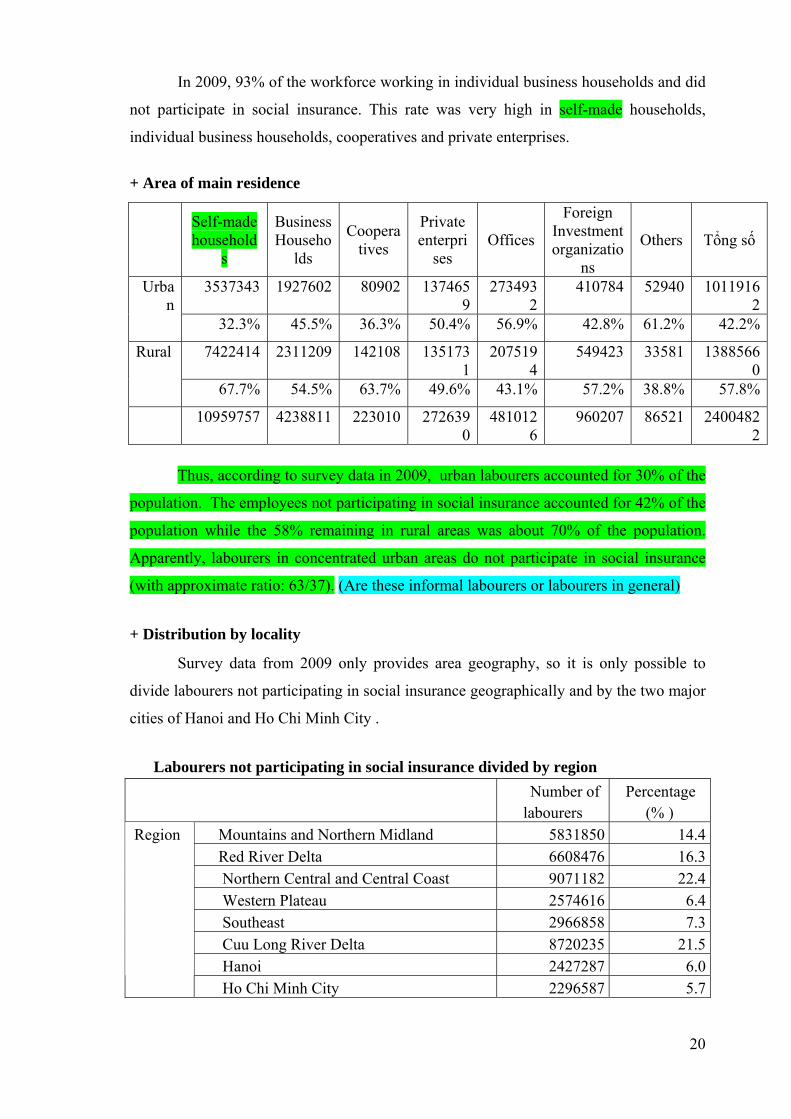
In 2009, 93% of the workforce working in individual business households and did
not participate in social insurance. This rate was very high in self-made households,
individual business households, cooperatives and private enterprises.
+ Area of main residence
Self-made household
s
Business Househo
lds
Cooperatives
Private enterpri
ses Offices
Foreign Investment organizatio
ns
Others Tổng số
3537343 1927602 80902 1374659
2734932
410784 52940 10119162
Urban
32.3% 45.5% 36.3% 50.4% 56.9% 42.8% 61.2% 42.2%
7422414 2311209 142108 1351731
2075194
549423 33581 13885660
Rural
67.7% 54.5% 63.7% 49.6% 43.1% 57.2% 38.8% 57.8%
10959757 4238811 223010 2726390
4810126
960207 86521 24004822
Thus, according to survey data in 2009, urban labourers accounted for 30% of the
population. The employees not participating in social insurance accounted for 42% of the
population while the 58% remaining in rural areas was about 70% of the population.
Apparently, labourers in concentrated urban areas do not participate in social insurance
(with approximate ratio: 63/37). (Are these informal labourers or labourers in general)
+ Distribution by locality
Survey data from 2009 only provides area geography, so it is only possible to
divide labourers not participating in social insurance geographically and by the two major
cities of Hanoi and Ho Chi Minh City .
Labourers not participating in social insurance divided by region
Number of labourers
Percentage (% )
Mountains and Northern Midland
5831850 14.4 Red River Delta 6608476 16.3
Northern Central and Central Coast
9071182 22.4Western Plateau 2574616 6.4Southeast 2966858 7.3Cuu Long River Delta 8720235 21.5Hanoi 2427287 6.0
Region
Ho Chi Minh City 2296587 5.7

21
Number of labourers
Percentage (% )
Mountains and Northern Midland
5831850 14.4 Red River Delta 6608476 16.3
Northern Central and Central Coast
9071182 22.4Western Plateau 2574616 6.4Southeast 2966858 7.3Cuu Long River Delta 8720235 21.5Hanoi 2427287 6.0Total 40497091 100.0
Selection of survey methods will be conducted with the help of information from
this distribution.
+ Provinces and cities having lots of informal labours
Province/City Number of Labours
%
Hanoi 2199484 5.50% HCM City 2075953 5.20% Thanh hoa 1910200 4.80% Nghe An 1614600 4.00%
Thai Binh 1128985 2.80% An Giang 1112345 2.80% Nam Dinh 1033015 2.60% Dong Thap 913649 2.30% Tien Giang 896575 2.20% Bac Giang 868551 2.20% Hai Duong 851834 2.10% Dong Nai 837602 2.10% Dak Lak 830888 2.10% Kien Giang 804255 2.00% Long An 723843 1.80% Ben Tre 713483 1.80% Binh Dinh 711834 1.80%
Distribution in selected provinces above suggests the need to survey the area to
collect full and representative information and search for policy proposals.
3.2.2. Occupation, status and income
+ Jobs having lots of labourers not participating in social insurance in 2009

22
(not-including unskilled labour in agriculture, forestry and fisheries)
Occupation Number of
labours Percentage
(%)
Sales staff 5527634 13.6495
Labours having market-oriented skills in agriculture
4698514 11.6021
Labour in mining, construction, industrial and transportation
1961610 4.8438Food processing workers, wood furniture processing, garment and other craft workers and other relevant workers 1873464 4.6262Construction labours and labours related to construction (except electricians) 1809201 4.4675Agricultural labour, fishing, hunting and gathering self-serving
1730440 4.273
Personal service workers 1172900 2.8963Drivers and equipment operating workers 1163748 2.8737Metal workers, mechanics and related workers 793336 1.959Artisans and craftsmen involved printing
687676 1.6981
Workers operating machinery and fixed equipment 545157 1.3462Labours having market-oriented skills in forestry, fishery and hunting
531881 1.3134
Labours on streets and labours related to sales 376067 0.9286Waste collecting workers and other unskilled labours 375050 0.9261Cleaners and housework assistant 297145 0.7337Electrician and electronic workers 201120 0.4966Experts on business and management 179148 0.4424Other office support staff
169571 0.4187
Employees of security service 129303 0.3193Personal care workers 100522 0.2482Technicians and engineering scientists 87505 0.2161Customer service staff 77108 0.1904
Jobs with a large number of labourers not participating in social insurance have
reason for concern as fluctuations in employment and income will have more of an
impact on the community as well as enabling social issues to arise. Policies to support
informal labourers will focus on the subjects mentioned above.
+ Position of labourers not participating in social insurance The position of informal labourers can be further identified through a number of
features: form of labour contract, gender and region.

23
The characteristics of form of labour contract and production scale from LFS2009
were as follows:
Form of labour contract
Number of labourers %
Unlimited time contract 4727779 19.501-02-year term contract 2799160 11.6Under 1-year term contract 1374544 5.7Agreement 5516959 22.8
Without contract 9792053 40.4
Form of labour
contract
Total 19955495 100.0 In the total number of surveyed labourers, a relatively high percentage, 40.4%, did
not have binding contracts with their employers. Moreover, 22.8% of labours had
agreements with business owners without a contract.
With forms of short-term contract, agreement or even no contract, labourers are
always in a state of losing their jobs. They are not protected by any laws or any other
organization.
The total number of people working without labour contracts or with agreements
only was 15,309,012.
Division of labourers by gender
Verbal agreement No contract No. % No. %
Male 3792459 24.8 4061903 26.5
Female 1724500 11.3 5730150 37.4
Gender
Total 5516959 36.1 9792053 63.9
The number of verbal agreements only was less for females than males but the
rate for no agreement at all was larger for of females. Gender inequality is clearly visible
in this labour sector.
Division of contract forms by age group
Verbal Agreement No contract Age group No. % No. %
15-19 628806 4.1 1837642 12.0 20-24 908927 5.9 1740934 11.4

24
25-29 871852 5.7 1343008 8.8 30-34 819698 5.4 998631 6.5 35-39 709212 4.6 909327 5.9 40-44 629917 4.1 740222 4.8 45-49 499145 3.3 753376 4.9 50-54 260876 1.7 551234 3.6 55-60 128282 0.8 481255 3.1 >60 60244 0.4 436424 2.9 Tổng số 5516959 36.1 9792053 63.9
There was a greater ratio of workers with verbal agreements or no contract among
younger workers. Additionally, among labourers with agreements only or no contracts
24.5% of them had a second job.
Division by size of enterprise
N % 1-20 39805340 83.0 21 - 300 6081705 12.7 > 300 2070906 4.3
Number of labours of enterprise
Total 47957951 100.0 + Earnings of labourers not participating in social insurance
From LFS 2007 data, the average income per month of this labour sector was
about VND1,200,000. This is two thirds the average income per month of labourers
participating in social insurance. However, dispersion of income of the two sectors was
about the same (VND345,000). Therefore it can be seen that labourers not participating in
social insurance have a low and unstable income.
+ Working environment and position of labourers not particiating in social insurance
Among the 25 million people working in non-agricultural areas and not
participating in social insurance, there are:
- 74% working in establishments without business registration
- 78% working in establishments without the tax code
- 93% working in establishments not registered for social insurance
- 87% working in establishments that do not perform bookkeeping
- 92% working in establishments with less than 20 employees
- 53.1% self-employed

25
- 9.6% housework assistants
- 29% receiving salary
- 24.4% enjoying a fixed salary
- 34% receiving hour/day wages
- 15% enjoying a salary of products
- 25% unpaid
- 68% do not sign payroll
Instability and poor working environments are clearly shown by the data above.
3.3. Participation in health insurance of informal labourers
According to statistics, in 2009 Vietnam had about 18 million people who did not
participate in economic activities for many different reasons. Of that figure about 4.8
million were elderly and more than 13 million people were of working age. People of
working age are economically active persons for whom opting for social insurance is
almost certainly the only way to participate in voluntary medical insurance.
The phenomenon of avoiding of health insurance as well as failing to comply with
the health insurance and social insurance laws has been a point of concern for the
government for many years. In general, the participation rate in health insurance is only
42%. Many studies show that people are indifferent about health insurance, accepting
high cost medical care when needed. People ignore or do not put much faith in the health
insurance system.
According to Ms. Tong Thi Song Huong, Director of the Department of Health
Insurance at the Ministry of Health, “there are multiple reasons for this phenomenon
among which a lack of undersdanding amongst both employers and employees as well as
employers’ fear of budget deficits due to paying social insurance premiums factor
highly”. Footnote?
PART TWO
CURRENT SITUATION AND POLICY ISSUES
26
4. PROPOSAL OF CONTENT AND PLANS FOR A SURVEY
4.1. Purpose and Scope
The purpose of this survey is to use the international conceptual framework (in the context of Vietnam) to collect information from labourers in the informal sector who are not participating in social insurance. There may be more signs of the number of these labourers, but given the time and a priori information from the two LFS surveys (2007 & 2009) this survey has the following main objectives:
- To determine the degree of policies related to informal labourers.
- To identify distribution by occupation, position, geographic area, and position of each group of informal labourers.
- Listen - To learn the causes of informal labourers opting out of social insurance, health
insurance, and access to community services. - To learn the aspirations of informal workers in order to mitigate difficulties in their lives.
The research scope will include labourers participating in employment with a
large number of people involved. Specifically work that affects the living environment of
the community. The survey will not include individuals in agricultural, forestry, fisheries,
salt plain production, households, or members of agricultural cooperatives since they are
given special attention by the government under the three agricultural policies.
4.2 Survey content
The survey content includes: 1- Defined information to identify the informal labour classes by gender, residence,
occupation, age and past experience.
2- Current situation of jobs, income, and rights to be protected. Also, the employment opportunities and viewpoints about access to public services and other forms of labourers' insurance.
3- Poll on labourers' desire for policy support from government, unions, and associations.
4- Data on the ability to limit the increase in the number of informal labourers.
5. SURVEY PREPARATION
5.1. Survey plan

27
5.1.1. Survey location
According to the results analyzed in Section 3 and the technical proposal, a survey
with live interviews was planned to be conducted in three provinces: Thanh Hoa, Binh
Dinh and Dong Thap.
The reason was that these provinces had a very high rate of non-official workers,
second only to that of Hanoi and Ho Chi Minh City, which were surveyed by IRD in
2008. The number of questionnaires was specified in the technical proposal.
The selection of districts/counties for the survey was carried out after consulting
with Department of Employment. The selection was done based on the rate of informal
labour in the districts. The number of participants was ratified based on such criteria as
type of work, age and gender as shown the analysis of LFS 2007 & 2009.
5.1.2. Personnel and plan for survey implementation
The Faculty of Economic Mathematics took on its lecturers, master-course
students and graduate students as personnel for the field survey (Appendix 1). The
questionnaires were first used in Hanoi in order to obtain experience, adjust content and
set norms of time for the field surveys. The in-depth interviews were done along with the
field surveys. After the questionnaires were completed the enumerators had one day for
training.
The teams carried out the survey simultaneously in the three selected provinces.
The survey was conducted in 20 days (with expected completion in April 2011). The
construction of a database and criteria for an output report was also done during the
survey.
Discussions with the local authorities were carried out at the end of the surveys.
The consulting agency determined the contents to be discussed and made additions, if
necessary, when conducting preliminary analyses on the information collected from the
participants.
The survey was funded as proposed.
5.1.3. Model distribution
Survey on employees: No. Location Number of
form Notes
1 Thanh Hoa 550 Population: 3400239

28
a- Thanh Hoa City 350 Population: 210000 b- Quang Xuong District 200 Population: 256351 Binh Đinh 550 Population: 1488900 a- Qui Nhon City 350 Number of communes: 5; Population:
280900
2
b- Phu Cat District 200 Number of communes: 17; Population:188200
Đong Thap 550 Population:1600000 a- Cao Lanh City 350 Number of communes: 15;
Population:149837
3
b- Lap Vo District 200 Number of communes:11; Population:121000
Total 1650 Including 15% in potential Time and personnel for survey:
- The survey was conducted in the selected provinces from 10/2 to 2/20/2011. - The survey was conducted by the lecturers, graduate students and master-course students of the Faculty of Economic Mathematics (Appendix 2).
In-depth interviews:
Twelve in-depth interviews with non-official workers were conducted to find out
more about needs and issues that were not all mentioned in the questionnaires. This also
helped check the issues mentioned by the participants in the questionnaires. The in-depth
interviews (in the form of group discussions) were conducted in the wards and communes
under survey.
Discussions with the local authorities:
Three discussions with local government representatives were conducted at the
commune level. The discussions mainly focused on the following content:
- increases in the number of non-official labour in the locality; - number, age structure and gender of informal workers; - structure of trade; - main contribution of non-official workers and informal employment; - satisfying the irregular labour requirements;
29
- raising income, eliminating hunger and reducing poverty; - reducing the unemployment rate; - unwanted consequences of non-official workers and informal employment; - culture, economy, administration, security, public services;
- proposals about support programs for informal labour under regulations of localities and the state; - possibility and profitability of setting up organizations to support local informal workers.
Discussions on the topics mentioned above were held and conducted directly by
the lecturers of the Faculty of Economic Mathematics.
5.1.4. Support for the survey
The Department of Employment issued letters of recommendation to the survey
staff. Localities (through district labour departments) helped the survey staff approach
commune governments and informal workers. The consulting unit was responsible for
monitoring and directing the survey process to promptly resolve any issues that arose.
5.2. Expected results of survey
The survey results were expected to provide information that would help clarify
the phenomena discovered in the LFS 2007 & 2009 as well as providing a basis to meet
consultation needs and build pilot policies on formal labour. Pilot policies can give the
experience and insight necessary to amend other policies for greater success.
In addition to compiling reports and charts of output data for analysis and policy
recommendation, the survey results can be used to organize seminars with management
agencies and experts in order to complete reports and recommenations.
5.3. Results of field surveys After completing the questionnaires, the consulting agency conducted a trial
survey in Thanh Hoa. After that, it made an assessment of the questionnaires and all of
the adjustments necessary to produce an official questionnaire.
The field survey was conducted in the selected locations only.
30
However, one challenge was that in February 2011 it was impossible for the survey
teams to travel by aircraft or by train. The consulting agency had to hire a van to take the
teams to the area to ensure the progress of survey and conduct group discussions and
discussions with the local authorities. The survey progressed smoothly thanks to great
support of the local governments and the enthusiastic cooperation of the local labourers in
providing relevant information.
In 3 provinces (Thanh Hoa, Binh Dinh and Dong Thap), the staff of the Labour,
Invalids and Social Affairs Department offered a lot of useful advice that helped the team
reach the right audience and achieve the best quality results. The team collected 1652
personal questionnaires, 12 sets of workers’ opinions (through group discussions), and 3
sets of general opinions from the commune governments. The survey supervisors
affirmed that the survey was conducted in a strict, honest and random manner.
The advisory agency checked and collected the questionnaires. They had the
survey staff explain unclear points and directly re-interviewed the information providers
in doubt. Initially, the advisory agency adopted 100% of the questionnaires for synthesis
and analysis. According to the advisory agents the discussions were generally of good
quality.
6. SYNTHESIS and ANALYSIS of SURVEY DATA
6.1. Database
The database was built using the standard format of the Special Purpose Statistics
Software (SPSS) with full logic controls that run on SPSS Data Entry Builder 4.0. All
variables were fully determined (variable names, variable types, variable labels, value
labels and missing values).
The data entry was conducted twice independently and the inputs were compared
to detect any mechanical faults. The mechanical errors were then corrected using the
information obtained from the questionnaires.
All the data was entered and saved in different formats which helped make the
data readable by different softwares like SPSS, Winstata, Excel, Fox, and Dbase. For the
other formats of SPSS, the consulting agency provided a dictionary of variables in the
31
form of an Excel spreadsheet. This dictionary was extracted directly from SPSS. The
database was also presented in two versions, one in Vietnamese and the other in English.
6.2. Scale and distribution of informal labour under survey
6.2.1. Distribution by work location
As planned, the field survey was conducted in three provinces (th: Thanh Hoa; bd:
Binh Dinh; dt: Dong Thap) and in three regions (North, Central and South). Two areas –
urban and rural – were also taken into account, consistent with the model design of labour
distribution (Section 3.2.2). Also, the data from previous surveys showed that the
proportion of informal labour from rural areas to the city was relatively high. Table 1
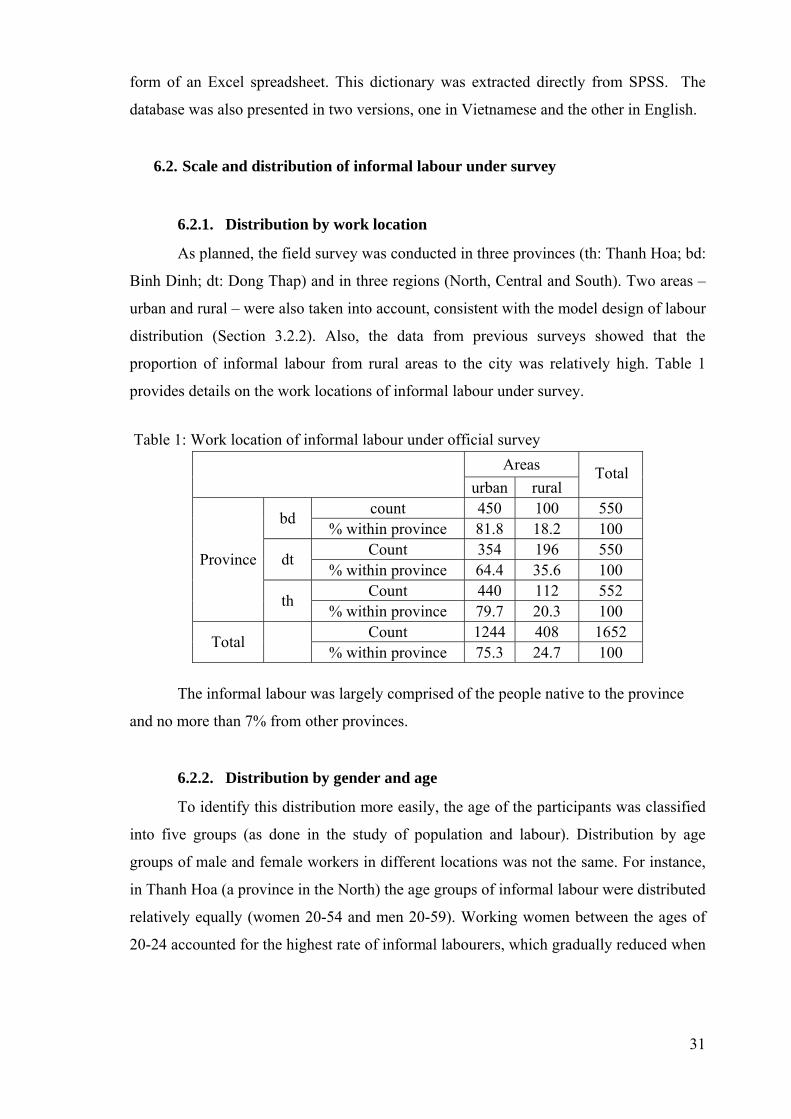
provides details on the work locations of informal labour under survey.
Table 1: Work location of informal labour under official survey
Areas urban rural
Total
count 450 100 550 bd % within province 81.8 18.2 100
Count 354 196 550 dt % within province 64.4 35.6 100
Count 440 112 552
Province
th % within province 79.7 20.3 100
Count 1244 408 1652 Total % within province 75.3 24.7 100
The informal labour was largely comprised of the people native to the province
and no more than 7% from other provinces.
6.2.2. Distribution by gender and age
To identify this distribution more easily, the age of the participants was classified
into five groups (as done in the study of population and labour). Distribution by age
groups of male and female workers in different locations was not the same. For instance,
in Thanh Hoa (a province in the North) the age groups of informal labour were distributed
relatively equally (women 20-54 and men 20-59). Working women between the ages of
20-24 accounted for the highest rate of informal labourers, which gradually reduced when

32
the working age increased. Whereas, working men of age group 50-54 occupied the
highest level.
This was likely due to the fact that almost all men between the ages of 20-24 were
still in vocational schools, secondary schools, or other training institutions, but it was not
so for women of the same age. This explains why women found work sooner. Figure 1a
and 1b shows this distribution.
Age group60-6455-5950-5445-4940-4435-3930-3425-2920-2415-19
Per
cent
20
15
10
5
0
1.29%
3.00%
11.59%9.87%
13.30%12.88%
15.45%
12.45%
16.31%
3.86%
Age groupTinh: th, Gender: Female
Figure 1a: Age distribution of working women in Thanh Hoa
Age group65-6960-6455-5950-5445-4940-4435-3930-3425-2920-2415-19
Perc
ent
20
15
10
5
0 0 31%0.94%
5.02%
16.30%
12.23%
15.05%13.48%13.79%13.17%
7.52%
2.19%
Age group
Tinh: th, Gender: Male
Figure 1b: Age distribution of working men in Thanh Hoa
In the Central provinces and the South, this distribution of gender was seen even
more clearly. The percentage of informal working women surveyed in Dong Thap was

33
highly concentrated in the age group of 20-24, while working men were distributed quite
equally amongst the age groups. This likely demonstrates the difference in customs and
culture of the two regions. Figure 2a and 2b show more details.
Age group70+65-6960-6455-5950-5445-4940-4435-3930-3425-2920-2415-19
Perc
ent
20
15
10
5
0 0.65%0.65%
1.96%
4.25%
7.52%
15.03%
12.75%
10.78%
14.71%15.03%
11.44%
5.23%
Age group
Tinh: dt, Gender: Male
Figure 2a: Age structure of working men surveyed in Dong Thap
Age group60-6455-5950-5445-4940-4435-3930-3425-2920-2415-19
Perc
ent
20
15
10
5
0
2.46%3.28%
10.66%
12.30%
13.52%
11.89%
10.66%10.25%
19.26%
5.74%
Age group
Tinh: dt, Gender: Female
Figure 2b: Age structure of working women surveyed in Dong Thap
The difference in age and gender distribution shown above was not found in Binh
Dinh (a central province).

34
6.2.3. Marital status
The informal labourers were mainly married and living with their spouses.
Statistics from the survey showed that this was true for more than 75% of the informal
workers. This might show us that most of the non-official workers found jobs to meet the
needs of their families. Their family responsibilities did not allow them various job
options.
We can verify this hypothesis by analyzing the non-official workers’ positions in
their families. The following statistics will help identify the accuracy of the theory. Table
1 shows more details of the people surveyed by province.
Table 1a: Relationship to the head of household(a)
Frequenc
y Percent Valid
Percent Cumulative
Percent Valid Head 531 42.7 42.9 42.9 Spouse 230 18.5 18.6 61.5 son/
daughter 320 25.7 25.9 87.4
Parents 6 .5 .5 87.9 Other
relative 150 12.1 12.1 100.0
Total 1237 99.4 100.0 Missing
System 7 .6
Total 1244 100.0 a urban/ rural = urban
Table 1b: Relationship to the head of household(a)
Frequenc
y Percent Valid
Percent Cumulative
Percent Valid Head 152 37.3 37.3 37.3 Spouse 133 32.6 32.7 70.0 son/
daughter 97 23.8 23.8 93.9
Parents 3 .7 .7 94.6 Other
relative 22 5.4 5.4 100.0
Total 407 99.8 100.0 Missing
System 1 .2
Total 408 100.0

35
a urban/ rural = rural The number of informal workers identified as householders in urban areas was
42.9% and 37% in rural areas. If both the husband and wife of the household were
included, the proportion would be 62% and 70% respectively. Also, it is notable that
21.7% of those surveyed were not married.
Table 2: Marital status of the people surveyed by province and gender
current marital status(a) - Tinh = bd , Gender = Male
Frequenc
y Percent Valid
Percent Cumulative
Percent Valid Single 41 15.0 15.1 15.1 Married 226 82.8 83.1 98.2 Widowed 3 1.1 1.1 99.3 Divorced/
Separated 2 .7 .7 100.0
Total 272 99.6 100.0
current marital status(a) - Tinh = bd , Gender = Female
Frequenc
y Percent Valid
Percent Cumulative
Percent Valid Single 46 16.6 16.7 16.7 Married 219 79.1 79.3 96.0 Widowed 10 3.6 3.6 99.6 Divorced/
Separated 1 .4 .4 100.0
Total 276 99.6 100.0
current marital status(a) - Tinh = dt , Gender = Male
Frequenc
y Percent Valid
Percent Cumulative
Percent Valid single 78 25.5 25.6 25.6 married 225 73.5 73.8 99.3 widowe
d 2 .7 .7 100.0

36
Total 305 99.7 100.0
current marital status(a) - Tinh = dt , Gender = Female
Frequen
cy Percent Valid
Percent Cumulative Percent
Valid
Single 74 30.3 30.3 30.3
Married 150 61.5 61.5 91.8 Widowed 9 3.7 3.7 95.5 Divorced/
Separated 11 4.5 4.5 100.0
Total 244 100.0 100.0
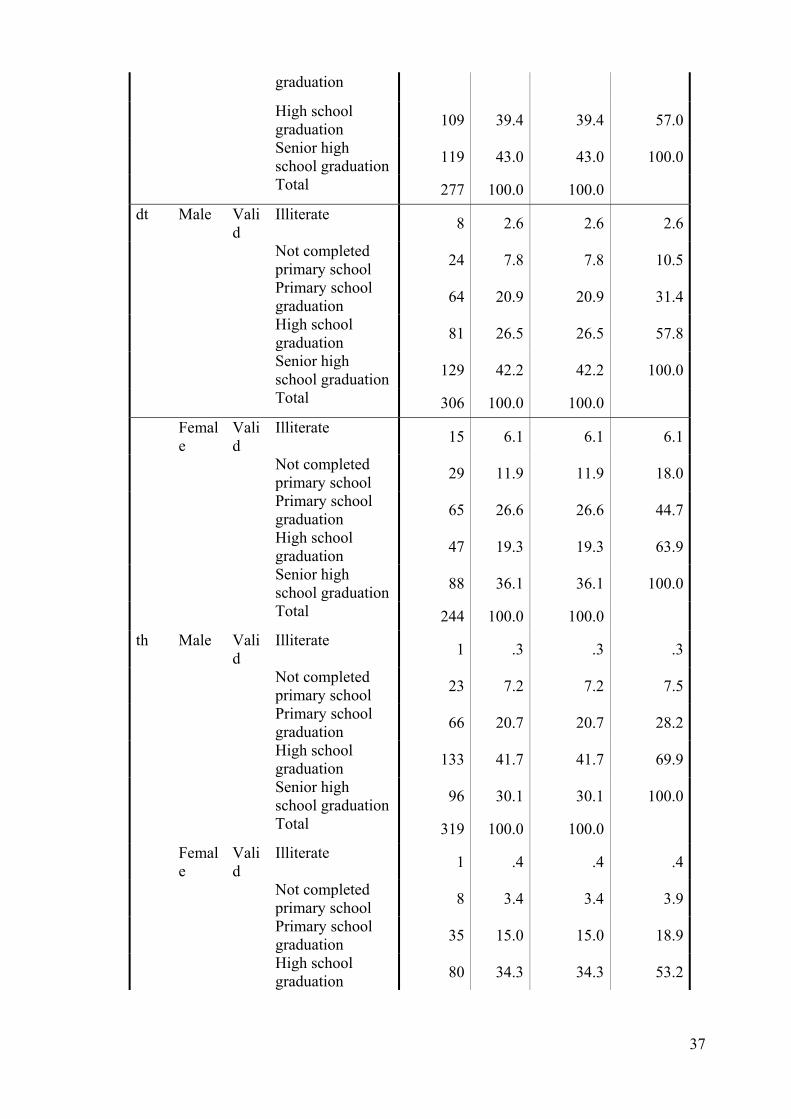
6.2.4. Educational and technical qualifications of the people surveyed
The informal labourers surveyed were mostly school graduates, regardless of
region and gender (Table 3). However, there was a difference in education level between
the rural and urban areas (Table 4).
Although it was not too serious a problem, this difference affects how the
informal workers benefitted from the policies of the State. This issue will be discussed in
the last section of this report.
Table 3: Education level by region and gender
Tinh Gender
Frequency
Percent
Valid Percent
Cumulative Percent
bd Male Valid
Not completed primary school 5 1.8 1.8 1.8
Primary school graduation 30 11.0 11.0 12.8
High school graduation 113 41.4 41.4 54.2
Senior high school graduation 125 45.8 45.8 100.0
Total 273 100.0 100.0 Femal
e Valid
Illiterate 2 .7 .7 .7
Not completed primary school 12 4.3 4.3 5.1
Primary school 35 12.6 12.6 17.7
37
graduation
High school graduation 109 39.4 39.4 57.0
Senior high school graduation 119 43.0 43.0 100.0
Total 277 100.0 100.0 dt Male Vali
d Illiterate 8 2.6 2.6 2.6
Not completed primary school 24 7.8 7.8 10.5
Primary school graduation 64 20.9 20.9 31.4
High school graduation 81 26.5 26.5 57.8
Senior high school graduation 129 42.2 42.2 100.0
Total 306 100.0 100.0 Femal
e Valid
Illiterate 15 6.1 6.1 6.1
Not completed primary school 29 11.9 11.9 18.0
Primary school graduation 65 26.6 26.6 44.7
High school graduation 47 19.3 19.3 63.9
Senior high school graduation 88 36.1 36.1 100.0
Total 244 100.0 100.0 th Male Vali
d Illiterate 1 .3 .3 .3
Not completed primary school 23 7.2 7.2 7.5
Primary school graduation 66 20.7 20.7 28.2
High school graduation 133 41.7 41.7 69.9
Senior high school graduation 96 30.1 30.1 100.0
Total 319 100.0 100.0 Femal
e Valid
Illiterate 1 .4 .4 .4
Not completed primary school 8 3.4 3.4 3.9
Primary school graduation 35 15.0 15.0 18.9
High school graduation 80 34.3 34.3 53.2
38
Senior high school graduation 109 46.8 46.8 100.0
Total 233 100.0 100.0
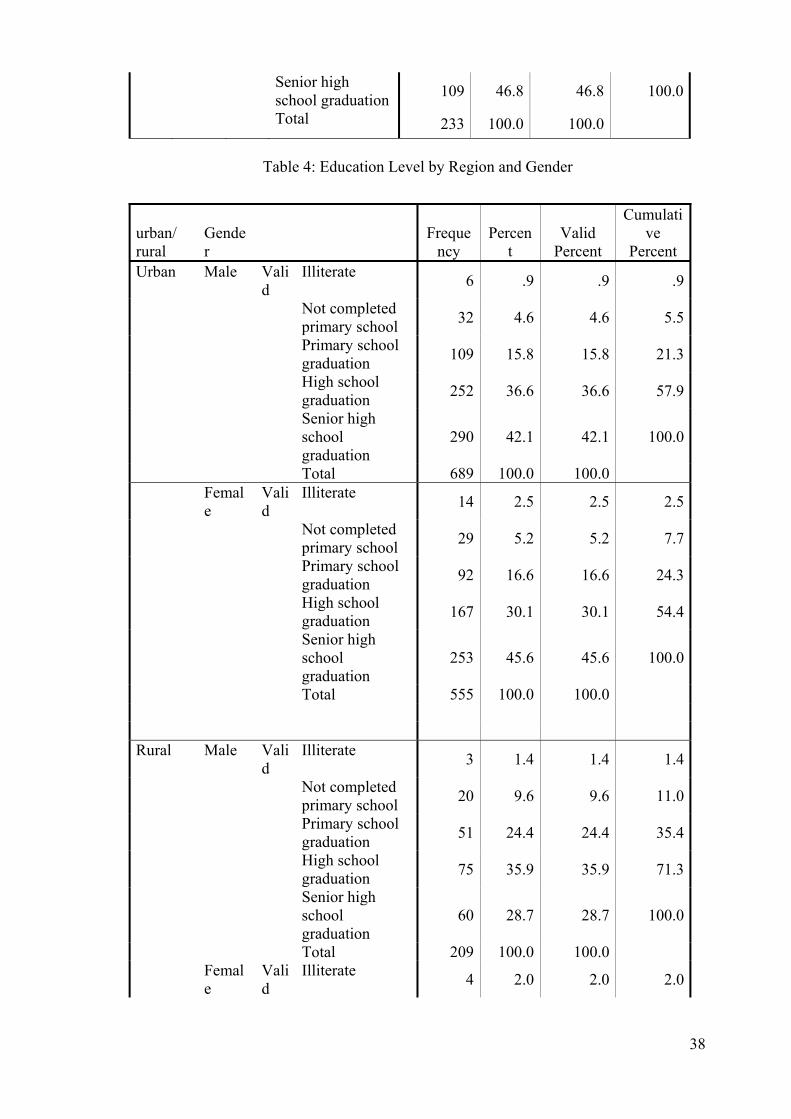
Table 4: Education Level by Region and Gender
urban/ rural
Gender
Frequency
Percent
Valid Percent
Cumulative
Percent Urban Male Vali
d Illiterate 6 .9 .9 .9
Not completed primary school 32 4.6 4.6 5.5
Primary school graduation 109 15.8 15.8 21.3
High school graduation 252 36.6 36.6 57.9
Senior high school graduation
290 42.1 42.1 100.0
Total 689 100.0 100.0 Femal
e Valid
Illiterate 14 2.5 2.5 2.5
Not completed primary school 29 5.2 5.2 7.7
Primary school graduation 92 16.6 16.6 24.3
High school graduation 167 30.1 30.1 54.4
Senior high school graduation
253 45.6 45.6 100.0
Total 555 100.0 100.0 Rural Male Vali
d Illiterate 3 1.4 1.4 1.4
Not completed primary school 20 9.6 9.6 11.0
Primary school graduation 51 24.4 24.4 35.4
High school graduation 75 35.9 35.9 71.3
Senior high school graduation
60 28.7 28.7 100.0
Total 209 100.0 100.0 Femal
e Valid
Illiterate 4 2.0 2.0 2.0
39
Not completed primary school 20 10.1 10.1 12.1
Primary school graduation 43 21.6 21.6 33.7
High school graduation 69 34.7 34.7 68.3
Senior high school graduation
63 31.7 31.7 100.0
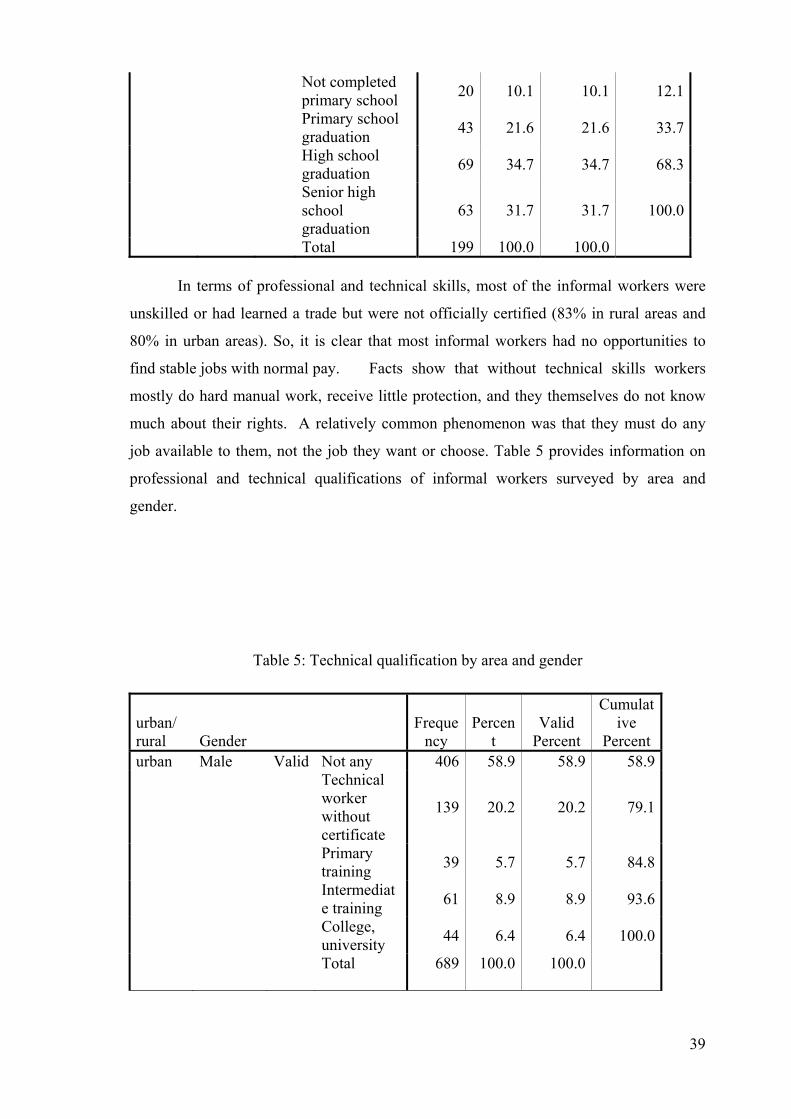
Total 199 100.0 100.0 In terms of professional and technical skills, most of the informal workers were
unskilled or had learned a trade but were not officially certified (83% in rural areas and
80% in urban areas). So, it is clear that most informal workers had no opportunities to
find stable jobs with normal pay. Facts show that without technical skills workers
mostly do hard manual work, receive little protection, and they themselves do not know
much about their rights. A relatively common phenomenon was that they must do any
job available to them, not the job they want or choose. Table 5 provides information on
professional and technical qualifications of informal workers surveyed by area and
gender.
Table 5: Technical qualification by area and gender
urban/ rural Gender
Frequency
Percent
Valid Percent
Cumulative
Percent urban Male Valid Not any 406 58.9 58.9 58.9 Technical
worker without certificate
139 20.2 20.2 79.1
Primary training 39 5.7 5.7 84.8
Intermediate training 61 8.9 8.9 93.6
College, university 44 6.4 6.4 100.0
Total 689 100.0 100.0

40
Female Valid Not any 377 67.9 67.9 67.9 Technical
worker without certificate
64 11.5 11.5 79.5
Primary training 23 4.1 4.1 83.6
Intermediate training 55 9.9 9.9 93.5
College, university 36 6.5 6.5 100.0
Total 555 100.0 100.0 rural Male Valid Not any 121 57.9 57.9 57.9 Technical
worker without certificate
54 25.8 25.8 83.7
Primary training 14 6.7 6.7 90.4
Intermediate training 13 6.2 6.2 96.7
College, university 7 3.3 3.3 100.0
Total 209 100.0 100.0 Female Valid Not any 144 72.4 72.4 72.4 Technical
worker without certificate
26 13.1 13.1 85.4
Primary training 8 4.0 4.0 89.4
Intermediate training 13 6.5 6.5 96.0
College, university 8 4.0 4.0 100.0
Total 199 100.0 100.0
Notwithstanding, 6% of the surveyed workers, mostly young workers, finished
university and college (Table 6).
Table 6: Age distribution of informal workers as university-college graduates by group
age

41
Frequenc
y Percent Valid
Percent Cumulative Percent
Valid
20-24 20 21.1 21.1 21.1
25-29 19 20.0 20.0 41.1
30-34 17 17.9 17.9 58.9
35-39 7 7.4 7.4 66.3
40-44 6 6.3 6.3 72.6
45-49 13 13.7 13.7 86.3
50-54 6 6.3 6.3 92.6
55-59 4 4.2 4.2 96.8
60-64 2 2.1 2.1 98.9
65-69 1 1.1 1.1 100.0
Total 95 100.0 100.0
Updates on work status will help us identify this issue more clearly.
6.3. Work status of informal workers
6.3.1. Current work of informal workers
There were 24 main jobs undertaken by the informal workers under survey. The
survey results showed that there was some difference in gender distribution between the
informal workers in general, and between informal workers of rural and urban areas in
particular. Table 7 provides background information on this aspect in urban areas.
Table 7: Main jobs of urban informal labour
Current jobs Frequency Valid Percent Male
Processing worker, hand carver, machine operator, mechanic, electrician 146 21.89Bus driver 94 14.09Porter 58 8.70Producer /service provider 58 8.70Grocery shop owner 56 8.40Food caterers 40 6.00

42
Lorry driver 32 4.80Female
Grocery seller 123 22.94Food caterers 113 21.08processing worker, hand carver, machine operator, mechanic, electrician 63 11.75Vegetable and food seller 39 7.27Clothing retailer 36 6.71Health staff 26 4.85
48% of the male labourers worked as lorry drivers, bus drivers, porters, producers,
machine operators or equipment repairmen. A modest percentage (8.7%) of workers
worked as small producers or service providers (also called household businesses).
A considerable percentage (23%) of the female employees were hired at grocery
stalls or in the markets. 25.93% of the female employees served customers in restaurants,
hotels, spas or healthcare centers.
In rural areas, the situation was different. Most male employees worked in
manufacturing, processing, or industrial maintainence establishments (41.7%). Some
worked in the construction field, in trading companies, or in their own businesses. A
small percentage worked in the food service sector or transportation.
The majority of rural female workers found jobs in manufacturing establishments
or set up their own businesses buying and selling agricultural products and groceries. The
rate of rural workers in the service sector (restaurants/hotels/healthcare centers) was
smaller than that of informal workers in urban areas. Table 8 provides key information
about this structure.
Table 8: Main jobs of rural informal labour
Current jobs Frequency Valid PercentMale
Processing worker, hand carver, machine operator, mechanic, electrician 83 41.71Grocery seller 15 7.54Producer /service provider 14 7.04Food caterer 13 6.53House builder/repairer 13 6.53Fuel, material and equipment seller 12 6.03Bus driver 10 5.03

43
Female Processing worker, hand carver, machine operator, mechanic, electrician 45 22.96Grocery shop owner 36 18.37Food caterers 25 12.76Vegetable and food seller 22 11.22Clothing retailer 13 6.63Healthcare staff 9 4.59Producer /service provider 9 4.59
6.3.2. Work stability and professional suitability
In particular cases, job stability may reflect the status of workers. A hard job with
low pay may show that the workers are in a disadvantageous position. Similarly, the
frequent changing of poorly paid jobs points to a high potential for unemployment – a
constant threat for informal workers. Table 9 provides more information given by the
informal workers in both areas surveyed by gender:
Table 9: Working time at current jobs of surveyed workers (years) Tinh
Urban/ Rural Gender
Minimum
Maximum Mean
Std. Deviation
bd Urban Male .08 50.00 10.2842 9.01369 Female .08 35.00 8.8920 8.03092 Rural Male .25 60.00 16.9410 15.12133 Female .17 26.67 7.0801 7.18627 dt Urban Male .08 30.00 7.7928 6.97875 Female .08 40.00 6.8054 8.37334 Rural Male .08 30.00 5.9963 6.94577 Female .08 28.00 6.4809 6.89354 th Urban Male .17 35.00 6.3407 5.94375

44
Female .17 30.00 6.0764 5.96897 Rural Male 1.00 25.00 6.4427 6.34271 Female .25 30.00 8.8229 6.23133
The specific statistics indicate that the work stability of informal workers is not
high. The relative standard deviation, which came near to the average line, shows a higher
dispersion of the working time at their current job. To see this issue more clearly we will
need more detailed analysis. The following is a statistical analysis, by quintile, of the
current working time and age group of informal workers (Table 10a, 10b).
Table 10a: The longest current working time by quintile
OLAP Cubes
330 1.67326 3.08349 7.00312 14.00326 60.00
1643 60.00
Percentile Group of c13n12345Total
N Maximum
Table 10b: Current working time by quintile of age group
Percentile Group of c13n Age group
1 2 3 4 5 15-19 15.5% 2.1% .6% .0% .0% 20-24 33.6% 16.6% 5.2% .6% .0% 25-29 17.3% 25.5% 16.0% 3.2% .3% 30-34 10.6% 18.1% 20.1% 13.8% 3.1% 35-39 6.7% 9.2% 17.5% 21.2% 7.7% 40-44 5.5% 10.1% 15.5% 18.9% 20.2%
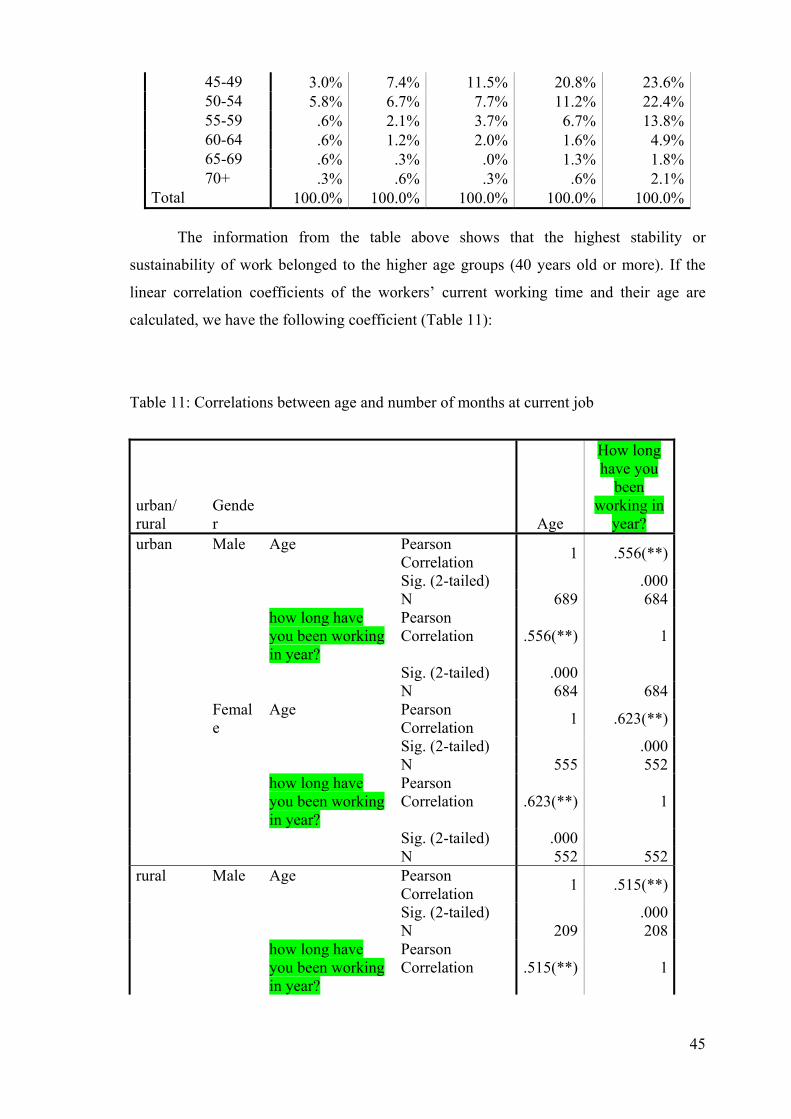
45
45-49 3.0% 7.4% 11.5% 20.8% 23.6% 50-54 5.8% 6.7% 7.7% 11.2% 22.4% 55-59 .6% 2.1% 3.7% 6.7% 13.8% 60-64 .6% 1.2% 2.0% 1.6% 4.9% 65-69 .6% .3% .0% 1.3% 1.8% 70+ .3% .6% .3% .6% 2.1%Total 100.0% 100.0% 100.0% 100.0% 100.0%
The information from the table above shows that the highest stability or
sustainability of work belonged to the higher age groups (40 years old or more). If the
linear correlation coefficients of the workers’ current working time and their age are
calculated, we have the following coefficient (Table 11):
Table 11: Correlations between age and number of months at current job
urban/ rural
Gender Age
How long have you
been working in
year? urban Male Age Pearson
Correlation 1 .556(**)
Sig. (2-tailed) .000 N 689 684 how long have
you been working in year?
Pearson Correlation .556(**) 1
Sig. (2-tailed) .000 N 684 684 Femal
e Age Pearson
Correlation 1 .623(**)
Sig. (2-tailed) .000 N 555 552 how long have
you been working in year?
Pearson Correlation .623(**) 1
Sig. (2-tailed) .000 N 552 552rural Male Age Pearson
Correlation 1 .515(**)
Sig. (2-tailed) .000 N 209 208 how long have
you been working in year?
Pearson Correlation .515(**) 1

46
Sig. (2-tailed) .000 N 208 208 Femal
e Age Pearson
Correlation 1 .547(**)
Sig. (2-tailed) .000 N 199 199 how long have
you been working in year?
Pearson Correlation .547(**) 1
Sig. (2-tailed) .000 N 199 199
** Correlation is significant at the 0.01 level (2-tailed). With the level of 1%, all the correlation coefficients above are positive. So, it is
clear that work stability was a characteristic of the informal workers’ employment. In
other words, they did not have any opportunity to or did not intend to change their job.
The dispersal of their current working time was because of the age difference
between men and women, and between urban and rural areas.
A very small percentage of informal workers had technical expertise. Yet, those who had
technical skills were able to find more stable jobs than the college/university graduates
did. Table 12 shows this situation.
Table 12: Workers with technical expertise and professional suitability
Is current job fit for your trained
technical qualification? Total
Yes No Yes highest technical qualification
Technical worker without certificate
Count
209 58 267
% within highest technical qualification
78.3% 21.7% 100.0%
Primary training Count 53 24 77 % within highest
technical qualification
68.8% 31.2% 100.0%
Intermediate training
Count 66 72 138
% within highest technical qualification
47.8% 52.2% 100.0%
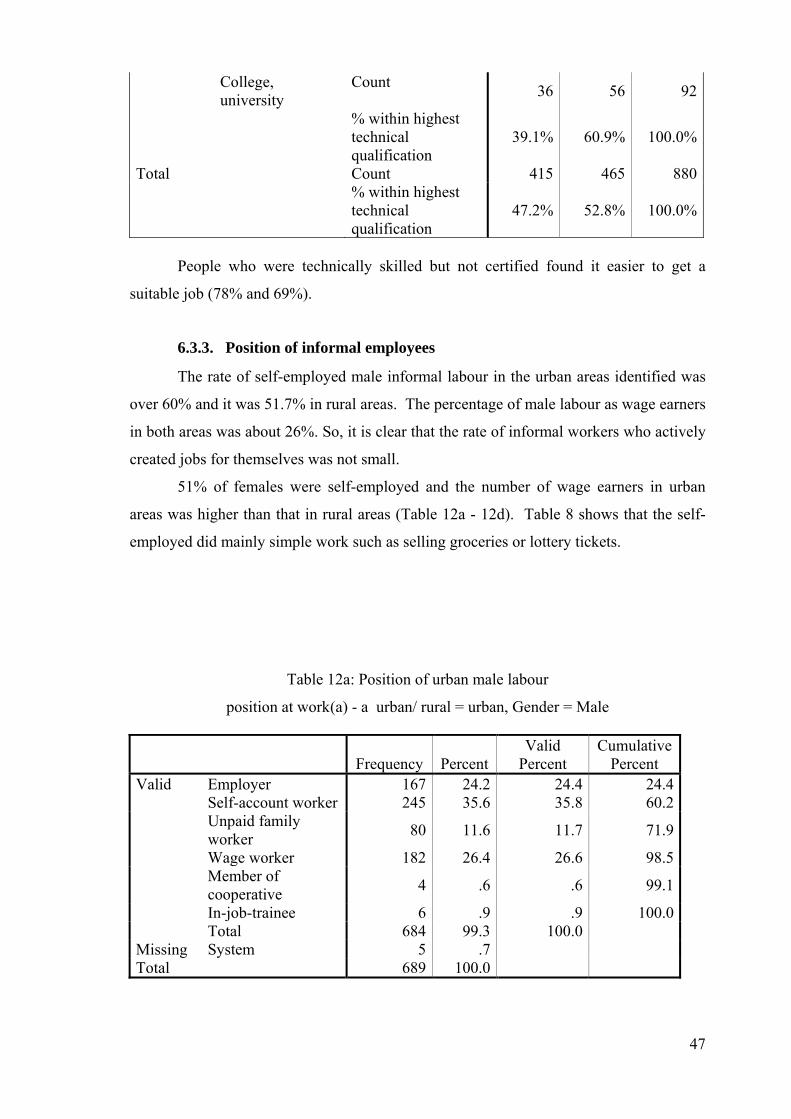
47
College, university
Count 36 56 92
% within highest technical qualification
39.1% 60.9% 100.0%
Total Count 415 465 880 % within highest
technical qualification
47.2% 52.8% 100.0%
People who were technically skilled but not certified found it easier to get a
suitable job (78% and 69%).
6.3.3. Position of informal employees
The rate of self-employed male informal labour in the urban areas identified was
over 60% and it was 51.7% in rural areas. The percentage of male labour as wage earners
in both areas was about 26%. So, it is clear that the rate of informal workers who actively
created jobs for themselves was not small.
51% of females were self-employed and the number of wage earners in urban
areas was higher than that in rural areas (Table 12a - 12d). Table 8 shows that the self-
employed did mainly simple work such as selling groceries or lottery tickets.
Table 12a: Position of urban male labour
position at work(a) - a urban/ rural = urban, Gender = Male
Frequency Percent Valid
Percent Cumulative
Percent Valid Employer 167 24.2 24.4 24.4 Self-account worker 245 35.6 35.8 60.2 Unpaid family
worker 80 11.6 11.7 71.9
Wage worker 182 26.4 26.6 98.5 Member of
cooperative 4 .6 .6 99.1
In-job-trainee 6 .9 .9 100.0 Total 684 99.3 100.0 Missing System 5 .7 Total 689 100.0

48
Table 12b: Position of rural male labour
position at work(a) - urban/ rural = rural, Gender = Male
Frequency Percent Valid
Percent Cumulative
Percent Valid Employer 63 30.1 30.1 30.1 Self-account worker 45 21.5 21.5 51.7 Unpaid family
worker 28 13.4 13.4 65.1
Wage worker 54 25.8 25.8 90.9 Member of
cooperative 15 7.2 7.2 98.1
In-job-trainee 4 1.9 1.9 100.0 Total 209 100.0 100.0
Table 12c: Position of urban female labour
position at work(a)- urban/ rural = urban, Gender = Female
Frequency Percent Valid
Percent Cumulative
Percent Valid Employer 106 19.1 19.2 19.2 Self-account
worker 176 31.7 31.8 51.0
Unpaid family worker 88 15.9 15.9 66.9
Wage worker 176 31.7 31.8 98.7 In-job-trainee 7 1.3 1.3 100.0 Total 553 99.6 100.0 Missing System 2 .4 Total 555 100.0
Table 12d: Position of rural female labour
position at work(a) - urban/ rural = rural, Gender = Female
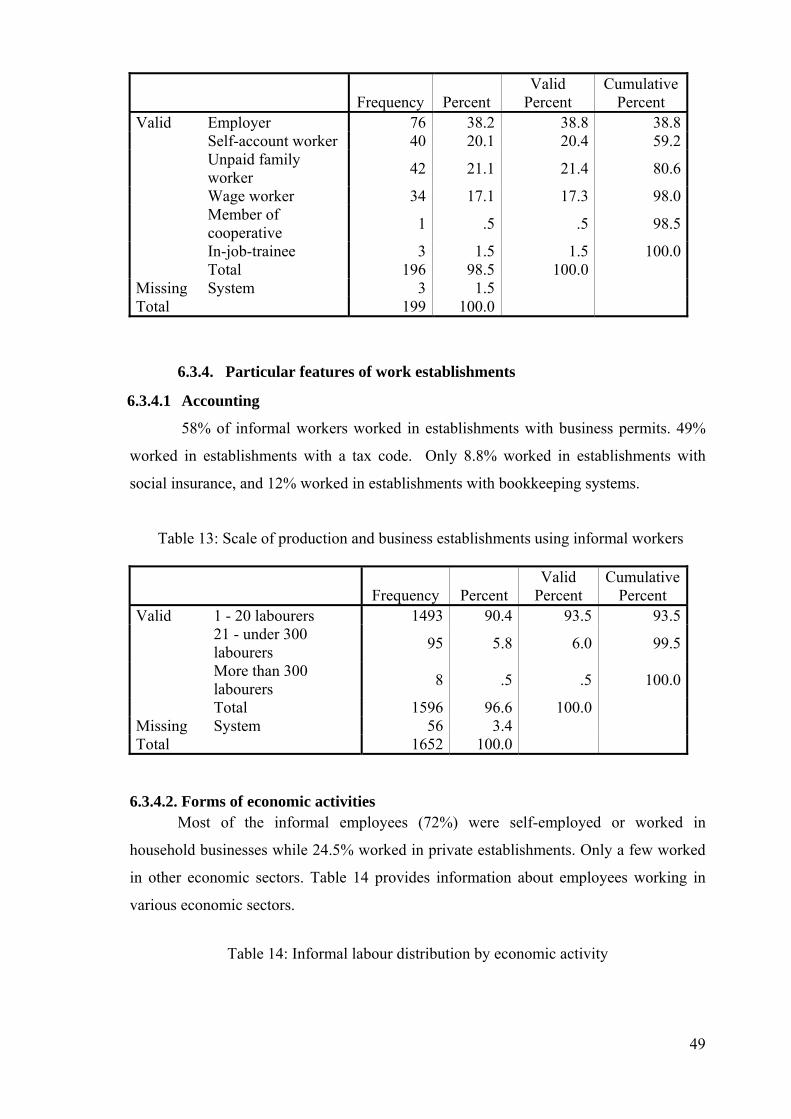
49
Frequency Percent Valid
Percent Cumulative
Percent Valid Employer 76 38.2 38.8 38.8 Self-account worker 40 20.1 20.4 59.2 Unpaid family
worker 42 21.1 21.4 80.6
Wage worker 34 17.1 17.3 98.0 Member of
cooperative 1 .5 .5 98.5
In-job-trainee 3 1.5 1.5 100.0 Total 196 98.5 100.0 Missing System 3 1.5 Total 199 100.0
6.3.4. Particular features of work establishments
6.3.4.1 Accounting
58% of informal workers worked in establishments with business permits. 49%
worked in establishments with a tax code. Only 8.8% worked in establishments with
social insurance, and 12% worked in establishments with bookkeeping systems.
Table 13: Scale of production and business establishments using informal workers
Frequency Percent Valid
Percent Cumulative
Percent Valid 1 - 20 labourers 1493 90.4 93.5 93.5 21 - under 300
labourers 95 5.8 6.0 99.5
More than 300 labourers 8 .5 .5 100.0
Total 1596 96.6 100.0 Missing System 56 3.4 Total 1652 100.0
6.3.4.2. Forms of economic activities Most of the informal employees (72%) were self-employed or worked in
household businesses while 24.5% worked in private establishments. Only a few worked
in other economic sectors. Table 14 provides information about employees working in
various economic sectors.
Table 14: Informal labour distribution by economic activity

50
Frequenc
y Percent Valid
Percent Cumulative
Percent Valid Household/
Individual 751 45.5 47.4 47.4
Business household 392 23.7 24.7 72.1
Collective 30 1.8 1.9 74.0 Private 388 23.5 24.5 98.4 State 21 1.3 1.3 99.7 Foreign investment 4 .2 .3 100.0 Total 1586 96.0 100.0 Missing
System 66 4.0
Total 1652 100.0 6.3.4.3 Work condition and position
Nearly 67% of informal employees worked at home or had a fixed office. The
rest (33%) had no fixed work location or had a fixed location but no building or office
space. Table 15 provides details of this situation.
Table 15: Work Place
Frequency Percent Valid
Percent Cumulative
Percent Valid Fixed office 422 25.5 25.7 25.7 Own home/client’s
home 675 40.9 41.2 66.9
Outdoor fixed location 228 13.8 13.9 80.8
Mobile location 315 19.1 19.2 100.0 Total 1640 99.3 100.0 Missing System 12 .7 Total 1652 100.0
6.4. Labour contract of working time and pay
6.4.1. Form of labour contract
As mentioned above, this information is only meaningful to salaried employees.
The self-employed do not find it useful. Of the 93.9% of the informal labour surveyed,
only 7.2% signed a contract – 28% worked on verbal agreements, and 64% worked
without any form of written contract or verbal agreement. Table 16 provides detailed
information about this situation.
Table 16: Contracted labour
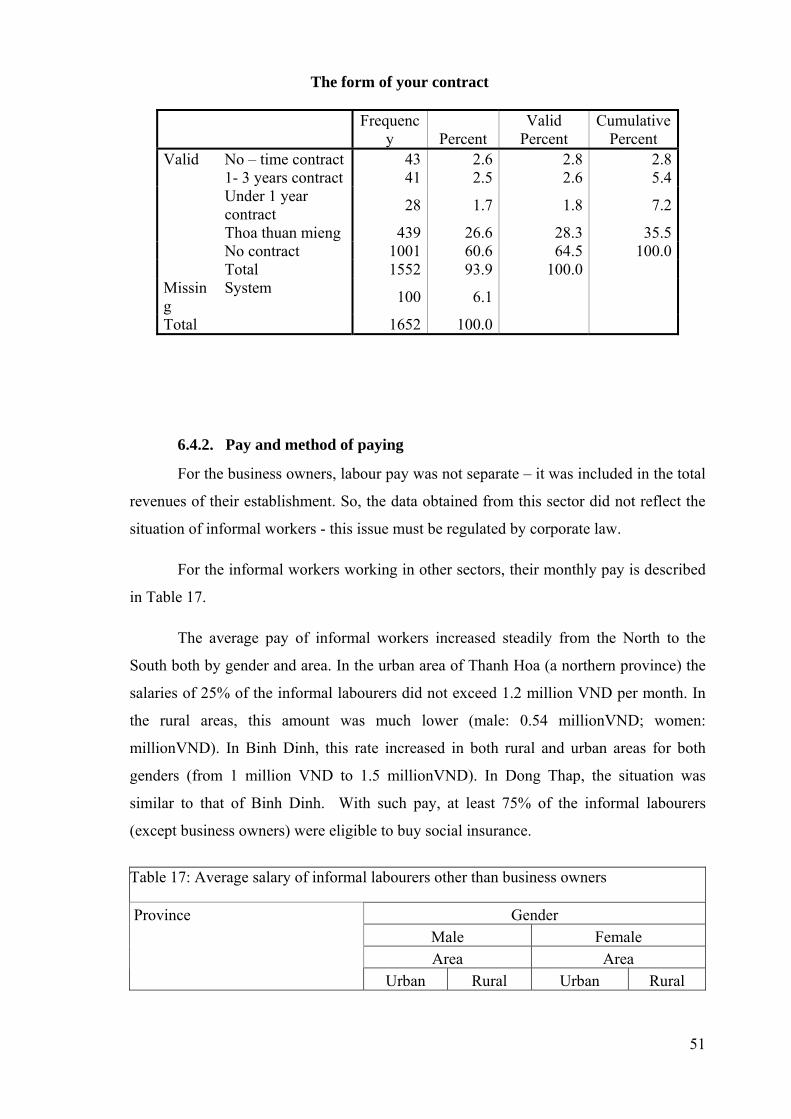
51
The form of your contract
Frequenc
y Percent Valid
Percent Cumulative
Percent Valid No – time contract 43 2.6 2.8 2.8 1- 3 years contract 41 2.5 2.6 5.4 Under 1 year
contract 28 1.7 1.8 7.2
Thoa thuan mieng 439 26.6 28.3 35.5 No contract 1001 60.6 64.5 100.0 Total 1552 93.9 100.0 Missing
System 100 6.1
Total 1652 100.0
6.4.2. Pay and method of paying
For the business owners, labour pay was not separate – it was included in the total
revenues of their establishment. So, the data obtained from this sector did not reflect the
situation of informal workers - this issue must be regulated by corporate law.
For the informal workers working in other sectors, their monthly pay is described
in Table 17.
The average pay of informal workers increased steadily from the North to the
South both by gender and area. In the urban area of Thanh Hoa (a northern province) the
salaries of 25% of the informal labourers did not exceed 1.2 million VND per month. In
the rural areas, this amount was much lower (male: 0.54 millionVND; women:
millionVND). In Binh Dinh, this rate increased in both rural and urban areas for both
genders (from 1 million VND to 1.5 millionVND). In Dong Thap, the situation was
similar to that of Binh Dinh. With such pay, at least 75% of the informal labourers
(except business owners) were eligible to buy social insurance.
Table 17: Average salary of informal labourers other than business owners
Gender Male Female Area Area
Province
Urban Rural Urban Rural

52
Mean 1694.37 1298.40 1813.16 1906.92Std. Deviation 793.299 1128.538 1315.316 1685.761
25 1200.00 540.00 1200.00 1000.0050 1500.00 540.00 1500.00 1450.00
th
Percentiles
75 2000.00 2000.00 2000.00 2250.00Mean 2399.31 1570.33 2345.24 1760.48Std. Deviation 2106.716 887.882 2033.670 811.581
25 1500.00 1000.00 1500.00 1200.0050 2000.00 1425.00 2000.00 1500.00
bd
Percentiles
75 3000.00 2000.00 2500.00 2000.00Mean 2569.91 2269.32 2231.62 1866.94Std. Deviation 3369.477 1140.312 3144.636 1596.485
25 1450.00 1500.00 1200.00 1000.0050 2000.00 2300.00 1800.00 1350.00
dt
Percentiles
75 3000.00 3000.00 2250.00 2025.00 Methods of paying are shown in Table 18. As we can see, 51% of informal
workers got paid based on the quantity of the products they made, 27% got paid by the
hour, 24% got a fixed salary, and other forms of pay accounted for 15% (a number of
employees were paid in various forms).
Of the people who got a salary and a wage, only 11% signed in the payroll. The
remaining got paid without regular payroll signing. This will be an obstacle when
labourers want to buy voluntary social insurance.
Table 18: Forms of pay
Pay and methods of pay N Percent Fixed pay 1651 24 Commission 1652 8 By day/ hour 1652 27
By product 1648 51 Unpaid 1652 1 Others 1649 15 Sign payroll 1540 11
Additionally, the survey showed that only 9% of the informal workers got paid
during vacations and holidays. Also, most informal workers did not get periodic pay
raises (except those working in the foreign invested enterprises).

53
Table 19: Periodical pay raise by particular ownership of workplace. Have you had a pay rise periodically? Ownership of the establishment
Frequency Percent
Valid Percent
Cumulative Percent
. Valid Yes 2 3.0 12.5 12.5 No 14 21.2 87.5 100.0 Total 16 24.2 100.0 Missi
ng System 50 75.8
Total 66 100.0 Household/ individual
Valid Yes 24 3.2 3.3 3.3
No 700 93.2 96.7 100.0 Total 724 96.4 100.0 Missi
ng System 27 3.6
Total 751 100.0 Business household
Valid Yes 50 12.8 13.2 13.2
No 330 84.2 86.8 100.0 Total 380 96.9 100.0 Missi
ng System 12 3.1
Total 392 100.0 Collective Valid Yes 3 10.0 10.0 10.0 No 27 90.0 90.0 100.0 Total 30 100.0 100.0 Private Valid Yes 45 11.6 11.7 11.7 No 339 87.4 88.3 100.0 Total 384 99.0 100.0 Missi
ng System 4 1.0
Total 388 100.0 State Valid Yes 1 4.8 4.8 4.8 No 20 95.2 95.2 100.0 Total 21 100.0 100.0 Foreign investment
Valid Yes 3 75.0 75.0 75.0
No 1 25.0 25.0 100.0 Total 4 100.0 100.0
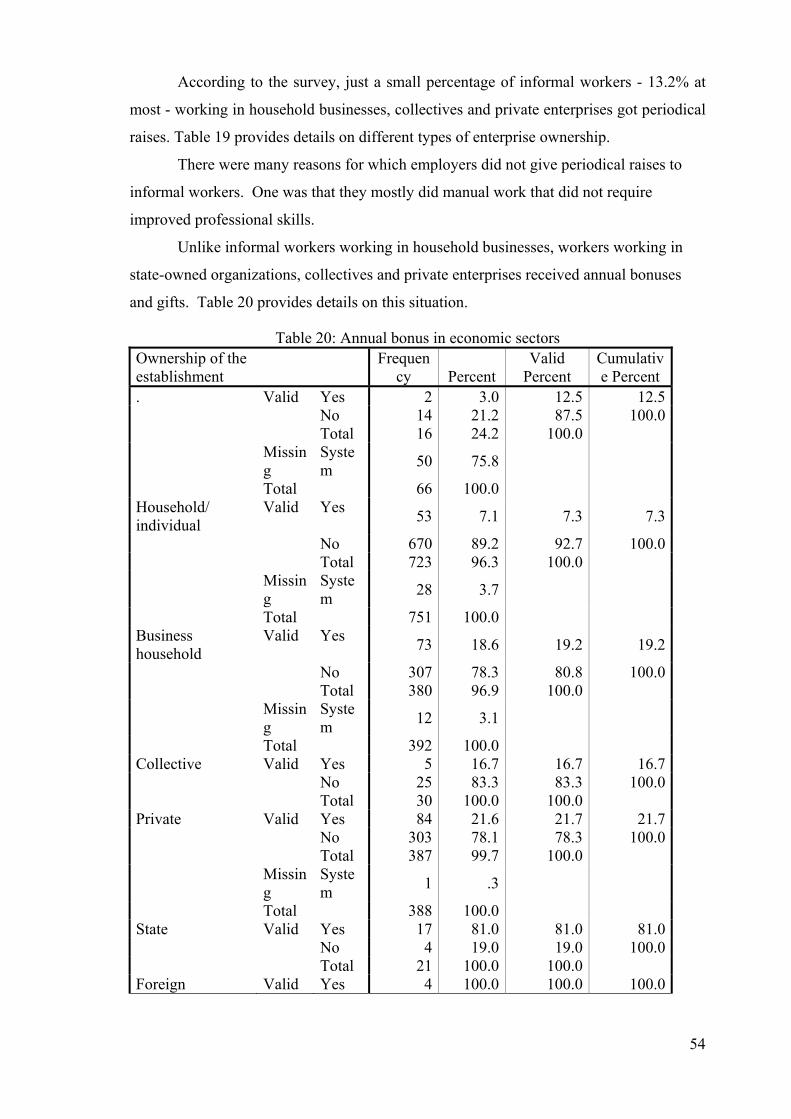
54
According to the survey, just a small percentage of informal workers - 13.2% at
most - working in household businesses, collectives and private enterprises got periodical
raises. Table 19 provides details on different types of enterprise ownership.
There were many reasons for which employers did not give periodical raises to
informal workers. One was that they mostly did manual work that did not require
improved professional skills.
Unlike informal workers working in household businesses, workers working in
state-owned organizations, collectives and private enterprises received annual bonuses
and gifts. Table 20 provides details on this situation.
Table 20: Annual bonus in economic sectors Ownership of the establishment
Frequency Percent
Valid Percent
Cumulative Percent
. Valid Yes 2 3.0 12.5 12.5 No 14 21.2 87.5 100.0 Total 16 24.2 100.0 Missin
g System 50 75.8
Total 66 100.0 Household/ individual
Valid Yes 53 7.1 7.3 7.3
No 670 89.2 92.7 100.0 Total 723 96.3 100.0 Missin
g System 28 3.7
Total 751 100.0 Business household
Valid Yes 73 18.6 19.2 19.2
No 307 78.3 80.8 100.0 Total 380 96.9 100.0 Missin
g System 12 3.1
Total 392 100.0 Collective Valid Yes 5 16.7 16.7 16.7 No 25 83.3 83.3 100.0 Total 30 100.0 100.0 Private Valid Yes 84 21.6 21.7 21.7 No 303 78.1 78.3 100.0 Total 387 99.7 100.0 Missin
g System 1 .3
Total 388 100.0 State Valid Yes 17 81.0 81.0 81.0 No 4 19.0 19.0 100.0 Total 21 100.0 100.0 Foreign Valid Yes 4 100.0 100.0 100.0

55
investment
6.4.3. Working time
The weekly working time of most informal employees was from 6 to 7 days per
week in all businesses. Daily working time is reflected in Table 21. In the
household businesses and private companies over 50% of the informal workforce had to
work at least nine hours or more a day. It was common that the self-employed worker
worked over 12 hours per day (367 / 1652 workers surveyed). A considerable number of
workers had to work 18 hours per day; generally, these were the ones working in service
sector, especially food catering and cleaning. They voluntarily worked longer hours in
order to get higher wages.
Table 21: Working time per day (hours) Ownership of the establishment Value Frequency Percent
<6 31 4.2 6-8 277 37.6 >=9 429 58.2
Household/ individual
Total 737 100 <6 13 3.5 6-8 147 39.2 >=9 215 57.3
Business household
Total 375 100 <6 1 3.4 6-8 24 82.8 >=9 4 13.8
Collective
Total 29 100 <6 15 4 6-8 238 62.8 >=9 126 33.2
Private
Total 379 100 <6 1 5 6-8 10 50 >=9 9 45
State
Total 20 100 Foreign investment 6-8 4 100
With the income compared to the work hours, the pay by hour of the informal
workers was extremely low. They resigned themselves to working in poor working

56
conditions with little protection. Talking with a number of the self-employed in Dong
Thap, we found that many people had almost no visible income – their daily expenses
soley depended on the deferred payment allowed by the goods supplier.
The rate of informal workers doing extra work apart from their main job was very
small (about 6%). Clearly, the time available for extra work was minute given the long
hours worked by most informal workers.
6.4.4. Training for informal workers
Almost all of the employers had no intention of offering training to the informal
workers. If any, no more than 8% of the informal workers got trained. This is accepted as
common practice, especially when the workforce in general and informal labour in
particular is in abundance.
Most of the business or service establishments did not need skilled labour and the
employees did not pay much attention to this issue either. Evidence of this (see Table
22a) was that only 17% of the informal workers required additional training. When asked
about their current job, 85% of the informal workers surveyed said they found their
current positions acceptable or felt satisfied with them (see Table 22b).
Table 22a: Demand for further training of informal workers
Frequenc
y Percent Valid
Percent Cumulative
Percent Valid Yes 276 16.7 16.8 16.8 No 1362 82.4 83.2 100.0 Total 1638 99.2 100.0 Missing
System 14 .8
Total 1652 100.0
Table 22b: Self-assessment of informal workers
Frequenc
y Percent Valid
Percent Cumulative
Percent Valid Very
dissatisfied 17 1.0 1.0 1.0
Dissatisfied 231 14.0 14.0 15.0 Normal 741 44.9 45.0 60.0 Satisfied 583 35.3 35.4 95.4 Very Satisfied 76 4.6 4.6 100.0 Total 1648 99.8 100.0 Missing
System 4 .2

57
Total 1652 100.0 Up to 74.4% of the surveyed informal workers said that they accepted their
current pay and that it could help them have a normal and stable life (see Table 22c).
Table 22c: Life self-evaluation of informal workers
Frequenc
y Percent Valid
Percent Cumulative
Percent Valid Excess 29 1.8 1.8 1.8 Norma
l 1198 72.5 72.7 74.4
Lack 422 25.5 25.6 100.0 Total 1649 99.8 100.0 Missing
System 3 .2
Total 1652 100.0
6.5. Informal workers’ understanding and need of insurance
6.5.1. Awareness and understanding of policy
Most informal workers understood that they had the right to buy social insurance
as well as health insurance. Tables 23a and 23b show that up to 74% thought that they
could take out social insurance and 89% said they could buy health insurance.
Table 23a: Perception of the right to access health insurance
Frequenc
y Percent Valid
Percent Cumulative
Percent Valid Yes 1448 87.7 88.9 88.9 No 181 11.0 11.1 100.0 Total 1629 98.6 100.0 Missing
System 23 1.4
Total 1652 100.0
Table 23a: Perception of the right to access social insurance
Frequenc
y Percent Valid
Percent Cumulative
Percent Valid Yes 1196 72.4 74.2 74.2

58
No 416 25.2 25.8 100.0 Total 1612 97.6 100.0 Missing
System 40 2.4
Total 1652 100.0
6.5.2. Accessing social insurance and health insurance
Although the informal workers knew that they were allowed to access insurance,
their work place did not bring it to them. A small percentage worked in the
establishments with social insurance, and only 24% worked in the establishments with
health insurance.
Reasons for not having these two types of insurance came from both sides (see
Table 24a). The reason why the informal workers did not have social insusrance was that
they did not want to buy it or did not care about it. Only 18.6% did not know about it. A
few said that the application for insurance was too complex (see Table 24b).
Table 24a: Enterprises – factors causing informal employees to be without social
insurance
Frequenc
y Percent Valid
Percent Cumulative
Percent Valid Enterprises do not
pay 350 21.2 23.4 23.4
The employee does not pay 543 32.9 36.4 59.8
other reasons 600 36.3 40.2 100.0 Total 1493 90.4 100.0 Missing
System 159 9.6
Total 1652 100.0
Table 24b: Informal workers – factors causing thems to be without social insurance
Frequenc
y Percent Valid
Percent Cumulative
Percent Valid Don't want 164 9.9 31.1 31.1 Don't know 98 5.9 18.6 49.6 Don't think 254 15.4 48.1 97.7 Difficult to 12 .7 2.3 100.0

59
record Total 528 32.0 100.0 Missing
System 1124 68.0
Total 1652 100.0 The data obtained from the workers surveyed shows that 75.7% of the informal
workers said they could not get assessed to health insurance. When asked why 24.3% said
their company did not buy it for them; 32.3% said they refused to buy it; and 43% said
this was due to other causes. The answer to the question why the informal employees
themselves did not buy health insurance was that they did not want to or they did not
regard it as important. Only 10% said they did not know that they could buy health
insurance (Tables 25a and 25b provide detailed information).
Table 25a: Enterprises – factors causing informal employees to be without health
insurance
Frequenc
y Percent Valid
Percent Cumulative
Percent Valid Enterprises do not
pay 294 17.8 24.3 24.3
The employee does not pay 391 23.7 32.3 56.6
other reasons 525 31.8 43.4 100.0 Total 1210 73.2 100.0 Missing
System 442 26.8
Total 1652 100.0
Table 25b: Informal workers – factors causing thems to be without health insurance
Frequenc
y Percent Valid
Percent Cumulative
Percent Valid Don't want 139 8.4 37.1 37.1 Don't know 39 2.4 10.4 47.5 Don't think 191 11.6 50.9 98.4 Difficult to
record 6 .4 1.6 100.0
Total 375 22.7 100.0 Missing
System 1277 77.3
Total 1652 100.0

60
6.5.3. Voluntary health insurance at work place
45% of the participants said that they already had a voluntary health insurance
card; 36.6% said they had heard about it but had not seen any colleagues buy it; and 10%
said they had neither seen nor heard about it at their workplace.
6.5.4. Providing voluntary medical insurance for community groups
Voluntary medical insurance has been provided for community groups for years.
The participants in the survey were asked how they woud buy voluntary health insurance
if they could. Most of them said that they would do it in groups with the people in their
locality. They said it was because of their habit and they found it safe and convenient
(Table 26).
Table 26: Reasons for informal labour to buy voluntary health insurance through groups
of local residents
Frequenc
y Percent Valid
Percent Cumulative
Percent Valid Trusting
head 77 4.7 5.9 5.9
Well organized 559 33.8 43.0 49.0
Habitual 577 34.9 44.4 93.4 Others 86 5.2 6.6 100.0 Total 1299 78.6 100.0 Missing
System 353 21.4
Total 1652 100.0
6.6. Law and desire to find formal employment
6.6.1. Update of regulations and laws
A low percentage of the respondents said that their work establishment often
informed them of labour regulations and laws (16.2%). A higher proportion (39%) said
that they often self-studied the labour safety regulations and regularly updated themselves
with the labour law (36.6%).

61
6.6.2. Desire
Nearly 45% of the respondents said it was necessary to set up local trade unions to
support fellow informal workers in the locality. Table 26 provides more information in
each area (urban-rural).
Table 26: Need for local trade unions Do you need a careers society to support labourers in your area?
Urban/ Rural
Frequency Percent
Valid Percent
Cumulative Percent
Urban Valid Yes 528 42.4 42.6 42.6 No 711 57.2 57.4 100.0 Total 1239 99.6 100.0 Missin
g System 5 .4
Total 1244 100.0 Rural Valid Yes 200 49.0 49.8 49.8 No 202 49.5 50.2 100.0 Total 402 98.5 100.0 Missin
g System 6 1.5
Total 408 100.0
When asked about their expectation to find an official job, the respondents of
different age groups gave different answers. Table 27a shows that most of the young
labourers (under 30 years old) wanted to find an official job. This rate decreased in the
higher age groups.

62
Table 27a: Percentage of informal workers expecting to become formal (surveyed by age
group)
Similarly, in different regions the answers were different. Table 27b supports this
conclusion.
Table 27b: Percentage of informal workers expecting to become formal by region
Tinh Frequenc
y Percent Valid
Percent Cumulative
Percent bd Valid Yes 135 24.5 24.8 24.8 No 409 74.4 75.2 100.0 Total 544 98.9 100.0 Missin
g System 6 1.1
Total 550 100.0 dt Valid Yes 196 35.6 35.8 35.8 No 351 63.8 64.2 100.0 Total 547 99.5 100.0 Missin
g System 3 .5
Total 550 100.0 th Valid Yes 335 60.7 60.8 60.8 No 216 39.1 39.2 100.0 Total 551 99.8 100.0 Missin
g System 1 .2
Total 552 100.0
Age group N % 15-19 42 70.0 20-24 138 74.6 25-29 124 59.6 30-34 97 44.5 35-39 78 37.9
40-44 83 35.9 45-49 48 22.2 50-54 40 22.5 55-59 10 11.2
63
6.7. Information from group discussion and local governments
6.7.1. Information from group discussions
Twelve group discussions (10 people each) were conducted in the surveyed areas
of 12 communes/wards. These discussions focused on capturing the informal employees’
needs for protection and support in order to reduce their immediate and long-term
difficulties in life. The discussions were also designed to check their understanding of
labour rights and obligations. Here is a summary of the main results obtained from these
these 12 discussions.
- The informal employees only had a rough understanding of what insurance
policies were, how to access them, and whether they were allowed to get them or
not.
- Many could not tell the difference between social insurance and health insurance
when they themselves bought or were offered the insurance by their employer.
- Many thought that the application for social insurance was too complex and no
one guided them on how to apply for it.
- As small establishments, the employers did not take out insurance policies and
the informal workers themselves did not care - thinking that their jobs were just
simple and temporary.
- Most of the informal labourers worked under no contract; so the employers did
not buy social insurance for them and the workers themselves did not think they
were entitled to it.
Regarding voluntary medical insurance, the discussions also agreed on two issues:
- First, the application for health insurance was too complex for the informal
workers and they feared that with health insurance they would be treated as
second class patients at medical centres.

64
- Second, some admitted that they could not afford health insurance so they did not
care about this policy.
Aspirations:
- Although most of the informal workers found jobs within their province, they did
not know how to register for temporary residence when moving and therefore,
they did not benefit from labour policies. They expected to get specific
instructions from local authorities.
- Although there were different opinions, the informal employees all wanted to
have local trade unions to protect them and help them avoid unnecessary conflicts
among themselves as well as with the employers.
- Most of the young workers (under 40 years old) expected to have an official job in
an enterprise where they were protected and allowed to benefit from the state’s
policies and the community welfare.
6.7.2. Information from discussions with local authorities
The governments at various levels and the specialized agencies all showed great
interest in this survey by sending their representatives to all of the discussions. When the
issues related to informal labour were mentioned, the local authorities all came to an
agreement as follows:
- Informal labour has been in existence for a long time and they have
undertaken all of the work that the local governments were not able to plan for
in advance. This informal workforce contributes to local development by
serving as seasonal labourers and generating additional income for themselves
and for the local budget.
- The amount and types of employment were stormily increasing in many
localities, especially in the outskirt areas, where the freelance workers live a
hard life, are not very well-informed, and are difficult to manage.
- The dark side of informal labour was that it affects social order, security,
environmental management and occupational safety. Local governemnts had

65
taken many measures to get these issues under control. The most common
method was management. Nevertheless, the support measures were not many
and the effectiveness was low due to the nonuniformity in the way each locality
carried out measures.
- The local authorities said that there should be a policy of setting up local trade
unions to attract the informal workforce, especially young workers, to the trade
unions. This would help reduce the informal workforce and provide better
support for them. The general support policies were hard for informal labour to
access.
PART III POLICY RECOMMENDATIONS
7. INITIAL CONCLUSIONS AND RECOMMENDATIONS
With information from the surveys in the two major cities of Hanoi and Ho Chi
Minh, data analysed in LFS2007 & LFS2009, and further understanding gained through
in-depth interviews with informal labourers and local authorities in three provinces under
survey, some initial conclusions and recommendations can be made. These can be used as
a reference basis to issue some support policies on informal labour and to resolve and
prevent the problems that informal labour has generated in the past and may create in the
future.
7.1. Trend of official employment diversification
It is obvious that informal employment is almost everywhere, in almost all aspects
of socio-economic life, and in almost every economic sector. Statistics from LFS2007 &
LFS2009, survey data and information from the discussions all clearly reflect this issue.
Although the informal employment under survey was classified into 24 different types,
evidence shows that it is even more diverse.
The trend of informal work diversification is generated not only from people’s
spontaneous job seeking or self-employment, but also from the domestic work
establishments, administrative agencies, and foreign invested enterprises as well.
Economic agents are subject to the strictest regulations of labour law and business
law. That informal employment is generated by socio-economic development cannot be

66
denied. Although it has been referred to in several studies, informal employent still needs
to be examined again in the Vietnamese labour market.
There are certain differences in the distributions of informal labour such as age,
gender, and the types of work of informal workers do in different localities and regions.
Also, there are differences in the acceptance of informal employment as informal work by
the informal labourers.
7.2. Ability and status of informal workers
Based on various studies, it can be reaffirmed that informal labour has a
weakening effect on the labour market. Informal labourers are weak in many respects
such as technical education, a poor understanding of the law, ignorance about policies,
and their tendency to work without contracts and for unstable pay.
7.3. Policy system is less accessible to informal labour
With their low position at work, informal workers found it difficult to access
support policies eventhough the state and community always tried their best to bring
those policies to labour in general and informal labour in particular. Apart from the
reasons mentioned above (and in many other studies), the legal system and the
approaches by which the legal provisions of the state were communicated to the informal
workers were still not as effective as expected.
Many of the legal documents and instructions lacked relevant provisions and
guidance to help people with a low education understand and implement the law.
Although the localities all had an advisory agency on law, labour and employment, no
official advice on insurance or other types of support policies for informal labour was
offered. This may be due to the fact that informal labour and employment remains a new
concept to the community and to the advisory bodies as well.
The informal labourers themselves are another important factor in policy
ineffectiveness. When they work as informal workers their primary focus is maximizing
their income to ensure their livelihood. This leads to a lack of interest and poor
understanding of the policies in the community. In addition, informal workers are not
represented, even temporarily, by anyone.
7.4. Some provisions of labour law, social insurance and health insurance laws remain impractical due to lack of implementation mechanisms
Facts show that for many years now employers in Vietnam have found ways to
reduce the amounts payable to the state - including social insurance and health insurance
67
premiums. Although decreasing, the insurance debt in the large enterprises and socio-
economic institutions has not come to an end. The consequences of employers who avoid
to compliance with labour law can badly affect informal labourers even in the official
economic sectors.
In recent years, the social insurance law has cohered and has helped many enjoy
better living and working conditions. However, there has been no mechanism for the
authorities to help informal workers apply for social insurance. In terms of income, the
informal workers surveyed said that over 70% of them could afford social insurance, but
wondered who would certify them if they did not work at the enterprises that obeyed the
accounting regulations.
7.5. Inadequacy in awareness of labour rights
Employees in general and the informal labour in particular were not aware of their
rights and obligations when practicing the provisions under labour law. They did not
realize that ignoring their rights and obligations made the system of social management
less effective in the task of administrating and building policies. Many people claimed
that it was normal to ignore social insurance, health insurance and/or voluntary health
insurance. However, people did not realize that this ignorance prevented new policies
from emerging that could help alleviate poverty, diseases, illiteracy and other social evils.
7.6. Economic sectors/work using informal labour
It is easy to indicate some areas that use informal labour and the prominant
characteristics of the workers in these sectors. There was a big difference between
distribution of informal workers in urban areas and rural areas. This feature suggests
adopting different policies to meet the needs of the workers in both areas.
In rural areas, most of the informal workers worked in food and farm product
processing, handicrafts, repairs and small scale grocery retail. A considerable number
found work in other areas such as food services or sales of building materials and
agricultural supplies. Table 8 provides a list of the main tasks undertaken by informal
labour in rural areas.
In urban areas the informal labour worked mostly in food processing and minor
repairs. A considerable number found work in other areas such as grocery retail, catering
and transportation. Table 7 gives information about the jobs attracting a great number of
informal workers in the urban area.

68
7.7. Some recommendations in favor of informal workers and local governments
As indicated by many studies, the information from discussions with groups of
informal workers and local authorities shows that there really need to be community
organizations to centralize the people working in the same industry and in the same
location. This will make it easy for local governments to support, manage and guide
these workers in exercising their labour rights and obligations. The informal workers
themselves also wanted to work in small communities to avoid unnecessary collisions and
other social evils that might otherwise arise.
Most of the middle-aged and young workers expect to find formal employment.
So, in addition to offering an employment advisory service, it is essential to formalize a
number of pilot work establishments or professional associations to ensure the rights of
workers and downsize the scale of informal labour as planned by the ILO.
We recommend that some measures, forms and policies be adopted to help
informal labour reach their legitimate goals. Our recommendations are as follows:
- strengthen management and supervision of the implementation of legal
provisions to ensure the rights and obligations of employees;
- develop labour organizations in the areas with a high density of informal labour -
offering policy support to both employees and employers;
- strongly promote support programs for professional development associations in
the rural areas and set up work establishments for informal labour in the urban
and suburban areas;
- design and issue policies that help the informal employees to improve their
education and work skills so that they can later have a better chance to find work
in the formal sector;
- state management agencies on insurance need to issue more comprehensive and
detailed instructions on how to apply for insurance to make it easier for informal
workers to access it without help from any official representatives, agency or
enterprise.

69
Professional organizations and support policies should be studied carefully and
piloted on a small scale first. Then there should be reviews and assessment on all aspects
related to informal employees, such as management, policy implementation and impact
on the community, before putting them into practice on a large scale.

70
APPENDICES
APPENDIX 1
CENTER FOR PROCESSING SOCIO-ECONOMIC DATA AND FORECAST
OFFICE OF INTERNATIONAL LABOUR ORGANIZATION
IN VIETNAM (ILO)
SURVEY ON INFORMAL LABOUR
The rate of informal employment and non-formal labour is becoming increasingly
common and diverse. Its existence and size have been taken into account in all studies of
labour market and employment issues.
With the aim of providing policy building advice in Vietnam, we are conducting
this survey in order to clarify the status of jobs, incomes, needs of protection, ability to
find jobs, access to public services and various forms of insurance of the informal labour
group. The survey is also expected to help obtain better findings on informal labourers’
expectations of the support policies from governments, social unions and associations.
The information collected from the survey will serve as a scientific basis for
policy proposal and policy building. The data will assist the Vietnamese government
with measures that give rational and effective support to the industries in which you are
working in order to ensure and improve your quality of life.
Please answer the following questions: Question 1. Name: .................................... Question 2. Age: ............................ Question 3. Gender:
o Male o Female
Question 4. Ethnicity: o Business o Other (Please specify :...................)
o Question 5. Please tell us your permanent work address: Commune / Ward :.............................................. .................................................. ................. County / District :.............................................. .................................................. ............. Question 6. Marital status:
o Single
Survey form No:
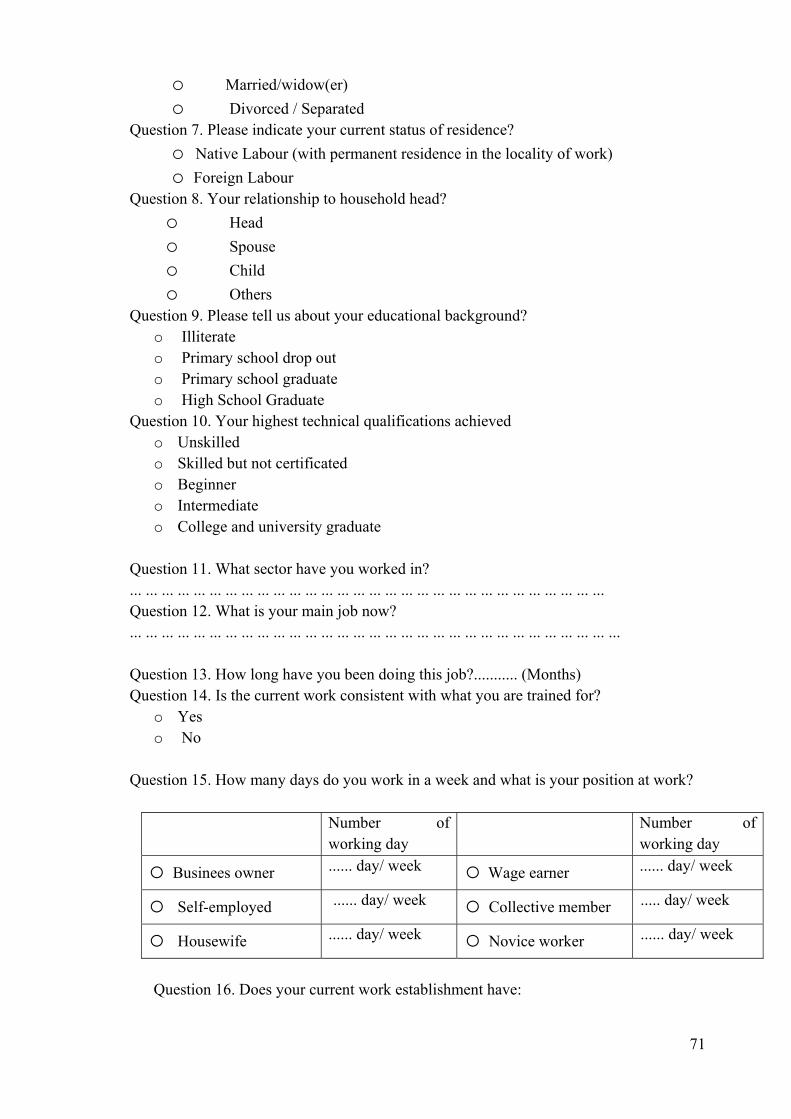
71
o Married/widow(er) o Divorced / Separated
Question 7. Please indicate your current status of residence? o Native Labour (with permanent residence in the locality of work) o Foreign Labour
Question 8. Your relationship to household head? o Head o Spouse o Child o Others
Question 9. Please tell us about your educational background? o Illiterate o Primary school drop out o Primary school graduate o High School Graduate
Question 10. Your highest technical qualifications achieved o Unskilled o Skilled but not certificated o Beginner o Intermediate o College and university graduate
Question 11. What sector have you worked in? ... ... ... ... ... ... ... ... ... ... ... ... ... ... ... ... ... ... ... ... ... ... ... ... ... ... ... ... ... ... Question 12. What is your main job now? ... ... ... ... ... ... ... ... ... ... ... ... ... ... ... ... ... ... ... ... ... ... ... ... ... ... ... ... ... ... ... Question 13. How long have you been doing this job?........... (Months) Question 14. Is the current work consistent with what you are trained for?
o Yes o No
Question 15. How many days do you work in a week and what is your position at work?
Number of working day
Number of working day
o Businees owner ...... day/ week o Wage earner ...... day/ week
o Self-employed ...... day/ week o Collective member ..... day/ week
o Housewife ...... day/ week o Novice worker ...... day/ week
Question 16. Does your current work establishment have:

72
Yes No Business permit ? o o
Tax code ? o o
Social insurance ? o o
Bookkeeping system ? o o
Question 17. Your work location is:
o Fixed office o Your home/Client’s home
Question 18. Your current work establishment is: o Household / Personal o Individual business household o Collective o State-owned o Foreign invested
Question 19. What are the main activities of the establishment where you work? .................................................. .................................................. Questions 20. How many permanent employees are there at your current work establishment?
o 1-20 o 21 - under 300 o Over 300
Question 21. What is your form of labour contract?
o permanent o 1 - 3 years o under 1-year o oral o no contract Question 22. Do you:
Yes No Sign the payroll ? o o
Get paid on vacations and holidays ? o o
Question 23. What is your monthly income? ............................ (Thousand VND) Question 24. How are you paid? □ Fixed Salary □ Commissions
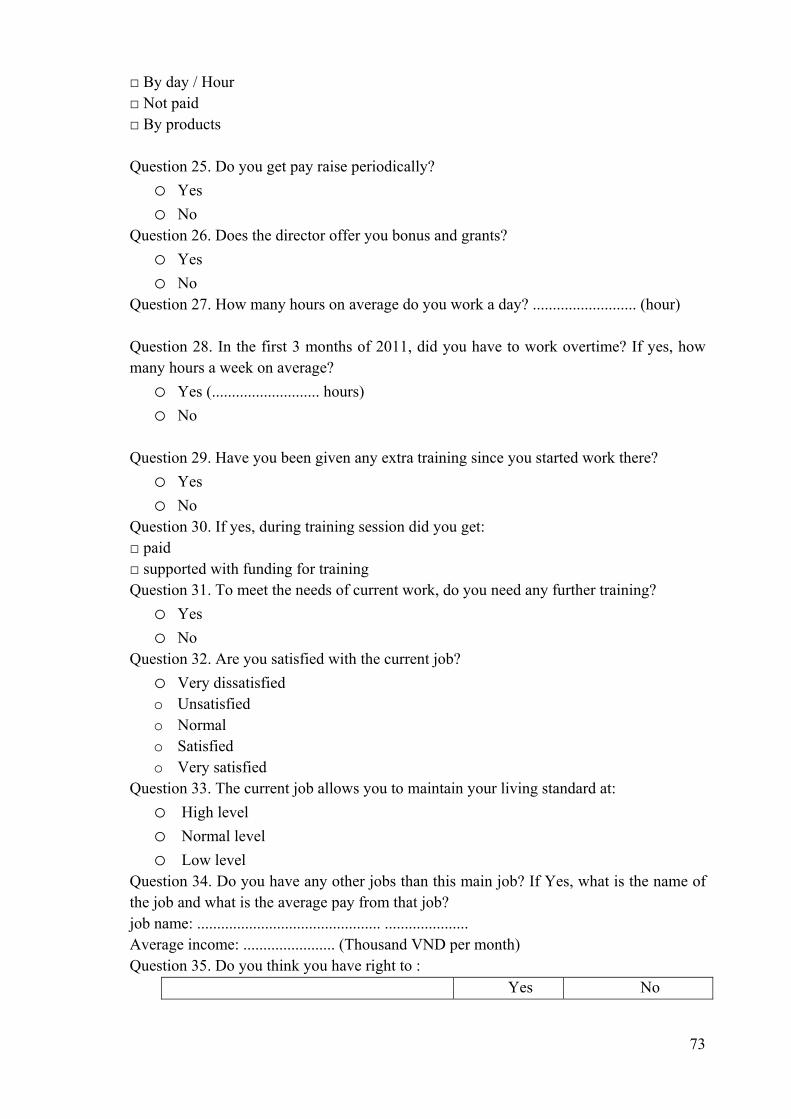
73
□ By day / Hour □ Not paid □ By products Question 25. Do you get pay raise periodically?
o Yes o No
Question 26. Does the director offer you bonus and grants? o Yes o No
Question 27. How many hours on average do you work a day? .......................... (hour) Question 28. In the first 3 months of 2011, did you have to work overtime? If yes, how many hours a week on average?
o Yes (........................... hours) o No
Question 29. Have you been given any extra training since you started work there?
o Yes o No
Question 30. If yes, during training session did you get: □ paid □ supported with funding for training Question 31. To meet the needs of current work, do you need any further training?
o Yes o No
Question 32. Are you satisfied with the current job? o Very dissatisfied o Unsatisfied o Normal o Satisfied o Very satisfied
Question 33. The current job allows you to maintain your living standard at: o High level o Normal level o Low level
Question 34. Do you have any other jobs than this main job? If Yes, what is the name of the job and what is the average pay from that job? job name: .............................................. ..................... Average income: ....................... (Thousand VND per month) Question 35. Do you think you have right to :
Yes No

74
Buy medical insurance ? o o
Buy social insurance ? o o
Question 36. Could you please give some information about medical insurance and social insurance :
a. Can you buy medical insurance and social insurance at your work place ?
b. If yes, how many years have you had them ?
c. If no, what is the main reason ?
d. If it is because the labourer do not buy, what is the reason ?
SOCIAL
INSURANCE
o YES
o NO
...............(year)
o The company does not buy
o The labourer does not buy
o Other reasons
o Do not want it
o Do not know about it
o Do not think of it
o Difficult to apply
MEDICAL
INSURANCE
o YES
o NO
...............(year)
o The company does not buy
o The labourer does not buy
o Other reasons
o Do not want it
o Do not know about it
o Do not think of it
o Difficult to apply
Question 37. What is the current situation of buying voluntary medical insurance in your work place ?
□ Some already have □ Do not know about it
□ Hear about it but not yet buy □ Some used to buy
Question 38. If the State sold voluntary medical insurance to groups or community, through which of the following groups could you buy the insurance ?

75
Main reason
Community groups Trust the
head
Good organization Habit others
□ Village, resident group o o o o
□ Youth union o o o o
□ Women’s union o o o o
□ Farmers’ association o o o o
□ Veteran’s society o o o o
□ Old-aged people’s union o o o o
□ Family line o o o o
Others (Please specify) ………………………………………)
o o o o
Question 39a. Does your work place have a trade union?
o Yes o No
Question 39B. If yes, are you a member?
o Yes o No
Question 39C. If you are not a member, please indicate why? No need to participate Question 40a. Does the management board often popularize labour regulations to you?
o Yes o No
Question 40b. If Yes, in which form are the regulations popularized to you? □ at meeting □ brochure □ notice □ Other (Please specify ............................................................................ ........................) Question 41A. Do you find out about labour safety?
o Yes

76
o No Question 41B. Does the work place equip you with any forms of labour protection?
o Yes o No
Question 42a. Do you regularly update yourself with new provisions of the labour law?
o Yes o No
Question 42.b. If yes, how do you do that? □ through local labour Administration agency □ through the Internet □ through the mass media □ through law consultancy firm □ Other (Please specify ........................) Question 43. Do you need a trade union to support those working in the area?
o Yes o No
Question 44. Do you want to become a formal labourer? o Yes o No
Question 45. If yes, how will you find the job? □ send an application form directly to the company □ through employment services □ set up own business □ through friends / relatives □ place job ads □ Other (Please specify ..................................... .................) Question 46. Do you have any suggestions or expectations on policies, unions, income, benefits, ... for the informal labour? ... ... ... ... ... ... ... ... ... ... ... ... ... ... ... ... ... ... ... ... ... ... ... ... ... ... ... ... ... ... ... ... ... ... ... ... ... ... ... ... ... ... ... ... ... ... ... ... ... ... ... ... ... ... ... ... ... ... ... ... ... ... ... ... ... ... ... ... ... ... ... ... ... ... ... ... ... ... ... ... ... ... ... ... ... ... ... ... ... ... ... ... ... ... ... ... ... ... ... ... ... ... ... ... ... ... ... ... ... ... ... ... ... ... ... ... ... ... ... ... ... ... ... ... ... ... ... ... ... ... ... ... ... ... ... ... ... ... ... ... ... ... ... ... ... ... ... ... ... ... ... ... ... Question 47. If something is not clear, are you able to provide more information when need arises?

77
o Yes o No
Sincerely appreciate your cooperation
Questionnaires checked and taken over by
Name and signature of enumerator

78
APPENDIX 2
List of field survey teams Thanh hoa No Full name Work place Duty 1 Phạm Thị Hồng Thắm ĐHKTQD leader 2 Hoàng Đức Mạnh ĐHKTQD member 3 Định Hồng Thêu ĐHKTQD member 4 Lê Đức Hoàng ĐHKTQD supervisor
Binh Đinh No Full name Work place Duty 1 Trần Chung Thuỷ ĐHKTQD leader 2 Bùi Dương Hải ĐHKTQD member 3 Nguyễn Thu Trang ĐHKTQD member 4 Ngô Văn Thứ ĐHKTQD supervisor
Đong Thap No Full name Work place Duty 1 Phạm Thị Nga ĐHKTQD leader 2 Lê Thái Sơn ĐHKTQD member 3 Phạm Thị Loan ĐHKTQD member 4 Trần Trọng Nguyên ĐHKTQD supervisor

79
APPENDIX 3
GUIDELINES FOR SURVEY STAFF
1 Duties
- Survey staff are responsible for conducting in-depth interviews
using the questions listed on the questionnaires.
- Survey staff must bring a letter of recommendation issued by a
local authority or a consultancy office.
- Survey staff must explain purpose of survey clearly and respect rights of
respondents.
- Survey staff must not suggest any answers, just clarify the content of
questions and record answers from respondents precisely.
2 People selected for survey
Respondents are informal labourers defined in the cells from 1 to 9 in the
conceptual framework.
3 How to fill in the questionnaires
- Answers must be written / marked in ink (black, purple, blue).
Any changes must be written / marked in red ink.
- Answers in numbers must use "." for decimal; currency unit
must be in thousand VND.
- Multiple choice questions marked "○" allow just one answer;
questions marked “”" allow multiple answers.
- Question with (If yes, please specify...) require extra briefly-
given information.

80
4 - Specific guidance on a number of questions
Question 5: Survey staff should record the current work place of the respondents only,
not their permanent address. If their current work place is a commune (rural area), then
cross out "ward" before putting down name of commune, and vice versa.
Question 8: This relationship represents the workers’ position in their family. If the
workers live alone (with no siblings, spouses, children, or parents) they should be
regared as head of household.
Question 11: Record occupations and sectors of workers, say, driver, service provider,
seller.
Question 12: Record jobs only.
Question 16: If the employees cannot give the information needed, leave both columns
blank.
Question 35: If the employees cannot give the information needed, leave both columns
blank.
Question 39a: If the employees cannot give the information needed, leave both columns
blank
Question 44: Survey staff must help respondents know that formal labourers are workers
in formal economic sectors in which the employers are responsible for paying part of the
employees’ social insurance fees and paying all medical insurance premiums for the
employees.
Question 46: Write, in brief, contents of items specified in questions. In case too many
ideas arise, another sheet of paper can be used for recording extra ideas and it should be
pinned at reverse side of the questionnaires.
5 - Monitoring
Each team has one supervisor appointed by the chief consultant. Supervisors shall:

81
- Monitor the survey process.
- Coordinate with chief coordinators in field surveys.
- On behalf of chief consultant, solve problems arising after
consulting with chief consultant .
The survey staff must fullfill all requirements made by supervisors assigned to each
locality. Supervisors, on behalf of the chief consultant, monitor and timely make
correction of defects during interviews conducted by survey staff. Adjustments must be
reported to consulting office within the day.
6 Report to consulting office
Survey staff shall make daily report by telephone or email to consulting office at
0436283007 – regular work hours, or 0903201788 - after regular work hours, or
[email protected], on survey progress and problems that need solving.
In case of emergency, consulting office may change plan of survey. This
information is valid only when verified by Dr Ngo Van Thu (Chief Consultant).
Otherwise, no sources of information are of validity.