RESEARCH MEMORANDUM - NASA · RESEARCH MEMORANDUM PRELIMINARY INVESTIGATION OF ... RESEARCH...
13
RIVI L55E11b = RESEARCH MEMORANDUM PRELIMINARY INVESTIGATION OF THE COMPRESSIVE STRENGTH AND CREEP LIFETIME OF 2024-T3 (FORMERLY 24S-T3) ALUMINUM-ALLOY PLATES AT ELEVATED TEMPERATURES By Eldon E. Mathauser and William D. Deveikis Langley Aeronautical Laboratory Langley Field, Va. TEHN!CAL I IBRARY AIRE"EARCH MA : IUFACTJRING CO. 9851951 SE UtVEDA BLVD. LOS ANGELES 45, CALIF. CALIFORNIA NATIONAL ADVISORY COMMITTEE FOR AERONAUTICS I, WASHINGTON June 14, 1955 https://ntrs.nasa.gov/search.jsp?R=19930093819 2018-06-16T19:15:53+00:00Z
Transcript of RESEARCH MEMORANDUM - NASA · RESEARCH MEMORANDUM PRELIMINARY INVESTIGATION OF ... RESEARCH...

RIVI L55E11b
=
RESEARCH MEMORANDUM
PRELIMINARY INVESTIGATION OF THE COMPRESSIVE
STRENGTH AND CREEP LIFETIME OF 2024-T3 (FORMERLY 24S-T3)
ALUMINUM-ALLOY PLATES AT ELEVATED TEMPERATURES
By Eldon E. Mathauser and William D. Deveikis
Langley Aeronautical Laboratory Langley Field, Va.
TEHN!CAL I IBRARY
AIRE"EARCH MA : IUFACTJRING CO.
9851951 SE UtVEDA BLVD. LOS ANGELES 45, CALIF.
CALIFORNIA
NATIONAL ADVISORY COMMITTEE FOR AERONAUTICS
I,
WASHINGTON June 14, 1955
https://ntrs.nasa.gov/search.jsp?R=19930093819 2018-06-16T19:15:53+00:00Z

NACA EM L75E11b
NATIONAL ADVISORY COMMITTEE FOR AERONAUTICS
RESEARCH MEMORANDUM
PRELIMINARY INVESTIGATION OF THE COMPRESSIVE
STRENGTH AND CREEP LIFETIME OF 2024-T3 (FORMERLY 24S-T3)
ALUYIINUvI_ALLOY PLATES AT ELEVATED TEMPERATURES
By Eldon E. Mathauser and William D. Deveikis
SINNARY
The results of elevated-temperature compressive strength and creep tests of 2024-T13 (formerly 24S-T3) aluminum-alloy plates supported in V-grooves are presented. For determining elevated-temperature strength, where creep effects are negligible, a relation previously developed for predicting plate compressive strength at room temperature was satisfac-tory. Creep-lifetime results are presented for the plates in the form of master creep-lifetime curves by using a time-temperature parameter that is convenient for summarizing tensile creep-rupture data. A com-parison is made between tensile and compressive creep lifetime for the plates, and the magnitude by which the design stress is decreased because of material creep and loss of strength due to exposure at elevated tem-peratures is indicated.
INTRODUCTION
Since plates are one of the most important load-carrying components in the structure of an aircraft, knowledge of the èlevated-temperatüre strength and creep behavior is becoming increasingly important. At the present time very little published information is available on the experi-mental maximum strength of plates at elevated temperatures (ref. 1), and no data have been found on experimental creep behavior of such members. In order to obtain such information, the National Advisory Committee for Aeronautics has recently made an experimental study of both compressive strength and creep lifetime of 2024-T aluminum-alloy plates at elevated temperatures.
In this •investigation, the unloaded edges of the plates were'er sup-ported in V-grooves. This type of support was used because room-temperature strength tests of plates supported in V-grooves showed good correlation with experimental plate strengths obtained from stiffened panel and box-beam tests. Width-thickness ratios ranging from 20 to 60 were investigated. A hydraulic testing machine was used to apply load in the compressive-strength tests and in the creep tests a constant dead load was applied.

2
NACA RM L55E11b
SYMBOLS
b width, in.
C constant
ESEC secant modulus, ksi
t thickness, in.
ter failure time, hr
TR temperature, OR
acy 0.2-percent-offset compressive yield stress, ksi
af average stress at maximum load, ksi
1.1 Poisson's ratio
RESULTS AND DISCUSSION
Compressive-Strength Tests
Test results.- An example of the results that were obtained which illustrates the behavior of the plates and the material when subjected to compressive loading is shown in figure 1. Average stress is plotted against unit shortening of the plates. Results are shown for plates tested at 4000 F for width-thickness ratios of 20, 30, 245, and 60. The material compressive stress-strain curve is indicated by the dashed line.
For the plate of width-thickness ratio of 20, the maximum stress exceeded the 0.2-percent-offset compressive yield stress indicated by the tick mark before collapse occurred at about 0.8-percent shortening. Buckling and collapse of this plate as well as the plate of b/t = 30 occurred almost simultaneously. The plates of b/t = 47 and 60 buckled elastically, and considerable shortening occurred after buckling before maximum load was obtained. Maximum loads for plates of b/t = 30, 45, and 60 were reached at approximately the same value of unit shortening, in this case about 04 percent.
The maximum stresses obtained in these tests at 400 0 F and in simi-lar tests at other temperatures are shown in figure 2. Average stress at
NACA RA L55E11b 3
maximum load is plotted against temperature in °F. The curves represent the predicted maximum strength of the plates. Test results are indicated by the symbols. The method used for determining plate strength will be discussed later. Results are given for width-thickness ratios of 20, 30, 14.5, and 60 for temperatures ranging from room temperature to 6000 F.
All plates were exposed to the test temperature for 1/2 hour before application of load. Several plates of each proportion were tested at room temperature and 400 0 F. The results at these two temperatures give an indication of the scatter that can be expected in the test data at the other temperatures. The increase in compressive strength produced by artificial aging of the aluminum alloy accounts for the increased strength of the plates in the vicinity of 4000 F.
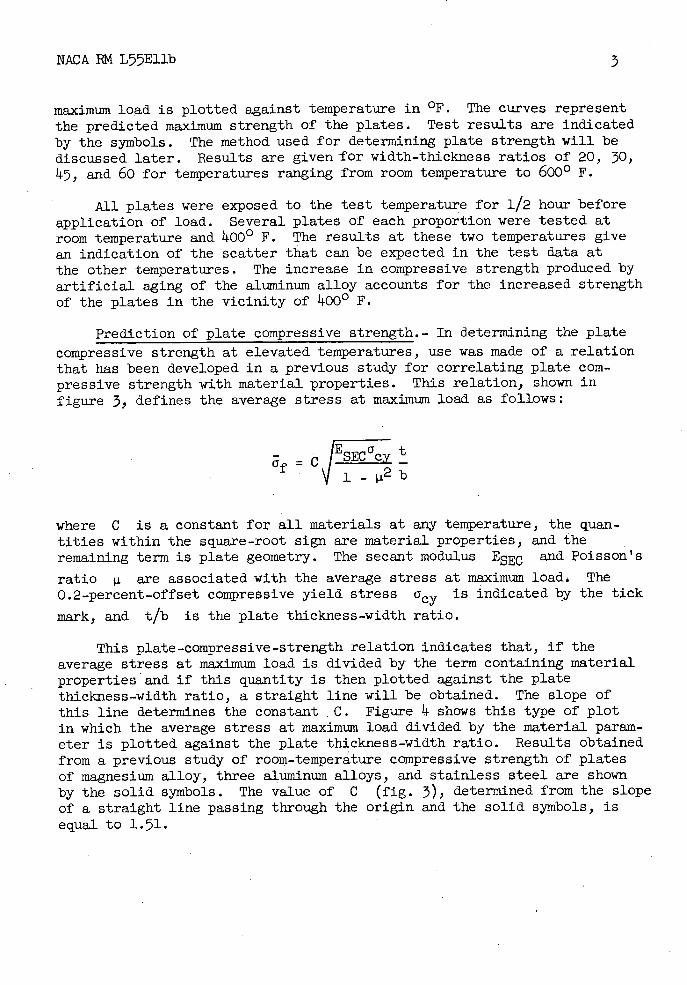
Prediction of plate compressive strength.- In determining the plate compressive strength at elevated temperatures, use was made of a relation that has been developed in a previous study for correlating plate com-pressive strength with material properties. This relation, shown in figure 3, defines the average stress at maximum load as follows:
if
where C is a constant for all materials at any temperature, the quan-tities within the square-root sign are material properties, and the remaining term is plate geometry. The secant modulus ESEC and Poisson's
ratio .i are associated with the average stress at maximum load. The 0.2-percent-offset compressive yield stress acy is indicated by the tick
mark, and t/b is the plate thickness-width ratio.
This plate-compressive-strength relation indicates that, if the average stress at maximum load is divided by the term containing material properties and if this quantity is then plotted against the plate thickness-width ratio, a straight line will be obtained. The slope of this line determines the constant C. Figure 4 shows this type of plot in which the average stress at maximum load divided by the material param-eter is plotted against the plate thickness-width ratio. Results obtained from a previous study of room-temperature compressive strength of plates of magnesium alloy, three aluminum alloys, and stainless steel are shown by the solid symbols. The value of C (fig. 3), determined from the slope of a straight line passing through the origin and the solid symbols, is equal to 1.71.

ii. NACA BM L55E11b
Since the elevated-temperature plate compressive strengths obtained in the present study and shown by the open symbols in figure Ii also lie essentially along the same line, the same value of C applies to these results. It thus appears that plate compressive strengths can be esti-mated satisfactorily from the previous strength relation for all materials at either room or elevated temperatures. Only the material compressive stress-strain curve at the corresponding temperature and exposure time is required in predicting the plate strength.
Creep Tests
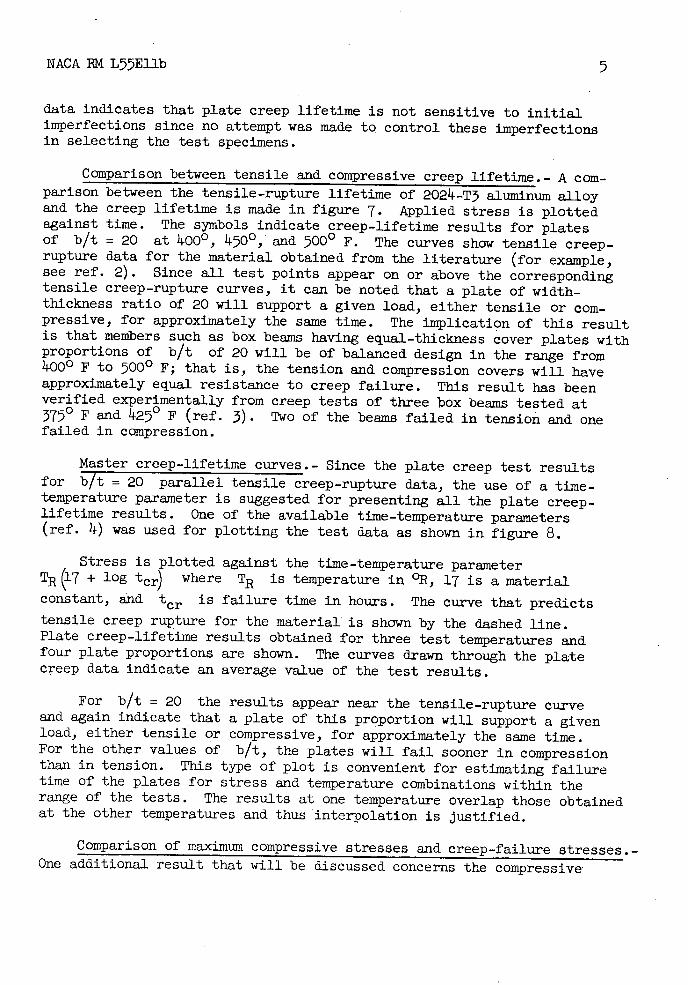
Test results.- Creep test results were obtained for temperatures of 14000 , 14500 , and 5000 F. The applied load in most cases produced creep failure of the plates within 6 hours after loading. Some typical plate creep curves are shown in figure 5 in which unit shortening is plotted against time in hours. These results were obtained for plates of width-thickness ratio of 20 exposed to test temperature for 1/2 hour before loading. The applied stress is shown for each plate, as well as the ratio of the applied stress to the stress that would produce immediate failure upon loading.
The applied stress for the plates that failed within 5 hours was a substantial percentage of stress that would produce immediate failure at 14000 F. The plate with applied stress of 31.5 ksi failed in 33.8 hours. For the plates that failed within 5 hours, constant or secondary creep rate existed for only a small portion of the plate lifetime, whereas the plate with applied stress of 31.5 ksi exhibited constant creep rate for approximately 15 percent of the total lifetime.
These creep test results for b/t = 20 resemble the results obtained for other values of b/t at 400 0 F and for other test temperatures. Fail-ure of the plates occurred in most cases at a value of shortening somewhat greater than the shortening obtained at maximum load in the compressive-strength tests. For example, for the results shown in figure 5, failure occurred soon after the shortening reached 0.8 percent, which corresponds to the shortening obtained at maximum load in the compressive-strength test for b/t = 20 given in figure 1.
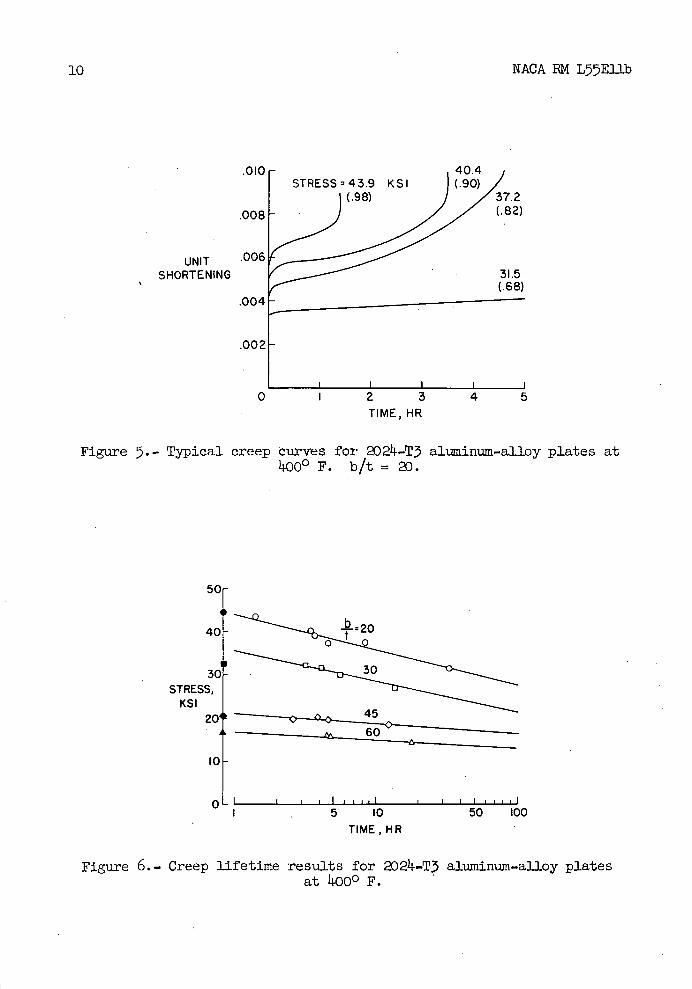
The most significant information obtained from the creep tests is the lifetime. Lifetimes obtained from these tests and from similar tests at 000 F for other values of b/t are plotted in figure 6. In this figure, applied stress is plotted as open symbols for each value of b/t. The maximum strength of the plates determined from the compressive-strength tests is shown by the solid symbols on the vertical axis. Lines repre-senting an average of the test results have been drawn through the data for each value of b/t. The relatively small amount of scatter in these
NACA RN L55E11b 5
data indicates that plate creep lifetime is not sensitive to initial imperfections since no attempt was made to control these imperfections in selecting the test specimens.
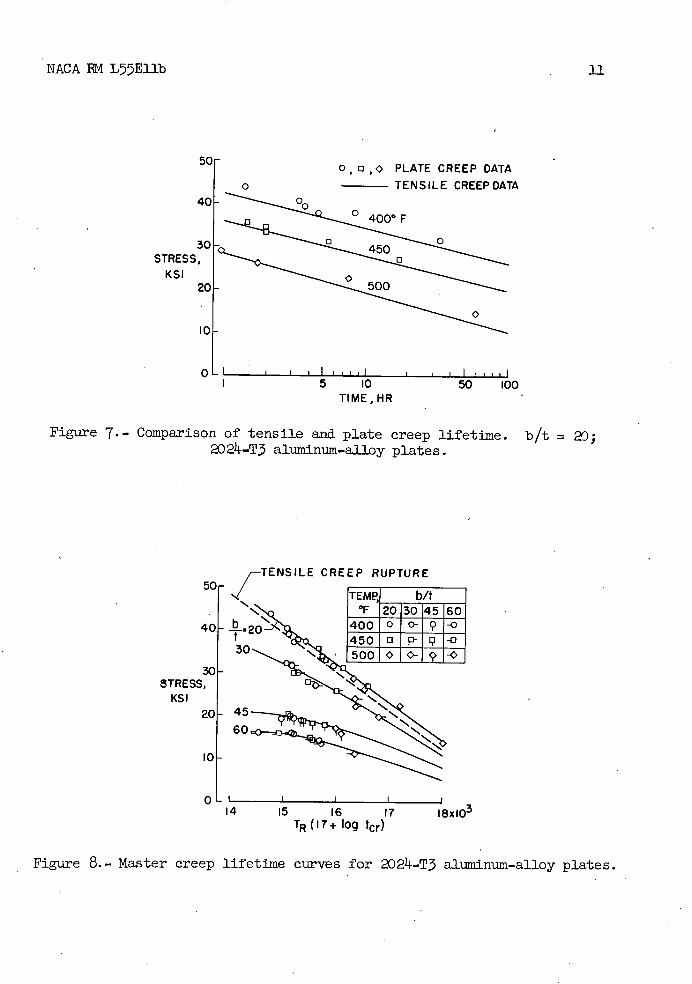
Comparison between tensile and compressive creep lifetime. - A com- parison between the tensile-rupture lifetime of 2024-T3 aluminum alloy and the creep lifetime is made in figure 7. Applied stress is plotted against time. The symbols indicate creep-lifetime results for plates of b/t = 20 at 4000 , 4500 , and 5000 F. The curves show tensile creep-rupture data for the material obtained from the literature (for example, see ref. 2). Since all test points appear on or above the corresponding tensile creep-rupture curves, it can be noted that a plate of width-thickness ratio of 20 will support a given load, either tensile or com-pressive, for approximately the same time. The implication of this result is that members such as box beams having equal-thickness cover plates with proportions of b/t of 20 will be of balanced design in the range from )..QQ0 F to 5000 F; that is, the tension and compression covers will have approximately equal resistance to creep failure. This result has been verified experimentally from creep tests of three box beams tested at 375° F and 425° F (ref. 3) . Two of the beams failed in tension and one failed in compression.
Master creep-lifetime curves.- Since the plate creep test results for b/t _= 20 parallel tensile creep-rupture data, the use of a time-temperature parameter is suggested for presenting all the plate creep-lifetime results. One of the available time-temperature parameters (ref. 1) was used for plotting the test data as shown in figure 8.
Stress is plotted against the time-temperature parameter TR (17 + log ter) where TR is temperature in °R, 17 is a material
constant, and ter is failure time in hours. The curve that predicts
tensile creep rupture for the material is shown by the dashed line. Plate creep-lifetime results obtained for three test temperatures and four plate proportions are shown. The curves drawn through the plate creep data indicate an average value of the test results.
For b/t = 20 the results appear near the tensile-rupture curve and again indicate that a plate of this proportion will support a given load, either tensile or compressive, for approximately the same time. For the other values of b/t, the plates will fail sooner in compression than in tension. This type of plot is convenient for estimating failure time of the plates for stress and temperature combinations within the range of the tests. The results at one temperature overlap those obtained at the other temperatures and thus interpolation is justified.
Comparison of maximum compressive stresses and creep-failure stresses.-One additional result that will be discussed concerns the compressive

6 NACA EM L55E11b
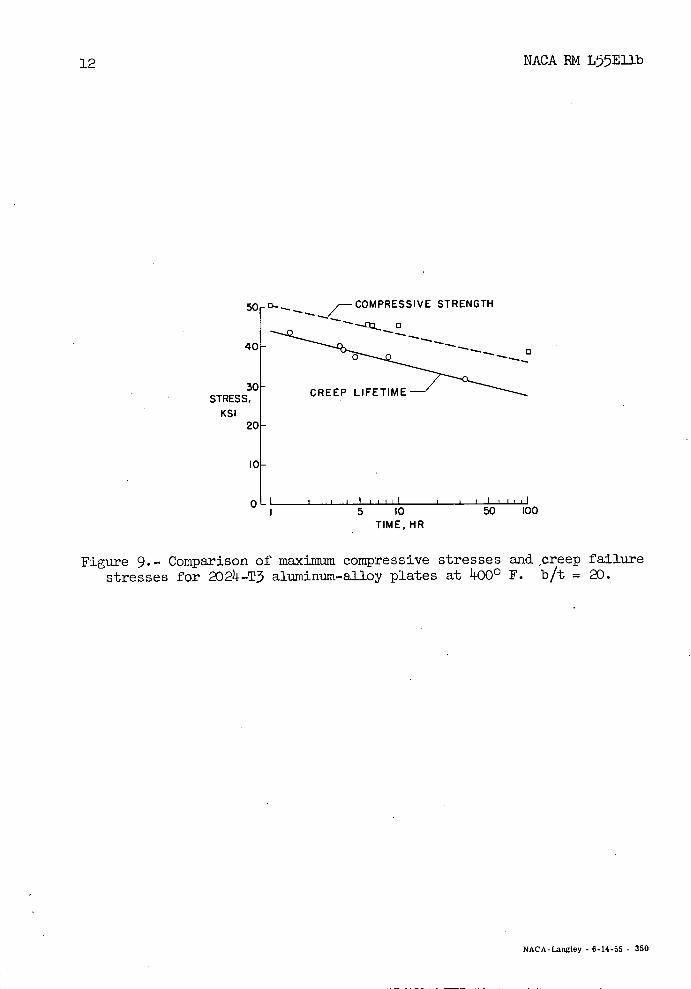
strength of the plates after a given exposure time and the stresses that will produce creep failure of the plates in a corresponding time. Such a comparison is made in figure 9 in which stress is plotted against time in hours. The square symbols indicate the experimental compressive strength of the plates obtained by first exposing the specimens to the test temperature for the times shown in the abscissa and then loading to maximum strength. The predicted compressive strength for a similar range of exposure times is indicated by the dashed line. The solid line drawn through the circles indicates an average of the plate creep-lifetime results shown previously in figure 6. For this case, load was applied and maintained on the specimens until creep failure occurred.
This comparison of maximum compressive stresses and Creep-failure stresses indicates the magnitude by which the design stress is reduced below the maximum strength because of material creep for times ranging up to 100 hours. Comparable results were obtained for other values of b/t and other test temperatures. Many materials do not exhibit marked changes in compressive strength with exposure time; consequently, results such as these may be obtained only with aluminum alloys for the tempera-ture range investigated.
CONCLUDING REMARKS
In summary, experimental results from elevated-temperature strength and creep tests of aluminum-alloy plates supported in V-grooves have been presented. A relation previously developed for predicting plate compres-sive strength at room temperature was satisfactory for determining elevated-temperature strength. The creep test results indicate that plates of width-thickness ratio of 20 will support a tensile or compres-sive load for approximately the same time and that the plate creep-lifetime results for the temperature range investigated can be presented by using time-temperature parameters that are convenient for summarizing tensile creep-rupture data. In addition, a comparison was made to indi-cate the magnitude by which the design stress is decreased in plates because of material creep and loss of strength due to exposure at elevated temperature.
Langley Aeronautical Laboratory, National Advisory Committee for Aeronautics,
Langley Field, Va., April 25, 1955.

NACA RM L55E11b
7
REFERENCES
1. Heimerl, George J., and Roberts, William M.: Determination of Plate Compressive Strengths at Eleva€ed Temperatures. NACA Rep. 960, 1950. (Supersedes NACA TN 1806.)
2. Dorn, J. E., and Tietz, T. E.: Creep and Stress-Rupture Investigation on Some Aluminum Ahoy Sheet Metals. Preprint 26, A.S.T.M., 1949, pp. 1-17.
3. Mathauser, Eldon E.: Investigation of Static Strength and Creep Behavior of an Aluminum-Alloy Multiweb Box Beam at Elevated Tempera-tures. NACA TN 3310, 1954.
k. Larson, F. R., and Miller, James: A Time-Temperature Relationship for Rupture and Creep Stresses. Trans. A.S.M.E., vol. 711, no. 5, July 1952, pp. 765-771.

-MATERIAL RESS- STRAIN
CURVE
STRESS KS I
NACA BM L55E11b
0 .002 .004 .006 .008 .010 UNIT SHORTENING AND STRAIN
Figure 1.- Compressive strength test results for 24-T aluminum-alloy plates at 4000 F.
PREDICTED o,c,O,A EXPERIMENTAL
0 j-.__D U -
STRESS, I 45 KSI I
20!-
10L
0 200 400 600 TEMPERATURE ,°F
2O
30
Figure 2.- Comparison of experimental and predicted compressive strengths of 2024-T3 aluminum-alloy plates. Room temperature to 6000 F.

rERIAL ESS- STRAIN
WE STRESS
2024-T3 800 Fo 80°F •FS-Ih o 300 U 2024-T3
350 •2014-T6 400 A 7075-T6
> 450 4 STAINLESS W v 500 4 600
.10
.08
.06
/ °cy -v _2 .04
.1 A,-' •
4
.021-I - I -
I - 6 0 45 -I
I I
I Ii
0 .01 .02 .0 f
30 20 I I I
.04 .05
NACA RM L55E1Ib
1
STRAIN
Figure 3 . - Relation for predicting plate compressive strength.
Figure Ii. . - Correlation of room and elevated temperature plate strengths with material properties.
40%2)
4 (.90)2
MRSTRESS43.9 KSI
(.98)
008
10
NACA BM L55Ellb
UNIT .006
SHORTENING
31.5 (.68)
.004
.002
I 2 3 4 5 TIME, HR
Figure 5.- Typical creep curves for 2024_T3 aluminum-ahoy plates at ).g)o° F. b/t = a).
4 1 - 20
30 STRESS, r
KSI I
2045
I,]
0 L...I I ii 5 10 50 100
TIME, HR
Figure 6.- Creep lifetime results for 2D24-T aluminum-alloy plates at 4000 F.
NACA IM L55E1Ib
11
o,a, 0 PLATE CREEP DATA TENSILE CREEPDATA
40
30 50o STRESS,
KSI0 20 50
IoJ
0 L I I I I I ii I I
I 5 10 50 100 TIME, HR
Figure 7-- Comparison of tensile and plate creep lifetime, b/t = 20; 2024-T aluminum-alloy plates.
/TENSILE CREEP RUPTURE
40J_
I 30..
30 STRESS,
KS I
14 15 16 17 18x103 TR(lT+ log tcr)
ITEMP, L OF
b/f 20304560
400 0 0- 9 1 -o 450 0 0- -D
500 0 o- ç -o
Figure 8. - Master creep lifetime curves for 2)24-T3 aluminum-alloy plates.
12
NACA EM L55E11b
STRENGTH
D
30L CREEP LIFETIME STRESS,
KSI I
0 _I I I I liii I I I 11111 I 5 10 50 100
TIME, HR
Figure 9 . - Comparison of maximum compressive stresses and (creep failure stresses for 2024-T aluminum-alloy plates at II000 F. b/t = 20.
NACA-Langley - 6-14-55 - 350