Research Article Trans Fatty Acids in the Hong Kong Food ...
8
Hindawi Publishing Corporation Journal of Chemistry Volume 2013, Article ID 327582, 7 pages http://dx.doi.org/10.1155/2013/327582 Research Article Trans Fatty Acids in the Hong Kong Food Supply Stephen W. C. Chung, 1 S. K. Tong, 1 Violette F. P. Lin, 2 Melva Y. Y. Chen, 2 Janny K. M. Ma, 2 Y. Xiao, 2 and Y. Y. Ho 3 1 Food Research Laboratory, Food and Environmental Hygiene Department, Centre for Food Safety, 4/F Public Health Laboratory Centre, 382 Nam Cheong Street, Hong Kong 2 Risk Assessment Section, Food and Environmental Hygiene Department, Centre for Food Safety, 43/F, Queensway Government Offices, 66 Queensway, Hong Kong 3 Food and Environmental Hygiene Department, Centre for Food Safety, 45/F, Queensway Government Offices, 66 Queensway, Hong Kong Correspondence should be addressed to Stephen W. C. Chung; [email protected] Received 7 May 2013; Revised 18 July 2013; Accepted 20 July 2013 Academic Editor: Ioannis G. Roussis Copyright © 2013 Stephen W. C. Chung et al. is is an open access article distributed under the Creative Commons Attribution License, which permits unrestricted use, distribution, and reproduction in any medium, provided the original work is properly cited. is study aimed to examine trans fatty acids (TFA) content of 142 individual food items, including bakery, fast food, and other fatty food that may contain high level of TFA. TFA was detected in all samples, except for four samples including one plain bread, one sponge cake, and two batter-made foods (egg roll and eggette) samples. For those found to contain detectable TFA, the content ranged up to 4.7 g/100 g of food or 17.3% of total lipids. On a per 100 grams of food basis, the highest mean TFA content among the 18 food subgroups was the doughnuts/French toast subgroup (0.95 g), followed by the other pastries subgroup (0.49 g) and the bread with filling/topping subgroup (0.44 g). Among the samples, the highest TFA content is from a doughnut (4.7 g/100 g), followed by two cream-filled bread with shredded coconut (1.8 and 1.4 g/100 g) and a sweetheart cake (1.7 g/100 g). Only consuming one whole piece of doughnut would have reached 100% of the maximum daily TFA intake as recommended by WHO based on a 2000kcal diet. About 78% of samples had TFA ≤0.3 g/100 g food. For the majority of the food samples available in Hong Kong, if TFA was present, C18:1 trans would possibly be the predominant one. 1. Introduction e World Health Organization [1] predicted that coronary heart disease (CHD) will remain as the third killer of the world in the coming decades. In Hong Kong, the latest data from the Department of Health shows that CHD has been the 2nd killer since 2001 [2]. As there is a lack of TFA intake data in Hong Kong, the trans fatty acids (TFAs) content of the diet in Hong Kong could only be estimated in the range from less than 1g/person/day in Asian and Pacific countries to 10–20 g/person/day in subpopulations of some Western countries [3]. Intake of excessive TFA would increase the risk of CHD, and its effect is considered to be even greater than saturated fatty acids (SFAs). TFA can increase the risk of CHD by not only raising the level of low density lipoprotein (LDL) cholesterol, but also reducing the high density lipoprotein (HDL) cholesterol [4]. us, the World Health Organization [5] has recommended a daily TFA intake of less than 1% of overall energy intake (i.e., about 2.2 g/day for a 2000 kcal diet) for chronic diseases prevention. Internationally, there have been increasing concerns on TFA content in foods. e intake and potential adverse health effects of TFA in developed and developing countries have received considerable attention [4, 6–9]. Some countries have introduced legislations to regulate TFA level in certain foods or mandated TFA labelling on foods so as to lower TFA consumption in the populations [10–12]. In these countries, the TFA content in foods has been lowered as manufacturers and restaurants took initiatives to reformulate their products [13–15]. A recently published review [16] has reinforced that TFA policies were associated with significant reductions in TFA levels in the food supply. However, both individual- and policy-level initiatives to decrease TFA consumption should continue particularly in subgroups and in developing
Transcript of Research Article Trans Fatty Acids in the Hong Kong Food ...

Hindawi Publishing CorporationJournal of ChemistryVolume 2013, Article ID 327582, 7 pageshttp://dx.doi.org/10.1155/2013/327582
Research ArticleTrans Fatty Acids in the Hong Kong Food Supply
Stephen W. C. Chung,1 S. K. Tong,1 Violette F. P. Lin,2 Melva Y. Y. Chen,2
Janny K. M. Ma,2 Y. Xiao,2 and Y. Y. Ho3
1 Food Research Laboratory, Food and Environmental Hygiene Department, Centre for Food Safety,4/F Public Health Laboratory Centre, 382 Nam Cheong Street, Hong Kong
2 Risk Assessment Section, Food and Environmental Hygiene Department, Centre for Food Safety, 43/F,Queensway Government Offices, 66 Queensway, Hong Kong
3 Food and Environmental Hygiene Department, Centre for Food Safety, 45/F, Queensway Government Offices,66 Queensway, Hong Kong
Correspondence should be addressed to Stephen W. C. Chung; [email protected]
Received 7 May 2013; Revised 18 July 2013; Accepted 20 July 2013
Academic Editor: Ioannis G. Roussis
Copyright © 2013 Stephen W. C. Chung et al. This is an open access article distributed under the Creative Commons AttributionLicense, which permits unrestricted use, distribution, and reproduction in any medium, provided the original work is properlycited.
This study aimed to examine trans fatty acids (TFA) content of 142 individual food items, including bakery, fast food, and otherfatty food that may contain high level of TFA. TFA was detected in all samples, except for four samples including one plain bread,one sponge cake, and two batter-made foods (egg roll and eggette) samples. For those found to contain detectable TFA, the contentranged up to 4.7 g/100 g of food or 17.3% of total lipids. On a per 100 grams of food basis, the highestmean TFA content among the 18food subgroups was the doughnuts/French toast subgroup (0.95 g), followed by the other pastries subgroup (0.49 g) and the breadwith filling/topping subgroup (0.44 g). Among the samples, the highest TFA content is from a doughnut (4.7 g/100 g), followed bytwo cream-filled bread with shredded coconut (1.8 and 1.4 g/100 g) and a sweetheart cake (1.7 g/100 g). Only consuming one wholepiece of doughnut would have reached 100% of the maximum daily TFA intake as recommended by WHO based on a 2000 kcaldiet. About 78% of samples had TFA ≤0.3 g/100 g food. For the majority of the food samples available in Hong Kong, if TFA waspresent, C18:1 trans would possibly be the predominant one.
1. Introduction
The World Health Organization [1] predicted that coronaryheart disease (CHD) will remain as the third killer of theworld in the coming decades. In Hong Kong, the latest datafrom the Department of Health shows that CHD has beenthe 2nd killer since 2001 [2]. As there is a lack of TFA intakedata in Hong Kong, the trans fatty acids (TFAs) content ofthe diet in Hong Kong could only be estimated in the rangefrom less than 1 g/person/day in Asian and Pacific countriesto 10–20 g/person/day in subpopulations of some Westerncountries [3]. Intake of excessive TFA would increase the riskof CHD, and its effect is considered to be even greater thansaturated fatty acids (SFAs). TFA can increase the risk of CHDby not only raising the level of low density lipoprotein (LDL)cholesterol, but also reducing the high density lipoprotein(HDL) cholesterol [4]. Thus, the World Health Organization
[5] has recommended a daily TFA intake of less than 1% ofoverall energy intake (i.e., about 2.2 g/day for a 2000 kcal diet)for chronic diseases prevention.
Internationally, there have been increasing concerns onTFA content in foods.The intake and potential adverse healtheffects of TFA in developed and developing countries havereceived considerable attention [4, 6–9]. Some countries haveintroduced legislations to regulate TFA level in certain foodsor mandated TFA labelling on foods so as to lower TFAconsumption in the populations [10–12]. In these countries,the TFA content in foods has been lowered as manufacturersand restaurants took initiatives to reformulate their products[13–15]. A recently published review [16] has reinforced thatTFA policies were associated with significant reductions inTFA levels in the food supply. However, both individual-and policy-level initiatives to decrease TFA consumptionshould continue particularly in subgroups and in developing

2 Journal of Chemistry
countries with high consumption of partially hydrogenatedvegetable oils (PHVO) [17]. Furthermore, Ansorena et al. [18]showed the TFA content in bakery products in Spain in 2012has significantly lowered and highlighted the importance ofupdating food composition databases in order to accuratelyestimate the real and current intake of TFA. Similarly, Roe andFinglas of the United Kingdom [19] made the same commenton the importance of updating the food composition databaseon foods with TFA.
Hong Kong is a gourmet paradise; however, there is lim-ited data on the level of TFA in locally available foods. Inaddition to some notorious high TFA Western foods (e.g.,French fries, biscuits, cakes, and instant soup), many indige-nous foods may contain significant amounts of TFA as theyare deep fried (e.g., fritter and sesame seed ball) or areprobably manufactured with PHVO (e.g., sweetheart cake,and egg tart) for its lower cost compared with other fats, itsability to prolong the shelf-life of products, and its desirablecharacteristics imparted to the food. There was no labellingrequirement of nutrients includingTFA in prepackaged foodsprior to the labelling regulation enacted on May 28, 2008,including the grace period of 2 years [20].
The purpose of the present study was to obtain the TFAlevel in Hong Kong so as to gauge the risk of excessive TFAintake. Selected food products in this study were generallyconsidered to be the major sources of TFA in the Westerndiets, and it also covered many indigenous foods that poten-tially contained high level of TFA.This paper is the first studyin Hong Kong which revealed the TFA content in mainlybakery products including indigenous foods and commonWestern fast foods as well as other high fat foods.
2. Materials and Methods
2.1. Sampling of Foods. A total of 142 items were identifiedand sampled for TFA analysis. They were foods commonlyconsumed inHongKong thatmight contain a significant TFAcontent as reported in a corresponding item in the literature.Food samples were purchased and prepared for analysisbetween March and December 2007. They were collectedfrom retail outlets including catering suppliers and takeawayoutlets, food premises, and supermarkets in different districtsin Hong Kong. Sample selection was also based on thepopularity of the brands for that category. All samples wereready-to-eat and required no cooking. Food samples werecollected individually for analysis. However, each samplewas made up of 1 to 10 units to provide at least 200 g forchemical analysis. Amongst the samples, quite a significantportion of prepackaged products were imported from over-seas countries, especially in the subgroups of biscuits, potatoproducts, instant soup, chocolate, chips, and spread. Table 1shows the samples selected which were categorised intobakery products or fast foods/others and were separated into18 food subgroups.
The samples were analysed by the Food Research Labo-ratory (FRL) of Centre for Food Safety (CFS) to determinethe content of TFA, SFA, and total lipids. FRL is accreditedunder ISO/IEC 17025:2005 by the Hong Kong AccreditationService for analysing the concerned parameters. Except for
Table 1: Food items selected for analysis in this study.
Food subgroup Food itemBakery products
Batter-made foods (11) Egg rolls (5), eggette (3), andwaffles (3)
Biscuits (10) Biscuits (4), crackers (3), andcookies (3)
Creamy biscuits (5) Cream crackers (2), andwafers (3)
Pastries (10) Pastries (5), croissant (2), andsweetheart cake (3)
Plain bread (11) White bread (3), wholemealbread (4), and sweet bun (4)
Bread with filling/topping (12)Cream-filled bun (3),pineapple bun with/withoutbutter (6), and sausage bun (3)
Doughnuts/French toast (7) Doughnuts (4), and frenchtoast (3)
Sponge cakes (13) Sponge cakes (13)Creamy cakes (4) Creamy cakes (4)
Chinese fried dough (6) Fried fritter (3), and friedsesame seed ball (3)
Egg tarts (7) Shortcrust pastry (3), puffpastry (3), and portuguese (1)
Fast foods/others
Potato products (11) French fries (3), potato wedges(1), and potato chips (7)
Instant noodles (7) Instant noodles withoutseasonings (7)
Chocolate (6) Chocolate (6)
Instant soup (6) Ready-to-drink (3), and soupmix (3)
Chips (6) Other chips (6)Deep-fried meat (4) Chicken (3), and pork chop (1)Spread (6) Peanut (4), and chocolate (2)
The number in the bracket refers to the number of individual food samples.
deep-fried meat that bones were removed before analysis, thewhole sample was homogenised and stored at −20∘C untilthey were analysed.
2.2. Analytical Determination of Fatty Acids. Analysis of fattyacids was performed according to the AOAC official method[21] 996.06 except that the duration of methylation increasedfrom 45 to 60min, and the gas chromatographic conditionswere as described here: (i) the column used was SP-2560column (100m × 0.25mm × 0.2 𝜇m); (ii) the carrier gas washelium (0.7mL/min); (iii) the injector temperaturewas 225∘Cand injection volume at 1 𝜇L; (iv) the split ratio was 150 : 1;(v) the temperature programme was 100∘C for 4min, thenincreased at a rate of 3∘C/min to 240∘C and held for 20min;and (vi) the temperature of FID detector was at 285∘C.
In brief, weigh a test portion of the homogenised samplethat contained around 50–100mg total lipids into a Mojon-nier flask, and the lipids of the samples were then hydrolysed

Journal of Chemistry 3
by 8.3M hydrochloric acid. Pyrogallic acid was added toprevent oxidative degradation of fatty acids during acidhydrolysis, and 10mg triundecanoin was added as internalstandard. After hydrolysis, fatty acids were extracted intodiethyl etherwhichwere concentrated. Boron trifluirode (7%,2mL) was then added as derivatising agent, and fatty acidswere methylated to fatty acid methyl esters (FAMEs) by heat-ing at 100∘C for an hour. FAMEs yielded were quantitativelymeasured by using a gas chromatograph equipped with flameionisation detection system.
2.3. Analytical Determination of Total Lipids. Analysis of totalfat in samples was performed according to the AOAC officialmethod [21] 922.06. In brief, 2 g sample was moistened withethanol, and the lipids in the samplewere hydrolysed by 8.3Mhydrochloric acid. After that, the lipids were extracted intodiethyl ether which was then evaporated to dryness. Total oflipids yielded was determined by weighing the residue.
2.4. Quality Control. For each batch of analysis of fatty acids(15 samples) or total lipids (10 samples), one blank, one spike,and one control sample were analysed for quality assurancepurpose. For fatty acids, a control food sample (beef-pork fatblend) was run throughout the whole study. The maximumprecision of duplicate analysis and average recovery spikedtriglycerides were 9.5 and 96%. The CVs for main fatty acidswere 6.9% for C14:0, 3.6% for C16:0, 3.5% for C18:0, 9.7%for C16:1n-7t, and 11.8% for C18:2n-6ct, respectively. For totallipids, the average spiked recovery, maximum precision ofduplicate analysis, and CV of a control sample were 101, 5.5,and 1.87%, respectively.
2.5. Data Interpretation. The contents of TFA, SFA, and totallipids are presented in per 100 g food. The TFA content isfurther presented in per 100 g total lipids.
Total lipids referred to the sum of triglycerides, phos-pholipids, wax ester, sterols, and minor amount of nonfattymaterial. SFA referred to the sum of 13 isomers (C4:0,C6:0, C8:0, C10:0, C12:0, C14:0, C15:0, C16:0, C17:0, C18:0,C20:0, C22:0, and C24:0), and TFA referred to the sum of 8isomers (C14:1n-5t, C16:1n-7t, C18:1 trans (sum of all positionisomers), C18:2n-6tt, C18:2n-6ct, C18:2n-6tc, C20:1n-9t, andC22:1n-9t).
The mean (and range) of the individual samples of eachgroup was presented as the content of each food item in thereport.The values of fatty acids and total lipids were roundedto 2 significant figures rather than 2 decimal figures and inagreement with the decimal place of the limit of detection(LOD).The values of fatty acids and total lipids were reportedas “ND” if the level was below LOD.
When the value of fatty acids or total lipids of a foodwas between LOD and the limit of quantitation (LOQ), theaverage of LOD and LOQ would be used for calculating themean and the range. The LOD and LOQ of each individualTFA are 0.005 and 0.01 g/100 g, respectively. The LOD andLOQ of each individual SFA are in the range of 0.0005–0.005and 0.002–0.02 g/100 g, respectively. The LOD and LOQ fortotal lipids are 0.1 and 0.3 g/100 g, respectively.
3. Results and Discussion
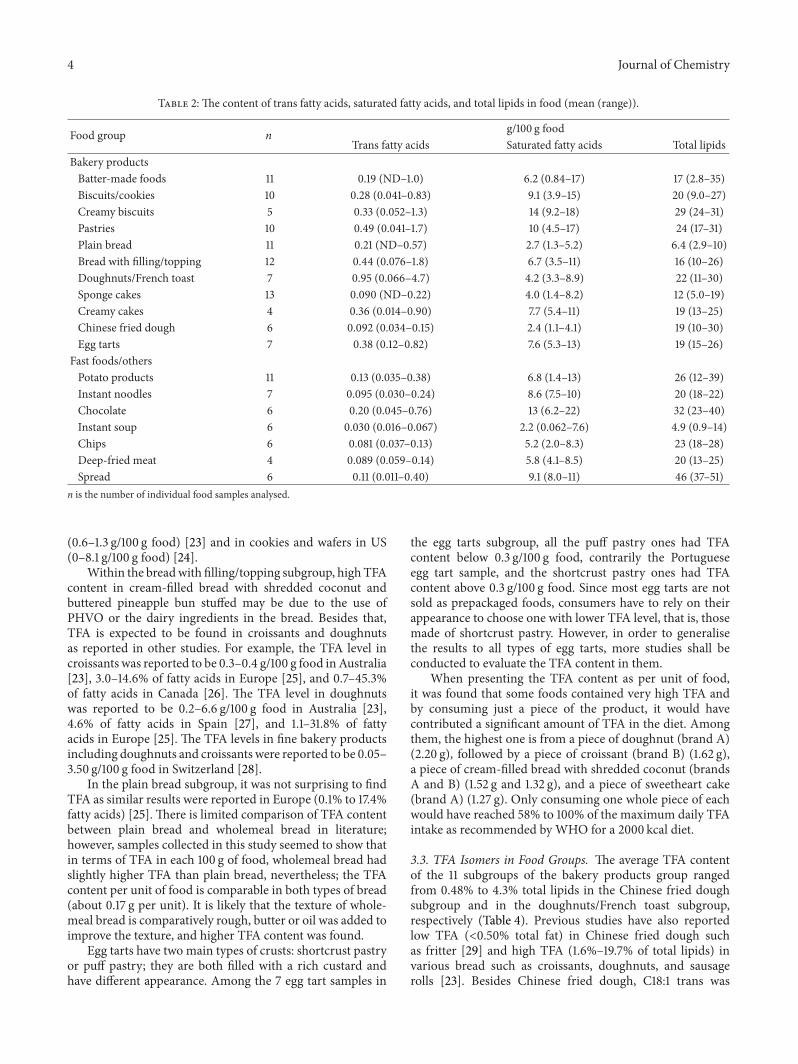
3.1. TFA, SFA, and Total Lipids Content across Food Groups.The average levels of TFA, SFA, and total lipids in the 18food subgroups are shown in Table 2. Generally, the averageTFA content of the bakery products group (except for thesponge cakes, the Chinese fried dough, and batter-madefoods subgroups) was higher than that of the fast foods/othergroup (except for the chocolate subgroup).The highest meanTFA content was found in the doughnuts/French toast sub-group (0.95 g/100 g food), followed by the pastries subgroup(0.49 g/100 g food), the bread with filling/topping subgroup(0.44 g/100 g food), and the egg tart subgroup (0.38 g/100 gfood). The bakery products group had a similar range ofaverage SFA levels as the fast foods/others group (2.4–14 g and2.2–13 g/100 g food, resp.) but with a lower level of averagetotal lipids content (except for the creamy biscuits subgroup)than the fast foods/others group (except for the instant soupsubgroups).
In per 100 g of the 142 foods, TFA is present in almost allfoods except for four food samples: a plain bread, a spongecake, and two batter-made samples (one egg roll and oneeggette). For the rest, TFA varied from 0.010 g in a plainsponge cake to 4.7 g in a doughnut. About 79% (112/142) sam-ples hadTFAequal to or less than 0.3 g, a valuewhich could beround to 0 g under theHong Kong nutrition labelling schemefor prepackaged foods [22].The SFA varied from0.062 g in aninstant soup to 22 g in a chocolate, and the total lipids variedfrom 0.9 g in an instant soup to 51 g in a peanut butter.
Due to resource constraints, the study had only coveredlimited number of food types and samples with high TFAcontent; more studies are warranted to examine other foodsthat may contain TFA such as oils and fats, common localdishes, and candies.
3.2. Food Items with TFA Content Greater Than 0.3 g per 100 gof Food. A total of 31 food items had TFA content morethan 0.3 g/100 g which were distributed in these subgroups(number of items): pastries (5), bread with filling/topping (5),biscuits (3), plain bread (4), egg tarts (4), batter-made foods(3), doughnuts/French toast (2), creamy biscuits (1), creamycakes (1), chocolate (1), potato products (1), and spread (1).Table 3 shows their TFA content in each 100 g of foods (indescending order of the respective subgroups) and in eachcommon unit of foods.
In the batter-made foods subgroup, all egg roll samplesexamined in this study contained a significant amount of TFA(0.34 to 1.0 g/100 g food). Egg roll is a popular snack in HongKong which is a layer of egg batter baked on a hot flat metalplate. The product may be rolled up into a cylindrical shapeor a square shape, and it may be sold plainly or stuffed withpork floss, seaweed, or sesame/coconut/candy mixture, andso forth. It is possible that TFA is produced during the highheat cooking of the ingredients involving oils and fats or theaddition of PHVO in the ingredients.
Within the biscuits, creamy biscuits, and pastries sub-groups, TFA found in wafers, cookies, and sweet puff pastryis in line with other studies. For instance, a wide range ofTFA content has been reported in sweet pastry in Australia
4 Journal of Chemistry
Table 2: The content of trans fatty acids, saturated fatty acids, and total lipids in food (mean (range)).
Food group n g/100 g foodTrans fatty acids Saturated fatty acids Total lipids
Bakery productsBatter-made foods 11 0.19 (ND–1.0) 6.2 (0.84–17) 17 (2.8–35)Biscuits/cookies 10 0.28 (0.041–0.83) 9.1 (3.9–15) 20 (9.0–27)Creamy biscuits 5 0.33 (0.052–1.3) 14 (9.2–18) 29 (24–31)Pastries 10 0.49 (0.041–1.7) 10 (4.5–17) 24 (17–31)Plain bread 11 0.21 (ND–0.57) 2.7 (1.3–5.2) 6.4 (2.9–10)Bread with filling/topping 12 0.44 (0.076–1.8) 6.7 (3.5–11) 16 (10–26)Doughnuts/French toast 7 0.95 (0.066–4.7) 4.2 (3.3–8.9) 22 (11–30)Sponge cakes 13 0.090 (ND–0.22) 4.0 (1.4–8.2) 12 (5.0–19)Creamy cakes 4 0.36 (0.014–0.90) 7.7 (5.4–11) 19 (13–25)Chinese fried dough 6 0.092 (0.034–0.15) 2.4 (1.1–4.1) 19 (10–30)Egg tarts 7 0.38 (0.12–0.82) 7.6 (5.3–13) 19 (15–26)
Fast foods/othersPotato products 11 0.13 (0.035–0.38) 6.8 (1.4–13) 26 (12–39)Instant noodles 7 0.095 (0.030–0.24) 8.6 (7.5–10) 20 (18–22)Chocolate 6 0.20 (0.045–0.76) 13 (6.2–22) 32 (23–40)Instant soup 6 0.030 (0.016–0.067) 2.2 (0.062–7.6) 4.9 (0.9–14)Chips 6 0.081 (0.037–0.13) 5.2 (2.0–8.3) 23 (18–28)Deep-fried meat 4 0.089 (0.059–0.14) 5.8 (4.1–8.5) 20 (13–25)Spread 6 0.11 (0.011–0.40) 9.1 (8.0–11) 46 (37–51)
n is the number of individual food samples analysed.
(0.6–1.3 g/100 g food) [23] and in cookies and wafers in US(0–8.1 g/100 g food) [24].
Within the breadwith filling/topping subgroup, high TFAcontent in cream-filled bread with shredded coconut andbuttered pineapple bun stuffed may be due to the use ofPHVO or the dairy ingredients in the bread. Besides that,TFA is expected to be found in croissants and doughnutsas reported in other studies. For example, the TFA level incroissants was reported to be 0.3–0.4 g/100 g food inAustralia[23], 3.0–14.6% of fatty acids in Europe [25], and 0.7–45.3%of fatty acids in Canada [26]. The TFA level in doughnutswas reported to be 0.2–6.6 g/100 g food in Australia [23],4.6% of fatty acids in Spain [27], and 1.1–31.8% of fattyacids in Europe [25]. The TFA levels in fine bakery productsincluding doughnuts and croissants were reported to be 0.05–3.50 g/100 g food in Switzerland [28].
In the plain bread subgroup, it was not surprising to findTFA as similar results were reported in Europe (0.1% to 17.4%fatty acids) [25]. There is limited comparison of TFA contentbetween plain bread and wholemeal bread in literature;however, samples collected in this study seemed to show thatin terms of TFA in each 100 g of food, wholemeal bread hadslightly higher TFA than plain bread, nevertheless; the TFAcontent per unit of food is comparable in both types of bread(about 0.17 g per unit). It is likely that the texture of whole-meal bread is comparatively rough, butter or oil was added toimprove the texture, and higher TFA content was found.
Egg tarts have two main types of crusts: shortcrust pastryor puff pastry; they are both filled with a rich custard andhave different appearance. Among the 7 egg tart samples in
the egg tarts subgroup, all the puff pastry ones had TFAcontent below 0.3 g/100 g food, contrarily the Portugueseegg tart sample, and the shortcrust pastry ones had TFAcontent above 0.3 g/100 g food. Since most egg tarts are notsold as prepackaged foods, consumers have to rely on theirappearance to choose one with lower TFA level, that is, thosemade of shortcrust pastry. However, in order to generalisethe results to all types of egg tarts, more studies shall beconducted to evaluate the TFA content in them.
When presenting the TFA content as per unit of food,it was found that some foods contained very high TFA andby consuming just a piece of the product, it would havecontributed a significant amount of TFA in the diet. Amongthem, the highest one is from a piece of doughnut (brand A)(2.20 g), followed by a piece of croissant (brand B) (1.62 g),a piece of cream-filled bread with shredded coconut (brandsA and B) (1.52 g and 1.32 g), and a piece of sweetheart cake(brand A) (1.27 g). Only consuming one whole piece of eachwould have reached 58% to 100% of the maximum daily TFAintake as recommended by WHO for a 2000 kcal diet.
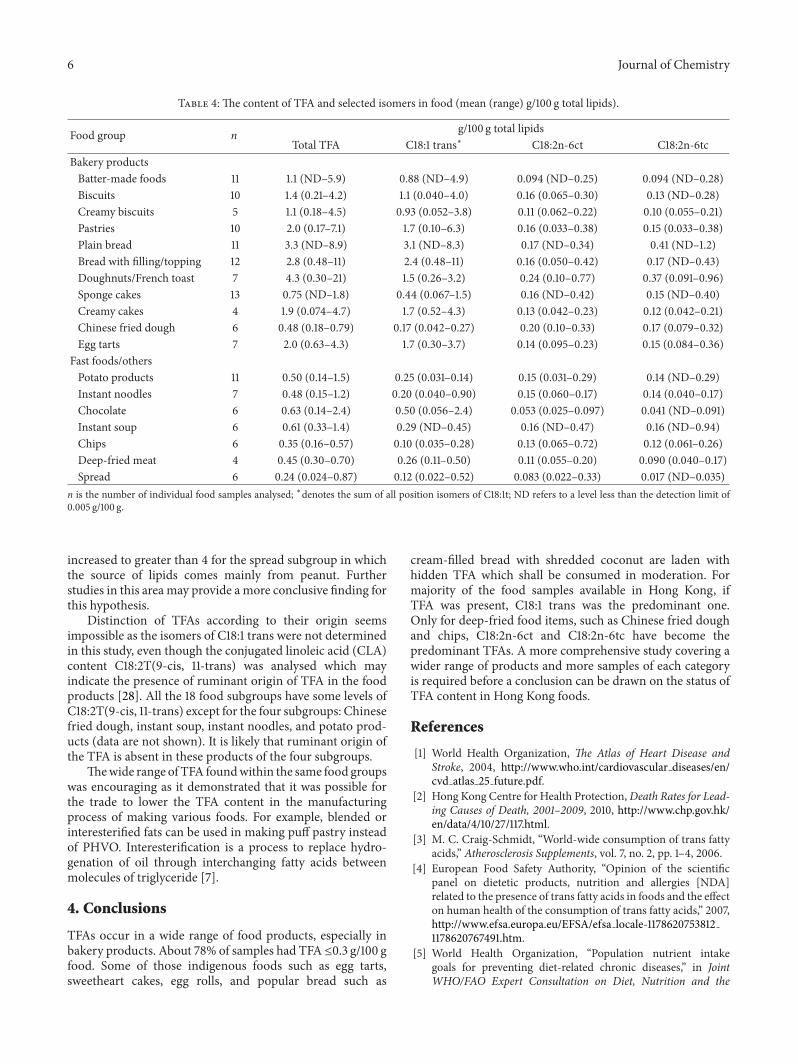
3.3. TFA Isomers in Food Groups. The average TFA contentof the 11 subgroups of the bakery products group rangedfrom 0.48% to 4.3% total lipids in the Chinese fried doughsubgroup and in the doughnuts/French toast subgroup,respectively (Table 4). Previous studies have also reportedlow TFA (<0.50% total fat) in Chinese fried dough suchas fritter [29] and high TFA (1.6%–19.7% of total lipids) invarious bread such as croissants, doughnuts, and sausagerolls [23]. Besides Chinese fried dough, C18:1 trans was

Journal of Chemistry 5
Table 3: Food items with TFA greater than 0.3 g per 100 g of food.
Food group ProductTFA
g/100 g food g/unit∗Percentage of the daily
recommended intake of TFA byone piece of food item#
Batter-made foodsEgg roll (brand A) 1.0 0.16 7.3Egg roll (brand B) 0.48 0.09 4.1Egg roll (brand C) 0.34 0.13 5.9
Biscuits Cookies (brand A) 0.83 0.07 3.2Cookies (brand B) 0.58 0.06 2.7
Creamy biscuits Wafer (brand A) 1.3 0.11 5.0
Pastries
Sweetheart cake (brand A) 1.7 1.27 58Croissant (brand A) 0.98 0.36 16Croissant (brand B) 0.81 1.62 74
Sweet puff pastry (brand A) 0.69 0.06 2.7Sweet puff pastry (brand B) 0.43 0.04 1.8
Croissant (brand C) 0.36 0.17 7.7
Doughnuts/French toast Doughnut (brand A) 4.7 2.20 100Doughnut (brand B) 0.47 0.28 13
Creamy cakes Swiss roll (brand A) 0.90 0.90 41
Plain bread
Wholemeal bread (brand A) 0.57 0.17 7.7Wholemeal bread (brand B) 0.51 0.18 8.2
White bread (brand A) 0.40 0.17 7.7Sweet bun (brand A) 0.31 0.10 4.5
Bread with filling/topping
Cream-filled bread w/shredded coconut (brand A) 1.8 1.52 69Cream-filled bread w/shredded coconut (brand B) 1.4 1.32 60
Buttered pineapple bun (brand A) 0.45 0.21 9.5Buttered pineapple bun (brand B) 0.39 0.42 19
Cream-filled bread w/shredded coconut (brand C) 0.35 0.38 17
Egg tarts
Portuguese egg tart 0.82 0.43 20Egg tart (brand A) 0.54 0.39 18Egg tart (brand B) 0.43 0.41 19Egg tart (brand C) 0.38 0.23 11
Chocolate Chocolate (brand A) 0.76 0.33 15Potato products French fries (brand B) 0.38 0.53 24Spread Peanut butter (brand A) 0.40 0.06 2.7∗One unit refers to one whole piece of food or recommended serving size written on the label of the prepackaged product.#Percentage of daily intake of TFA with respect to consumption of one piece or recommended serving size of a daily energy intake of 2000 kilocalories.
the predominant TFA in most samples which echoes thefindings in many bakery products by other studies [23, 25,27, 28]. For Chinese fried dough, they mainly contain thecooking oil used for deep drying, and the TFA profile shouldbe similar to that of cooking oil. Thus, C18:2 trans was thepredominant TFA which echoes the findings of TFA profilein edible oil [30].
The average TFA content of the 7 subgroups of fastfoods/others group ranged from 0.24% to 0.63% of totallipids in the spread group and in the instant soup group,respectively (Table 4). Compared with other studies, the TFAcontent in peanut butter and chocolate spread determined inthis study was much lower than that reported in Australia
(e.g., 0.8–1.4% of total lipids) [23]. Other foods such as chips,French fries, and chocolate also had lower TFA than otherstudies [23, 27–29, 31]. Similar to the results in the bakeryproducts, C18:1 trans was the predominant TFA in mostsamples.
Regarding the abundance of TFA, most of the testedsamples had the descending sequence of C18:1 trans, C18:2n-6ct, and C18:2n-6tc while other isomers were minimal. Forthe ratio of C18:2n-6ct to C18:2n-6tc, it was normally closedto one. Such ratio was also found in the plain bread anddoughnuts/French toast subgroups which were less than0.7; this could be a result of using butter as one of themajor ingredients in these food items. In contrast, the ratio
6 Journal of Chemistry
Table 4: The content of TFA and selected isomers in food (mean (range) g/100 g total lipids).
Food group n g/100 g total lipidsTotal TFA C18:1 trans∗ C18:2n-6ct C18:2n-6tc
Bakery productsBatter-made foods 11 1.1 (ND–5.9) 0.88 (ND–4.9) 0.094 (ND–0.25) 0.094 (ND–0.28)Biscuits 10 1.4 (0.21–4.2) 1.1 (0.040–4.0) 0.16 (0.065–0.30) 0.13 (ND–0.28)Creamy biscuits 5 1.1 (0.18–4.5) 0.93 (0.052–3.8) 0.11 (0.062–0.22) 0.10 (0.055–0.21)Pastries 10 2.0 (0.17–7.1) 1.7 (0.10–6.3) 0.16 (0.033–0.38) 0.15 (0.033–0.38)Plain bread 11 3.3 (ND–8.9) 3.1 (ND–8.3) 0.17 (ND–0.34) 0.41 (ND–1.2)Bread with filling/topping 12 2.8 (0.48–11) 2.4 (0.48–11) 0.16 (0.050–0.42) 0.17 (ND–0.43)Doughnuts/French toast 7 4.3 (0.30–21) 1.5 (0.26–3.2) 0.24 (0.10–0.77) 0.37 (0.091–0.96)Sponge cakes 13 0.75 (ND–1.8) 0.44 (0.067–1.5) 0.16 (ND–0.42) 0.15 (ND–0.40)Creamy cakes 4 1.9 (0.074–4.7) 1.7 (0.52–4.3) 0.13 (0.042–0.23) 0.12 (0.042–0.21)Chinese fried dough 6 0.48 (0.18–0.79) 0.17 (0.042–0.27) 0.20 (0.10–0.33) 0.17 (0.079–0.32)Egg tarts 7 2.0 (0.63–4.3) 1.7 (0.30–3.7) 0.14 (0.095–0.23) 0.15 (0.084–0.36)
Fast foods/othersPotato products 11 0.50 (0.14–1.5) 0.25 (0.031–0.14) 0.15 (0.031–0.29) 0.14 (ND–0.29)Instant noodles 7 0.48 (0.15–1.2) 0.20 (0.040–0.90) 0.15 (0.060–0.17) 0.14 (0.040–0.17)Chocolate 6 0.63 (0.14–2.4) 0.50 (0.056–2.4) 0.053 (0.025–0.097) 0.041 (ND–0.091)Instant soup 6 0.61 (0.33–1.4) 0.29 (ND–0.45) 0.16 (ND–0.47) 0.16 (ND–0.94)Chips 6 0.35 (0.16–0.57) 0.10 (0.035–0.28) 0.13 (0.065–0.72) 0.12 (0.061–0.26)Deep-fried meat 4 0.45 (0.30–0.70) 0.26 (0.11–0.50) 0.11 (0.055–0.20) 0.090 (0.040–0.17)Spread 6 0.24 (0.024–0.87) 0.12 (0.022–0.52) 0.083 (0.022–0.33) 0.017 (ND–0.035)
n is the number of individual food samples analysed; ∗denotes the sum of all position isomers of C18:1t; ND refers to a level less than the detection limit of0.005 g/100 g.
increased to greater than 4 for the spread subgroup in whichthe source of lipids comes mainly from peanut. Furtherstudies in this area may provide a more conclusive finding forthis hypothesis.
Distinction of TFAs according to their origin seemsimpossible as the isomers of C18:1 trans were not determinedin this study, even though the conjugated linoleic acid (CLA)content C18:2T(9-cis, 11-trans) was analysed which mayindicate the presence of ruminant origin of TFA in the foodproducts [28]. All the 18 food subgroups have some levels ofC18:2T(9-cis, 11-trans) except for the four subgroups: Chinesefried dough, instant soup, instant noodles, and potato prod-ucts (data are not shown). It is likely that ruminant origin ofthe TFA is absent in these products of the four subgroups.
Thewide range of TFA foundwithin the same food groupswas encouraging as it demonstrated that it was possible forthe trade to lower the TFA content in the manufacturingprocess of making various foods. For example, blended orinteresterified fats can be used in making puff pastry insteadof PHVO. Interesterification is a process to replace hydro-genation of oil through interchanging fatty acids betweenmolecules of triglyceride [7].
4. Conclusions
TFAs occur in a wide range of food products, especially inbakery products. About 78% of samples had TFA ≤0.3 g/100 gfood. Some of those indigenous foods such as egg tarts,sweetheart cakes, egg rolls, and popular bread such as
cream-filled bread with shredded coconut are laden withhidden TFA which shall be consumed in moderation. Formajority of the food samples available in Hong Kong, ifTFA was present, C18:1 trans was the predominant one.Only for deep-fried food items, such as Chinese fried doughand chips, C18:2n-6ct and C18:2n-6tc have become thepredominant TFAs. A more comprehensive study covering awider range of products and more samples of each categoryis required before a conclusion can be drawn on the status ofTFA content in Hong Kong foods.
References
[1] World Health Organization, The Atlas of Heart Disease andStroke, 2004, http://www.who.int/cardiovascular diseases/en/cvd atlas 25 future.pdf.
[2] Hong Kong Centre for Health Protection,Death Rates for Lead-ing Causes of Death, 2001–2009, 2010, http://www.chp.gov.hk/en/data/4/10/27/117.html.
[3] M. C. Craig-Schmidt, “World-wide consumption of trans fattyacids,” Atherosclerosis Supplements, vol. 7, no. 2, pp. 1–4, 2006.
[4] European Food Safety Authority, “Opinion of the scientificpanel on dietetic products, nutrition and allergies [NDA]related to the presence of trans fatty acids in foods and the effecton human health of the consumption of trans fatty acids,” 2007,http://www.efsa.europa.eu/EFSA/efsa locale-11786207538121178620767491.htm.
[5] World Health Organization, “Population nutrient intakegoals for preventing diet-related chronic diseases,” in JointWHO/FAO Expert Consultation on Diet, Nutrition and the
Journal of Chemistry 7
Prevention of Chronic Diseases, WHO Technical Report Series916, chapter 5, 2003, http://whqlibdoc.who.int/trs/WHO TRS916.pdf.
[6] Dietary Guidelines Advisory Committee, Fats in the Report ofthe Dietary Guidelines Advisory Committee on Dietary Guide-lines for Americans, Part D: Science Base, Section 4, 2005,http://www.health.gov/dietaryguidelines/dga2005/report/HTML/D4 Fats.htm.
[7] Health Canada, “TRANSforming the food supply is the finalreport of the trans fat task force,” Health Canada and theHeart and Stroke Foundation of Canada, submitted to theMin-ister of Health, 2013, http://www.hc-sc.gc.ca/fn-an/nutrition/gras-trans-fats/tf-ge/tf-gt rep-rap-eng.php.
[8] Senate and House of Representatives of the Republic of thePhilippines in Congress, “House Bill no. 330: Trans fat labelingrequirements on food product labels and banning harmful transfat in food,” http://www.congress.gov.ph/download/basic 15/HB00330.pdf.
[9] New York City Department of Health and Mental Hygiene,The Regulation to Phase Out Artificial Trans Fat in New YorkCity Food Service Establishments, 2008, http://www.nyc.gov/html/doh/downloads/pdf/cardio/cardio-transfat-bro.pdf.
[10] Danish Nutrition Council, The Influence of Trans Fatty Acidson Health, 4th edition, 2003, http://www.meraadet.dk/gfx/up-loads/rapporter pdf/Trans%20fatty%20acids 4.th%20ed. UKwww.pdf.
[11] US Food and Drug Administration, “Federal register—68 FR41433 July 11, 2003: food labeling; trans fatty acids in nutritionlabeling; consumer research to consider nutrient content andhealth claims and possible footnote or disclosure statements;final rule and proposed rule,” 2005, https://www.federalregister.gov/regulations/0910-AC50/food-labeling-trans-fatty-acids-in-nutrition-labeling-consumer-research-to-consider-nutri-ent-content.
[12] Health Canada, “Trans fat,” 2009, http://www.hc-sc.gc.ca/fn-an/nutrition/gras-trans-fats/index-eng.php.
[13] T. Leth,H.G. Jensen,A.A.Mikkelsen, andA. Bysted, “The effectof the regulation on trans fatty acid content in Danish food,”Atherosclerosis Supplements, vol. 7, no. 2, pp. 53–56, 2006.
[14] M. J. Albers, L. J. Harnack, L. M. Steffen, and D. R. Jacobs Jr.,“2006 marketplace survey of trans-fatty acid content of marga-rines and butters, cookies and snack cakes, and savory snacks,”Journal of the American Dietetic Association, vol. 108, no. 2, pp.367–370, 2008.
[15] W. M. N. Ratnayake, M. R. L’Abbe, and D. Mozaffarian,“Nationwide product reformulations to reduce trans fatty acidsin Canada: when trans fat goes out, what goes in?” EuropeanJournal of Clinical Nutrition, vol. 63, no. 6, pp. 808–811, 2009.
[16] S. M. Downs, A. M. Thow, and S. R. Leeder, “The effectivenessof policies for reducing dietary trans fat: a systematic review ofthe evidence,” Bulletin of theWorld Health Organization, vol. 91,pp. 262H–269H, 2013.
[17] S. M. Teegala,W. C.Willett, andD.Mozaffarian, “Consumptionand health effects of trans fatty acids: a review,” Journal of AOACInternational, vol. 92, no. 5, pp. 1250–1257, 2009.
[18] D. Ansorena, A. Echarte, R. Olle, and I. Astiasaran, “2012: Notrans fatty acids in Spanish bakery products,” Food Chemistry,vol. 138, no. 1, pp. 422–429, 2013.
[19] M. Roe and P. M. Finglas, “UK food composition data—updating the McCance and Widdowson integrated dataset,”Journal of the Association of Public Analysts, vol. 40, pp. 69–70,2012, http://www.apajournal.org.uk/2012 0069-0070.pdf.
[20] Hong Kong Department of Justice, Cap 132W Food and Drugs(Composition and Labelling) Regulations, 2010, http://www.legislation.gov.hk/blis ind.nsf/WebView?OpenAgent&vwpg=CURALLENGDOC∗132∗100∗132.24#132.24.
[21] AOAC, Official Methods of Analysis of AOAC International(OMA), 19th edition, 2012.
[22] HongKongCentre for Food Safety,Technical Guidance Notes onNutrition Labelling and Nutrition Claims, 2008, http://www.cfs.gov.hk/english/food leg/files/nl technical guidance e.pdf.
[23] J. McCarthy, D. Barr, and A. Sinclair, “Determination of transfatty acid levels by FTIR in processed foods in Australia,” AsiaPacific Journal of Clinical Nutrition, vol. 17, no. 3, pp. 391–396,2008.
[24] M.M.Mossoba, J. Moss, and J. K. G. Kramer, “Trans fat labelingand levels in U.S. foods: assessment of gas chromatographic andinfrared spectroscopic techniques for regulatory compliance,”Journal of AOAC International, vol. 92, no. 5, pp. 1284–1300,2009.
[25] M. A. van Erp-Baart, C. Couet, C. Cuadrado, A. Kafatos, J.Stanley, andG. van Poppel, “Transfatty acids in bakery productsfrom 14 european countries: the TRANSFAIR study,” Journal ofFood Composition and Analysis, vol. 11, no. 2, pp. 161–169, 1998.
[26] W. M. N. Ratnayake, M. R. L’abbe, S. Farnworth et al., “Transfatty acids: current contents in Canadian foods and estimatedintake levels for the Canadian population,” Journal of AOACInternational, vol. 92, no. 5, pp. 1258–1276, 2009.
[27] P. M. Fernandez and S. Juan, “Fatty acid composition of com-mercial Spanish fast food and snack food,” Journal of Food Com-position and Analysis, vol. 13, no. 3, pp. 275–281, 2000.
[28] E. K. Richter, K. A. Shawish, M. R. L. Scheeder, and P. C.Colombani, “Trans fatty acid content of selected Swiss foods:the TransSwissPilot study,” Journal of Food Composition andAnalysis, vol. 22, no. 5, pp. 479–484, 2009.
[29] H. Fu, L. Yang, H. Yuan, P. Rao, and Y. M. Lo, “Assessment oftrans fatty acids content in popular Western-style products inChina,” Journal of Food Science, vol. 73, no. 8, pp. S383–S391,2008.
[30] A. Baylin, X. Siles, A. Donovan-Palmer, X. Fernandez, and H.Campos, “Fatty acid composition of Costa Rican foods includ-ing trans fatty acid content,” Journal of Food Composition andAnalysis, vol. 20, no. 3-4, pp. 182–192, 2007.
[31] A. Aro, E. Amaral, H. Kesteloot, A. Rimestad, M. Thamm, andG. van Poppel, “Transfatty acids in French fries, soups, andsnacks from 14 european countries: the TRANSFAIR study,”Journal of Food Composition and Analysis, vol. 11, no. 2, pp. 170–177, 1998.

Submit your manuscripts athttp://www.hindawi.com
Hindawi Publishing Corporationhttp://www.hindawi.com Volume 2014
Inorganic ChemistryInternational Journal of
Hindawi Publishing Corporation http://www.hindawi.com Volume 2014
International Journal ofPhotoenergy
Hindawi Publishing Corporationhttp://www.hindawi.com Volume 2014
Carbohydrate Chemistry
International Journal of
Hindawi Publishing Corporationhttp://www.hindawi.com Volume 2014
Journal of
Chemistry
Hindawi Publishing Corporationhttp://www.hindawi.com Volume 2014
Advances in
Physical Chemistry
Hindawi Publishing Corporationhttp://www.hindawi.com
Analytical Methods in Chemistry
Journal of
Volume 2014
Bioinorganic Chemistry and ApplicationsHindawi Publishing Corporationhttp://www.hindawi.com Volume 2014
SpectroscopyInternational Journal of
Hindawi Publishing Corporationhttp://www.hindawi.com Volume 2014
The Scientific World JournalHindawi Publishing Corporation http://www.hindawi.com Volume 2014
Medicinal ChemistryInternational Journal of
Hindawi Publishing Corporationhttp://www.hindawi.com Volume 2014
Chromatography Research International
Hindawi Publishing Corporationhttp://www.hindawi.com Volume 2014
Applied ChemistryJournal of
Hindawi Publishing Corporationhttp://www.hindawi.com Volume 2014
Hindawi Publishing Corporationhttp://www.hindawi.com Volume 2014
Theoretical ChemistryJournal of
Hindawi Publishing Corporationhttp://www.hindawi.com Volume 2014
Journal of
Spectroscopy
Analytical ChemistryInternational Journal of
Hindawi Publishing Corporationhttp://www.hindawi.com Volume 2014
Journal of
Hindawi Publishing Corporationhttp://www.hindawi.com Volume 2014
Quantum Chemistry
Hindawi Publishing Corporationhttp://www.hindawi.com Volume 2014
Organic Chemistry International
ElectrochemistryInternational Journal of
Hindawi Publishing Corporation http://www.hindawi.com Volume 2014
Hindawi Publishing Corporationhttp://www.hindawi.com Volume 2014
CatalystsJournal of