Research Article Microemulsion Liquid Chromatographic Method...
10
Hindawi Publishing Corporation Journal of Analytical Methods in Chemistry Volume 2013, Article ID 132836, 9 pages http://dx.doi.org/10.1155/2013/132836 Research Article Microemulsion Liquid Chromatographic Method for Simultaneous Determination of Simvastatin and Ezetimibe in Their Combined Dosage Forms Mohammed E. A. Hammouda, Mohamed A. Abu El-Enin, Dina T. El-Sherbiny, Dalia R. El-Wasseef, and Saadia M. El-Ashry Department of Medicinal Chemistry, Faculty of Pharmacy, University of Mansoura, Mansoura 35516, Egypt Correspondence should be addressed to Mohammed E. A. Hammouda; [email protected] Received 5 May 2013; Revised 4 August 2013; Accepted 8 August 2013 Academic Editor: Juan F. Garcia-Reyes Copyright © 2013 Mohammed E. A. Hammouda et al. is is an open access article distributed under the Creative Commons Attribution License, which permits unrestricted use, distribution, and reproduction in any medium, provided the original work is properly cited. A rapid HPLC procedure using a microemulsion as an eluent was developed and validated for analytical quality control of antihyperlipidemic mixture containing simvastatin (SIM) and ezetimibe (EZT) in their pharmaceutical preparations. e separation was performed on a column packed with cyano bonded stationary phase adopting UV detection at 238 nm using a flow rate of 1 mL/min. e optimized microemulsion mobile phase consisted of 0.2 M sodium dodecyl sulphate, 1% octanol, 10% n- propanol, and 0.3% triethylamine in 0.02 M phosphoric acid at pH 5.0. e developed method was validated in terms of specificity, linearity, lower limit of quantification (LOQ), lower limit of detection (LOD), precision, and accuracy. e proposed method is rapid (8.5 min), reproducible (RSD < 2.0%) and achieves satisfactory resolution between SIM and EZT (resolution factor = 2.57). e mean recoveries of the analytes in pharmaceutical preparations were in agreement with those obtained from a reference method, as revealed by statistical analysis of the obtained results using Student’s t-test and the variance ratio F-test. 1. Introduction Simvastatin, 2,2-dimethylbutanoic acid (1S,3R,7S,8S,8aR)-1, 2,3,7,8,8a-hexahydro-3,7-dimethyl-8-[2-[(2R,4R)-tetrahy- dro-4-hydroxy-6-oxo-2H-pyran-2-yl]ethyl]-1-naphthalenyl ester [1](Figure 1(a)), is antihyperlipidemic drug, acting by competitive inhibition of 3-hydroxy-3-methylglutaryl coen- zyme A reductase (HMG-CoA reductase), the rate deter- mining enzyme for cholesterol synthesis in the liver [2]. Ezetimibe, (3R,4S)-1-(p-fluorophenyl)-3-[(3S)-3-(p-fluoro- phenyl)-3-hydroxypropyl]-4-(p-hydroxyphenyl)-2-azetidi- none [2](Figure 1(b)), is antihyperlipidemic agent, as it inhibits intestinal sterol absorption [2]. A combination dos- age form containing simvastatin and ezetimibe was approved by FDA in July 2004 for the treatment hyperlipidemia. Reviewing the literature revealed that several methods have been described for determination of SIM in pure forms as well as in pharmaceutical preparations, individually or in combination with other drugs. ese methods include spec- trophotometry [3–5], voltammetry [6], micellar enhanced kinetic chromatography (MEKC) [7], ultra performance liquid chromatography (UPLC) [8], and high performance liquid chromatography (HPLC) [9–12]. Regarding ezetimibe, various methods have been reported for its determination, individually or in combination with other drugs including spectrophotometry [13, 14], spectrofluorimetry [15], MEKC [16], gas chromatography-mass spectrometry (GC-MS) [17], UPLC [18], and HPLC [19–26]. Different methods were reported for the simultaneous determination of SIM and EZT in their coformulated tablets relying on spectrophotometric methods [27–30], MEKC [31], high performance thin layer chromatography (HPTLC) [32], and HPLC [33–35]. Microemulsions are clear, thermodynamically stable isotropic mixtures containing oil, water, surfactant, and most oſten also a medium chain alcohol acting as a cosurfactant.
Transcript of Research Article Microemulsion Liquid Chromatographic Method...
Hindawi Publishing CorporationJournal of Analytical Methods in ChemistryVolume 2013, Article ID 132836, 9 pageshttp://dx.doi.org/10.1155/2013/132836
Research ArticleMicroemulsion Liquid Chromatographic Method forSimultaneous Determination of Simvastatin and Ezetimibein Their Combined Dosage Forms
Mohammed E. A. Hammouda, Mohamed A. Abu El-Enin, Dina T. El-Sherbiny,Dalia R. El-Wasseef, and Saadia M. El-Ashry
Department of Medicinal Chemistry, Faculty of Pharmacy, University of Mansoura, Mansoura 35516, Egypt
Correspondence should be addressed to Mohammed E. A. Hammouda; [email protected]
Received 5 May 2013; Revised 4 August 2013; Accepted 8 August 2013
Academic Editor: Juan F. Garcia-Reyes
Copyright © 2013 Mohammed E. A. Hammouda et al. This is an open access article distributed under the Creative CommonsAttribution License, which permits unrestricted use, distribution, and reproduction in any medium, provided the original work isproperly cited.
A rapid HPLC procedure using a microemulsion as an eluent was developed and validated for analytical quality controlof antihyperlipidemic mixture containing simvastatin (SIM) and ezetimibe (EZT) in their pharmaceutical preparations. Theseparation was performed on a column packed with cyano bonded stationary phase adopting UV detection at 238 nm using aflow rate of 1mL/min.The optimized microemulsion mobile phase consisted of 0.2M sodium dodecyl sulphate, 1% octanol, 10% n-propanol, and 0.3% triethylamine in 0.02M phosphoric acid at pH 5.0.The developed method was validated in terms of specificity,linearity, lower limit of quantification (LOQ), lower limit of detection (LOD), precision, and accuracy.Theproposedmethod is rapid(8.5min), reproducible (RSD < 2.0%) and achieves satisfactory resolution between SIM and EZT (resolution factor = 2.57). Themean recoveries of the analytes in pharmaceutical preparations were in agreement with those obtained from a reference method,as revealed by statistical analysis of the obtained results using Student’s t-test and the variance ratio F-test.
1. Introduction
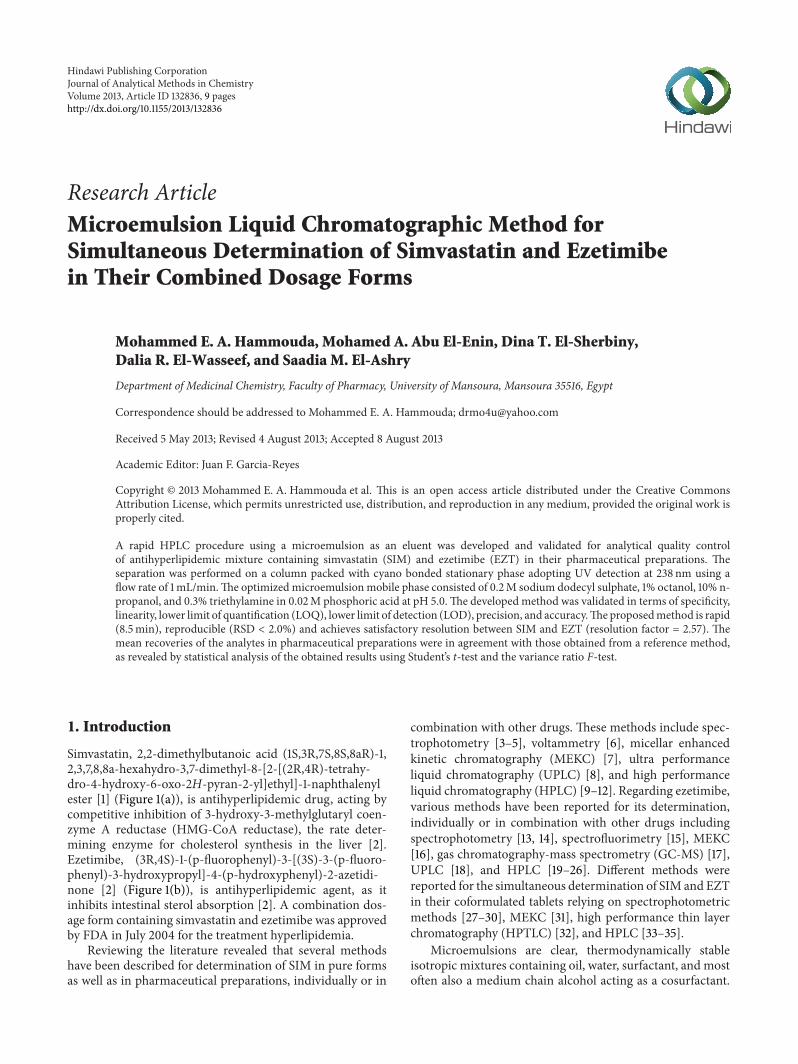
Simvastatin, 2,2-dimethylbutanoic acid (1S,3R,7S,8S,8aR)-1,2,3,7,8,8a-hexahydro-3,7-dimethyl-8-[2-[(2R,4R)-tetrahy-dro-4-hydroxy-6-oxo-2H-pyran-2-yl]ethyl]-1-naphthalenylester [1] (Figure 1(a)), is antihyperlipidemic drug, acting bycompetitive inhibition of 3-hydroxy-3-methylglutaryl coen-zyme A reductase (HMG-CoA reductase), the rate deter-mining enzyme for cholesterol synthesis in the liver [2].Ezetimibe, (3R,4S)-1-(p-fluorophenyl)-3-[(3S)-3-(p-fluoro-phenyl)-3-hydroxypropyl]-4-(p-hydroxyphenyl)-2-azetidi-none [2] (Figure 1(b)), is antihyperlipidemic agent, as itinhibits intestinal sterol absorption [2]. A combination dos-age form containing simvastatin and ezetimibe was approvedby FDA in July 2004 for the treatment hyperlipidemia.
Reviewing the literature revealed that several methodshave been described for determination of SIM in pure formsas well as in pharmaceutical preparations, individually or in
combination with other drugs. These methods include spec-trophotometry [3–5], voltammetry [6], micellar enhancedkinetic chromatography (MEKC) [7], ultra performanceliquid chromatography (UPLC) [8], and high performanceliquid chromatography (HPLC) [9–12]. Regarding ezetimibe,various methods have been reported for its determination,individually or in combination with other drugs includingspectrophotometry [13, 14], spectrofluorimetry [15], MEKC[16], gas chromatography-mass spectrometry (GC-MS) [17],UPLC [18], and HPLC [19–26]. Different methods werereported for the simultaneous determination of SIM and EZTin their coformulated tablets relying on spectrophotometricmethods [27–30], MEKC [31], high performance thin layerchromatography (HPTLC) [32], and HPLC [33–35].
Microemulsions are clear, thermodynamically stableisotropic mixtures containing oil, water, surfactant, and mostoften also a medium chain alcohol acting as a cosurfactant.
2 Journal of Analytical Methods in Chemistry
O
HO O
O
O
Simvastatin
CH3 CH3
H3C
H3C
H3C
(a)
NO
F
F
OH
OH
Ezetimibe
(b)
Figure 1: Structural formula of simvastatin and ezetimibe.
They can be considered as two-phase solvents consisting of amicellar phase surrounded by either an aqueous or an organicphase. The micellar phase may contain either an organicsolvent or an aqueous phase (reversed micelles). Thus, themicroemulsions may either be oil-in-water (o/w) or water-in-oil (w/o) microemulsions [36], where the o/wmicroemul-sions are the preferred for HPLC. The partitioning and theinterfacial adsorption of the analytes in the microheteroge-nous systems are responsible for the separations obtained[36]. In previous reports on microemulsion liquid chro-matography (MELC) [37–48], the potential of application ofmicroemulsions as mobile phases in LC analysis was proven.For SIM,MELCwas reported for its quantitation either in thepresence of impurities [40, 44] or its active metabolite [48].
1.1. The Objective of the Work. SIM and EZT are coformu-lated in medicinally recommended ratios of 2 : 1 and 4 : 1.Analysis of such mixture with strong spectral overlapping ischallenging. Although there are a several methods for theirsimultaneous determination, it was the first time to use themicroemulsion as a new mobile phase developed only in thelast ten years and considered superior to aqueous mobilephase used by all reported methods [32–35], where it offersthree simultaneous partitioning systems. The first systemcomprises microemulsion droplets/bulk of the eluent; thesecond comprises microemulsion droplets/stationary phaseand; the third comprises, bulk of the eluent/stationary phase.
Also it is the first time to use the cyano column as stationaryphase which is adopted for the mixture separation instead ofreversed stationary phase (C
18column) that has been used by
other reported HPLC methods [33–35].The proposed method present simple, rapid (retention
time is 8.5min), sensitive (LOD values were 0.15 and0.17 𝜇g/mL for SIM and EZT, resp.), and efficient methodfor quantitation of the two drugs in their combined tabletdosage form compared with other methods which either;need more retention times “not less than 15–20 minutes”[33–35], and less sensitive [33–35], need complicated pre-caution like programmable detection [34], or finally needsophisticated instrumentation like MEKC [31]. Besides, thespectrophotometric methods [27–30] are less advanced andnot considered a separation techniques.
2. Experimental
2.1. Materials and Reagents. All the chemicals used were ofanalytical grade, and the solvents were of HPLC grade.
(i) Simvastatin and ezetimibe were kindly provided byHikma Pharma S.A.E. (6th of October city, Cairo,Egypt), and both have purity of 99.9%.Theywere usedas received without further purification.
(ii) Alkor 20 plus tablets, batch no. 013 (Hikma PharmaS.A.E., 6th of October city, Cairo, Egypt), were pur-chased from commercial sources, labeled to contain20mg simvastatin and 10mg ezetimibe.
(iii) Alkor 40 plus tablets, batch no. 017 (Hikma PharmaS.A.E., 6th of October city, Cairo, Egypt), were pur-chased from commercial sources, labeled to contain40mg simvastatin and 10mg ezetimibe.
(iv) Sodium dodecyl sulphate (SDS) of 99% purity wasobtained from Park Scientific Limited, Northampton,UK. 1-Propanol, methanol, and diisopropyl ether(HPLC grade) as well as triethylamine (TEA) wereobtained from Riedel-de Haen (Seelze, Germany).1-Butanol and tetrahydrofuran (HPLC grade) wereobtained from Merck (Darmstadt, Germany). 1-Octanol (HPLC grade) was obtained from Aldrich(Gillingham, UK). 1-Butyl acetate was obtained fromFluka (Buchs, Switzerland).Orthophosphoric acid foranalysis was obtained from Prolabo (Paris, France).
2.2. Apparatus. Separation was performed with ShimadzuLC-20A series chromatograph equipped with a 20𝜇L Rheo-dyne injector valve and a SPD-20A UV detector operat-ing at 238 nm (LC workstation, Nishinokyo-Kuwabara-cho,Nakagyo-Ku, Kyoto 604-8511, Japan).
2.3. Columns and Mobile Phases. Separation was achievedon a Shim-pack cyano column (150mm × 4.6mm i.d., 5 𝜇mparticle size 100 A) fromShimadzu.The columnwas operatedat ambient temperature. The components of the microemul-sion were 0.2M SDS, 10% 1-propanol, 1% 1-octanol, and 0.3%TEA in 0.02M phosphoric acid; the pH was adjusted at 5. All
Journal of Analytical Methods in Chemistry 3
1
0.8
0.6
0.4
0.2
0
200 220 240 260 280
Wavelength (nm)
Abso
rban
ce
(a)
(b)
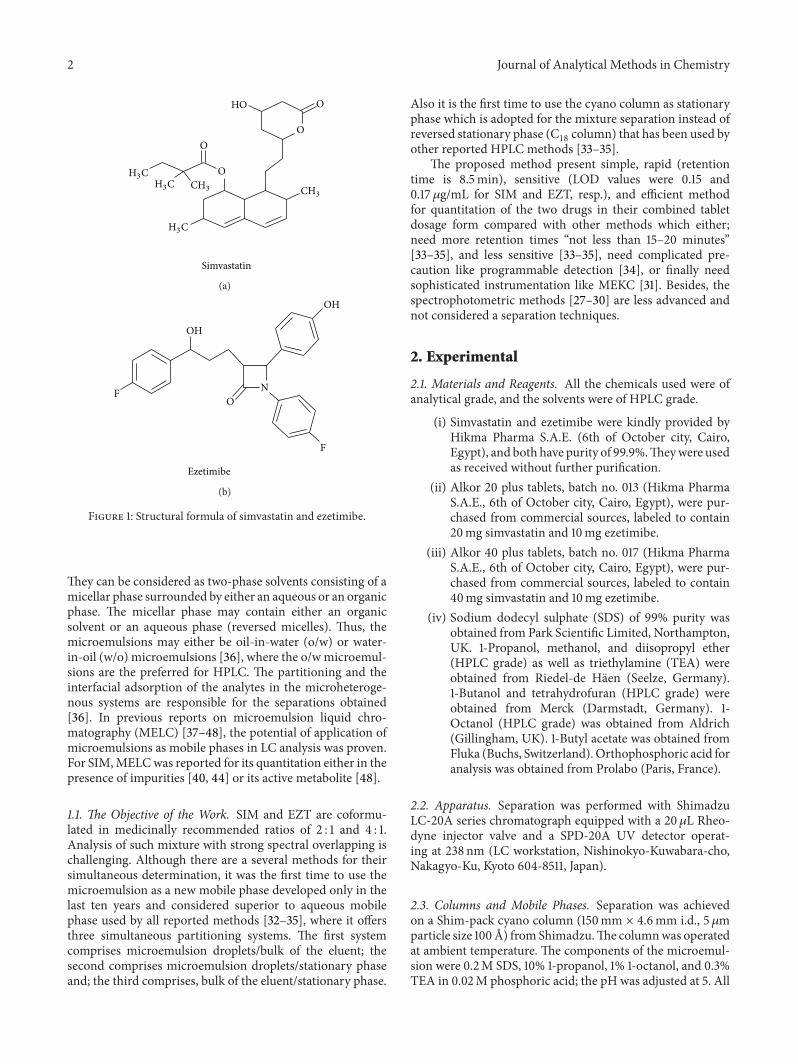
Figure 2: Absorption spectra of 20.0 𝜇g/mL EZT (a) and20.0 𝜇g/mL SIM (b) in methanol.
the microemulsion components were mixed together and thepH was adjusted using TEA. Then, the mixture was treatedon an ultrasonic bath for 30min. The resulting transparentmobile phase was filtered through a 0.45𝜇mmembrane filter(Millipore, Ireland). Microemulsion was stable for at least 2months [38].
2.4. Sample Preparation and Procedures. Stock solutions ofSIM and EZT (100 𝜇g/mL) were prepared in methanol. Thestandard solutions were kept in the refrigerator and werefound to be stable for at least 7 days.
2.4.1. General Procedures and Calibration Graphs. To a setof 10mL volumetric flasks, increasing volumes of the stocksolutions of SIM and EZT were quantitatively transferred soas to give solutions within the concentration range of 0.5–40 and 1–50 𝜇g/mL, respectively, after being diluted to thevolumewith themicroemulsion. Injection into theHPLCwasperformed at ambient temperature (25∘C). Twenty-microliteraliquots were injected (in triplicate), and the calibrationcurves were constructed by plotting the area under the curveagainst the final concentration of both drugs. Alternatively,the corresponding regression equations were derived.
2.4.2. Analysis of the Studied Drugs in Their CoformulatedTablets. Ten Alkor plus tablets were accurately weighed,finely pulverized, and thoroughly mixed. An accuratelyweighed amount of pulverized tablets equivalent to 20.0mgSIM and 10.0mg EZT (according to their pharmaceuticalratio in Alkor 20 plus) and 40.0mg SIM and 10.0mg EZT(according to their pharmaceutical ratio in Alkor 40 plus)was transferred into small conical flask and extracted with 3×30mL of methanol. The extracts were collected then filteredinto 100mL volumetric flask. The conical flask was washedwith few milliliters of methanol. The washings were passedinto the same volumetric flask and completed to the volumewith the same solvent. All samples were filtered through0.45 𝜇m sample filters (RC25, Sartorius AG, Gottingen, Ger-many) prior to injection into theHPLC system. “Thenominal
Det
ecto
r res
pons
e
Time (min)
SIM
EZT
60
50
40
30
20
10
0
−10
0 5 10
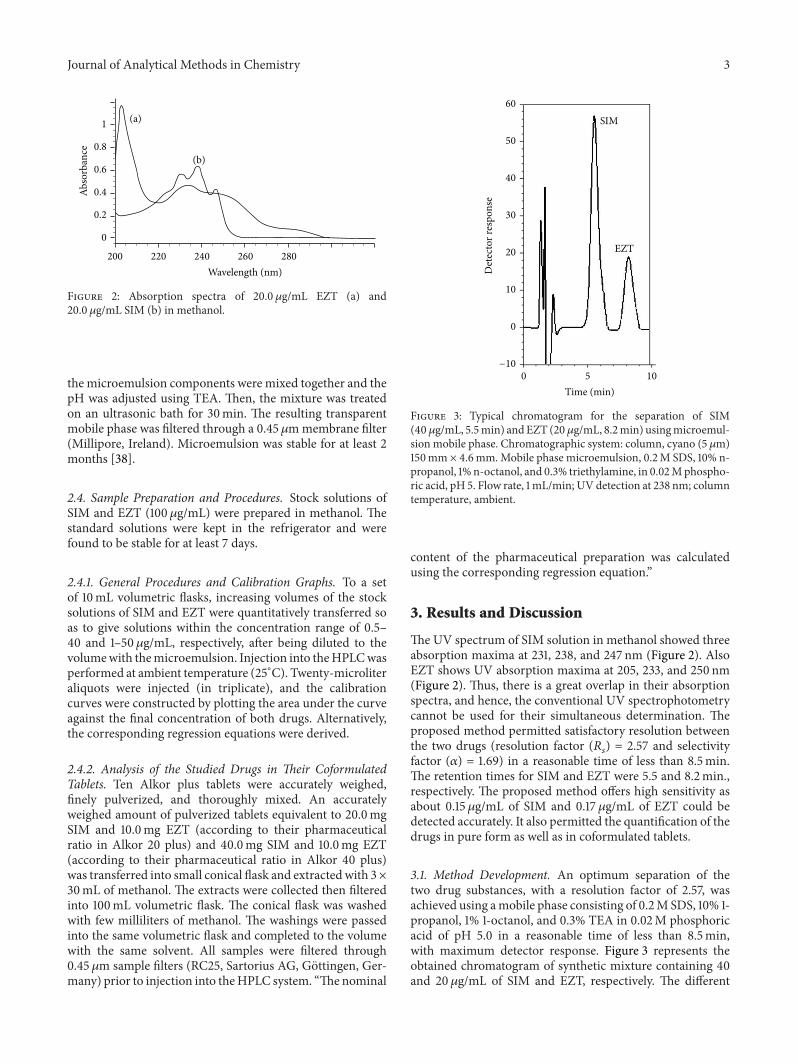
Figure 3: Typical chromatogram for the separation of SIM(40 𝜇g/mL, 5.5min) andEZT (20 𝜇g/mL, 8.2min) usingmicroemul-sion mobile phase. Chromatographic system: column, cyano (5 𝜇m)150mm × 4.6mm.Mobile phase microemulsion, 0.2M SDS, 10% n-propanol, 1%n-octanol, and 0.3% triethylamine, in 0.02Mphospho-ric acid, pH 5. Flow rate, 1mL/min; UV detection at 238 nm; columntemperature, ambient.
content of the pharmaceutical preparation was calculatedusing the corresponding regression equation.”
3. Results and Discussion
TheUV spectrum of SIM solution in methanol showed threeabsorption maxima at 231, 238, and 247 nm (Figure 2). AlsoEZT shows UV absorption maxima at 205, 233, and 250 nm(Figure 2). Thus, there is a great overlap in their absorptionspectra, and hence, the conventional UV spectrophotometrycannot be used for their simultaneous determination. Theproposed method permitted satisfactory resolution betweenthe two drugs (resolution factor (𝑅
𝑠) = 2.57 and selectivity
factor (𝛼) = 1.69) in a reasonable time of less than 8.5min.The retention times for SIM and EZT were 5.5 and 8.2min.,respectively. The proposed method offers high sensitivity asabout 0.15𝜇g/mL of SIM and 0.17 𝜇g/mL of EZT could bedetected accurately. It also permitted the quantification of thedrugs in pure form as well as in coformulated tablets.
3.1. Method Development. An optimum separation of thetwo drug substances, with a resolution factor of 2.57, wasachieved using amobile phase consisting of 0.2M SDS, 10% 1-propanol, 1% 1-octanol, and 0.3% TEA in 0.02M phosphoricacid of pH 5.0 in a reasonable time of less than 8.5min,with maximum detector response. Figure 3 represents theobtained chromatogram of synthetic mixture containing 40and 20𝜇g/mL of SIM and EZT, respectively. The different
4 Journal of Analytical Methods in Chemistry
0.10 0.15 0.20 0.250
1
2
3
4
5
6
7
8
9
10
Concentration of SDS (M)
Rete
ntio
n fa
ctor
10𝜇g/mL SIM10𝜇g/mL EZT
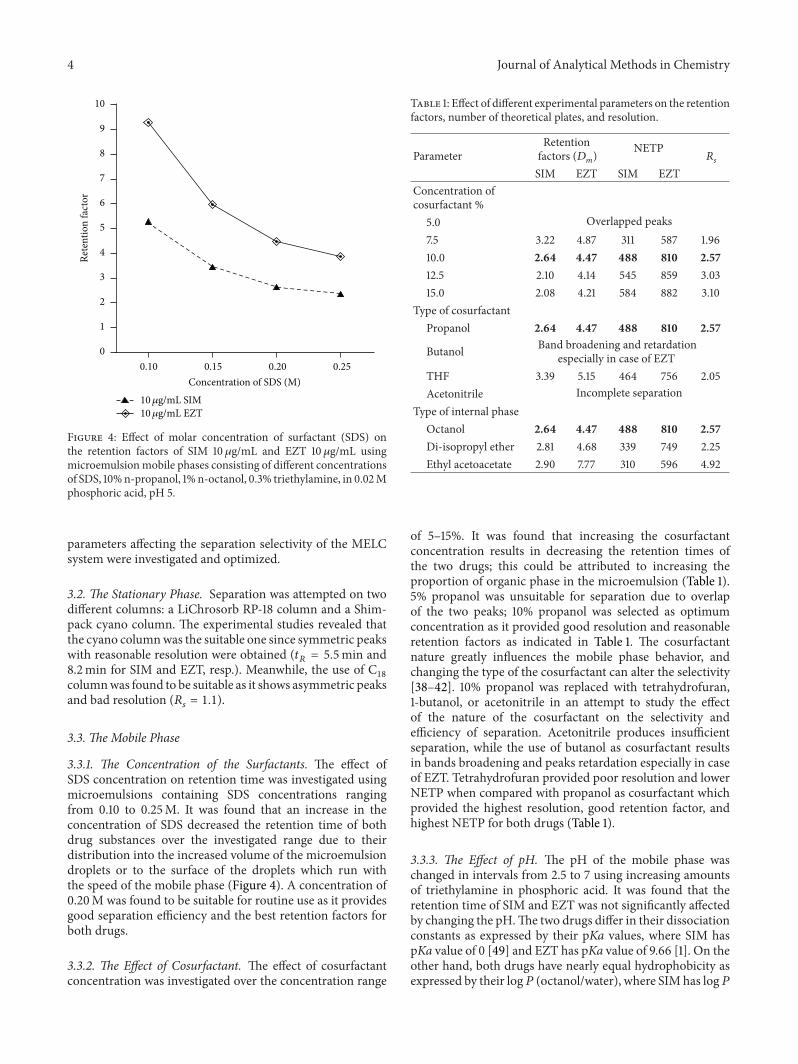
Figure 4: Effect of molar concentration of surfactant (SDS) onthe retention factors of SIM 10 𝜇g/mL and EZT 10 𝜇g/mL usingmicroemulsionmobile phases consisting of different concentrationsof SDS, 10%n-propanol, 1%n-octanol, 0.3% triethylamine, in 0.02Mphosphoric acid, pH 5.
parameters affecting the separation selectivity of the MELCsystem were investigated and optimized.
3.2. The Stationary Phase. Separation was attempted on twodifferent columns: a LiChrosorb RP-18 column and a Shim-pack cyano column. The experimental studies revealed thatthe cyano columnwas the suitable one since symmetric peakswith reasonable resolution were obtained (𝑡
𝑅= 5.5min and
8.2min for SIM and EZT, resp.). Meanwhile, the use of C18
columnwas found to be suitable as it shows asymmetric peaksand bad resolution (𝑅
𝑠= 1.1).
3.3. The Mobile Phase
3.3.1. The Concentration of the Surfactants. The effect ofSDS concentration on retention time was investigated usingmicroemulsions containing SDS concentrations rangingfrom 0.10 to 0.25M. It was found that an increase in theconcentration of SDS decreased the retention time of bothdrug substances over the investigated range due to theirdistribution into the increased volume of the microemulsiondroplets or to the surface of the droplets which run withthe speed of the mobile phase (Figure 4). A concentration of0.20M was found to be suitable for routine use as it providesgood separation efficiency and the best retention factors forboth drugs.
3.3.2. The Effect of Cosurfactant. The effect of cosurfactantconcentration was investigated over the concentration range
Table 1: Effect of different experimental parameters on the retentionfactors, number of theoretical plates, and resolution.
ParameterRetentionfactors (𝐷
𝑚) NETP
𝑅𝑠
SIM EZT SIM EZTConcentration ofcosurfactant %
5.0 Overlapped peaks7.5 3.22 4.87 311 587 1.9610.0 2.64 4.47 488 810 2.5712.5 2.10 4.14 545 859 3.0315.0 2.08 4.21 584 882 3.10
Type of cosurfactantPropanol 2.64 4.47 488 810 2.57
Butanol Band broadening and retardationespecially in case of EZT
THF 3.39 5.15 464 756 2.05Acetonitrile Incomplete separation
Type of internal phaseOctanol 2.64 4.47 488 810 2.57Di-isopropyl ether 2.81 4.68 339 749 2.25Ethyl acetoacetate 2.90 7.77 310 596 4.92
of 5–15%. It was found that increasing the cosurfactantconcentration results in decreasing the retention times ofthe two drugs; this could be attributed to increasing theproportion of organic phase in the microemulsion (Table 1).5% propanol was unsuitable for separation due to overlapof the two peaks; 10% propanol was selected as optimumconcentration as it provided good resolution and reasonableretention factors as indicated in Table 1. The cosurfactantnature greatly influences the mobile phase behavior, andchanging the type of the cosurfactant can alter the selectivity[38–42]. 10% propanol was replaced with tetrahydrofuran,1-butanol, or acetonitrile in an attempt to study the effectof the nature of the cosurfactant on the selectivity andefficiency of separation. Acetonitrile produces insufficientseparation, while the use of butanol as cosurfactant resultsin bands broadening and peaks retardation especially in caseof EZT. Tetrahydrofuran provided poor resolution and lowerNETP when compared with propanol as cosurfactant whichprovided the highest resolution, good retention factor, andhighest NETP for both drugs (Table 1).
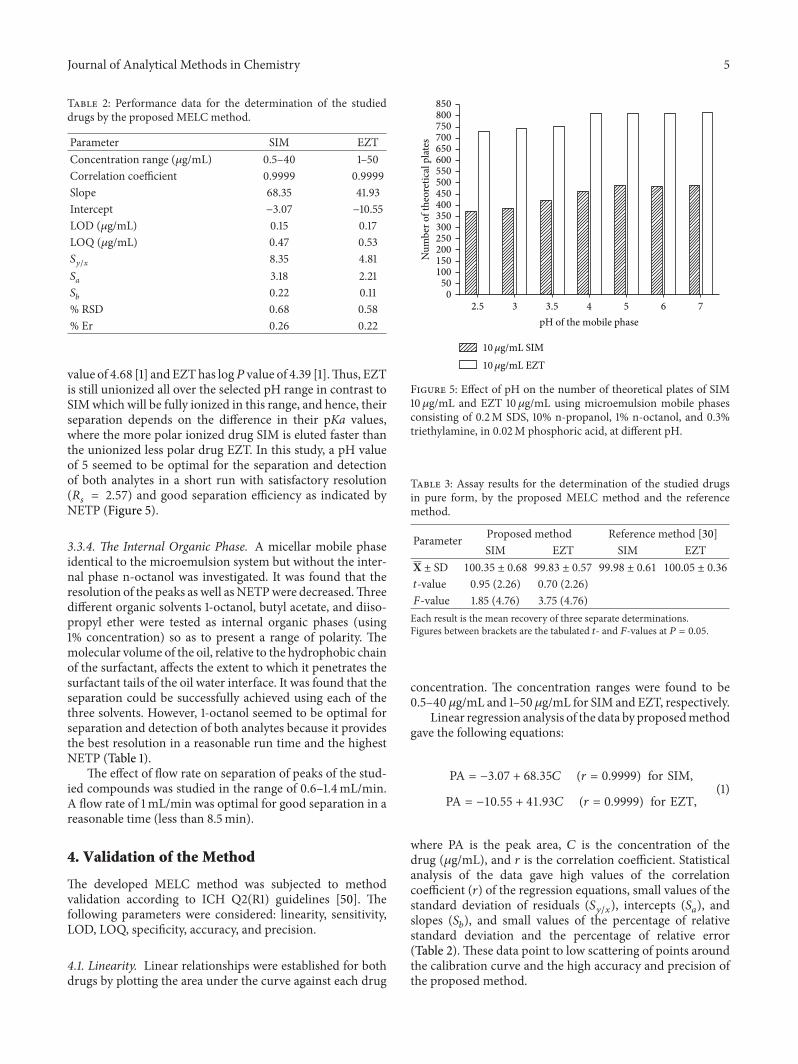
3.3.3. The Effect of pH. The pH of the mobile phase waschanged in intervals from 2.5 to 7 using increasing amountsof triethylamine in phosphoric acid. It was found that theretention time of SIM and EZT was not significantly affectedby changing the pH.The two drugs differ in their dissociationconstants as expressed by their pKa values, where SIM haspKa value of 0 [49] and EZT has pKa value of 9.66 [1]. On theother hand, both drugs have nearly equal hydrophobicity asexpressed by their log𝑃 (octanol/water), where SIMhas log𝑃
Journal of Analytical Methods in Chemistry 5
Table 2: Performance data for the determination of the studieddrugs by the proposed MELC method.
Parameter SIM EZTConcentration range (𝜇g/mL) 0.5–40 1–50Correlation coefficient 0.9999 0.9999Slope 68.35 41.93Intercept −3.07 −10.55LOD (𝜇g/mL) 0.15 0.17LOQ (𝜇g/mL) 0.47 0.53𝑆𝑦/𝑥
8.35 4.81𝑆𝑎
3.18 2.21𝑆𝑏
0.22 0.11% RSD 0.68 0.58% Er 0.26 0.22
value of 4.68 [1] andEZThas log𝑃 value of 4.39 [1].Thus, EZTis still unionized all over the selected pH range in contrast toSIMwhich will be fully ionized in this range, and hence, theirseparation depends on the difference in their pKa values,where the more polar ionized drug SIM is eluted faster thanthe unionized less polar drug EZT. In this study, a pH valueof 5 seemed to be optimal for the separation and detectionof both analytes in a short run with satisfactory resolution(𝑅𝑠= 2.57) and good separation efficiency as indicated by
NETP (Figure 5).
3.3.4. The Internal Organic Phase. A micellar mobile phaseidentical to the microemulsion system but without the inter-nal phase n-octanol was investigated. It was found that theresolution of the peaks as well as NETPwere decreased.Threedifferent organic solvents 1-octanol, butyl acetate, and diiso-propyl ether were tested as internal organic phases (using1% concentration) so as to present a range of polarity. Themolecular volume of the oil, relative to the hydrophobic chainof the surfactant, affects the extent to which it penetrates thesurfactant tails of the oil water interface. It was found that theseparation could be successfully achieved using each of thethree solvents. However, 1-octanol seemed to be optimal forseparation and detection of both analytes because it providesthe best resolution in a reasonable run time and the highestNETP (Table 1).
The effect of flow rate on separation of peaks of the stud-ied compounds was studied in the range of 0.6–1.4mL/min.A flow rate of 1mL/min was optimal for good separation in areasonable time (less than 8.5min).
4. Validation of the Method
The developed MELC method was subjected to methodvalidation according to ICH Q2(R1) guidelines [50]. Thefollowing parameters were considered: linearity, sensitivity,LOD, LOQ, specificity, accuracy, and precision.
4.1. Linearity. Linear relationships were established for bothdrugs by plotting the area under the curve against each drug
2.5 3 3.5 4 5 6 7
Num
ber o
f the
oret
ical
pla
tes
pH of the mobile phase
050100150200250300350
450400
500550600650
750700
800850
10𝜇g/mL SIM10𝜇g/mL EZT
Figure 5: Effect of pH on the number of theoretical plates of SIM10 𝜇g/mL and EZT 10 𝜇g/mL using microemulsion mobile phasesconsisting of 0.2M SDS, 10% n-propanol, 1% n-octanol, and 0.3%triethylamine, in 0.02M phosphoric acid, at different pH.
Table 3: Assay results for the determination of the studied drugsin pure form, by the proposed MELC method and the referencemethod.
Parameter Proposed method Reference method [30]SIM EZT SIM EZT
X ± SD 100.35 ± 0.68 99.83 ± 0.57 99.98 ± 0.61 100.05 ± 0.36𝑡-value 0.95 (2.26) 0.70 (2.26)𝐹-value 1.85 (4.76) 3.75 (4.76)Each result is the mean recovery of three separate determinations.Figures between brackets are the tabulated 𝑡- and 𝐹-values at 𝑃 = 0.05.
concentration. The concentration ranges were found to be0.5–40 𝜇g/mL and 1–50𝜇g/mL for SIM and EZT, respectively.
Linear regression analysis of the data by proposedmethodgave the following equations:
PA = −3.07 + 68.35𝐶 (𝑟 = 0.9999) for SIM,
PA = −10.55 + 41.93𝐶 (𝑟 = 0.9999) for EZT,(1)
where PA is the peak area, 𝐶 is the concentration of thedrug (𝜇g/mL), and 𝑟 is the correlation coefficient. Statisticalanalysis of the data gave high values of the correlationcoefficient (𝑟) of the regression equations, small values of thestandard deviation of residuals (𝑆
𝑦/𝑥), intercepts (𝑆
𝑎), and
slopes (𝑆𝑏), and small values of the percentage of relative
standard deviation and the percentage of relative error(Table 2). These data point to low scattering of points aroundthe calibration curve and the high accuracy and precision ofthe proposed method.
6 Journal of Analytical Methods in Chemistry
Table 4: Accuracy and precision data for the determination of the studied drugs by the proposed MELC method.
SIM concentration (𝜇g/mL) EZT concentration (𝜇g/mL)10.0 20.0 30.0 20.0 30.0 40.0
IntradayX 100.47 100.01 99.70 100.20 99.84 99.63±SD 0.51 0.27 0.62 0.60 0.44 0.57% RSD 0.51 0.27 0.62 0.60 0.44 0.57% Error 0.30 0.16 0.36 0.35 0.25 0.33
InterdayX 100.12 99.97 99.89 100.04 100.08 99.81±SD 0.37 0.30 0.84 0.73 0.58 0.46% RSD 0.37 0.30 0.84 0.73 0.58 0.46% Error 0.21 0.17 0.49 0.42 0.33 0.26
Each result is the mean recovery of three separate determinations.
Table 5: Assay results for the determination of the studied drugs intheir synthetic mixture using the proposed MELC method.
Parameter Proposed method Reference method [30]SIM EZT SIM EZT
X ± SD 99.94 ± 0.55 99.71 ± 0.60 100.18 ± 0.36 99.92 ± 0.35
𝑡-value 0.65 (2.57) 0.55 (2.57)𝐹-value 2.32 (9.55) 2.87 (9.55)Each result is the mean recovery of three separate determinations.Figures between brackets are the tabulated 𝑡- and 𝐹-values at 𝑃 = 0.05.
4.2. Limit of Quantification (LOQ) and Limit of Detection(LOD). LOQ and LOD were calculated according to ICHQ2(R1) recommendations [50] using the following equations:
LOQ = 10𝑆𝑎
𝑏
, LOD = 3.3𝑆𝑎
𝑏
, (2)
where 𝑆𝑎is the standard deviation of the intercept and 𝑏 is the
slope of the calibration curve.LOQ values were found to be 0.47 and 0.53 𝜇g/mL, while
LODvalues were found to be 0.15 and 0.17 𝜇g/mL for SIM andEZT, respectively.
4.3. Accuracy and Precision. To prove the accuracy of theproposed method, the results of the assay of SIM and EZTwere compared with those of the reference method [30].Statistical analysis of the results using Student’s t-test andvariance ratio F-test [51] revealed no significant differencebetween the performance of the two methods regarding theaccuracy and precision, respectively (Table 3). The referencemethod depends on the simultaneous determination of SIMand EZT by ratio derivative spectrophotometric method,where the ratio first-derivative amplitudes were measuredat 242.5 nm (1D
242.5) and 299.5 nm (1D
299.5) for the deter-
mination of SIM and EZT, respectively [30]. The intradayand interday precisions and accuracy of proposed MELCmethod were examined by triplicate analysis of SIM at threedifferent concentrations of 10.0, 20.0, and 30.0 𝜇g/mL and
EZT at 20.0, 30.0, and 40.0 𝜇g/mL in one day and for threeconsecutive days. The precision of the proposed method wassatisfactory, as indicated by the low values of SD and RS; alsothe low values of % Er indicate good accuracy of the method(Table 4).
4.4. Specificity. Thespecificity of themethodwas investigatedby observing any interference encountered from the presenceof common tablet excipients that are present in coformu-lated tablets, including butylated hydroxyanisole, citric acidmonohydrate, croscarmellose sodium, hypromellose, lactosemonohydrate, magnesium stearate, microcrystalline cellu-lose, and propyl gallate. These excipients did not interferewith the proposed method.
4.5. Applications
4.5.1. Analysis of SIM/EZT in Synthetic Mixtures and Cofor-mulated Tablets. The proposed method was applied to thesimultaneous determination of SIM and EZT in syntheticmixtures in the medicinally recommended ratios of 2 : 1 and4 : 1. Furthermore, the proposed method was successfullyapplied for their determination in coformulated tablets inthe same ratios. The results shown in Tables 5 and 6 arein good agreement with those obtained using the referencemethod [30]. Statistical analysis of the results obtained usingStudent’s t-test and variance ratio F-test [51] revealed nosignificant difference between the performance of the twomethods regarding the accuracy and precision, respectively.
5. Conclusion
A new reliable and specific HPLC method for the simulta-neous determination of SIM and EZT in pure form and syn-theticmixture aswell as in pharmaceutical preparations usingmicroemulsion as mobile phase with UV detection has beendeveloped. The method has a short turnover time (8.5min),and the LOD and RSD values are sufficiently good for theapplicability of this method for quality control laboratorieswith HPLC availability. Moreover, microemulsion mobile
Journal of Analytical Methods in Chemistry 7
Table 6: Assay results for the determination of the studied drugs in their coformulated tablets using the proposed MELC method.
Parameter Proposed MELC method Reference method [30]SIM EZT SIM EZT
Alkor 20 plus tabletsX ± SD 99.73 ± 0.19 99.69 ± 0.74 99.94 ± 0.43 100.04 ± 0.50
𝑡-value 0.76 (2.78) 0.69 (2.78)𝐹-value 5.35 (19.00) 2.18 (19.00)
Alkor 40 plus tabletsX ± SD 99.85 ± 0.26 99.92 ± 0.79 99.74 ± 0.42 99.66 ± 0.48
𝑡-value 0.41 (2.78) 0.49 (2.78)𝐹-value 2.69 (19.00) 2.73 (19.00)
Each result is the mean recovery of three separate determinations.Figures between brackets are the tabulated 𝑡- and 𝐹-values at 𝑃 = 0.05.
phase provided an additional advantage over aqueous mobilephase, where it offers alternative partitioning mechanismsdue to the presence of surfactant and oil droplets.
Conflict of Interests
None of the authors have direct financial relation with thetrademarks mentioned in this paper, so they have no conflictof interests.
References
[1] A. C. Moffat, M. D. Osselton, B. Widdop, and L. Y. Galichet,Eds.,Clarke’s Analysis of Drugs and Poisons,The PharmaceuticalPress, London, UK, 4th edition, 2011.
[2] S. C. Sweetman, Ed.,Martindale: The Complete Drug Reference,The Pharmaceutical Press, London, UK, 35th edition, 2007.
[3] M. M. Sharaf El-Din, K. A. Attia, M. W. Nassar, and M.M. Kaddah, “Colorimetric determination of simvastatin andlovastatin in pure form and in pharmaceutical formulations,”Spectrochimica Acta A, vol. 76, no. 3-4, pp. 423–428, 2010.
[4] N. Erk, “Rapid spectrophotometric method for quantitativedetermination of simvastatin and fluvastatin in human serumand pharmaceutical formulations,” Die Pharmazie, vol. 57, no.12, pp. 817–819, 2002.
[5] L. Wang and M. Asgharnejad, “Second-derivative UV spectro-metric determination of simvastatin in its tablet dosage form,”Journal of Pharmaceutical and Biomedical Analysis, vol. 21, no.6, pp. 1243–1248, 2000.
[6] O. Coruh and S. A. Ozkan, “Determination of the antihyper-lipidemic simvastatin by various voltammetric techniques intablets and serum samples,” Die Pharmazie, vol. 61, no. 4, pp.285–290, 2006.
[7] M. K. Srinivasu, A. N. Raju, and G. O. Reddy, “Determinationof lovastatin and simvastatin in pharmaceutical dosage formsby MEKC,” Journal of Pharmaceutical and Biomedical Analysis,vol. 29, no. 4, pp. 715–721, 2002.
[8] L. Novakova, H. Vlckova, D. Satınsky et al., “Ultra high per-formance liquid chromatography tandem mass spectrometricdetection in clinical analysis of simvastatin and atorvastatin,”Journal of Chromatography B, vol. 877, no. 22, pp. 2093–2103,2009.
[9] T. D. Silva, M. A. Oliveira, R. B. de Oliveira, and C. D. Vianna-Soares, “Development and validation of a simple and fastHPLC method for determination of lovastatin, pravastatin and
simvastatin,” Journal of Chromatographic Science, vol. 50, no. 9,pp. 831–838, 2012.
[10] L. Burugula, R. Mullangi, N. R. Pilli, A. Makula, D. S. Lodagala,and R. Kandhagatla, “Simultaneous determination of sitagliptinand simvastatin in human plasma by LC-MS/MS and itsapplication to a human pharmacokinetic study,” BiomedicalChromatography, vol. 27, no. 1, pp. 80–87, 2013.
[11] N. R. Pilli, R. Mullangi, J. K. Inamadugu, I. K. Nallapati,and J. V. Rao, “Simultaneous determination of simvastatin,lovastatin and niacin in human plasma by LC-MS/MS andits application to a human pharmacokinetic study,” BiomedicalChromatography, vol. 26, no. 4, pp. 476–484, 2012.
[12] J. Zhang, R. Rodila, E. Gage et al., “High-throughput salting-out assisted liquid/liquid extraction with acetonitrile for thesimultaneous determination of simvastatin and simvastatinacid in human plasma with liquid chromatography,” AnalyticaChimica Acta, vol. 661, no. 2, pp. 167–172, 2010.
[13] M. Sharma, D. V. Mhaske, M. Mahadik, S. S. Kadam, and S.R. Dhaneshwar, “UV and three derivative spectrophotometricmethods for determination of ezetimibe in tablet formulation,”Indian Journal of Pharmaceutical Sciences, vol. 70, no. 2, pp. 258–260, 2008.
[14] M. Imran, R. S. Singh, and S. Chandran, “Stability indicatingultraviolet spectroscopic method for the estimation of ezetim-ibe and carvedilol,” Die Pharmazie, vol. 61, no. 9, pp. 766–769,2006.
[15] N. A. Alarfaj and F. A. Aly, “Micelle-enhanced spectrofluori-metric method for determination of cholesterol-reducing drugezetimibe in dosage forms,” Journal of Fluorescence, vol. 22, no.1, pp. 9–15, 2012.
[16] S. L. Dalmora, P. R. Oliveira, T. Barth, and V. Todeschini,“Development and validation of a stability-indicating micellarelectrokinetic chromatography method for the determinationof ezetimibe in pharmaceutical formulations,” Analytical Sci-ences, vol. 24, no. 4, pp. 499–503, 2008.
[17] E. Ucakturk, N. Ozaltin, and B. Kaya, “Quantitative analysisof ezetimibe in human plasma by gas chromatography-massspectrometry,” Journal of Separation Science, vol. 32, no. 11, pp.1868–1874, 2009.
[18] A. Goel, S. Baboota, J. K. Sahni et al., “Development andvalidation of stability-indicating assay method by UPLC for afixed dose combination of atorvastatin and ezetimibe,” Journalof Chromatographic Science, vol. 51, no. 3, pp. 222–228, 2012.
[19] A. Ajmera, S. Deshpande, P. Patel, K. Patel, S. Solanki, andK. Rathod, “Reverse phase high performance liquid chromato-graphic (HPLC) method for simultaneous determination ofatorvastatin, ezetimibe and fenofibrate in commercial tablets,”
8 Journal of Analytical Methods in Chemistry
International Journal of Pharmacy and Pharmaceutical Sciences,vol. 4, no. 1, pp. 206–209, 2012.
[20] A. Patel, C. Macwana, V. Parmar, and S. Patel, “Simultaneousdetermination of atorvastatin calcium, ezetimibe, and fenofi-brate in a tablet formulation by HPLC,” Journal of AOACInternational, vol. 95, no. 2, pp. 419–423, 2012.
[21] S. J. Varghese and T. K. Ravi, “Determination of rosuvas-tatin and ezetimibe in a combined tablet dosage form usinghigh-performance column liquid chromatography and high-performance thin-layer chromatography,” Journal of AOACInternational, vol. 93, no. 4, pp. 1222–1227, 2010.
[22] B. G. Chaudhari, N. M. Patel, P. B. Shah, L. J. Patel, and V.P. Patel, “Stability-indicating reversed-phase liquid chromato-graphic method for simultaneous determination of atorvastatinand ezetimibe from their combination drug products,” Journalof AOAC International, vol. 90, no. 6, pp. 1539–1546, 2007.
[23] S. J. Basha, S. A. Naveed, N. K. Tiwari et al., “Concurrentdetermination of ezetimibe and its phase-I and IImetabolites byHPLCwith UV detection: quantitative application to various invitrometabolic stability studies and for qualitative estimation inbile,” Journal of Chromatography B, vol. 853, no. 1-2, pp. 88–96,2007.
[24] S. Singh, B. Singh, R. Bahuguna, L. Wadhwa, and R. Saxena,“Stress degradation studies on ezetimibe and development of avalidated stability-indicating HPLC assay,” Journal of Pharma-ceutical and Biomedical Analysis, vol. 41, no. 3, pp. 1037–1040,2006.
[25] S. Li, G. Liu, J. Jia, X. Li, and C. Yu, “Liquid chromatography-negative ion electrospray tandem mass spectrometry methodfor the quantification of ezetimibe in human plasma,” Journalof Pharmaceutical and Biomedical Analysis, vol. 40, no. 4, pp.987–992, 2006.
[26] R. Sistla, V. S. Tata, Y. V. Kashyap, D. Chandrasekar, andP. V. Diwan, “Development and validation of a reversed-phase HPLC method for the determination of ezetimibe inpharmaceutical dosage forms,” Journal of Pharmaceutical andBiomedical Analysis, vol. 39, no. 3-4, pp. 517–522, 2005.
[27] V. B. Mane, S. Babar, and N. Kulkarni, “Development of UVspectrophotometric method for the simultaneous estimationof simvastatine and ezetimibe in tablet dosage form by simul-taneous equation and absorbance ratio method,” InternationalJournal of PharmTech Research, vol. 3, no. 3, pp. 1459–1466, 2011.
[28] H. M. Lotfy, A. M. Aboul Alamein, and M. A. M. Hegazy,“Quantitative analysis of the cholesterol-lowering drugs eze-timibe and simvastatin in pure powder, binary mixtures, anda combined dosage form by spectrophotometry, chemometry,and high-performance column liquid chromatography,” Journalof AOAC International, vol. 93, no. 6, pp. 1844–1855, 2010.
[29] S. Balaji and A. Sunitha, “Development and validation ofspectrophotometeric method for simultaneous determinationof simvastatin and ezetimibe in tablet formulations,” PakistanJournal of Pharmaceutical Sciences, vol. 23, no. 4, pp. 375–378,2010.
[30] H. M. Maher, R. M. Youssef, E. M. Hassan, E. I. El-Kimary, andM. A. Barary, “Enhanced spectrophotometric determinationof two antihyperlipidemic mixtures containing ezetimibe inpharmaceutical preparations,”Drug Testing and Analysis, vol. 3,no. 2, pp. 97–105, 2011.
[31] I. M. Palabiyik, F. Onur, C. Yardimci, and N. Ozaltin, “Simul-taneous spectrophotometric determination of ezetimibe andsimvastatin in pharmaceutical preparations using chemometrictechniques,” Quımica Nova, vol. 31, no. 5, pp. 1121–1124, 2008.
[32] B. Shrestha, B. Stephenrathinaraj, S. S. Patel, N. K. Verma, andR.Mazumder, “SimultaneousHPTLC estimation of simvastatinand ezetimibe in tablet dosage form,” E-Journal of Chemistry,vol. 7, no. 4, pp. 1206–1211, 2010.
[33] B. S. Rathinaraj, S. V. Kumar, S. Sudharshini, B. Thirupathy,and G. Vaagdevi, “Quantitative analysis of simvastatin andezetimibe of drugs in combined dosage forms by HPLC,”International Journal of Pharma and Bio Sciences, vol. 1, no. 2,pp. 1–7, 2010.
[34] R. P. Dixit, C. R. Barhate, S. G. Padhye, C. L. Viswanathan, andM. S. Nagarsenker, “Stability indicating RP-HPLC method forsimultaneous determination of simvastatin and ezetimibe fromtablet dosage form,” Indian Journal of Pharmaceutical Sciences,vol. 72, no. 2, pp. 204–210, 2010.
[35] P. R. Oliveira, T. Barth, V. Todeschini, and S. L. Dalmora,“Simultaneous liquid chromatographic determination of eze-timibe and simvastatin in pharmaceutical products,” Journal ofAOAC International, vol. 90, no. 6, pp. 1566–1572, 2007.
[36] E. W. Kaler and S. Prager, “A model of dynamic scattering bymicroemulsions,” Journal of Colloid and Interface Science, vol.86, no. 2, pp. 359–369, 1982.
[37] S. Torres Cartas, M. C. Garcıa Alvarez-Coque, and R. M.Villanueva Camanas, “Determination of anabolic steroids inpharmaceuticals by liquid chromatography with a microemul-sion of sodium dodecyl sulfate and pentanol as mobile phase,”Analytica Chimica Acta, vol. 302, no. 2-3, pp. 163–172, 1995.
[38] D. T.M. El-Sherbiny, S.M. El-Ashry,M. A.Mustafa, A. A.-E. El-Emam, and S. H. Hansen, “Evaluation of the use of microemul-sions as eluents in high-performance liquid chromatography,”Journal of Separation Science, vol. 26, no. 6-7, pp. 503–509, 2003.
[39] A. Marsh, B. Clark, and K. Altria, “Oil-in-water microemulsionhigh performance liquid chromatographic analysis of pharma-ceuticals,”Chromatographia, vol. 59, no. 9-10, pp. 531–542, 2004.
[40] A. Malenovic, D. Ivanovic, M. Medenica, B. Jancic, and S.Markovic, “Retention modelling in liquid chromatographicseparation of simvastatin and six impurities using amicroemul-sion as eluent,” Journal of Separation Science, vol. 27, no. 13, pp.1087–1092, 2004.
[41] D. T. El-Sherbiny, M. I. Eid, D. R. El-Wasseef, R. M. Al-Ashan,and F. Belal, “Analysis of flunarizine in the presence of some ofits degradation products using micellar liquid chromatography(MLC) or microemulsion liquid chromatography (MELC)—application to dosage forms,” Journal of Separation Science, vol.28, no. 2, pp. 197–202, 2005.
[42] B. Jancic, D. Ivanovic, M. Medenica, A. Malenovic, andN. Dimkovic, “Development of liquid chromatographicmethod for fosinoprilat determination in human plasma usingmicroemulsion as eluent,” Journal of Chromatography A, vol.1088, no. 1-2, pp. 187–192, 2005.
[43] B. Jancic, M. Medenica, D. Ivanovic, A. Malenovic, and S.Markovic, “Microemulsion liquid chromatographic method forcharacterisation of fosinopril sodium and fosinoprilat separa-tion with chemometrical support,” Analytical and BioanalyticalChemistry, vol. 383, no. 4, pp. 687–694, 2005.
[44] A. Malenovic, M. Medenica, D. Ivanovic, and B. Jancic, “Moni-toring of simvastatin impurities by HPLC with microemulsioneluents,” Chromatographia, vol. 63, no. 13, pp. S95–S100, 2006.
[45] D. T. El-Sherbiny, N. El-Enany, F. F. Belal, and S. H. Hansen,“Simultaneous determination of loratadine and desloratadinein pharmaceutical preparations using liquid chromatographywith a microemulsion as eluent,” Journal of Pharmaceutical andBiomedical Analysis, vol. 43, no. 4, pp. 1236–1242, 2007.
Journal of Analytical Methods in Chemistry 9
[46] M. I.Walash, F. Belal, N. El-Enany, andA.Abdelal, “Microemul-sion liquid chromatographic determination of nicardipinehydrochloride in pharmaceutical preparations and biologicalfluids. Application to stability studies,” Journal of Liquid Chro-matography and Related Technologies, vol. 30, no. 8, pp. 1015–1034, 2007.
[47] E. McEvoy, S. Donegan, J. Power, and K. Altria, “Optimisationand validation of a rapid and efficient microemulsion liquidchromatographic (MELC) method for the determination ofparacetamol (acetaminophen) content in a suppository formu-lation,” Journal of Pharmaceutical and Biomedical Analysis, vol.44, no. 1, pp. 137–143, 2007.
[48] A. Malenovic, B. Jancic-Stojanovic, M. Medenica, and D.Ivanovic, “Microemulsion liquid chromatographic screening ofsimvastatin and its active metabolite in human plasma,” ActaChromatographica, vol. 20, no. 4, pp. 595–607, 2008.
[49] 2012, http://www.DrugBank.com/Simvastatin(DB00641).htm.[50] ICH Harmonized Tripartite Guideline, “Validation of Analyti-
cal Procedures,” Text andMethodology, Q2(R1), Current Step 4Version, Parent Guidelines on Methodology Dated November6 1996, Incorporated in November 2005.
[51] J. N. Miller and J. C. B. Miller, Statistics and Chemometrics forAnalytical Chemistry, Pearson Education Limited, Harlow, UK,5th edition, 2005.

Submit your manuscripts athttp://www.hindawi.com
Hindawi Publishing Corporationhttp://www.hindawi.com Volume 2014
Inorganic ChemistryInternational Journal of
Hindawi Publishing Corporation http://www.hindawi.com Volume 2014
International Journal ofPhotoenergy
Hindawi Publishing Corporationhttp://www.hindawi.com Volume 2014
Carbohydrate Chemistry
International Journal of
Hindawi Publishing Corporationhttp://www.hindawi.com Volume 2014
Journal of
Chemistry
Hindawi Publishing Corporationhttp://www.hindawi.com Volume 2014
Advances in
Physical Chemistry
Hindawi Publishing Corporationhttp://www.hindawi.com
Analytical Methods in Chemistry
Journal of
Volume 2014
Bioinorganic Chemistry and ApplicationsHindawi Publishing Corporationhttp://www.hindawi.com Volume 2014
SpectroscopyInternational Journal of
Hindawi Publishing Corporationhttp://www.hindawi.com Volume 2014
The Scientific World JournalHindawi Publishing Corporation http://www.hindawi.com Volume 2014
Medicinal ChemistryInternational Journal of
Hindawi Publishing Corporationhttp://www.hindawi.com Volume 2014
Chromatography Research International
Hindawi Publishing Corporationhttp://www.hindawi.com Volume 2014
Applied ChemistryJournal of
Hindawi Publishing Corporationhttp://www.hindawi.com Volume 2014
Hindawi Publishing Corporationhttp://www.hindawi.com Volume 2014
Theoretical ChemistryJournal of
Hindawi Publishing Corporationhttp://www.hindawi.com Volume 2014
Journal of
Spectroscopy
Analytical ChemistryInternational Journal of
Hindawi Publishing Corporationhttp://www.hindawi.com Volume 2014
Journal of
Hindawi Publishing Corporationhttp://www.hindawi.com Volume 2014
Quantum Chemistry
Hindawi Publishing Corporationhttp://www.hindawi.com Volume 2014
Organic Chemistry International
ElectrochemistryInternational Journal of
Hindawi Publishing Corporation http://www.hindawi.com Volume 2014
Hindawi Publishing Corporationhttp://www.hindawi.com Volume 2014
CatalystsJournal of