Centrifugal Partition Chromatographic (CPC) Technology: Application for Natural Product Isolation

HAL Id: hal-02130025https://hal.archives-ouvertes.fr/hal-02130025
Submitted on 15 May 2019
HAL is a multi-disciplinary open accessarchive for the deposit and dissemination of sci-entific research documents, whether they are pub-lished or not. The documents may come fromteaching and research institutions in France orabroad, or from public or private research centers.
L’archive ouverte pluridisciplinaire HAL, estdestinée au dépôt et à la diffusion de documentsscientifiques de niveau recherche, publiés ou non,émanant des établissements d’enseignement et derecherche français ou étrangers, des laboratoirespublics ou privés.
Liquid chromatographic isolation of individualcarbohydrates from environmental matrices for stable
carbon analysis and radiocarbon datingAmel Nouara, Christos Panagiotopoulos, Jérôme Balesdent, Kalliopi Violaki,
Édouard Bard, Yoann Fagault, Daniel James Repeta, Richard Sempere
To cite this version:Amel Nouara, Christos Panagiotopoulos, Jérôme Balesdent, Kalliopi Violaki, Édouard Bard, et al..Liquid chromatographic isolation of individual carbohydrates from environmental matrices for stablecarbon analysis and radiocarbon dating. Analytica Chimica Acta, Elsevier Masson, 2019, 1067, pp.137-146. �10.1016/j.aca.2019.03.028�. �hal-02130025�
Liquid chromatographic isolation of individual carbohydrates from 1
environmental matrices for stable carbon analysis and radiocarbon 2
dating 3
4
Amel Nouara1, Christos Panagiotopoulos1*, Jérôme Balesdent2, Kalliopi Violaki1, 5
Edouard Bard2, Yoann Fagault2, Daniel James Repeta3, Richard Sempéré1 6
7
8
1Aix Marseille Univ. ulon, CNRS, IRD, MIO UM 110, 13288, 9
Marseille, France 10
11
2Aix Marseille Univ., CNRS, Collège de France, IRD, INRA, CEREGE UM34, 13545 12
Aix-en-Provence, France 13
14
3Department of Marine Chemistry and Geochemistry, Woods Hole Oceanographic 15
Institution, Woods Hole, MA 02543, USA 16
17
*Corresponding author. Phone: +33 4 86 09 05 26 18
E-mail : [email protected] 19
Revised version 20
February 27, 2019 21
22

2
23
Abstract 24
Carbohydrates are among the most abundant organic molecules in both aquatic and 25
terrestrial ecosystems; however, very few studies have addressed their isotopic signature 26
using compound-specific isotope analysis, which provides additional information on 27
their origin (δ13
C) and fate (14
C). In this study, semi-preparative liquid 28
chromatography with refractive index detection (HPLC-RI) was employed to produce 29
pure carbohydrate targets for subsequent offline δ13
C and 14
C isotopic analysis. δ13
C 30
analysis was performed by elemental analyzer-isotope ratio mass spectrometer 31
(EA-IRMS) whereas 14
C analysis was performed by an innovative measurement 32
procedure based on the direct combustion of the isolated fractions using an elemental 33
analyzer coupled to the gas source of a mini carbon dating system (AixMICADAS). In 34
general, four successive purifications with Na+, Ca
2+, Pb
2+, and Ca
2+ cation-exchange
35
columns were sufficient to produce pure carbohydrates. These carbohydrates were 36
subsequently identified using mass spectrometry by comparing their mass spectra with 37
those of authentic standards. 38
The applicability of the proposed method was tested on two different environmental 39
samples comprising marine particulate organic matter (POM) and total suspended 40
atmospheric particles (TSP). The obtained results revealed that for the marine POM 41
3
sample, the δ13
C values of the individual carbohydrates ranged from −18.5 to −16.8‰ 42
except for levoglucosan and mannosan, which presented values of −27.2 a −26.2‰, 43
respectively. For the TSP sample, the δ13
C values a g f m −26.4 −25.0‰. The 44
galactose and glucose 14
C values were 19 and 43‰ p c ly, for the POM sample. 45
On the other hand, the levoglucosan a ca b alu wa 33‰ f h SP ampl . 46
These results suggest that these carbohydrates exhibit a modern age in both of these 47
samples. Radiocarbon HPLC collection window blanks, measured after the addition of 48
phthalic acid (14
C free blank), ranged from −988 to −986‰ f h ab mentioned 49
compounds, indicating a very small background isotopic influence from the whole 50
purification procedure. Overall, the proposed method does not require derivatization 51
steps, produces extremely low blanks, and may be applied to different types of 52
environmental samples. 53
54
55
Keywords: Semi-preparative liquid chromatography; carbohydrates purification; 56
carbohydrate-specific 13
C and 14
C analysis; EA-IRMS; EA-AixMICADAS 57
58
1. Introduction 59
Carbohydrates are among the most ubiquitous organic molecules and have been 60
recorded in all geochemical systems, including terrestrial [1,2], marine [3,4], and 61
atmospheric organic matter [5,6]. Although previous investigations have provided a 62
wealth of information on their concentrations and distributions in all geochemical 63
systems [7–11], very less is known about their sources and fate, which have not been 64
thoroughly studied using carbon isotopes. Such information, obtained from carbon 65

4
isotope examination at the molecular level, may help trace the origin of the different 66
components of organic matter and explain its reactivity during long-range transport 67
[12]. 68
Bulk carbon isotope analysis generally reflects the average of the isotopic 69
composition of the whole panel of organic molecules inside the sample [13–18]. Further 70
extraction of the sample with acids or organic solvents produces “purified” fractions 71
(e.g. sugar- or lipid-like fractions) and aids in the determination of the isotopic 72
composition of the hydrophilic and hydrophobic components of the sample [18–20]. For 73
example, previous studies on dissolved organic matter (DOM) have reported 13C 74
values for carbohydrate-like fractions in the ranges −29 to −25‰ in river estuaries [21] 75
and −21.5 to −20.3‰ h Atlantic and Pacific Oceans [22]. These 13C values are 76
typical for terrestrial and marine ecosystems, respectively. Moreover, the reported 14
C 77
values for carbohydrate-like fractions in marine high molecular weight DOM showed a 78
wide range of values spanning from 7 to −406‰, further implying that the age of 79
carbohydrates spans from modern to very old (4180 yr BP) [22]. However, the bulk 80
isotope analysis approach does not completely address the isotopic diversity of the 81
individual molecules inside the sample. 82
In contrast with bulk isotope analysis, the compound-specific isotope analysis 83
(CSIA) of the individual sugars offers valuable information on the origin (13C) and 84
age (14
C) of the single molecules [23–27]. The CSIA technique is not a new approach; 85
however, it requires high analytical skills for the purification and extraction of 86
individual molecules from the sample. This step is crucial and might strongly affect the 87
results. The two most commonly employed techniques for the stable carbon isotope 88
analysis of carbohydrates are gas and liquid chromatography coupled with isotope ratio 89
mass spectrometry (GC-IRMS and LC-IRMS, respectively). Since carbohydrates are 90

5
not volatile, derivatization steps (silylation or alditol acetate derivatization) are required 91
for GC-IRMS analysis. This further necessitates carbon corrections on the carbohydrate 92
isotopic signatures [23,28–30]. Another disadvantage of the GC-IRMS technique is that 93
two different monosaccharides (e.g. glucose and fructose) can produce the same alditol 94
(e.g. glucitol) during the reduction step of the derivatization procedure, thereby causing 95
a loss of compositional information [31]. 96
LC-IRMS is a good alternative to GC-IRMS because it does not require any 97
derivatization steps [30,32–34]. However, this technique does not target all the sugar 98
components of the sample; for example, neutral sugars, amino sugars, alditols, and 99
anhydrosugars cannot be separated in a single run [35,36]. Moreover, both the GC-100
IRMS and LC-IRMS techniques cannot be used for 14
C determination on single 101
carbohydrates due to their low sensitivity toward the 14
C isotope. To date, very few 102
radiocarbon data exist on single carbohydrates comprising neutral sugars, alditols, and 103
anhydrosugars. Alditols and anhydrosugars are important tracers of terrestrial 104
vegetation [37,38] and burning biomass processes [39], respectively. Thus, their 105
isotopic study may help to evaluate their long-range transport from land to sea and more 106
importantly, to assess their reactivity in long time scales (fate) in the marine 107
environment. Although a significant amount of work was done on the compound- 108
specific radiocarbon analysis of individual lipids over the past 20 years [40–43] and 109
more recently, on amino acids [44], a well-established technique for single carbohydrate 110
purification from environmental samples for subsequent radiocarbon measurements has 111
not been reported to date. 112
An interesting approach to produce pure carbohydrate targets for δ13
C and 14
C 113
analysis is the use of semi-preparative high-performance liquid chromatography with 114
refractive index detection (HPLC-RI) on cation-exchange columns. Pure carbohydrates 115
6
can be analyzed by an elemental analyzer–isotope ratio mass spectrometer (EA-IRMS) 116
for δ13
C and/or an accelerated mass spectrometer for 14
C analysis. HPLC-RI is a 117
simple and well-established method for carbohydrate analysis; however, in 118
environmental studies, it has been less explored [27,45] than traditional GC-MS or 119
high-performance anion-exchange chromatography with pulsed amperometric detection 120
(HPAEC-PAD) techniques [5,8,10,11,31,46,47]. 121
This study employs HPLC-RI to demonstrate that four successive purifications on 122
Na+, Ca
2+, Pb
2+, and Ca
2+ cation-exchange columns are sufficient to produce pure 123
carbohydrates for compound-specific carbon isotope determination. In previous 124
investigations, the isolated fractions were measured after combustion in evacuated 125
quartz tubes and the produced CO2 was purified on vacuum lines. This was followed by 126
graphitization for solid measurements or transfer in glass ampoules for gas 127
measurements. On the other hand, this study employs an alternative procedure [48] 128
based on the direct combustion of isolated fractions using an elemental analyzer 129
coupled to the gas source of a mini carbon dating system (AixMICADAS) for 14
C 130
analysis. Compared to the time-consuming vacuum line method, this procedure is 131
la ly fa a ca b a ap f ampl ma ≤10 g C with moderate precision. 132
The applicability of the method was tested on two different environmental samples, 133
namely marine particulate organic matter (POM) and total suspended atmospheric 134
particles (TSP). 135
2. Materials and Methods 136
2.1. Chemicals and reagents 137
All the carbohydrate standards used in this study were purchased from 138
Sigma-Aldrich or Interchim at the purest available grade (>98%). The standard stock 139
7
solutions of the individual (1 mM) and a mixture of 14 monosaccharides (glucose, 140
galactose, mannose, fucose, rhamnose, arabinose, xylose, fructose, xylitol, sorbitol, 141
mannitol, levoglucosan, mannosan, and galactosan, 1 mM and 50 µM each) were 142
prepared by dilution with ultrapure water. The prepared solutions were stored in the 143
a k a ‒15 °C until use. HCl (37%, Sigma-Aldrich), diluted with ultrapure water (final 144
concentration of 1 M), was used for sample hydrolysis. The ultrapure water used in this 145
work was produced by a Millipore Milli-Q system (Molsheim, France). 146
2.2. Sampling and carbohydrate extraction 147
2.2.1. Marine POM 148
Sinking particles (marine POM) were collected over seven-day periods from January 149
6th to March 3th, 2013, in the upwelling system located offshore Lima (Peru) in the 150
Pacific Ocean (12° 02’ S - 77° 40’ W), using sediment traps (PPS3, Technicap) 151
deployed in the oxycline/upper oxygen minimum zone (OMZ) layer at a depth of 34 m 152
[49]. To avoid POM bio-degradation, a solution of seawater with 5% formaldehyde was 153
added to the bottom of the collection chamber. After trap recovery, the living and dead 154
swimmers were carefully removed so that only detrital particles remained in the sample. 155
These detrital particles (marine POM) were stored in the dark at 4 °C in the initial 156
chambers used in the PPS3. On land, the samples were filtered through 25 mm 157
pre-combusted (450 °C, 6 h) Whatman GF/F filters (nominal retention size, 0.7 µm), 158
freeze-dried, and subsequently stored in the dark at 4 °C until further analysis. The 159
ga c ca b (OC) c f h pa cl wa h a g 20‒29%. To obtain 160
uff c ma al f p c a aly f p (40‒60 mg ach) f each of the 161
five samples obtained from the respective collection chambers of the sediment trap were 162
pooled together. This resulted in ~265 mg dry POM powder which was hydrolyzed with 163
1 M HCl at 100 °C for 20 h [50]. The acid-soluble fraction recovered after 164

8
centrifugation (2000 rpm) was then transferred into a pre-combusted (450 °C, 6 h) glass 165
vial and the acid was removed from the sample by three successive lyophilizations. The 166
afforded dry powder was weighed (25.61 mg), redissolved in 1 mL ultrapure water and 167
filtered through a Pasteur pipette packed with quartz wool (both pre-combusted at 450 168
°C for 6 h) to remove any remaining particles prior to chromatographic injection. 169
2.2.2. TSP 170
The aerosol sample was collected on a pre-combusted (450 °C, 6 h) weighed 171
Whatman quartz fiber filter (20.3 cm × 25.4 cm) using an automatic sampler (Tisch 172
Environmental USA; flow rate 85 m3 h
‒1). The sample was collected from the 10th to 173
17th March, 2016, from the rooftop of the Endoume marine station (Marseille; 43° 16' 174
N - 5° 21' E). After collection, the sample was dried for 24 h in a desiccator, weighed, 175
and then stored in a freezer at ‒25 °C in pre-combusted aluminum foil (450 °C, 6 h). 176
Three portions (17.34 cm2 each) of the filter were extracted with 18 mL ultrapure water 177
in an ultrasonic bath for 1 h and then filtered through a Pasteur pipette packed with 178
quartz wool (both pre-combusted at 450 ˚C for 6 h) to remove any remaining particles 179
[5]. Finally, the sample was freeze-dried and stored in a freezer at ‒35 °C until 180
chromatographic injection. 181
2.3. Chromatography 182
The carbohydrates were analyzed using an HPLC system (Thermo Scientific 183
UltiMate 3000) equipped with a vacuum degasser and a 100-µL loop auto-injector. The 184
carbohydrates were detected with a refractive index detector (Shodex RI-101) and 185
eluted in isocratic mode with ultrapure water, which was previously degassed with high 186
purity N2 for 30 min. 187
Three cation-exchange analytical columns packed with a polymeric resin (sulfonated 188
polystyrene-divinyl benzene) were used to purify the carbohydrates (Table S.1). The 189

9
first column (Na+: 4% cross-linked Na
+; 200 × 10 mm, 12 µm; REZEX™ 190
RNO-Oligosaccharide; Phenomenex) was used to separate the oligosaccharides from 191
the monosaccharides after acid hydrolysis. The column temperature was set at 85 °C 192
and the carbohydrates were eluted with ultrapure water at a flow rate of 0.3 mL min‒1
. 193
The second column (Ca2+
: 8% cross-linked Ca2+
; 300 × 7.8 mm, 9 µm; REZEX™ 194
RCM-Monosaccharide; Phenomenex) was used to separate the neutral sugars from 195
sugar alcohols and anhydrosugars. The column temperature was maintained at 85 °C 196
throughout the analysis at a flow rate of 0.6 mL min‒1
. The third column (Pb2+
: 8% 197
cross-linked resin Pb2+
; 300 × 7.8 mm, 8 µm; REZEX™ RPM-Monosaccharide; 198
Phenomenex) was used to further separate the monosaccharides at 75 °C and a flow rate 199
of 0.6 mL min‒1
. The injected samples never exceeded 10 mg/injection and the columns 200
were cleaned at the end of each day by washing overnight with ultrapure water at a flow 201
rate of 0.1 mL min‒1
. The carbohydrate fractions and/or individual monosaccharides 202
were collected by an automatic Foxy R1 fraction collector (Teledyne ISCO, USA) 203
placed after the RI detector. The system was controlled via Chromeleon 204
chromatography software (Thermofisher). 205
The detection limit of the HPLC-RI system was ~1 µM at a signal-to-noise ratio 206
(S/N) of three for all the carbohydrates on the three tested columns; this was in 207
agreement with previous results reported in the literature [51]. The precision of the 208
method was evaluated by calculating the relative standard deviation (RSD%) for six 209
replicate HPLC-RI injections of the standard mixture of the 14 carbohydrates at the 5 210
µM level. The RSD was <10% for the peak area and <1% for the retention time for all 211
the columns tested. Additional details on the system optimization are included in the 212
supplementary information (section S1 and Fig. S1). 213
2.4. Isotopic measurements 214
10
2.4.1. EA-IRMS 215
Prior to EA-IRMS processing, the samples were acidified with HCl (final 216
concentration, 0.01 M) to avoid any errors related to the isotopic signature of inorganic 217
carbon mainly from atmospheric CO2 absorbed in the sample [52]. The samples were 218
placed in a tin capsule (5 mm × 9 mm; light; Santis) and dried under a N2 stream. The 219
stable carbon isotope composition and the carbon content of the purified carbohydrates 220
were measured using an elemental analyzer (Flash EA 1500; Thermo Finnigan, 221
Germany) coupled with an isotope ratio mass spectrometer (IRMS Deltaplus
, Thermo 222
Finnigan, Germany). Briefly, this technique measures the 13
C/12
C ratio of total carbon of 223
the dried sample as follows: in a continuous helium flow, the sample is oxidized at 1000 224
°C in the presence of O2 and catalysts; the resulting CO2 is separated from the other 225
combustion products and transferred by the helium flow to a gas source, magnetic 226
sector, triple collector mass spectrometer. The latter determines the 13
C/12
C ratio of 227
CO2-carbon. The stable carbon isotope composition is conventionally expressed as δ13
C 228
values according to the formula: 229
where VPDB is the Vienna Pee Dee Belemnite standard. 230
International Atomic Energy Agency (IAEA)-CH-7 polyethylene (δ13C = −32.2‰) 231
and IAEA-CH-6 sucrose were used as the calibration standard and control, respectively 232
[53]. The latter yielded a mean value of −10.5‰. The δ13
C and carbon content of the 233
samples were corrected for the contribution of carbon in the tin capsules. The δ13
C 234
standard deviations were determined from replicated measurements of the IAEA-CH-6 235
standard and were ± 0.2‰ ± 0.2‰ ± 0.4‰ and ± 0.7‰ f samples containing 20, 10, 236
11
5, and 2 µg C, respectively. The precision on the carbon content (precision on the 237
absolute amount of carbon analyzed) was ± 0.1 µg C. 238
2.4.2. EA-AixMICADAS 239
Direct radiocarbon measurement of the CO2 gas was carried out, after combustion, 240
using an elemental analyzer (EA) coupled to the gas interface system (GIS) of the 241
AixMICADAS system [48]. Briefly, the main characteristic of the EA is that it works 242
with a combustion tube filled with tungsten oxide heated to 1050 °C to allow the 243
introduction of silver boats containing the sample material. The purified extracts were 244
recovered in ultrapure water without acidification, transferred into silver capsules (4 245
mm × 8 mm, Elemental Microanalysis Ltd), and dried at 80 °C on a hotplate under a N2 246
stream. The silver capsules were baked at 800 °C for 3 h prior to use to eliminate any 247
organic contamination [54,55]. The CO2 produced by the EA is captured in the zeolite 248
trap inside the GIS. The CO2 is then released by heating the zeolite trap to 450 °C and is 249
mixed inside the syringe with a helium flow in order to obtain 5% CO2 in the gas 250
mixture, which is sputtered into the ion source. The CO2 is injected from the GIS into 251
the ion source through a small fused silica capillary continuously fed by the syringe, 252
which is driven by a stepping motor controlled by the GIS software. A carbon flow of 253
2.80 μg C min−1
keeps the total pressure constant inside the syringe (filled to 1300 254
mbar), allowing the ion source to produce stable currents. The tuning procedure and 255
main operation parameters used in the gas configurations are described in the literature 256
[48]. The measurements were normalized with the oxalic acid 2 standard (~100 g C; 257
OxA2 SRM 4990 C, National Institute of Standards and Technology) and corrected for 258
blanks using phthalic anhydride acid (F14
C = 0.0027; n = 3) prepared from the same 259
protocol as that used for OxA2 (i.e. silver capsules measured by EA-GIS). 260
12
The samples were blank corrected with procedural blanks of the same size (section 261
3.3) and a conservative uncertainty of 30% of the blank value was propagated in the 262
final error calculation. The samples were in the size range 50‒150 g C, which 263
translates to a precision of ~1% for a modern sample. However, samples down to 10 g 264
C could be measured with less precision. The accuracy of 14
C measurements of small 265
samples (< 100 µg C) with the gas ion source of AixMICADAS has been tested with 266
numerous measurements on various standards (NIST 4990C, IAEA-C1, IAEA-C2, in-267
house carbonate standards) [54,55]. For example, the analysis of oxalic acid NIST 268
4990C was replicated 132 times over 2.5 years, giving an average F14
C of 1.3403 and a 269
a a a (SD) f 0.0078 ( . . 6‰). h a hm c m a a a c a 270
error (std error = 0.0007) are compatible with the weighted mean (1.3405) and the 271
weighted error (0.0008), and closely agree with the NIST reference value of 1.3407 ± 272
0.0005. 273
The 14C a aly w p a ∆
14C corrected for decay [56,57] according to the 274
formula: 275
where ASN is the normalized sample activity, AON is the normalized standard activity, 276
x is the year of formation or growth, and λC = (1/8267) yr‒1
. 277
2.5. Identification of purified monosaccharides 278
The identification of the isolated purified monosaccharides was checked with Liquid 279
Chromatography coupled with Time-of-Flight Mass Spectrometry (LC-Q-TOF-MS) 280
Agilent 6500 system. The chromatographic separation was performed with a Luna 281
HILIC c lum (100 mm × 2.00 mm I.D. 3 μm pa cl z ; Ph m x). h m b l 282
phase was ultrapure water with 13 mM CH3COONH4 (A) and acetonitrile (LC-MS 283

13
grade) with 13 mM CH3COONH4 (B) and sugars were eluted isocratically (20% A and 284
80% B). h fl w a a h c lum mp a u w a 200 μL min−1
and 25 ºC, 285
respectively for the whole run. Monosaccharides were injected without prior 286
derivatization and ionized in the ESI positive mode. The main ion source parameters 287
were optimized as follows: source temperature 350 ºC, sheath gas temperature 350 ºC, 288
gas flow 11 L min−1
, and drying gas at 8 L min−1
. The MS scan was 50 – 1700 m/z, and 289
the scan rate was 1 spectra s−1
. The capillary voltage and the nozzle voltage were set at 290
4000 V and 500 V, respectively. Samples and standards were diluted in acetonitrile 291
before injection. 292
3. Results and discussion 293
3.1. Cation-exchange column selection and purification procedure 294
Cation-exchange chromatography allows the separation of poly-, oligo-, and 295
monosaccharides based on their degree of polymerization [45,58]. The chromatographic 296
resolution and selectivity can be modulated by changing the cation-exchange column. 297
The separation mechanism is based on the strength of the complex formed between the 298
hydroxyl groups of the carbohydrate and the metal (e.g. K+, Na
+, Pb
2+, Ca
2+, Cd
2+, and 299
Cu2+
). 300
In this study, Na+, Ca
2+, and Pb
2+ columns were selected for optimum purification of 301
the set of studied carbohydrates. The Na+ column is ideal to separate polysaccharides 302
from oligosaccharides and monosaccharides, whereas the Ca2+
and Pb2+
columns 303
provide further and complementary separation among the different monosaccharides 304
(e.g. neutral monosaccharides, alditols, anhydrosugars; Fig. 1 a-c). Compared to NH2- 305
columns (also employed for sugar preparative chromatography), Na+, Ca
2+, and Pb
2+ 306
columns have the advantage of running with ultrapure water as eluent instead of 307
acetonitrile. This considerably reduces the organic carbon contamination delivered by 308
14
the eluent, while ultrapure water is easily removed by evaporation with a minimum 309
organic carbon background left behind. 310
Because carbohydrates in environmental samples can also be polymers 311
(polysaccharides and oligosaccharides) and acid hydrolysis is not always 100% 312
effective [59], an initial purification on a Na+ column was necessary to separate the 313
polymers from the monosaccharides [60]. The next step was the sequential purification 314
of the monosaccharides on the Ca2+
, Pb2+
and again, when necessary, on the Ca2+
315
columns. This provided further and complementary separation among the different 316
monosaccharides (e.g. neutral monosaccharides, alditols, anhydrosugars; Fig. 1 b-c) 317
[61]. In summary the purification procedure flowchart proposed in this study is: Na+ → 318
Ca2+→ Pb
2+→ Ca
2+. 319
15
320
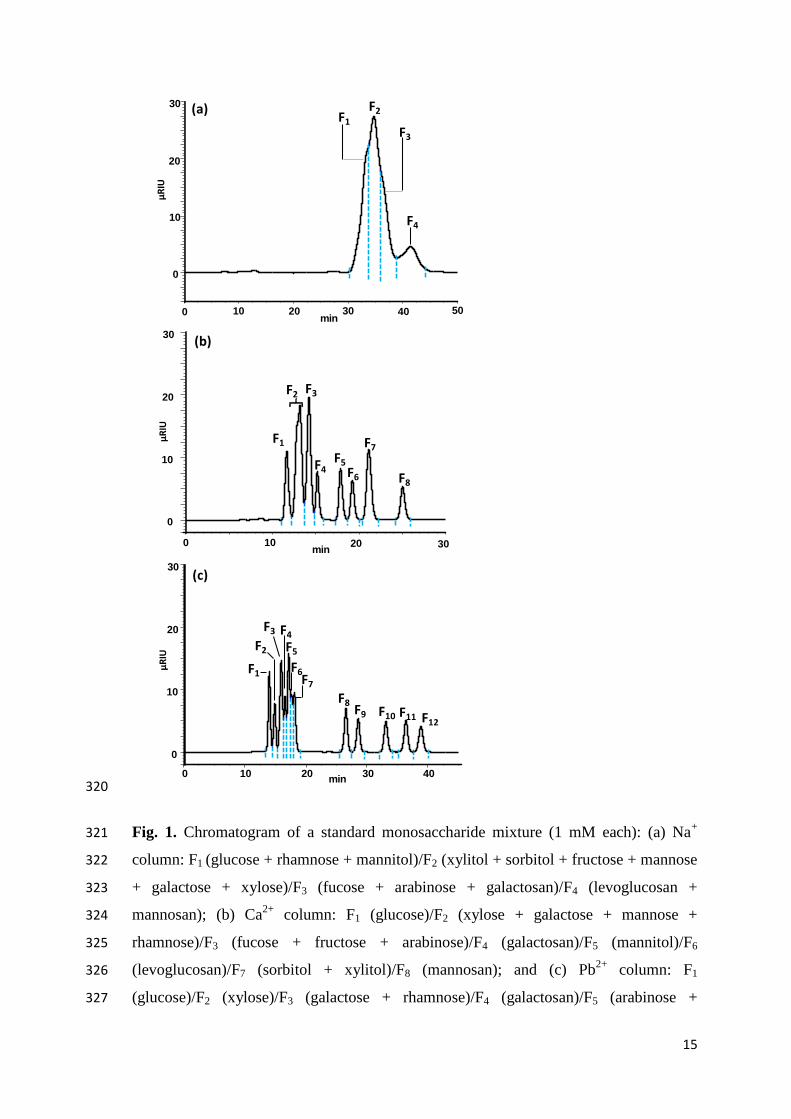
Fig. 1. Chromatogram of a standard monosaccharide mixture (1 mM each): (a) Na+ 321
column: F1 (glucose + rhamnose + mannitol)/F2 (xylitol + sorbitol + fructose + mannose 322
+ galactose + xylose)/F3 (fucose + arabinose + galactosan)/F4 (levoglucosan + 323
mannosan); (b) Ca2+
column: F1 (glucose)/F2 (xylose + galactose + mannose + 324
rhamnose)/F3 (fucose + fructose + arabinose)/F4 (galactosan)/F5 (mannitol)/F6 325
(levoglucosan)/F7 (sorbitol + xylitol)/F8 (mannosan); and (c) Pb2+
column: F1 326
(glucose)/F2 (xylose)/F3 (galactose + rhamnose)/F4 (galactosan)/F5 (arabinose + 327
0 10 20 30 40
0
10
20
30
min
F1
F2
F3 F4F5F6F7
F8F9 F10 F11 F12
(c)
(b)
0
10
20
30
F1
F2 F3
F4F5F6
F7
F8
0 10 20 30min
µRIU
min
0
10
20
30
F1F2
F3
F4
0 10 20 30 40 50
(a)
µRIU
µRIU
16
fucose)/F6 (mannose)/F7 (fructose)/F8 (mannitol)/F9 (levoglucosan)/F10 (xylitol)/F11 328
(sorbitol)/F12 (mannosan). Dashed vertical lines correspond to the duration of the eluted 329
compound(s) and were used as the starting and ending points of peak collection by the 330
fraction collector. 331
332
3.2. Monosaccharide standards purification and recovery yields 333
The analytical procedure flowchart established in the previous section was tested on 334
monosaccharide standards (neutral monosaccharides, alditols, and anhydrosugars; initial 335
concentration of 50 µM) to evaluate the separation and peak isolation of the single 336
monosaccharides. The monosaccharide standards were sequentially purified on Ca2+
and 337
Pb2+
columns and if necessary, again on a Ca2+
column. Note that for the purpose of this 338
exercise the Na+ column was not included because the polysaccharides and 339
oligosaccharides were not considered in the standard (section 3.1). 340
The first separation was achieved on a Ca2+
column (Fig. S2 a) and resulted in eight 341
peaks corresponding to fractions F1–F8, which were collected into 6 mL pre-combusted 342
(450 °C, 6 h) glass tubes. The obtained results indicated that at this stage of the 343
purification process only the F8 fraction (e.g. mannosan) was pure because it was eluted 344
significantly after the other monosaccharides (Fig. S2 a). Therefore, this 345
monosaccharide was not purified further. The collected fractions F1–F7 were freeze 346
dried, redissolved into 300 µL ultrapure water, and injected individually into the Pb2+
347
column (Fig. S2 b). It is worth noting that fractions in the time periods between the two 348
adjacent peaks were also collected and their purity was checked after injection into the 349
Pb2+
column. The monosaccharide(s), if any, obtained in such a way was (were) further 350
pooled with fraction(s) that contained the same monosaccharide to increase its recovery. 351
Following the second purification, 10 peaks were obtained corresponding to fractions 352

17
F1–F10. The last purification was performed on a Ca2+
column to ensure the collection of 353
ultrapure monosaccharide targets (Fig. S2 c). 354
The obtained results revealed that the recovery yields after three successive 355
purifications (Ca2+→ Pb
2+ → Ca
2+) of the standard mixture ranged from 12.38 ± 0.01% 356
to 36.32 ± 0.02% (n = 3), with the highest values observed for glucose, mannosan, 357
levoglucosan, and mannitol and the lowest for arabinose (Table S2). Notably, for 358
environmental sample analysis (section 3.5), the monosaccharides xylose, fucose, and 359
rhamnose were also included in the standard (in total 14 monosaccharides) despite the 360
fact that their recovery yield was not estimated via this exercise. 361
3.3. Chromatographic system blanks and background isotopic signature 362
The blanks were run on the HPLC-RI system with ultrapure water and the amount of 363
carbon released from the chromatographic columns (column bleeding) and isotopic 364
signature were evaluated (Table 1). Column blanks were recorded during the whole run 365
for each column: 50 min for the Na+ column, 30 min for the Ca
2+ column, and 45 min 366
for the Pb2+
column. Subsequently, the amount of carbon released from these three 367
columns was measured via EA-IRMS. The obtained values were significantly close for 368
the Ca2+
and Pb2+
columns (4.84 ± 0.25 and 2.80 ± 0.21 µg, respectively), while those of 369
the Na+ column were much higher (28.64 ± 1.57 µg). Despite these differences, all the 370
blanks resulted in a similar δ13
C signature ranging from −28.4 ± 0.4 to −27.8 ± 0.4‰ 371
(Table 1). 372
The next step was to estimate the total carbon release after sequential purification on 373
the Na+→ Ca
2+→ Pb
2+→ Ca
2+ columns. The obtained results indicated that the 374
purification procedure produced a blank that contained 19.76 ± 1.80 µg carbon (Table 375
1) with a δ13
C value of −27.9 ± 1.1‰; these results were similar to those observed for 376
each column. Blanks corresponding to the collection time window of the three 377

18
monosaccharides (glucose, galactose, and levoglucosan) after Na+ → Ca
2+→ Pb
2+→ 378
Ca2+
purification were also run. The respective carbon inputs and the δ13
C signatures 379
after Na+ → Ca
2+→ Pb
2+→ Ca
2+ purification were 0.58 ± 0.004 µg a −24.4 ± 2.9 ‰ 380
for glucose a 0.54 ± 0.15 µg a −26.7 ± 1.5‰ f l gluc a ( abl 1). 381
Because of the elevated cost of radiocarbon analysis, radiocarbon blanks were only 382
run for the collection time trap of the three monosaccharides (glucose, galactose and 383
levoglucosan) measured in this study. Moreover, as the amount of carbon delivered for 384
the whole purification procedure (Na+ → Ca
2+→ Pb
2+→ Ca
2+ columns) for each of the 385
these monosaccharides was too small for a reliable 14
C measurement, phthalic acid 386
(14
C free blank sample) was added to the final collected blank and the sample was 387
processed as the monosaccharide sample (i.e. transferred into Ag capsules with 388
ultrapure water and combusted by the EA coupled to the gas interface of 389
AixMICADAS). The amount of phthalic acid was adjusted according to the size of the 390
sample to correct for constant contamination offsets. The results revealed that the 391
radiocarbon blanks exhibited values ranging from −988 to −986‰ ( abl 1). 392
These 14
C values are slightly higher than those observed for the phthalic acid 393
samples ( −997‰) m a u c ly af a to the silver capsules (i.e. without 394
any transfer from the collection tube to the silver cups). This suggests that little 395
exogenous carbon was added to the sample from HPLC purification (column bleeding 396
and organic residues), glassware contamination (collection vials, Pasteur pipets) and 397
airborne particle deposition during sample collection and transfer. Moreover, the 14
C 398
alu (−989.7 ± 3.5‰) and carbon amounts (0.52 ± 0.34 µg C) of the ultrapure water 399
samples (10 mL corresponding to ~10 times the volume of the collection window of a 400
pure monosaccharide) indicated that the addition of exogenous carbon from the eluent 401
was also negligible. 402
19
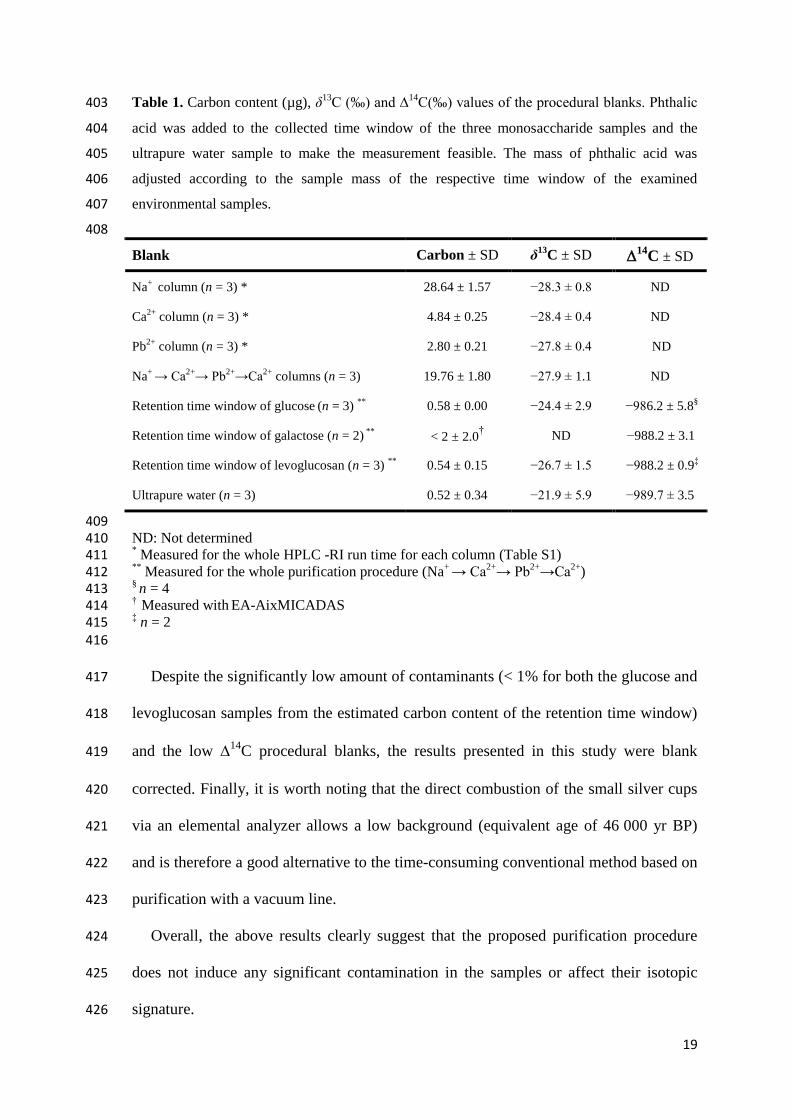
Table 1. Carbon content (µg), δ13C (‰) a
14C(‰) alu f h p c u al bla k . Ph hal c 403
acid was added to the collected time window of the three monosaccharide samples and the 404
ultrapure water sample to make the measurement feasible. The mass of phthalic acid was 405
adjusted according to the sample mass of the respective time window of the examined 406
environmental samples. 407
408
Blank Carbon ± SD δ13
C ± SD 14
C ± SD
Na+
column (n = 3) * 28.64 ± 1.57 −28.3 ± 0.8 ND
Ca2+
column (n = 3) * 4.84 ± 0.25 −28.4 ± 0.4 ND
Pb2+
column (n = 3) * 2.80 ± 0.21 −27.8 ± 0.4 ND
Na+ → Ca
2+→ Pb
2+→Ca
2+ columns (n = 3) 19.76 ± 1.80 −27.9 ± 1.1 ND
Retention time window of glucose (n = 3)
** 0.58 ± 0.00 −24.4 ± 2.9 −986.2 ± 5.8
§
Retention time window of galactose (n = 2) **
< 2 ± 2.0† ND
−988.2 ± 3.1
Retention time window of levoglucosan (n = 3) **
0.54 ± 0.15 −26.7 ± 1.5 −988.2 ± 0.9‡
Ultrapure water (n = 3) 0.52 ± 0.34 −21.9 ± 5.9 −989.7 ± 3.5
409 ND: Not determined 410 * Measured for the whole HPLC -RI run time for each column (Table S1) 411
** Measured for the whole purification procedure (Na
+ → Ca
2+→ Pb
2+→Ca
2+) 412
§ n = 4 413
† Measured with
EA-AixMICADAS 414
‡ n = 2 415
416
Despite the significantly low amount of contaminants (< 1% for both the glucose and 417
levoglucosan samples from the estimated carbon content of the retention time window) 418
and the low 14
C procedural blanks, the results presented in this study were blank 419
corrected. Finally, it is worth noting that the direct combustion of the small silver cups 420
via an elemental analyzer allows a low background (equivalent age of 46 000 yr BP) 421
and is therefore a good alternative to the time-consuming conventional method based on 422
purification with a vacuum line. 423
Overall, the above results clearly suggest that the proposed purification procedure 424
does not induce any significant contamination in the samples or affect their isotopic 425
signature. 426
20
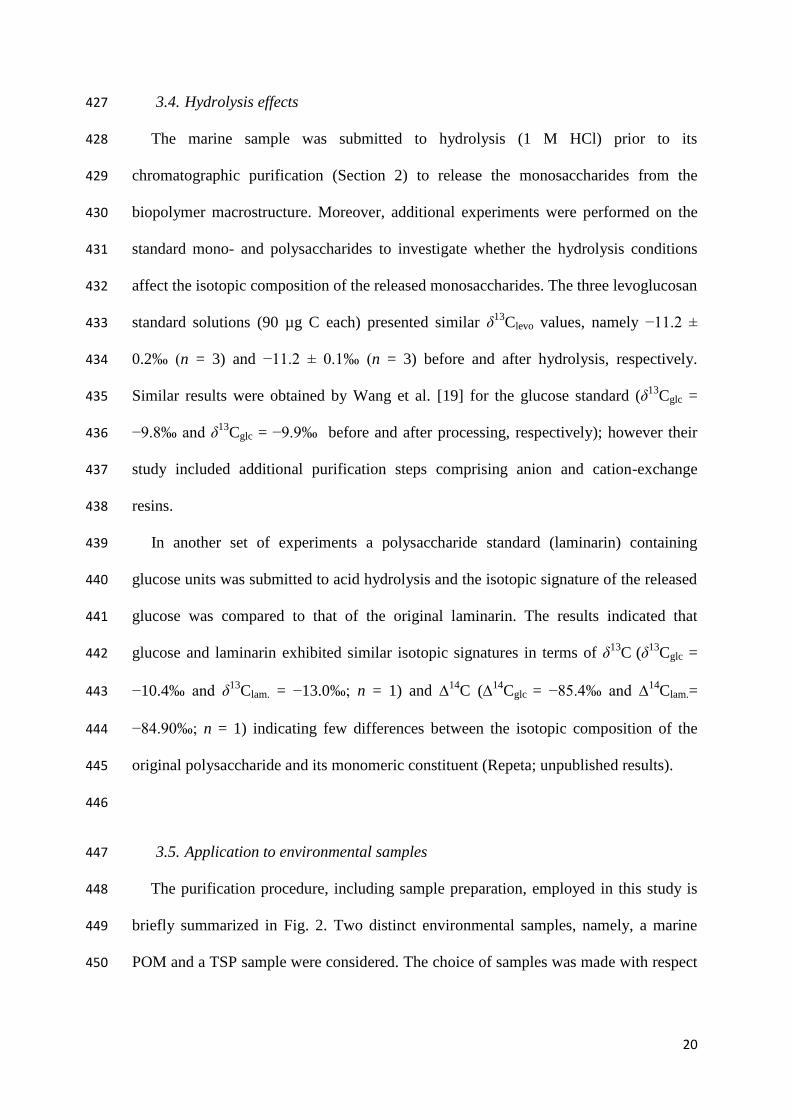
3.4. Hydrolysis effects 427
The marine sample was submitted to hydrolysis (1 M HCl) prior to its 428
chromatographic purification (Section 2) to release the monosaccharides from the 429
biopolymer macrostructure. Moreover, additional experiments were performed on the 430
standard mono- and polysaccharides to investigate whether the hydrolysis conditions 431
affect the isotopic composition of the released monosaccharides. The three levoglucosan 432
standard solutions (90 µg C each) presented similar δ13
Clevo values, namely −11.2 ± 433
0.2‰ (n = 3) and −11.2 ± 0.1‰ (n = 3) before and after hydrolysis, respectively. 434
Similar results were obtained by Wang et al. [19] for the glucose standard (δ13
Cglc = 435
−9.8‰ a δ13
Cglc = −9.9‰ before and after processing, respectively); however their 436
study included additional purification steps comprising anion and cation-exchange 437
resins. 438
In another set of experiments a polysaccharide standard (laminarin) containing 439
glucose units was submitted to acid hydrolysis and the isotopic signature of the released 440
glucose was compared to that of the original laminarin. The results indicated that 441
glucose and laminarin exhibited similar isotopic signatures in terms of δ13
C (δ
13Cglc = 442
−10.4‰ a δ13
Clam. = −13.0‰; n = 1) and 14
C (14
Cglc = −85.4‰ a 14
Clam.= 443
−84.90‰; n = 1) indicating few differences between the isotopic composition of the 444
original polysaccharide and its monomeric constituent (Repeta; unpublished results). 445
446
3.5. Application to environmental samples 447
The purification procedure, including sample preparation, employed in this study is 448
briefly summarized in Fig. 2. Two distinct environmental samples, namely, a marine 449
POM and a TSP sample were considered. The choice of samples was made with respect 450
21
to the opportunities and the logistics set to obtain them but more importantly of their 451
high carbohydrate content. 452
453
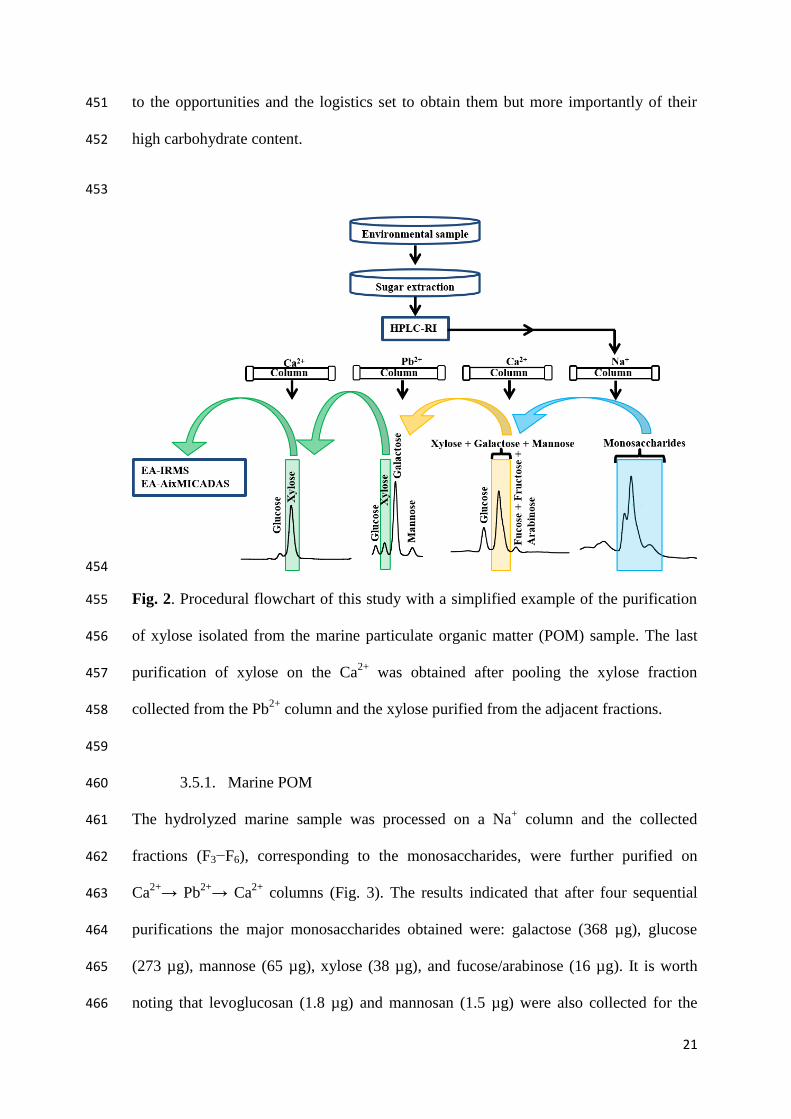
454
Fig. 2. Procedural flowchart of this study with a simplified example of the purification 455
of xylose isolated from the marine particulate organic matter (POM) sample. The last 456
purification of xylose on the Ca2+
was obtained after pooling the xylose fraction 457
collected from the Pb2+
column and the xylose purified from the adjacent fractions. 458
459
3.5.1. Marine POM 460
The hydrolyzed marine sample was processed on a Na+ column and the collected 461
fractions (F3−F6), corresponding to the monosaccharides, were further purified on 462
Ca2+→ Pb
2+→ Ca
2+ columns (Fig. 3). The results indicated that after four sequential 463
purifications the major monosaccharides obtained were: galactose (368 µg), glucose 464
(273 µg), mannose (65 µg), xylose (38 µg), and fucose/arabinose (16 µg). It is worth 465
noting that levoglucosan (1.8 µg) and mannosan (1.5 µg) were also collected for the 466
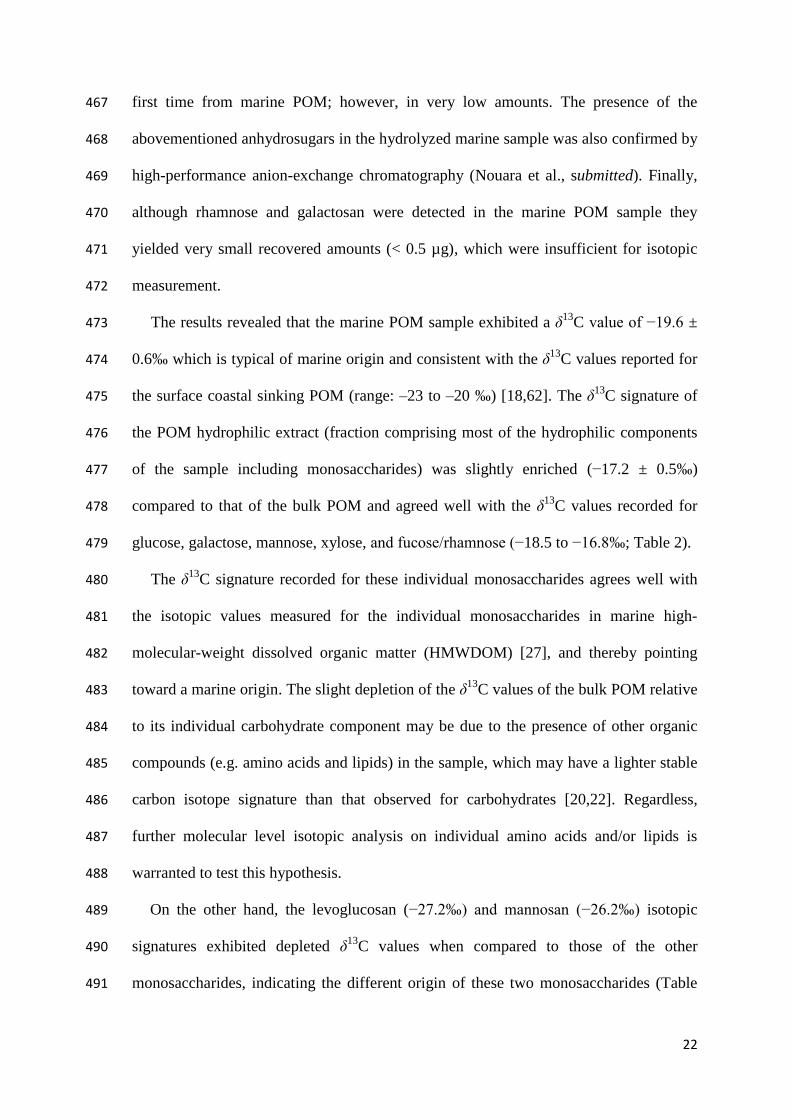
22
first time from marine POM; however, in very low amounts. The presence of the 467
abovementioned anhydrosugars in the hydrolyzed marine sample was also confirmed by 468
high-performance anion-exchange chromatography (Nouara et al., submitted). Finally, 469
although rhamnose and galactosan were detected in the marine POM sample they 470
yielded very small recovered amounts (< 0.5 µg), which were insufficient for isotopic 471
measurement. 472
The results revealed that the marine POM sample exhibited a δ13
C alu f −19.6 ± 473
0.6‰ which is typical of marine origin and consistent with the δ13
C values reported for 474
the surface coastal sinking POM (range: ‒23 to ‒20 ‰) [18,62]. The δ13
C signature of 475
the POM hydrophilic extract (fraction comprising most of the hydrophilic components 476
of the sample including monosaccharides) was slightly enriched (−17.2 ± 0.5‰) 477
compared to that of the bulk POM and agreed well with the δ13
C values recorded for 478
glucose, galactose, mannose, xylose, a fuc / ham (−18.5 to −16.8‰; Table 2). 479
The δ13
C signature recorded for these individual monosaccharides agrees well with 480
the isotopic values measured for the individual monosaccharides in marine high-481
molecular-weight dissolved organic matter (HMWDOM) [27], and thereby pointing 482
toward a marine origin. The slight depletion of the δ13
C values of the bulk POM relative 483
to its individual carbohydrate component may be due to the presence of other organic 484
compounds (e.g. amino acids and lipids) in the sample, which may have a lighter stable 485
carbon isotope signature than that observed for carbohydrates [20,22]. Regardless, 486
further molecular level isotopic analysis on individual amino acids and/or lipids is 487
warranted to test this hypothesis. 488
On the other hand, the levoglucosan (−27.2‰) a ma a (−26.2‰) isotopic 489
signatures exhibited depleted δ13
C values when compared to those of the other 490
monosaccharides, indicating the different origin of these two monosaccharides (Table 491
23
2). Indeed, these sugars are well known tracers of terrestrial biomass burning processes 492
[39], and thus their presence in marine POM indicates an external terrestrial input 493
probably via atmospheric deposition [5,10] from C3 land plant tissue (δ13
C: −32 494
−20‰; mean: −27‰ [63]). The presence of levoglucosan and mannosan in the POM 495
sample is not surprising since the sampling site was located a few kilometers offshore 496
from the Lima area (section 2.2). 497
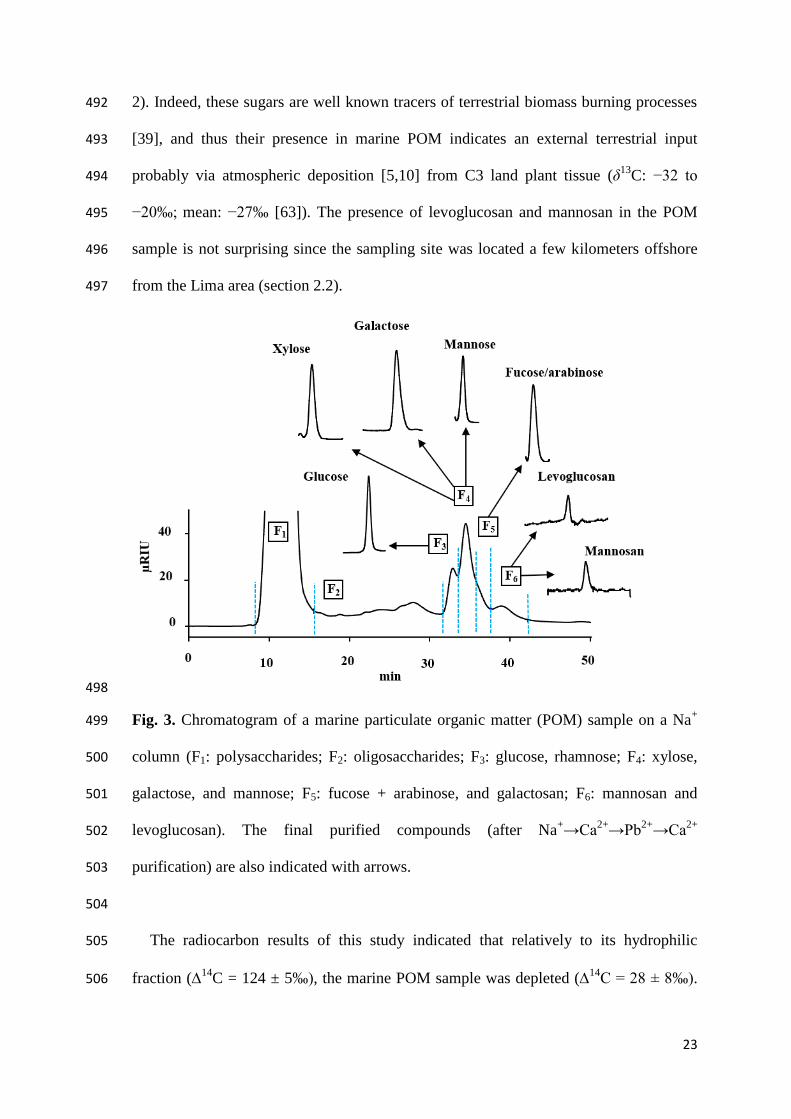
498
Fig. 3. Chromatogram of a marine particulate organic matter (POM) sample on a Na+ 499
column (F1: polysaccharides; F2: oligosaccharides; F3: glucose, rhamnose; F4: xylose, 500
galactose, and mannose; F5: fucose + arabinose, and galactosan; F6: mannosan and 501
levoglucosan). The final purified compounds (after Na+→Ca
2+→Pb
2+→Ca
2+ 502
purification) are also indicated with arrows. 503
504
The radiocarbon results of this study indicated that relatively to its hydrophilic 505
fraction (14
C = 124 ± 5‰), the marine POM sample was depleted (14C = 28 ± 8‰). 506
24
This agrees very well with previous investigations, which have reported similar results 507
for a wide variety of environmental samples comprising sediments, sinking POM, 508
planktons [19,64] including riverine, and marine HMWDOM [22,65]. Intermediate 509
radiocarbon values were recorded for glucose and galactose (14
Cglc = 43‰ and 14
Cgal 510
= 19‰; Table 2) and are consistent with the radiocarbon monosaccharide signature 511
reported for surface marine HMWDOM [27]. 512
513
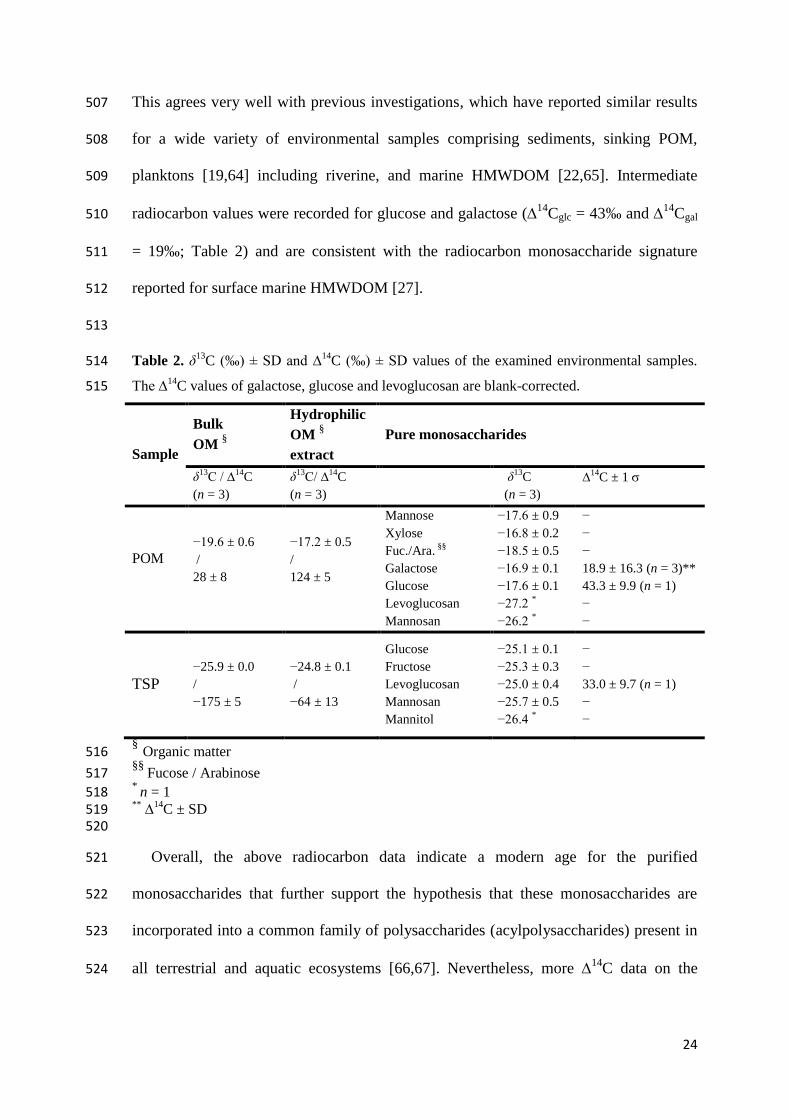
Table 2. δ13
C (‰) ± SD a ∆14
C (‰) ± SD values of the examined environmental samples. 514
h ∆14
C values of galactose, glucose and levoglucosan are blank-corrected. 515
Sample
Bulk
OM §
Hydrophilic
OM §
extract
Pure monosaccharides
δ13C / ∆
14C
(n = 3)
δ13C/ ∆
14C
(n = 3)
δ13
C
(n = 3)
∆14
C ± 1
POM
−19.6 ± 0.6
/
28 ± 8
−17.2 ± 0.5
/
124 ± 5
Mannose
Xylose
Fuc./Ara. §§
Galactose
Glucose
Levoglucosan
Mannosan
−17.6 ± 0.9
−16.8 ± 0.2
−18.5 ± 0.5
−16.9 ± 0.1
−17.6 ± 0.1
−27.2 *
−26.2 *
−
−
−
18.9 ± 16.3 (n = 3)**
43.3 ± 9.9 (n = 1)
−
−
TSP
−25.9 ± 0.0
/
−175 ± 5
−24.8 ± 0.1
/
−64 ± 13
Glucose
Fructose
Levoglucosan
Mannosan
Mannitol
−25.1 ± 0.1
−25.3 ± 0.3
−25.0 ± 0.4
−25.7 ± 0.5
−26.4 *
−
−
33.0 ± 9.7 (n = 1)
−
−
§ Organic matter 516
§§ Fucose / Arabinose 517
* n = 1 518
** ∆
14C ± SD 519
520
Overall, the above radiocarbon data indicate a modern age for the purified 521
monosaccharides that further support the hypothesis that these monosaccharides are 522
incorporated into a common family of polysaccharides (acylpolysaccharides) present in 523
all terrestrial and aquatic ecosystems [66,67]. Nevertheless, more 14
C data on the 524
25
individual monosaccharides including other environmental matrices (e.g. sediments, and 525
riverine POM and DOM) are warranted before any generalizations can be made. 526
527
3.5.2. TSP 528
The purification of the atmospheric sample was performed, without prior processing, 529
on the Na+ column. This was due to the low complexity of the sample and to avoid 530
further possible losses and contamination that may occur during additional 531
manipulation. The purification was conducted in a Ca2+
column, followed by a Pb2+
532
column and again by a Ca2+
column (Fig. 4). The obtained results indicated that after 533
three purifications the major monosaccharides obtained were: levoglucosan (134 µg), 534
fructose (40 µg), mannosan (38 µg), glucose (36 µg), and mannitol (4 µg). The 535
abundance of these monosaccharides is in agreement with the results generally reported 536
for PM10 particles [5,10]. Similar to the abovementioned results galactose, arabinose 537
and galactosan were detected in the TSP sample. However, these were present in very 538
low amounts (< 0.5 µg) and no isotopic measurements were performed. 539
The δ13
C value recorded for the TSP sample (−25.9 ± 0.0‰) was similar to that of its 540
hydrophilic extract (−24.8 ± 0.1‰) and within the range of that of the isolated 541
monosaccharides (−26.4 to −25.0‰; Table 2). These results reflect a dominant 542
terrestrial origin from C3 vegetation and/or microorganisms, including fungal spores 543
[6,37]. The δ13
C values of levoglucosan and mannosan were in agreement with the 544
values reported by Sang et al. [25] for hardwood and stalk plant combustion. The δ13
C 545
values reported in this study are also in good agreement with those measured for n-546
alkanes (C23–C33: −26.7 to −28.5‰) n-alkanols (C22–C32: −23.9 to −30.4‰), and long-547
chain n-alkanoic acids (C22–C32: −22.6 to −27.4‰) h h w Af ca u 548
over the Atlantic Ocean [41]. 549
26
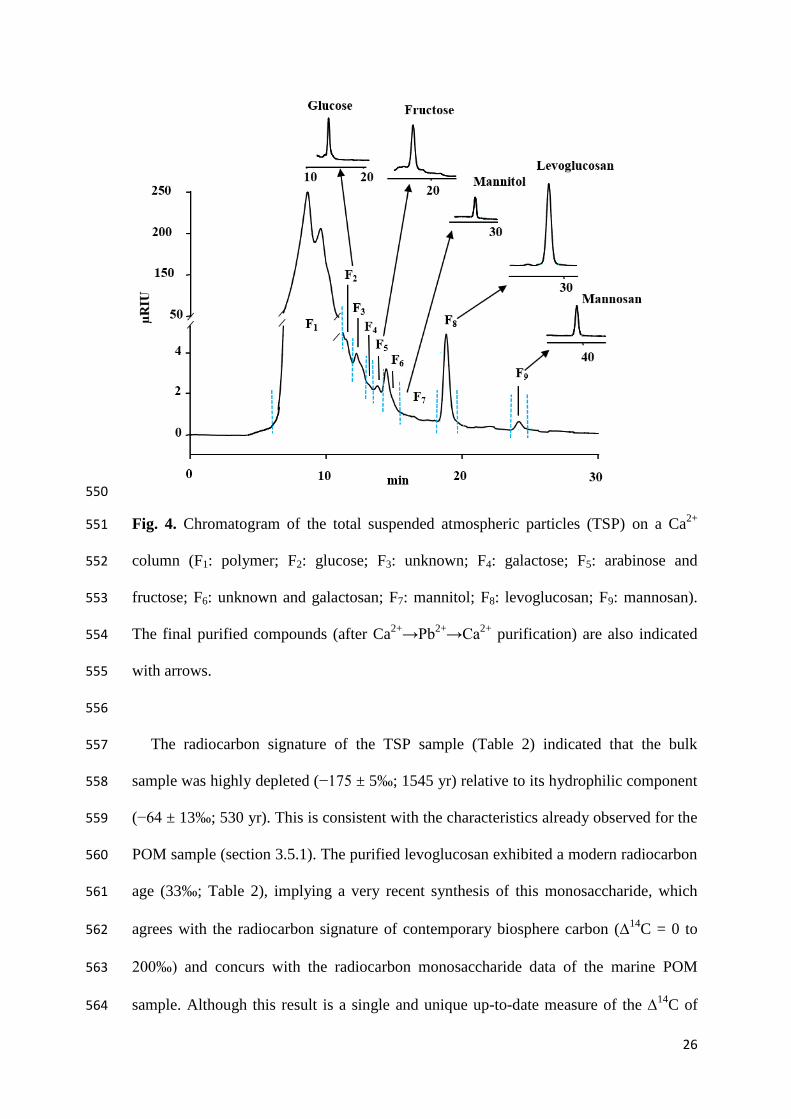
550
Fig. 4. Chromatogram of the total suspended atmospheric particles (TSP) on a Ca2+
551
column (F1: polymer; F2: glucose; F3: unknown; F4: galactose; F5: arabinose and 552
fructose; F6: unknown and galactosan; F7: mannitol; F8: levoglucosan; F9: mannosan). 553
The final purified compounds (after Ca2+→Pb
2+→Ca
2+ purification) are also indicated 554
with arrows. 555
556
The radiocarbon signature of the TSP sample (Table 2) indicated that the bulk 557
sample was highly depleted (−175 ± 5‰; 1545 yr) relative to its hydrophilic component 558
(−64 ± 13‰; 530 yr). This is consistent with the characteristics already observed for the 559
POM sample (section 3.5.1). The purified levoglucosan exhibited a modern radiocarbon 560
age (33‰; Table 2), implying a very recent synthesis of this monosaccharide, which 561
agrees with the radiocarbon signature of contemporary biosphere carbon (14
C = 0 to 562
200‰) and concurs with the radiocarbon monosaccharide data of the marine POM 563
sample. Although this result is a single and unique up-to-date measure of the 14
C of 564

27
levoglucosan, it can also explain, in part, the lack of stability of levoglucosan in the 565
atmosphere over time since this compound has a modern age [68,69]. The radiocarbon 566
signature of the TSP sample (1545 yr) relative to those of the purified water extract (530 567
yr) and levoglucosan (modern), may be due to the contribution of aged organic material 568
such as black carbon (>50,000 yr). This material is known to be ubiquitous in the 569
atmosphere as a result of fossil fuel emissions. This observation is further supported by 570
the location of the sampling site (Marseille, France), which is characterized by the high 571
influence from anthropogenic emissions and is in agreement with previous radiocarbon 572
data performed on fossil fuels, soot aerosols, and PM2.5 particles in other areas [70–72]. 573
However, more TSP radiocarbon data in conjunction with compound specific 574
radiocarbon analyses (i.e. monosaccharides, lipids, polyaromatic hydrocarbons) are 575
required to confirm this hypothesis. 576
577
3.6. Identification of purified monosaccharides: comparison with authentic 578
standards 579
Isolated monosaccharides recovered after the whole extraction and purification 580
procedure were compared with authentic standards to check their purity. Depending on 581
the amount of carbon recovered and the number of subsequently performed replicate 582
EA-IRMS analysis, only three monosaccharides were further explored: levoglucosan, 583
glucose, and galactose. The results from this study indicated that the mass spectra of the 584
isolated monosaccharides well matched those of authentic standards (Table S3), as 585
revealed by liquid chromatography coupled with quadrupole time-of-flight mass 586
spectrometry (Q-TOF-LC/MS; Fig. S3). These results indicate that this proposed 587
approach is specific, valid and reliable. 588
4. Conclusions and Outlook 589
28
The approach presented herein proved to be a powerful and robust tool for δ13
C and 590
14
C determination of individual carbohydrates in the environmental matrices. Briefly, 591
after four successive purifications on cation-exchange columns, the pure carbohydrates 592
were produced and further assessed by EA-IRMS and/or EA-AixMICADAS. Particular 593
attention was given to the procedural blanks, which were found to be extremely low 594
during the whole cleanup procedure (0.5 μg C per carbohydrate collected). 595
The applicability of the proposed procedure was tested on two different 596
environmental samples comprising marine POM and TSP and the results revealed that 597
the isotopic compositions of the individual carbohydrates, in terms of δ13
C, were in 598
good agreement with the data reported in the literature. Unfortunately, the Δ14
C values 599
for individual carbohydrates are scarce in literature and to the best of our knowledge, 600
only one study, on marine HMWDOM, has been reported to date. Therefore, we could 601
not directly compare the obtained results to Δ14
C values of similar samples. 602
Nevertheless, the obtained data suggested that the monosaccharides exhibit a modern 603
age, further implying the recent synthesis of these compounds and their rapid cycling. 604
Applying this method to a wide variety of environmental samples comprising marine 605
sediments, riverine organic matter, deep water HMWDOM, soils, and rain may 606
substantially help to improve the understanding of the carbohydrate dynamics and 607
organic matter cycling in all geochemical systems. 608
Finally, the overall approach highlights the high potential of preparative liquid 609
chromatography for application to the purification of specific compounds after selection 610
of the adequate column(s) for subsequent molecular-level isotopic measurements. 611
Moreover, future research employing two-dimensional cation-exchange 612
chromatography may prove to be a very useful tool to speed up the whole purification 613
procedure. 614

29
615
Acknowledgments 616
This research was funded by the projects AIOLOS, TRACFIRE (Labex OT-Med; 617
ANR-11-LABEX-0.061) and MANDARINE (grant No 2008-10372; Région Provence 618
Alpes Côte d'Azur). The project leading to this publication has received funding from 619
European FEDER Fund under project 1166-39417. The authors acknowledge the four 620
anonymous reviewers for valuable comments and fruitful discussions. A. Nouara was 621
supported by a Ph.D. grant from Aix-Marseille University. 622
623
Appendix A. Supplementary data 624
Supplementary data related to this article can be found at https://doi.org/10.1016/j.aca 625
Table and Figure captions 626
Table 1. Carbon content (µg), δ13
C (‰) a 14C(‰) values of the procedural blanks. 627
Phthalic acid was added to the collected time window of the three monosaccharide 628
samples and the ultrapure water sample to make the measurement feasible. The mass of 629
phthalic acid was adjusted according to the sample mass of the respective time window 630
of the examined environmental samples. 631
632
Table 2. δ13
C (‰) ± SD a ∆14
C (‰) ± SD values of the examined environmental 633
samples. The ∆14
C values of galactose, glucose and levoglucosan are blank-corrected. 634
635
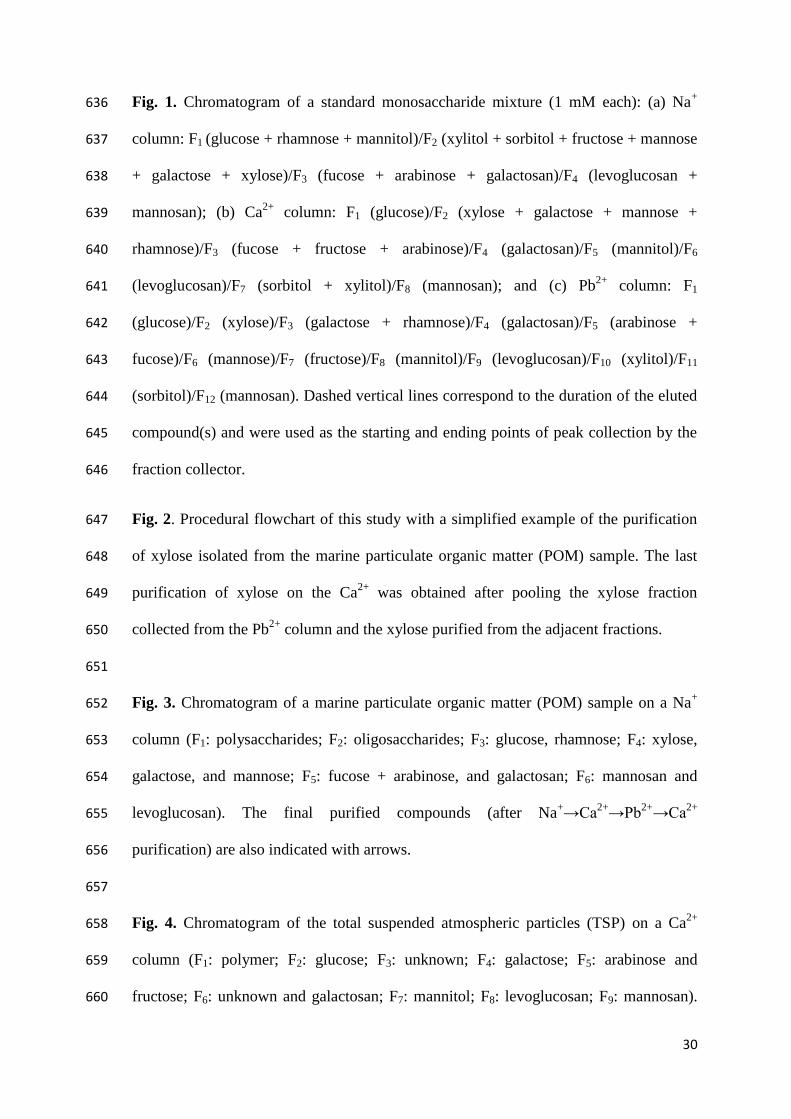
30
Fig. 1. Chromatogram of a standard monosaccharide mixture (1 mM each): (a) Na+ 636
column: F1 (glucose + rhamnose + mannitol)/F2 (xylitol + sorbitol + fructose + mannose 637
+ galactose + xylose)/F3 (fucose + arabinose + galactosan)/F4 (levoglucosan + 638
mannosan); (b) Ca2+
column: F1 (glucose)/F2 (xylose + galactose + mannose + 639
rhamnose)/F3 (fucose + fructose + arabinose)/F4 (galactosan)/F5 (mannitol)/F6 640
(levoglucosan)/F7 (sorbitol + xylitol)/F8 (mannosan); and (c) Pb2+
column: F1 641
(glucose)/F2 (xylose)/F3 (galactose + rhamnose)/F4 (galactosan)/F5 (arabinose + 642
fucose)/F6 (mannose)/F7 (fructose)/F8 (mannitol)/F9 (levoglucosan)/F10 (xylitol)/F11 643
(sorbitol)/F12 (mannosan). Dashed vertical lines correspond to the duration of the eluted 644
compound(s) and were used as the starting and ending points of peak collection by the 645
fraction collector. 646
Fig. 2. Procedural flowchart of this study with a simplified example of the purification 647
of xylose isolated from the marine particulate organic matter (POM) sample. The last 648
purification of xylose on the Ca2+
was obtained after pooling the xylose fraction 649
collected from the Pb2+
column and the xylose purified from the adjacent fractions. 650
651
Fig. 3. Chromatogram of a marine particulate organic matter (POM) sample on a Na+ 652
column (F1: polysaccharides; F2: oligosaccharides; F3: glucose, rhamnose; F4: xylose, 653
galactose, and mannose; F5: fucose + arabinose, and galactosan; F6: mannosan and 654
levoglucosan). The final purified compounds (after Na+→Ca
2+→Pb
2+→Ca
2+ 655
purification) are also indicated with arrows. 656
657
Fig. 4. Chromatogram of the total suspended atmospheric particles (TSP) on a Ca2+
658
column (F1: polymer; F2: glucose; F3: unknown; F4: galactose; F5: arabinose and 659
fructose; F6: unknown and galactosan; F7: mannitol; F8: levoglucosan; F9: mannosan). 660

31
The final purified compounds (after Ca2+→Pb
2+→Ca
2+ purification) are also indicated 661
with arrows. 662
663
References 664
[1] J.I. Hedges, G.L. Cowie, J.E. Richey, P.D. Quay, R. Benner, M. Strom, B.R. 665
Forsberg, Origins and processing of organic matter in the Amazon River as 666
indicated by carbohydrates and amino acids, Limnol. Oceanogr. 39 (1994) 743–667
761. doi:10.4319/lo.1994.39.4.0743. 668
[2] S. Opsahl, R. Benner, Characterization of carbohydrates during early diagenesis 669
of five vascular plant tissues, Org. Geochem. 30 (1999) 83–94. 670
doi:10.1016/S0146-6380(98)00195-8. 671
[3] C. Panagiotopoulos, D.J. Repeta, L. Mathieu, J.F. Rontani, R. Sempéré, 672
Molecular level characterization of methyl sugars in marine high molecular 673
weight dissolved organic matter, Mar. Chem. 154 (2013) 34–45. 674
doi:10.1016/j.marchem.2013.04.003. 675
[4] D.J. Repeta, Chemical characterization and cycling of dissolved organic matter, 676
in: D. A. Hansell and C. A. Carlson (Ed.), Biogeochem. Mar. Dissolved Org. 677
Matter, Elsevier Science, USA, 2015: pp. 21–63. 678
[5] C. Theodosi, C. Panagiotopoulos, A. Nouara, P. Zarmpas, P. Nicolaou, K. 679
Violaki, M. Kanakidou, R. Sempéré, N. Mihalopoulos, Sugars in atmospheric 680
aerosols over the Eastern Mediterranean, Prog. Oceanogr. 163 (2018) 70–81. 681
doi:10.1016/j.pocean.2017.09.001. 682
[6] P. Fu, K. Kawamura, M. Kobayashi, B.R.T. Simoneit, Seasonal variations of 683
32
sugars in atmospheric particulate matter from Gosan, Jeju Island: Significant 684
contributions of airborne pollen and Asian dust in spring, Atmos. Environ. 55 685
(2012) 234–239. doi:10.1016/j.atmosenv.2012.02.061. 686
[7] J.M. Oades, Soil organic matter and structural stability: mechanisms and 687
implications for management, Plant Soil. 76 (1984) 319–337. 688
[8] C. Panagiotopoulos, R. Sempéré, J. Para, P. Raimbault, C. Rabouille, B. 689
Charrière, The composition and flux of particulate and dissolved carbohydrates 690
from the Rhone River into the Mediterranean Sea, Biogeosciences. 9 (2012) 691
1827–1844. doi:10.5194/bg-9-1827-2012. 692
[9] J.D. Pakulski, R. Benner, Abundance and distribution of carbohydrates in the 693
ocean, Limnol. Oceanogr. 39 (1994) 930–940. doi:10.4319/lo.1994.39.4.0930. 694
[10] P. Fu, K. Kawamura, K. Miura, Molecular characterization of marine organic 695
aerosols collected during a round-the-world cruise, J. Geophys. Res. 116 (2011) 696
1–14. doi:10.1029/2011JD015604. 697
[11] R. Sempéré, M. Tedetti, C. Panagiotopulos, B. Charriere, F. Van Wambeke, 698
Distribution and bacterial availability of dissolved neutral sugars in the South 699
East Pacific, Biogeosciences. 5 (2008) 1165–1173. doi:10.5194/bg-5-1165-2008. 700
[12] S.R. Beaupré, The Carbon Isotopic Composition of Marine DOC, in: D.A. 701
Hansell, C.A. Carlson (Eds.), Biogeochem. Mar. Dissolved Org. Matter, Second 702
Edi, Academic Press, Boston, 2015: pp. 335–368. 703
doi:https://doi.org/10.1016/B978-0-12-405940-5.00006-6. 704
[13] E.A. Hobbie, R.A. Werner, Intramolecular, compound-specific, and bulk carbon 705
isotope patterns in C 3 and C 4 plants: a review and synthesis, New Phytol. 161 706
33
(2004) 371–385. doi:10.1046/j.1469-8137.2004.00970.x. 707
[14] J. Hwang, E.R.M. Druffel, Carbon isotope ratios of organic compound fractions 708
in oceanic suspended particles, Geophys. Res. Lett. 33 (2006) 1–5. 709
doi:10.1029/2006GL027928. 710
[15] D. López-Veneroni, The stable carbon isotope composition of PM2.5 and PM10 711
in Mexico City Metropolitan Area air, Atmos. Environ. 43 (2009) 4491–4502. 712
doi:10.1016/j.atmosenv.2009.06.036. 713
[16] C.P. Bataille, M. Mastalerz, B.J. Tipple, G.J. Bowen, Influence of provenance 714
and preservation on the carbon isotope variations of dispersed organic matter in 715
ancient floodplain sediments, Geochemistry, Geophys. Geosystems. 14 (2013) 716
4874–4891. doi:10.1002/ggge.20294. 717
[17] P.K. Zigah, E.C. Minor, H.A.N. Abdulla, J.P. Werne, P.G. Hatcher, An 718
investigation of size-fractionated organic matter from Lake Superior and a 719
tributary stream using radiocarbon, stable isotopes and NMR, Geochim. 720
Cosmochim. Acta. 127 (2014) 264–284. doi:10.1016/j.gca.2013.11.037. 721
[18] L.A. Roland, M.D. McCarthy, T. Guilderson, Sources of molecularly 722
uncharacterized organic carbon in sinking particles from three ocean basins: A 723
c upl Δ14C a δ13C app ach Ma . Ch m. 111 (2008) 199–213. 724
doi:10.1016/j.marchem.2008.05.010. 725
[19] X.-C. Wang, E.R.M. Druffel, S. Griffin, C. Lee, M. Kashgarian, Radiocarbon 726
studies of organic compounds classes in plankton and sediment of the 727
northeastern Pacific Ocean, Geochim. Cosmochim. Acta. 62 (1998) 1365–1378. 728
doi:10.1016/S0016-7037(98)00074-X. 729

34
[20] J. Hwang, E.R.M. Druffel, Lipid-Like Material as the Source of the 730
Uncharacterized Organic Carbon in the Ocean?, Science. 299 (2003) 881–884. 731
doi:10.1126/science.1078508. 732
[21] X.-C. Wang, R.F. Chen, G.B. Gardner, Sources and transport of dissolved and 733
particulate organic carbon in the Mississippi River estuary and adjacent coastal 734
waters of the northern Gulf of Mexico, Mar. Chem. 89 (2004) 241–256. 735
doi:10.1016/j.marchem.2004.02.014. 736
[22] A.N. Loh, J.E. Bauer, E.R.M. Druffel, Variable ageing and storage of dissolved 737
organic components in the open ocean., Nature. 430 (2004) 877–881. 738
doi:10.1038/nature02780. 739
[23] B.E. Van Dongen, S. Schouten, J.S. Sinninghe Damsté, Carbon isotope 740
variability in monosaccharides and lipids of aquatic algae and terrestrial plants, 741
Mar. Ecol. Prog. Ser. 232 (2002) 83–92. doi:10.3354/meps232083. 742
[24] B. Glaser, Compound-specificstable- p (δ13C) a aly l c c J. 743
Plant Nutr. Soil Sci. 168 (2005) 633–648. doi:10.1002/jpln.200521794. 744
[25] X.F. Sang, I. Gensch, W. Laumer, B. Kammer, C.Y. Chan, G. Engling, A. 745
Wahner, H. Wissel, A. Kiendler-Scharr, Stable carbon isotope ratio analysis of 746
anhydrosugars in biomass burning aerosol particles from source samples, 747
Environ. Sci. Technol. 46 (2012) 3312–3318. doi:10.1021/es204094v. 748
[26] R. Zhu, Y.-S. Lin, J.. Lipp, T.B. Meador, K.-U. Hinrichs, Optimizing sample 749
pretreatment for compound-specific stable carbon isotopic analysis of amino 750
sugars in marine sediment, Biogeosciences. 11 (2014) 4869–4880. 751
doi:10.5194/bgd-11-593-2014. 752

35
[27] D.J. Repeta, L.I. Aluwihare, Radiocarbon analysis of neutral sugars in high-753
molecular-weight dissolved organic carbon: Implications for organic carbon 754
cycling, Limnol. Oceanogr. 51 (2006) 1045–1053. 755
doi:10.4319/lo.2006.51.2.1045. 756
[28] D. Derrien, J. Balesdent, C. Marol, C. Santaella, Measurement of the 13C/12C 757
ratio of soil-plant individual sugars by gas chromatography/combustion/isotope-758
ratio mass spectrometry of silylated derivatives, Rapid Commun. Mass Spectrom. 759
17 (2003) 2626–2631. doi:10.1002/rcm.1269. 760
[29] M.A. Teece, M.L. Fogel, Stable carbon isotope biogeochemistry of 761
monosaccharides in aquatic organisms and terrestrial plants, Org. Geochem. 38 762
(2007) 458–473. doi:10.1016/j.orggeochem.2006.06.008. 763
[30] T.C.W. Moerdijk-Poortvliet, H. Schierbeek, M. Houtekamer, T. van Engeland, 764
D. Derrien, L.J. Stal, H.T.S. Boschker, Comparison of gas 765
chromatography/isotope ratio mass spectrometry and liquid 766
chromatography/isotope ratio mass spectrometry for carbon stable-isotope 767
analysis of carbohydrates, Rapid Commun. Mass Spectrom. 29 (2015) 1205–768
1214. doi:10.1002/rcm.7217. 769
[31] C. Panagiotopoulos, R. Sempéré, Analytical methods for the determination of 770
uga ma ampl : A h cal p p c and future directions, Limnol. 771
Oceanogr. Methods. 3 (2005) 419–454. doi:10.4319/lom.2005.3.419. 772
[32] T.C.W. Moerdijk-Poortvliet, L.J. Stal, H.T.S. Boschker, LC/IRMS analysis: A 773
powerful technique to trace carbon flow in microphytobenthic communities in 774
intertidal sediments, J. Sea Res. 92 (2014) 19–25. 775
doi:10.1016/j.seares.2013.10.002. 776

36
[33] H.T.S. Boschker, T.C.W. Moerdijk-Poortvliet, P. van Breugel, M. Houtekamer, 777
J.J. Middelburg, A versatile method for stable carbon isotope analysis of 778
carbohydrates by high-performance liquid chromatography/isotope ratio mass 779
spectrometry., Rapid Commun. Mass Spectrom. 22 (2008) 3902–3908. 780
doi:10.1002/rcm.3804. 781
[34] A. Basler, J. Dyckmans, Compound- p c f c δ13C a aly f m accha 782
from soil extracts by high-performance liquid chromatography/isotope ratio mass 783
spectrometry, Rapid Commun. Mass Spectrom. 27 (2013) 2546–2550. 784
doi:10.1002/rcm.6717. 785
[35] K.T. Rinne, M. Saurer, K. Streit, R.T.W. Siegwolf, Evaluation of a liquid 786
chromatography method for compound-specific δ13C a aly f pla 787
carbohydrates in alkaline media, Rapid Commun. Mass Spectrom. 26 (2012) 788
2173–2185. doi:10.1002/rcm.6334. 789
[36] R.S. Sevcik, R.A. Mowery, C. Becker, C.K. Chambliss, Rapid analysis of 790
carbohydrates in aqueous extracts and hydrolysates of biomass using a carbonate-791
modified anion-exchange column, J. Chromatogr. A. 1218 (2011) 1236–1243. 792
doi:https://doi.org/10.1016/j.chroma.2011.01.002. 793
[37] H. Bauer, M. Claeys, R. Vermeylen, E. Schueller, G. Weinke, A. Berger, H. 794
Puxbaum, Arabitol and mannitol as tracers for the quantification of airborne 795
fungal spores, Atmos. Environ. 42 (2008) 588–593. 796
doi:10.1016/j.atmosenv.2007.10.013. 797
[38] P.M. Medeiros, M.H. Conte, J.C. Weber, B.R.T. Simoneit, Sugars as source 798
indicators of biogenic organic carbon in aerosols collected above the Howland 799
Experimental Forest, Maine, Atmos. Environ. 40 (2006) 1694–1705. 800

37
doi:10.1016/j.atmosenv.2005.11.001. 801
[39] B.R.T. Simoneit, Biomass burning — a review of organic tracers for smoke from 802
incomplete combustion, Appl. Geochemistry. 17 (2002) 129–162. 803
doi:10.1016/S0883-2927(01)00061-0. 804
[40] T.I. Eglinton, L.I. Aluwihare, J.E. Bauer, Ellen R.M.Druffel, A.P. Mcnichol, Gas 805
Chromatographic Isolation of Individual Compounds from Complex Matrices for 806
Radiocarbon Dating, Anal. Chem. 68 (1996) 904–912. doi:10.1021/ac9508513. 807
[41] T.I. Eglinton, G. Eglinton, L. Dupont, E.R. Sholkovitz, D. Montluc, C.M. Reddy, 808
Composition, age, and provenance of organic matter in NW African dust over the 809
Atlantic Ocean, Geochemistry Geophys. Geosystems. 3 (2002) 1525–2027. 810
doi:10.1029/2001GC000269. 811
[42] A. Ingalls, A. Pearson, Ten Years of Compound-Specific Radiocarbon Analysis, 812
Oceanography. 18 (2005) 18–31. doi:10.5670/oceanog.2005.22. 813
[43] M. Makou, T. Eglinton, C. McIntyre, D. Montluçon, I. Antheaume, V. Grossi, 814
Plant Wax n-Alkane and n-Alkanoic Acid Signatures Overprinted by Microbial 815
Contributions and Old Carbon in Meromictic Lake Sediments, Geophys. Res. 816
Lett. 45 (2018) 1049–1057. doi:10.1002/2017GL076211. 817
[44] A.L. Bour, B.D. Walker, T.A.B. Broek, M.D. McCarthy, Radiocarbon Analysis 818
of Individual Amino Acids: Carbon Blank Quantification for a Small-Sample 819
High-Pressure Liquid Chromatography Purification Method, Anal. Chem. 88 820
(2016) 3521–3528. doi:10.1021/acs.analchem.5b03619. 821
[45] C. Panagiotopoulos, D.J. Repeta, C.G. Johnson, Characterization of methyl 822
sugars, 3-deoxysugars and methyl deoxysugars in marine high molecular weight 823

38
dissolved organic matter, Org. Geochem. 38 (2007) 884–896. 824
doi:10.1016/j.orggeochem.2007.02.005. 825
[46] P.M. Medeiros, B.R.T. Simoneit, Analysis of sugars in environmental samples by 826
gas chromatography-mass spectrometry, J. Chromatogr. A. 1141 (2007) 271–827
278. doi:10.1016/j.chroma.2006.12.017. 828
[47] X. Cheng, L.A. Kaplan, Simultaneous analyses of neutral carbohydrates and 829
amino sugars in freshwaters with HPLC-PAD, J. Chromatogr. Sci. 41 (2003) 830
434–438. doi: 10.1093/chromsci/41.8.434. 831
[48] E. Bard, T. Tuna, Y. Fagault, L. Bonvalot, L. Wacker, S. Fahrni, H.A. Synal, 832
AixMICADAS, the accelerator mass spectrometer dedicated to14C recently 833
installed in Aix-en-Provence, France, Nucl. Instruments Methods Phys. Res. 834
Sect. B Beam Interact. with Mater. Atoms. 361 (2015) 80–86. 835
doi:10.1016/j.nimb.2015.01.075. 836
[49] M. Bretagnon, A. Paulmier, V. Garcon, B. Dewitte, S. Illig, L. Coppola, F. 837
Campos, F. Velazco, C. Panagiotopoulos, A. Oschlies, J.M. Hernandez-ayon, H. 838
Maske, O. Vergara, I. Montes, P. Martinez, E. Carrasco, J. Grelet, Desprez-De-839
Gesincourt, C. Maes, L. Scouarnec, Modulation of the vertical particles transfer 840
efficiency in the Oxygen Minimum Zone off Peru, Biogeosciences. 15 (2018) 1–841
19. doi:10.5194/bg-15-1-2018. 842
[50] C. Panagiotopoulos, R. Sempéré, V. Jacq, B. Charrière, Composition and 843
distribution of dissolved carbohydrates in the Beaufort Sea Mackenzie margin 844
(Arctic Ocean), Mar. Chem. 166 (2014) 92–102. 845
doi:10.1016/j.marchem.2014.09.004. 846

39
[51] C. Cheng, C.-S. Chen, P.-H. Hsieh, On-line desalting and carbohydrate analysis 847
for immobilized enzyme hydrolysis of waste cellulosic biomass by column-848
switching high-performance liquid chromatography, J. Chromatogr. A. 1217 849
(2010) 2104–2110. doi:10.1016/j.chroma.2010.01.084. 850
[52] E.S. Gordon, M.A. Goni, Sources and distribution of terrigenous organic matter 851
delivered by the Atchafalaya River to sediments in the northern Gulf of Mexico, 852
Geochim. Cosmochim. Acta. 67 (2003) 2359–2375. doi:10.1016/S0016-853
7037(02)01412-6. 854
[53] T.B. Coplen, W.A. Brand, M. Gehre, M. Gröning, H.A.J. Meijer, B. Toman, 855
R.M. V k u Af w ca a c a ch f h VPDB δ13C cal 856
Rapid Commun. Mass Spectrom. 20 (2006) 3165–3166. doi:10.1002/rcm. 857
[54] T. Tuna, Y. Fagault, L. Bonvalot, M. Capano, E. Bard, Development of small 858
CO2 gas measurements with AixMICADAS, Nucl. Instruments Methods Phys. 859
Res. Sect. B Beam Interact. with Mater. Atoms. 437 (2018) 93–97. 860
doi:10.1016/J.NIMB.2018.09.012. 861
[55] Y. Fagault, T. Tuna, F. Rostek, E. Bard, Radiocarbon dating small carbonate 862
samples with the gas ion source of AixMICADAS, Nucl. Instruments Methods 863
Phys. Res. Sect. B Beam Interact. with Mater. Atoms. (2019). 864
doi:10.1016/J.NIMB.2018.11.018. 865
[56] M. Stuiver, H.A. Polach, Reporting of C-14 data - Discussion, Radiocarbon. 19 866
(1977) 355–363. 867
[57] P.J. Reimer, T.A. Brown, R.W. Reimer, Discussion: Reporting and calibration of 868
post-bomb C-14 data, Radiocarbon. 46 (2004) 1299–1304. 869
40
[58] S.J. Angyal, G.S. Bethell, R.J. Beveridge, The separation of sugars and of polyols 870
on cation-exchange resins in the calcium form, Carbohydr. Res. 73 (1979) 9–18. 871
[59] C. Panagiotopoulos, O. Wurl, Spectrophotometric and chromatographic analysis 872
of carbohydrates in marine samples, in: O. Wurl (Ed.), Pract. Guidel. Anal. 873
Seawater, 1st Editio, CRC Press, Boca Raton, 2009: p. 408. 874
[60] C. Nobre, M.J. Santos, A. Dominguez, D. Torres, O. Rocha, A.M. Peres, I. 875
Rocha, E.C. Ferreira, J.A. Teixeira, L.R. Rodrigues, Comparison of adsorption 876
equilibrium of fructose, glucose and sucrose on potassium gel-type and 877
macroporous sodium ion-exchange resins, Anal. Chim. Acta. 654 (2009) 71–76. 878
doi:10.1016/j.aca.2009.06.043. 879
[61] J.A. Vente, H. Bosch, A.B. De Haan, P.J.T. Bussmann, Comparison of sorption 880
isotherms of mono- and disaccharides relevant to oligosaccharide separations for 881
Na, K, and Ca loaded cation exchange resins, Chem. Eng. Commun. 192 (2005) 882
23–33. doi:10.1080/00986440590473254. 883
[62] E.R.M. Druffel, P.M. Williams, J.E. Bauer, J.R. Ertel, Cycling of dissolved and 884
particulate organic matter in the open ocean, J. Geophys. Res. Ocean. 97 (1992) 885
15639–15659. doi:10.1029/92JC01511. 886
[63] M.H. O’L a y Ca b I p Ph y h :F ac a ch ques may 887
reveal new aspects of carbon dynamics in plants, Bioscience. 38 (1988) 328–336. 888
[64] X.C. Wang, E.R.M. Druffel, Radiocarbon and stable carbon isotope compositions 889
of organic compound classes in sediments from the NE Pacific and Southern 890
Oceans, Mar. Chem. 73 (2001) 65–81. doi:10.1016/S0304-4203(00)00090-6. 891
[65] X.-C. Wang, J. Callahan, R.F. Chen, Variability in radiocarbon ages of 892

41
biochemical compound classes of high molecular weight dissolved organic 893
matter in estuaries, Estuar. Coast. Shelf Sci. 68 (2006) 188–194. 894
doi:10.1016/J.ECSS.2006.01.018. 895
[66] L.I. Aluwihare, D.J. Repeta, R.F. Chen, A major biopolymeric component to 896
dissolved organic carbon in surface sea water, Nature. 387 (1997) 166–169. 897
doi:10.1038/387166a0. 898
[67] D.J. Repeta, T.M. Quan, L.I. Aluwihare, A. Accardi, Chemical characterization 899
of high molecular weight dissolved organic matter in fresh and marine waters, 900
Geochim. Cosmochim. Acta. 66 (2002) 955–962. doi:10.1016/S0016-901
7037(01)00830-4. 902
[68] C.F. Fortenberry, M.J. Walker, Y. Zhang, D. Mitroo, W.H. Brune, B.J. Williams, 903
Bulk and Molecular-Level Characterization of Laboratory-Aged Biomass 904
Burning Organic Aerosol from Oak Leaf and Heartwood Fuels, Atmos. Chem. 905
Phys. Discuss. 60 (2017) 1–40. doi:10.5194/acp-2017-576. 906
[69] A. Bertrand, G. Stefenelli, C.N. Jen, S.M. Pieber, E.A. Bruns, B. Temime-907
Roussel, J.G. Slowik, A.H. Goldstein, I. El Haddad, U. Baltensperger, A.S.H. 908
Prévôt, H. Wortham, N. Marchand, Evolution of the chemical fingerprint of 909
biomass burning organic aerosol during aging, Atmos. Chem. Phys. Discuss. 910
(2018) 1–33. doi:10.5194/acp-2017-1196. 911
[70] L. Bonvalot, T. Tuna, Y. Fagault, J.-L. Jaffrezo, V. Jacob, F. Chevrier, E. Bard, 912
Estimating contributions from biomass burning and fossil fuel combustion by 913
means of radiocarbon analysis of carbonaceous aerosols: application to the 914
Valley of Chamonix, Atmos. Chem. Phys. Discuss. (2016) 1–39. 915
doi:10.5194/acp-2016-351. 916

42
[71] Z. Niu, S. Wang, J. Chen, F. Zhang, X. Chen, C. He, L. Lin, L. Yin, L. Xu, 917
Source contributions to carbonaceous species in PM2,5 and their uncertainty 918
analysis at typical urban, peri-urban and background sites in southeast China., 919
Environ. Pollut. 181 (2013) 107–114. doi:10.1016/j.envpol.2013.06.006. 920
[72] A. Andersson, R.J. Sheesley, M. Kruså, C. Johansson, Ö. Gustafsson, 14C-Based 921
source assessment of soot aerosols in Stockholm and the Swedish EMEP-922
Aspvreten regional background site, Atmos. Environ. 45 (2011) 215–222. 923
doi:10.1016/j.atmosenv.2010.09.015. 924
925
926
927
928
929
930
931
932
933
934
935
Appendix A 936
Supporting data and information for 937
938
Liquid Chromatographic isolation of individual carbohydrates from 939
environmental matrices for stable carbon analysis and radiocarbon dating 940
941

43
Amel Nouara1, Christos Panagiotopoulos
1*, Jérôme Balesdent
2, Kalliopi Violaki
1, 942
Edouard Bard2, Yoann Fagault
2, Daniel James Repeta
3, Richard Sempéré
1 943
944
1A x Ma ll . ul , CNRS, IRD, MIO UM 110, 13288, 945
Marseille, France 946
2Aix Marseille Univ., CNRS, Collège de France, IRD, INRA, CEREGE UM34, 13545 947
Aix-en-Provence, France 948
3Department of Marine Chemistry and Geochemistry, Woods Hole Oceanographic 949
Institution, Woods Hole, MA 02543, USA 950
951
*Corresponding author. Phone: +33 4 86 09 05 26; 952
E-mail : [email protected] 953
954
955
956
957
958
959
February 27th
, 2019 960
961
962
Table of Contents 963
S 1. Optimization of the HPLC-RI system 44 964
S. 2. Supplementary figures and table legends 46 965
Fig. S1. Comparison of chromatograms with and without online degasser 46 966
44
Fig. S2: Example of a standard monosaccharide mixture (50 µM each) purification on 967
(a) Ca2+
column: F1 (glucose)/F2 (galactose + mannose)/F3 (fructose + arabinose)/F4 968
(galactosan)F5 (mannitol)/F6 (levoglucosan)/F7 (sorbitol + xylitol)/F8 (mannosan), 969
followed by purification on (b) Pb2+
column of F1 and F2 fractions: F1 + F2-1 970
(glucose)/F2-2 (galactose)/F2-3 (mannose) and (c) Ca2+
column of F2-1 fraction : F2-1-1 971
(unknown)/F2-1-2 (glucose). Colored boxes correspond to peak(s) collection. 46 972
Fig. S3. Extracted ion chromatograms corresponding to the analysis of underivatized 973
levoglucosan (a), glucose (b) and galactose (c). The black line corresponds to the 974
respective authentic standard (~ 5ppm final concentration) and red line to the sample. In 975
all spectra, the molecular ion was detected as a Na+ and NH4
+ additive. More details are 976
given in Table S3. 47 977
Table S1: Columns characteristics and analysis conditions used for the HPLC-RI 978
system. 48 979
Table S2. Monosaccharide purification yields after three sequential purifications 980
(Ca2+→ Pb
2+ → Ca
2+) of a standard monosaccharide mixture (see text) at 50 µM (n = 3).981
49 982
Table S3. Theoretical and measured masses (LC-Q-TOF-MS analysis) recorded as Na+ 983
and NH4+ additives for levoglucosan, glucose and galactose. 49 984
References 50 985
986
987
988
989
S 1. Optimization of the HPLC-RI system 990

45
During the optimization step, a systematic large negative peak was always observed in 991
the chromatograms at 18-20 min (Fig. S1). Previous studies indicated that this peak is 992
probably due to the presence of dissolved oxygen in the sample and can mask the eluted 993
compounds at this time window or cause an increase in the baseline noise [1]. The peak 994
intensity somehow decreased after sample degassing (with pure He) but was still 995
significant at low sample concentrations. We overcame this problem by installing a 996
degassing device (RFIC eluent degasser, Thermo Fisher) before the chromatographic 997
column. We found that this device increases neither the back-pressure of the system nor 998
the retention time of the carbohydrates. To shorten the analysis time of the 999
carbohydrates, no guard columns were used in this study. However, as a precaution, an 1000
online polyether ether ketone (PEEK) filter equipped with a stainless-steel frit (pore size 1001
0.5 µm) was placed just before the online degasser. The filter frit was cleaned regularly 1002
by sonication in a methanol bath, followed by sonication in ultrapure water, once per 1003
month and between each sample purification. 1004
Moreover, to maximize the collection efficiency of carbohydrates, the tubing between 1005
the RI detector and the fraction collector was minimized. The delay time between the 1006
detector and the fraction collector was calculated using 1 mM of vitamin B12 without an 1007
analytical column. Further adjustments of the working flow rates (0.3 mL min−1
and 0.6 1008
mL min−1
for Na+
and Ca2+
/Pb2+
columns, respectively) were made with a glucose 1009
standard (50 µM). We found that the highest recovery (~80%) of the glucose was 1010
obtained with a delay time of 110 s for the Na+ column, and 60 s for the Ca
2+ and Pb
2+ 1011
columns. These delay times were applied for all peak and fraction collections during the 1012
purification procedure either of standards or samples. 1013
1014
1015

46
1016
S. 2. Supplementary figures and table legends 1017
1018
1019
Fig. S1. Comparison of chromatograms with and without online degasser 1020
1021
1022
1023
Fig. S2: Example of a standard monosaccharide mixture (50 µM each) purification on 1024
(a) Ca2+
column: F1 (glucose)/F2 (galactose + mannose)/F3 (fructose + arabinose)/F4 1025
(galactosan)F5 (mannitol)/F6 (levoglucosan)/F7 (sorbitol + xylitol)/F8 (mannosan), 1026

47
followed by purification on (b) Pb2+
column of F1 and F2 fractions: F1 + F2-1 1027
(glucose)/F2-2 (galactose)/F2-3 (mannose) and (c) Ca2+
column of F2-1 fraction : F2-1-1 1028
(unknown)/F2-1-2 (glucose). Colored boxes correspond to peak(s) collection. 1029
1030
1031
1032
Fig. S3. Extracted ion chromatograms corresponding to the analysis of underivatized 1033
levoglucosan (a), glucose (b) and galactose (c). The black line corresponds to the 1034
respective authentic standard (~ 5ppm final concentration) and red line to the sample. In 1035
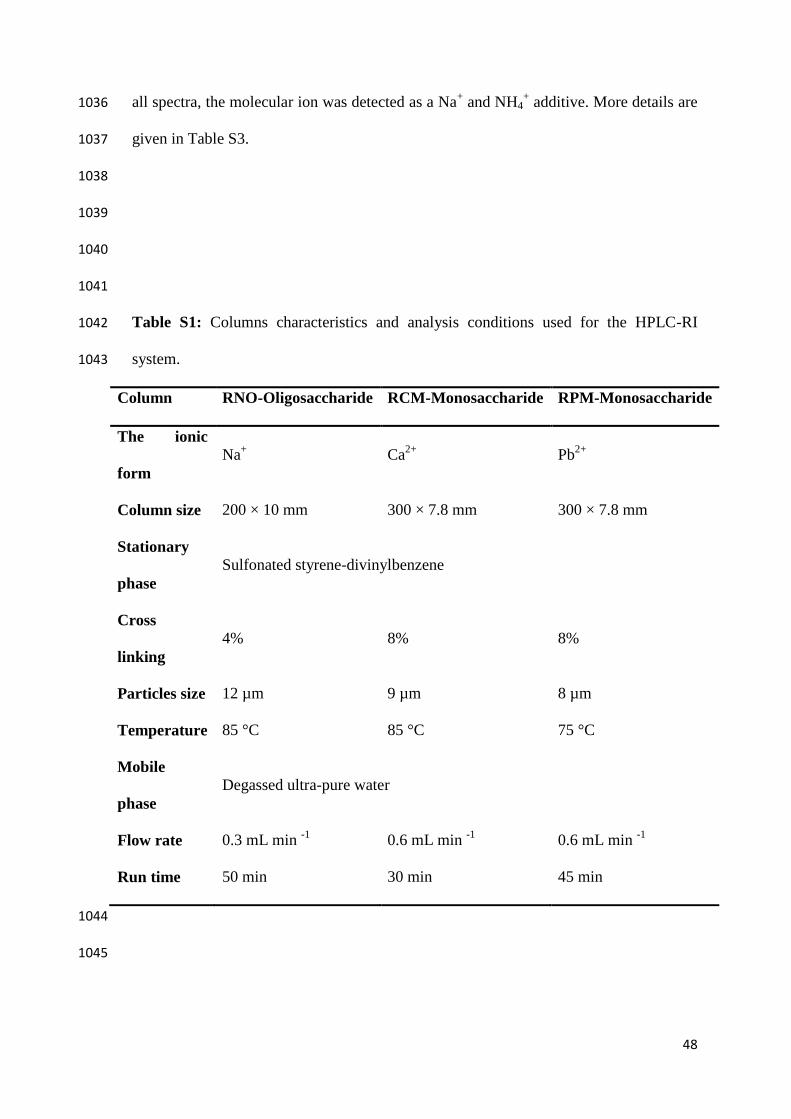
48
all spectra, the molecular ion was detected as a Na+ and NH4
+ additive. More details are 1036
given in Table S3. 1037
1038
1039
1040
1041
Table S1: Columns characteristics and analysis conditions used for the HPLC-RI 1042
system. 1043
Column RNO-Oligosaccharide RCM-Monosaccharide RPM-Monosaccharide
The ionic
form
Na+ Ca
2+ Pb
2+
Column size 200 × 10 mm 300 × 7.8 mm 300 × 7.8 mm
Stationary
phase
Sulfonated styrene-divinylbenzene
Cross
linking
4% 8% 8%
Particles size 12 µm 9 µm 8 µm
Temperature 85 °C 85 °C 75 °C
Mobile
phase
Degassed ultra-pure water
Flow rate 0.3 mL min -1
0.6 mL min -1
0.6 mL min -1
Run time 50 min 30 min 45 min
1044
1045

49
Table S2. Monosaccharide purification yields after three sequential purifications 1046
(Ca2+→ Pb
2+ → Ca
2+) of a standard monosaccharide mixture (see text) at 50 µM (n = 3). 1047
Standard
Average yield
Mean ± Stdev
Glucose 36.32 ± 0.02
Galactose 29.28 ± 0.03
Mannose 25.17 ± 0.01
Fructose 20.44 ± 0.01
Arabinose 12.38 ± 0.01
Galactosan 15.22 ± 0.00
Mannitol 31.01 ± 0.01
Levoglucosan 31.49 ± 0.01
Xylitol 25.84 ± 0.01
Sorbitol 30.09 ± 0.03
Mannosan 32.21 ± 0.00
1048
1049
1050
Table S3. Theoretical and measured masses (LC-Q-TOF-MS analysis) recorded as Na+ 1051
and NH4+ additives for levoglucosan, glucose and galactose. 1052
Theoretical mass
Measured
authentic
standard mass
Measured purified
compound mass
Na+ NH4
+ Na
+ NH4
+ Na
+ NH4
+
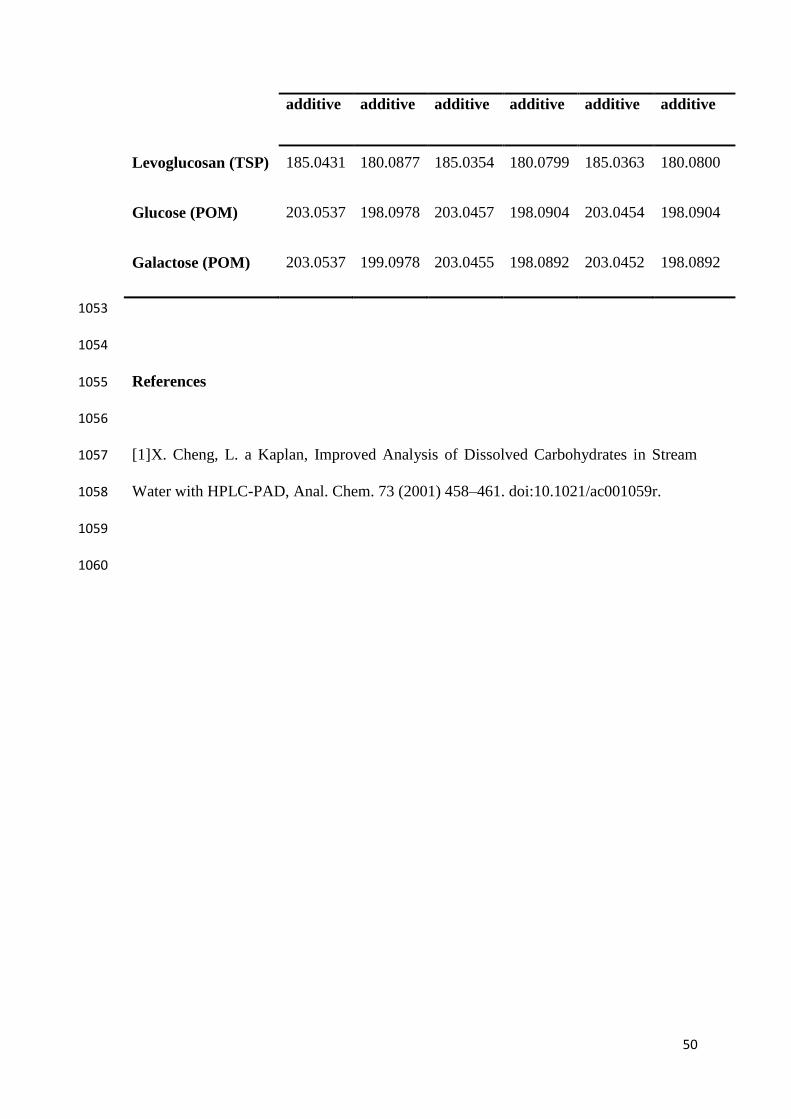
50
additive additive additive additive additive additive
Levoglucosan (TSP) 185.0431 180.0877 185.0354 180.0799 185.0363 180.0800
Glucose (POM) 203.0537 198.0978 203.0457 198.0904 203.0454 198.0904
Galactose (POM) 203.0537 199.0978 203.0455 198.0892 203.0452 198.0892
1053
1054
References 1055
1056
[1] X. Cheng, L. a Kaplan, Improved Analysis of Dissolved Carbohydrates in Stream 1057
Water with HPLC-PAD, Anal. Chem. 73 (2001) 458–461. doi:10.1021/ac001059r. 1058
1059
1060