Research Article Mathews Journal of Nutrition &...
11
Research Arcle Mathews Journal of Nutrion & Dietecs Assessing Human Environmental Aluminum Exposure by Analysing Frequency Distribuon Properes of Hair and Whole Blood Aluminum Concentraons Berislav Momcilovic 1 , Juraj Prejac 2 , Andrey Anatolyevic Skalny 3 , Eugeny Petrovich Serebryansky 3 , Ninoslav Mimica 4 1 Instute for Research and Development of the Sustainable Ecosystems (IRES), Srebrnjak 59, 10000 Zagreb, Croaa. 2 University Hospital Centre Zagreb, Deparmtent of Oncology, Kišpaćeva 12, Zagreb, Croaa. 3 ANO Center for Bioc Medicine, Zemlyanoi val 46-48, 103604 Moscow, Russia. 4 University Psychiatric Hospital Vrapče, Bolnicka cesta 32, 10 090 Zagreb, Croaa. Corresponding Author: Berislav Momcilovic, Instute for Research and Development of the Sustainable Ecosystems (IRES), Srebrnjak 59, 10000 Zagreb, Croaa, Tel: +38512430288; Email: [email protected] 1 Received Date: 01 Mar 2016 Accepted Date: 16 Mar 2016 Published Date: 04 Apr 2016 Copyright © 2016 Momcilovic B Citaon: Momcilovic B, Prejac J, Skalny AA, Serebryansky, et al. (2016). Assessing Human Environmental Aluminum Exposure by Analysing Frequency Distribuon Properes of Hair and Whole Blood Aluminum Concentraons. M J Nutr. 1(1): 001. Citaon: Momcilovic B, Prejac J, Skalny AA, Serebryansky, et al. (2016). Assessing Human Environmental Aluminum Exposure by Analysing Frequency Distribuon Properes of Hair and Whole Blood Aluminum Concentraons. M J Nutr. 1(1): 001. ABSTRACT Aluminum is an omnipresent non-essenal trace element in the human diet and an essenal component of numerous industrial processes. The Al populaon exposure risk is increasing, but there is no long-term biomarker for the exposure assessment. We analyzed Al with ICP MS in the hair ( Al H) and whole blood ( Al WB) in 311 healthy persons (n♂ = 123 and n♀ = 188); the Al WB was analyzed in 142 women and 90 men. We used the median derivave power funcon to assess aluminum exposure. Al H median was higher in men (6.64) than in women (4.74 µg∙g -1 ) (p < 0.01, χ 2 -test). Al WB was below detecon limit of 0.09 µg∙ml -1 in over half the men and women. Al H concentraons below or above the linear segment (Tolerable exposure) of 1.98–14.3 in women and 2.78–17.5 µg∙g -1 in men indicate Low or the Excessive exposure, respec- vely. Al WB of 0.09-1.53 µg∙g -1 indicates the Tollerable Al exposure; Al WB and Al H were poorly correlated. The Tollerable Al H exposure can be further differenated by a 3-component kinec analysis to reflect the changes of hair aluminum saturaon capacity. The median derivave power funcon for analyzing Al H frequency distribuon is a valuable long-term biomarker for assessing the populaon environmental aluminum exposure risk. KEY WORDS Aluminum; Populaon Exposure; Biomarkers; Hair; Whole Blood; Median Derivaves; Risk Assessment. INTRODUCTION Aluminum is a non-essenal element abundantly present in the Earth’s crust. It is also widely used in a great number of industrial products and processes - from packaging materials and food addives to water purificaon, from anperspirants and gastric antacides to vaccines [1]. Aluminum has a low tox- icity, but its ever increasing presence in the human environ- ment became a subject of great public concern [2,3]. Indeed, exposure to high doses of aluminum may impair the brain, blood, bone and kidneys and, also, there is a strong associa- on between the high environmental aluminum exposure and the occurence of Alzheimers’s disease and Parkinson’s disease [4-7]. The level of the current human aluminum environmen- tal exposure to the general populaon needs to be accurately assessed so that the adequate health protecon measures can be established [8]. Aluminum is omnipresent in all the foods - both fresh and pro-
Transcript of Research Article Mathews Journal of Nutrition &...

Research Article Mathews Journal of Nutrition & Dietetics
Assessing Human Environmental Aluminum Exposure by Analysing Frequency Distribution Properties of Hair and Whole Blood Aluminum ConcentrationsBerislav Momcilovic1, Juraj Prejac2, Andrey Anatolyevic Skalny3, Eugeny Petrovich Serebryansky3, Ninoslav Mimica4
1Institute for Research and Development of the Sustainable Ecosystems (IRES), Srebrnjak 59, 10000 Zagreb, Croatia.2University Hospital Centre Zagreb, Deparmtent of Oncology, Kišpatićeva 12, Zagreb, Croatia.3ANO Center for Biotic Medicine, Zemlyanoi val 46-48, 103604 Moscow, Russia.4University Psychiatric Hospital Vrapče, Bolnicka cesta 32, 10 090 Zagreb, Croatia.
Corresponding Author: Berislav Momcilovic, Institute for Research and Development of the Sustainable Ecosystems (IRES),
Srebrnjak 59, 10000 Zagreb, Croatia, Tel: +38512430288; Email: [email protected]
1
Received Date: 01 Mar 2016Accepted Date: 16 Mar 2016Published Date: 04 Apr 2016
Copyright © 2016 Momcilovic BCitation: Momcilovic B, Prejac J, Skalny AA, Serebryansky, et al. (2016). Assessing Human Environmental Aluminum Exposure by Analysing Frequency Distribution Properties of Hair and Whole Blood Aluminum Concentrations. M J Nutr. 1(1): 001.
Citation: Momcilovic B, Prejac J, Skalny AA, Serebryansky, et al. (2016). Assessing Human Environmental Aluminum Exposure by Analysing Frequency Distribution
Properties of Hair and Whole Blood Aluminum Concentrations. M J Nutr. 1(1): 001.
ABSTRACT
Aluminum is an omnipresent non-essential trace element in the human diet and an essential component of numerous industrial processes. The Al population exposure risk is increasing, but there is no long-term biomarker for the exposure assessment. We analyzed Al with ICP MS in the hair (AlH) and whole blood (AlWB) in 311 healthy persons (n♂ = 123 and n♀ = 188); the AlWB was analyzed in 142 women and 90 men. We used the median derivative power function to assess aluminum exposure. AlH median was higher in men (6.64) than in women (4.74 µg∙g-1) (p < 0.01, χ2-test). AlWB was below detection limit of 0.09 µg∙ml-1 in over half the men and women. AlH concentrations below or above the linear segment (Tolerable exposure) of 1.98–14.3 in women and 2.78–17.5 µg∙g-1 in men indicate Low or the Excessive exposure, respec-tively. AlWB of 0.09-1.53 µg∙g-1 indicates the Tollerable Al exposure; AlWB and AlH were poorly correlated. The Tollerable AlH exposure can be further differentiated by a 3-component kinetic analysis to reflect the changes of hair aluminum saturation capacity. The median derivative power function for analyzing AlH frequency distribution is a valuable long-term
biomarker for assessing the population environmental aluminum exposure risk.
KEY WORDS
Aluminum; Population Exposure; Biomarkers; Hair; Whole Blood; Median Derivatives; Risk Assessment.
INTRODUCTION
Aluminum is a non-essential element abundantly present in the Earth’s crust. It is also widely used in a great number of industrial products and processes - from packaging materials and food additives to water purification, from antiperspirants and gastric antacides to vaccines [1]. Aluminum has a low tox-icity, but its ever increasing presence in the human environ-ment became a subject of great public concern [2,3]. Indeed, exposure to high doses of aluminum may impair the brain,
blood, bone and kidneys and, also, there is a strong associa-tion between the high environmental aluminum exposure and the occurence of Alzheimers’s disease and Parkinson’s disease [4-7]. The level of the current human aluminum environmen-tal exposure to the general population needs to be accurately assessed so that the adequate health protection measures can be established [8].
Aluminum is omnipresent in all the foods - both fresh and pro-
www.mathewsopenaccess.com
2Citation: Momcilovic B, Prejac J, Skalny AA, Serebryansky, et al. (2016). Assessing Human Environmental Aluminum Exposure by Analysing Frequency Distribution
Properties of Hair and Whole Blood Aluminum Concentrations. M J Nutr. 1(1): 001.
cessed - and its concentration therein may vary by a factor of ten worldwide [1]. In the UK the aluminum in the food may vary (mg∙kg-1 dry weight, dw) from 0.27 in eggs to 78 in mis-cellaneous cereals [9]. Aluminum absorption from the gastro-intestinal tract is of a very low magnitude and of 0.1 - 0.3 % on the average [3].
However, there is no available long term bio-marker to moni-tor the aluminum exposure of the occupationaly non-exposed general population. Biological monitoring of human aluminum exposure has been conducted with urine, which is thought to indicate recent exposure, and plasma which is thought to bet-ter reflect the aluminum body burden. However, neither bio-marker is a very good predictor of the aluminum body burden. Thus far, hair aluminum concentration has been described, but its value as an indicator of aluminum body burden has not been demonstrated [3].
In our previous studies we have demonstrated that hair analy-sis may help to accurately asses the exposure, overexposure, and toxicity of environmental silver, and to accurately esti-mate the nutritional status of iodine in the human body [10-12]. The aim of this study was to assess the level of current environmental aluminum exposure in an occupationally non-exposed population. We have explored how much aluminum may be found in human hair and whole blood of an appar-ently healthy population, what was the frequency distribution of the analyzed aluminum concentration in the hair and whole blood, with the aim to estimate the current level and possible
risk of aluminum exposure in the population.
Subjects and Methods
This prospective, observational, cross-sectional, and explor-atory study was approved by the Ethical Committee of the Institute for Research and Development of the Sustainable Eco Systems (IRES) and conducted by strict adherence to the Declaration of Helsinki on Human Subject Research and to the complementary Croatian national bylaws and regulations [13,14]. Every subject gave his/her written consent to partici-pate in the study and filled out a short questionnaire on his/her health status and medical history (data not shown) [15].
Hair aluminum (AlH) was analyzed in a random sample of 311 apparently healthy adults (123 Men, 188 Women) 47 years old on average (SD 15.7, median 49.0) who were concerned with their health status with respect to their trace element nutritional status and toxic element body burden. They came from a general population from across the country, most of them living in Zagreb, the capital of Croatia. All the subjects were fed their usual home prepared mixed diet, and reported no adverse medical condition. In addtion, the whole blood
aluminum was analyzed in 142 women and 90 men (AlWB)
from the same cohort.
Hair (AlH) and Whole blood (AlWB) aluminum analysis: Hair and whole blood aluminum were analyzed with the ICP MS (Elan 9000, Perkin Elmer, USA) at the Center for Biotic Medi-cine (CBM), Moscow, Russia - CBM is an ISO Europe certified commercial laboratory for analysing bioelements (major and trace and ultratrace elements) in different biological matrices [16]. CBM is also a core member of the External Quality As-sessment at Surrey EQAS (http://trace-elements-eu) which helps ensure accurate and consistent results of the trace ele-ment analysis in biological matrices.
In brief, hair analysis was performed following the Interna-tional Atomic Energy Agency recomendations and other vali-dated analytical methods and procedures [17,18]. Hair sample of 0.5-0.1 g were stored in envelopes and the vials with whole blood were kept refrigerated at 4°C before they were random-ly assigned for analysis. The individual hair samples were cut with the sterilyzed titanium coated scissors (Suvorna Compo-nents Private Ltd., Hyderabad, Andra Pradesh, India) prior to chemical analysis to be less than 1 cm long, stirred 10 min in an ethylether/acetone (3:1, w/w), rinsed three times with the redistilled H2O, dried at 85°C for one hour to constant weight, immersed one hour in 5% EDTA, rinsed again in the redistilled H2O, dried at 85°C for twelve hours, wet digested in HNO3/H2O2 in a plastic tube, sonicated, and microwaved. Hair was microwave digested with HNO3 (Fluka #02650 Sigma-Aldrich, Co.) in the Berghof SW-4 DAP-40 microwave system (Berghof Products + Instruments GmbH, 72800 Eningen, Germany), and diluted 1:150 with DDIW, sonicated and run into the ICP MS system.
Whole Blood (AlWB). Whole venous blood was collected into the green-cap Vacuette collecting tubes (#454082 Lot A13030M7, Greiner Bio-On International AG, 4550 Krems-münster, Austria) which were randomly assigned for ICP MS analysis: whole blood samples of 0.5 ml were digested in a mi-crowave oven with 0.1 ml of HNO3 (Khimmed Sintez, Moscow, Russia) at 175°C. Blood standards were liophylized Seronorm TM Trace Elements Whole Blood Reference Standards Level 1 (OK 0036), Level 2 (MR9067), and Level 3 (OK0337) for alumi-num in the whole blood (SERO AS, Bilingstadt, Norway). Five ml of redistilled H2O were added to every reference standard and stirred gently at a room temperature for two hours to equilibrate. One ml of such equilibrated standard was pipet-ted in 25 ml quartz glass vial, dried at 105°C for 24 hours. The microwaved samples were dissolved in 5 ml of redistilled H2O with 0.1 ml of H2O added.
www.mathewsopenaccess.com
3Citation: Momcilovic B, Prejac J, Skalny AA, Serebryansky, et al. (2016). Assessing Human Environmental Aluminum Exposure by Analysing Frequency Distribution
Properties of Hair and Whole Blood Aluminum Concentrations. M J Nutr. 1(1): 001.
All chemicals were proanalysis grade (Khimmed Sintez, Mos-cow, Russia). We used certified GBW0910b Human Hair Refer-ence Material (Shanghai Institute for Nuclear Research, Aca-demia Sinica, Shanghai 201849, China) (CV [SD/Mean] 0.21) [16,19].
Current CBM hair and whole blood aluminum cut off points (µg∙g-1) are 0.00 - 40.0 for men and 0.00 - 15.0 women, respec-tively; whole blood reference values for allowable aluminum exposure are 0.00 - 0.40 [20]. Values above this range are con-sidered to indicate excessive aluminum exposure; our detec-tion limit for AlH and AlWB was 0.039 µg∙g-1.
Aluminum belongs to the pleiad of 29 elements sharing the same mass number (number of isotopes//element): 2 Ne, 5 Na, 5 Mg, 8 Al, 5 Sr, 3 P, 1 S [21]. Thus, the pleiad includes all the elements and their isotopes sharing the same mass num-ber.
Median Derivatives
To scrutinize the hair and whole blood aluminum concen-tration frequency distribution, we used the median de-rivative model to fit the sigmoid logistic regression analysis
function (power function) for men and women separately (Appendix):A2 + (A1 – A2)/[1+(x/x0)
p]where A1 is initial value (lower horizontal asymptote, A2 is final value (upper horizon-tal asymptote), x0 is center (point of inflection, in our case it is the median M0), p is power (the parameter that affects the slope of the area about the inflection point) [10,22]. The Qti-plot Data Analysis and Scientific Visualisation programs were used for this analysis (www.softproindependent.com/qtiplot.html). The same program was used to assess the hair satura-tion capacity by analysing the exponential functions of a linear part od the sigmoid curve.
RESULTSHair and whole blood aluminum detectability: Aluminum was detected in 304 of 311 of analyzed hair samples, but only in 109 of 232 of the analyzed whole blood samples (Table 1). Thus, over the half of the analyzed whole blood samples were below the detection limits of our ICP MS instrument (0.09 µg∙g-1). The frequency distribution of whole blood samples where aluminum could not be detected was not influenced by the sex of the subjects, i.e., the detectability of AlWB in both sexes was equally affected.
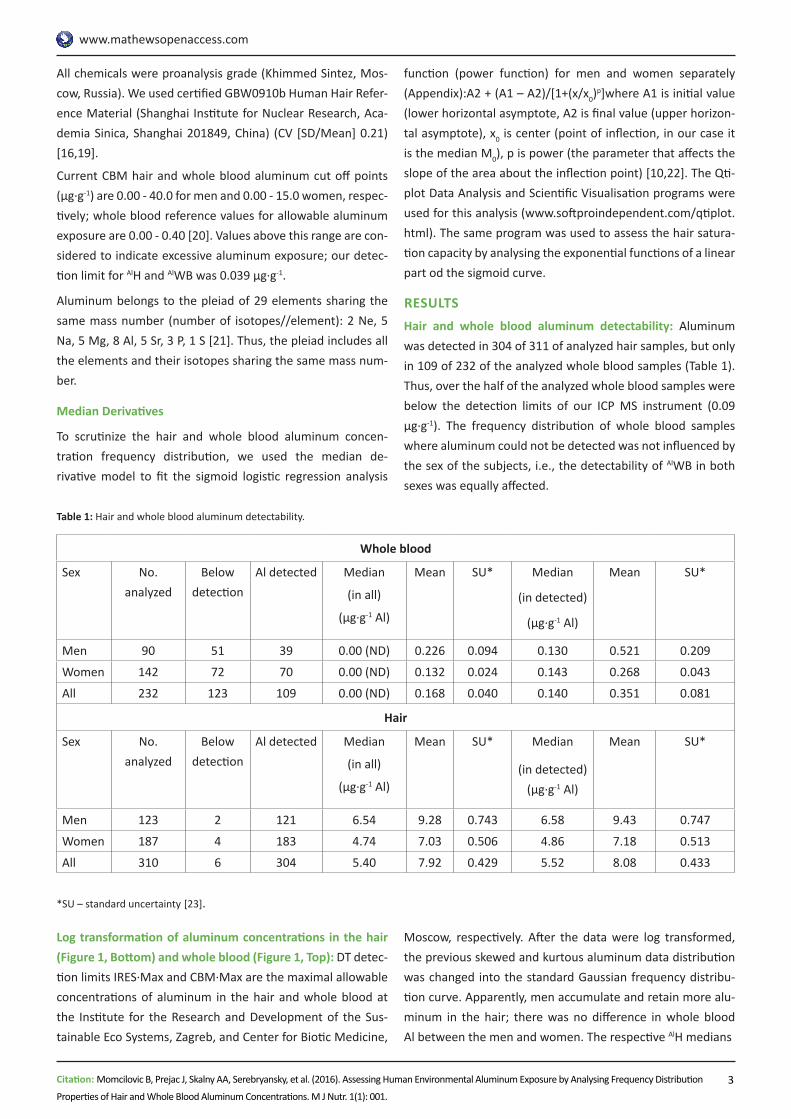
Log transformation of aluminum concentrations in the hair (Figure 1, Bottom) and whole blood (Figure 1, Top): DT detec-tion limits IRES∙Max and CBM∙Max are the maximal allowable concentrations of aluminum in the hair and whole blood at the Institute for the Research and Development of the Sus-tainable Eco Systems, Zagreb, and Center for Biotic Medicine,
Moscow, respectively. After the data were log transformed, the previous skewed and kurtous aluminum data distribution was changed into the standard Gaussian frequency distribu-tion curve. Apparently, men accumulate and retain more alu-minum in the hair; there was no difference in whole blood Al between the men and women. The respective AlH medians
Whole blood
Sex No. analyzed
Below detection
Al detected Median
(in all)
(µg∙g-1 Al)
Mean SU* Median
(in detected)
(µg∙g-1 Al)
Mean SU*
Men 90 51 39 0.00 (ND) 0.226 0.094 0.130 0.521 0.209
Women 142 72 70 0.00 (ND) 0.132 0.024 0.143 0.268 0.043
All 232 123 109 0.00 (ND) 0.168 0.040 0.140 0.351 0.081
Hair
Sex No. analyzed
Below detection
Al detected Median
(in all)
(µg∙g-1 Al)
Mean SU* Median
(in detected) (µg∙g-1 Al)
Mean SU*
Men 123 2 121 6.54 9.28 0.743 6.58 9.43 0.747
Women 187 4 183 4.74 7.03 0.506 4.86 7.18 0.513
All 310 6 304 5.40 7.92 0.429 5.52 8.08 0.433
Table 1: Hair and whole blood aluminum detectability.
*SU – standard uncertainty [23].
www.mathewsopenaccess.com
4Citation: Momcilovic B, Prejac J, Skalny AA, Serebryansky, et al. (2016). Assessing Human Environmental Aluminum Exposure by Analysing Frequency Distribution
Properties of Hair and Whole Blood Aluminum Concentrations. M J Nutr. 1(1): 001.
Men (n = 123) Women (n = 187)Median (M0) = 6.54 µg∙g-1 Al Median (M0) = 4.74 µg∙g-1 Al
MDC n Al MDC n Al MDC n Al MDC n AlD1 62 4.06 U1 62 10.79 d1 94 2.89 u1 94 8.03D2 31 2.78 U2 31 17.49 d2 47 1.88 u2 47 14.29D3 16 1.89 U3 16 26.05 d3 24 1.34 u3 24 19.05D4 8 1.02 U4 8 28.40 d4 12 0.93 u4 12 24.13D5 4 0.35 U5 4 39.10 d5 6 0.00 u5 6 28.10D6 2 0.00 U6 2 44.64 d6 3 0.00 u6 3 32.94
Note: Common median (M0) n=310 = 5.40 µg•g-1 Al, capital letters (D1 – D6, U1 – U6) men, small letters (d1 – d6, u1 – u6) women.
Table 2b: Whole blood.
Men (n = 90) Women (n = 142)Median (M0) = 0.000 µg∙g-1 Al (below DL) Median (M0) = 0.00 µg∙g-1 Al (below DL)
MDC n Al MDC n Al MDC n Al MDC n AlD1 45 0.000 U1 45 0.120 d1 76 0.000 u1 76 0.142D2 23 0.000 U2 23 0.160 d2 36 0.000 u2 36 0.203D3 12 0.000 U3 12 0.383 d3 18 0.000 u3 18 0.455D4 6 0.000 U4 6 1.912 d4 9 0.000 u4 9 0.890
D5 3 0.000 U5 3 2.910 d5 5 0.000 u5 5 1.360
D6 2 0.000 U6 2 5.290 d6 3 0.000 u6 3 1.660
Figure 1: Log transformation of aluminum concentrations in the hair (Bot-tom) and whole blood (Top). DT detection limits IRES∙Max and CBM∙Max are the maximal allowable concentrations of aluminum in the hair and whole blood at the Institute for the Research and Development of the Sustainable Eco Systems, Zagreb, and Center for Biotic Medicine, Mos-cow, respectively.
–– Normal distribution curve men and women (column size = 0.2 µg•g-1).
Median derivatives to fit the power function sigmoid (see
were for ♂ = 6.54 and for ♀ = 4.74; and AlWB medians for both ♂and ♀ (♀♂) = 0.09 (µg∙g-1 for subjects where aluminum was detectable. Except for the aluminum concentrations in wom-en’s hair, we think that the current CBM standards of tolerable aluminum exposure (CBM∙Max) are set too high.
Appendix 2): Table 2a Hair, Table 2b Whole Blood: The data to fit the power function sigmoid curve of median derivatives (see Appendix 2) are presented in Table 2. The data on upward and downward arms of the median derivatives are shown for men and women separately. The number of subjects above the linear segment of the sigmoid (segments ♀ u3 – u6 for women and ♂ U3 - U6 for men) involved AlHn = 310 30 men and 45 women, whereas AlWBn = 232 was comprised of 23 men and 35 women. Apparently, somewhat less than 25% of the Croa-tian population has increased AlH exposure and 35% of them have increased aluminum in the whole blood (AlWB) according to the criteria graphically presented in Figure 2a and Figure 2b.
Table 2: Median derivatives to fit the power function sigmoid (see Appendix).Table 2a: Hair
www.mathewsopenaccess.com
5Citation: Momcilovic B, Prejac J, Skalny AA, Serebryansky, et al. (2016). Assessing Human Environmental Aluminum Exposure by Analysing Frequency Distribution
Properties of Hair and Whole Blood Aluminum Concentrations. M J Nutr. 1(1): 001.
Note: Common median (M0) n=232 = 0.000 µg•g-1 Al (below DL), capital let-
ters (D1 – D6, U1 – U6) men, small letters (d1 – d6, u1 – u6) women.
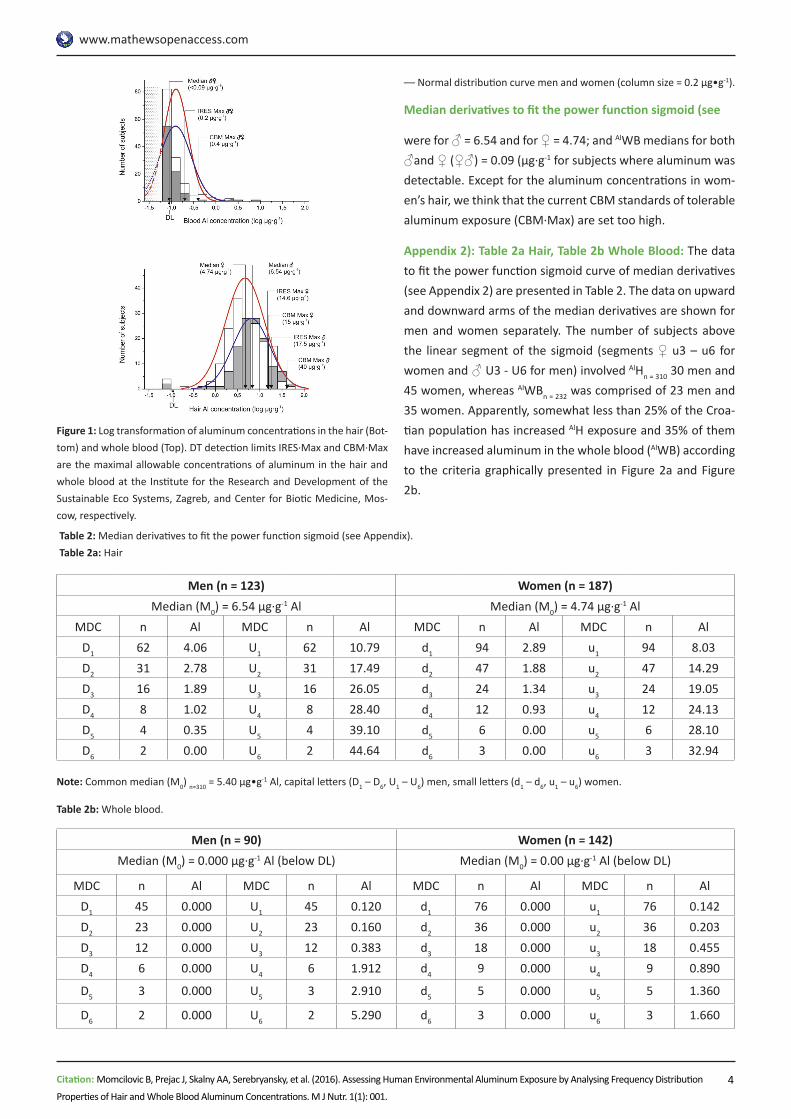
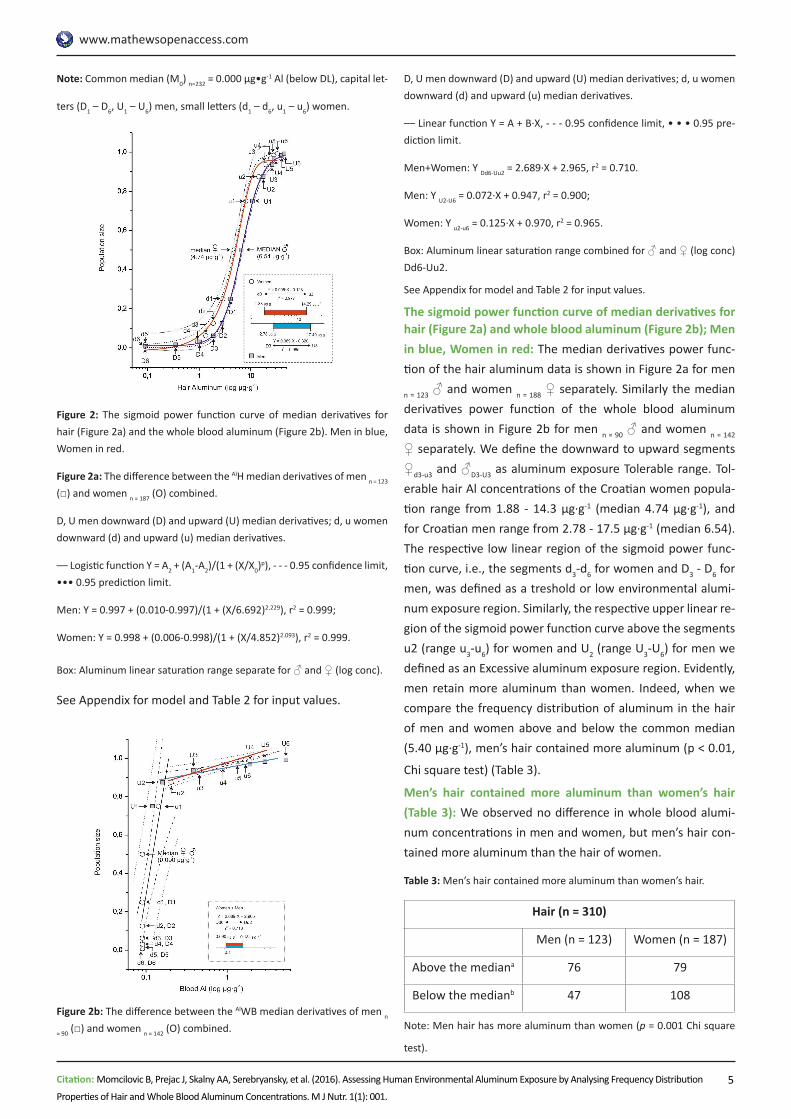
Figure 2: The sigmoid power function curve of median derivatives for hair (Figure 2a) and the whole blood aluminum (Figure 2b). Men in blue, Women in red.
Figure 2a: The difference between the AlH median derivatives of men n = 123 (□) and women n = 187 (О) combined.
D, U men downward (D) and upward (U) median derivatives; d, u women downward (d) and upward (u) median derivatives.
–– Logistic function Y = A2 + (A1-A2)/(1 + (X/X0)p), - - - 0.95 confidence limit,
••• 0.95 prediction limit.
Men: Y = 0.997 + (0.010-0.997)/(1 + (X/6.692)2.229), r2 = 0.999;
Women: Y = 0.998 + (0.006-0.998)/(1 + (X/4.852)2.093), r2 = 0.999.
Box: Aluminum linear saturation range separate for ♂ and ♀ (log conc).
See Appendix for model and Table 2 for input values.
Figure 2b: The difference between the AlWB median derivatives of men n
= 90 (□) and women n = 142 (О) combined.
D, U men downward (D) and upward (U) median derivatives; d, u women downward (d) and upward (u) median derivatives.
–– Linear function Y = A + B∙X, - - - 0.95 confidence limit, • • • 0.95 pre-diction limit.
Men+Women: Y Dd6-Uu2 = 2.689∙X + 2.965, r2 = 0.710.
Men: Y U2-U6 = 0.072∙X + 0.947, r2 = 0.900;
Women: Y u2-u6 = 0.125∙X + 0.970, r2 = 0.965.
Box: Aluminum linear saturation range combined for ♂ and ♀ (log conc) Dd6-Uu2.
See Appendix for model and Table 2 for input values.
The sigmoid power function curve of median derivatives for hair (Figure 2a) and whole blood aluminum (Figure 2b); Men in blue, Women in red: The median derivatives power func-tion of the hair aluminum data is shown in Figure 2a for men
n = 123 ♂ and women n = 188 ♀ separately. Similarly the median derivatives power function of the whole blood aluminum data is shown in Figure 2b for men n = 90 ♂ and women n = 142 ♀ separately. We define the downward to upward segments ♀d3-u3 and ♂D3-U3 as aluminum exposure Tolerable range. Tol-erable hair Al concentrations of the Croatian women popula-tion range from 1.88 - 14.3 µg∙g-1 (median 4.74 µg∙g-1), and for Croatian men range from 2.78 - 17.5 µg∙g-1 (median 6.54). The respective low linear region of the sigmoid power func-tion curve, i.e., the segments d3-d6 for women and D3 - D6 for men, was defined as a treshold or low environmental alumi-num exposure region. Similarly, the respective upper linear re-gion of the sigmoid power function curve above the segments u2 (range u3-u6) for women and U2 (range U3-U6) for men we defined as an Excessive aluminum exposure region. Evidently, men retain more aluminum than women. Indeed, when we compare the frequency distribution of aluminum in the hair of men and women above and below the common median (5.40 µg∙g-1), men’s hair contained more aluminum (p < 0.01,
Chi square test) (Table 3).
Men’s hair contained more aluminum than women’s hair (Table 3): We observed no difference in whole blood alumi-num concentrations in men and women, but men’s hair con-tained more aluminum than the hair of women.
Table 3: Men’s hair contained more aluminum than women’s hair.
Hair (n = 310)
Men (n = 123) Women (n = 187)
Above the mediana 76 79
Below the medianb 47 108
Note: Men hair has more aluminum than women (p = 0.001 Chi square
test).
www.mathewsopenaccess.com
6Citation: Momcilovic B, Prejac J, Skalny AA, Serebryansky, et al. (2016). Assessing Human Environmental Aluminum Exposure by Analysing Frequency Distribution
Properties of Hair and Whole Blood Aluminum Concentrations. M J Nutr. 1(1): 001.
a,bMedian (M0 = 5.40 µg•g-1 Al)
Whole Blood (n = 232)
Men (n = 90) Women (n = 142)Above the detection
limita
39 70
Below the detection limitb
51 72
Note: No significant sex dependent difference (p = 0.375 Chi square test)
a,bDetection limit (DL = 0.090 µg•g-1 Al)
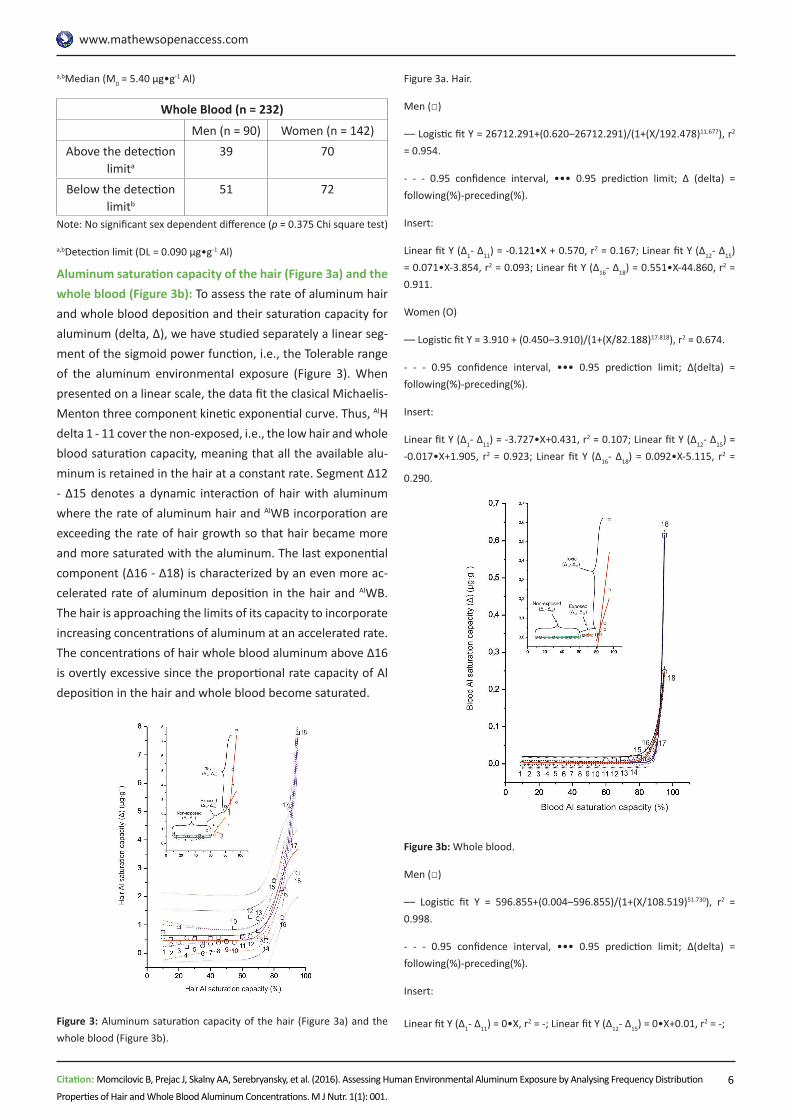
Aluminum saturation capacity of the hair (Figure 3a) and the whole blood (Figure 3b): To assess the rate of aluminum hair and whole blood deposition and their saturation capacity for aluminum (delta, ∆), we have studied separately a linear seg-ment of the sigmoid power function, i.e., the Tolerable range of the aluminum environmental exposure (Figure 3). When presented on a linear scale, the data fit the clasical Michaelis-Menton three component kinetic exponential curve. Thus, AlH delta 1 - 11 cover the non-exposed, i.e., the low hair and whole blood saturation capacity, meaning that all the available alu-minum is retained in the hair at a constant rate. Segment ∆12 - ∆15 denotes a dynamic interaction of hair with aluminum where the rate of aluminum hair and AlWB incorporation are exceeding the rate of hair growth so that hair became more and more saturated with the aluminum. The last exponential component (∆16 - ∆18) is characterized by an even more ac-celerated rate of aluminum deposition in the hair and AlWB. The hair is approaching the limits of its capacity to incorporate increasing concentrations of aluminum at an accelerated rate. The concentrations of hair whole blood aluminum above ∆16 is overtly excessive since the proportional rate capacity of Al deposition in the hair and whole blood become saturated.
Figure 3: Aluminum saturation capacity of the hair (Figure 3a) and the whole blood (Figure 3b).
Figure 3a. Hair.
Men (□)
–– Logistic fit Y = 26712.291+(0.620–26712.291)/(1+(X/192.478)11.677), r2 = 0.954.
- - - 0.95 confidence interval, ••• 0.95 prediction limit; Δ (delta) = following(%)-preceding(%).
Insert:
Linear fit Y (Δ1- Δ11) = -0.121•X + 0.570, r2 = 0.167; Linear fit Y (Δ12- Δ15) = 0.071•X-3.854, r2 = 0.093; Linear fit Y (Δ16- Δ18) = 0.551•X-44.860, r2 = 0.911.
Women (О)
–– Logistic fit Y = 3.910 + (0.450–3.910)/(1+(X/82.188)17.818), r2 = 0.674.
- - - 0.95 confidence interval, ••• 0.95 prediction limit; Δ(delta) = following(%)-preceding(%).
Insert:
Linear fit Y (Δ1- Δ11) = -3.727•X+0.431, r2 = 0.107; Linear fit Y (Δ12- Δ15) = -0.017•X+1.905, r2 = 0.923; Linear fit Y (Δ16- Δ18) = 0.092•X-5.115, r2 =
0.290.
Figure 3b: Whole blood.
Men (□)
–– Logistic fit Y = 596.855+(0.004–596.855)/(1+(X/108.519)51.730), r2 = 0.998.
- - - 0.95 confidence interval, ••• 0.95 prediction limit; Δ(delta) = following(%)-preceding(%).
Insert:
Linear fit Y (Δ1- Δ11) = 0•X, r2 = -; Linear fit Y (Δ12- Δ15) = 0•X+0.01, r2 = -;
www.mathewsopenaccess.com
7Citation: Momcilovic B, Prejac J, Skalny AA, Serebryansky, et al. (2016). Assessing Human Environmental Aluminum Exposure by Analysing Frequency Distribution
Properties of Hair and Whole Blood Aluminum Concentrations. M J Nutr. 1(1): 001.
HAIR BLOOD% Rate Al ♀
(μg∙g-
1)
Δ Al ♂
(μg∙g-
1)
Δ % Rate Al ♀
(μg∙g-1)
Δ Al ♂
(μg∙g-1)
Δ
Non-ex-
posed
10 Δ1 1.65 2.39 Non-exposed
10 Δ1 0.000 0.000
15 Δ2 1.95 0.30 2.88 0.49 15 Δ2 0.000 0.000 0.000 0.000
20 Δ3 2.34 0.39 3.81 0.93 20 Δ3 0.000 0.000 0.000 0.000
25 Δ4 2.87 0.54 4.04 0.23 25 Δ4 0.000 0.000 0.000 0.000
30 Δ5 3.37 0.50 4.57 0.53 30 Δ5 0.000 0.000 0.000 0.000
35 Δ6 3.64 0.27 4.93 0.36 35 Δ6 0.000 0.000 0.000 0.000
40 Δ7 3.96 0.33 5.46 0.53 40 Δ7 0.000 0.000 0.000 0.000
45 Δ8 4.32 0.36 6.01 0.55 45 Δ8 0.000 0.000 0.000 0.000
50 Δ9 4.73 0.41 6.43 0.42 50 Δ9 0.000 0.000 0.000 0.000
55 Δ10 5.11 0.38 7.33 0.90 55 Δ10 0.000 0.000 0.000 0.000
60 Δ11 5.67 0.56 7.92 0.59 60 Δ11 0.100 0.100 0.000 0.000
Ex-posed
65 Δ12 6.27 0.60 9.21 1.29 Exposed 65 Δ12 0.110 0.010 0.100 0.100
70 Δ13 7.49 1.23 10.00 0.79 70 Δ13 0.125 0.015 0.110 0.010
75 Δ14 7.92 0.43 10.58 0.55 75 Δ14 0.141 0.016 0.120 0.010
80 Δ15 10.49 2.57 13.13 2.55 80 Δ15 0.153 0.012 0.137 0.017
Bor-derline
85 Δ16 11.75 1.26 15.40 2.28 Border-line
85 Δ16 0.190 0.037 0.150 0.013
90 Δ17 16.83 5.08 19.40 4.00 90 Δ17 0.262 0.072 0.190 0.04095 Δ18 19.66 2.83 27.18 7.78 95 Δ18 0.510 0.248 0.805 0.615
Linear fit Y (Δ16- Δ18) = 0.036•X-3.016, r2 = 0.446.
Women (O)
–– Logistic fit Y = 675.760 + (0.004–675.760)/(1 + (X/137.860)21.305), r2 = 0.987.
- - - 0.95 confidence interval, ••• 0.95 prediction limit; Δ(delta) = following(%)-preceding(%).Insert:
Linear fit Y (Δ1- Δ11) = 0.00009•X -0.002, r2 = 0.167; Linear fit Y (Δ12- Δ15) = 0.0004•X-0.028, r2 = 0.742; Linear fit Y (Δ16- Δ18) = 0.015•X-1.207, r2 =
0.714.
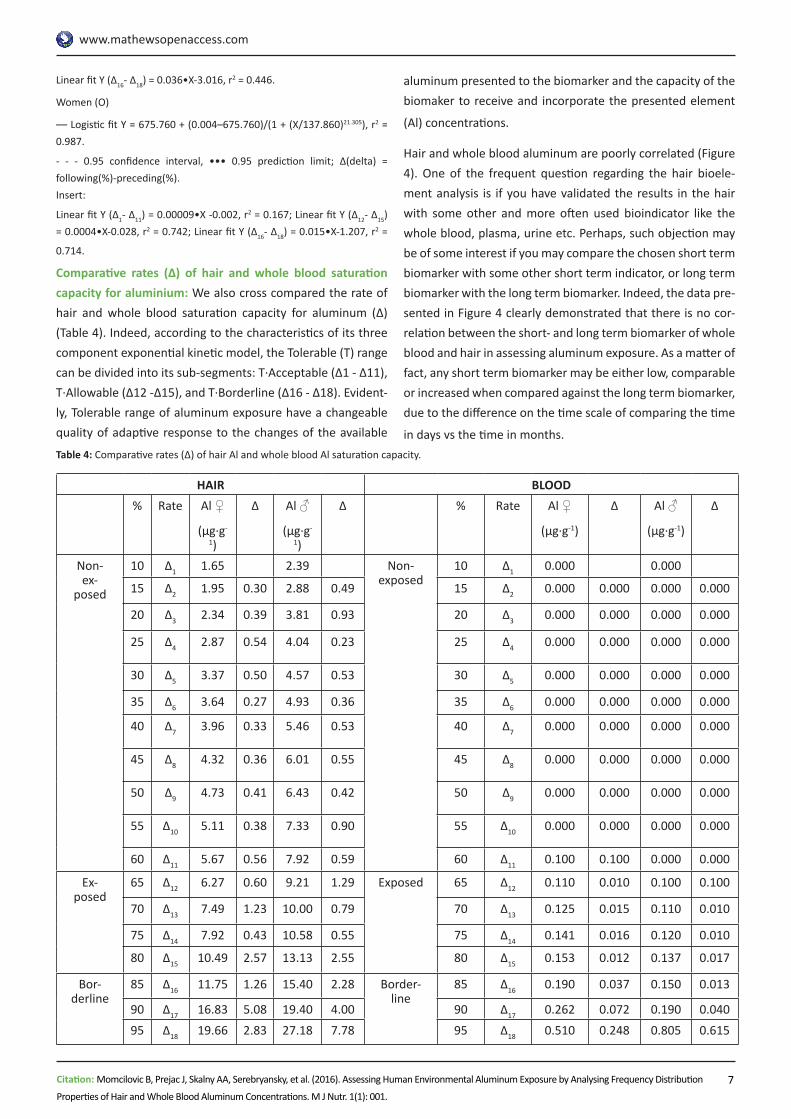
Comparative rates (∆) of hair and whole blood saturation capacity for aluminium: We also cross compared the rate of hair and whole blood saturation capacity for aluminum (∆) (Table 4). Indeed, according to the characteristics of its three component exponential kinetic model, the Tolerable (T) range can be divided into its sub-segments: T∙Acceptable (∆1 - ∆11), T∙Allowable (∆12 -∆15), and T∙Borderline (∆16 - ∆18). Evident-ly, Tolerable range of aluminum exposure have a changeable quality of adaptive response to the changes of the available
aluminum presented to the biomarker and the capacity of the biomaker to receive and incorporate the presented element
(Al) concentrations.
Hair and whole blood aluminum are poorly correlated (Figure 4). One of the frequent question regarding the hair bioele-ment analysis is if you have validated the results in the hair with some other and more often used bioindicator like the whole blood, plasma, urine etc. Perhaps, such objection may be of some interest if you may compare the chosen short term biomarker with some other short term indicator, or long term biomarker with the long term biomarker. Indeed, the data pre-sented in Figure 4 clearly demonstrated that there is no cor-relation between the short- and long term biomarker of whole blood and hair in assessing aluminum exposure. As a matter of fact, any short term biomarker may be either low, comparable or increased when compared against the long term biomarker, due to the difference on the time scale of comparing the time
in days vs the time in months.Table 4: Comparative rates (∆) of hair Al and whole blood Al saturation capacity.

www.mathewsopenaccess.com
8Citation: Momcilovic B, Prejac J, Skalny AA, Serebryansky, et al. (2016). Assessing Human Environmental Aluminum Exposure by Analysing Frequency Distribution
Properties of Hair and Whole Blood Aluminum Concentrations. M J Nutr. 1(1): 001.
Figure 4: Hair and whole blood aluminum are poorly correlated. AlH and AlWB values are shown on the X and Y axis, respectfully. IRES Institute for research and development of the sustainable eco systems, Zagreb, Croa-tia. CBM Center for biotic medicine, Moscow, Russia.
Men, ○ Women.
DISCUSSION
Today, hair is considered to be a non-invasive, reliable, repro-ducible, and affordable biomarker of the human body multi-element status in general population [24-26].
The main advantage of hair for assessing the long-term bioele-ment status, and toxic element status (body burden) in partic-ular is hair’s unidirectional growth. Once a certain bioelement is deposited in the hair, it does not equilibrate further with the body tissues, and thus serves as a permanent time log of environmental exposure. When an element is absorbed into the body, it gets widely distributed between the organs and tissues before it reaches the hair follicle and becomes irrevers-ibly deposited into the hair fibres. With the rate of hair growth of about 1 cm per month, all the homeostatically controlled changes in the bioelement concentrations are irreversibly re-corded in the hair [27,28].
However, hair bioelement analysis (macro elements, trace elements, and ultra trace elements, both essential and toxic) is notorious for the large dispersion of the analytical data. Indeed, our results on hair and whole blood aluminum con-centrations are easy to compare with those reported by the other researchers because the reported ranges are so wide that it was easy to claim the good agreement. Hence, our hair [24,29-32] and whole blood [24,29-34] aluminum values are in good agreement with the values reported by the quoted authors.
Here presented sigmoid power function of media derivatives allowed us to assess the current level of population aluminum
exposure with a resonable accuracy. More large data sets would be necessary to establish a more reliable reference sig-moid power function standards for the benefit of personalized medicine, health practices and in environmental health stud-ies, epidemiology, nutrition, and toxicology. A brief look at our median derivatives input data for the segments u3-u6 and U3 – U6 indicates that already, at the present time, there are some 30% of non-occupationaly exposed persons within the general Croatian population who are overexposed to environmental aluminum. Currently, we do not know how much somebody should be overexposed with aluminum before the clinical signs of toxicity became recognizable. We may only state that the higher the body burden of aluminum, the greater the chance that the adverse signs and symptoms of excessive aluminum exposure would become manifested. The changes in aluminum exposure may also arise from the changes in a health status.
Our approach to assessing environmental hair aluminum exposure by analyzing the median derivatives of a sigmoid power function curve allows us for the first time, to differenti-ate between the pattern of aluminum hair deposition in men and women. Indeed, women start to accumulate aluminum in the hair earlier than men do, i.e., the aluminum starts to ac-cumulate in hair at lower exposure aluminum concentrations for women. As a matter of fact, that pattern differs from the pattern observed for silver and iodine hair deposition where these two elements tend to accumulate earlier in men than women [11,22]. Such subtle sex dependent differences be-tween the hair deposition of different elements may not be detected by comparing the arithmetic means and by working with the cut off points and/or random sets of unstructured ranges. The tolerable ranges of an element in the hair also dif-fers from element to element, allowing for the possibility of a new insight into the metabolic processes of the human body and of their homeostatic control. However, this new, median derivatives approach to data analysis and data presentation as a sigmoid power function curve would require a wider valida-tion by the other scientists and comparison with other dife-rent large data sets.
CONCLUSION
Environmental aluminum from food, water and air may en-ter the human body and accumulate in human hair; this de-position of aluminum in hair is governed by the Power Law function. This study demonstrated that hair is a reliable long term biomarker for assessing the non-occupational human aluminum environmental exposure of general population. By analyzing the frequency distribution of hair aluminum it
www.mathewsopenaccess.com
9Citation: Momcilovic B, Prejac J, Skalny AA, Serebryansky, et al. (2016). Assessing Human Environmental Aluminum Exposure by Analysing Frequency Distribution
Properties of Hair and Whole Blood Aluminum Concentrations. M J Nutr. 1(1): 001.
is possible to differentiate between the Low (non-exposure Treshold), Tolerable, and Excessive level of aluminum popu-lation exposure, respectively. More research and larger data sets are required to establish the reliable power function ref-erence curves for use in personalized medicine, environmen-tal health/toxicology, and epidemiology.
DISCLOSURE STATEMENT
The authors declare no conflict of interest.
Appendix. The hair aluminum median derivatives model (Population Size, PS = 1.000)
__________________________________________________
Median (M0,n=310 = 5.40 µg•g-1)
<--------------------------------->◘<-------------------------------------->
Median Derivative Downward (Descending)
Median Derivative Upward (Ascending)
Branch (D0,n=155 = PS/2 = 0.500) Branch (U0,n=155 = PS/2 = 0.500)
Descending Median Derivatives
Ascending Median Derivatives
D1 = D0/2 0.250 U1 = U0 + U0/2 0.750
<------------◘--------------><--------------◘---------------------->
D2 = D0/4 0.125 U2 = U1 + U0/4 0.875
<------------◘------------> <------------◘------------>
D3 = D0/8 0.062 U3 = U2 + U0/8 0.937
<------◘-----> <-----◘------>
D4 = D0/16 0.030 U4 = U3 + U0/16 0.969
<--◘--> <--◘-->
D5 = D0/32 0.016 U5 = U4 + U0/32 0. 983
<◘> <◘>
D6 = D0/64 0.008 U6 = U5 + U0/64 0.992
◘ ◘
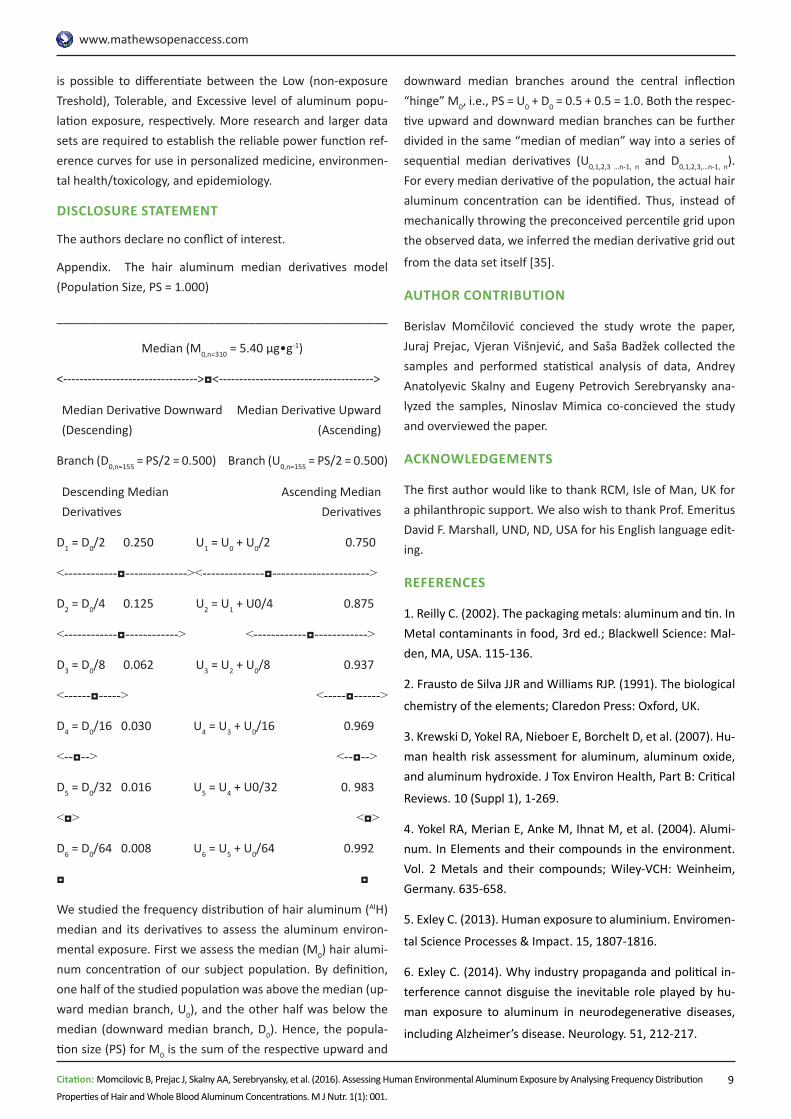
We studied the frequency distribution of hair aluminum (AlH) median and its derivatives to assess the aluminum environ-mental exposure. First we assess the median (M0) hair alumi-num concentration of our subject population. By definition, one half of the studied population was above the median (up-ward median branch, U0), and the other half was below the median (downward median branch, D0). Hence, the popula-tion size (PS) for M0 is the sum of the respective upward and
downward median branches around the central inflection “hinge” M0, i.e., PS = U0 + D0 = 0.5 + 0.5 = 1.0. Both the respec-tive upward and downward median branches can be further divided in the same “median of median” way into a series of sequential median derivatives (U0,1,2,3 …n-1, n and D0,1,2,3,…n-1, n). For every median derivative of the population, the actual hair aluminum concentration can be identified. Thus, instead of mechanically throwing the preconceived percentile grid upon the observed data, we inferred the median derivative grid out
from the data set itself [35].
AUTHOR CONTRIBUTION
Berislav Momčilović concieved the study wrote the paper, Juraj Prejac, Vjeran Višnjević, and Saša Badžek collected the samples and performed statistical analysis of data, Andrey Anatolyevic Skalny and Eugeny Petrovich Serebryansky ana-lyzed the samples, Ninoslav Mimica co-concieved the study and overviewed the paper.
ACKNOWLEDGEMENTS
The first author would like to thank RCM, Isle of Man, UK for a philanthropic support. We also wish to thank Prof. Emeritus David F. Marshall, UND, ND, USA for his English language edit-ing.
REFERENCES
1. Reilly C. (2002). The packaging metals: aluminum and tin. In Metal contaminants in food, 3rd ed.; Blackwell Science: Mal-den, MA, USA. 115-136.
2. Frausto de Silva JJR and Williams RJP. (1991). The biological
chemistry of the elements; Claredon Press: Oxford, UK.
3. Krewski D, Yokel RA, Nieboer E, Borchelt D, et al. (2007). Hu-man health risk assessment for aluminum, aluminum oxide, and aluminum hydroxide. J Tox Environ Health, Part B: Critical
Reviews. 10 (Suppl 1), 1-269.
4. Yokel RA, Merian E, Anke M, Ihnat M, et al. (2004). Alumi-num. In Elements and their compounds in the environment. Vol. 2 Metals and their compounds; Wiley-VCH: Weinheim, Germany. 635-658.
5. Exley C. (2013). Human exposure to aluminium. Enviromen-
tal Science Processes & Impact. 15, 1807-1816.
6. Exley C. (2014). Why industry propaganda and political in-terference cannot disguise the inevitable role played by hu-man exposure to aluminum in neurodegenerative diseases,
including Alzheimer’s disease. Neurology. 51, 212-217.
www.mathewsopenaccess.com
10Citation: Momcilovic B, Prejac J, Skalny AA, Serebryansky, et al. (2016). Assessing Human Environmental Aluminum Exposure by Analysing Frequency Distribution
Properties of Hair and Whole Blood Aluminum Concentrations. M J Nutr. 1(1): 001.
7. Semchuk KM, Love EJ and Lee RG. (1993). Parkinson’s dis-ease: A test of the multifactorial etiology hypothesis. Neurol-
ogy. 43(6), 1173-1180.
8. Crawford LM. (2005). Petition to rescind the “Generally rec-ognized as safe” or GRAS status for aluminum based food ad-ditives; Department of the Planet Earth: Rockville, Maryland,
USA.
9. Ysart G, Miller P, Crews H, Robb P, et al. (1993). Dietary ex-posure estimates of 30 elements from the UK Total Diet Study.
Food Additives and Contaminants. 16(9), 391-403.
10. Momčilović B, Prejac J, Višnjević V, Mimica N, et al. (2012). Environmental human silver exposure. Toxicological and Envi-
ronmental Chemistry. 94(6), 1238-1246.
11. Momčilović B, Prejac J, Višnjević V, Skalnaya MG, et al. (2014). Hair iodine for human iodine status assessment. Thy-
roid. 24(6), 1018-1026.
12. Prejac J, Višnjević V, Drmić S, Skalny AA, et al. (2014). A novel concept to derive iodine status in human populations from frequency distribution properties of a hair iodine con-centration. Journal of Trace Elements in Medicine and Biology.
28(2), 205-211.
13. Browne M. (2005). Charter of rights is adopted in the UN. The New York Times.
14. Momčilović B, Prejac J, Brundić S, Skalny AV, et al. (2010). An essay on human and elements, multielement profiles, and
depression. Translational Neuroscience. 1(4), 322-334.
15. Oppenheim AN. (2004). Questionnaire-design, interview-ing, and attitude measurement; Continuum: London.
16. Momčilović B, Morović J, Ivičić N and Skalny AV. (2006). Hair and blood multielement profile for metabolic imaging of the major unipolar depression. Study rationale and design.
Trace Elements in Medicine (Moscow). 7(4), 35-42.
17. IAEA. (1980). Elemental Analysis of biological materisals. IAEA – TEC. DOC 197; International Atomic Energy Agency: Vi-
enna.
18. Burges C. (2000). Valid analytical methods and procedures;
The Royal Society of Chemistry: Cambridge.
19. Momčilović B, Prejac J and Ivičić N. (2009). A case report on analytical reproducibility of the hair: a two years follow up.
Trace Elements in Medicine (Moscow). 10(1-2), 33-38.
20. Harbison RD. (1998). Director. Aluminum. In Hamilton &
Hardy’s Industrial Toxicology, 5th ed. 21-24; Mosby-Year Book: St. Louis, Missouri.
21. Momčilović B, Prejac J, Momčilović R, Ivičić N, et al. (2008). On the same element isotope mass number (Pleiad) and the clusters of elements bearing the same mass numbers in the Periodic system – the “chesshyja” (fish skin) model. Trace Ele-ments in Medicine (Moscow). 9(3-4), 5-20.
22. Momčilović B, Prejac J, Višnjević V, Drmić S, et al. (2012). The muscle immobility of depression – The weightlessness
within. Psychology. 3, 825-833.
23. Ferson S, Kreinovich V, Hajagos J, Oberkampf W, et al. (2007). Experimental uncertainty estmation and statistics for data having interval uncertainty. SAND2007-0939 Unlimited Release. 3-162.
24. Caroli S, Almonti A, Coni E, Petrucci F, et al. (1994). The as-sessment of reference values for elements in human biologi-cal tissues and fluids: A systematic review. Critical Reviews in
Analytical Chemistry. 24(5-6), 363-398.
25. Druyan ME, Bass D, Puchyr R, Urek K, et al. (1998). De-termination of reference ranges for elements in human scalp
hair. Biological Trace Elements Research. 62(3), 185-197.
26. Esteban M and Castaño A. (2009). Non-invasive matrices in human biomonitoring: a review. Environment International.
35(2), 438-449.
27. Rook A and Dawber R. (1982). Diseases of hair and scalp;
Blackwell Sci Publ: Oxford.
28. Robbins CR. (2012). Chemical and physical behavior of hu-
man hair. 5th ed; Springer: Berlin.
29. Iyengar GV and Voittiez JRW. (1988). Trace elerments in human clinical specimernts. Evaluation of literature data to
identify healthy reference. Clinical Chemistry. 343, 474-481.
30. Iyengar GV. (1985). Normal values for the elemental com-position of human tissues and body fluids. New look at an old problem. Trace Substances in Environmental Health. 29, 277-
295.
31. Goullé JP, Mahieu L, Casternmant J, Neveau N, et al. (2005). Metal and metalloid multi-elementary ICP-MS valida-tion in whole blood, plasma, urine and hair. Reference values.
Forensic Science International. 153(1), 39-44.
32. Wolowiec P, Michalak I, Chojnacka K and Mikulewicz M. (2013). Hair analysis in health assessment, Clinica Chimica
Acta. 419, 139-171.
www.mathewsopenaccess.com
11Citation: Momcilovic B, Prejac J, Skalny AA, Serebryansky, et al. (2016). Assessing Human Environmental Aluminum Exposure by Analysing Frequency Distribution
Properties of Hair and Whole Blood Aluminum Concentrations. M J Nutr. 1(1): 001.
33. Rodushkin I, Odman F, Olofsson R and Axelsson MD. (2000). Determination of 60 elements in whole blood by sec-tor field inductively coupled plasma mass spectrometry. Jour-
nal of Analitical Atomic Spectrometry. 15(8), 937-944.
34. Goullé JP, Le Roux P, Castanet M, Mahieu L, et al. (2015). Metallic profile of whole blood and plasma in a series of 99 healthy children. Journal of Analytical Toxicology. 39(9), 707-
713.
35. Smylevich L and Dougherty ER. (2012). ProbabilisticBool-ean network; Society for industrial and Applied Mathematics: Philadephia, PA.