Research Article Impacts of the Load Models on Optimal ...
11
Research Article Impacts of the Load Models on Optimal Planning of Distributed Generation in Distribution System Aashish Kumar Bohre, Ganga Agnihotri, Manisha Dubey, and Shilpa Kalambe Electrical Engineering Department, Maulana Azad National Institute of Technology (MANIT), Bhopal 462003, India Correspondence should be addressed to Aashish Kumar Bohre; [email protected] Received 21 May 2015; Revised 4 September 2015; Accepted 8 September 2015 Academic Editor: Alaa Sheta Copyright © 2015 Aashish Kumar Bohre et al. is is an open access article distributed under the Creative Commons Attribution License, which permits unrestricted use, distribution, and reproduction in any medium, provided the original work is properly cited. e optimal planning (sizing and siting) of the distributed generations (DGs) by using butterfly-PSO/BF-PSO technique to investigate the impacts of load models is presented in this work. e validity of the evaluated results is confirmed by comparing with well-known Genetic Algorithm (GA) and standard or conventional particle swarm optimization (PSO). To exhibit its compatibility in terms of load management, an impact of different load models on the size and location of DG has also been presented in this work. e fitness evolution function explored is the multiobjective function (FMO), which is based on the three significant indexes such as active power loss, reactive power loss, and voltage deviation index. e optimal solution is obtained by minimizing the multiobjective fitness function using BF-PSO, GA, and PSO technique. e comparison of the different optimization techniques is given for the different types of load models such as constant, industrial, residential, and commercial load models. e results clearly show that the BF-PSO technique presents the superior solution in terms of compatibility as well as computation time and efforts both. e algorithm has been carried out with 15-bus radial and 30-bus mesh system. 1. Introduction e practical system comprises various kinds of loads. Many researchers have explored efficient siting and sizing methods for distribution system. However, most of them have assumed constant load models. Constant load shows insensitivity to variations of frequency as well as voltage profile of the system. is depicts the ideal situation of the system. us all those methods fail to present the practically sound solution. It is observed that actual practical system comprised industrial, residential, and commercial loads. e Genetic Algorithm (GA) is genetic based evolutionary search algorithm. e basic concepts and applications of the Genetic Algorithms (GAs) including the various fields of optimizing the complex problems in a practical way for different functions have been analyzed in [1–3]. e standard or conventional particle swarm optimization (PSO) based optimization approach is given in [4–6]. e butterfly-particle swarm optimization (butterfly-PSO or BF-PSO) technique is based on the char- acteristic, behavior, and intelligence of the butterfly swarm search process for food, hence attraction towards food (or nectar) source which is described in [7, 8]. e simple and efficient method for solving load flow case radial distribution networks proposed by [9] involves only the evaluation of a simple algebraic expression of voltage magnitudes. e mul- tiobjective function is based on system performance indices to determine the location and size of distributed generation with the load models in the distribution system by [10, 11]. e new concept for the network reconfiguration problem considering the distributed generation (DG) to minimize the real power loss and voltage profile improvement of the distribution system is reported in [12]. e analysis of several performance indexes for multiobjective function approach in distribution network with different power factor (PF) of DG and also considering the wide range of technical issues for distribution system are presented by [13]. e different power flow methodologies to solve load flow problems are described in [14–16]. e DG planning for mesh system with several techniques is reported in [17, 18]. is paper presents the optimal sizing and siting of distributed generation (DG) with the different type of load models. en DG is considered as an active power source Hindawi Publishing Corporation Advances in Artificial Intelligence Volume 2015, Article ID 297436, 10 pages http://dx.doi.org/10.1155/2015/297436
Transcript of Research Article Impacts of the Load Models on Optimal ...

Research ArticleImpacts of the Load Models on Optimal Planning ofDistributed Generation in Distribution System
Aashish Kumar Bohre Ganga Agnihotri Manisha Dubey and Shilpa Kalambe
Electrical Engineering Department Maulana Azad National Institute of Technology (MANIT) Bhopal 462003 India
Correspondence should be addressed to Aashish Kumar Bohre aashu371984gmailcom
Received 21 May 2015 Revised 4 September 2015 Accepted 8 September 2015
Academic Editor Alaa Sheta
Copyright copy 2015 Aashish Kumar Bohre et al This is an open access article distributed under the Creative Commons AttributionLicense which permits unrestricted use distribution and reproduction in any medium provided the original work is properlycited
The optimal planning (sizing and siting) of the distributed generations (DGs) by using butterfly-PSOBF-PSO technique toinvestigate the impacts of loadmodels is presented in this workThe validity of the evaluated results is confirmed by comparing withwell-knownGenetic Algorithm (GA) and standard or conventional particle swarm optimization (PSO) To exhibit its compatibilityin terms of load management an impact of different load models on the size and location of DG has also been presented in thisworkThe fitness evolution function explored is the multiobjective function (FMO) which is based on the three significant indexessuch as active power loss reactive power loss and voltage deviation index The optimal solution is obtained by minimizing themultiobjective fitness function using BF-PSO GA and PSO technique The comparison of the different optimization techniques isgiven for the different types of loadmodels such as constant industrial residential and commercial loadmodelsThe results clearlyshow that the BF-PSO technique presents the superior solution in terms of compatibility as well as computation time and effortsboth The algorithm has been carried out with 15-bus radial and 30-bus mesh system
1 Introduction
The practical system comprises various kinds of loads Manyresearchers have explored efficient siting and sizing methodsfor distribution systemHowevermost of themhave assumedconstant load models Constant load shows insensitivity tovariations of frequency as well as voltage profile of the systemThis depicts the ideal situation of the system Thus all thosemethods fail to present the practically sound solution It isobserved that actual practical system comprised industrialresidential and commercial loads The Genetic Algorithm(GA) is genetic based evolutionary search algorithm Thebasic concepts and applications of the Genetic Algorithms(GAs) including the various fields of optimizing the complexproblems in a practical way for different functions havebeen analyzed in [1ndash3]The standard or conventional particleswarm optimization (PSO) based optimization approach isgiven in [4ndash6] The butterfly-particle swarm optimization(butterfly-PSO or BF-PSO) technique is based on the char-acteristic behavior and intelligence of the butterfly swarmsearch process for food hence attraction towards food (or
nectar) source which is described in [7 8] The simple andefficient method for solving load flow case radial distributionnetworks proposed by [9] involves only the evaluation of asimple algebraic expression of voltage magnitudes The mul-tiobjective function is based on system performance indicesto determine the location and size of distributed generationwith the load models in the distribution system by [10 11]The new concept for the network reconfiguration problemconsidering the distributed generation (DG) to minimizethe real power loss and voltage profile improvement of thedistribution system is reported in [12]The analysis of severalperformance indexes for multiobjective function approach indistribution network with different power factor (PF) of DGand also considering the wide range of technical issues fordistribution system are presented by [13]The different powerflowmethodologies to solve load flow problems are describedin [14ndash16] The DG planning for mesh system with severaltechniques is reported in [17 18]
This paper presents the optimal sizing and siting ofdistributed generation (DG) with the different type of loadmodels Then DG is considered as an active power source
Hindawi Publishing CorporationAdvances in Artificial IntelligenceVolume 2015 Article ID 297436 10 pageshttpdxdoiorg1011552015297436
2 Advances in Artificial Intelligence
Constant loadM
OF
(fitn
ess)
GAPSO
BF-PSO
5 10 15 20 25 30 35 40 45 500
Iterations
0383
0384
0385
0386
0387
0388
0389
039
0391
0392
0393
(a)
Industrial load
MO
F (fi
tnes
s)
GAPSO
BF-PSO
5 10 15 20 25 30 35 40 45 500
Iterations
0286
0288
029
0292
0294
0296
0298
03
(b)
5
MO
F (fi
tnes
s)
Residential load
GAPSO
BF-PSO
10 15 20 25 30 35 40 45 500
Iterations
038
039
04
041
042
043
044
(c)
MO
F (fi
tnes
s)
Commercial load
GAPSO
BF-PSO
5 10 15 20 25 30 35 40 45 500
Iterations
044
046
048
05
052
054
056
058
(d)
Figure 1The convergence of multiobjective function (FMO) with iterations of 15-bus radial system for (a) constant load (b) industrial load(c) residential load and (d) commercial load
at load bus The optimal site allocation and sizing of DGwith the different objective indices such as active power lossindex (PLI) reactive power loss index (QLI) and voltagedeviation index (VDI) based multiobjective function havebeen evaluated as fitness function The presented resultsexhibit the impacts of the different load models on theoverall performance of the distributed system The evaluatedresults show that the BF-PSO leads GA and PSO in terms ofcomputational time and efforts In spite of that the better per-formance characteristics can be obtained by using BF-PSO
2 Problem Formulation and Load Models
To find the optimal sizing and siting of the distributed gener-ation (DG) in the radial system with the various objectivesis achieved by the accompanying multiobjective function(FMO) as
FMO = 1198961times PLI + 119896
2timesQLI + 119896
3times VDI (1)
where sum3119894=1119896119894= 1 and 119896
119894is the weight factor for the different
index The values of 1198961 1198962 and 119896
3are 045 025 and 03
respectively The details to select the weight factor of theindices are given in [11 12 14]
The active power loss index (PLI) is
PLI =PLDG
PLNo-DG (2)
The reactive power loss index (QLI) is
QLI =QLDG
QLNo-DG (3)
The voltage deviation index (VDI) is
VDI = 119899max119895=2
(
119881reff minus 119881DG119895
119881reff) (4)
where PLDG andPLNo-DG are real power losswith andwithoutDGTheQLDG and QLNo-DG are reactive power loss with andwithout DG The 119881reff and 119881DG119895 are the reference or ratedvoltage and with-DG case voltage at bus 119895
The load models for the particular loads can be mathe-matically expressed as
119875119894= 119875119900119894119881
119886
119894
119876119894= 119876119900119894119881
119903
119894
(5)
Advances in Artificial Intelligence 3
Constant load
No-DGDG-BFPSO
00005
0010015
0020025
0030035
004PL
(MW
)
Branch number
2-3
3-4
4-5
2-9
9-10
2-6
6-7
6-8
3-11
11-12
12-13
4-14
4-15
1-2
(a)
No-DGDG-BFPSO
00002000400060008
0010012001400160018
Industrial load
PL
(MW
)
Branch number
2-3
3-4
4-5
2-9
9-10
2-6
6-7
6-8
3-11
11-12
12-13
4-14
4-15
1-2
(b)
No-DGDG-BFPSO
Residential load
Branch number
0002000400060008
00100120014
PL
(MW
)
2-3
3-4
4-5
2-9
9-10
2-6
6-7
6-8
3-11
11-12
12-13
4-14
4-15
1-2
(c)
No-DGDG-BFPSO
Commercial load
00002000400060008
0010012001400160018
PL
(MW
)
Branch number2-3
3-4
4-5
2-9
9-10
2-6
6-7
6-8
3-11
11-12
12-13
4-14
4-15
1-2
(d)
Figure 2 Active power loss of 15-bus radial system for (a) constant load (b) industrial load (c) residential load and (d) commercial load
Table 1 The exponent values for load models
Load type 119886 119903
Constant 0 0Industrial load 018 6Residential load 092 404Commercial load 151 34
where 119875119894and 119876
119894are real and reactive power at bus 119894 119875
119900119894and
119876119900119894are the active and reactive operating points at bus 119894 119881
119894is
the voltage at bus 119894 and 119886 and 119903 are active and reactive powerexponents Table 1 gives the load models exponent values [1011 13]
3 Butterfly Particle Swarm Optimization(BF-PSO) Technique
The butterfly-PSO (BF-PSO) algorithm is essentially basedon the nectar probability and the sensitivity of the butterflyswarm [7] In process for computing the optimal solutionthe degree of node in every flight of butterfly is assumed asapproximately equal to 1 because of assuming the maximumconnectivity in each flight The butterfly swarm based searchprocess investigates the optimal location depending upon thesensitivity of butterfly toward the flower and the probabilityof nectar The information about the optimal solution com-municates directly or indirectly between all the butterflies
by different means of communication intelligence (suchas dancing colors chemicals sounds physical action andnatural processes) [8] The butterfly leaning based particleswarm optimization algorithm has developed to ascertainthe optimal solutions including the random parametersacceleration coefficients probability sensitivity lbest andgbest In the butterfly-PSO lbest solutions are selected bythe individualrsquos best solution After that the gbest solutionidentified was based on the respective fitness The locations(location) of the nectar (food) source represent the probableoptimal solution for the problem and the amount of nectar(food) represents the corresponding fitnessThe detail imple-mentation of the butterfly-PSO (BF-PSO) technique is givenbelowThegeneral ranges of the sensitivity and probability areconsidered from00 to 10The velocity limits can be set basedon the limits of the problem variables Hence the functionof inertia weight sensitivity and probability as a function ofiterations can be given as [7 8]
119908119896= 09 minus (
(09 minus 04)
ITERmax) lowast ITER
119896
119904119896= exp minus
(ITERmax minus ITER119896)ITERmax
119901119896=
FITgbest119896
sum(FITlbest119896)
(6)
4 Advances in Artificial Intelligence
Branch number
Constant load
No-DGDG-BFPSO
0
0005
001
0015
002
0025
003
0035
004
QL
(MVA
R)
2-3
3-4
4-5
2-9
9-10
2-6
6-7
6-8
3-11
11-12
12-13
4-14
4-15
1-2
(a)
Industrial load
No-DGDG-BFPSO
0
0002
0004
0006
0008
001
0012
0014
0016
0018
QL
(MVA
R)
2-3
3-4
4-5
2-9
9-10
2-6
6-7
6-8
3-11
11-12
12-13
4-14
4-15
1-2
Branch number
(b)
Branch number
Residential load
No-DGDG-BFPSO
0
0002
0004
0006
0008
001
0012
QL
(MVA
R)
2-3
3-4
4-5
2-9
9-10
2-6
6-7
6-8
3-11
11-12
12-13
4-14
4-15
1-2
(c)
Branch number
Commercial load
No-DGDG-BFPSO
0
0002
0004
0006
0008
001
0012
0014
0016
0018
QL
(MVA
R)
2-3
3-4
4-5
2-9
9-10
2-6
6-7
6-8
3-11
11-12
12-13
4-14
4-15
1-2
(d)
Figure 3 The reactive power loss of 15-bus radial system for (a) constant load (b) industrial load (c) residential load and (d) commercialload
where ITERmax is maximum number of iterations and ITER119896
is 119896th iteration count And FITlbest119896 is fitness of local bestsolutions with 119896th iteration and FITgbest119896 is fitness of globalbest solutions with 119896th iteration
Then the equations of BF-PSO technique given below forthe velocity and position updating are
V1015840(119896+1)= 119908 lowast V
119896
+ 119904119896(1 minus 119901
119896) 11988811199031(lbest
119896minus currentpop)
+ 11990111989611988821199032(gbest
119896minus currentpop)
119909(119896+1)= 119909119896+ V1015840119896+1
(7)
The detail algorithm to find the optimal sizing and location ofDG using GA PSO and butterfly-PSO (BF-PSO) techniqueis given as follows
(1) Read and input the systems data (bus data line datageneration data etc)
(2) Run and execute the NR-power flow results for no-DG case including load models
(3) Initialize all the parameters of GA (populationselection rate mutation rate iterations etc) PSO(1198881 1198882 119908) and BF-PSO (119888
1 1198882 119908119896 119901119896 and 119904
119896) The
variables can be defined as
119909 = [119875dg1 119875dg2 119875DG119873 119871dg1 119871dg2 119871DG119873] (8)
where119873 is number of population for GA number ofswarm for PSO and the number of butterfly swarmfor BF-PSOThe119875dg and 119871dg areDG size and locationrespectively
(4) Update the variables within the algorithm usingthe different operators (selection crossover andmutation) for GA equations (velocity and posi-tionslocations) for PSO and equations (velocitylocations inertia weight sensitivity and probability)for BF-PSO
(5) After that assign the DG size and location in thesystem excluding the slack and PV buses
(6) After that call the NR-power flow and execute theresults with DG condition including load models
Advances in Artificial Intelligence 5
Constant load
No-DGDG-BFPSO
094
095
096
097
098
099
1
V(p
u)
2 3 4 5 6 7 8 9 10 11 12 13 14 151
Bus number
(a)
Industrial load
V(p
u)
No-DGDG-BFPSO
0965
097
0975
098
0985
099
0995
1
1005
4 6 8 10 12 142
Bus number
(b)
No-DGDG-BFPSO
2 4 6 8 10 12 14
Residential load
V(p
u)
Bus number
097
0975
098
0985
099
0995
1
1005
(c)
No-DGDG-BFPSO
2 4 6 8 10 12 14
Commercial load
V(p
u)
Bus number
0965
097
0975
098
0985
099
0995
1
1005
(d)Figure 4 The voltage profile of 15-bus radial system for (a) constant load (b) industrial load (c) residential load and (d) commercial load
(7) Calculate the all indices value for the multiobjectivefunction with each technique
(8) Evaluate the fitness value for each technique of multi-objective function
(9) Compare the variables from previous variables foreach technique
(10) Check for termination criteria if otherwise repeatalgorithm from step (3) to step (9)
(11) Repeat this procedure up to maximum number ofiterations
(12) Record and save all the output data of the system
The parameters such as population size for GA and alsoswarm size for PSO and BF-PSO are assumed 30 in all the testsystemsThe iterations forGA PSO andBF-PSOare assumedto be 50 respectively for all test systems
4 Results and Discussions
This proposed algorithm has been tested on 15-bus radialsystem [9] and 30-bus mesh system [17 18] with a base of100MVAThe range of DG size is 00 to maximum load (sumof all power demands) in the system The DG is considered
at a unity power factor The loads are dependent on thevoltage that is real and reactive load demand depends onthe voltage magnitude of the particular bus The range of DGsize is 00 to maximum load (sum of all power demands)in the system All the results for proposed methodology arecarried out with MATLAB (2009a)Matpowe41 tool withthe system configuration Windows 81 AMD-E1-1500APU148GHz 20GB RAM
41 The 15-Bus Radial System The data of 15-bus radialsystem is given in [9] The performance results of the 15-bus radial system are shown in Figures 1ndash4 Figure 1 showsthe results for the convergence of multiobjective function(FMO)with iterations for the constant industrial residentialand commercial loads The convergence towards the optimalvalue of the function varies with an optimization techniqueas shown for GA PSO and BF-PSO The comparativeanalysis indicates that the convergence of BF-PSO techniqueis better and faster than GA and PSO Hence overall systemperformance is computed by BF-PSO technique
The impacts of load models on the active and reactivepower losses of 15-bus radial system are shown in Figures2 and 3 respectively The BF-PSO reveals that the activeand reactive power loss of system with constant industrialresidential and commercial loads are varied in the same
6 Advances in Artificial Intelligence
GAPSO
BF-PSO
00800901011012013014015016017
MO
F (fi
tnes
s)
5 10 15 20 25 30 35 40 45 500
Iterations
Constant load
(a)
Industrial load
GAPSO
BF-PSO
MO
F (fi
tnes
s)
01
012
014
016
018
02
022
0 10 15 20 25 30 35 40 45 505
Iterations
(b)
GAPSO
BF-PSO
Residential load
01
015
02
025
03
MO
F (fi
tnes
s)
0 10 15 20 25 30 35 40 45 505
Iterations
(c)
GAPSO
BF-PSO
Commercial load
009009501
0105011011501201250130135
MO
F (fi
tnes
s)5 10 15 20 25 30 35 40 45 500
Iterations
(d)
Figure 5The convergence of multiobjective function (FMO) with iterations of 30-bus mesh system for (a) constant load (b) industrial load(c) residential load and (d) commercial load
proportion as size and the location of DG vary The activepower loss of system with DG using BF-PSO technique isless as compared to without- or no-DG case The impactsof load models on sizing and siting as well as on the activepower losses are different with DGThe reactive power losseswithout and with DG using BF-PSO technique for loadmodels are given in Figure 3The result shows the effect of theload models on the reactive power loss with DG condition
The impact of different load models on the voltage profileusing BF-PSO is shown in Figure 4 The voltage profiles ofthe system are distinguished for the different type of loadmodels The improvement in the voltage profile with DG-BFPSO is more efficient for all load models Table 2 givesthe values of the system indices using different methods withDG condition These values are the optimal solution valuesof different technique for load models Value of the multi-objective function (FMO) size of DG (PDG) and optimalbus location of DG are given in Table 3 Minimum value ofthe fitness function (FMO) is obtained using BF-PSOmethodfor all load models hence all system results evaluated forBF-PSO method The value of FMO is 04335 PDG is 10355and optimal bus location is 3 using BF-PSO for the constantloadThe value of FMO is 04346 PDG is 09703 and optimalbus location is 3 using PSO for the constant load The valueof FMO is 04375 PDG is 11596 and optimal bus locationis 3 using GA for the constant load Similarly the impactsof industrial residential and commercial load models on
Table 2Objective indices of 15-bus radial systemwith different loadmodels using GA PSO and BF-PSO
Load type PLI QLI VDI Technique
Constant load06123 05931 00324 BF-PSO06133 0594 00338 PSO06188 06001 00302 GA
Industrial load03782 03404 00187 BF-PSO0402 03662 002 PSO05006 04483 0022 GA
Residential load05453 05093 00195 BF-PSO05637 05303 00212 PSO0644 06003 00229 GA
Commercial load06603 06285 00198 BF-PSO06715 06379 00188 PSO07387 07034 00227 GA
the multi-objective function (FMO) size of DG (PDG) andoptimal bus location of DG can be analyzed
42 The 30-Bus Mesh System The all data information aboutthe 30-busmesh system data have given in [17]The proposedalgorithm applied to minimize the multi-objective functionfor the 30-bus mesh system in this section The results of the30-busmesh system are shown in Figures 5ndash8 and Tables 4ndash6
Advances in Artificial Intelligence 7
Constant load
No-DGDG-BFPSO
Branch number0 5 10 15 20 25 30 35 40 45
PL
(MW
)
0
1
2
3
4
5
6
(a)
No-DGDG-BFPSO
Industrial load
Branch number0 5 10 15 20 25 30 35 40 45
PL
(MW
)
0
1
2
3
4
5
6
(b)
Branch number
No-DGDG-BFPSO
Residential load
0 5 10 15 20 25 30 35 40 45
PL
(MW
)
0
1
2
3
4
5
6
(c)
No-DGDG-BFPSO
Commercial load
Branch number0 5 10 15 20 25 30 35 40 45
0
1
2
3
4
5
6
PL
(MW
)
(d)
Figure 6 Active power loss of 30-bus mesh system for (a) constant load (b) industrial load (c) residential load and (d) commercial load
Table 3 Multiobjective function and DG size at optimal buslocation with different load models for 15-bus radial system usingGA PSO and BF-PSO
Load Type Fitness (FMO) PDG Bus Technique
Constant load04335 10355 3 BF-PSO04346 09703 3 PSO04375 11596 3 GA
Industrial load02609 08549 3 BF-PSO02785 07232 4 PSO03439 05862 15 GA
Residential load03786 0672 3 BF-PSO03926 05697 4 PSO04467 04502 15 GA
Commercial load04602 05505 3 BF-PSO04673 0644 3 PSO05151 0363 15 GA
The result for convergence of multi-objective function(FMO) with iterations for the constant industrial residentialand commercial loads are shown in Figure 5 The conver-gence towards the optimal value of the function varies withan optimization technique for 30-bus mesh system as shownfor GA PSO and BF-PSOThe comparative analysis indicates
that the convergence of BF-PSO technique is better andfaster than GA and PSO Hence overall 30-bus mesh systemperformance is computed only for BF-PSO technique TheBF-PSO results for active power loss of system with constantindustrial residential and commercial loads are shown inFigure 6 The result presents that the active power loss ofsystem with DG using BF-PSO technique is less as comparedto that without DG condition The impacts of load modelson size and location as well as on the active power lossesof 30-bus mesh system are different with DG cases Thereactive power losses without and with DG using BF-PSOtechnique for 30-busmesh systemwith loadmodels are givenin Figure 7 The result shows the effect of the load modelson the reactive power loss of 30-bus mesh system with DGcondition
The voltage profiles of the system are dissimilar for theparticular load models of the system The change in voltageprofiles of the system occurs due to variations in the size andlocation of DG The impact of different load models on thevoltage profile of 30-busmesh system using BF-PSO is shownin Figure 8The improvement in the voltage profile with DG-BFPSO is more efficient for all load models The values ofthe system indices for 30-bus mesh system using differentmethodswithDGcondition are given in Table 4These valuesare the optimal solution values of different technique for loadmodels The value of multiobjective function (FMO) size
8 Advances in Artificial Intelligence
Constant load
No-DGDG-BFPSO
QL
(MVA
R)
5 10 15 20 25 30 35 40 450
Branch number
0
1
2
3
4
5
6
7
8
9
10
(a)
Industrial load
QL
(MVA
R)
0
1
2
3
4
5
6
7
8
9
10
5 10 15 20 25 30 35 40 450
Branch number
No-DGDG-BFPSO
(b)
No-DGDG-BFPSO
Residential load
QL
(MVA
R)
0
2
4
6
8
10
12
5 10 15 20 25 30 35 40 450
Branch number
(c)
No-DGDG-BFPSO
Commercial load
QL
(MVA
R)
0
2
4
6
8
10
12
5 10 15 20 25 30 35 40 450
Branch number
(d)
Figure 7 The reactive power loss of 30-bus mesh system for (a) constant load (b) industrial load (c) residential load and (d) commercialload
Table 4Objective indices of 30-busmesh systemwith different loadmodels using GA PSO and BF-PSO
Load type PLI QLI VDI Technique
Constant load03073 minus02643 minus00048 BF-PSO03071 minus02634 minus00046 PSO03185 minus02528 minus0006 GA
Industrial load03111 minus02296 00004 BF-PSO03155 minus02266 minus00002 PSO03197 minus02215 minus00004 GA
Residential load03078 minus02032 minus0001 BF-PSO03085 minus02034 minus00012 PSO0317 minus01799 00001 GA
Commercial load03059 minus01791 minus00016 BF-PSO03068 minus0179 minus00018 PSO03061 minus01765 minus00012 GA
of DG (PDG) and optimal bus location of DG are givenin Table 5 The minimum value of fitness function (FMO)is obtained by using BF-PSO technique for different loadmodels hence all system results are evaluated for BF-PSOmethod The value of FMO is 00708 PDG is 2029922 andoptimal bus location is 6 using BF-PSO for the constant loadThe value of FMO is 00710 PDG is 1992922 and optimal
Table 5 Multiobjective function and DG size at optimal buslocation with different load models for 30-bus mesh system usingGA PSO and BF-PSO
Load type Fitness function(FMO) PDG Bus Technique
Constant load00708 2029922 6 BF-PSO00710 1992922 6 PSO00784 2261614 6 GA
Industrial load00827 2032873 7 BF-PSO00853 2168522 7 PSO00884 2235097 6 GA
Residential load00874 2063894 7 BF-PSO00876 2108828 7 PSO00977 1792814 7 GA
Commercial load00924 2100633 6 BF-PSO00925 2150907 6 PSO00932 2019343 6 GA
bus location is 6 using PSO for the constant load The valueof FMO is 00784 PDG is 2261614 and optimal bus locationis 6 using GA for the constant load Similarly the impactsof industrial residential and commercial load models on
Advances in Artificial Intelligence 9
Constant load
DG-BFPSONo-DG
097
098
099
10
101
102
5 10
Bus number15 20 25 30
V(p
u)
(a)
DG-BFPSONo-DG
Industrial load
098
0985
099
0995
10
1005
101
1015
5 10
Bus number15 20 25 30
V(p
u)
(b)
DG-BFPSONo-DG
Residential load
098
0985
099
0995
10
1005
101
5 10
Bus number15 20 25 30
V(p
u)
(c)
DG-BFPSONo-DG
Commercial load
098
0985
099
0995
10
1005
101
5 10
Bus number15 20 25 30
V(p
u)
(d)
Figure 8 The voltage profile of 30-bus mesh system for (a) constant load (b) industrial load (c) residential load and (d) commercial load
Table 6 The comparative analysis of 30-bus radial system
CasesParameter
Active powerloss (MW)
Active power lossreduction ()
Reactive power loss(MVAr)
Reactive power lossreduction ()
Without-DG (base case) 17557 mdash 6769 mdashWith-DG
Existing (75 DG penetration) 70973 [17] 5957 NA NAProposed (DG-BFPSO) 5396 6927 2632 6111
the multiobjective function (FMO) size of DG (PDG) andoptimal bus location of DG can be analyzed
The comparative analysis of the proposed and the existingmethodology is given in Table 6 for the 30-bus mesh systemThis analysis shows that the reduction in active power losswith existing methodology is 5957The reduction in activeand reactive power losses with the proposed methodology is6927 and 6111 respectively for 30-bus mesh systemThisresult analysis accomplishes the idea that themore power lossreduction is achieved by proposedmethodology as comparedto existing methodology
5 Conclusions
The proposed methodology is implemented on the 15-busradial and 30-bus mesh system and the comparative analysis
for 30-bus mesh system with proposed and the existingmethodology is given in Section 4 It shows that reduction inactive power loss with existing methodology is up to 5957whereas the reduction in active and reactive power losseswith the proposed methodology is up to 6927 and 6111respectively for 30-bus mesh system Hence the more powerloss reduction is obtained by proposed methodology thanthe existing one This result analysis demonstrates that theBF-PSO technique based algorithm is an efficient algorithmon the basis of hybridization of butterfly and the particleswarm techniques It is observed that the hybridization of twoallegiant techniques provides the unique combo to evaluatethe system performance In this work also the presentedresults are compared between with- and without-DG casesusing GA PSO and BF-PSO techniqueThe effect of differenttypes of load in the system is assumed while tackling the
10 Advances in Artificial Intelligence
optimal sizing and siting of DG problems in the system Itis clearly shown in the results that the performance of thesystem such as reduction in losses and increase in voltageshas improved Also the size and location of DG vary withdifferent load models for GA PSO and BF-PSO technique
Conflict of Interests
The authors declare that there is no conflict of interestsregarding the publication of this paper
Acknowledgments
The authors wish to acknowledge the MANIT Bhopal andMHRD for financial support Furthermore the authors wantto extend acknowledgment to those who have supportedthem directly or indirectly
References
[1] J H Holland Adaptation in Natural and Artificial Systems TheUniversity of Michigan Press Ann Arbor Mich USA 1975
[2] D E Goldberg Genetic Algorithms in Search Optimization andMachine Learning Addison-Wesley 1st edition 1989
[3] R L Haupt and S E Haupt Practical Genetic Algorithms JohnWiley amp Sons Hoboken NJ USA 2nd edition 2004
[4] E Bonabeau M Dorigo and G Theraulaz Swarm IntelligenceFrom Natural to Artificial Systems Oxford University PressOxford UK 1999
[5] J Kennedy and R Eberhart ldquoParticle swarm optimizationrdquoin Proceedings of the IEEE International Conference on NeuralNetworks vol 4 pp 1942ndash1948 Perth Australia December1995
[6] R C Eberhart and J Kennedy ldquoA new optimizer using particleswarm theoryrdquo in Proceedings of the 6th International Sympo-sium on Micro Machine and Human Science (MHS rsquo95) pp 39ndash43 IEEE Service Center Nagoya Japan October 1995
[7] A K Bohre G Agnihotri and M Dubey ldquoHybrid butterflybased particle swarm optimization for optimization problemsrdquoin Proceedings of the 1st International Conference on Networksand Soft Computing (ICNSC rsquo14) pp 172ndash177 Guntur IndiaAugust 2014
[8] A K Bohre G Agnihotri M Dubey and J S BhadoriyaldquoA novel method to find optimal solution based on modifiedbutterfly particle swarm optimizationrdquo International Journal ofSoft Computing Mathematics and Control vol 3 no 4 pp 1ndash142014
[9] D Das D P Kothari and A Kalam ldquoSimple and efficientmethod for load flow solution of radial distribution networksrdquoInternational Journal of Electrical Power andEnergy Systems vol17 no 5 pp 335ndash346 1995
[10] D Singh D Singh and K S Verma ldquoMultiobjective optimiza-tion for DG planning with load modelsrdquo IEEE Transactions onPower Systems vol 24 no 1 pp 427ndash436 2009
[11] A M El-Zonkoly ldquoOptimal placement of multi-distributedgeneration units including different load models using particleswarm optimizationrdquo Swarm and Evolutionary Computationvol 1 no 1 pp 50ndash59 2011
[12] R S Rao K Ravindra K Satish and S V L NarasimhamldquoPower loss minimization in distribution system using network
reconfiguration in the presence of distributed generationrdquo IEEETransactions on Power Systems vol 28 no 1 pp 317ndash325 2013
[13] L F Ochoa A Padilha-Feltrin and G P Harrison ldquoEvaluatingdistributed generation impacts with a multiobjective indexrdquoIEEE Transactions on Power Delivery vol 21 no 3 pp 1452ndash1458 2006
[14] D Thukaram H M Wijekoon Banda and J Jerome ldquoArobust three phase power flow algorithm for radial distributionsystemsrdquo Electric Power Systems Research vol 50 no 3 pp 227ndash236 1999
[15] R D Zimmerman and C E Murillo-Sanchez ldquoMatpower41rdquoDecember 2011 httpwwwpserccornelledumatpower
[16] H Sadat Power System Analyses TMH Publication 2002[17] F Ugranli and E Karatepe ldquoConvergence of rule-of-thumb
sizing and allocating rules of distributed generation in meshedpower networksrdquo Renewable and Sustainable Energy Reviewsvol 16 no 1 pp 582ndash590 2012
[18] A K Bohre G Agnihotri and M Dubey ldquoThe OPF andbutterfly-PSO (BF-PSO) technique based optimal location andsizing of distributed generation in mesh systemrdquo Electrical andElectronics Engineering An International Journal vol 4 no 2pp 127ndash141 2015
Submit your manuscripts athttpwwwhindawicom
Computer Games Technology
International Journal of
Hindawi Publishing Corporationhttpwwwhindawicom Volume 2014
Hindawi Publishing Corporationhttpwwwhindawicom Volume 2014
Distributed Sensor Networks
International Journal of
Advances in
FuzzySystems
Hindawi Publishing Corporationhttpwwwhindawicom
Volume 2014
International Journal of
ReconfigurableComputing
Hindawi Publishing Corporation httpwwwhindawicom Volume 2014
Hindawi Publishing Corporationhttpwwwhindawicom Volume 2014
Applied Computational Intelligence and Soft Computing
thinspAdvancesthinspinthinsp
Artificial Intelligence
HindawithinspPublishingthinspCorporationhttpwwwhindawicom Volumethinsp2014
Advances inSoftware EngineeringHindawi Publishing Corporationhttpwwwhindawicom Volume 2014
Hindawi Publishing Corporationhttpwwwhindawicom Volume 2014
Electrical and Computer Engineering
Journal of
Journal of
Computer Networks and Communications
Hindawi Publishing Corporationhttpwwwhindawicom Volume 2014
Hindawi Publishing Corporation
httpwwwhindawicom Volume 2014
Advances in
Multimedia
International Journal of
Biomedical Imaging
Hindawi Publishing Corporationhttpwwwhindawicom Volume 2014
ArtificialNeural Systems
Advances in
Hindawi Publishing Corporationhttpwwwhindawicom Volume 2014
RoboticsJournal of
Hindawi Publishing Corporationhttpwwwhindawicom Volume 2014
Hindawi Publishing Corporationhttpwwwhindawicom Volume 2014
Computational Intelligence and Neuroscience
Industrial EngineeringJournal of
Hindawi Publishing Corporationhttpwwwhindawicom Volume 2014
Modelling amp Simulation in EngineeringHindawi Publishing Corporation httpwwwhindawicom Volume 2014
The Scientific World JournalHindawi Publishing Corporation httpwwwhindawicom Volume 2014
Hindawi Publishing Corporationhttpwwwhindawicom Volume 2014
Human-ComputerInteraction
Advances in
Computer EngineeringAdvances in
Hindawi Publishing Corporationhttpwwwhindawicom Volume 2014
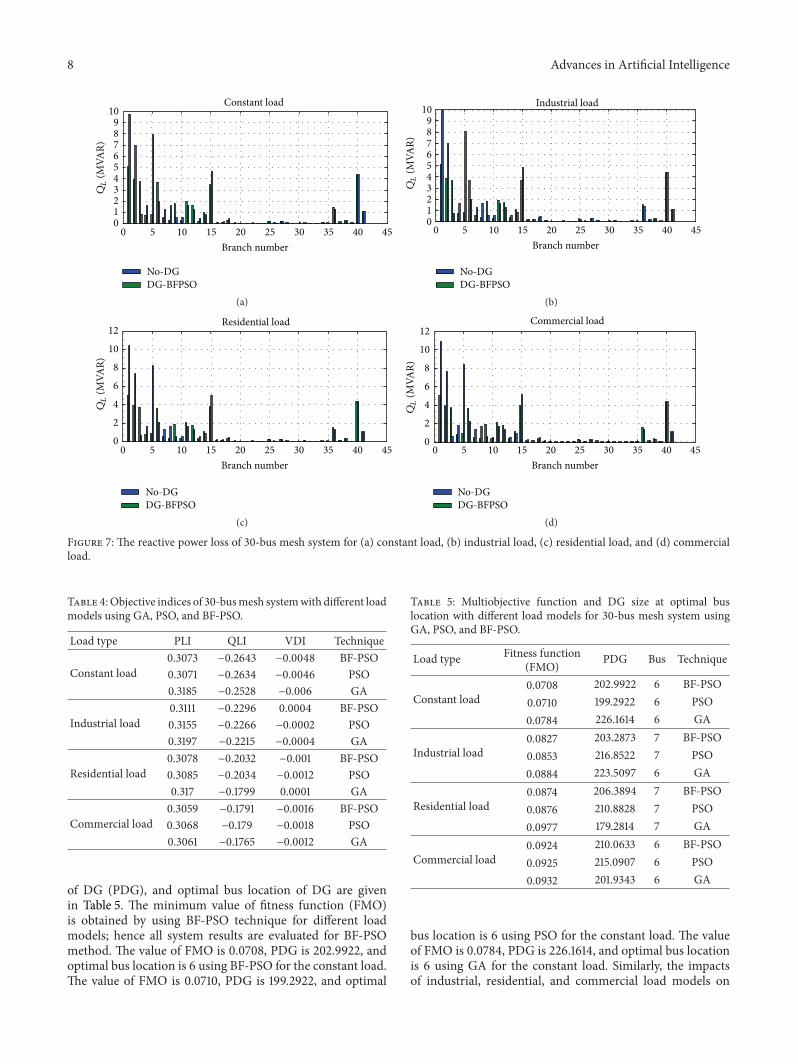