
REPUBLIC OF IRAQ MINISTRY OF ELECTRICITY IRAQ ELECTRICITY MASTERPLAN FINAL REPORT...
63
REPUBLIC OF IRAQ MINISTRY OF ELECTRICITY IRAQ ELECTRICITY MASTERPLAN FINAL REPORT VOLUME 1 EXECUTIVE SUMMARY DECEMBER 2010
Transcript of REPUBLIC OF IRAQ MINISTRY OF ELECTRICITY IRAQ ELECTRICITY MASTERPLAN FINAL REPORT...
REPUBLIC OF IRAQ MINISTRY OF ELECTRICITY IRAQ ELECTRICITY MASTERPLAN FINAL REPORT VOLUME 1 EXECUTIVE SUMMARY DECEMBER 2010


Wxw|vtàxw àÉ à{x ÅxÅÉÜç Éy gxÜÜç UtÜÇ|v{
I `tÜv{ DLHF „ EH `tç ECCL j|à{Éâà ã{Éáx yÉÜxá|z{à? ä|á|ÉÇ tÇw wÜ|äx? à{|á ÑÜÉ}xvà
ãÉâÄw ÇÉà {täx uxxÇ ÑÉáá|uÄx


IRAQ ELECTRICITY MASTERPLAN
Overall Table of Contents
Volume 1 Executive Summary Volume 2 Load Forecasting Volume 3 Generation Planning Volume 4 Transmission Planning
Part 1 Short Term Part 2 Long Term
Volume 5 Distribution Planning


Parsons Brinckerhoff List of Revisions
LIST OF REVISIONS
Current Rev.
Date Page affected
Prepared by Checked by
(technical)
Checked by (quality assurance)
Approved by
1 30 December 2010
v, 2,3,15,17,18,21, 23,33,34,36,38,43,44,46,47,49
A. Pearce I. Harlow M. A. Hussain A. Topari
A. Pearce D. Thorn J. Larkin
0 20 December 2010
-
A. Pearce I. Harlow M. A. Hussain A. Topari
A. Pearce D. Thorn J. Larkin
REVISION HISTORY
1 Correct Figure 8 inserted. Typographical errors corrected.
0 Masterplan Final Report
Executive Summary Final Report

Executive Summary Final Report
Parsons Brinckerhoff Page i of i
CONTENTS
Page
1. Introduction ...................................................................................................................... 1
2. Overall Summary ............................................................................................................. 3
3. Load Forecasting ............................................................................................................. 4
3.1 Approach ................................................................................................................. 4
4. Generation Planning ........................................................................................................ 8
4.1 Introduction .............................................................................................................. 8
4.2 Fuel .......................................................................................................................... 8
4.3 Existing and Committed Generation ...................................................................... 11
4.4 Candidate Plant ..................................................................................................... 13
4.5 Recommended Generation Plan ........................................................................... 14
4.6 Conclusions and Recommendations from Generation Planning ........................... 19
5. Short Term Transmission Planning ................................................................................ 20
5.1 Introduction ............................................................................................................ 20
5.2 Planning Standards ............................................................................................... 20
5.2.1 Recommended Planning Standards .................................................................. 20
5.3 Existing Transmission System ............................................................................... 21
5.3.1 Introduction ........................................................................................................ 21 5.3.2 Problems with the Existing System .................................................................... 21
5.4 Short Term Plan 2010-2015 .................................................................................. 22
5.4.1 ME Generation Plan .......................................................................................... 22 5.4.2 Network .............................................................................................................. 22
5.5 System Expansion Requirements.......................................................................... 22
5.6 Conclusions and Recommendations from Short-Term Transmission Planning .... 23
5.6.1 132 kV Network ................................................................................................. 23 5.6.2 400 kV Network ................................................................................................. 23
6. Long Term Transmission Planning ................................................................................ 29
6.1 Introduction ............................................................................................................ 29
6.2 Methodology .......................................................................................................... 29
6.3 Demand and Generation Distribution .................................................................... 30
6.4 Gas Resources and Pipelines ............................................................................... 31
6.5 Power or Gas Transfer Comparison ...................................................................... 33
6.6 Power System Analysis and Network Design ........................................................ 34
6.7 Required Reinforcements and Costs ..................................................................... 36
6.8 Conclusions and Recommendations from Long-Term Transmission Planning ..... 38
7. Distribution Planning ...................................................................................................... 43
Executive Summary Final Report
Parsons Brinckerhoff Page ii of ii
7.1 Introduction ............................................................................................................ 43
7.2 Capacity Development .......................................................................................... 43
7.3 Background ........................................................................................................... 44
7.4 Methodology .......................................................................................................... 44
7.5 Planning Standards and Guidelines ...................................................................... 44
7.6 Network Modelling ................................................................................................. 45
7.7 Estimated Investment Costs .................................................................................. 45
7.8 Main Recommendations from Distribution Planning .............................................. 46
7.8.1 Capacity Development ....................................................................................... 46 7.8.2 Loss Reduction .................................................................................................. 46 7.8.3 Planning Standards and Guidelines .................................................................. 47 7.8.4 Planning Information .......................................................................................... 47 7.8.5 Condition Assessment ....................................................................................... 47 7.8.6 Meter Installation Programme ............................................................................ 48
8. Investment Summary ..................................................................................................... 49
Executive Summary Final Report
Parsons Brinckerhoff Page iii of iii
LIST OF FIGURES Figure 1 High, Base and Low Case Load Forecasts ............................................................... 5
Figure 2 Summer Weekday Load Curve for IEK ..................................................................... 6
Figure 3 Annual Load Duration Curve for IEK ......................................................................... 7
Figure 4 Existing Hydrocarbon Resources in Iraq ................................................................... 9
Figure 5 Fuel Burn for Electricity Production in 2009 ............................................................ 11
Figure 6 Recommended Generation Plan – Capacity and Demand ..................................... 15
Figure 7 Gas Burn MMSCF/day – Recommended Plan ....................................................... 17
Figure 8 HFO Burn Tonnes/day – Recommended Plan ........................................................ 17
Figure 9 400 kV & 132 kV Existing Transmission Network – Load Centres and Transmission Directorates ............................................................................................................................ 26
Figure 10 400 kV & 132 kV Network of Baghdad City – Required Re-Configuration ............ 27
Figure 11 ME Committed Short-Term Plan ........................................................................... 28
Figure 12 MO Gas and Gas Pipe Lines (Committed/Planned) ............................................. 32
Figure 13 Model for Power/Gas Transfer .............................................................................. 35
Figure 14 Expected Future Development of the 400kV System ........................................... 41
Figure 15 General Methodology ............................................................................................ 44
Executive Summary Final Report
Parsons Brinckerhoff Page iv of iv
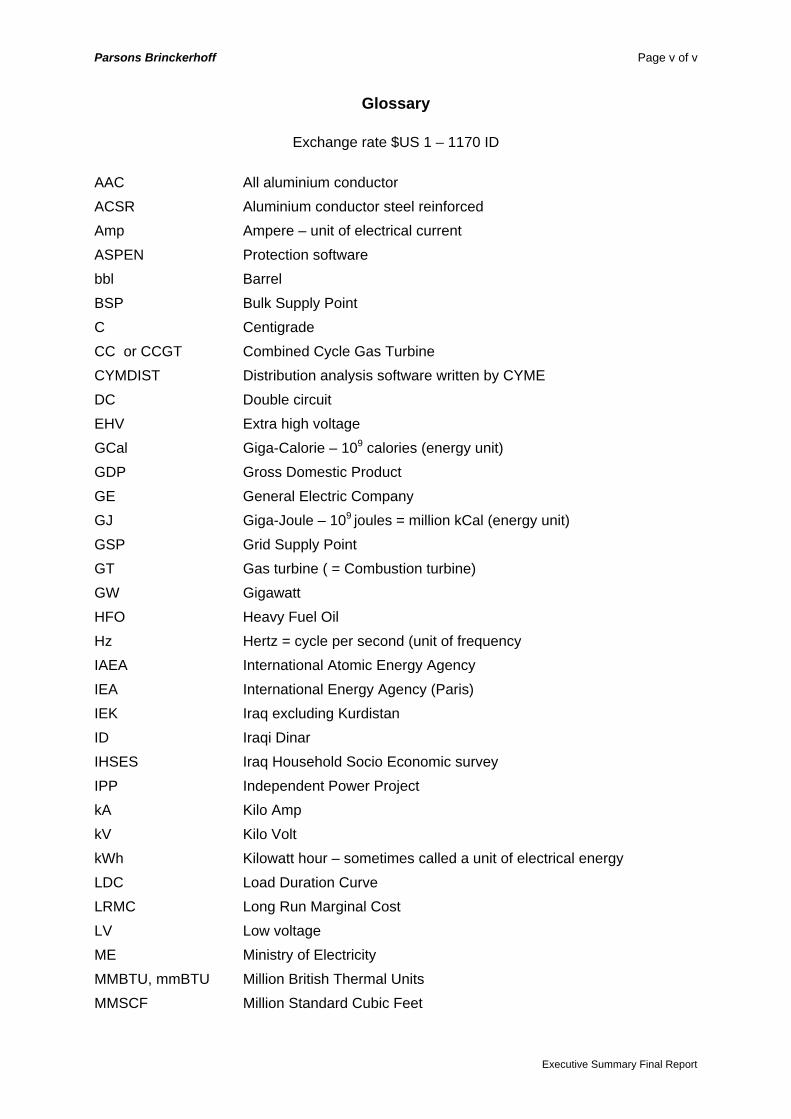
LIST OF TABLES Table 1 Master Plan Team ...................................................................................................... 2
Table 2 Base Case Load Forecast for IEK - MW .................................................................... 5
Table 3 MO Forecast of Crude Oil and Gas Production .......................................................... 9
Table 4 HFO Available for Power Generation ....................................................................... 10
Table 5 Capacity of Existing Plant 2009 – 2030 .................................................................... 12
Table 6 Committed Generation Capacity .............................................................................. 13
Table 7 Short-list of Candidate Plants Studied in WASP ...................................................... 13
Table 8 Recommended Generation Plan .............................................................................. 14
Table 9 Recommended Fuel Conversion Programme .......................................................... 15
Table 10 Investment Cost of Recommended Long-Term Plan – US$ Millions ..................... 18
Table 11 Generation Added Annually to the System ............................................................ 22
Table 12 132 kV and 400 kV Reinforcement Requirements for 2009 to 2015 ...................... 25
Table 13 Overall Plan Costs .................................................................................................. 25
Table 14 Demand Forecast ................................................................................................... 30
Table 15 Generation Plan (High Load Forecast) ................................................................... 31
Table 16 Availability beyond 2015 as Predicted by MO ........................................................ 32
Table 17 Present Value of Electricity and Gas Scenario Costs ............................................ 33
Table 18 132 kV Substation (BSP) Requirements and Costs ............................................... 36
Table 19 132 kV Overhead Line Requirements and Costs ................................................... 36
Table 20 400 kV Substation (GSPs) Requirements and Costs ............................................. 37
Table 21 400 kV Overhead Line Requirements .................................................................... 37
Table 22 400 kV Overhead Line Costs – High Load Forecast .............................................. 37
Table 23 Overall Transmission Costs ................................................................................... 37
Table 24 Estimated Distribution Investment 2011 - 2015 ..................................................... 45
Table 25 Estimated Distribution Investment 2016 – 2030 .................................................... 45
Table 26 Estimated Overall Investment ................................................................................ 49
Executive Summary Final Report
Parsons Brinckerhoff Page v of v
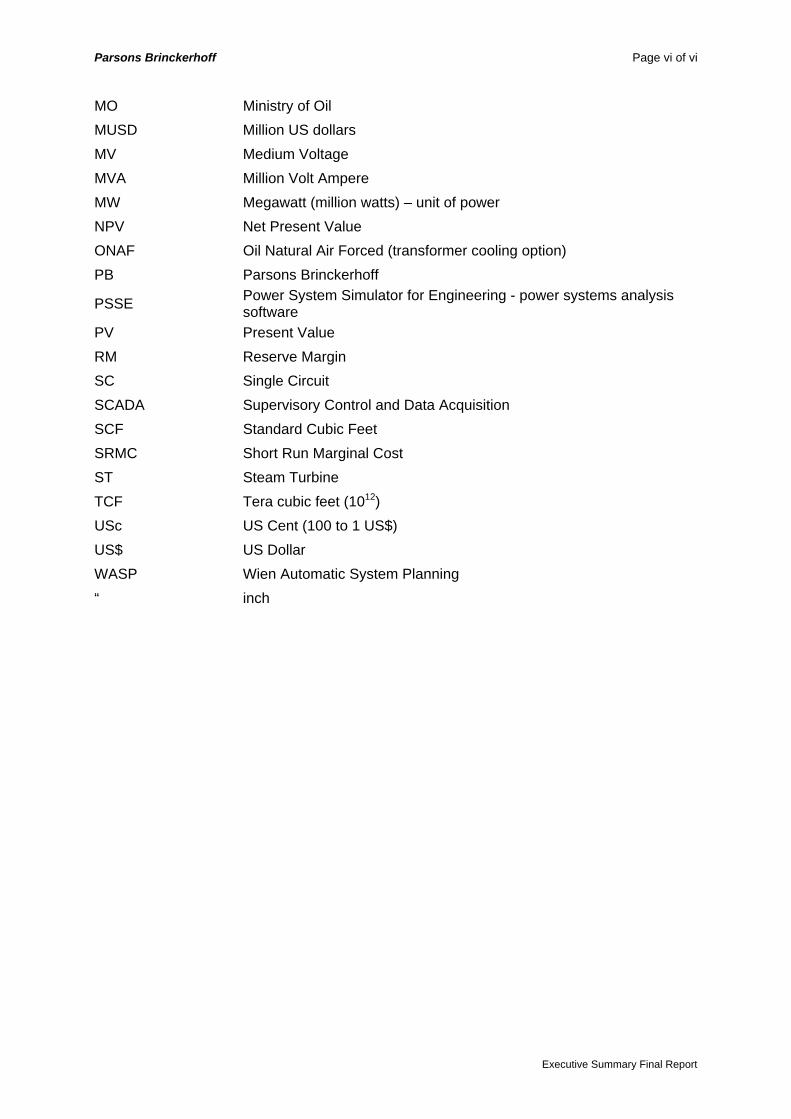
Glossary
Exchange rate $US 1 – 1170 ID AAC All aluminium conductor ACSR Aluminium conductor steel reinforced Amp Ampere – unit of electrical current ASPEN Protection software bbl Barrel BSP Bulk Supply Point C Centigrade CC or CCGT Combined Cycle Gas Turbine CYMDIST Distribution analysis software written by CYME DC Double circuit EHV Extra high voltage GCal Giga-Calorie – 109 calories (energy unit) GDP Gross Domestic Product GE General Electric Company GJ Giga-Joule – 109 joules = million kCal (energy unit) GSP Grid Supply Point GT Gas turbine ( = Combustion turbine) GW Gigawatt HFO Heavy Fuel Oil Hz Hertz = cycle per second (unit of frequency IAEA International Atomic Energy Agency IEA International Energy Agency (Paris) IEK Iraq excluding Kurdistan ID Iraqi Dinar IHSES Iraq Household Socio Economic survey IPP Independent Power Project kA Kilo Amp kV Kilo Volt kWh Kilowatt hour – sometimes called a unit of electrical energy LDC Load Duration Curve LRMC Long Run Marginal Cost LV Low voltage ME Ministry of Electricity MMBTU, mmBTU Million British Thermal Units MMSCF Million Standard Cubic Feet
Executive Summary Final Report
Parsons Brinckerhoff Page vi of vi
Executive Summary Final Report
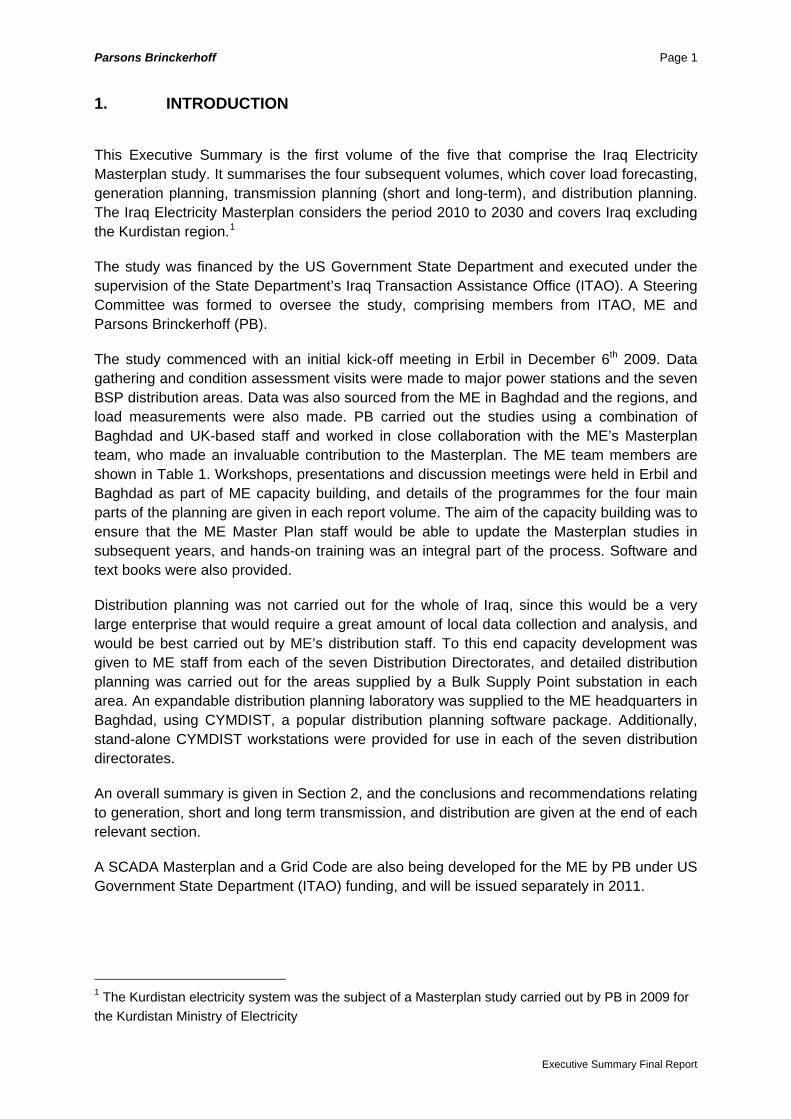
MO Ministry of Oil MUSD Million US dollars MV Medium Voltage MVA Million Volt Ampere MW Megawatt (million watts) – unit of power NPV Net Present Value ONAF Oil Natural Air Forced (transformer cooling option) PB Parsons Brinckerhoff
PSSE Power System Simulator for Engineering - power systems analysis software
PV Present Value RM Reserve Margin SC Single Circuit SCADA Supervisory Control and Data Acquisition SCF Standard Cubic Feet SRMC Short Run Marginal Cost ST Steam Turbine TCF Tera cubic feet (1012) USc US Cent (100 to 1 US$) US$ US Dollar WASP Wien Automatic System Planning “ inch
Parsons Brinckerhoff Page 1
1. INTRODUCTION
This Executive Summary is the first volume of the five that comprise the Iraq Electricity Masterplan study. It summarises the four subsequent volumes, which cover load forecasting, generation planning, transmission planning (short and long-term), and distribution planning. The Iraq Electricity Masterplan considers the period 2010 to 2030 and covers Iraq excluding the Kurdistan region.1
The study was financed by the US Government State Department and executed under the supervision of the State Department’s Iraq Transaction Assistance Office (ITAO). A Steering Committee was formed to oversee the study, comprising members from ITAO, ME and Parsons Brinckerhoff (PB).
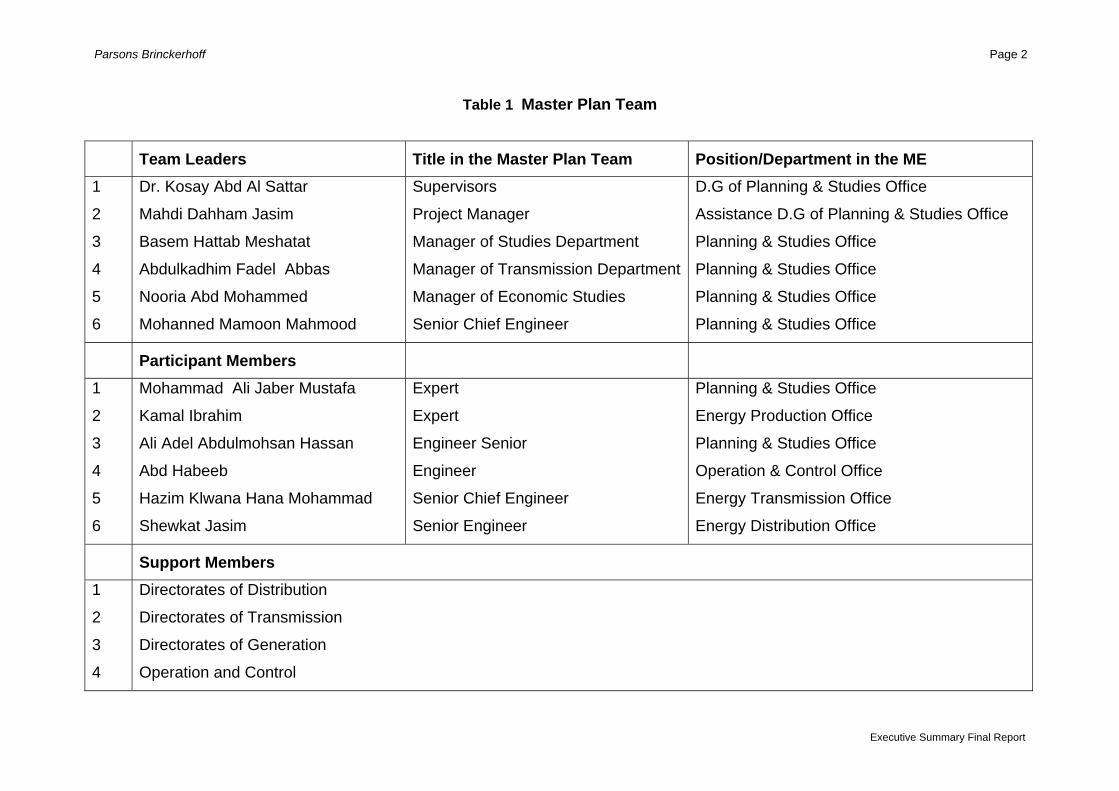
The study commenced with an initial kick-off meeting in Erbil in December 6th 2009. Data gathering and condition assessment visits were made to major power stations and the seven BSP distribution areas. Data was also sourced from the ME in Baghdad and the regions, and load measurements were also made. PB carried out the studies using a combination of Baghdad and UK-based staff and worked in close collaboration with the ME’s Masterplan team, who made an invaluable contribution to the Masterplan. The ME team members are shown in Table 1. Workshops, presentations and discussion meetings were held in Erbil and Baghdad as part of ME capacity building, and details of the programmes for the four main parts of the planning are given in each report volume. The aim of the capacity building was to ensure that the ME Master Plan staff would be able to update the Masterplan studies in subsequent years, and hands-on training was an integral part of the process. Software and text books were also provided.
Distribution planning was not carried out for the whole of Iraq, since this would be a very large enterprise that would require a great amount of local data collection and analysis, and would be best carried out by ME’s distribution staff. To this end capacity development was given to ME staff from each of the seven Distribution Directorates, and detailed distribution planning was carried out for the areas supplied by a Bulk Supply Point substation in each area. An expandable distribution planning laboratory was supplied to the ME headquarters in Baghdad, using CYMDIST, a popular distribution planning software package. Additionally, stand-alone CYMDIST workstations were provided for use in each of the seven distribution directorates.
An overall summary is given in Section 2, and the conclusions and recommendations relating to generation, short and long term transmission, and distribution are given at the end of each relevant section.
A SCADA Masterplan and a Grid Code are also being developed for the ME by PB under US Government State Department (ITAO) funding, and will be issued separately in 2011.
1 The Kurdistan electricity system was the subject of a Masterplan study carried out by PB in 2009 for the Kurdistan Ministry of Electricity
Executive Summary Final Report
Parsons Brinckerhoff Page 2
Table 1 Master Plan Team
Team Leaders Title in the Master Plan Team Position/Department in the ME 1
2
3
4
5
6
Dr. Kosay Abd Al Sattar
Mahdi Dahham Jasim
Basem Hattab Meshatat
Abdulkadhim Fadel Abbas
Nooria Abd Mohammed
Mohanned Mamoon Mahmood
Supervisors
Project Manager
Manager of Studies Department
Manager of Transmission Department
Manager of Economic Studies
Senior Chief Engineer
D.G of Planning & Studies Office
Assistance D.G of Planning & Studies Office
Planning & Studies Office
Planning & Studies Office
Planning & Studies Office
Planning & Studies Office
Participant Members 1
2
3
4
5
6
Mohammad Ali Jaber Mustafa
Kamal Ibrahim
Ali Adel Abdulmohsan Hassan
Abd Habeeb
Hazim Klwana Hana Mohammad
Shewkat Jasim
Expert
Expert
Engineer Senior
Engineer
Senior Chief Engineer
Senior Engineer
Planning & Studies Office
Energy Production Office
Planning & Studies Office
Operation & Control Office
Energy Transmission Office
Energy Distribution Office
Support Members 1
2
3
4
Directorates of Distribution
Directorates of Transmission
Directorates of Generation
Operation and Control
Executive Summary Final Report
Parsons Brinckerhoff Page 3
2. OVERALL SUMMARY
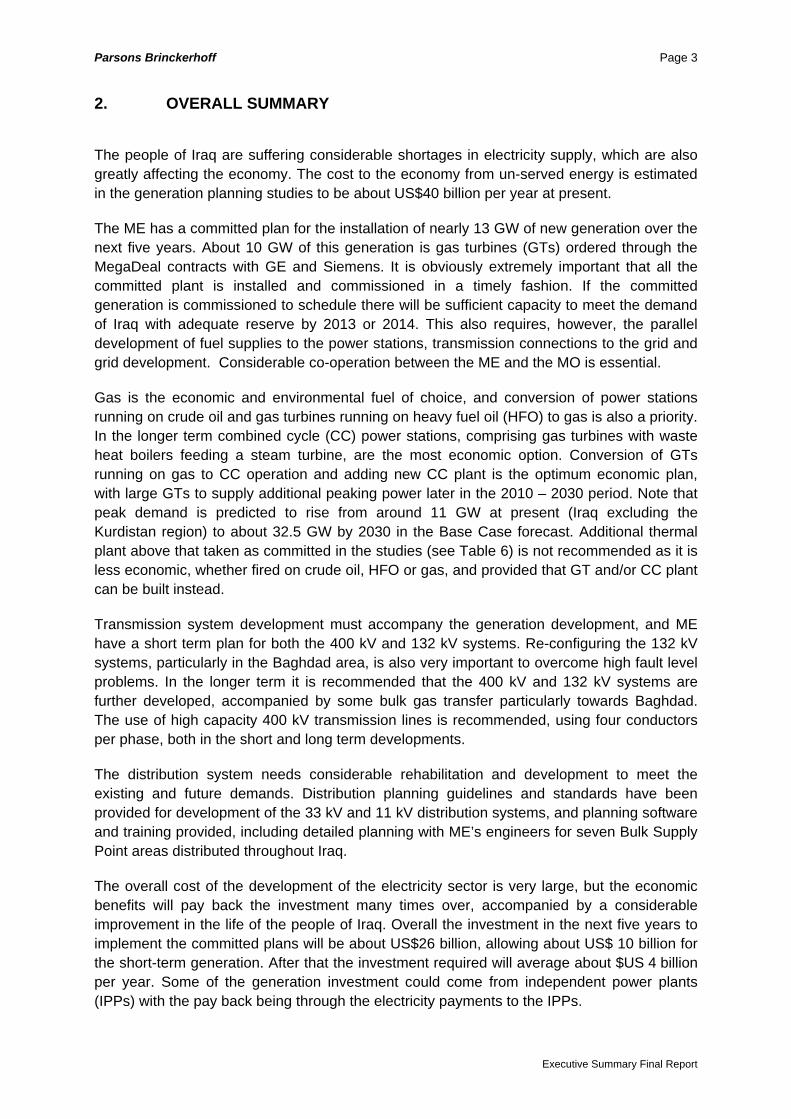
The people of Iraq are suffering considerable shortages in electricity supply, which are also greatly affecting the economy. The cost to the economy from un-served energy is estimated in the generation planning studies to be about US$40 billion per year at present.
The ME has a committed plan for the installation of nearly 13 GW of new generation over the next five years. About 10 GW of this generation is gas turbines (GTs) ordered through the MegaDeal contracts with GE and Siemens. It is obviously extremely important that all the committed plant is installed and commissioned in a timely fashion. If the committed generation is commissioned to schedule there will be sufficient capacity to meet the demand of Iraq with adequate reserve by 2013 or 2014. This also requires, however, the parallel development of fuel supplies to the power stations, transmission connections to the grid and grid development. Considerable co-operation between the ME and the MO is essential.
Gas is the economic and environmental fuel of choice, and conversion of power stations running on crude oil and gas turbines running on heavy fuel oil (HFO) to gas is also a priority. In the longer term combined cycle (CC) power stations, comprising gas turbines with waste heat boilers feeding a steam turbine, are the most economic option. Conversion of GTs running on gas to CC operation and adding new CC plant is the optimum economic plan, with large GTs to supply additional peaking power later in the 2010 – 2030 period. Note that peak demand is predicted to rise from around 11 GW at present (Iraq excluding the Kurdistan region) to about 32.5 GW by 2030 in the Base Case forecast. Additional thermal plant above that taken as committed in the studies (see Table 6) is not recommended as it is less economic, whether fired on crude oil, HFO or gas, and provided that GT and/or CC plant can be built instead.
Transmission system development must accompany the generation development, and ME have a short term plan for both the 400 kV and 132 kV systems. Re-configuring the 132 kV systems, particularly in the Baghdad area, is also very important to overcome high fault level problems. In the longer term it is recommended that the 400 kV and 132 kV systems are further developed, accompanied by some bulk gas transfer particularly towards Baghdad. The use of high capacity 400 kV transmission lines is recommended, using four conductors per phase, both in the short and long term developments.
The distribution system needs considerable rehabilitation and development to meet the existing and future demands. Distribution planning guidelines and standards have been provided for development of the 33 kV and 11 kV distribution systems, and planning software and training provided, including detailed planning with ME’s engineers for seven Bulk Supply Point areas distributed throughout Iraq.
The overall cost of the development of the electricity sector is very large, but the economic benefits will pay back the investment many times over, accompanied by a considerable improvement in the life of the people of Iraq. Overall the investment in the next five years to implement the committed plans will be about US$26 billion, allowing about US$ 10 billion for the short-term generation. After that the investment required will average about $US 4 billion per year. Some of the generation investment could come from independent power plants (IPPs) with the pay back being through the electricity payments to the IPPs.
Executive Summary Final Report
Parsons Brinckerhoff Page 4
3. LOAD FORECASTING
3.1 Approach This section summarises the load forecasts between 2009 and 2030 for Iraq, excluding Kurdistan, which we have called IEK. Kurdistan is made up of the Governorates of Dohuk, Sulaimaniya and Erbil. A full explanation of the load forecast methodology is given in the subsequent sections of this report.
The draft load forecasts (Base, Low and High) were described in a report dated 12 March 2010. Following a presentation, review and discussions with ME, final overall load forecasts were produced, and are presented in this report. The principal changes were to include the effects of a tariff increase and to revise the GDP growth rates of some of the sectors whilst retaining the overall GDP growth rates of Iraq. The final load forecast report was discussed with the ME during a meeting in Erbil on Sunday 26th March where it was accepted and agreed that it could be used for the planning in the Masterplan.
The draft load forecast report also included a distributed forecast by 132 kV bulk supply points, based on the overall load forecast. The distributed forecast is used in transmission and distribution planning. The ME advised that they would supply a revised list of large loads, and this was used to revise the distributed forecast based on the overall forecasts.
The load forecasts are the result of a combined study by PB and the ME load forecasting team, with the ME team providing valuable input on local conditions and PB using its experience to provide structure, methodology and international comparisons.
The team started by looking at the present electrical system in Iraq and used 2009 substation data and reports to estimate a non-suppressed demand at the generation sent-out level of about 11,466 MW.
An estimate of existing load was also developed using a “Bottom Up” approach. This gave a sent-out generation demand of about 13.4 GW for all Iraq and about 11.2 GW for IEK. These figures are similar to the IEK suppressed demand estimate from the substation analysis described above, and also to the maximum demand for all Iraq from a prior econometric study carried out by PB and the ME study team. We thus have a degree of confidence that the demand forecast starts off from a reasonable estimate of unsuppressed demand.
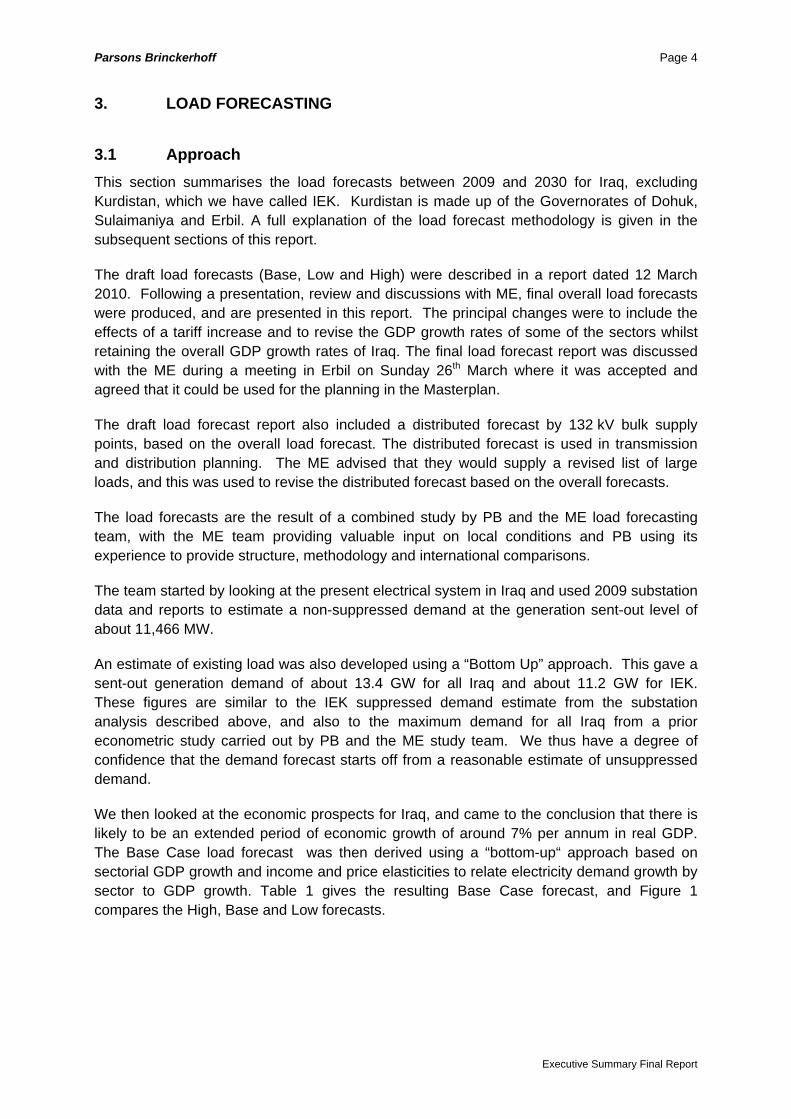
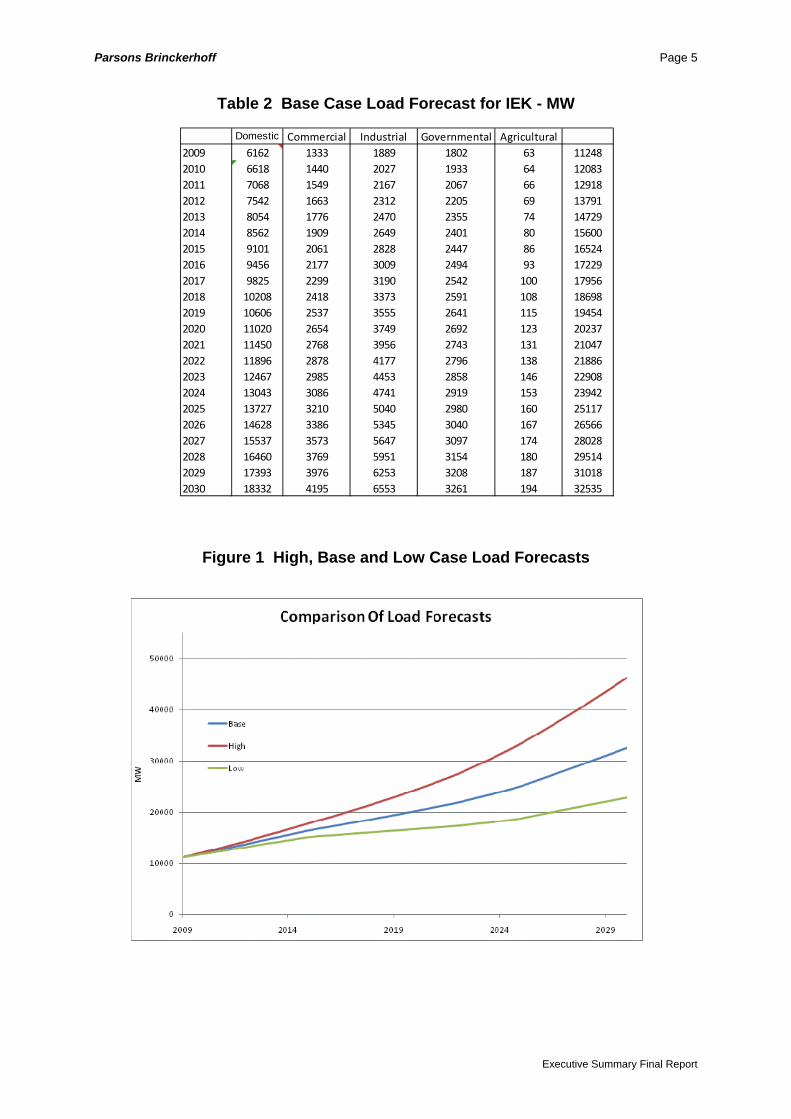
We then looked at the economic prospects for Iraq, and came to the conclusion that there is likely to be an extended period of economic growth of around 7% per annum in real GDP. The Base Case load forecast was then derived using a “bottom-up“ approach based on sectorial GDP growth and income and price elasticities to relate electricity demand growth by sector to GDP growth. Table 1 gives the resulting Base Case forecast, and Figure 1 compares the High, Base and Low forecasts.
Executive Summary Final Report
Parsons Brinckerhoff Page 5
Table 2 Base Case Load Forecast for IEK - MW
Domestic Commercial Industrial Governmental Agricultural2009 6162 1333 1889 1802 63 112482010 6618 1440 2027 1933 64 120832011 7068 1549 2167 2067 66 129182012 7542 1663 2312 2205 69 137912013 8054 1776 2470 2355 74 147292014 8562 1909 2649 2401 80 156002015 9101 2061 2828 2447 86 165242016 9456 2177 3009 2494 93 172292017 9825 2299 3190 2542 100 179562018 10208 2418 3373 2591 108 186982019 10606 2537 3555 2641 115 194542020 11020 2654 3749 2692 123 202372021 11450 2768 3956 2743 131 210472022 11896 2878 4177 2796 138 218862023 12467 2985 4453 2858 146 229082024 13043 3086 4741 2919 153 239422025 13727 3210 5040 2980 160 251172026 14628 3386 5345 3040 167 265662027 15537 3573 5647 3097 174 280282028 16460 3769 5951 3154 180 295142029 17393 3976 6253 3208 187 310182030 18332 4195 6553 3261 194 32535
Figure 1 High, Base and Low Case Load Forecasts
Executive Summary Final Report
Parsons Brinckerhoff Page 6
A forecast of the demand from consumers not connected at present to the ME system was also derived, estimated to be just less than 40 MW in 2020.
Finally, and as a third check on un-suppressed demand, we determined a series of load curves for weekdays, Fridays and Saturdays, for:
• Each Governorate and IEK as a whole, and
• For four seasons. These have been defined for study purposes as:
o Winter: December, January, February;
o Spring: March, April;
o Summer: May, June, July, August, September
o Autumn: October, November.
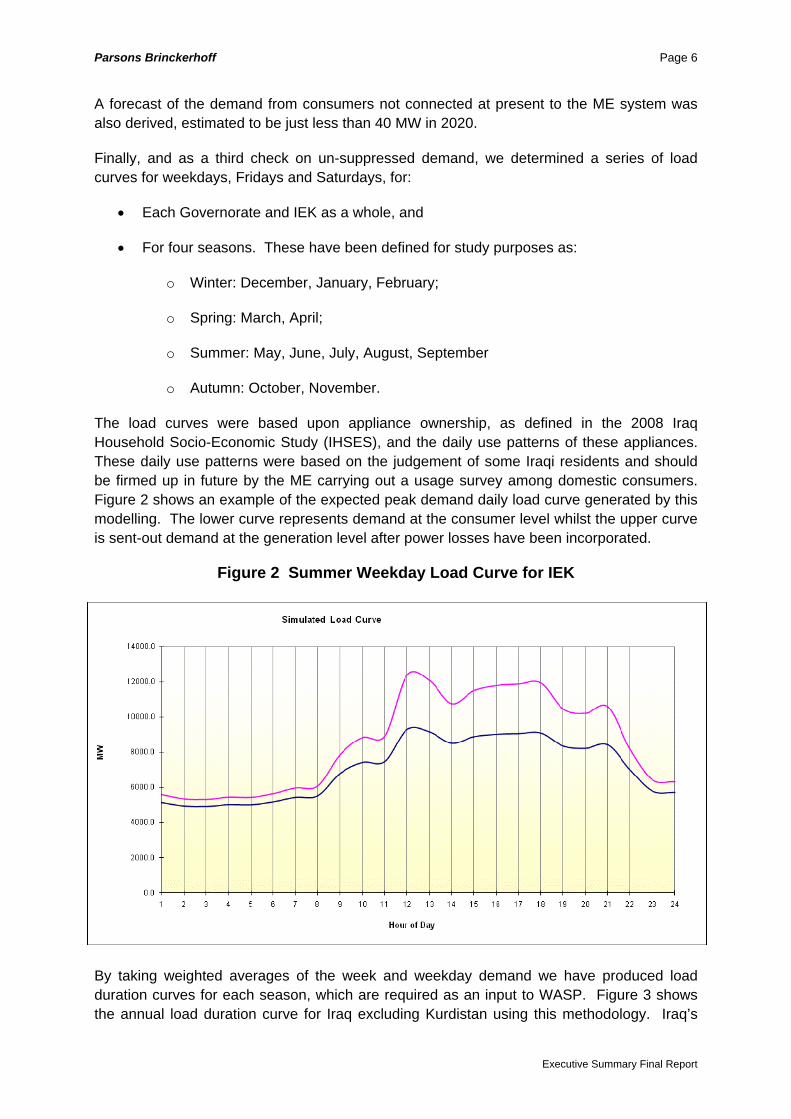
The load curves were based upon appliance ownership, as defined in the 2008 Iraq Household Socio-Economic Study (IHSES), and the daily use patterns of these appliances. These daily use patterns were based on the judgement of some Iraqi residents and should be firmed up in future by the ME carrying out a usage survey among domestic consumers. Figure 2 shows an example of the expected peak demand daily load curve generated by this modelling. The lower curve represents demand at the consumer level whilst the upper curve is sent-out demand at the generation level after power losses have been incorporated.
Figure 2 Summer Weekday Load Curve for IEK
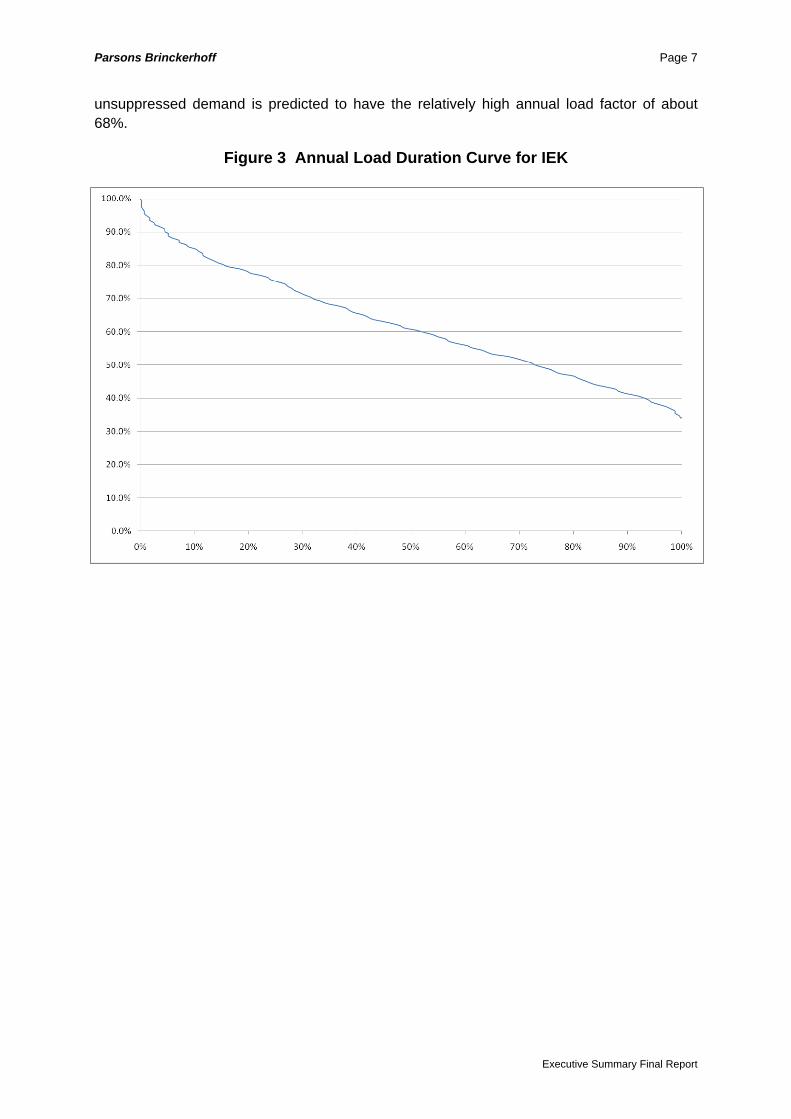
By taking weighted averages of the week and weekday demand we have produced load duration curves for each season, which are required as an input to WASP. Figure 3 shows the annual load duration curve for Iraq excluding Kurdistan using this methodology. Iraq’s
Executive Summary Final Report
Parsons Brinckerhoff Page 7
unsuppressed demand is predicted to have the relatively high annual load factor of about 68%.
Figure 3 Annual Load Duration Curve for IEK
Executive Summary Final Report
Parsons Brinckerhoff Page 8
4. GENERATION PLANNING
4.1 Introduction The generation planning analysis for Iraq has been carried out using the WASP least cost analysis computer program supplied by the IAEA, and used by the ME Planning Department. The studies exclude the Kurdistan region2.
The main studies have been carried out for the period 2010 to 2030 using the Base load forecast, but with sensitivity studies for the High and Low load forecasts. The High forecast plan has been used in the long-term transmission planning studies. The starting point for the studies has been the existing and firmly planned generation (including the Mega Deal GTs).
Data collection was carried out by PB’s Baghdad team and the ME Masterplan team, and included condition assessment site visits to major power stations.
The analysis has been carried out in full co-operation with the ME Masterplan team, and three week-long interactive workshops were held in Erbil. ME has been given working computer models of the final WASP runs and the working spreadsheets and files.
The analysis was subject to a data freeze at the end of March 2010, and the Final Generation Report was submitted in August 2010 followed by a presentation in Baghdad.
The close involvement of ME means that their planning team will be able to carry out updates of the generation planning on a regular basis (annually recommended). The updates will be able to take into account how load growth progresses, fuel supply developments, the latest status of existing and planned generation, and transmission system developments.
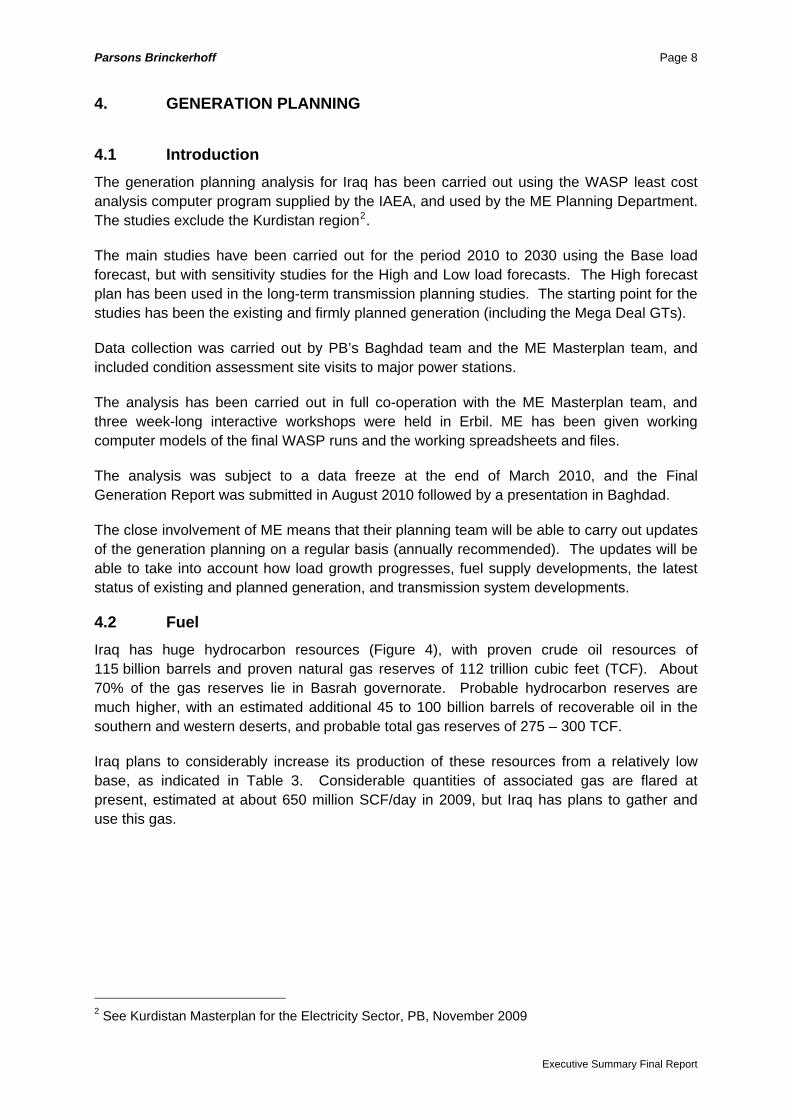
4.2 Fuel Iraq has huge hydrocarbon resources (Figure 4), with proven crude oil resources of 115 billion barrels and proven natural gas reserves of 112 trillion cubic feet (TCF). About 70% of the gas reserves lie in Basrah governorate. Probable hydrocarbon reserves are much higher, with an estimated additional 45 to 100 billion barrels of recoverable oil in the southern and western deserts, and probable total gas reserves of 275 – 300 TCF.
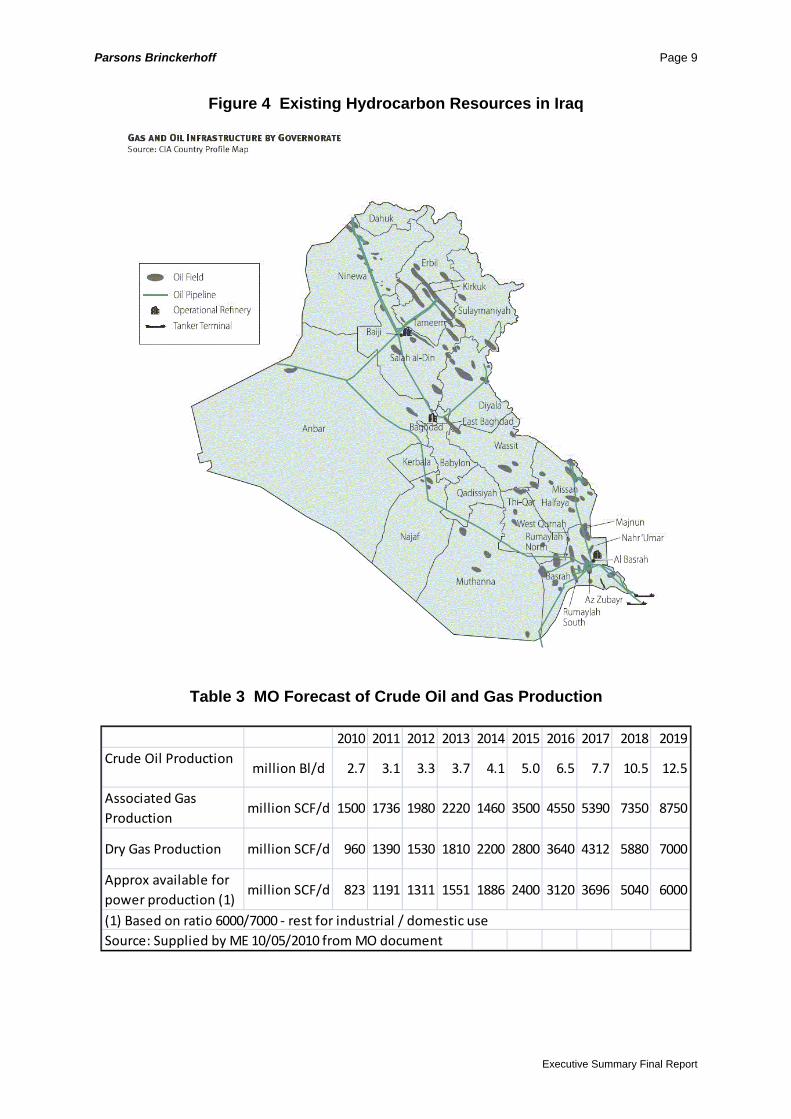
Iraq plans to considerably increase its production of these resources from a relatively low base, as indicated in Table 3. Considerable quantities of associated gas are flared at present, estimated at about 650 million SCF/day in 2009, but Iraq has plans to gather and use this gas.
2 See Kurdistan Masterplan for the Electricity Sector, PB, November 2009
Executive Summary Final Report
Parsons Brinckerhoff Page 9
Figure 4 Existing Hydrocarbon Resources in Iraq
Table 3 MO Forecast of Crude Oil and Gas Production
2010 2011 2012 2013 2014 2015 2016 201Crude Oil Production
million Bl/d 2.7 3.1 3.3 3.7 4.1 5.0 6.5 7
Associated Gas Production
million SCF/d 1500 1736 1980 2220 1460 3500 4550 53
Dry Gas Production million SCF/d 960 1390 1530 1810 2200 2800 3640 431
Approx available for power production (1)
million SCF/d 823 1191 1311 1551 1886 2400 3120 369
Source: Supplied by ME 10/05/2010 from MO document(1) Based on ratio 6000/7000 ‐ rest for industrial / domestic use
7 2018 2019
.7 10.5 12.5
90 7350 8750
2 5880 7000
6 5040 6000
Executive Summary Final Report

Parsons Brinckerhoff Page 10
There are three major oil refineries at Baiji, Basrah and Doura, and several smaller refineries which are planned to be retired by 2015. New refineries with increased production are planned from 2015 to 2017.
The estimated amount of heavy fuel oil (HFO) available is given in the table below.
Table 4 HFO Available for Power Generation
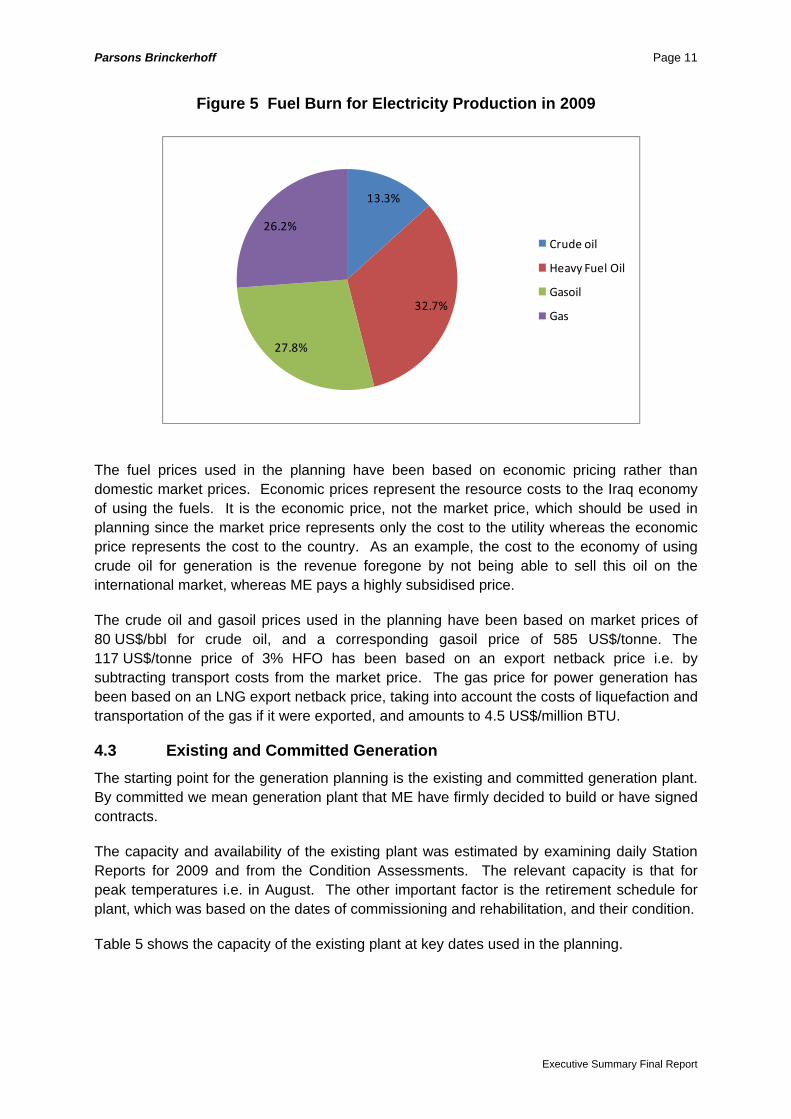
Figure 5 shows the estimated percentage fuel burn (based on total GCal) for electricity production in 2009 (estimated from the generation planning modelling – metered values not available). These correspond to an estimated average gas burn of 430 millions SCF/day and 15,000 tonnes/day of HFO. The notable points are:
• The large crude oil burn (28% of total fuel energy) - this is very expensive to the Iraqi economy in terms of lost export income.
• 13% of the fuel energy comes from gasoil, which is a premium and expensive fuel (partially imported).
• Heavy fuel oil and gas provide about 33% and 26% of the energy respectively.
The gas burnt is only about a half of the available fuel according to Table 3 – but this assumes that flared gas is processed and available. This flared gas would be sufficient to power about 4GW of combined cycle base load plant. The HFO burnt is also only about half the amount available – in this case the HFO is mixed with crude for export, or disposed of in other ways.
It should also be noted that considerable amounts of gasoil and crude oil are being burnt. Both of these are expensive fuels – gasoil is a premium fuel and has to be partly imported, and crude oil burnt in power stations could otherwise be exported, and thus has a high value.
2010 2011 2012 2013 2014 2015 2016 2017 201HFO Production (1) m3/day 41,000 48,000 52,000 51,000 49,000 57,000 59,000 59,000 59,000 Estimated High Sulphur (6%) m3/day 4,000 4,000 4,000 4,000 4,000 4,000 4,000 4,000 4,000 Estimated 3% Sulphur HFO m3/day 37,000 44,000 48,000 47,000 45,000 53,000 55,000 55,000 55,000 Industry use (2) m3/day 5,000 5,350 5,725 6,125 6,554 7,013 7,504 8,029 8,591 Available for Power Generation m3/day 32,000 38,650 42,276 40,875 38,446 45,987 47,496 46,971 46,409 Available for Power Generation tonnes/day 30,400 36,718 40,162 38,831 36,524 43,688 45,122 44,623 44,089 Notes: (1) Source: Presentation by MOO on 15/06/10(2) Escalated at 7% per annum in line with GDP growth 2011 onwards
8 2019 202059,000 59,000 4,000 4,000 55,000 55,000 9,192 9,836 45,808 45,164 43,517 42,906
Executive Summary Final Report
Parsons Brinckerhoff Page 11
Figure 5 Fuel Burn for Electricity Production in 2009
13.3%
32.7%
27.8%
26.2%Crude oil
Heavy Fuel Oil
Gasoil
Gas
The fuel prices used in the planning have been based on economic pricing rather than domestic market prices. Economic prices represent the resource costs to the Iraq economy of using the fuels. It is the economic price, not the market price, which should be used in planning since the market price represents only the cost to the utility whereas the economic price represents the cost to the country. As an example, the cost to the economy of using crude oil for generation is the revenue foregone by not being able to sell this oil on the international market, whereas ME pays a highly subsidised price.
The crude oil and gasoil prices used in the planning have been based on market prices of 80 US$/bbl for crude oil, and a corresponding gasoil price of 585 US$/tonne. The 117 US$/tonne price of 3% HFO has been based on an export netback price i.e. by subtracting transport costs from the market price. The gas price for power generation has been based on an LNG export netback price, taking into account the costs of liquefaction and transportation of the gas if it were exported, and amounts to 4.5 US$/million BTU.
4.3 Existing and Committed Generation The starting point for the generation planning is the existing and committed generation plant. By committed we mean generation plant that ME have firmly decided to build or have signed contracts.
The capacity and availability of the existing plant was estimated by examining daily Station Reports for 2009 and from the Condition Assessments. The relevant capacity is that for peak temperatures i.e. in August. The other important factor is the retirement schedule for plant, which was based on the dates of commissioning and rehabilitation, and their condition.
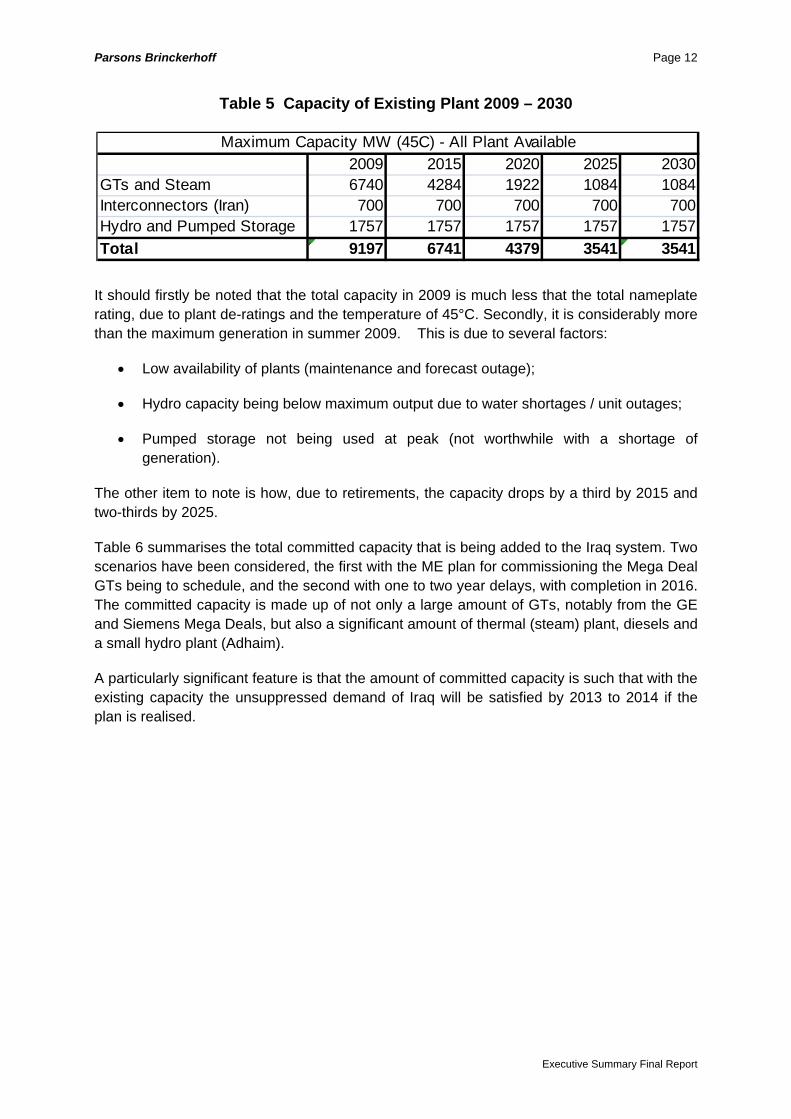
Table 5 shows the capacity of the existing plant at key dates used in the planning.
Executive Summary Final Report
Parsons Brinckerhoff Page 12
Table 5 Capacity of Existing Plant 2009 – 2030
2009 2015 2020 2025 2030GTs and Steam 6740 4284 1922 1084 1084Interconnectors (Iran) 700 700 700 700 700Hydro and Pumped Storage 1757 1757 1757 1757 1757Total 9197 6741 4379 3541 3541
Maximum Capacity MW (45C) - All Plant Available
It should firstly be noted that the total capacity in 2009 is much less that the total nameplate rating, due to plant de-ratings and the temperature of 45°C. Secondly, it is considerably more than the maximum generation in summer 2009. This is due to several factors:
• Low availability of plants (maintenance and forecast outage);
• Hydro capacity being below maximum output due to water shortages / unit outages;
• Pumped storage not being used at peak (not worthwhile with a shortage of generation).
The other item to note is how, due to retirements, the capacity drops by a third by 2015 and two-thirds by 2025.
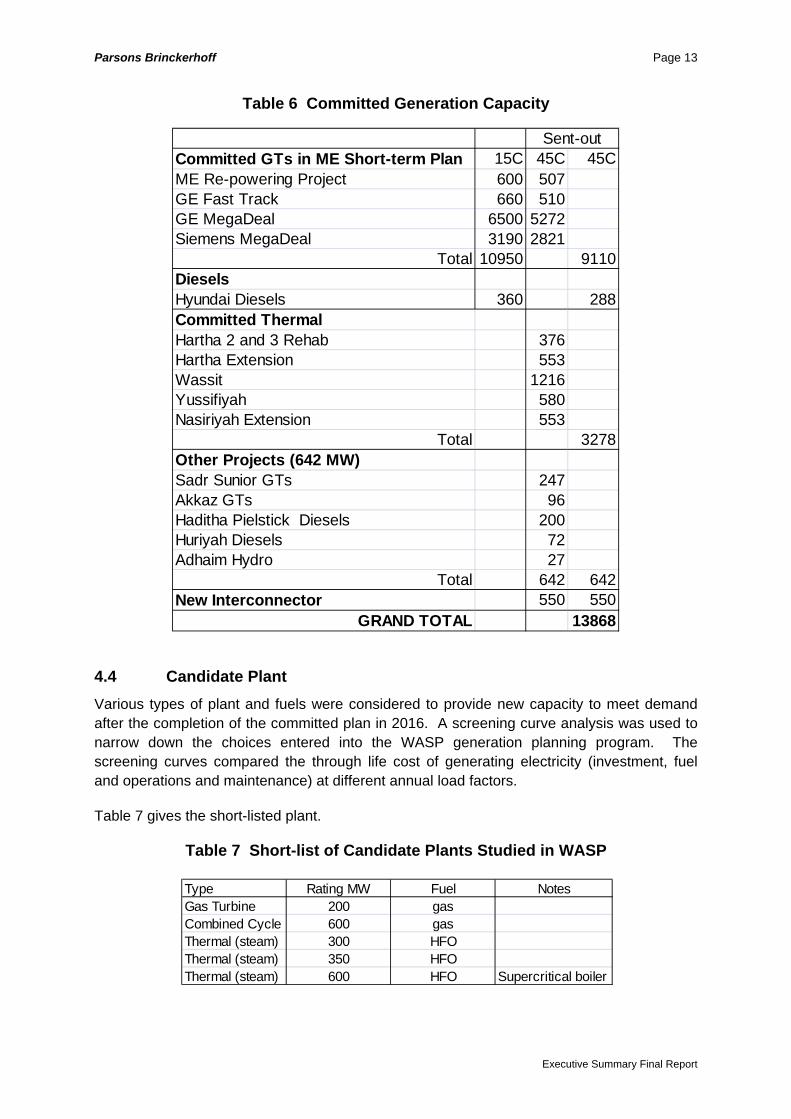
Table 6 summarises the total committed capacity that is being added to the Iraq system. Two scenarios have been considered, the first with the ME plan for commissioning the Mega Deal GTs being to schedule, and the second with one to two year delays, with completion in 2016. The committed capacity is made up of not only a large amount of GTs, notably from the GE and Siemens Mega Deals, but also a significant amount of thermal (steam) plant, diesels and a small hydro plant (Adhaim).
A particularly significant feature is that the amount of committed capacity is such that with the existing capacity the unsuppressed demand of Iraq will be satisfied by 2013 to 2014 if the plan is realised.
Executive Summary Final Report
Parsons Brinckerhoff Page 13
Table 6 Committed Generation Capacity
Committed GTs in ME Short-term Plan 15C 45C 45CME Re-powering Project 600 507GE Fast Track 660 510GE MegaDeal 6500 5272Siemens MegaDeal 3190 2821
Total 10950 9110DieselsHyundai Diesels 360 288Committed ThermalHartha 2 and 3 Rehab 376Hartha Extension 553Wassit 1216Yussifiyah 580Nasiriyah Extension 553
Total 3278Other Projects (642 MW)Sadr Sunior GTs 247Akkaz GTs 96Haditha Pielstick Diesels 200Huriyah Diesels 72Adhaim Hydro 27
Total 642 642New Interconnector 550 550
GRAND TOTAL 13868
Sent-out
4.4 Candidate Plant Various types of plant and fuels were considered to provide new capacity to meet demand after the completion of the committed plan in 2016. A screening curve analysis was used to narrow down the choices entered into the WASP generation planning program. The screening curves compared the through life cost of generating electricity (investment, fuel and operations and maintenance) at different annual load factors.
Table 7 gives the short-listed plant.
Table 7 Short-list of Candidate Plants Studied in WASP
Type Rating MW Fuel NotesGas Turbine 200 gasCombined Cycle 600 gasThermal (steam) 300 HFOThermal (steam) 350 HFOThermal (steam) 600 HFO Supercritical boiler
Executive Summary Final Report
Parsons Brinckerhoff Page 14
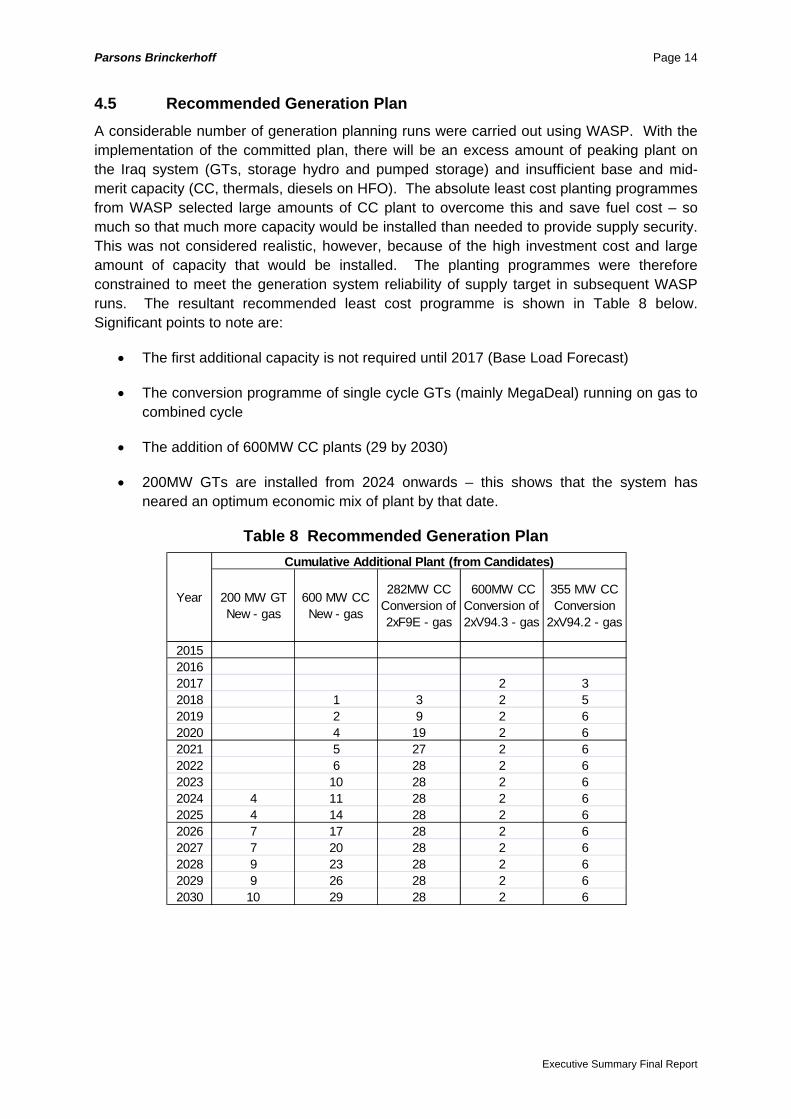
4.5 Recommended Generation Plan A considerable number of generation planning runs were carried out using WASP. With the implementation of the committed plan, there will be an excess amount of peaking plant on the Iraq system (GTs, storage hydro and pumped storage) and insufficient base and mid-merit capacity (CC, thermals, diesels on HFO). The absolute least cost planting programmes from WASP selected large amounts of CC plant to overcome this and save fuel cost – so much so that much more capacity would be installed than needed to provide supply security. This was not considered realistic, however, because of the high investment cost and large amount of capacity that would be installed. The planting programmes were therefore constrained to meet the generation system reliability of supply target in subsequent WASP runs. The resultant recommended least cost programme is shown in Table 8 below. Significant points to note are:
• The first additional capacity is not required until 2017 (Base Load Forecast)
• The conversion programme of single cycle GTs (mainly MegaDeal) running on gas to combined cycle
• The addition of 600MW CC plants (29 by 2030)
• 200MW GTs are installed from 2024 onwards – this shows that the system has neared an optimum economic mix of plant by that date.
Table 8 Recommended Generation Plan
201520162017 2 32018 1 3 2 52019 2 9 2 62020 4 19 2 62021 5 27 2 62022 6 28 2 62023 10 28 2 62024 4 11 28 2 62025 4 14 28 2 62026 7 17 28 2 62027 7 20 28 2 62028 9 23 28 2 62029 9 26 28 2 62030 10 29 28 2 6
600MW CC Conversion of 2xV94.3 - gas
355 MW CC Conversion
2xV94.2 - gas
200 MW GT New - gas
600 MW CC New - gas
282MW CC Conversion of 2xF9E - gas
Year
Cumulative Additional Plant (from Candidates)
Executive Summary Final Report

Parsons Brinckerhoff Page 15
Figure 6 shows the capacity installed by fuel type, the Base Case load forecast and the
reserve margin (percentage of capacity above the maximum load).
Figure 6 Recommended Generation Plan – Capacity and Demand
. As discussed earlier, it can be seen that with the installation of the committed generation to schedule
there would be sufficient capacity by 2013 to meet demand.
It can also be seen that up to 2013/14 the amount of capacity burning HFO and crude increases, but
subsequently declines, and the proportion of gas-fired plant rapidly rises to dominate the capacity
maximum. The increase in gas-fuel plant initially rises due to a conversion programme of GTs to gas-
firing, and later due to the conversion of the single cycle gas-fuel GTs to combined cycle and the
installation of new GT and CC plant being gas.
As discussed earlier, it can be seen that there would be sufficient capacity by 2013 to meet demand, assuming the installation of the committed generation is to schedule.
It can also be seen that up to 2013/14 the amount of capacity burning HFO and crude increases, but subsequently declines, and the proportion of gas-fired plant rapidly rises to dominate the capacity. The increase in gas-fuel plant initially arises due to a conversion programme of GTs to gas-firing, and later due to the conversion of the single cycle gas-fuel GTs to combined cycle and the installation of new GT and CC plant using gas.
The recommended fuel conversion program is shown in the table below:
Table 9 Recommended Fuel Conversion Programme Fuel Conversion from Crude Oil
–Run Wassit new Thermal Plant on gas rather than crude (2014)–Existing Hartha Thermal Units 1 & 4 to HFO (2013)–Existing Qudus 6xF9E GTs to gas (2015)–GE Megadeal: Qudus 4x and Wassit 4x F9E GTs (2015)–Committed Yussifiyah 3x210 MW Thermal run on gas (2017)Fuel Conversion from HFO to gas–GE Megadeal: 42xF9Es (2015 -2017)–Siemens Megadeal: 10xV94.2 (2015 -2017)
Executive Summary Final Report

Parsons Brinckerhoff Page 16
The conversion of plant running on crude oil is the priority because of the high cost of this fuel.
Although the conversion of GTs to CC is shown to be least cost, the actual savings are not major. An additional advantage of conversion is, however, that the number of power station sites required will be reduced.
However, the ME may decide that conversion of all of the Mega Deal GTs fired on gas (plus a few others) is not worthwhile due to the condition of the turbines. Installing brand new 600 MW combined cycle plants may be easier and more attractive. The ME should review the conversion programme in successive years, as the actual demand growth and plant installation program unfolds, to decide how many GTs it wishes to convert.
There are proposals by ME to install more thermal (steam) plants in the next few years than are included in the committed plant programme that has been studied. Some of these additional plants were only known after the planning had been completed – e.g. Khayrat. However the least cost planning runs have not selected thermal plant, confirming the results of the screening curve analysis which showed that they are more expensive overall. This is due to their high investment cost and their lower efficiency compared to combined cycle plant.
A case could be made, however, that if gas is not made available as quickly as promised, installing extra thermal plant would be advantageous. To this end, a scenario where gas availability was delayed by five years was considered using WASP. As expected, the overall present value was higher than the recommended plan (around US$ 5 billion more). The other significant result from these studies was that gas turbines running on HFO were shown to be more economic than thermal plant using HFO, in spite of their reduced availability and capacity and higher operating and maintenance costs relative to gas firing. This confirmed the screening studies which showed that thermal plant is slightly more expensive overall than GTs running on the same fuel at all plant load factors less than 80%.
Figure 7 and Figure 8 show the gas and HFO burn respectively for the Recommended Plan. The blue columns in Figure 7 show the MO forecast of gas availability up to 2019, which is the latest date in MO’s projection. The red columns show the forecast of gas burn for electricity generation. It can be seen that if the gas availability follows MO’s projection there will be a considerable margin between availability and use. However, it is recommended that gas for domestic use (power industry and residential) should take priority over export, to avoid the possibility of a shortage (as is currently being experienced by some Middle East gas exporting countries).
Figure 8 shows in blue the forecast of HFO available for power generation, derived from the MO’s projection after the subtraction of industry use. In this case MO’s forecast only goes as far as 2018.
Executive Summary Final Report

Parsons Brinckerhoff Page 17
Figure 7 Gas Burn MMSCF/day – Recommended Plan
0
500
1,000
1,500
2,000
2,500
3,000
3,500
4,000
4,500
5,000
5,500
6,000
6,500
2010
2011
2012
2013
2014
2015
2016
2017
2018
2019
2020
2021
2022
2023
2024
2025
2026
2027
2028
2029
2030
Available
Gas Used
Figure 8 HFO Burn Tonnes/day – Recommended Plan
0
5,000
10,000
15,000
20,000
25,000
30,000
35,000
40,000
45,000
50,000
2010
2011
2012
2013
2014
2015
2016
2017
2018
2019
2020
2021
2022
2023
2024
2025
2026
2027
2028
2029
2030
Available
HFO Used
Executive Summary Final Report

Parsons Brinckerhoff Page 18
Executive Summary Final Report
Year Total InvestmentDomestic Foreign Total Domestic Foreign Total plus IDC
2015 83 333 416 4 16 20 436 2016 298 1,190 1,487 23 93 117 1,604 2017 338 1,355 1,693 30 121 152 1,845 2018 468 1,875 2,343 39 157 196 2,539 2019 510 2,042 2,552 51 204 255 2,807 2020 340 1,363 1,703 33 134 167 1,870 2021 331 1,325 1,657 26 105 131 1,788 2022 320 1,282 1,602 44 176 220 1,822 2023 374 1,498 1,872 28 113 141 2,013 2024 381 1,525 1,907 41 164 205 2,111 2025 461 1,844 2,305 46 184 230 2,535 2026 378 1,512 1,890 41 163 204 2,094 2027 431 1,725 2,156 44 177 221 2,377 2028 361 1,445 1,806 40 160 200 2,006 2029 204 817 1,022 31 125 156 1,178 2030 ‐ ‐ ‐ ‐ ‐ ‐ ‐
Total 2015 ‐ 2030
5,281 21,130 26,411 523 2,092 2,615 29,026
Notes: Money of 2009
Investment Cost Interest during Construction
It can be seen that up until 2014 the demand for HFO rises rapidly, nearly reaching the available capacity. This results from the large number of GTs and thermal plants burning HFO that are installed in the committed plant programme. Subsequently they are converted to gas and the usage drops. A large surplus of HFO thus develops from 2015 onwards. Iraq is undergoing a programme of new refinery construction during the study period, and it is suggested that the overall least cost solution for Iraq is to construct the new refineries to produce less HFO and more premium fuels, such as gasoil and gasoline.
The table below gives investment cost of the recommended long-term generation plan.
Table 10 Investment Cost of Recommended Long-Term Plan – US$ Millions
It can be seen that for new generation / conversion beyond the committed plan, about US$2 billion per year (money of 2010) is needed. The table shows a tail-off in 2029 and 2030 – this is due to the fact that the plant required beyond 2030 are not included (costs are disbursed in advance of commissioning). The total investment cost for generation from 2016 – 2030 will be about US$ 30 billion.

Parsons Brinckerhoff Page 19
4.6 Conclusions and Recommendations from Generation Planning
1. Un-served energy cost is huge at present (US$40 billion). Delay in implementing the committed short-term plan will therefore be very costly to Iraq.
2. Gas is the economic fuel of choice.
3. The economic priority is to convert generators running on crude oil to gas (or HFO if gas is not available).
4. New GTs (predominantly MegaDeal) and the existing Qudus F9E GTs should be converted from burning crude or HFO to gas as soon as gas is available at the sites.
5. There is sufficient committed plant (GT, Thermal and diesels) that new plant is not needed until 2017 onwards (Base Forecast).
6. Additional (new) capacity after the committed short-term plan should come from conversion of simple cycle GTs to combined cycle (i.e. by the addition of waste heat boilers and a steam turbine). This increases the capacity of a plant by about 50% with no extra fuel burn. With conversion of GTs to CC, new CC plant is also selected from 2018, with new large GTs from 2024.
7. However, the conversion of all the MegaDeal and a few other GTs to combined cycle, although economic, shows progressively less advantage the more that are converted. It is recommended that ME, in its successive generation planning exercises using WASP, keeps the option open of only converting some GTs (particularly the larger units) and instead installing more new large CC plant.
8. Additional thermal (steam) plant is not least cost. It is understood that ME’s latest planning is considering new thermal power stations at Khayrat, Al Anbar, Al Shimal, and Salah El Deen. The long term planning analyses described in this report have shown that building these plants is not the least cost solution provided that GT and CC plant can be built instead.
9. It is economic to add the committed additional 550 MW interconnection. However, from 2015/16 the interconnectors will only provide peaking power, and tariffs should be structured to reflect this i.e. a two part tariff covering capacity and energy separately.
10. Gas and HFO availability should be sufficient as long as fuel infrastructure development follows the MO’s plans. Surplus HFO from 2016 onwards could be reduced by changed refinery product mix, particularly in new refineries.
11. If gas is delayed such that new plant 2015 to 2019 cannot be converted to gas, the penalty is about US$ 5 billion. This assumes GTs installed running on HFO instead of CC - installing thermal plant burning HFO instead of GTs on HFO would be more expensive.
Executive Summary Final Report

Parsons Brinckerhoff Page 20
5. SHORT TERM TRANSMISSION PLANNING
5.1 Introduction The short term transmission plan covers the period 2009 to 2015, and the main objectives were to identify what is required to:
• strengthen the existing grid system to satisfy transmission requirements arising from growing load demands (both from suppressed load and natural load growth)
• connect future generating stations to the grid system, and
• connect isolated load to the grid system.
PB and the ME Master Plan Team built PSS/E models of the 400/132 kV transmission system for the years 2009 to 2015. The models incorporated ME’s short-term plan for nearly 13 GW of new generation (GTs, Thermal and diesel plant) from 2010 to 2015 and associated transmission reinforcements. This enabled any supplementary network reinforcements to be identified, based on the Base Case load forecast, load flow and fault level studies, and using the Planning Standards recommended below.
5.2 Planning Standards The transmission plan has been developed based on our recommendations for a Planning Standard, which are based on best international practices for transmission planning development. The current condition of the Iraq electricity system is such that many aspects of the planning standard cannot be met at present, but the object of the plan is to develop a system as quickly as possible that meets the Standard, which is summarised below.
5.2.1 Recommended Planning Standards The system (132 kV or 400 kV) shall be planned such that for an Intact system (i.e. no system outage) there shall not be:
• Any transmission equipment (132 or 400 kV) loaded above its nominal rating;
• Any unacceptable voltage conditions;
• Any unacceptable fault level conditions.
The transmission system will normally operate at a target frequency of 50 Hz +/- 0.5% (i.e. 50.25 Hz to 49.75 Hz).
The system (132 kV or 400 kV) shall be planned such that there is:
• No plant overloading under single planned or unplanned outage of any one circuit at a time;
• No stability issue under single planned or unplanned outage of any one circuit at a time.
Executive Summary Final Report

Parsons Brinckerhoff Page 21
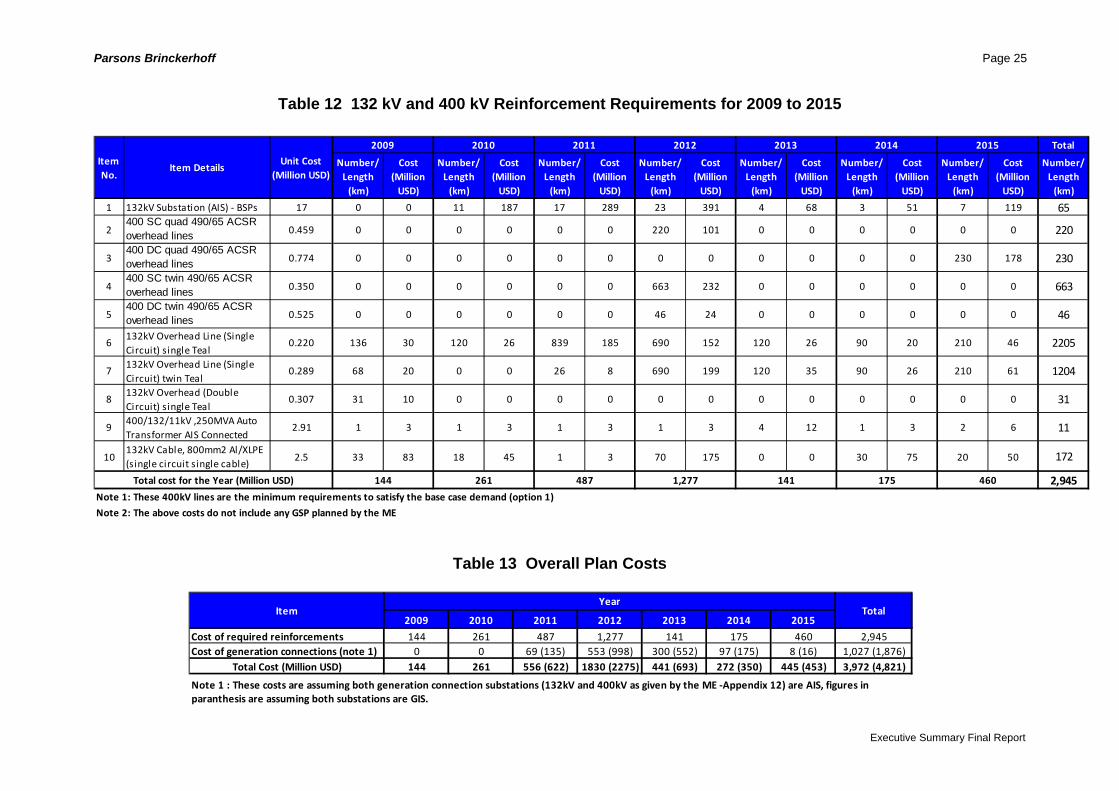
5.3 Existing Transmission System 5.3.1 Introduction The existing Iraqi transmission network uses 400 kV and 132 kV, as shown in Figure 9, which also shows the locations of the Grid Supply Points (GSPs), Bulk Supply Points (BSPs) and the major load centres in the country. The 132 kV network is the local load distribution network within each Governorate, with a few 132 kV ties to neighbouring Governorates, whilst the 400 kV network is the national grid bulk power transfer highway between the Governorates and with neighbouring countries. The network comprises:
• 3723km of 400 kV, twin 490/65mm2 ACSR, single circuit construction overhead lines with thermal rating of 100MVA;
• twenty four 400/132 kV substations (GSPs);
• 13,746km of 132 kV overhead lines;
• 209 132/33/11kV substations which are used as Bulk Supply Points (BSPs) to distribute electricity in the Governorates.
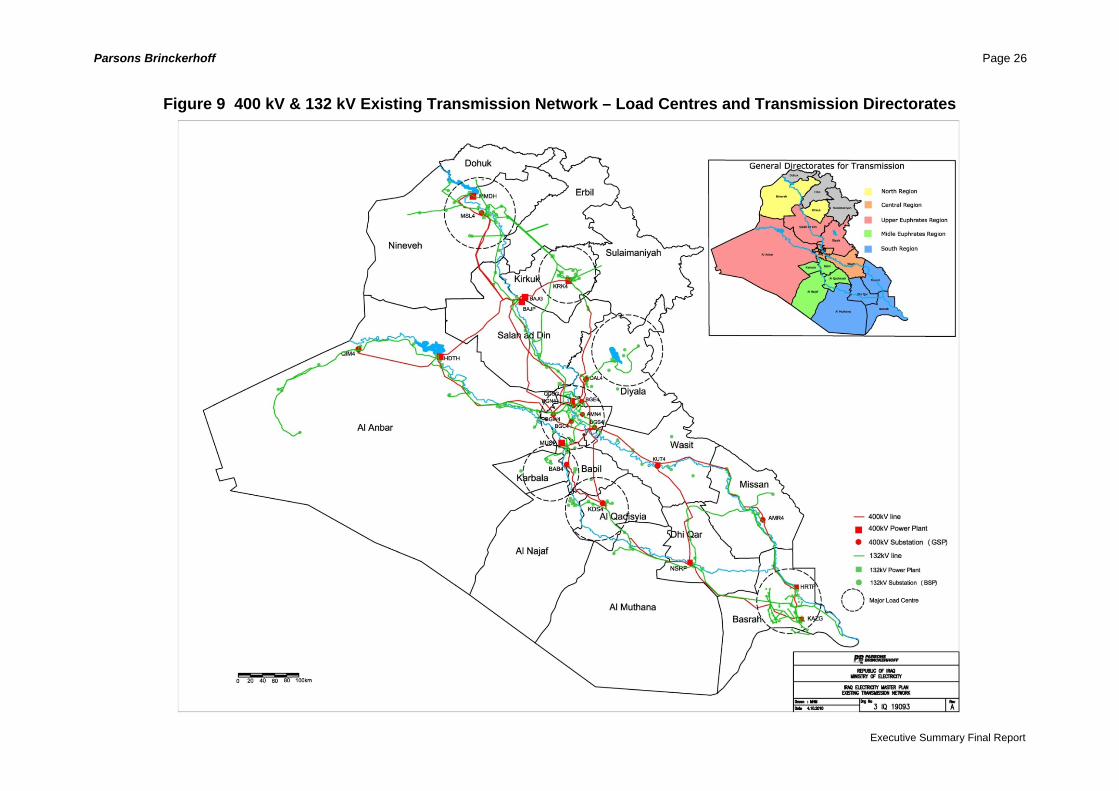
5.3.2 Problems with the Existing System The major problem with the existing system is the high fault levels on the 132kV system, particularly in Baghdad. 17% of the BSPs in Iraq have three phase fault levels higher than 30kA, and all these BSPs are located in Baghdad city.
The 132kV fault level problem is identified as an urgent problem which has to be solved as soon as possible. Five solutions are suggested:
• Split the existing 132kV network with open points;
• Adopt a re-configuration methodology on the existing 132kV network;
• Re-configure the 132kV network to nearly equally distribute the BSPs among the GSPs, as shown in Figure 10;
• Adopt a standardized approach and switchgear upgrade for the new 132kV network extensions;
• Check the possibility of upgrading some of the existing switchgear ratings.
Executive Summary Final Report

Parsons Brinckerhoff Page 22
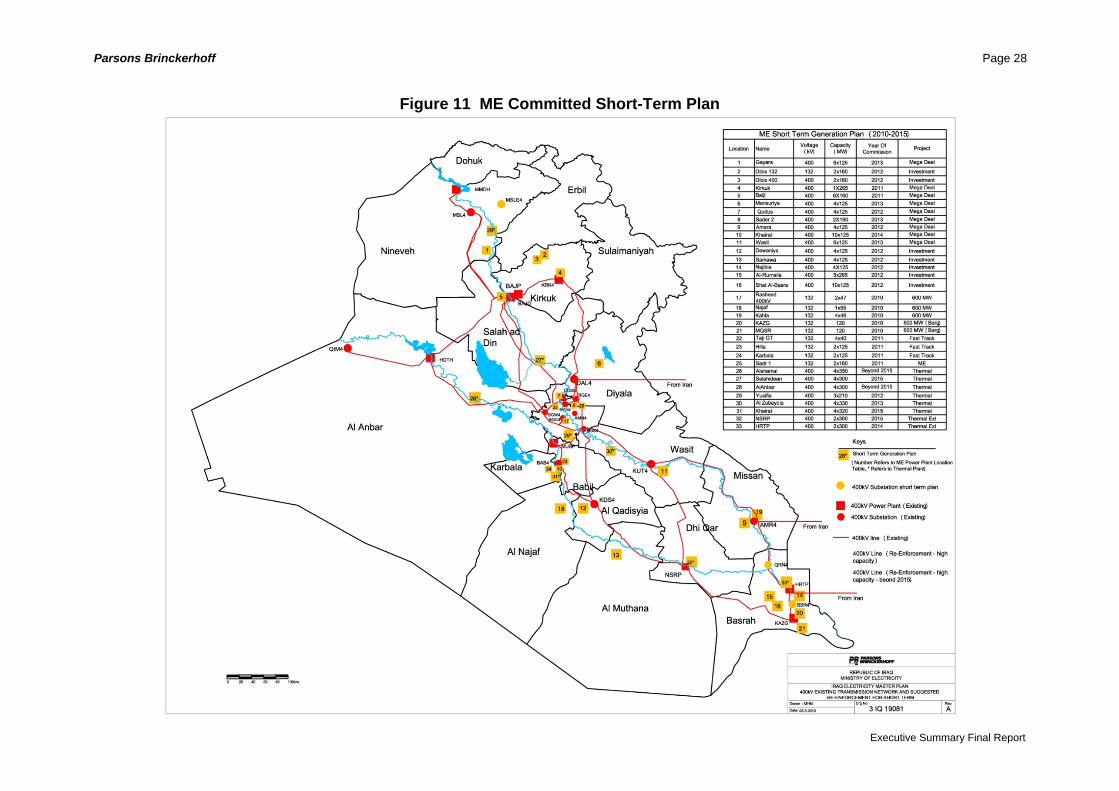
5.4 Short Term Plan 2010-2015 5.4.1 ME Generation Plan The ME generation plan involves almost 13 GW of gas turbine, thermal and diesel generation plants. Figure 11 shows the geographical distribution of the ME generation plan. Table 1 gives the yearly distribution of the generation as committed/planned by the ME. This plan shows that year 2012 is critical year with more than 4000MW expected to be connected to the network. This new generation will have a large impact on the transmission network.
5.4.2 Network Load flow models were built using the power systems software PSSE for the years 2010 to 2015 based on the 2009 existing model, the ME generation locations and the ME initial single line diagrams of the generation connections to the transmission network. The generation plan and the BSP loads were then integrated into the network to obtain the comprehensive network models of the short-term plan, and load flow analyses were carried out on the year by year models.
Table 11 Generation Added Annually to the System
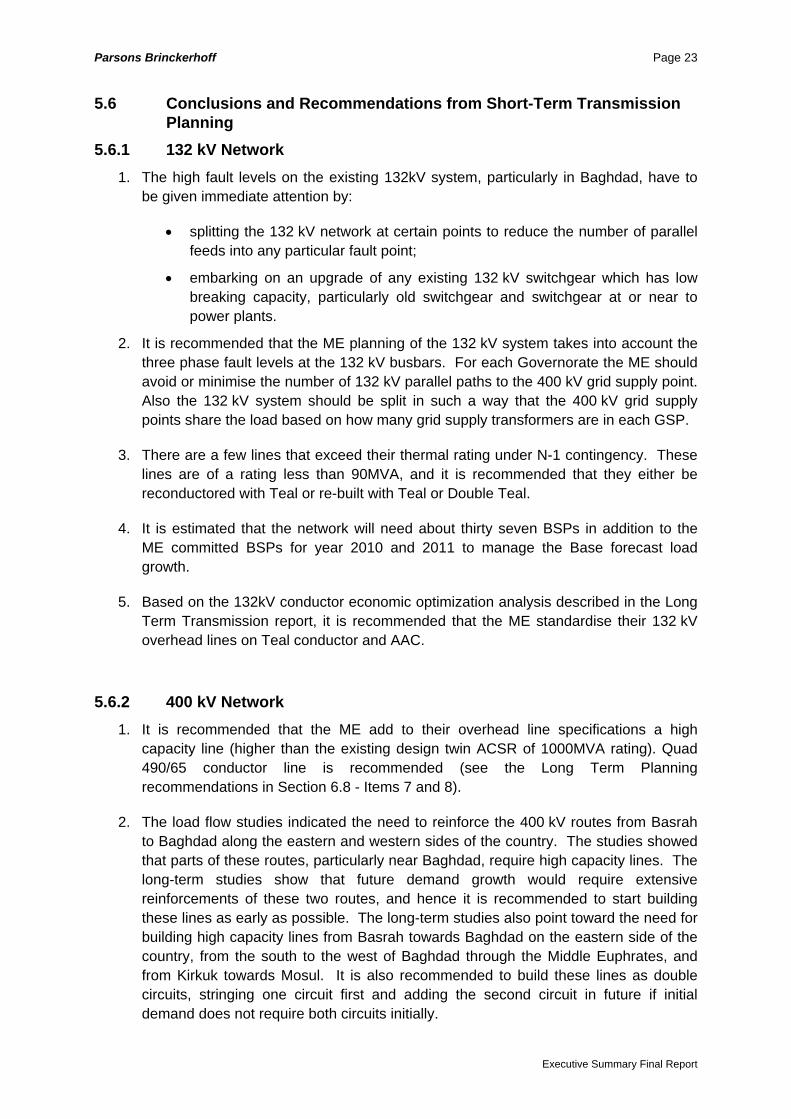
5.5 System Expansion Requirements Table 12 gives the system reinforcement required from 2009 to 2015, and Table 13 gives the corresponding cost for the reinforcements of the transmission system and the cost to connect the ME committed generation to the transmission system.
Executive Summary Final Report
Parsons Brinckerhoff Page 23
5.6 Conclusions and Recommendations from Short-Term Transmission Planning
5.6.1 132 kV Network 1. The high fault levels on the existing 132kV system, particularly in Baghdad, have to
be given immediate attention by:
• splitting the 132 kV network at certain points to reduce the number of parallel feeds into any particular fault point;
• embarking on an upgrade of any existing 132 kV switchgear which has low breaking capacity, particularly old switchgear and switchgear at or near to power plants.
2. It is recommended that the ME planning of the 132 kV system takes into account the three phase fault levels at the 132 kV busbars. For each Governorate the ME should avoid or minimise the number of 132 kV parallel paths to the 400 kV grid supply point. Also the 132 kV system should be split in such a way that the 400 kV grid supply points share the load based on how many grid supply transformers are in each GSP.
3. There are a few lines that exceed their thermal rating under N-1 contingency. These lines are of a rating less than 90MVA, and it is recommended that they either be reconductored with Teal or re-built with Teal or Double Teal.
4. It is estimated that the network will need about thirty seven BSPs in addition to the ME committed BSPs for year 2010 and 2011 to manage the Base forecast load growth.
5. Based on the 132kV conductor economic optimization analysis described in the Long Term Transmission report, it is recommended that the ME standardise their 132 kV overhead lines on Teal conductor and AAC.
5.6.2 400 kV Network 1. It is recommended that the ME add to their overhead line specifications a high
capacity line (higher than the existing design twin ACSR of 1000MVA rating). Quad 490/65 conductor line is recommended (see the Long Term Planning recommendations in Section 6.8 - Items 7 and 8).
2. The load flow studies indicated the need to reinforce the 400 kV routes from Basrah to Baghdad along the eastern and western sides of the country. The studies showed that parts of these routes, particularly near Baghdad, require high capacity lines. The long-term studies show that future demand growth would require extensive reinforcements of these two routes, and hence it is recommended to start building these lines as early as possible. The long-term studies also point toward the need for building high capacity lines from Basrah towards Baghdad on the eastern side of the country, from the south to the west of Baghdad through the Middle Euphrates, and from Kirkuk towards Mosul. It is also recommended to build these lines as double circuits, stringing one circuit first and adding the second circuit in future if initial demand does not require both circuits initially.
Executive Summary Final Report

Parsons Brinckerhoff Page 24
Executive Summary Final Report
3. By 2012 a third circuit has to be added to Qudus to be able to evacuate the extra generation. However, this connection can be to any point on the Baghdad ring, provided the 400kV fault level is satisfactory.
4. It is recommended that the 400 kV Baghdad ring be split at specific points to reduce fault levels on the 400 kV network in future. As an initial suggestion, the place of the split can be chosen in such a way as to isolate the Qudus and Sadr 400 kV generation from feeding into other 400 kV substations connected to the ring.
5. Figure 11 gives a geographical layout of the expected development of the 400 kV network in the short term.
Parsons Brinckerhoff Page 25
Table 12 132 kV and 400 kV Reinforcement Requirements for 2009 to 2015
Total
Number/ Length (km)
Cost (Million USD)
Number/ Length (km)
Cost (Million USD)
Number/ Length (km)
Cost (Million USD)
Number/ Length (km)
Cost (Million USD)
Number/ Length (km)
Cost (Million USD)
Number/ Length (km)
Cost (Million USD)
Number/ Length (km)
Cost (Million USD)
Number/ Length (km)
1 132kV Substation (AIS) ‐ BSPs 17 0 0 11 187 17 289 23 391 4 68 3 51 7 119 65
2400 SC quad 490/65 ACSR overhead lines 0.459 0 0 0 0 0 0 220 101 0 0 0 0 0 0 220
3400 DC quad 490/65 ACSR overhead lines 0.774 0 0 0 0 0 0 0 0 0 0 0 0 230 178 230
4400 SC twin 490/65 ACSR overhead lines 0.350 0 0 0 0 0 0 663 232 0 0 0 0 0 0 663
5400 DC twin 490/65 ACSR overhead lines 0.525 0 0 0 0 0 0 46 24 0 0 0 0 0 0 46
6132kV Overhead Line (Single Circuit) single Teal
0.220 136 30 120 26 839 185 690 152 120 26 90 20 210 46 2205
7132kV Overhead Line (Single Circuit) twin Teal
0.289 68 20 0 0 26 8 690 199 120 35 90 26 210 61 1204
8132kV Overhead (Double Circuit) single Teal
0.307 31 10 0 0 0 0 0 0 0 0 0 0 0 0 31
9400/132/11kV ,250MVA Auto Transformer AIS Connected
2.91 1 3 1 3 1 3 1 3 4 12 1 3 2 6 11
10132kV Cable, 800mm2 Al/XLPE (single circuit single cable)
2.5 33 83 18 45 1 3 70 175 0 0 30 75 20 50 172
2,945
2015
487 1,277 141 175 460Total cost for the Year (Million USD) 144
Note 2: The above costs do not include any GSP planned by the ME
Note 1: These 400kV lines are the minimum requirements to satisfy the base case demand (option 1)
2010
Item No.
Item DetailsUnit Cost
(Million USD)
2009
261
2011 2012 2013 2014
Table 13 Overall Plan Costs
2009 2010 2011 2012 2013 2014 2015
Cost of required reinforcements 144 261 487 1,277 141 175 460 2,945Cost of generation connections (note 1) 0 0 69 (135) 553 (998) 300 (552) 97 (175) 8 (16) 1,027 (1,876)
Total Cost (Million USD) 144 261 556 (622) 1830 (2275) 441 (693) 272 (350) 445 (453) 3,972 (4,821)
Note 1 : These costs are assuming both generation connection substations (132kV and 400kV as given by the ME ‐Appendix 12) are AIS, figures in
Total
paranthesis are assuming both substations are GIS.
YearItem
Executive Summary Final Report
Parsons Brinckerhoff Page 26
Figure 9 400 kV & 132 kV Existing Transmission Network – Load Centres and Transmission Directorates
Executive Summary Final Report
Parsons Brinckerhoff
Executive Summary Final Report
Page 27
Figure 10 400 kV & 132 kV Network of Baghdad City – Required Re-Configuration
Parsons Brinckerhoff Page 28
Figure 11 ME Committed Short-Term Plan
Executive Summary Final Report
Parsons Brinckerhoff Page 29
6. LONG TERM TRANSMISSION PLANNING
6.1 Introduction The long-term transmission planning report deals with various aspects of developing a long-term strategy to expand the transmission network in Iraq for the period 2015-2030. Beyond 2015 Iraq’s electrical transmission network developments will be influenced by two main factors:
• Power demand magnitude and distribution;
• Generation fuel availability and location.
The generation planning studies concluded that the most economical fuel to use to generate electricity in Iraq is gas. MO information indicates that about 60% of future gas resources will come from the Southern region (Basrah/Missan/ThiQar), followed by Diala and Al-Anbar with 20% and 10% respectively.
Consideration of the above information points to the following critical questions:
• Should generation be built in the Southern region and the power be transmitted to Baghdad by overhead lines? - Scenario A - or
• Should Baghdad demand be satisfied by building generation around Baghdad and transferring gas from the south by pipelines? - Scenario B.
In addition to answering the above strategic question, the long term plan also estimates the transmission network expansion requirement up to 2030.
6.2 Methodology The methodology followed in developing the long term transmission plan consists of the following:
• Develop a model to evaluate power transfer between generation and demand centres for the entire country.
• Develop load flow models to evaluate the transmission network development.
• Estimate the network expansion requirements.
• Review design aspects of major network components.
• The inputs to the above processes are:
o The load (demand) forecast
o The ME short term committed generation plan
o The long term generation plan
Executive Summary Final Report

Parsons Brinckerhoff Page 30
o The transmission short-term plan
o The ME/MO fuel expectation and the MO committed/planned fuel transportation infrastructure.
New generation plant in a particular area is aggregated in the long-term load flows. However, this does not mean that all the generation is connected at one point.
6.3 Demand and Generation Distribution Iraq demand is distributed among the Governorates as shown in Table 14, which shows that Baghdad has the maximum demand, at about 35% of the total.
Table 14 Demand Forecast
Base High Base High Base High Base High Base High
Baghdad 3822 3874 4982 5434 6156 7475 7678 10319 10058 14410Basrah 1317 1335 1738 1896 2154 2618 2723 3664 3567 5115Ninevah 1246 1262 1664 1810 2019 2438 2520 3366 3311 4719ThiQar 577 585 730 798 930 1135 1179 1594 1536 2211Salahuddin 552 560 713 779 885 1077 1121 1512 1458 2095Babil 541 548 856 919 1017 1201 1237 1608 1578 2193Al-Anbar 509 516 1136 1192 1268 1429 1457 1780 1751 2285Al-Najaf 500 507 661 721 823 1000 1029 1385 1345 1930Kirkuk 459 465 584 639 740 903 936 1265 1208 1739Al-Qadisiya 437 443 576 627 716 866 891 1191 1153 1645Kerbela 398 403 601 647 730 863 885 1152 1122 1561Missan 390 395 514 560 651 788 815 1091 1052 1501Wasit 387 392 520 563 614 734 738 972 934 1312Diala 354 359 445 487 549 670 691 935 910 1312Al-Muthanna 292 296 389 423 479 578 589 784 740 1050TOTAL 11781 11939 16111 17494 19731 23775 24489 32619 31722 45078
2010 2015 2020 2025 2030Governorate
0%5%
10%15%20%25%30%35%
Bag
hdad
Bas
rah
Nin
evah
ThiQ
ar
Sal
ahud
din
Babi
l
Al-A
nbar
Al-N
ajaf
Kirk
uk
Al-Q
adis
iya
Ker
bela
Mis
san
Was
it
Dia
la
Al-M
utha
nnaD
eman
d (%
of T
otal
)
Base Case Demand Distribution
2010 2020
2030
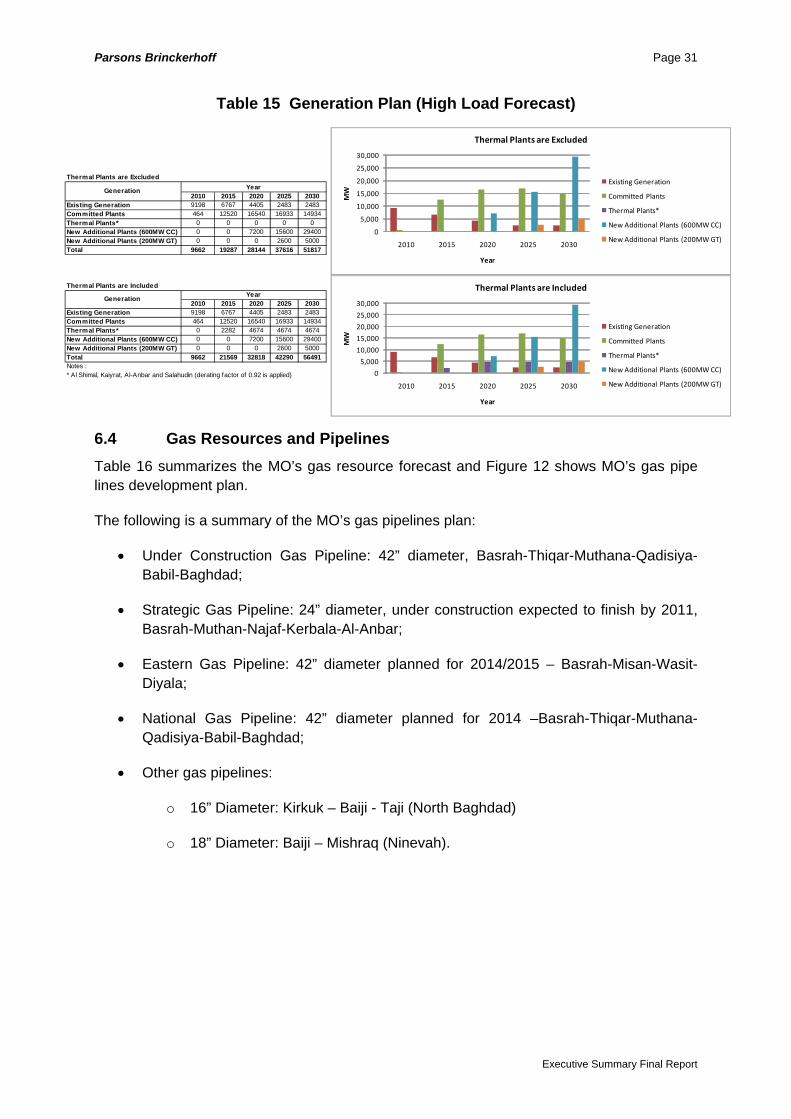
The generation growth is shown in Table 15. Baghdad and Basrah are the major centres for generation up to 2020, but beyond that the picture would change if the gas resources are developed as per the MO plan. In that case the major centre of generation would be in the south of the country. Two options are shown – one without ME’s additional four thermal plants included, and one including them. However, since the generation planning has shown that installing the four additional plant is not a least cost solution, the economic comparison between the scenarios has been based on the cases without the additional thermal plant, although the conclusions will be similar if the additional plant were installed.
Executive Summary Final Report
Parsons Brinckerhoff Page 31
Table 15 Generation Plan (High Load Forecast)
Thermal Plants are Excluded
2010 2015 2020 2025 20309198 6767 4405 2483 2483464 12520 16540 16933 149340 0 0 0 00 0 7200 15600 294000 0 0 2600 5000
9662 19287 28144 37616 51817
Thermal Plants are Included
2010 2015 2020 2025 20309198 6767 4405 2483 2483464 12520 16540 16933 149340 2282 4674 4674 46740 0 7200 15600 294000 0 0 2600 5000
9662 21569 32818 42290 56491Notes : * Al Shimal, Kaiyrat, Al-Anbar and Salahudin (derating factor of 0.92 is applied)
Year
Existing Generation
TotalNew Additional Plants (200MW GT)New Additional Plants (600MW CC)Thermal Plants*Committed Plants
Generation
New Additional Plants (600MW CC)New Additional Plants (200MW GT)Total
Generation Year
Existing GenerationCommitted Plants Thermal Plants*
0
5,000
10,000
15,000
20,000
25,000
30,000
2010 2015 2020 2025 2030
MW
Year
Thermal Plants are Excluded
Existing Generation
Committed Plants
Thermal Plants*
New Additional Plants (600MW CC)
New Additional Plants (200MW GT)
0
5,000
10,000
15,000
20,000
25,000
30,000
2010 2015 2020 2025 2030
MW
Year
Thermal Plants are Included
Existing Generation
Committed Plants
Thermal Plants*
New Additional Plants (600MW CC)
New Additional Plants (200MW GT)
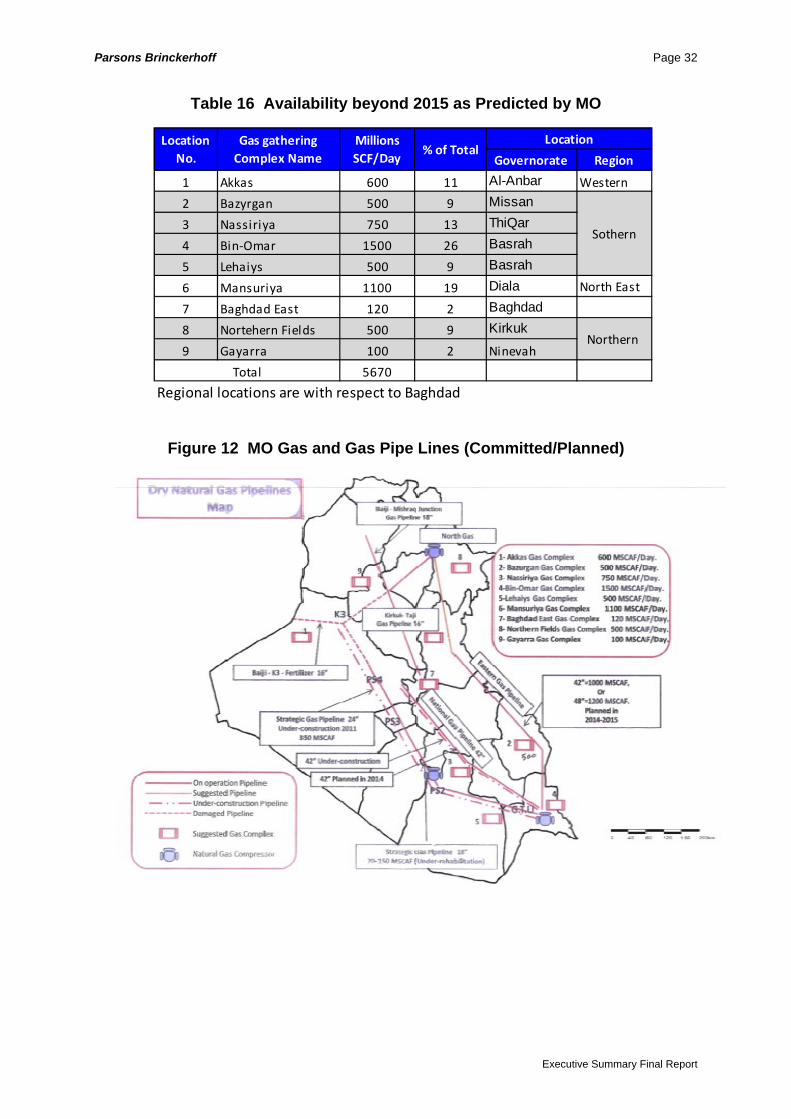
6.4 Gas Resources and Pipelines Table 16 summarizes the MO’s gas resource forecast and Figure 12 shows MO’s gas pipe lines development plan.
The following is a summary of the MO’s gas pipelines plan:
• Under Construction Gas Pipeline: 42” diameter, Basrah-Thiqar-Muthana-Qadisiya-Babil-Baghdad;
• Strategic Gas Pipeline: 24” diameter, under construction expected to finish by 2011, Basrah-Muthan-Najaf-Kerbala-Al-Anbar;
• Eastern Gas Pipeline: 42” diameter planned for 2014/2015 – Basrah-Misan-Wasit-Diyala;
• National Gas Pipeline: 42” diameter planned for 2014 –Basrah-Thiqar-Muthana-Qadisiya-Babil-Baghdad;
• Other gas pipelines:
o 16” Diameter: Kirkuk – Baiji - Taji (North Baghdad)
o 18” Diameter: Baiji – Mishraq (Ninevah).
Executive Summary Final Report
Parsons Brinckerhoff Page 32
Table 16 Availability beyond 2015 as Predicted by MO
Governorate Region
1 Akkas 600 11 Al-Anbar Western
2 Bazyrgan 500 9 Missan3 Nassiriya 750 13 ThiQar4 Bin‐Omar 1500 26 Basrah5 Lehaiys 500 9 Basrah
6 Mansuriya 1100 19 Diala North East
7 Baghdad East 120 2 Baghdad
8 Nortehern Fields 500 9 Kirkuk
9 Gayarra 100 2 Ninevah
5670
Regional locations are with respect to Baghdad Total
Northern
Sothern
LocationLocation No.
Gas gathering Complex Name
Millions SCF/Day
% of Total
Figure 12 MO Gas and Gas Pipe Lines (Committed/Planned)
Executive Summary Final Report
Parsons Brinckerhoff Page 33
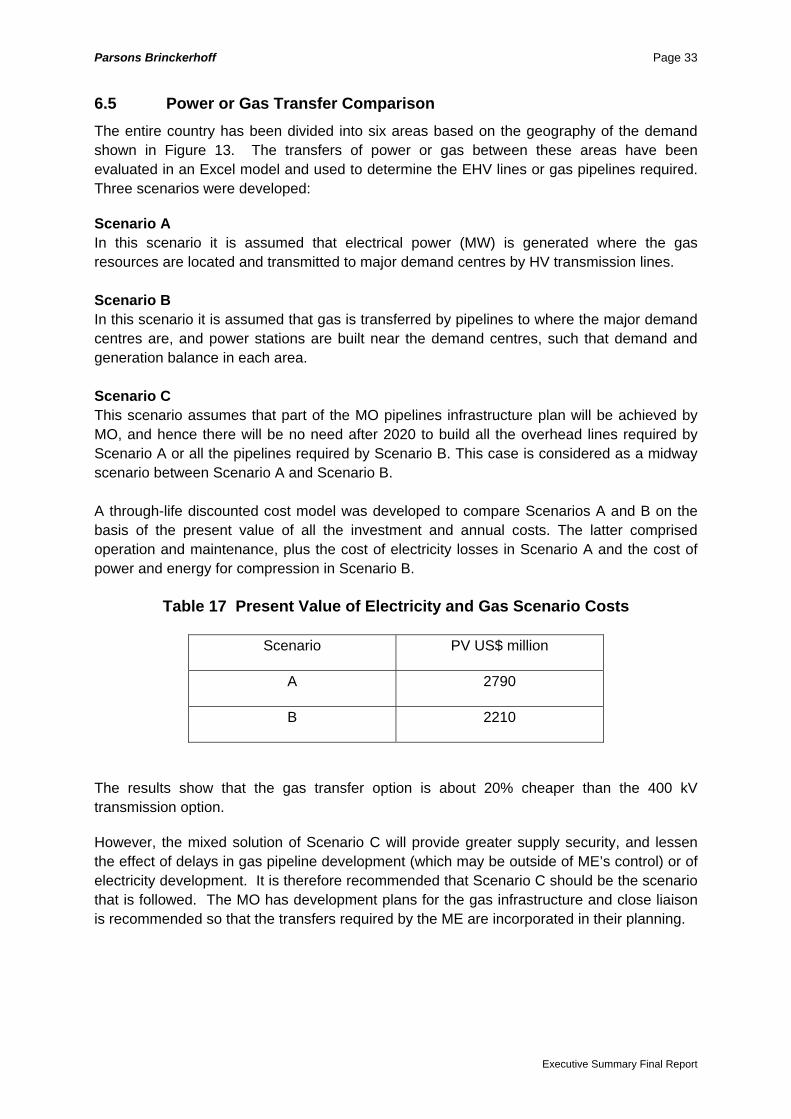
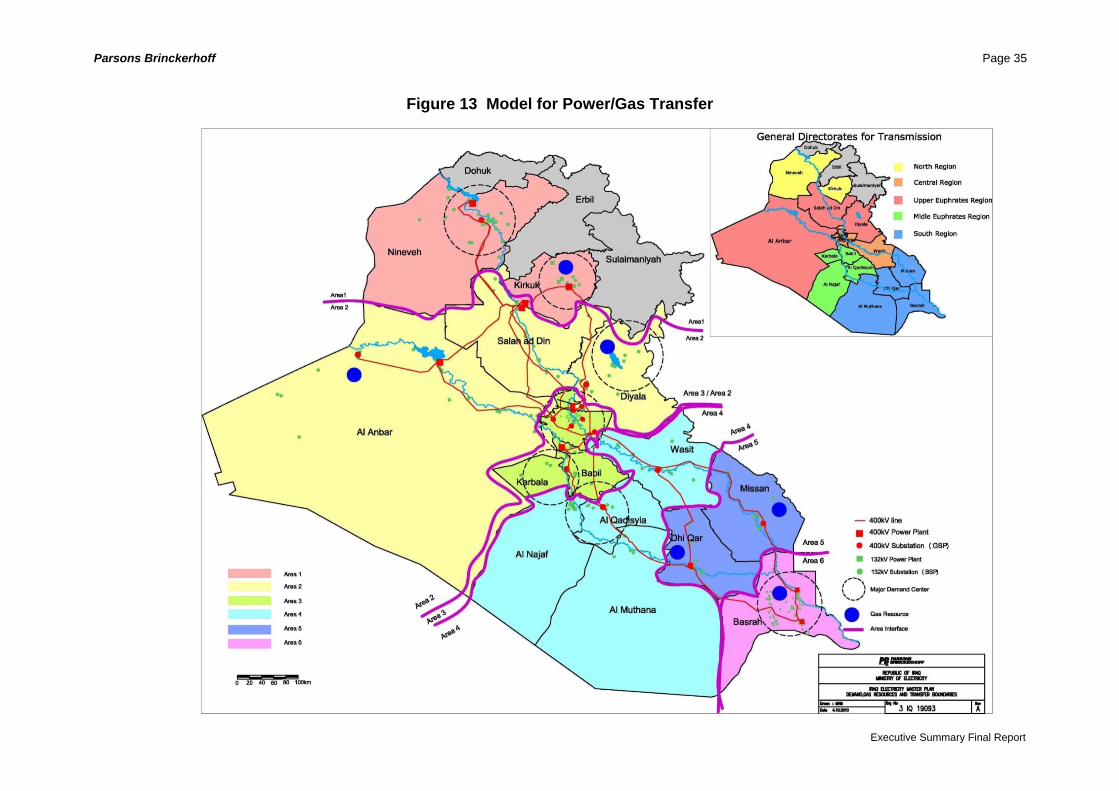
6.5 Power or Gas Transfer Comparison The entire country has been divided into six areas based on the geography of the demand shown in Figure 13. The transfers of power or gas between these areas have been evaluated in an Excel model and used to determine the EHV lines or gas pipelines required. Three scenarios were developed:
Scenario A In this scenario it is assumed that electrical power (MW) is generated where the gas resources are located and transmitted to major demand centres by HV transmission lines. Scenario B In this scenario it is assumed that gas is transferred by pipelines to where the major demand centres are, and power stations are built near the demand centres, such that demand and generation balance in each area. Scenario C This scenario assumes that part of the MO pipelines infrastructure plan will be achieved by MO, and hence there will be no need after 2020 to build all the overhead lines required by Scenario A or all the pipelines required by Scenario B. This case is considered as a midway scenario between Scenario A and Scenario B. A through-life discounted cost model was developed to compare Scenarios A and B on the basis of the present value of all the investment and annual costs. The latter comprised operation and maintenance, plus the cost of electricity losses in Scenario A and the cost of power and energy for compression in Scenario B.
Table 17 Present Value of Electricity and Gas Scenario Costs
Scenario PV US$ million
A 2790
B 2210
The results show that the gas transfer option is about 20% cheaper than the 400 kV transmission option.
However, the mixed solution of Scenario C will provide greater supply security, and lessen the effect of delays in gas pipeline development (which may be outside of ME’s control) or of electricity development. It is therefore recommended that Scenario C should be the scenario that is followed. The MO has development plans for the gas infrastructure and close liaison is recommended so that the transfers required by the ME are incorporated in their planning.
Executive Summary Final Report

Parsons Brinckerhoff Page 34
Executive Summary Final Report
6.6 Power System Analysis and Network Design
Load flow, fault level and dynamic stability studies have been carried out up to 2030 for the High load forecast for Scenarios A and C. The High load forecast case has been used because the long life of transmission plant makes it important to take a long term view so as to avoid possible stranded assets. Conductor and transmission voltage optimisations, and network design aspects have also been examined in the Long-Term Transmission Planning report, together with an overview of transmission protection. The results of this work feed into the estimate of transmission requirements and costs, and to the conclusions and recommendations given in Section 6.8.
Parsons Brinckerhoff Page 35
Figure 13 Model for Power/Gas Transfer
Executive Summary Final Report
Parsons Brinckerhoff Page 36
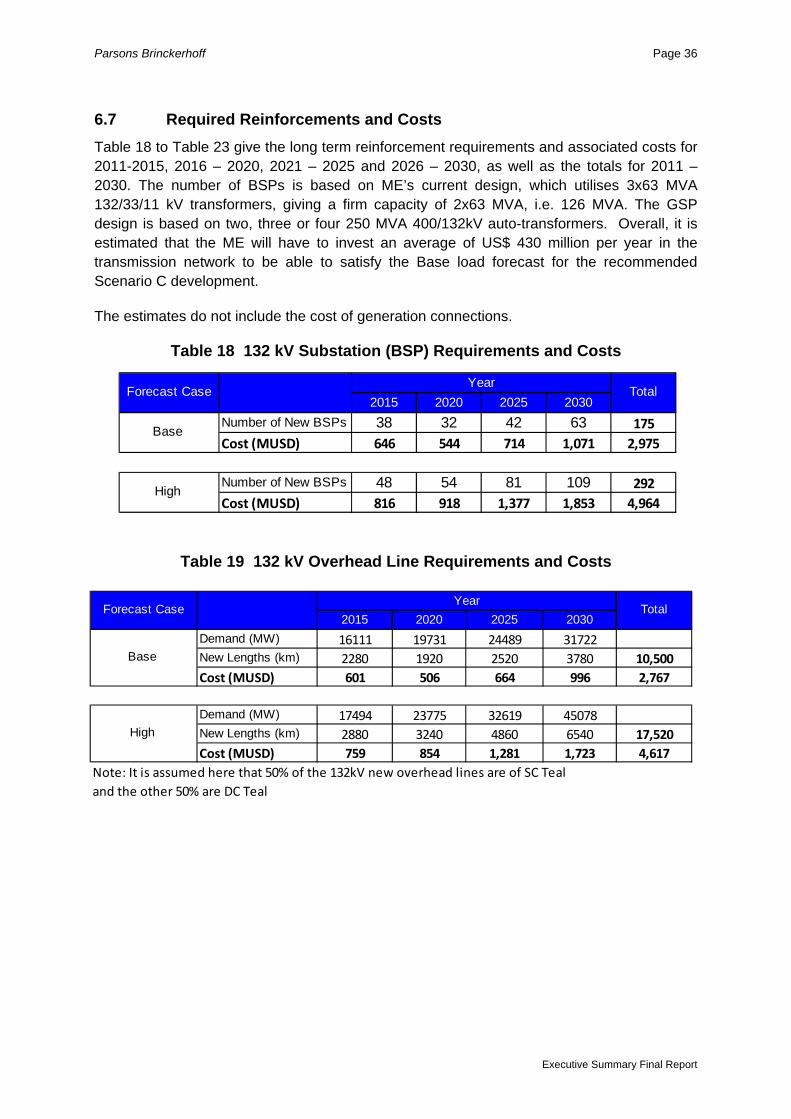
6.7 Required Reinforcements and Costs Table 18 to Table 23 give the long term reinforcement requirements and associated costs for 2011-2015, 2016 – 2020, 2021 – 2025 and 2026 – 2030, as well as the totals for 2011 – 2030. The number of BSPs is based on ME’s current design, which utilises 3x63 MVA 132/33/11 kV transformers, giving a firm capacity of 2x63 MVA, i.e. 126 MVA. The GSP design is based on two, three or four 250 MVA 400/132kV auto-transformers. Overall, it is estimated that the ME will have to invest an average of US$ 430 million per year in the transmission network to be able to satisfy the Base load forecast for the recommended Scenario C development.
The estimates do not include the cost of generation connections.
Table 18 132 kV Substation (BSP) Requirements and Costs
Table 19 132 kV Overhead Line Requirements and Costs
2015 2020 2025 2030Demand (MW) 16111 19731 24489 31722New Lengths (km) 2280 1920 2520 3780 10,500Cost (MUSD) 601 506 664 996 2,767
Demand (MW) 17494 23775 32619 45078New Lengths (km) 2880 3240 4860 6540 17,520Cost (MUSD) 759 854 1,281 1,723 4,617
Note: It is assumed here that 50% of the 132kV new overhead lines are of SC Teal and the other 50% are DC Teal
TotalYear
Base
High
Forecast Case
2015 2020 2025 2030Number of New BSPs 38 32 42 63 175Cost (MUSD) 646 544 714 1,071 2,975
Number of New BSPs 48 54 81 109 292Cost (MUSD) 816 918 1,377 1,853 4,964
TotalYear
Base
High
Forecast Case
Executive Summary Final Report
Parsons Brinckerhoff Page 37
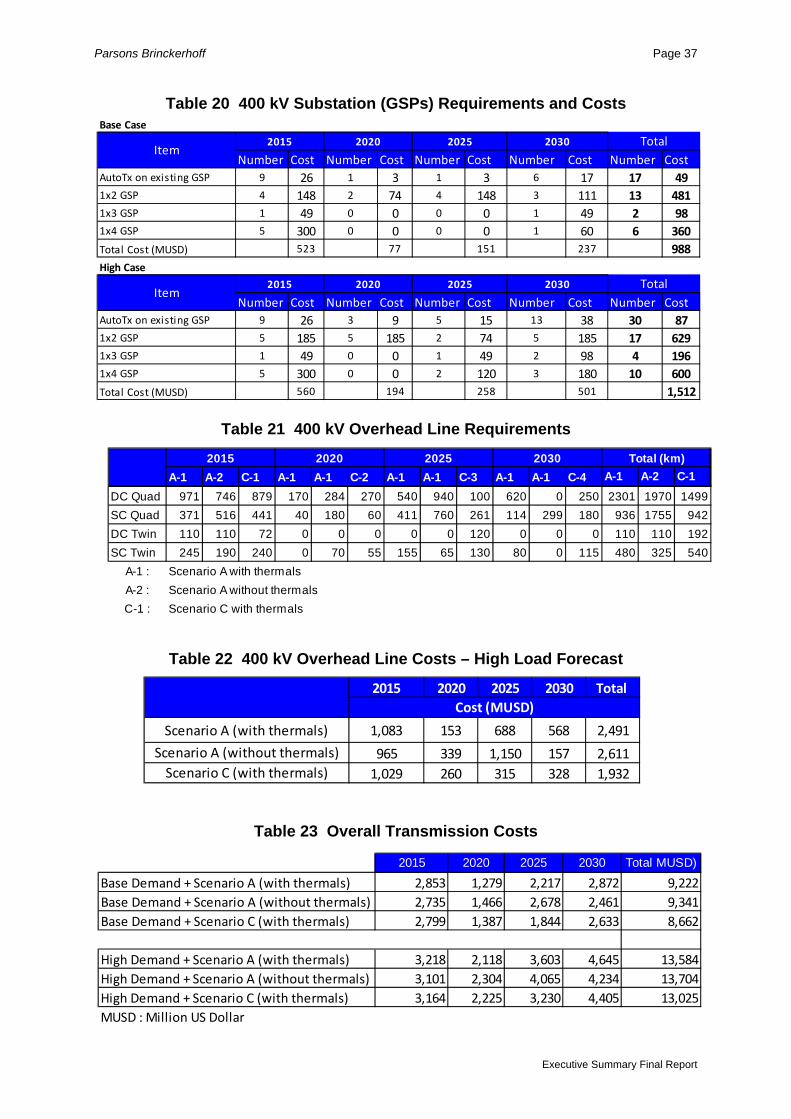
Table 20 400 kV Substation (GSPs) Requirements and Costs Ba
Table 21 400 kV Overhead Line Requirements
Table 22 400 kV Overhead Line Costs – High Load Forecast
Table 23 Overall Transmission Costs
A-1 A-2 C-1 A-1 A-1 C-2 A-1 A-1 C-3 A-1 A-1 C-4 A-1 A-2 C-1DC Quad 971 746 879 170 284 270 540 940 100 620 0 250 2301 1970 1499SC Quad 371 516 441 40 180 60 411 760 261 114 299 180 936 1755 942DC Twin 110 110 72 0 0 0 0 0 120 0 0 0 110 110 192SC Twin 245 190 240 0 70 55 155 65 130 80 0 115 480 325 540
A-1 : Scenario A with thermalsA-2 : Scenario A without thermalsC-1 : Scenario C with thermals
Total (km)2015 2020 20302025
se Case
Number Cost Number Cost Number Cost Number Cost Number CosttoTx on existing GSP 9 26 1 3 1 3 6 17 17 49 GSP 4 148 2 74 4 148 3 111 13 481 GSP 1 49 0 0 0 0 1 49 2 98 GSP 5 300 0 0 0 0 1 60 6 360
tal Cost (MUSD) 523 77 151 237 988gh Case
Number Cost Number Cost Number Cost Number Cost Number CosttoTx on existing GSP 9 26 3 9 5 15 13 38 30 87 GSP 5 185 5 185 2 74 5 185 17 629 GSP 1 49 0 0 1 49 2 98 4 196 GSP 5 300 0 0 2 120 3 180 10 600
tal Cost (MUSD) 560 194 258 501 1,512
ItemTotal
Total
2015 2020 2025 2030
2030202520202015Item
Au
1x2
1x3
1x4
To
Hi
Au
1x2
1x3
1x4
To
2015 2020 2025 2030 Total
1,083 153 688 568 2,491
965 339 1,150 157 2,6111,029 260 315 328 1,932
Scenario A (with thermals)
Scenario A (without thermals)Scenario C (with thermals)
Cost (MUSD)
2015 2020 2025 2030 Total MUSD)
2,853 1,279 2,217 2,872 9,2222,735 1,466 2,678 2,461 9,3412,799 1,387 1,844 2,633 8,662
3,218 2,118 3,603 4,645 13,5843,101 2,304 4,065 4,234 13,7043,164 2,225 3,230 4,405 13,025
MUSD : Million US Dollar
Base Demand + Scenario A (with thermals)
High Demand + Scenario C (with thermals)High Demand + Scenario A (without thermals)High Demand + Scenario A (with thermals)
Base Demand + Scenario C (with thermals)Base Demand + Scenario A (without thermals)
Executive Summary Final Report
Parsons Brinckerhoff Page 38
6.8 Conclusions and Recommendations from Long-Term Transmission Planning
1 The existing network exhibits short circuit level problems at the 132 kV level. This
requires re-configuration of the 132kV network around Baghdad. New 132 kV network extensions should follow the configurations recommended in Volume 4.
2 It is recommended that the ME reduces their list of 132 kV conductors for new circuits to only two sizes; Teal and AAC.
3 It is recommended that ME continue with their standard BSP design, which utilises 3x63 MVA 132/33/11 kV transformers. However, better utilisation of the 33 kV and 11 kV windings is recommended by properly distributing the load on the two windings according to their ratings. Consideration could, however, be given to specifying forced air cooling be fitted for use under outage conditions (ONAF), which could increase the transformer ratings to 80 MVA.
4 A through-life economic analysis shows that it is cheaper to transfer gas from sources to load centres by pipelines than to produce power at gas sources and transfer bulk power to load centres by EHV lines. However, taking into account the need for supply security and timely execution, it is recommended that Iraq follows an intermediate path whereby some bulk energy is transferred as gas and some by developing the EHV transmission system – Scenario C in this report. The MO has development plans for the gas infrastructure and close liaison is recommended so that the transfers required by the ME are incorporated in their planning.
5 The EHV transmission system voltage should continue to be 400 kV. Use of 765 kV is a more expensive option in through-life economic terms, and is not recommended at this stage.
6 It is recommended that ME start planning for the construction of new 400 kV lines as soon as possible in order to catch up with generation development.
7 For the high level of demand and generation expected, the ME is recommended to upgrade their 400kV line specification for new circuits from twin to quad conductor transmission lines. The existing 400kV design based on twin 490/65 ACSR does not have sufficient capacity to handle the future high flow of power on the network.
8 The analysis in this report shows that the highest expected flow on the 400kV network and under N-1 contingency is around 2500MVA. This is approximately equal to the thermal rating of quad 490/65 ACSR. The 490/65 conductor in a quad formation is also shown to be an economical option for the long term. Another advantage of quad 490/65 is that this type of line is based on a conductor which is already a standard ME conductor on the existing twin conductor 400kV lines. Hence this type of new line is recommended.
9 The new 400 kV lines should be built as double circuits, stringing one side first if needed. This will save the ME cost and time.
Executive Summary Final Report
Parsons Brinckerhoff Page 39
10 As a consequence of adopting a new 400kV line design with higher rating, it is also recommended that the ME upgrade their 400kV switchgear thermal and short circuit ratings. The existing 400 kV switchgear is rated for 2000 amp and suggested 400 kV switchgear candidates are 3000 amp and 3500 amp. For the short circuit rating it is recommended to upgrade to the level of 50kA or higher.
11 It is recommended to update the PSS/E transmission system models (load flow, fault level and dynamic stability) and revise the analysis on a yearly basis.
12 It is recommended that the ME uses the load flow models to analyse the re-configuration and re-structuring of the local 400kV network around Baghdad to accommodate the new 400kV lines and the expected increase in the 400kV fault levels.
13 It is also recommended that the load flow models be used to develop the local 400kV networks which, in the Masterplan studies, have lumped generation assumed for the future gas sources.
14 The protection operation times plus switchgear opening times on the ME 400 kV network are lower than the 400 kV critical clearance times determined by transient stability studies, and are therefore satisfactory. The transient stability studies also indicate that the network is stable under credible contingency events of tripping a highly loaded circuit from a network branch, generation units or bulk load.
15 The ME should produce comprehensive protection application and setting policy documents. A protection maintenance policy should also be produced.
16 Fault records should be kept for all fault incidents and all protection operations (including failure to trip), and these statistics should be analysed periodically.
17 An up-to-date record should be kept of as-installed protection settings and protection scheme details. A dedicated team(s) should be appointed to create the ASPEN database/s and continually update it. Updates should be carried out at regular intervals of at least every month
18 Training has been given to the ME’s Planning and Studies office as part of the Masterplan activities. It is recommended that a follow-on training programme for the engineers and specialists of the Planning and Studies office should be developed.
Executive Summary Final Report

Parsons Brinckerhoff Page 40
Executive Summary Final Report

Parsons Brinckerhoff Page 41
Figure 14 Expected Future Development of the 400kV System
Executive Summary Final Report

Parsons Brinckerhoff Page 42
Executive Summary Final Report
Parsons Brinckerhoff Page 43
7. DISTRIBUTION PLANNING
7.1 Introduction Iraq possessed in the past a relatively robust electricity system. However, many years of sanctions, conflict, and lack of investment have resulted in a system struggling to keep up with a rapidly rising demand. In general the distribution system has suffered substantially from lack of investment, both in the network itself and in the planning and maintenance staff. The construction and maintenance of the distribution system has a considerable impact on the quality of supply to consumers and the efficiency of the network. The distribution section of the ME is typically having to react to short-term problems rather than being able to develop medium and long-term plans and strategies.
Due to a restricted supply situation, load shedding is widespread. Because of this unreliable supply most consumers have resorted to connecting to a private supply of electricity. Private generation is particularly pervasive at low voltage (LV) and is used in both rural and urban environments.
Due to the uncontrolled and unplanned expansion of the LV networks, much of the distribution network is overloaded. As a result of insufficient energy metering and a subsidised tariff, there are no satisfactory measures in place to be able to control this consumption.
7.2 Capacity Development The primary aim of the distribution portion of the Iraq Masterplan has been to develop the ME’s capability to conduct distribution planning. With close cooperation from the ME, PB has designed and delivered documents, equipment, software tools and training. The capacity development programme involved distribution staff from the Planning and Studies Department and from all seven directorates. It was a mixture of classroom instruction, interactive workshops, and practical hands-on training with distribution planning software tools. Over the project duration, almost three months of training was given to the distribution planning team.
A distribution planning laboratory has been supplied in the ME headquarters in Baghdad, using CYMDIST, a popular distribution planning software package, and is designed to be expandable. Additionally, stand-alone CYMDIST workstations have been provided for use in each of the seven Distribution Directorates.
To give practical experience with the tools used to develop distribution plans, the ME selected a 132/33/11 kV Bulk Supply Point from each of the Directorates. The ME Masterplan distribution planning team collected data regarding the network supplied by each BSP and built electrical models in CYMDIST simulating the current performance of the MV and LV networks.
Although the main use of the models has been as a training tool, they will allow the ME to start to develop plans to rehabilitate and reinforce the distribution network, in order to bring them up to the desired standard. By involving staff from each of the Directorates in the training, they can replicate the methodology in their local areas and pass knowledge onto others.
Executive Summary Final Report
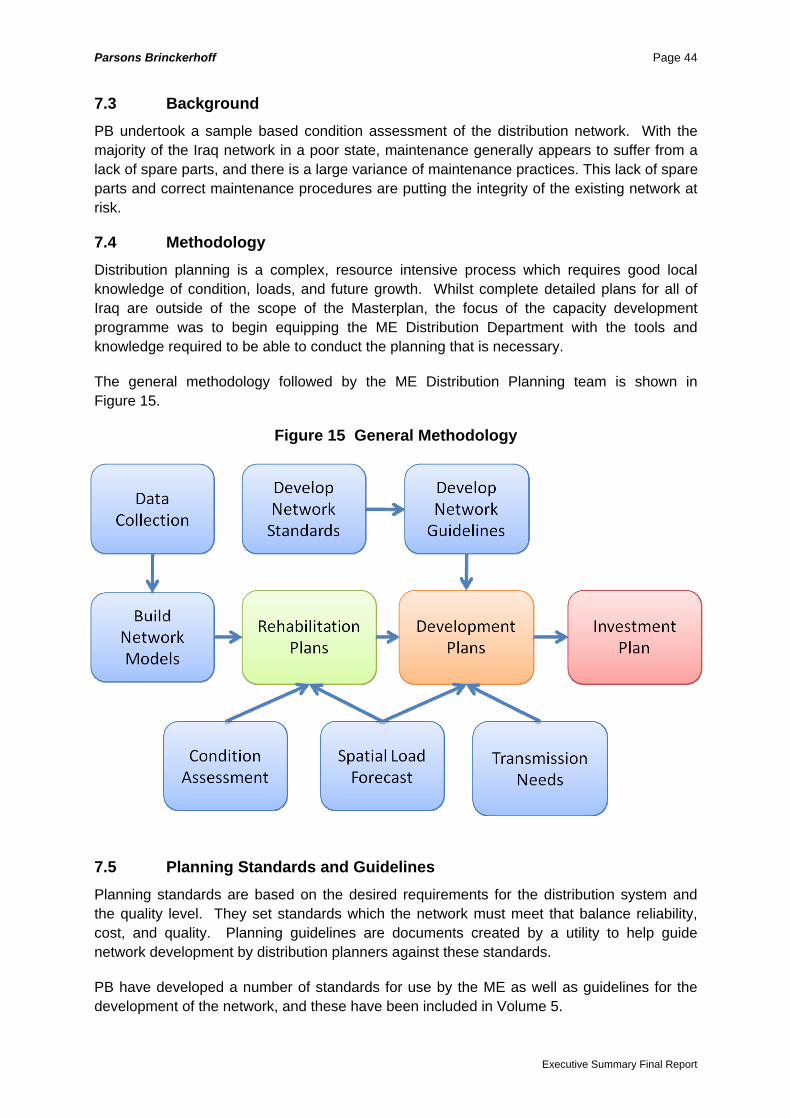
Parsons Brinckerhoff Page 44
7.3 Background PB undertook a sample based condition assessment of the distribution network. With the majority of the Iraq network in a poor state, maintenance generally appears to suffer from a lack of spare parts, and there is a large variance of maintenance practices. This lack of spare parts and correct maintenance procedures are putting the integrity of the existing network at risk.
7.4 Methodology Distribution planning is a complex, resource intensive process which requires good local knowledge of condition, loads, and future growth. Whilst complete detailed plans for all of Iraq are outside of the scope of the Masterplan, the focus of the capacity development programme was to begin equipping the ME Distribution Department with the tools and knowledge required to be able to conduct the planning that is necessary.
The general methodology followed by the ME Distribution Planning team is shown in Figure 15.
Figure 15 General Methodology
7.5 Planning Standards and Guidelines Planning standards are based on the desired requirements for the distribution system and the quality level. They set standards which the network must meet that balance reliability, cost, and quality. Planning guidelines are documents created by a utility to help guide network development by distribution planners against these standards.
PB have developed a number of standards for use by the ME as well as guidelines for the development of the network, and these have been included in Volume 5.
Executive Summary Final Report
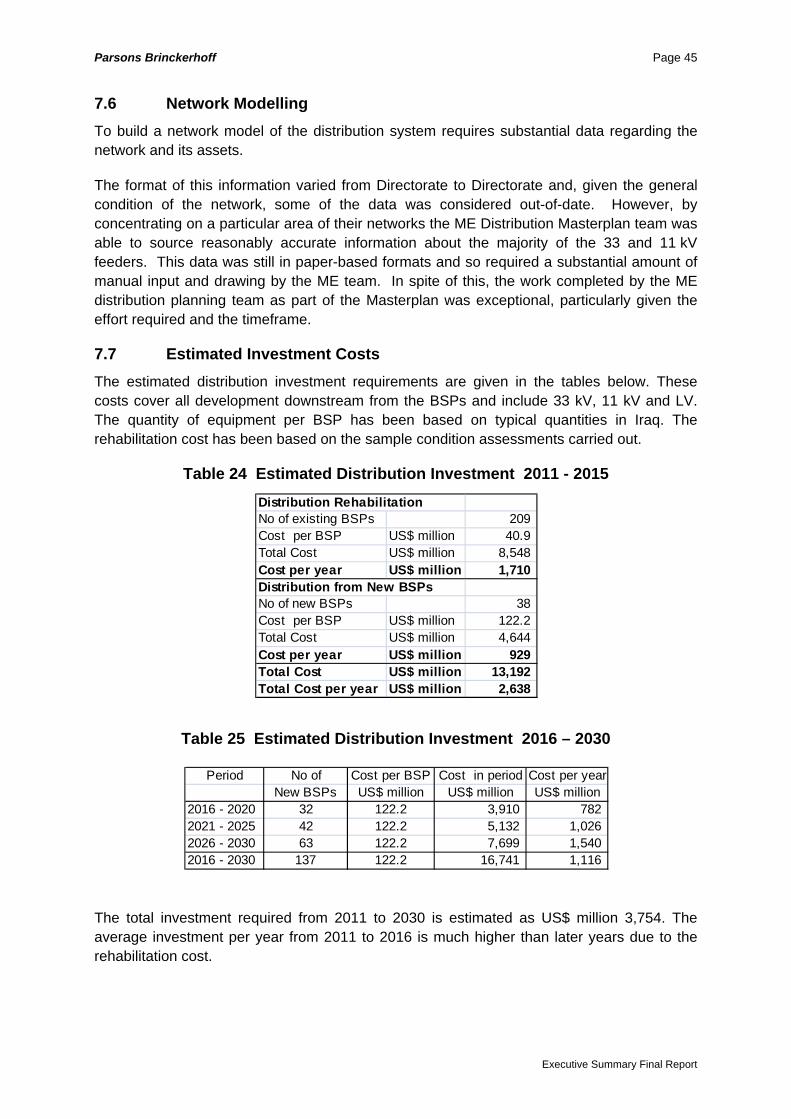
Parsons Brinckerhoff Page 45
7.6 Network Modelling To build a network model of the distribution system requires substantial data regarding the network and its assets.
The format of this information varied from Directorate to Directorate and, given the general condition of the network, some of the data was considered out-of-date. However, by concentrating on a particular area of their networks the ME Distribution Masterplan team was able to source reasonably accurate information about the majority of the 33 and 11 kV feeders. This data was still in paper-based formats and so required a substantial amount of manual input and drawing by the ME team. In spite of this, the work completed by the ME distribution planning team as part of the Masterplan was exceptional, particularly given the effort required and the timeframe.
7.7 Estimated Investment Costs The estimated distribution investment requirements are given in the tables below. These costs cover all development downstream from the BSPs and include 33 kV, 11 kV and LV. The quantity of equipment per BSP has been based on typical quantities in Iraq. The rehabilitation cost has been based on the sample condition assessments carried out.
Table 24 Estimated Distribution Investment 2011 - 2015 Distribution Rehabilitation
No of existing BSPs 209 Cost per BSP US$ million 40.9 Total Cost US$ million 8,548 Cost per year US$ million 1,710 Distribution from New BSPsNo of new BSPs 38 Cost per BSP US$ million 122.2 Total Cost US$ million 4,644 Cost per year US$ million 929 Total Cost US$ million 13,192 Total Cost per year US$ million 2,638
Table 25 Estimated Distribution Investment 2016 – 2030
Period No of Cost per BSP Cost in period Cost per yearNew BSPs US$ million US$ million US$ million
2016 - 2020 32 122.2 3,910 782 2021 - 2025 42 122.2 5,132 1,026 2026 - 2030 63 122.2 7,699 1,540 2016 - 2030 137 122.2 16,741 1,116
The total investment required from 2011 to 2030 is estimated as US$ million 3,754. The average investment per year from 2011 to 2016 is much higher than later years due to the rehabilitation cost.
Executive Summary Final Report

Parsons Brinckerhoff Page 46
7.8 Main Recommendations from Distribution Planning 7.8.1 Capacity Development The training that was delivered to the ME needs to be maintained and developed further. Some recommendations for this area are:
• Periodic training in planning software such as CYMDIST to teach new users and refresh existing users
• Expansion of the existing usage of CYMDIST and other distribution planning tools and techniques
• Development of an internal training programme (including handouts and notes) in English and Arabic.
• Cross-department training and formalised interaction e.g. between Operations and Maintenance and the Planning departments, and between Transmission and Distribution departments, etc.
• Provide access to expertise and support from international consultants and key equipment suppliers.
• The ME planners need to gain further knowledge and experience of modern distribution system technology and practices. It is suggested that there is more active participation by the ME in the wider distribution industry both within the Middle East and further afield.
7.8.2 Loss Reduction As previously mentioned, the condition of the distribution network is poor, which has an impact on the quality and efficiency of supply. The power and energy losses within a system are the input less the output. They are inherent in any electrical network and can be viewed as the ‘cost’ of delivering electricity. However, like any other business cost, losses must be managed to the appropriate economic level, which is where the cost of further reducing losses balances the further investment needed to reduce them i.e. marginal costs are balanced.
Metering is not consistent across Iraq, making it difficult to measure what the loss levels are. However the condition of the network means that the Iraq network has quite high levels of losses, and thus requires immediate action.
It is therefore highly recommended that the ME begin the implementation of a Loss Reduction Programme immediately. Loss Reduction Programmes are generally self-financing even over a relatively short period of time. The reduction in technical losses plus the associated improvement in voltage quality to the consumer means that there are savings in both energy and capacity costs. In addition, a reduction in non-technical losses will increase ME’s income, and can also lead to a reduction in consumption.
Arguably the most cost effective way to reduce losses at the distribution level is to ensure that maintenance and construction problems are corrected. As the ME already employs staff to undertake this work, the additional costs should be minimal. Additionally PB has proposed
Executive Summary Final Report
Parsons Brinckerhoff Page 47
a number of network standards for the ME to use on their system. If these standards are followed, then losses can be generally kept within acceptable ranges. This means keeping:
• voltage within the required range;
• equipment loaded to standard levels; and
• power factor at optimal levels.
7.8.3 Planning Standards and Guidelines The planning standards and guidelines provided by PB will only become beneficial if they are used throughout the entire distribution network. Procedures and regular training should be implemented to ensure that they are widely understood and used. Additionally, feedback and suggestions for document revision from all the Directorates should be used to update the standards and guidelines as necessary.
To encourage wider usage, the ME may need to develop parallel documents in Arabic, although care will need to be taken to ensure that these match the intent of the English versions.
7.8.4 Planning Information There are substantial differences within the ME as to how and what information is recorded. It is important to standardise the data and records kept by the ME on their system, both between departments and between regions. These records should be in a consistent and coherent electronic format, and the important data should be accessible in a centralised repository.
The lack of accurate loading information at the primary substation level is also a significant issue. It needs to be redressed if the ME wishes their distribution planners to be able to make correct and cost effective decisions. Much of the data is collected by hand at present, and not always at the time of system peak.
Additionally this load is generally only recorded in amperes, with little information on the system voltage and power factor. Whilst not crucial to the planning process, the assumptions that planners are forced to make mean that they have limited knowledge of the true load on their network.
7.8.5 Condition Assessment The representative condition assessment sample that PB completed allowed a reasonably accurate picture of the state of the Iraq distribution network to be developed. This allowed budgets for investment to be broadly estimated.
However the condition assessment is not sufficient for developing detailed rehabilitation or replacement plans for individual feeders and secondary distribution networks.
It is highly recommended that the ME conduct a complete inventory and condition assessment of the distribution network. As well as the condition of the equipment, this should also record the age and characteristics of the network assets. This would form the
Executive Summary Final Report
Parsons Brinckerhoff Page 48
start of an ongoing condition monitoring programme to provide prioritised maintenance cues for the distribution department.
7.8.6 Meter Installation Programme Meters provide important information for reconciling the usage of energy throughout the network and provide the ME with a way to recover costs proportional to individual consumer usage.
Un-metered usage also tends to be excessive when compared to metered usage, although this does depend significantly upon the set level of tariff. However it is expected that a meter installation programme (along with the required systems/procedures for meter reading and customer billing) would encourage more energy conservation amongst domestic consumers.
It is recommended that the ME consider implementation of a meter installation programme as soon as feasible. It will be important that this involves the development of the ‘back-office’ functionality in staff and software that will allow meter readings to be taken, recorded, and audited and energy usage calculated, billed, and recovered.
Inexpensive electronic meters that are robust and relatively tamper-resistant would provide advantages over the mechanical meters that are currently in use. Meter reading can be partially automated in order to reduce human error.
More advanced metering may need to be considered for large or industrial consumers to allow monitoring of power factor and reactive power consumption.
It is suggested that any implementation of ‘smart metering’ for domestic consumers be firstly evaluated under a pilot scheme to ensure cost effectiveness and demonstrate tangible benefits.
Executive Summary Final Report
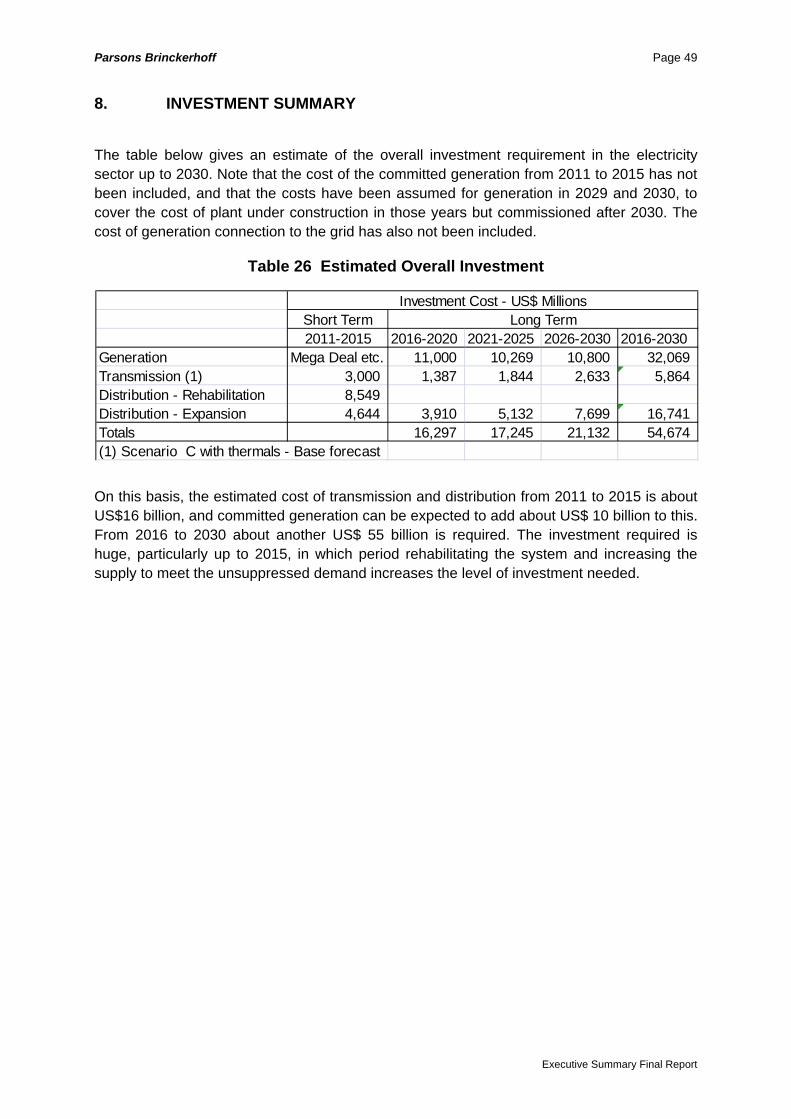
Parsons Brinckerhoff Page 49
Executive Summary Final Report
8. INVESTMENT SUMMARY
The table below gives an estimate of the overall investment requirement in the electricity sector up to 2030. Note that the cost of the committed generation from 2011 to 2015 has not been included, and that the costs have been assumed for generation in 2029 and 2030, to cover the cost of plant under construction in those years but commissioned after 2030. The cost of generation connection to the grid has also not been included.
Table 26 Estimated Overall Investment
Short Term2011-2015 2016-2020 2021-2025 2026-2030 2016-2030
Generation Mega Deal etc. 11,000 10,269 10,800 32,069 Transmission (1) 3,000 1,387 1,844 2,633 5,864 Distribution - Rehabilitation 8,549 Distribution - Expansion 4,644 3,910 5,132 7,699 16,741 Totals 16,297 17,245 21,132 54,674 (1) Scenario C with thermals - Base forecast
Long TermInvestment Cost - US$ Millions
On this basis, the estimated cost of transmission and distribution from 2011 to 2015 is about US$16 billion, and committed generation can be expected to add about US$ 10 billion to this. From 2016 to 2030 about another US$ 55 billion is required. The investment required is huge, particularly up to 2015, in which period rehabilitating the system and increasing the supply to meet the unsuppressed demand increases the level of investment needed.