Representative Farms Economic Outlook for the … FARMS ECONOMIC OUTLOOK FOR THE JANUARY 2017...
105
9 14 2016 2017 2018 2019 2020 9 0 50 100 150 200 250 300 350 Working Paper 17-1 March 2017 Department of Agricultural Economics Texas AgriLife Research Texas AgriLife Extension Service Texas A&M University College Station, Texas 77843-2124 Telephone: (979) 845-5913 Fax: (979) 845-3140 http://www.afpc.tamu.edu AFPC Agricultural and Food Policy Center Representative Farms Economic Outlook for the January 2017 FAPRI/AFPC Baseline
Transcript of Representative Farms Economic Outlook for the … FARMS ECONOMIC OUTLOOK FOR THE JANUARY 2017...

9 14
2016 2017 2018 2019 2020
90
50
100
150
200
250
300
350
Working Paper 17-1
March 2017
Department of Agricultural EconomicsTexas AgriLife ResearchTexas AgriLife Extension ServiceTexas A&M University
College Station, Texas 77843-2124Telephone: (979) 845-5913
Fax: (979) 845-3140http://www.afpc.tamu.edu
AFPCAgricultural and Food Policy Center
Representative Farms EconomicOutlook for the January 2017
FAPRI/AFPC Baseline

EXECUTIVE SUMMARY
The Agricultural and Food Policy Center (AFPC) at Texas A&M University develops and maintains data to simulate 94 representative crop, dairy, and livestock operations in major production areas in 29 states. The chief purpose of this analysis is to project the economic viability of those farms by region and commodity for 2017 through 2021. The data necessary to simulate the economic activity of these operations is developed through ongoing cooperation with panels of agricultural producers in selected states. The Food and Agricultural Policy Research Institute (FAPRI) provided projected prices, policy variables, and input inflation rates in their January 2017 Baseline. Under the January 2017 Baseline, 19 of the 63 crop farms are considered in good liquidity condition (less than a 25 percent chance of negative ending cash by 2021). Nine crop farms have between a 25 percent and a 50 percent likelihood of negative ending cash, and the remaining 35 crop farms have greater than a 50 percent chance of negative ending cash. Additionally, 25 of the 63 crop farms are considered in good equity position (less than a 25 percent chance of decreasing real net worth during the study period). Four crop farms have between a 25 percent and 50 percent likelihood of losing real net worth, and 34 crop farms have greater than a 50 percent probability of decreasing real net worth by 2021. The following discussion provides an overall evaluation by commodity considering both liquidity and equity measures.
• FEEDGRAIN FARMS: Seven of the 22 feedgrain farms are in good overall financial condition. Four farms are classified in marginal condition, and eleven are in poor condition.
• WHEAT FARMS: Three representative wheat farms are classified in good overall financial condition, none are in marginal condition, and eight are in poor condition.
• COTTON FARMS: Five of the 15 cotton farms are classified in good condition, three are in marginal condition, and seven are in poor condition.
• RICE FARMS: Three of the 15 rice farms are projected to be in good financial condition. Four rice farms are projected to be in marginal condition; eight are in poor condition.
• DAIRY FARMS: Sixteen of the 20 dairies are in good overall financial condition. One dairy is classified in marginal condition, and three are in poor condition.
• BEEF CATTLE RANCHES: One of the 11 cattle ranches is classified in good financial
condition, four are in marginal condition, and six are projected to be in poor condition.

REPRESENTATIVE FARMS ECONOMIC OUTLOOK FOR THE JANUARY 2017
FAPRI/AFPC BASELINE
AFPC Working Paper 17-1
James W. Richardson Joe L. Outlaw
George M. Knapek J. Marc Raulston Brian K. Herbst
David P. Anderson Henry L. Bryant Steven L. Klose Peter Zimmel
Agricultural and Food Policy Center Department of Agricultural Economics
Texas AgriLife Research Texas AgriLife Extension Service
Texas A&M University
March 2017
College Station, Texas 77843-2124 Telephone: (979) 845-5913
Fax: (979) 845-3140 Web Site: http://www.afpc.tamu.edu/

REPRESENTATIVE FARMS ECONOMIC OUTLOOK FOR THE JANUARY 2017 FAPRI/AFPC BASELINE
The farm level economic impacts of the FAPRI January 2017 Baseline on representative crop and livestock operations are projected in this report. The analysis was conducted over the 2014-2021 planning horizon using FLIPSIM, AFPC’s whole farm simulation model. Data to simulate farming operations in the nation’s major production regions came from two sources:
• Producer panel cooperation to develop economic information to describe and simulate representative crop, livestock, and dairy farms.
• Projected prices, policy variables, and input inflation rates from the Food and Agricultural Policy
Research Institute (FAPRI) January 2017 Baseline. The FLIPSIM policy simulation model incorporates the historical risk faced by farmers for prices and
production. This report presents the results of the January 2017 Baseline in a risk context using selected simulated probabilities and ranges for annual net cash farm income values. The probability of a farm experiencing negative ending cash reserves and the probability of a farm losing real net worth are included as indicators of the cash flow and equity risks facing farms through the year 2021.
This report is organized into ten sections. The first section summarizes the process used to develop the representative farms and the key assumptions utilized for the farm level analysis. The second section summarizes the FAPRI January 2017 Baseline and the policy and price assumptions used for the representative farm analyses. The third through sixth sections present the results of the simulation analyses for feed grain, wheat, cotton, and rice farms. The seventh and eighth sections summarize simulation results for dairy and cattle. Two appendices constitute the final sections of the report. Appendix A provides tables to summarize the physical and financial characteristics for each of the representative farms. Appendix B provides the names of producers, land grant faculty, and industry leaders who cooperated in the panel interview process to develop the representative farms. Panel Process
AFPC has developed and maintains data to simulate 95 representative crop farms, dairies, and livestock operations chosen from major production areas across the United States (Figure 7). Characteristics for each of the operations in terms of location, size, crop mix, assets, and average receipts are summarized in Appendix A. The locations of these farms are primarily the results of discussions with staffers for the U.S. House and Senate Agriculture Committees. Information necessary to simulate the economic activity on these representative farms is developed from panels of producers using a consensus-building interview process. Often, two farms are developed in each region using separate panels of producers: one is representative of moderate size full-time farm operations, and the second panel usually represents farms two to three times larger.
The data collected from the panel farms are analyzed using the whole farm simulation model (FLIPSIM) developed by AFPC. The producer panels are provided pro-forma financial statements for their representative farm and are asked to verify the accuracy of simulated results for the past year and the reasonableness of a five-year projection. Each panel must approve the model’s ability to reasonably reflect the economic activity on their representative farm prior to using the farm for policy analysis. All farms used in the analysis have been updated through panel discussions since January 2013, with the majority being updated in the last two years. All of the crop farms are assumed to begin 2014 with 20 percent intermediate-term and long-term debt. Initial debt levels in 2014 for dairy farms were set at 30 percent and initial debt levels for beef cattle ranches were 1 percent for land and 5 percent for cattle and machinery. The debt levels the farms have at the outset of 2014 are based on a stratified tabulation of the ERS-USDA Farm Cost and Returns Survey (using the survey data for moderate to large size farms in states where AFPC has representative farms) and panel member input.

Figure 1. Representative Farms and Ranches
Rice
Dairy
Wheat
Rice
Dairy
Cattle
Cattle
CattleWheat
Cotton CottonDairy
Dairy
Feed Grain
Cotton
RiceRice
Wheat
Wheat
Feed Grain
Feed Grain
Feed GrainFeed Grain
DairyCattle
DairyDairy
Dairy
Feed GrainCotton
Dairy
Dairy
Cattle
Cattle
Cotton
Cotton
Cattle
Rice
Cotton
Dairy Rice
FeedGrain
Feed Grain
Cotton
Cotton
Cattle
Cattle
Feed Grain
Feed Grain
CottonFeed Grain
Cattle
Wheat
Wheat
Wheat
Feed GrainCotton
Feed Grain
Feed Grain
Rice
Dairy
Feed Grain
CottonCattle
Dairy
Rice
Rice

Key Assumptions of Report All farms classified as moderate scale are the size (acres or number of livestock) considered to be
representative of a majority of full-time commercial farming operations in the study area. In many regions, a second farm two to three times larger than the moderate scale farm is developed as an indicator of size economies.
The farm level simulation model incorporates price and yield risk faced by farmers. Historical yield
variability for crops and production for livestock (sale weights, birth rates, and milk per cow) over the past ten years are assumed to prevail for the planning horizon. Random crop, livestock, and milk prices are simulated using the January 2017 Baseline by FAPRI as the forecast of average prices. Prices reflect national price volatility caused by international production and demand as well as U.S. production risk.
Historical crop yields (2014-2016) were held constant based on actual values obtained from the producers.
Crop yields for 2017-2021 were simulated stochastically based on the average yields provided by the producers and the historical yield variability for the farm. Prices were held constant at producer-provided values for 2014 and 2015. FAPRI’s January 2017 Baseline prices were localized for the farms and used as the average prices for 2017-2021 to simulate stochastic crop and livestock prices.
Dairy and beef cattle herd sizes were held constant for all farms over the 2017-2021 planning horizon.
Starting in 2014, all farms are subject to 4 payment limits on ARC, PLC, and Marketing Loan combined
payments.
The farm is subject to owner/operator federal (income and self-employment) and applicable state income taxes as a sole proprietor, based on the current income tax provisions.
No off-farm income, including family employment, was included in the analyses. Therefore, the farm
reflects only the ability of the farm to provide for family living and capital replacement.
Farm program parameters, average annual prices, crop and livestock yield trends, interest rates, and input cost inflation (deflation) are based on the January 2017 FAPRI Baseline which incorporates the provisions of the 2014 Farm Bill.
Marketing loan provisions for covered commodities were authorized in the 2008 Farm Bill and continued
in the 2014 Farm Bill and are assumed to be in place for the farm level analysis.
Program selection was crop by crop and based on highest simulated ending cash for each program. Farms are assumed to enroll in either PLC or ARC in 2014 and beyond.
Dairies are assumed to enroll in the Margin Protection Plan at the Base $4.00 margin level.
Actual average loan deficiency payment (LDP) rates in the counties where the representative farms are
located are used when applicable.
All crop farms are assumed to carry Multi-Peril Crop Insurance (MPCI), Crop Revenue Coverage (CRC), or Catastrophic coverage (CAT) at levels common to the area.

2014 2015 2016 2017 2018 2019 2020 2021
Crop Prices
Corn ($/bu.) 3.70 3.61 3.38 3.59 3.73 3.74 3.70 3.69
Wheat ($/bu.) 5.99 4.89 3.79 4.43 4.85 5.11 5.17 5.18
Cotton ($/lb.) 0.6130 0.6120 0.6666 0.6312 0.6483 0.6414 0.6383 0.6390
Sorghum ($/bu.) 4.03 3.31 2.82 3.23 3.39 3.42 3.40 3.39
Soybeans ($/bu.) 10.10 8.95 9.46 9.55 9.77 9.82 9.72 9.53
Barley ($/bu.) 5.30 5.52 4.87 4.64 4.73 4.87 4.91 4.89
Oats ($/bu.) 3.21 2.12 2.00 2.18 2.27 2.31 2.32 2.32
Rice ($/cwt.) 13.40 12.10 10.23 11.43 11.61 11.47 11.68 11.92
Soybean Meal ($/ton) 351 310 302 299 302 298 290 286
All Hay ($/ton) 172 145 132 146 150 151 151 150
Peanuts ($/ton) 440 386 375 368 363 362 363 363
Loan Rates
Corn ($/bu.) 1.95 1.95 1.95 1.95 1.95 1.95 1.95 1.95
Wheat ($/bu.) 2.94 2.94 2.94 2.94 2.94 2.94 2.94 2.94
Cotton ($/lb.) 0.5200 0.5200 0.4850 0.4732 0.4837 0.5164 0.5200 0.5200
Sorghum ($/bu.) 1.95 1.95 1.95 1.95 1.95 1.95 1.95 1.95
Soybeans ($/bu.) 5.00 5.00 5.00 5.00 5.00 5.00 5.00 5.00
Barley ($/bu.) 1.95 1.95 1.95 1.95 1.95 1.95 1.95 1.95
Oats ($/bu.) 1.39 1.39 1.39 1.39 1.39 1.39 1.39 1.39
Rice ($/cwt.) 6.50 6.50 6.50 6.50 6.50 6.50 6.50 6.50
Peanuts ($/ton) 355.00 355.00 355.00 355.00 355.00 355.00 355.00 355.00
Reference Prices
Corn ($/bu.) 3.70 3.70 3.70 3.70 3.70 3.70 3.70 3.70
Wheat ($/bu.) 5.50 5.50 5.50 5.50 5.50 5.50 5.50 5.50
Cotton ($/lb.) 0 0 0 0 0 0 0 0
Sorghum ($/bu.) 3.95 3.95 3.95 3.95 3.95 3.95 3.95 3.95
Soybeans ($/bu.) 8.40 8.40 8.40 8.40 8.40 8.40 8.40 8.40
Barley ($/bu.) 4.95 4.95 4.95 4.95 4.95 4.95 4.95 4.95
Oats ($/bu.) 2.40 2.40 2.40 2.40 2.40 2.40 2.40 2.40
Rice ($/cwt.) 14 14 14 14 14 14 14 14
Peanuts ($/ton) 535 535 535 535 535 535 535 535
Source: Food and Agricultural Policy Research Institute (FAPRI) at the University of Missouri-Columbia
Table 1. FAPRI January 2017 Baseline Projections of Crop Prices, Loan Rates, and Reference Prices, 2014-2021

2014 2015 2016 2017 2018 2019 2020 2021
Cattle Prices
Feeder Cattle ($/cwt) 225.07 226.52 153.72 134.29 128.07 127.83 131.54 138.88
Fed Cattle ($/cwt) 154.56 148.12 120.86 110.61 106.03 105.59 105.98 109.10
Culled Cows ($/cwt) 104.09 99.76 71.45 63.80 62.49 62.33 62.98 65.65
Milk Prices -- National and State
All Milk Price ($/cwt) 24.07 17.21 16.20 17.68 18.17 18.46 18.52 18.55
California ($/cwt) 22.12 15.40 14.92 15.99 16.50 16.81 16.88 16.91
Florida ($/cwt) 28.20 21.30 19.37 20.96 21.36 21.62 21.66 21.69
Idaho ($/cwt) 23.10 16.70 15.99 17.39 17.86 18.15 18.21 18.24
Missouri ($/cwt) 24.60 18.50 16.96 18.66 19.11 19.38 19.43 19.46
Nevada ($/cwt) 24.80 17.70 16.51 18.12 18.60 18.89 18.95 18.98
New York ($/cwt) 25.40 18.20 16.86 18.40 18.98 19.32 19.41 19.44
Texas ($/cwt) 24.60 17.70 16.61 18.26 18.72 19.00 19.05 19.09
Vermont ($/cwt) 25.50 18.60 17.21 18.74 19.33 19.68 19.76 19.79
Washington ($/cwt) 24.70 17.20 16.34 17.79 18.44 18.81 18.91 18.94
Wisconsin ($/cwt) 24.50 17.80 16.65 18.30 18.67 18.91 18.94 18.97
Source: Food and Agricultural Policy Research Institute (FAPRI) at the University of Missouri-Columbia
Table 2. FAPRI January 2017 Baseline Projections of Livestock and Milk Prices, 2014-2021

Table 3. FAPRI January 2017 Baseline Assumed Rates of Change in Input Prices, Annual Interest Rates, and Annual Changes inLand Values, 2015-2021
2015 2016 2017 2018 2019 2020 2021
Annual Rate of Change for Input Prices Paid
Seed Prices (%) 0.70 -2.48 -0.74 -0.28 0.61 1.24 1.32
All Fertilizer Prices (%) -10.86 -21.49 0.77 3.68 -1.55 -0.06 1.04
Herbicide Prices (%) -2.10 2.17 0.52 0.67 3.56 4.42 3.32
Insecticide Prices (%) -4.37 0.92 0.40 0.72 2.91 3.43 2.43
Fuel and Lube Prices (%) -35.14 -11.51 12.36 3.46 8.10 9.01 8.29
Machinery Prices (%) 2.32 0.02 2.19 3.10 3.53 3.28 2.88
Wages (%) 3.61 3.53 2.50 3.16 3.48 3.53 3.54
Supplies (%) 0.19 0.19 1.42 1.38 1.66 1.73 1.79
Repairs (%) 0.09 0.18 2.07 2.34 2.67 2.64 2.66
Services (%) 4.22 2.57 2.35 2.96 3.25 3.24 3.15
Taxes (%) 6.28 3.88 3.30 1.96 0.93 1.26 1.73
PPI Items (%) -3.24 -5.56 0.15 1.23 1.67 1.92 2.15
PPI Total (%) -2.12 -4.31 0.58 1.57 1.94 2.09 2.25
Annual Change in Consumer Price Index (%) 0.12 1.28 2.46 2.09 2.45 2.67 2.68
Annual Rate of Change for U.S. Land Prices (%) 2.37 -0.33 -3.16 -2.55 -1.58 -1.82 -1.21
Source: Food and Agricultural Policy Research Institute (FAPRI) at the University of Missouri-Columbia

FAPRI JANUARY 2017 BASELINE
Projected crop prices for FAPRI’s January 2017 Baseline are summarized in Table 1. Many crops are projected to bottom in 2016. From 2017-2021, most prices are projected to mildly increase. Individual crop prices are projected to move as follows:
Corn prices are projected to decline to $3.38/bu in 2016 before increasing slightly in the latter
projected years and ending at 3.69/bu in 2021. Wheat prices are projected to bottom in 2016 at $3.79/bu. Prices are expected to then rise to
$5.18/bu by 2021. Cotton prices are expected to rise to $0.6666/lb in 2016 before falling to $0.6312/lb in 2017 and
ending at $0.6390/lb in 2021. Rice prices fall from a high of $13.40/cwt in 2014 to a low of $10.23/cwt in 2016 before slowly
increasing and ending 2021 at $11.92/cwt. Sorghum prices decline from a high of $4.03/bu. in 2014, ending the projection period at
$3.39/bu. Prices for Soybeans are expected to fall from $10.10/bu. in 2014 to a low of $8.95/bu in 2015 and
finish 2021 at $9.53/bu. Assumed loan rates and reference prices are reported in Table 1 and reflect the rates authorized in the
2014 Farm Bills. Cotton Transition Assistance Program Payments are only assumed for 2014.
Projected livestock prices and state and national milk prices for FAPRI’s January 2017 Baseline are summarized in Table 2. Feeder cattle prices are projected to peak in 2015 and fall until 2019, while milk prices are projected to have hit their high in 2014, before bottoming in 2016 and then rise over the remainder of the analysis period. Cattle and milk prices are projected to move as follows:
Feeder cattle prices are projected to reach a high of $226.52/cwt in 2015 and then fall to a
low of $127.83/cwt in 2019 before finishing 2021 at $138.88/cwt. Fed cattle prices are expected to decrease from the high in 2014 of $154.56/cwt, ending
2021 at $109.10/cwt. Culled cow prices range between $62.33/cwt and $104.09/cwt. Milk prices are expected to range from $16.20/cwt to $24.07/cwt for the 2014-2021 study
period.
Projected annual rates of change for variable cash expenses are summarized in Table 3. The rates of change in input prices come from FAPRI’s January 2017 Baseline. Fertilizer prices are projected to decline in 2015-2016 before increasing in 2017 and 2018. Fuel prices are projected to decline sharply in 2015 and another 12 percent in 2016 before reversing course and increasing at approximately 3-13 percent annually through 2021. Projected annual rates of change in land values over the 2015 – 2021 period were provided by the January 2017 FAPRI Baseline and exhibit an overall decline after an increase in 2015.

Definitions of Variables in the Summary Tables Overall Financial Position, 2017-2021 -- As a means of summarizing the representative farms’ economic
efficiency, liquidity, and solvency position, AFPC classifies each farm as being in either a good, marginal or poor position. AFPC assumes a farm is in a good financial position when it has less than a 25 percent chance of a negative ending cash balance and a less than 25 percent chance of losing real net worth. If the probabilities of these events are between 25 and 50 percent the farm is classified as marginal. A probability greater than 50 percent places the farm in a poor financial position.
Change in Real Net Worth, 2017-2021 -- Annualized percentage change in the operator’s net worth from
January 1, 2017 through December 31, 2021, after adjusting for inflation. This value reflects the real annualized increase or decrease in net worth or equity for the farm over the planning horizon including changes in real estate values.
Net Income Adjustment (NIA) to Maintain Real Net Worth, 2017-2021 -- NIA is the annual change in net
cash farm income necessary to insure the farm maintains its real net worth during 2017-2021. A positive NIA indicates the additional annual net income needed to maintain real net worth. A negative NIA indicates the annual loss in net income the farm can endure and still maintain real net worth.
Net Income Adjustment (NIA) for Zero Ending Cash Balance in 2021 -- NIA is the loss in annual net cash
farm income a farm can withstand and have a zero-ending cash balance in 2021. A positive NIA indicates the annual increase in receipts necessary for a zero ending cash balance, while a negative NIA indicates the annual decrease in receipts that results in a zero ending cash balance.
Government Payments/Receipts, 2017-2021 -- Sum of all farm program payments (PLC or ARC and
marketing loan gains/loan deficiency payments) divided by total receipts received from the market plus PLC or ARC, marketing loan gains/loan deficiency payments, Dairy Margin Protection Plan (DMPP) payments, crop insurance indemnities, and other farm related receipts.
Total Cash Receipts -- Sum of annual cash receipts from all sources, including market sales, PLC or ARC
payments, marketing loan gains/loan deficiency payments, DMPP payments, crop insurance indemnities, and other farm related receipts.
Government Payments -- Sum of annual PLC or ARC payments and marketing loan gains/loan deficiency
payments for crops. Also included are lump sum disaster payments for livestock. Net Cash Farm Income -- Equals total cash receipts minus all cash expenses. Net cash farm income is used to
pay family living expenses, principal payments, income taxes, self employment taxes, and machinery replacement costs. The values in the tables are the averages for each year in the planning horizon.
Probability of Negative Ending Cash Balance -- The number of times out of 100 that the farm’s ending cash
reserves before borrowing are less than zero. This probability is reported for each year to indicate how the cash flow risk for the farm changes over the planning horizon.
Ending Cash Reserves -- Equals total cash on hand at the end of the year. Ending cash equals beginning cash
reserves plus net cash farm income and interest earned on cash reserves less principal payments, federal taxes (income and self employment), state income taxes, family living withdrawals, and actual machinery replacement costs (not depreciation).
Nominal Net Worth -- Equity at the end of each year equals total assets including land minus total debt from all
sources. Nominal net worth is not adjusted for inflation and averages are reported for each year in the planning horizon.
Probability of Decreasing Real Net Worth Over 2014-2021 -- The number of times out of 100 that real net worth at the end of 2021 is less than real net worth at the start of 2014.

Figure 2. Representative Farms Producing Feed Grains and
Oilseeds
IA
MONMOC
TN
SC
TXH
INNE
TXWTXU
TXPG
ND
TXNP
LA
NCSP

Table 4. Implications of the January 2017 FAPRI Baseline on the Economic Viability of Representative Farms Primarily Producing Feed Grains and Oilseeds.
IAG1350 IAG3400 NEG2400 NEG4300 NDG3000 NDG8000 ING1000 ING2200
Overall Financial Position2017-2021 Average Poor Poor Poor Poor Poor Marginal Poor Poor
Change Real Net Worth (%)2017-2021 Average -8.07 -0.44 -1.59 -1.98 -1.54 0.53 0.08 -0.57
NIA to Maintain RealNet Worth (%/Rec.) 24.83 5.70 4.95 11.88 5.93 0.00 1.50 6.75
NIA for Zero EndingCash Balance (%/Rec.) 31.01 -2.33 5.44 13.68 5.97 -1.99 2.38 14.86
Govt Payments/Receipts (%)2017-2021 Average 1.64 1.66 1.17 1.10 2.92 1.92 4.57 4.32
Cost to Receipts Ratio (%)2017-2021 Average 111.59 84.19 91.92 93.72 88.09 76.71 67.19 82.40
Total Cash Receipts ($1000)2014 963.79 1,942.62 1,988.99 3,627.59 1,304.11 3,527.13 616.84 1,481.372015 1,036.70 2,188.78 2,125.51 3,343.69 1,120.39 3,221.49 546.98 1,309.832016 859.76 1,924.19 1,935.66 3,399.08 1,121.87 3,327.53 552.78 1,338.052017 839.15 1,866.64 1,923.24 3,400.67 1,136.06 3,373.66 585.26 1,410.312018 880.58 1,956.17 2,010.67 3,552.36 1,187.01 3,555.58 609.25 1,463.112019 887.76 1,973.00 2,015.26 3,554.12 1,202.02 3,612.82 609.98 1,465.662020 885.11 1,965.99 1,999.43 3,529.54 1,195.36 3,598.30 609.24 1,465.322021 885.56 1,963.88 1,990.31 3,518.53 1,195.40 3,607.94 607.58 1,462.36
2017-2021 Average 875.63 1,945.14 1,987.78 3,511.04 1,183.17 3,549.66 604.26 1,453.35
Government Payments ($1000)2014 0.00 0.00 0.00 0.00 0.00 0.00 0.00 0.002015 71.60 156.70 157.39 253.75 59.91 138.99 6.22 14.342016 77.34 176.62 124.67 211.92 97.34 247.71 22.15 50.772017 11.34 25.75 17.34 29.64 44.60 81.01 29.28 66.962018 12.25 28.13 21.23 37.13 34.31 69.88 28.02 63.752019 12.21 27.74 18.63 30.66 29.30 58.73 23.48 53.932020 14.59 32.56 22.90 36.15 25.94 49.69 25.30 57.522021 15.86 35.07 25.48 43.89 27.15 55.69 26.12 60.15
2017-2021 Average 13.25 29.85 21.12 35.49 32.26 63.00 26.44 60.46
Net Cash Farm Income ($1000)2014 4.85 287.45 115.03 330.87 252.54 766.19 184.34 286.072015 123.70 601.35 396.79 293.90 133.83 602.93 142.29 170.202016 -10.48 408.77 304.04 468.00 177.78 820.17 170.18 237.262017 -49.52 341.97 253.97 375.50 172.26 840.32 197.27 289.362018 -24.90 420.27 308.37 475.20 209.46 995.34 222.06 329.122019 -43.15 407.57 265.55 398.63 206.78 1,016.79 221.94 303.632020 -80.39 365.08 189.43 267.86 174.54 920.94 211.55 276.912021 -116.34 325.14 127.80 135.00 134.22 860.81 201.11 241.88
2017-2021 Average -62.86 372.01 229.02 330.44 179.45 926.84 210.79 288.18
Ending Cash Reserves ($1000)2014 -137.86 -41.74 -120.64 -233.47 11.05 78.51 0.26 -130.482015 -198.46 184.21 -44.19 -588.52 -125.76 -125.53 -47.17 -374.962016 -403.44 199.66 -64.59 -835.54 -183.24 -208.11 -57.38 -564.732017 -598.94 263.25 -63.89 -1,097.54 -211.47 -63.23 -43.81 -672.402018 -771.98 373.58 -76.34 -1,308.46 -217.41 117.27 -38.19 -761.912019 -969.07 413.08 -185.72 -1,611.30 -227.92 337.60 -31.91 -836.352020 -1,188.76 366.82 -369.41 -2,036.67 -285.78 377.55 -31.31 -933.102021 -1,445.90 236.67 -583.72 -2,636.52 -378.62 376.54 -56.25 -1,082.29
Nominal Net Worth ($1000)2014 2,763.86 9,962.88 4,669.56 16,035.17 3,229.83 19,353.45 2,882.53 7,967.812015 2,745.47 10,285.98 4,790.01 15,865.42 3,163.95 19,379.09 2,904.65 7,905.862016 2,564.29 10,382.46 4,845.18 15,751.61 3,150.02 19,620.38 2,942.56 7,859.302017 2,306.25 10,187.79 4,747.81 15,135.47 3,046.61 19,376.03 2,930.60 7,676.642018 2,094.85 10,137.72 4,711.10 14,787.10 2,998.69 19,370.90 2,935.01 7,591.112019 1,897.42 10,131.73 4,647.85 14,546.43 2,974.09 19,702.17 2,973.18 7,623.002020 1,668.30 10,050.09 4,573.29 14,142.35 2,909.35 19,804.17 2,966.26 7,548.032021 1,392.11 9,994.27 4,399.57 13,688.91 2,829.99 19,947.93 2,948.93 7,476.81
Prob. of Negative Ending Cash (%)2016 99 2 88 99 99 93 99 992017 99 25 63 95 85 58 69 992018 99 28 57 90 75 47 69 962019 99 34 61 87 71 44 60 942020 98 37 65 88 69 43 58 932021 99 42 70 89 72 43 62 95
Prob. of Decreasing Real Net WorthOver 2014-2021 (%) 1 1 1 1 1 1 1 1

Table 5. Implications of the January 2017 FAPRI Baseline on the Economic Viability of Representative Farms Primarily Producing Feed Grains and Oilseeds.
MOCG2300 MOCG4200 MONG2300 LANG2500 TNG2500 TNG4500 NCSP2000 SCG3500
Overall Financial Position2017-2021 Average Good Good Good Poor Marginal Good Poor Good
Change Real Net Worth (%)2017-2021 Average 1.64 2.96 0.86 -10.38 1.19 4.34 -5.98 6.33
NIA to Maintain RealNet Worth (%/Rec.) -15.00 -28.83 -2.41 12.92 -1.61 -12.15 16.60 -11.90
NIA for Zero EndingCash Balance (%/Rec.) -16.33 -38.10 -4.71 22.32 0.82 -13.68 19.68 -11.78
Govt Payments/Receipts (%)2017-2021 Average 3.62 1.91 3.80 7.98 1.85 3.95 7.99 6.09
Cost to Receipts Ratio (%)2017-2021 Average 53.45 49.52 75.35 100.79 83.95 76.00 99.84 78.82
Total Cash Receipts ($1000)2014 1,300.25 2,262.70 1,779.47 1,671.77 1,272.08 2,894.92 1,379.47 2,825.272015 994.79 1,759.80 1,641.34 1,604.56 1,247.44 3,187.05 1,346.27 2,364.012016 1,331.03 2,445.69 1,497.59 1,490.00 1,242.04 3,035.34 1,579.37 2,697.452017 1,401.86 2,499.21 1,536.58 1,707.87 1,222.65 2,983.43 1,433.79 2,821.402018 1,454.73 2,587.69 1,570.24 1,726.24 1,295.45 3,124.91 1,472.17 2,957.302019 1,464.31 2,610.93 1,570.42 1,731.03 1,323.95 3,160.91 1,489.80 2,965.622020 1,460.24 2,600.66 1,571.14 1,741.77 1,332.49 3,183.49 1,493.49 2,977.452021 1,456.37 2,601.53 1,581.03 1,746.50 1,335.05 3,200.87 1,494.88 2,999.39
2017-2021 Average 1,447.50 2,580.00 1,565.88 1,730.68 1,301.92 3,130.72 1,476.82 2,944.23
Government Payments ($1000)2014 0.00 0.00 0.00 16.11 0.00 52.97 0.00 52.642015 41.05 152.85 46.69 86.62 58.53 170.40 83.42 81.952016 48.46 131.09 54.16 96.02 5.24 68.39 110.55 161.552017 56.29 62.99 70.85 162.54 21.59 96.81 111.32 115.692018 48.86 39.85 60.68 130.20 23.06 117.10 108.26 177.502019 45.54 41.48 49.89 128.82 20.00 119.29 116.67 185.712020 47.52 41.27 51.49 132.42 24.14 125.60 119.88 192.832021 48.94 46.39 53.38 128.32 25.26 123.99 121.72 192.36
2017-2021 Average 49.43 46.40 57.26 136.46 22.81 116.56 115.57 172.82
Net Cash Farm Income ($1000)2014 470.16 900.63 527.36 -23.95 150.55 367.45 -66.69 375.922015 222.85 498.04 463.59 9.98 181.60 785.77 -26.08 202.652016 584.77 1,245.37 370.37 -35.74 240.97 757.01 239.36 576.892017 665.76 1,290.55 405.14 109.80 211.55 708.28 87.70 635.322018 726.15 1,371.00 431.38 91.91 271.77 833.89 80.99 753.012019 713.66 1,387.41 426.23 40.34 286.28 852.41 47.43 718.392020 703.54 1,355.66 409.44 -27.94 252.85 805.54 -6.51 649.532021 686.75 1,333.95 397.04 -123.35 225.59 770.35 -66.34 591.57
2017-2021 Average 699.17 1,347.71 413.85 18.15 249.61 794.10 28.65 669.56
Ending Cash Reserves ($1000)2014 34.35 440.92 177.07 -264.30 -86.88 -56.56 -286.41 134.262015 -160.50 413.00 293.82 -513.06 -153.23 285.93 -579.79 -140.772016 -9.97 1,023.73 212.41 -861.77 -180.11 539.02 -598.72 16.542017 197.15 1,628.45 267.16 -1,007.39 -170.11 824.45 -644.15 322.442018 389.66 2,212.26 307.24 -1,191.66 -137.10 1,144.87 -785.00 730.162019 612.63 2,710.87 337.78 -1,436.75 -53.81 1,557.94 -1,002.10 1,102.122020 765.32 3,222.19 316.10 -1,761.39 -47.11 1,819.74 -1,284.62 1,453.412021 900.41 3,690.59 340.49 -2,232.76 -55.96 2,095.93 -1,636.85 1,784.90
Nominal Net Worth ($1000)2014 10,363.47 14,027.42 8,695.80 2,737.21 2,696.07 6,399.46 4,150.43 4,502.262015 10,361.75 14,211.42 9,093.36 2,577.25 2,755.03 7,095.95 3,990.40 4,507.692016 10,662.15 15,010.59 8,953.24 2,306.52 2,802.23 7,547.74 4,016.30 4,802.592017 10,718.20 15,431.75 8,865.26 2,103.08 2,771.38 7,810.16 3,809.65 5,079.882018 10,853.05 15,971.95 8,876.08 1,917.46 2,798.64 8,178.73 3,541.22 5,501.732019 11,183.69 16,569.35 9,013.33 1,712.79 2,917.29 8,758.34 3,288.33 5,946.202020 11,366.60 17,156.17 9,076.78 1,435.54 2,927.21 9,115.18 3,011.57 6,374.332021 11,621.25 17,757.48 9,267.30 1,042.06 2,956.13 9,531.61 2,686.30 6,701.67
Prob. of Negative Ending Cash (%)2016 53 1 4 99 99 1 99 512017 15 1 10 99 76 2 99 282018 7 1 16 99 66 3 99 152019 4 1 22 99 55 2 99 102020 3 1 26 99 55 3 98 72021 2 1 24 99 54 3 99 6
Prob. of Decreasing Real Net WorthOver 2014-2021 (%) 1 1 1 1 1 1 1 1

Table 6. Implications of the January 2017 FAPRI Baseline on the Economic Viability of Representative Farms Primarily Producing Feed Grains and Oilseeds.
TXNP3450 TXNP10640 TXPG2500 TXHG2700 TXWG1600 TXUG1600
Overall Financial Position2017-2021 Average Good Good Marginal Poor Poor Marginal
Change Real Net Worth (%)2017-2021 Average 3.50 4.77 2.50 -6.26 -13.52 5.48
NIA to Maintain RealNet Worth (%/Rec.) -21.72 -15.00 -6.44 6.68 23.39 -3.51
NIA for Zero EndingCash Balance (%/Rec.) -36.12 -22.45 -2.67 20.05 38.18 -2.75
Govt Payments/Receipts (%)2017-2021 Average 5.54 6.21 7.30 10.30 10.18 7.66
Cost to Receipts Ratio (%)2017-2021 Average 64.83 75.96 75.59 91.74 107.38 86.81
Total Cash Receipts ($1000)2014 1,973.27 6,885.15 1,623.93 753.38 706.37 1,343.952015 1,947.05 7,220.84 1,580.87 635.10 538.66 1,411.462016 2,092.36 6,655.13 1,511.69 619.34 498.08 1,314.212017 2,233.19 6,788.10 1,692.49 849.78 539.23 1,334.102018 2,289.14 6,926.40 1,734.63 854.47 540.48 1,351.542019 2,286.33 6,858.95 1,729.63 852.54 535.54 1,351.152020 2,275.29 6,828.27 1,727.49 851.43 536.90 1,350.572021 2,279.42 6,870.33 1,730.68 855.35 537.94 1,358.34
2017-2021 Average 2,272.67 6,854.41 1,722.98 852.71 538.02 1,349.14
Government Payments ($1000)2014 5.97 123.19 8.94 5.52 11.87 61.992015 131.79 443.79 9.96 11.46 11.33 120.782016 166.85 507.01 53.82 71.40 43.22 83.082017 173.18 479.63 153.26 116.25 67.50 111.012018 126.07 405.95 128.71 84.72 53.71 95.042019 105.05 376.50 112.45 74.71 48.70 98.752020 99.89 388.27 112.69 76.33 49.74 96.442021 99.54 382.36 112.49 76.76 49.57 91.62
2017-2021 Average 120.75 406.54 123.92 85.75 53.85 98.57
Net Cash Farm Income ($1000)2014 303.64 1,398.36 210.20 -16.62 154.24 142.262015 614.84 2,085.85 353.50 -94.66 9.61 275.132016 776.55 1,843.22 362.37 -69.66 -5.70 232.992017 872.92 1,913.02 489.26 126.34 8.71 234.422018 911.18 2,008.58 509.01 116.81 -1.00 220.452019 867.20 1,835.56 466.68 94.33 -22.80 200.582020 800.96 1,647.20 411.38 59.64 -55.33 162.922021 752.49 1,528.04 354.35 37.20 -78.11 138.58
2017-2021 Average 840.95 1,786.48 446.14 86.87 -29.71 191.39
Ending Cash Reserves ($1000)2014 104.50 589.93 -141.71 -164.43 -6.61 -23.322015 508.88 1,809.89 -126.56 -423.20 -139.92 80.112016 940.32 2,724.74 -133.16 -673.62 -288.22 128.622017 1,554.07 3,928.50 6.67 -670.34 -413.79 212.322018 2,100.66 5,092.93 126.00 -697.85 -556.83 236.602019 2,629.48 6,031.21 278.43 -736.54 -720.85 280.872020 3,047.10 6,694.85 342.22 -843.62 -955.71 225.772021 3,409.08 7,274.04 240.31 -973.48 -1,164.63 182.51
Nominal Net Worth ($1000)2014 7,697.32 12,677.51 3,834.28 1,380.32 1,166.99 351.892015 7,762.73 13,718.55 4,038.38 1,188.09 1,116.49 459.542016 8,231.63 15,037.40 4,162.38 961.39 991.93 525.232017 8,623.53 16,101.63 4,268.08 928.77 847.56 598.072018 9,016.07 17,291.59 4,422.76 886.09 725.59 672.442019 9,464.83 18,343.33 4,688.50 859.65 603.59 738.792020 9,820.91 19,161.64 4,780.16 750.04 442.60 773.662021 10,154.78 19,973.64 4,811.58 650.58 280.89 769.20
Prob. of Negative Ending Cash (%)2016 1 1 99 99 99 52017 1 1 49 99 99 52018 1 1 38 99 99 122019 1 1 28 99 99 152020 1 1 27 99 99 252021 1 1 34 99 99 33
Prob. of Decreasing Real Net WorthOver 2014-2021 (%) 1 1 1 1 1 1

Figure 3. Feed Grain and Oilseed Farms
31.01%
-2.33%
2.39%
14.86%
-16.33%
-38.10%
-4.71%
5.97%
-1.99%
5.44%13.68%
-50%
-40%
-30%
-20%
-10%
0%
10%
20%
30%
40%
IAG1350 IAG3400 ING1000 ING2200 MOCG2300 MOCG4200 MONG2300 NDG3000 NDG8000 NEG2400 NEG4300
Minimum Annual Percentage Change in Receipts, 2017-2021, Needed to Have a Zero Ending Cash Balance in 2021
-36.12%
-22.45%
-2.67%
20.06%
38.18%
-2.75%
22.32% 19.68%
-11.78%
.82%
-13.68%
-40%
-30%
-20%
-10%
0%
10%
20%
30%
40%
50%
TXNP3450 TXNP8000 TXPG2500 TXHG2700 TXWG1600 TXUG1600 LANG2500 NCSP2000 SCG3500 TNG2500 TNG4500
Minimum Annual Percentage Change in Receipts, 2017-2021, Needed to Have a Zero Ending Cash Balance in 2021

Figure 4. Feed Grain and Oilseed Farms
7 7
9
4 4
2
11 11 11
0
2
4
6
8
10
12
Overall Cash Flow Position Maintain Wealth
Num
ber o
f Far
ms
Economic and Financial Position Over the Period, 2017-2021, for all Feed Grain and Oilseed Farms
Good Marginal Poor

Average NCFI 25 & 75 Percentile NCFI 5 & 95 Percentile NCFI Prob. of Cash Flow Deficit
Figure 5. Net Cash Farm Income and Probabilities of a Cash Flow Deficit:Feed Grain and Oilseed Farms
99 99 99 99 98 99
-800
-600
-400
-200
0
200
400
2014 2015 2016 2017 2018 2019 2020 2021
($1,
000'
s)
IAG1350 Iowa Grain Farm
225 28 34 37 42
-600
-400
-200
0
200
400
600
800
1000
1200
2014 2015 2016 2017 2018 2019 2020 2021
($1,
000'
s)
IAG3400 Large Iowa Grain Farm
9969 69 60 58 62
-100
0
100
200
300
400
500
2014 2015 2016 2017 2018 2019 2020 2021
($1,
000'
s)
ING1000 Indiana Grain Farm
99 99 96 94 93 95
-600
-400
-200
0
200
400
600
800
2014 2015 2016 2017 2018 2019 2020 2021
($1,
000'
s)
ING2200 Large Indiana Grain Farm

Average NCFI 25 & 75 Percentile NCFI 5 & 95 Percentile NCFI Prob. of Cash Flow Deficit
Figure 6. Net Cash Farm Income and Probabilities of a Cash Flow Deficit:Feed Grain and Oilseed Farms
5315 7 4 3 2
0
200
400
600
800
1000
1200
1400
2014 2015 2016 2017 2018 2019 2020 2021
($1,
000'
s)
MOCG2300 Central Missouri Grain Farm
1 1 1 1 1 10
500
1000
1500
2000
2500
2014 2015 2016 2017 2018 2019 2020 2021
($1,
000'
s)
MOCG4200 Large Central Missouri Grain Farm
4 10 16 22 26 24
-200
0
200
400
600
800
1000
2014 2015 2016 2017 2018 2019 2020 2021
($1,
000'
s)
MONG2300 Northwest Missouri Grain Farm

Average NCFI 25 & 75 Percentile NCFI 5 & 95 Percentile NCFI Prob. of Cash Flow Deficit
Figure 7. Net Cash Farm Income and Probabilities of a Cash Flow Deficit:Feed Grain and Oilseed Farms
99 85 75 71 69 72
-600
-400
-200
0
200
400
600
800
2014 2015 2016 2017 2018 2019 2020 2021
($1,
000'
s)
NDG3000 North Dakota Grain Farm
9358 47 44 43 43
-1000
-500
0
500
1000
1500
2000
2500
3000
2014 2015 2016 2017 2018 2019 2020 2021
($1,
000'
s)
NDG8000 Large North Dakota Grain Farm
8863 57 61 65 70
-1000
-500
0
500
1000
1500
2014 2015 2016 2017 2018 2019 2020 2021
($1,
000'
s)
NEG2400 Nebraska Grain Farm
99 95 90 87 88 89
-2000
-1500
-1000
-500
0
500
1000
1500
2000
2014 2015 2016 2017 2018 2019 2020 2021
($1,
000'
s)
NEG4300 Large Nebraska Grain Farm

Average NCFI 25 & 75 Percentile NCFI 5 & 95 Percentile NCFI Prob. of Cash Flow Deficit
Figure 8. Net Cash Farm Income and Probabilities of a Cash Flow Deficit:Feed Grain and Oilseed Farms
1 1 1 1 1 10
200
400
600
800
1000
1200
1400
1600
1800
2014 2015 2016 2017 2018 2019 2020 2021
($1,
000'
s)
TXNP3450 Texas North Plains Grain Farm
1 1 1 1 1 1-500
0500
10001500200025003000350040004500
2014 2015 2016 2017 2018 2019 2020 2021
($1,
000'
s)
TXNP10640 Large Texas North Plains Grain Farm
99
49 38 28 27 34
-400
-200
0
200
400
600
800
1000
2014 2015 2016 2017 2018 2019 2020 2021
($1,
000'
s)
TXPG2500 Texas Panhandle Grain Farm

Average NCFI 25 & 75 Percentile NCFI 5 & 95 Percentile NCFI Prob. of Cash Flow Deficit
Figure 9. Net Cash Farm Income and Probabilities of a Cash Flow Deficit:Feed Grain and Oilseed Farms
99 99 99 99 99 99
-400
-300
-200
-100
0
100
200
300
400
2014 2015 2016 2017 2018 2019 2020 2021
($1,
000'
s)
TXHG2500 Texas North Blacklands Grain Farm
99 99 99 99 99 99
-400
-300
-200
-100
0
100
200
2014 2015 2016 2017 2018 2019 2020 2021
($1,
000'
s)
TXWG1600 Texas South Blacklands Grain Farm
5 5 12 15 25 33
-200
-100
0
100
200
300
400
500
600
2014 2015 2016 2017 2018 2019 2020 2021
($1,
000'
s)
TXUG1600 Uvalde Texas Grain Farm
99 99 99 99 99 99
-1000
-800
-600
-400
-200
0
200
400
600
2014 2015 2016 2017 2018 2019 2020 2021
($1,
000'
s)
LANG2500 Louisiana Grain Farm

Average NCFI 25 & 75 Percentile NCFI 5 & 95 Percentile NCFI Prob. of Cash Flow Deficit
Figure 10. Net Cash Farm Income and Probabilities of a Cash Flow Deficit:Feed Grain and Oilseed Farms
99 99 99 99 98 99
-800
-600
-400
-200
0
200
400
600
2014 2015 2016 2017 2018 2019 2020 2021
($1,
000'
s)
NCSP1800 North Carolina Southern Peanut Farm
5128 15 10 7 6
-500
0
500
1000
1500
2000
2014 2015 2016 2017 2018 2019 2020 2021
($1,
000'
s)
SCG3500 Large South Carolina Grain Farm
9976 66 55 55 54
-600
-400
-200
0
200
400
600
800
1000
2014 2015 2016 2017 2018 2019 2020 2021
($1,
000'
s)
TNG2500 Tennessee Grain Farm
1 2 3 2 3 3-500
0
500
1000
1500
2000
2014 2015 2016 2017 2018 2019 2020 2021
($1,
000'
s)
TNG4500 Large Tennessee Grain Farm

WA
COKSN
KSC
MT
OR
Figure 11. Representative Farms Producing Wheat
WAA

Table 7. Implications of the January 2017 FAPRI Baseline on the Economic Viability of Representative Farms Primarily Producing Wheat.
WAW2000 WAW8000 WAAW4500 ORW4100 MTW7000 COW3000 COW5640 KSCW2000 KSCW5300 KSNW4000 KSNW5980
Overall Financial Position2017-2021 Average Good Poor Poor Poor Good Poor Poor Poor Good Poor Poor
Change Real Net Worth (%)2017-2021 Average 4.82 1.01 -10.23 -1.40 2.50 -1.66 -4.26 -2.78 2.17 -2.07 -4.24
NIA to Maintain RealNet Worth (%/Rec.) -16.94 -1.23 35.77 -2.85 -17.32 28.05 17.54 14.01 -8.35 10.48 23.71
NIA for Zero EndingCash Balance (%/Rec.) -24.80 3.62 53.01 -0.09 -24.68 17.66 31.69 26.06 -12.89 18.25 33.67
Govt Payments/Receipts (%)2017-2021 Average 4.13 3.66 6.72 11.52 12.80 9.09 9.53 4.34 5.21 9.82 7.78
Cost to Receipts Ratio (%)2017-2021 Average 61.78 84.42 112.92 77.48 55.06 73.46 91.61 86.69 69.33 84.17 100.74
Total Cash Receipts ($1000)2014 894.44 3,337.78 486.47 479.40 1,154.62 431.37 762.32 472.99 1,063.45 812.95 1,348.522015 632.53 2,532.58 419.53 378.21 994.84 343.43 684.11 482.40 1,125.65 754.54 1,307.132016 695.63 2,916.38 355.65 324.47 871.49 297.20 585.53 408.74 937.97 667.64 1,195.272017 766.05 3,229.26 403.65 422.89 1,132.85 366.04 717.24 458.72 1,054.43 806.85 1,385.412018 808.52 3,461.64 424.97 428.00 1,180.33 376.53 730.83 481.78 1,105.16 827.27 1,408.132019 831.20 3,566.80 432.97 433.50 1,196.93 382.24 736.14 491.51 1,134.34 836.46 1,413.682020 835.24 3,585.10 432.55 432.45 1,191.57 382.94 735.64 493.65 1,140.82 839.46 1,412.372021 838.57 3,599.36 432.58 431.33 1,188.34 385.42 735.39 496.59 1,149.26 844.52 1,421.30
2017-2021 Average 815.92 3,488.43 425.35 429.63 1,178.00 378.63 731.05 484.45 1,116.81 830.91 1,408.18
Government Payments ($1000)2014 0.00 0.00 0.00 0.00 0.00 0.00 0.00 0.00 0.00 0.00 0.002015 0.00 0.00 0.00 0.00 0.00 2.67 0.00 26.14 65.57 7.08 29.152016 54.45 146.52 45.31 28.49 72.33 21.60 37.07 28.72 75.48 64.63 104.372017 52.56 149.20 45.22 79.68 207.89 53.53 106.21 32.30 87.09 121.04 176.452018 37.81 147.70 32.93 52.01 165.77 35.83 73.34 21.22 57.58 81.57 110.032019 26.93 116.96 21.77 39.01 131.64 27.72 57.01 15.36 43.58 64.95 84.592020 20.87 96.69 17.31 33.91 115.70 24.12 51.97 14.22 40.38 61.09 77.042021 19.59 91.53 16.43 31.84 109.39 23.18 50.03 14.84 42.72 60.12 75.35
2017-2021 Average 31.55 120.42 26.73 47.29 146.08 32.87 67.71 19.59 54.27 77.76 104.69
Net Cash Farm Income ($1000)2014 357.46 359.01 58.18 157.94 438.68 150.02 150.76 72.61 251.61 118.84 -41.582015 133.52 -253.81 11.58 75.16 322.59 81.25 94.51 102.10 365.03 97.41 -18.792016 224.26 230.73 -41.09 33.06 260.43 47.06 15.69 41.38 233.36 47.60 -46.492017 288.77 487.54 -11.16 118.31 518.36 107.72 121.45 78.29 336.76 169.02 107.212018 327.85 669.34 -5.84 118.89 570.03 114.57 118.25 88.59 380.57 173.55 95.642019 345.58 717.93 -18.52 117.80 574.43 116.27 84.80 87.59 393.21 167.79 40.852020 339.21 644.41 -56.80 107.90 551.75 109.41 50.39 78.02 377.03 139.47 -10.342021 328.08 584.23 -90.75 89.89 539.95 103.40 19.82 63.61 350.19 112.96 -62.65
2017-2021 Average 325.90 620.69 -36.61 110.56 550.91 110.27 78.94 79.22 367.55 152.56 34.14
Ending Cash Reserves ($1000)2014 145.38 -189.45 -83.72 -42.00 204.25 36.53 -88.58 -106.25 34.16 -128.70 -331.642015 88.21 -997.84 -231.73 -103.27 145.25 2.19 -242.64 -143.53 160.47 -254.35 -702.142016 134.97 -1,347.22 -386.75 -208.74 126.71 -71.08 -482.35 -279.16 141.05 -445.97 -1,113.692017 263.13 -1,202.20 -488.28 -185.33 384.50 -92.87 -599.24 -341.56 265.11 -456.66 -1,268.432018 409.80 -957.83 -587.46 -163.92 582.26 -103.43 -742.14 -418.02 432.91 -544.33 -1,493.952019 557.87 -749.07 -712.96 -149.43 824.14 -132.90 -903.49 -489.72 605.16 -574.12 -1,845.202020 687.60 -714.82 -975.20 -157.66 1,010.31 -189.25 -1,112.04 -579.75 697.32 -657.52 -2,219.422021 807.84 -694.65 -1,223.33 -205.79 1,120.88 -261.08 -1,372.42 -664.41 728.65 -833.36 -2,669.52
Nominal Net Worth ($1000)2014 1,898.33 8,852.75 1,684.15 1,534.44 5,035.24 3,345.47 3,185.26 1,967.33 3,970.83 3,567.89 7,582.842015 1,902.95 8,414.68 1,645.80 1,514.72 5,132.92 3,433.37 3,111.68 2,013.28 4,244.67 3,583.02 7,492.122016 1,986.46 8,337.45 1,508.95 1,427.85 5,149.22 3,390.54 2,948.25 1,926.91 4,302.55 3,464.90 7,208.002017 2,060.18 8,235.52 1,354.16 1,396.53 5,279.81 3,294.93 2,811.75 1,828.04 4,351.09 3,368.16 6,849.732018 2,161.36 8,303.58 1,217.36 1,375.54 5,393.32 3,227.58 2,691.13 1,748.71 4,471.92 3,274.10 6,512.232019 2,286.40 8,487.17 1,081.84 1,362.07 5,622.16 3,182.89 2,606.93 1,691.00 4,639.90 3,259.49 6,148.372020 2,404.04 8,542.06 882.32 1,330.62 5,805.91 3,100.36 2,422.97 1,619.31 4,768.98 3,163.97 5,835.222021 2,564.02 8,695.76 668.17 1,303.38 5,951.53 3,028.37 2,220.97 1,581.95 4,837.93 3,029.59 5,413.60
Prob. of Negative Ending Cash (%)2016 2 99 99 99 4 99 99 99 1 99 992017 1 99 99 97 1 92 99 99 4 99 992018 1 88 99 90 1 89 99 99 6 99 992019 1 76 99 83 1 88 99 98 6 96 992020 1 69 99 78 1 92 99 97 9 95 992021 1 66 99 80 1 95 99 98 12 97 99
Prob. of Decreasing Real Net WorthOver 2014-2021 (%) 1 1 1 1 1 1 1 1 1 1 1

Figure 12. Wheat Farms
3 3 3
0 0 0
8 8 8
0
1
2
3
4
5
6
7
8
9
Overall Cash Flow Position Maintain Wealth
Num
ber o
f Far
ms
Economic and Financial Position Over the Period, 2017-2021, for all Wheat Farms
Good Marginal Poor
-24.80%
3.62%
53.01%
-.09%
-24.68%
17.66%
31.69%26.06%
-12.89%
18.25%
33.67%
-50%
-30%
-10%
10%
30%
50%
70%
WAW2000 WAW8000 WAAW4500 ORW4100 MTW7000 COW3000 COW5640 KSCW2000 KSCW5300 KSNW4000 KSNW5980
Minimum Annual Percentage Change in Receipts, 2017-2021, Needed to Have a Zero Ending Cash Balance in 2021

Average NCFI 25 & 75 Percentile NCFI 5 & 95 Percentile NCFI Prob. of Cash Flow Deficit
Figure 13. Net Cash Farm Income and Probabilities of a Cash Flow Deficit:Wheat Farms
2 1 1 1 1 10
100
200
300
400
500
600
700
2014 2015 2016 2017 2018 2019 2020 2021
($1,
000'
s)
WAW2000 Washington Wheat Farm
99 99 88 76 69 66
-1000
-500
0
500
1000
1500
2000
2014 2015 2016 2017 2018 2019 2020 2021
($1,
000'
s)
WAW8000 Large Washington Wheat Farm
99 99 99 99 99 99
-500
-400
-300
-200
-100
0
100
200
2014 2015 2016 2017 2018 2019 2020 2021
($1,
000'
s)
WAAW4500 Southern Washington Wheat Farm

Average NCFI 25 & 75 Percentile NCFI 5 & 95 Percentile NCFI Prob. of Cash Flow Deficit
Figure 14. Net Cash Farm Income and Probabilities of a Cash Flow Deficit:Wheat Farms
99 97 90 83 78 80
-200
-150
-100
-50
0
50
100
150
200
250
300
2014 2015 2016 2017 2018 2019 2020 2021
($1,
000'
s)
ORW4100 Oregon Wheat Farm
4 1 1 1 1 10
200
400
600
800
1000
1200
2014 2015 2016 2017 2018 2019 2020 2021
($1,
000'
s)
MTW7000 Montana Wheat Farm
99 92 89 88 92 95
-150
-100
-50
0
50
100
150
200
250
300
2014 2015 2016 2017 2018 2019 2020 2021
($1,
000'
s)
COW3000 Colorado Wheat Farm
99 99 99 99 99 99
-400
-300
-200
-100
0
100
200
300
400
2014 2015 2016 2017 2018 2019 2020 2021
($1,
000'
s)
COW5640 Large Colorado Wheat Farm

Average NCFI 25 & 75 Percentile NCFI 5 & 95 Percentile NCFI Prob. of Cash Flow Deficit
Figure 15. Net Cash Farm Income and Probabilities of a Cash Flow Deficit:Wheat Farms
99 99 99 98 97 98
-300
-200
-100
0
100
200
300
2014 2015 2016 2017 2018 2019 2020 2021
($1,
000'
s)
KSCW2000 Central Kansas Wheat Farm
1 4 6 6 9 12-100
0
100
200
300
400
500
600
700
800
900
2014 2015 2016 2017 2018 2019 2020 2021
($1,
000'
s)
KSCW5300 Large Central Kansas Wheat Farm
99 99 99 96 95 97
-400
-300
-200
-100
0
100
200
300
400
500
2014 2015 2016 2017 2018 2019 2020 2021
($1,
000'
s)
KSNW4000 Northwest Kansas Wheat Farm
99 99 99 99 99 99
-800
-600
-400
-200
0
200
400
600
2014 2015 2016 2017 2018 2019 2020 2021
($1,
000'
s)
KSNW5980 Large Northwest Kansas Wheat Farm

TN
TXSPTXRP
TXCB
AL
NC
GA
TXM
TXE
TXV
Figure 16. Representative Farms Producing Cotton
SC
NCNP

Table 8. Implications of the January 2017 FAPRI Baseline on the Economic Viability of Representative Farms Primarily Producing Cotton.
TXSP2500 TXSP4500 TXEC5000 TXRP2500 TXMC1800 TXCB3000 TXCB9200 TXVC4500
Overall Financial Position2017-2021 Average Marginal Good Marginal Poor Poor Good Poor Good
Change Real Net Worth (%)2017-2021 Average 4.57 3.78 2.70 -7.59 -5.33 0.06 -1.51 1.52
NIA to Maintain RealNet Worth (%/Rec.) -7.89 -7.00 -4.60 20.61 5.71 -0.88 1.22 -4.68
NIA for Zero EndingCash Balance (%/Rec.) -5.18 -7.52 -2.31 28.97 10.76 -6.16 1.18 -9.38
Govt Payments/Receipts (%)2017-2021 Average 22.97 8.74 7.94 9.86 10.87 13.00 12.38 11.87
Cost to Receipts Ratio (%)2017-2021 Average 78.34 79.27 81.58 95.54 93.59 85.38 93.36 80.17
Total Cash Receipts ($1000)2014 768.89 1,998.56 1,949.54 367.28 1,199.72 1,219.88 3,859.26 1,880.272015 877.12 1,960.86 1,991.23 448.34 686.88 1,273.33 4,330.71 1,845.602016 919.67 1,996.16 2,264.71 410.63 875.17 1,083.42 3,732.62 1,848.272017 908.40 1,944.92 2,181.85 416.79 927.94 1,150.84 3,993.74 2,017.942018 911.10 1,984.81 2,221.74 415.96 940.01 1,145.24 3,982.53 2,015.702019 915.10 1,978.71 2,206.92 410.62 932.65 1,129.38 3,936.23 1,987.172020 917.63 1,987.03 2,212.21 411.00 936.19 1,123.72 3,915.65 1,989.082021 917.21 1,987.16 2,214.68 413.16 933.65 1,130.67 3,942.97 1,989.36
2017-2021 Average 913.89 1,976.53 2,207.48 413.51 934.09 1,135.97 3,954.22 1,999.85
Government Payments ($1000)2014 21.35 84.20 87.29 10.35 43.60 39.86 102.20 47.022015 125.07 21.56 96.66 15.37 21.58 42.97 141.08 52.372016 205.37 152.19 185.44 52.04 69.78 126.36 391.63 187.452017 202.01 151.26 157.40 53.71 110.10 171.51 569.74 289.872018 196.94 165.57 164.83 42.24 97.13 139.14 460.26 228.792019 203.42 173.03 172.47 36.84 93.51 133.43 438.66 212.402020 201.95 166.07 168.37 34.12 95.57 137.62 453.29 217.612021 202.20 160.98 159.56 31.91 95.10 134.89 445.25 215.32
2017-2021 Average 201.31 163.38 164.53 39.76 98.28 143.32 473.44 232.80
Net Cash Farm Income ($1000)2014 60.68 357.10 227.15 -14.71 275.89 244.85 255.85 274.812015 231.75 456.62 349.76 80.94 -87.64 327.44 728.22 308.222016 310.17 612.60 598.61 62.33 82.14 197.19 372.59 364.082017 279.60 524.05 493.71 54.74 118.57 257.79 588.53 504.242018 265.83 526.05 511.96 44.26 118.45 226.16 531.02 474.842019 245.73 466.70 426.21 24.38 93.56 194.30 412.66 416.252020 197.70 405.78 380.20 4.39 70.67 167.43 278.68 386.082021 176.11 339.14 315.37 -12.52 19.19 149.64 203.47 361.46
2017-2021 Average 232.99 452.34 425.49 23.05 84.09 199.06 402.87 428.58
Ending Cash Reserves ($1000)2014 -97.47 20.80 -120.63 -83.88 109.27 118.17 -87.14 60.022015 -14.27 128.97 -153.95 -122.71 -134.33 287.64 167.40 142.622016 109.46 401.42 -55.36 -196.66 -255.79 327.55 6.54 252.962017 214.64 619.27 109.75 -255.06 -281.89 442.09 193.27 556.872018 295.08 741.14 257.35 -318.89 -317.78 457.11 292.00 791.162019 360.83 865.44 300.69 -357.14 -350.49 443.24 202.51 914.192020 271.80 900.92 326.45 -424.00 -412.03 420.34 15.48 969.492021 235.63 786.97 282.57 -512.19 -561.12 355.15 -240.02 980.51
Nominal Net Worth ($1000)2014 769.50 2,011.84 2,889.68 919.35 1,321.62 1,824.25 3,915.79 4,933.602015 902.14 2,241.20 2,986.66 920.67 1,121.79 2,054.50 4,261.48 5,160.772016 1,071.33 2,620.10 3,264.95 832.95 1,044.21 2,127.64 4,227.82 5,323.072017 1,190.50 2,858.58 3,416.86 738.34 1,007.31 2,197.20 4,356.50 5,468.452018 1,296.04 3,052.69 3,604.90 652.04 973.30 2,211.23 4,431.88 5,606.412019 1,433.71 3,300.78 3,752.69 605.54 963.07 2,232.20 4,375.81 5,714.842020 1,443.69 3,403.46 3,847.30 541.20 887.86 2,241.45 4,282.08 5,791.332021 1,459.95 3,408.81 3,891.83 463.09 760.84 2,209.90 4,065.73 5,894.62
Prob. of Negative Ending Cash (%)2016 29 1 83 99 98 1 51 22017 17 5 36 99 93 1 44 22018 12 6 27 99 88 5 42 12019 15 8 29 99 86 9 44 22020 24 11 30 99 84 13 51 32021 28 20 38 99 88 20 55 4
Prob. of Decreasing Real Net WorthOver 2014-2021 (%) 1 1 1 1 1 1 1 1

Table 9. Implications of the January 2017 FAPRI Baseline on the Economic Viability of Representative Farms Primarily Producing Cotton.
TNC2500 TNC4050 ALC3000 GAC2300 SCC2000 NCC1700 NCNP1600
Overall Financial Position2017-2021 Average Good Poor Marginal Poor Good Poor Poor
Change Real Net Worth (%)2017-2021 Average 5.82 -0.73 -0.29 0.10 5.38 -5.41 -6.80
NIA to Maintain RealNet Worth (%/Rec.) -12.20 2.54 0.85 1.11 -12.22 12.68 15.00
NIA for Zero EndingCash Balance (%/Rec.) -18.58 5.10 -3.30 3.13 -11.71 21.23 29.53
Govt Payments/Receipts (%)2017-2021 Average 2.96 7.57 2.81 16.05 8.13 3.41 13.83
Cost to Receipts Ratio (%)2017-2021 Average 76.62 92.37 91.19 86.95 76.30 94.17 98.86
Total Cash Receipts ($1000)2014 1,384.79 2,538.67 2,474.72 2,290.86 1,556.48 1,003.74 1,046.512015 1,315.89 2,481.81 2,463.65 2,450.41 1,265.43 953.43 996.622016 1,329.22 2,553.31 1,667.60 2,478.49 1,465.52 960.53 1,102.702017 1,356.53 2,574.82 1,770.98 2,514.82 1,550.13 989.79 1,123.902018 1,379.70 2,647.31 1,851.10 2,531.60 1,593.02 1,008.32 1,140.102019 1,385.93 2,654.51 1,874.06 2,559.84 1,614.85 1,016.82 1,145.762020 1,388.85 2,664.30 1,872.61 2,583.42 1,621.84 1,017.86 1,144.932021 1,392.75 2,679.11 1,872.51 2,609.74 1,629.30 1,015.59 1,141.46
2017-2021 Average 1,380.75 2,644.01 1,848.25 2,559.88 1,601.83 1,009.68 1,139.23
Government Payments ($1000)2014 10.29 82.29 10.11 61.07 13.78 9.41 24.802015 74.13 102.84 35.53 285.97 83.08 33.77 103.822016 97.14 192.10 79.20 376.19 178.19 39.66 136.222017 71.45 201.11 72.20 413.75 120.31 47.56 145.512018 37.11 201.11 50.56 391.03 120.10 34.48 149.982019 27.42 190.77 41.45 408.26 127.28 28.62 159.652020 27.88 188.28 37.69 409.78 129.61 28.09 161.102021 28.17 182.39 37.29 409.94 130.51 26.46 159.00
2017-2021 Average 38.41 192.73 47.84 406.55 125.56 33.04 155.05
Net Cash Farm Income ($1000)2014 281.00 97.35 798.28 -27.23 278.11 100.82 -14.672015 266.54 95.13 863.23 250.66 102.37 81.30 -35.212016 336.42 249.48 142.82 389.39 366.18 98.25 106.172017 358.31 251.83 224.99 392.77 398.66 104.89 93.852018 378.53 306.61 285.26 393.20 434.21 109.05 83.112019 364.63 267.09 277.62 364.92 442.76 97.39 36.452020 338.50 198.36 219.66 318.69 418.22 56.12 -9.992021 317.03 125.85 177.43 276.15 390.67 10.24 -56.13
2017-2021 Average 351.40 229.95 236.99 349.14 416.90 75.54 29.46
Ending Cash Reserves ($1000)2014 81.69 -210.36 433.91 -374.93 81.01 -66.54 -227.622015 152.24 -412.49 965.07 -458.73 -132.08 -190.51 -512.412016 295.89 -465.89 682.85 -415.48 -51.83 -339.71 -693.972017 498.93 -485.48 592.15 -423.29 136.14 -431.65 -825.422018 698.25 -474.06 513.17 -439.53 310.07 -532.16 -1,014.222019 896.40 -454.82 532.17 -426.38 505.45 -628.28 -1,327.562020 1,055.18 -535.70 425.78 -411.49 697.05 -776.61 -1,600.702021 1,163.58 -707.25 329.31 -452.41 871.64 -966.29 -1,892.80
Nominal Net Worth ($1000)2014 1,731.42 4,911.47 2,327.49 7,356.90 2,734.21 1,927.73 2,730.452015 1,847.14 4,947.23 2,952.19 7,357.10 2,697.91 1,863.20 2,572.972016 2,012.05 5,008.69 2,808.32 7,390.82 2,870.58 1,778.27 2,490.612017 2,155.35 4,914.93 2,763.10 7,293.27 3,032.46 1,663.08 2,344.752018 2,312.15 4,904.08 2,762.31 7,275.68 3,222.54 1,571.74 2,173.822019 2,498.06 5,004.85 2,910.09 7,398.01 3,460.84 1,512.97 1,994.212020 2,651.81 4,923.72 2,812.11 7,376.33 3,678.65 1,397.86 1,795.852021 2,792.54 4,756.89 2,774.57 7,349.45 3,847.35 1,226.15 1,560.49
Prob. of Negative Ending Cash (%)2016 1 98 1 99 60 99 992017 1 93 7 96 34 99 992018 1 87 22 89 22 99 992019 1 79 29 83 15 98 992020 1 76 35 79 11 98 992021 1 79 40 76 8 98 99
Prob. of Decreasing Real Net WorthOver 2014-2021 (%) 1 1 1 1 1 1 1

Figure 17. Cotton Farms
-2.31%
28.97%
-5.18%-7.52% -6.16%
-9.38%
1.18%
10.76%
-15%
-10%
-5%
0%
5%
10%
15%
20%
25%
30%
35%
TXEC5000 TXRP2500 TXSP2500 TXSP4500 TXCB3000 TXVC4500 TXCB9200 TXMC1800
Minimum Annual Percentage Change in Receipts, 2017-2021, Needed to Have a Zero Ending Cash Balance in 2021
-18.58%
5.10%
-3.30%
3.13%
-11.71%
21.23%
29.54%
-30%
-20%
-10%
0%
10%
20%
30%
40%
TNC2500 TNC4050 ALC3000 GAC2300 SCC2000 NCC1700 NCNP1600
Minimum Annual Percentage Change in Receipts, 2017-2021, Needed to Have a Zero Ending Cash Balance in 2021

Figure 18. Cotton Farms
5 5
8
3 3
0
7 7 7
0
1
2
3
4
5
6
7
8
9
Overall Cash Flow Position Maintain Wealth
Num
ber o
f Far
ms
Economic and Financial Position Over the Period, 2017-2021, for all Cotton Farms
Good Marginal Poor

Average NCFI 25 & 75 Percentile NCFI 5 & 95 Percentile NCFI Prob. of Cash Flow Deficit
Figure 19. Net Cash Farm Income and Probabilities of a Cash Flow Deficit:Cotton Farms
83
36 27 29 30 38
-200
0
200
400
600
800
1000
2014 2015 2016 2017 2018 2019 2020 2021
($1,
000'
s)
TXEC5000 Texas Eastern Caprock Cotton Farm
99 99 99 99 99 99
-200
-150
-100
-50
0
50
100
150
2014 2015 2016 2017 2018 2019 2020 2021
($1,
000'
s)
TXRP2500 Texas Rolling Plains Cotton Farm
29 17 12 15 24 28
-300
-200
-100
0
100
200
300
400
500
600
2014 2015 2016 2017 2018 2019 2020 2021
($1,
000'
s)
TXSP2500 Texas Southern Plains Cotton Farm
1 5 6 8 11 20
-400
-200
0
200
400
600
800
1000
1200
2014 2015 2016 2017 2018 2019 2020 2021
($1,
000'
s)
TXSP4500 Large Texas Southern Plains Cotton Farm

Average NCFI 25 & 75 Percentile NCFI 5 & 95 Percentile NCFI Prob. of Cash Flow Deficit
Figure 20. Net Cash Farm Income and Probabilities of a Cash Flow Deficit:Cotton Farms
1 1 5 9 13 20
-300
-200
-100
0
100
200
300
400
500
600
700
2014 2015 2016 2017 2018 2019 2020 2021
($1,
000'
s)
TXCB3000 Texas Coastal Bend Cotton Farm
51 44 42 44 51 55
-1500
-1000
-500
0
500
1000
1500
2000
2014 2015 2016 2017 2018 2019 2020 2021
($1,
000'
s)
TXCB9200 Large Texas Coastal Bend Cotton Farm
98 93 88 86 84 88
-500
-400
-300
-200
-100
0
100
200
300
400
500
2014 2015 2016 2017 2018 2019 2020 2021
($1,
000'
s)
TXMC1800 Texas Mid-Coast Cotton Farm
2 2 1 2 3 4-200
0
200
400
600
800
1000
1200
2014 2015 2016 2017 2018 2019 2020 2021
($1,
000'
s)
TXVC4500 Texas Rio Grande Valley Cotton Farm

Average NCFI 25 & 75 Percentile NCFI 5 & 95 Percentile NCFI Prob. of Cash Flow Deficit
Figure 21. Net Cash Farm Income and Probabilities of a Cash Flow Deficit:Cotton Farms
1 1 1 1 1 1-100
0
100
200
300
400
500
600
700
800
900
2014 2015 2016 2017 2018 2019 2020 2021
($1,
000'
s)
TNC2500 Tennessee Cotton Farm
98 93 87 79 76 79
-600
-400
-200
0
200
400
600
800
1000
2014 2015 2016 2017 2018 2019 2020 2021
($1,
000'
s)
TNC4050 Large Tennessee Cotton Farm
1 7 22 29 35 40
-1000
-500
0
500
1000
1500
2014 2015 2016 2017 2018 2019 2020 2021
($1,
000'
s)
ALC3000 Alabama Cotton Farm
99 96 89 83 79 76
-400
-200
0
200
400
600
800
1000
2014 2015 2016 2017 2018 2019 2020 2021
($1,
000'
s)
GAC2300 Georgia Cotton Farm

Average NCFI 25 & 75 Percentile NCFI 5 & 95 Percentile NCFI Prob. of Cash Flow Deficit
Figure 22. Net Cash Farm Income and Probabilities of a Cash Flow Deficit:Cotton Farms
6034 22 15 11 8
-200
0
200
400
600
800
1000
2014 2015 2016 2017 2018 2019 2020 2021
($1,
000'
s)
SCC2000 South Carolina Cotton Farm
99 99 99 98 98 98
-400
-300
-200
-100
0
100
200
300
400
2014 2015 2016 2017 2018 2019 2020 2021
($1,
000'
s)
NCC1700 North Carolina Cotton Farm
99 99 99 99 99 99
-500
-400
-300
-200
-100
0
100
200
300
400
2014 2015 2016 2017 2018 2019 2020 2021
($1,
000'
s)
NCNP1600 North Carolina Northern Peanut Farm

CA
TXB
ARW
LAS
ARH
TXTXE
ARS
Figure 23. Representative Farms Producing Rice
ARM MSD
MOB

Table 10. Implications of the January 2017 FAPRI Baseline on the Economic Viability of Representative Farms Primarily Producing Rice.
CAR550 CAR3000 CABR1300 CACR800 TXR1500 TXR3000 TXBR1800 TXER3200
Overall Financial Position2017-2021 Average Poor Marginal Good Marginal Good Good Poor Poor
Change Real Net Worth (%)2017-2021 Average -5.03 -0.02 1.96 -0.69 1.30 1.93 -0.83 -9.65
NIA to Maintain RealNet Worth (%/Rec.) 17.40 0.00 -11.32 5.21 -5.45 -3.69 -0.43 7.90
NIA for Zero EndingCash Balance (%/Rec.) 22.46 -0.50 -22.73 -4.80 -4.80 -4.13 0.71 13.86
Govt Payments/Receipts (%)2017-2021 Average 10.23 11.02 9.70 11.15 15.57 13.01 13.82 12.49
Cost to Receipts Ratio (%)2017-2021 Average 94.31 110547.03 72.26 28171.57 77.00 87.41 89.28 100.30
Total Cash Receipts ($1000)2014 753.57 4,545.22 1,912.04 1,262.43 844.92 1,711.25 414.23 1,991.472015 790.01 4,759.08 2,002.20 1,322.00 865.80 1,874.36 404.08 1,372.882016 686.73 4,091.82 1,743.08 1,128.25 722.59 1,434.35 907.48 1,450.112017 787.38 4,678.26 1,991.29 1,290.58 885.62 1,740.91 1,091.07 1,727.422018 763.95 4,544.89 1,936.50 1,253.33 845.29 1,681.90 1,049.62 1,683.092019 758.59 4,514.89 1,922.50 1,244.44 839.35 1,670.77 1,042.50 1,672.962020 769.56 4,576.70 1,950.13 1,261.42 858.56 1,710.71 1,066.11 1,701.122021 778.84 4,637.74 1,974.49 1,278.51 873.85 1,746.42 1,085.45 1,727.61
2017-2021 Average 771.66 4,590.50 1,954.98 1,265.66 860.53 1,710.14 1,066.95 1,702.44
Government Payments ($1000)2014 0.00 0.00 0.00 0.00 0.00 0.00 414.23 0.002015 17.05 96.93 40.97 27.10 29.34 48.00 404.08 45.532016 54.01 306.96 129.74 85.80 92.91 152.00 101.59 145.212017 107.23 609.50 257.61 170.37 184.49 301.81 201.72 289.372018 75.94 431.62 182.43 120.65 130.64 213.73 142.85 205.882019 73.12 415.59 175.66 116.17 125.80 205.79 137.54 198.112020 74.95 426.00 180.05 119.08 128.94 210.94 140.99 203.212021 72.21 410.44 173.48 114.73 124.24 203.24 135.84 196.06
2017-2021 Average 80.69 458.63 193.85 128.20 138.82 227.10 151.79 218.53
Net Cash Farm Income ($1000)2014 51.41 252.81 439.65 137.95 121.85 115.41 204.47 207.312015 142.10 807.54 669.42 309.98 257.65 515.54 193.33 -166.662016 64.95 294.29 456.09 161.37 158.75 178.38 100.50 -17.352017 130.97 786.23 674.19 297.04 302.29 422.69 231.51 187.942018 91.55 595.55 598.15 237.82 241.49 333.78 173.83 115.692019 63.21 465.74 558.83 202.46 204.36 272.39 143.40 48.732020 33.27 400.07 550.72 186.30 202.86 216.68 121.92 -20.292021 6.24 335.53 519.79 170.39 190.04 183.39 107.63 -92.33
2017-2021 Average 65.05 516.62 580.34 218.80 228.21 285.79 155.65 47.95
Ending Cash Reserves ($1000)2014 -119.22 -205.25 175.64 16.78 2.46 3.84 49.03 36.342015 -160.01 121.26 590.68 138.18 93.58 368.25 34.51 -355.372016 -284.07 -107.83 722.45 101.33 65.85 400.75 -55.01 -593.872017 -395.74 252.42 1,111.51 201.88 253.25 623.25 39.94 -575.472018 -490.65 375.11 1,384.06 268.94 296.10 744.25 60.14 -638.472019 -607.36 359.42 1,577.24 289.19 238.67 758.84 69.07 -762.672020 -781.19 280.63 1,718.55 277.49 245.39 568.87 23.44 -1,002.852021 -1,023.40 119.31 1,933.35 247.40 215.87 383.19 -40.47 -1,360.08
Nominal Net Worth ($1000)2014 2,766.50 9,240.67 6,479.98 4,464.84 1,755.17 942.09 816.64 2,075.662015 2,756.91 9,706.27 6,949.12 4,600.63 1,905.78 1,308.63 860.05 1,768.412016 2,658.80 9,598.26 7,119.52 4,555.91 1,930.20 1,350.42 813.59 1,584.752017 2,530.54 9,768.13 7,358.79 4,517.81 2,073.70 1,591.19 901.88 1,563.882018 2,398.90 9,817.51 7,537.07 4,485.66 2,119.85 1,737.50 920.87 1,481.882019 2,281.43 9,901.44 7,739.50 4,475.63 2,120.04 1,822.93 944.83 1,356.632020 2,097.90 9,849.75 7,855.46 4,414.54 2,182.93 1,779.29 905.38 1,128.552021 1,898.62 9,782.91 8,091.31 4,369.73 2,207.71 1,718.63 852.82 818.72
Prob. of Negative Ending Cash (%)2016 99 70 1 2 8 1 99 992017 99 23 1 7 4 2 36 992018 99 20 1 7 5 2 34 992019 99 21 1 8 9 2 34 992020 99 25 1 10 11 9 41 992021 99 29 1 13 17 22 53 99
Prob. of Decreasing Real Net WorthOver 2014-2021 (%) 1 1 1 1 1 1 1 1
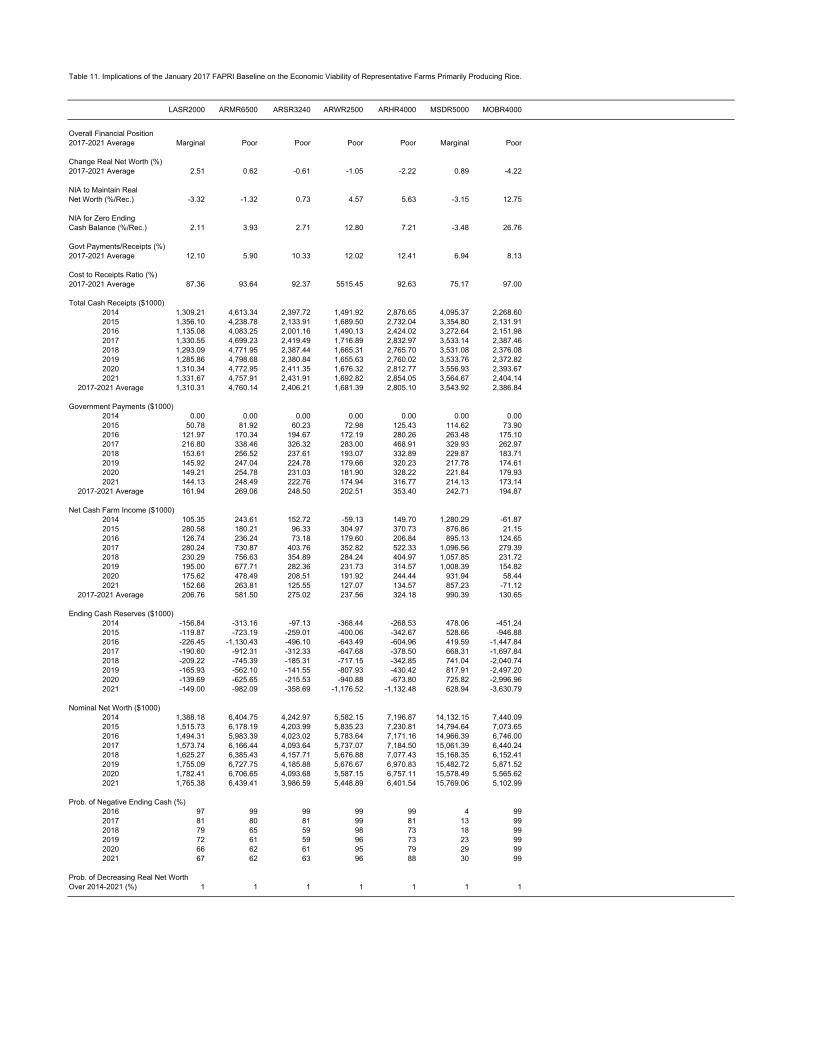
Table 11. Implications of the January 2017 FAPRI Baseline on the Economic Viability of Representative Farms Primarily Producing Rice.
LASR2000 ARMR6500 ARSR3240 ARWR2500 ARHR4000 MSDR5000 MOBR4000
Overall Financial Position2017-2021 Average Marginal Poor Poor Poor Poor Marginal Poor
Change Real Net Worth (%)2017-2021 Average 2.51 0.62 -0.61 -1.05 -2.22 0.89 -4.22
NIA to Maintain RealNet Worth (%/Rec.) -3.32 -1.32 0.73 4.57 5.63 -3.15 12.75
NIA for Zero EndingCash Balance (%/Rec.) 2.11 3.93 2.71 12.80 7.21 -3.48 26.76
Govt Payments/Receipts (%)2017-2021 Average 12.10 5.90 10.33 12.02 12.41 6.94 8.13
Cost to Receipts Ratio (%)2017-2021 Average 87.36 93.64 92.37 5515.45 92.63 75.17 97.00
Total Cash Receipts ($1000)2014 1,309.21 4,613.34 2,397.72 1,491.92 2,876.65 4,095.37 2,268.602015 1,356.10 4,238.78 2,133.91 1,689.50 2,732.04 3,354.80 2,131.912016 1,135.08 4,083.25 2,001.16 1,490.13 2,424.02 3,272.64 2,151.982017 1,330.55 4,699.23 2,419.49 1,716.89 2,832.97 3,533.14 2,387.462018 1,293.09 4,771.95 2,387.44 1,665.31 2,765.70 3,531.08 2,376.082019 1,285.86 4,798.68 2,380.84 1,655.63 2,760.02 3,533.76 2,372.822020 1,310.34 4,772.95 2,411.35 1,676.32 2,812.77 3,556.93 2,393.672021 1,331.67 4,757.91 2,431.91 1,692.82 2,854.05 3,564.67 2,404.14
2017-2021 Average 1,310.31 4,760.14 2,406.21 1,681.39 2,805.10 3,543.92 2,386.84
Government Payments ($1000)2014 0.00 0.00 0.00 0.00 0.00 0.00 0.002015 50.78 81.92 60.23 72.98 125.43 114.62 73.902016 121.97 170.34 194.67 172.19 280.26 263.48 175.102017 216.80 338.46 326.32 283.00 468.91 329.93 262.972018 153.61 256.52 237.61 193.07 332.89 229.87 183.712019 145.92 247.04 224.78 179.66 320.23 217.78 174.612020 149.21 254.78 231.03 181.90 328.22 221.84 179.932021 144.13 248.49 222.76 174.94 316.77 214.13 173.14
2017-2021 Average 161.94 269.06 248.50 202.51 353.40 242.71 194.87
Net Cash Farm Income ($1000)2014 105.35 243.61 152.72 -59.13 149.70 1,280.29 -61.872015 280.58 180.21 96.33 304.97 370.73 876.86 21.152016 126.74 236.24 73.18 179.60 206.84 895.13 124.652017 280.24 730.87 403.76 352.82 522.33 1,096.56 279.392018 230.29 756.63 354.89 284.24 404.97 1,057.85 231.722019 195.00 677.71 282.36 231.73 314.57 1,008.39 154.822020 175.62 478.49 208.51 191.92 244.44 931.94 58.442021 152.66 263.81 125.55 127.07 134.57 857.23 -71.12
2017-2021 Average 206.76 581.50 275.02 237.56 324.18 990.39 130.65
Ending Cash Reserves ($1000)2014 -156.84 -313.16 -97.13 -368.44 -268.53 478.06 -451.242015 -119.87 -723.19 -259.01 -400.06 -342.67 528.66 -946.882016 -226.45 -1,130.43 -496.10 -643.49 -604.96 419.59 -1,447.842017 -190.60 -912.31 -312.33 -647.68 -378.50 668.31 -1,697.842018 -209.22 -745.39 -185.31 -717.15 -342.85 741.04 -2,040.742019 -165.93 -562.10 -141.55 -807.93 -430.42 817.91 -2,497.202020 -139.69 -625.65 -215.53 -940.88 -673.80 725.82 -2,996.962021 -149.00 -982.09 -358.69 -1,176.52 -1,132.48 628.94 -3,630.79
Nominal Net Worth ($1000)2014 1,388.18 6,404.75 4,242.97 5,582.15 7,196.87 14,132.15 7,440.092015 1,515.73 6,178.19 4,203.99 5,835.23 7,230.81 14,794.64 7,073.652016 1,494.31 5,983.39 4,023.02 5,783.64 7,171.16 14,966.39 6,746.002017 1,573.74 6,166.44 4,093.64 5,737.07 7,184.50 15,061.39 6,440.242018 1,625.27 6,385.43 4,157.71 5,676.88 7,077.43 15,168.35 6,152.412019 1,755.09 6,727.75 4,185.88 5,676.67 6,970.83 15,482.72 5,871.522020 1,782.41 6,706.65 4,093.68 5,587.15 6,757.11 15,578.49 5,565.622021 1,765.38 6,439.41 3,986.59 5,448.89 6,401.54 15,769.06 5,102.99
Prob. of Negative Ending Cash (%)2016 97 99 99 99 99 4 992017 81 80 81 99 81 13 992018 79 65 59 98 73 18 992019 72 61 59 96 73 23 992020 66 62 61 95 79 29 992021 67 62 63 96 88 30 99
Prob. of Decreasing Real Net WorthOver 2014-2021 (%) 1 1 1 1 1 1 1

Figure 24. Rice Farms
22.46%
-.50%
-22.73%
-4.80% -4.80% -4.13%
.71%
13.86%
-25%
-20%
-15%
-10%
-5%
0%
5%
10%
15%
20%
25%
CAR550 CAR3000 CABR1300 CACR800 TXR1500 TXR3000 TXBR1800 TXER3200
Minimum Annual Percentage Change in Receipts, 2017-2021, Needed to Have a Zero Ending Cash Balance in 2021
3.93% 2.71%
12.80%
7.21%
-3.48%
26.76%
2.11%
-5%
0%
5%
10%
15%
20%
25%
30%
ARMR6500 ARSR3240 ARWR2500 ARHR4000 MSDR5000 MOBR4000 LASR2000
Minimum Annual Percentage Change in Receipts, 2017-2021, Needed to Have a Zero Ending Cash Balance in 2021
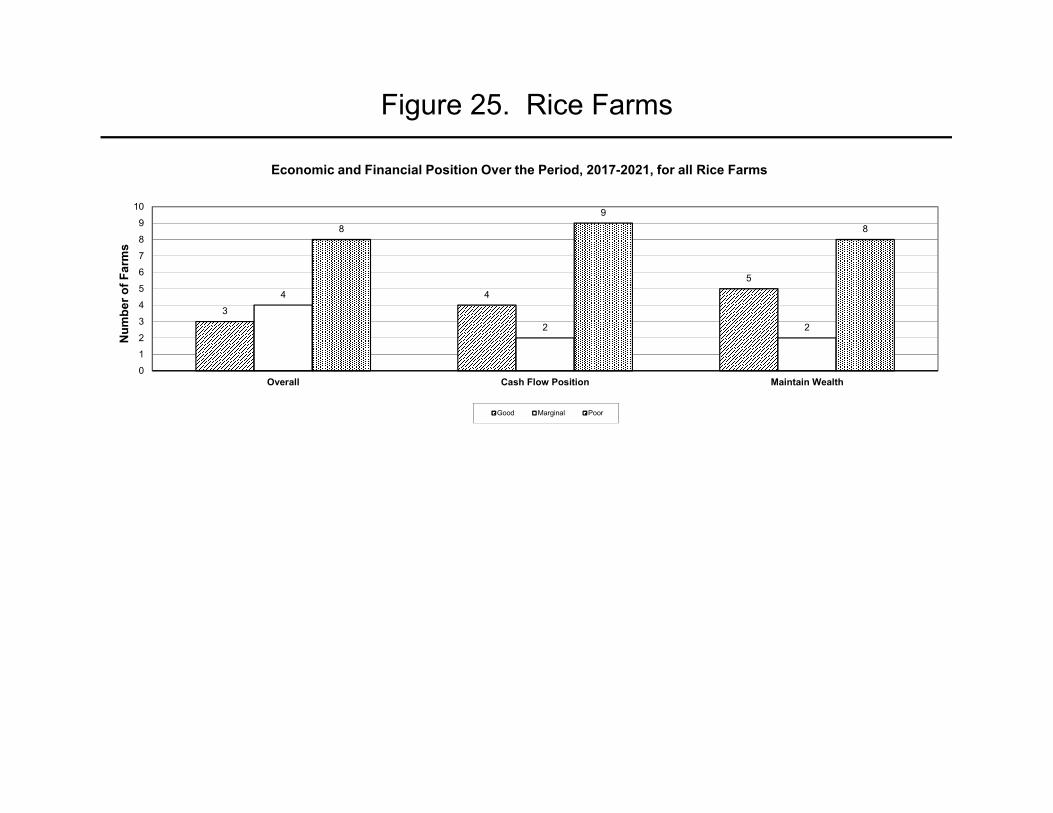
Figure 25. Rice Farms
34
5
4
2 2
89
8
0
12
3
4
5
67
8
9
10
Overall Cash Flow Position Maintain Wealth
Num
ber o
f Far
ms
Economic and Financial Position Over the Period, 2017-2021, for all Rice Farms
Good Marginal Poor

Average NCFI 25 & 75 Percentile NCFI 5 & 95 Percentile NCFI Prob. of Cash Flow Deficit
Figure 26. Net Cash Farm Income and Probabilities of a Cash Flow Deficit:Rice Farms
99 99 99 99 99 99
-500
-400
-300
-200
-100
0
100
200
300
2014 2015 2016 2017 2018 2019 2020 2021
($1,
000'
s)
CAR550 California Rice Farm
70
23 20 21 25 29
-2000
-1500
-1000
-500
0
500
1000
1500
2000
2014 2015 2016 2017 2018 2019 2020 2021
($1,
000'
s)
CAR3000 Large California Rice Farm
1 1 1 1 1 1-200
0
200
400
600
800
1000
1200
2014 2015 2016 2017 2018 2019 2020 2021
($1,
000'
s)
CABR1300 California Rice Farm
2 7 7 8 10 13-400
-300
-200
-100
0
100
200
300
400
500
600
2014 2015 2016 2017 2018 2019 2020 2021
($1,
000'
s)
CACR800 California Rice Farm

Average NCFI 25 & 75 Percentile NCFI 5 & 95 Percentile NCFI Prob. of Cash Flow Deficit
Figure 27. Net Cash Farm Income and Probabilities of a Cash Flow Deficit:Rice Farms
8 4 5 9 11 17
-300
-200
-100
0
100
200
300
400
500
600
2014 2015 2016 2017 2018 2019 2020 2021
($1,
000'
s)
TXR1500 Texas Rice Farm
1 2 2 2 9 22
-800
-600
-400
-200
0
200
400
600
800
1000
2014 2015 2016 2017 2018 2019 2020 2021
($1,
000'
s)
TXR3000 Large Texas Rice Farm
99
36 34 34 41 53
-600
-400
-200
0
200
400
600
2014 2015 2016 2017 2018 2019 2020 2021
($1,
000'
s)
TXBR1800 Texas Bay City Rice Farm
99 99 99 99 99 99
-1200
-1000
-800
-600
-400
-200
0
200
400
600
800
2014 2015 2016 2017 2018 2019 2020 2021
($1,
000'
s)
TXER3200 Texas El Campo Rice Farm

Average NCFI 25 & 75 Percentile NCFI 5 & 95 Percentile NCFI Prob. of Cash Flow Deficit
Figure 28. Net Cash Farm Income and Probabilities of a Cash Flow Deficit:Rice Farms
9980 65 61 62 62
-3000
-2000
-1000
0
1000
2000
3000
2014 2015 2016 2017 2018 2019 2020 2021
($1,
000'
s)
ARMR6500 Southeast Arkansas Rice Farm
99 8159 59 61 63
-1500
-1000
-500
0
500
1000
1500
2014 2015 2016 2017 2018 2019 2020 2021
($1,
000'
s)
ARSR3240 Large East Central Arkansas Rice Farm
99 99 98 96 95 96
-1000
-800
-600
-400
-200
0
200
400
600
800
1000
2014 2015 2016 2017 2018 2019 2020 2021
($1,
000'
s)
ARWR2500 East Central Arkansas Rice Farm
99 81 73 73 79 88
-1500
-1000
-500
0
500
1000
1500
2014 2015 2016 2017 2018 2019 2020 2021
($1,
000'
s)
ARHR4000 Northeast Arkansas Rice Farm
Average NCFI 25 & 75 Percentile NCFI 5 & 95 Percentile NCFI Prob. of Cash Flow Deficit
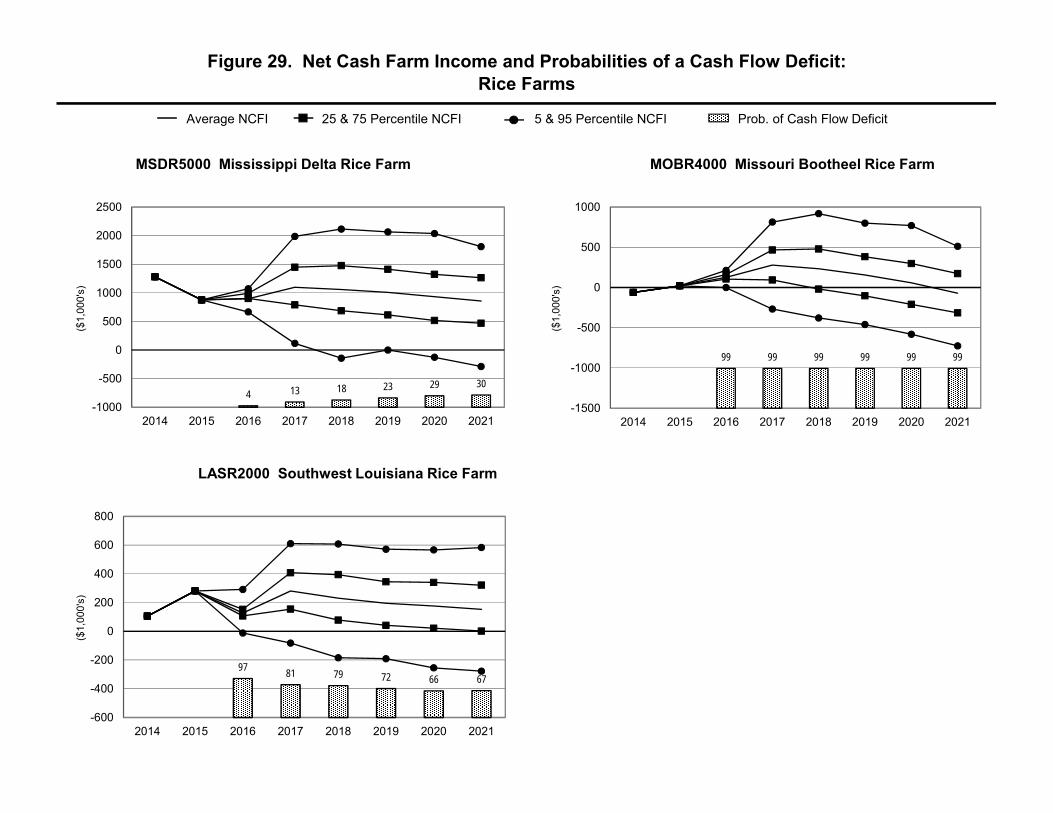
Figure 29. Net Cash Farm Income and Probabilities of a Cash Flow Deficit:Rice Farms
4 13 18 23 29 30
-1000
-500
0
500
1000
1500
2000
2500
2014 2015 2016 2017 2018 2019 2020 2021
($1,
000'
s)
MSDR5000 Mississippi Delta Rice Farm
99 99 99 99 99 99
-1500
-1000
-500
0
500
1000
2014 2015 2016 2017 2018 2019 2020 2021
($1,
000'
s)
MOBR4000 Missouri Bootheel Rice Farm
97 81 79 72 66 67
-600
-400
-200
0
200
400
600
800
2014 2015 2016 2017 2018 2019 2020 2021
($1,
000'
s)
LASR2000 Southwest Louisiana Rice Farm

WA
NV
CA
NM TXETXC
MO
FLS
FLN
WI NYW
VT
TXN
Figure 30. Representative Farms Producing Milk
IDNYC

Table 12. Implications of the January 2017 FAPRI Baseline on the Economic Viability of Representative Farms Primarily Producing Milk.
CAD2000 WAD300 WAD850 IDD3000 NVD1000 TXND3800 TXCD1500 TXED400 WID145 WID1000
Overall Financial Position2017-2021 Average Good Poor Good Good Good Good Marginal Poor Good Good
Change Real Net Worth (%)2017-2021 Average 3.67 -0.19 6.12 4.38 6.29 4.77 1.45 -2.45 1.52 6.82
NIA to Maintain RealNet Worth (%/Rec.) -8.60 4.07 -15.00 -8.16 -11.25 -7.33 -0.54 6.81 -4.22 -13.64
NIA for Zero EndingCash Balance (%/Rec.) -13.95 2.23 -20.56 -11.07 -18.15 -10.30 -1.27 11.08 -5.95 -18.96
Govt Payments/Receipts (%)2017-2021 Average 0.47 0.17 0.18 0.07 0.00 0.32 0.00 0.00 0.24 0.58
Cost to Receipts Ratio (%)2017-2021 Average 81.74 91.10 76.01 85.01 82.44 86.43 94.02 97.05 74.33 79.60
Total Cash Receipts ($1000)2014 12,765.68 1,693.03 6,011.27 19,741.30 6,816.03 23,548.73 8,616.97 1,637.91 1,089.75 7,696.422015 9,392.09 1,192.17 4,336.79 14,818.21 5,066.05 17,628.75 6,538.77 1,233.71 840.03 5,937.582016 8,949.66 1,111.06 4,052.77 13,937.92 4,584.52 16,212.22 6,036.85 1,108.77 769.70 5,505.562017 9,667.71 1,219.23 4,434.77 15,204.34 5,013.78 17,851.74 6,606.03 1,214.89 842.69 6,012.692018 10,006.62 1,277.71 4,640.46 15,804.94 5,221.84 18,572.93 6,880.29 1,267.77 867.18 6,155.342019 10,277.30 1,322.73 4,800.42 16,300.15 5,372.12 19,102.81 7,078.43 1,305.16 887.59 6,296.432020 10,437.71 1,347.96 4,890.23 16,561.80 5,457.48 19,408.39 7,195.10 1,326.38 898.06 6,375.472021 10,579.51 1,367.58 4,960.61 16,775.75 5,537.25 19,679.96 7,297.82 1,344.79 905.63 6,440.21
2017-2021 Average 10,193.77 1,307.04 4,745.30 16,129.41 5,320.49 18,923.17 7,011.54 1,291.80 880.23 6,256.03
Government Payments ($1000)2014 0.00 0.00 0.00 0.00 0.00 0.00 0.00 0.00 0.00 0.002015 31.58 7.37 27.64 37.82 0.00 15.97 0.00 0.00 5.47 92.172016 53.35 7.49 28.09 38.17 0.00 52.62 0.00 0.00 6.03 99.072017 89.05 6.39 23.97 33.01 0.00 96.82 0.00 0.00 5.20 81.832018 45.82 1.28 4.75 6.57 0.00 60.02 0.00 0.00 1.66 30.732019 33.59 0.84 3.12 4.19 0.00 46.26 0.00 0.00 0.99 19.862020 29.97 0.87 3.25 4.75 0.00 42.56 0.00 0.00 1.00 17.382021 29.28 1.14 4.33 5.93 0.00 41.64 0.00 0.00 1.04 21.20
2017-2021 Average 45.54 2.10 7.88 10.89 0.00 57.46 0.00 0.00 1.98 34.20
Net Cash Farm Income ($1000)2014 4,503.32 551.76 2,211.37 6,348.37 2,434.31 7,618.18 2,295.28 397.32 453.96 2,594.142015 1,627.93 107.48 812.36 2,106.54 1,024.24 2,618.70 776.27 148.13 229.90 1,048.472016 1,327.84 18.21 548.60 1,550.02 669.34 1,593.43 182.77 -7.61 168.49 617.322017 1,840.65 107.75 866.72 2,370.49 928.02 2,593.22 494.90 63.58 232.69 1,059.002018 1,966.88 139.93 980.77 2,666.46 1,011.38 2,864.48 569.34 75.62 248.34 1,115.012019 2,095.72 166.39 1,409.31 2,973.78 1,076.02 3,072.28 613.06 80.96 256.78 1,682.712020 2,140.35 176.14 1,488.70 3,113.25 1,080.52 3,126.97 589.92 79.34 251.31 1,699.412021 2,130.99 182.06 1,526.96 3,223.70 1,073.43 3,111.55 551.17 63.24 241.58 1,666.44
2017-2021 Average 2,034.92 154.46 1,254.49 2,869.54 1,033.87 2,953.70 563.68 72.55 246.14 1,444.51
Ending Cash Reserves ($1000)2014 2,101.17 267.56 1,073.94 2,775.47 1,199.30 3,991.12 961.71 67.06 149.27 1,265.542015 2,076.46 184.92 1,068.86 2,537.28 1,333.52 4,336.87 724.79 -78.97 138.50 1,371.032016 1,704.66 54.90 881.68 1,846.27 1,210.43 3,907.36 -33.75 -366.62 32.86 1,120.922017 2,430.39 1.71 1,291.27 2,723.23 1,663.71 4,210.88 47.02 -407.92 72.74 1,563.472018 3,149.36 -43.58 1,751.40 3,698.26 2,186.80 4,589.88 124.92 -448.42 80.44 2,016.322019 4,041.59 -74.89 2,502.81 4,907.91 2,736.42 5,131.69 263.81 -499.96 116.63 2,914.552020 4,970.37 -99.16 3,265.66 6,174.36 3,330.53 6,554.36 358.47 -561.84 173.27 3,821.152021 5,879.53 -130.36 4,083.98 7,461.46 3,911.90 7,977.22 393.45 -658.05 210.28 4,744.86
Nominal Net Worth ($1000)2014 20,724.82 3,901.45 9,561.10 27,456.86 7,147.21 25,593.98 8,654.81 2,494.71 2,681.79 9,711.012015 21,352.20 3,814.28 9,866.46 28,192.33 7,548.79 26,254.37 8,945.29 2,520.77 2,770.29 10,137.112016 20,338.59 3,516.74 9,508.96 26,520.80 7,051.87 24,004.44 7,806.86 1,972.51 2,668.22 9,536.412017 20,472.15 3,376.15 9,659.70 26,658.06 7,257.43 24,326.79 7,557.09 1,822.19 2,652.07 9,707.252018 21,080.99 3,312.43 10,050.95 27,519.14 7,711.73 25,363.68 7,590.05 1,742.33 2,655.12 10,092.832019 22,097.34 3,302.27 10,848.39 28,975.31 8,263.47 26,839.04 7,771.31 1,690.41 2,719.68 11,044.032020 23,104.12 3,321.83 11,659.92 30,572.14 8,877.42 28,389.74 7,926.06 1,645.71 2,793.45 11,975.742021 24,260.91 3,348.59 12,623.41 32,516.31 9,534.54 30,128.79 8,103.50 1,603.91 2,858.33 13,007.95
Prob. of Negative Ending Cash (%)2016 1 31 1 1 1 1 46 99 37 12017 2 52 3 12 1 3 48 97 25 32018 2 57 3 11 1 8 47 92 33 52019 3 58 2 10 1 10 42 92 30 12020 1 58 1 9 1 7 42 90 25 12021 1 62 1 8 1 6 43 93 22 1
Prob. of Decreasing Real Net WorthOver 2014-2021 (%) 1 1 1 1 1 1 1 1 1 1

Table 13. Implications of the January 2017 FAPRI Baseline on the Economic Viability of Representative Farms Primarily Producing Milk.
NYWD500 NYWD1200 NYCD180 NYCD675 VTD160 VTD400 MOGD550 MOGD400 FLND550 FLSD1750
Overall Financial Position2017-2021 Average Good Good Good Good Poor Good Good Good Good Good
Change Real Net Worth (%)2017-2021 Average 7.94 5.29 0.82 3.48 -3.87 2.72 3.48 6.45 4.91 4.89
NIA to Maintain RealNet Worth (%/Rec.) -21.69 -14.43 0.00 -15.00 10.46 -6.27 -10.87 -18.95 -6.32 -6.13
NIA for Zero EndingCash Balance (%/Rec.) -32.53 -23.41 -4.67 -20.55 18.28 -8.31 -14.22 -28.28 -8.19 -8.76
Govt Payments/Receipts (%)2017-2021 Average 0.38 0.28 0.00 0.00 0.02 0.03 0.00 0.00 0.00 0.00
Cost to Receipts Ratio (%)2017-2021 Average 70.58 77.26 76.82 72.93 96.17 82.16 72.31 67.83 85.93 89.35
Total Cash Receipts ($1000)2014 3,674.41 8,529.86 1,186.15 4,719.29 986.05 3,125.13 1,522.91 1,567.45 3,603.05 11,039.592015 2,831.90 6,405.02 863.84 3,424.19 740.82 2,343.51 1,233.30 1,150.82 2,806.90 8,630.642016 2,611.58 5,866.17 785.48 3,117.48 689.09 2,148.85 1,030.37 999.09 2,516.79 7,775.102017 2,827.62 6,404.50 856.48 3,417.15 749.26 2,334.14 1,118.95 1,092.71 2,736.62 8,467.222018 2,931.62 6,671.39 896.32 3,583.39 783.27 2,433.52 1,166.01 1,140.53 2,857.10 8,843.832019 3,017.43 6,877.08 924.09 3,698.10 806.82 2,500.70 1,201.05 1,175.25 2,945.46 9,120.142020 3,068.46 6,994.67 939.46 3,760.75 820.86 2,537.57 1,222.52 1,195.49 3,004.80 9,306.092021 3,116.59 7,101.21 953.90 3,818.13 833.81 2,570.53 1,239.74 1,210.58 3,050.30 9,446.22
2017-2021 Average 2,992.35 6,809.76 914.05 3,655.50 798.81 2,475.29 1,189.65 1,162.91 2,918.86 9,036.70
Government Payments ($1000)2014 0.00 0.00 0.00 0.00 0.00 0.00 0.00 0.00 0.00 0.002015 38.55 64.25 0.00 0.00 0.78 3.88 0.00 0.00 0.00 0.002016 38.63 64.39 0.00 0.00 0.70 3.49 0.00 0.00 0.00 0.002017 30.37 51.21 0.00 0.00 0.19 0.83 0.00 0.00 0.00 0.002018 7.80 13.02 0.00 0.00 0.11 0.48 0.00 0.00 0.00 0.002019 4.72 7.41 0.00 0.00 0.12 0.55 0.00 0.00 0.00 0.002020 4.96 8.21 0.00 0.00 0.12 0.54 0.00 0.00 0.00 0.002021 6.07 9.10 0.00 0.00 0.15 0.65 0.00 0.00 0.00 0.00
2017-2021 Average 10.79 17.79 0.00 0.00 0.14 0.61 0.00 0.00 0.00 0.00
Net Cash Farm Income ($1000)2014 1,621.33 3,502.08 501.72 2,117.83 265.10 1,121.17 637.90 806.29 1,097.97 2,833.632015 883.65 1,596.47 215.64 969.00 63.71 487.18 443.16 427.64 472.36 1,115.802016 667.39 1,048.57 135.67 660.14 0.08 263.48 254.33 284.17 189.09 224.292017 842.36 1,472.72 193.74 912.30 39.78 413.36 320.81 358.50 365.37 812.812018 902.96 1,617.63 219.88 1,030.29 51.13 466.74 348.54 385.11 431.20 1,003.012019 942.05 1,719.65 235.59 1,095.09 53.09 502.17 366.04 406.42 481.94 1,172.012020 950.95 1,740.53 240.38 1,101.42 46.51 505.33 362.60 409.53 515.03 1,318.132021 947.25 1,729.50 240.56 1,097.64 32.76 488.48 356.93 412.00 521.72 1,355.72
2017-2021 Average 917.11 1,656.01 226.03 1,047.35 44.66 475.22 350.98 394.31 463.05 1,132.34
Ending Cash Reserves ($1000)2014 943.09 1,892.97 194.88 946.04 61.89 450.48 177.70 334.80 460.81 1,319.462015 1,243.80 2,381.37 157.41 1,061.20 -86.19 463.43 232.31 424.46 452.68 1,286.262016 1,381.51 2,375.09 65.33 899.75 -256.52 257.92 138.54 407.54 221.43 557.362017 1,852.59 3,125.77 92.51 1,263.14 -318.53 331.96 247.15 574.49 320.97 861.642018 2,318.51 3,932.49 106.44 1,616.29 -382.03 452.25 374.95 765.87 445.09 1,307.952019 2,916.98 4,812.21 126.01 1,979.32 -444.45 567.58 491.55 948.78 606.20 1,909.802020 3,487.64 5,702.27 136.35 2,408.22 -519.97 680.67 585.30 1,131.23 783.77 2,608.332021 4,059.97 6,619.77 166.89 2,835.29 -600.28 813.51 663.01 1,289.95 975.02 3,358.92
Nominal Net Worth ($1000)2014 4,818.49 12,631.28 3,003.17 10,257.53 1,632.94 5,074.94 2,870.82 2,460.60 3,601.31 11,405.422015 5,360.13 13,695.12 3,134.57 11,070.47 1,578.24 5,352.26 3,084.17 2,417.88 3,830.55 11,782.382016 5,375.54 13,406.43 3,035.97 10,858.50 1,267.39 4,806.63 2,961.21 2,312.27 3,450.97 10,539.692017 5,711.34 13,801.88 2,980.37 10,987.99 1,166.07 4,816.16 2,989.43 2,419.13 3,443.14 10,497.952018 6,146.08 14,519.25 2,969.66 11,303.29 1,094.20 4,938.98 3,102.48 2,595.90 3,566.57 10,839.212019 6,768.18 15,451.37 3,004.04 11,759.15 1,041.82 5,132.75 3,240.44 2,791.97 3,775.22 11,445.882020 7,350.06 16,405.84 3,027.72 12,291.14 985.34 5,274.23 3,366.57 2,994.49 4,002.14 12,159.752021 7,986.73 17,475.64 3,108.19 12,922.63 940.90 5,477.15 3,507.79 3,200.25 4,281.61 13,020.05
Prob. of Negative Ending Cash (%)2016 1 1 7 1 99 1 4 1 16 172017 1 1 13 1 99 8 8 1 16 242018 1 1 27 1 99 11 8 1 18 212019 1 1 23 1 99 9 9 1 17 202020 1 1 24 1 99 6 8 1 11 142021 1 1 21 1 99 5 7 1 9 10
Prob. of Decreasing Real Net WorthOver 2014-2021 (%) 1 1 1 1 1 1 1 1 1 1

Figure 31. Dairy Farms
-13.95%-11.07%
2.23%
-20.56%-18.15%
-10.30%
-1.27%
11.08%
-32.53%
-18.96%
-35%
-30%
-25%
-20%
-15%
-10%
-5%
0%
5%
10%
15%
CAD2000 IDD3000 WAD300 WAD850 NVD1000 TXND3800 TXCD1500 TXED400 NYWD500 WID1000
Minimum Annual Percentage Change in Receipts, 2017-2021, Needed to Have a Zero Ending Cash Balance in 2021
18.28%
-23.41%
-4.67%
-20.55%
-5.95% -8.31%
-28.28%
-14.22%-8.19% -8.76%
-40%
-30%
-20%
-10%
0%
10%
20%
30%
VTD160 NYWD1200 NYCD180 NYCD675 WID145 VTD400 MOGD400 MOGD550 FLND550 FLSD1750
Minimum Annual Percentage Change in Receipts, 2017-2021, Needed to Have a Zero Ending Cash Balance in 2021

Figure 32. Dairy Farms
16 16 16
1 1 1
3 3 3
0
2
4
6
8
10
12
14
16
18
Overall Cash Flow Position Maintain Wealth
Num
ber o
f Far
ms
Economic and Financial Position Over the Period, 2017-2021, for all Dairy Farms
Good Marginal Poor

Average NCFI 25 & 75 Percentile NCFI 5 & 95 Percentile NCFI Prob. of Cash Flow Deficit
Figure 33. Net Cash Farm Income and Probabilities of a Cash Flow Deficit:Dairy Farms
1 2 2 3 1 1-2000
-1000
0
1000
2000
3000
4000
5000
6000
2014 2015 2016 2017 2018 2019 2020 2021
($1,
000'
s)
CAD2000 California Dairy Farm
1 12 11 10 9 8-4000
-2000
0
2000
4000
6000
8000
10000
2014 2015 2016 2017 2018 2019 2020 2021
($1,
000'
s)
IDD3000 Idaho Dairy Farm
3152 57 58 58 62
-600
-400
-200
0
200
400
600
800
2014 2015 2016 2017 2018 2019 2020 2021
($1,
000'
s)
WAD300 Washington Dairy Farm
1 3 3 2 1 1-1000
-500
0
500
1000
1500
2000
2500
3000
3500
2014 2015 2016 2017 2018 2019 2020 2021
($1,
000'
s)
WAD850 Large Washington Dairy Farm

Average NCFI 25 & 75 Percentile NCFI 5 & 95 Percentile NCFI Prob. of Cash Flow Deficit
Figure 34. Net Cash Farm Income and Probabilities of a Cash Flow Deficit:Dairy Farms
1 1 1 1 1 1-1000
-500
0
500
1000
1500
2000
2500
3000
2014 2015 2016 2017 2018 2019 2020 2021
($1,
000'
s)
NVD1000 Nevada Dairy Farm
1 3 8 10 7 6-4000
-2000
0
2000
4000
6000
8000
10000
2014 2015 2016 2017 2018 2019 2020 2021
($1,
000'
s)
TXND3800 North Texas Dairy Farm
46 48 47 42 42 43
-2500
-1500
-500
500
1500
2500
3500
2014 2015 2016 2017 2018 2019 2020 2021
($1,
000'
s)
TXCD1500 Large Central Texas Dairy Farm
99 97 92 92 90 93
-800
-600
-400
-200
0
200
400
600
2014 2015 2016 2017 2018 2019 2020 2021
($1,
000'
s)
TXED400 East Texas Dairy Farm

Average NCFI 25 & 75 Percentile NCFI 5 & 95 Percentile NCFI Prob. of Cash Flow Deficit
Figure 35. Net Cash Farm Income and Probabilities of a Cash Flow Deficit:Dairy Farms
1 1 1 1 1 10
200
400
600
800
1000
1200
1400
1600
1800
2000
2014 2015 2016 2017 2018 2019 2020 2021
($1,
000'
s)
NYWD500 Western New York Dairy Farm
1 1 1 1 1 10
500
1000
1500
2000
2500
3000
3500
4000
2014 2015 2016 2017 2018 2019 2020 2021
($1,
000'
s)
NYWD1200 Large Western New York Dairy Farm
7 13 27 23 24 21
-100
0
100
200
300
400
500
600
2014 2015 2016 2017 2018 2019 2020 2021
($1,
000'
s)
NYCD180 Central New York Dairy Farm
1 1 1 1 1 10
500
1000
1500
2000
2500
2014 2015 2016 2017 2018 2019 2020 2021
($1,
000'
s)
NYCD675 Large Central New York Dairy Farm

Average NCFI 25 & 75 Percentile NCFI 5 & 95 Percentile NCFI Prob. of Cash Flow Deficit
Figure 36. Net Cash Farm Income and Probabilities of a Cash Flow Deficit:Dairy Farms
37 25 33 30 25 22
-100
0
100
200
300
400
500
600
2014 2015 2016 2017 2018 2019 2020 2021
($1,
000'
s)
WID145 Wisconsin Dairy Farm
1 3 5 1 1 1-1500-1000
-5000
5001000150020002500300035004000
2014 2015 2016 2017 2018 2019 2020 2021
($1,
000'
s)
WID1000 Large Wisconsin Dairy Farm
99 99 99 99 99 99
-200
-150
-100
-50
0
50
100
150
200
250
300
2014 2015 2016 2017 2018 2019 2020 2021
($1,
000'
s)
VTD140 Vermont Dairy Farm
1 8 11 9 6 5-400
-200
0
200
400
600
800
1000
1200
2014 2015 2016 2017 2018 2019 2020 2021
($1,
000'
s)
VTD400 Large Vermont Dairy Farm

Average NCFI 25 & 75 Percentile NCFI 5 & 95 Percentile NCFI Prob. of Cash Flow Deficit
Figure 37. Net Cash Farm Income and Probabilities of a Cash Flow Deficit:Dairy Farms
1 1 1 1 1 10
100
200
300
400
500
600
700
800
900
2014 2015 2016 2017 2018 2019 2020 2021
($1,
000'
s)
MOGD400 Missouri Grazing Dairy Farm
4 8 8 9 8 7-100
0
100
200
300
400
500
600
700
800
2014 2015 2016 2017 2018 2019 2020 2021
($1,
000'
s)
MOGD550 Missouri Grazing Dairy Farm
16 16 18 17 11 9-800
-400
0
400
800
1200
1600
2014 2015 2016 2017 2018 2019 2020 2021
($1,
000'
s)
FLND550 Northern Florida Dairy Farm
17 24 21 20 14 10-3000
-2000
-1000
0
1000
2000
3000
4000
5000
2014 2015 2016 2017 2018 2019 2020 2021
($1,
000'
s)
FLSD1750 Southern Florida Dairy Farm

MT
WY
CO
MO
NV
NM
FL
SD
TXS
TXR
Figure 38. Representative Ranches Producing Beef Cattle
NVS

Table 14. Implications of the January 2017 FAPRI Baseline on the Economic Viability of Representative Farms Primarily Producing Beef Cattle.
NVB650 NVSB550 MTB600 WYB475 COB275 NMB240 SDB500 MOB250 TXRB400 TXSB275 FLB1155
Overall Financial Position2017-2021 Average Marginal Good Poor Poor Marginal Poor Poor Marginal Poor Poor Marginal
Change Real Net Worth (%)2017-2021 Average -1.23 1.11 -1.64 -5.74 -1.49 -1.60 -2.96 -0.32 -1.60 -2.00 -1.05
NIA to Maintain RealNet Worth (%/Rec.) 37.50 -1.76 75.38 57.61 214.42 104.18 106.35 15.00 87.14 88.78 99.81
NIA for Zero EndingCash Balance (%/Rec.) -17.23 -37.95 3.48 36.21 -11.37 -0.63 53.94 -25.93 -7.63 29.13 -34.44
Govt Payments/Receipts (%)2017-2021 Average 0.00 0.00 0.00 0.00 0.00 0.00 0.00 1.81 0.00 0.00 0.00
Cost to Receipts Ratio (%)2017-2021 Average 77.71 65.60 90.30 112.16 80.18 61.98 117.61 53.06 84.48 88.63 73.89
Total Cash Receipts ($1000)2014 831.32 735.28 688.01 769.23 402.99 343.93 533.49 477.25 650.25 350.25 1,195.712015 812.63 737.83 676.27 618.61 404.38 345.59 531.64 469.51 643.12 350.56 1,194.922016 596.52 544.93 456.05 453.29 252.01 252.71 360.32 358.21 458.49 255.25 848.942017 537.38 499.81 397.22 396.18 231.35 229.92 308.11 341.39 408.90 227.34 756.402018 518.59 483.67 377.38 378.41 226.51 220.32 291.74 336.86 392.68 220.47 726.972019 517.48 482.47 376.43 378.02 224.89 221.24 291.28 337.81 391.04 217.68 723.942020 526.49 491.53 386.40 390.07 229.85 223.75 298.66 342.68 401.20 222.26 738.812021 548.35 511.85 408.53 413.38 239.24 234.62 317.74 353.32 418.19 234.10 774.31
2017-2021 Average 529.66 493.86 389.19 391.21 230.37 225.97 301.51 342.41 402.40 224.37 744.09
Government Payments ($1000)2014 0.00 0.00 0.00 0.00 0.00 0.00 0.00 0.00 0.00 0.00 0.002015 0.00 0.00 0.00 0.00 25.00 0.00 0.00 1.53 0.00 0.00 0.002016 0.00 0.00 0.00 0.00 0.00 0.00 0.00 6.36 0.00 0.00 0.002017 0.00 0.00 0.00 0.00 0.00 0.00 0.00 8.64 0.00 0.00 0.002018 0.00 0.00 0.00 0.00 0.00 0.00 0.00 6.56 0.00 0.00 0.002019 0.00 0.00 0.00 0.00 0.00 0.00 0.00 5.16 0.00 0.00 0.002020 0.00 0.00 0.00 0.00 0.00 0.00 0.00 5.09 0.00 0.00 0.002021 0.00 0.00 0.00 0.00 0.00 0.00 0.00 5.12 0.00 0.00 0.00
2017-2021 Average 0.00 0.00 0.00 0.00 0.00 0.00 0.00 6.12 0.00 0.00 0.00
Net Cash Farm Income ($1000)2014 315.51 408.42 324.55 398.36 211.15 203.32 204.70 273.24 257.42 153.13 584.882015 413.27 426.54 317.85 246.31 223.55 201.57 209.55 281.05 260.52 162.19 619.982016 211.51 248.96 127.56 64.01 85.17 124.14 56.43 188.01 138.93 75.51 333.202017 151.36 193.33 69.62 6.05 59.67 94.48 -1.78 168.95 86.38 55.32 236.872018 123.92 173.95 47.54 -27.27 51.35 83.66 -29.22 158.78 64.69 28.23 194.162019 109.90 164.95 32.43 -49.35 44.10 81.36 -50.96 159.37 59.49 23.10 178.042020 106.02 163.10 26.45 -68.27 44.22 85.72 -72.12 161.37 53.74 18.59 183.112021 114.44 164.23 36.82 -68.30 40.89 89.76 -80.06 166.86 64.72 13.58 205.80
2017-2021 Average 121.13 171.91 42.57 -41.43 48.05 87.00 -46.83 163.07 65.80 27.76 199.60
Ending Cash Reserves ($1000)2014 146.11 209.48 141.85 179.02 152.69 60.78 61.08 126.98 102.21 17.48 247.932015 366.92 462.95 265.28 230.29 294.29 148.51 122.15 250.83 205.74 58.47 537.362016 410.82 558.65 249.24 127.00 302.85 167.22 67.68 287.52 219.89 4.91 687.472017 430.19 611.53 195.57 -12.82 293.78 141.03 -26.15 316.92 209.92 -48.08 800.642018 413.37 638.65 133.47 -177.75 271.70 107.69 -152.88 334.33 176.55 -114.56 865.602019 378.21 661.95 71.15 -334.04 226.98 61.89 -306.55 348.07 131.45 -174.69 899.302020 372.82 692.50 7.17 -495.70 180.64 32.21 -508.92 363.13 78.99 -238.70 930.842021 350.56 736.91 -46.17 -651.99 123.83 7.77 -713.26 374.96 27.35 -306.92 991.05
Nominal Net Worth ($1000)2014 8,541.03 2,715.33 8,408.65 3,335.43 16,423.17 7,387.97 8,317.15 3,250.96 8,850.32 5,240.40 25,413.692015 8,505.36 2,996.22 8,667.16 3,175.18 14,722.41 7,633.31 8,592.31 3,369.57 9,145.25 5,373.25 26,262.542016 8,036.96 2,722.85 8,173.32 2,678.80 14,379.50 7,426.85 7,797.53 3,221.50 8,770.37 5,128.43 25,648.652017 7,732.06 2,653.01 7,784.69 2,392.57 13,894.66 7,135.92 7,574.47 3,130.85 8,423.28 4,893.11 24,825.332018 7,527.60 2,635.78 7,524.87 2,169.96 13,530.83 6,924.74 7,252.46 3,091.16 8,171.22 4,726.43 24,266.942019 7,398.31 2,661.16 7,372.59 2,003.92 13,308.52 6,783.80 6,942.50 3,081.29 8,016.71 4,624.31 23,978.732020 7,307.19 2,708.63 7,231.38 1,840.02 13,064.89 6,658.10 6,683.60 3,070.26 7,860.27 4,503.48 23,669.142021 7,268.91 2,801.96 7,159.08 1,705.97 12,887.37 6,579.81 6,465.28 3,086.28 7,766.14 4,412.27 23,572.06
Prob. of Negative Ending Cash (%)2016 1 1 1 1 1 1 1 1 1 34 12017 1 1 1 65 1 1 77 1 1 93 12018 1 1 1 99 1 1 99 1 1 99 12019 1 1 13 99 1 8 99 1 1 99 12020 1 1 46 99 1 27 99 1 13 99 12021 1 1 67 99 1 46 99 1 34 99 1
Prob. of Decreasing Real Net WorthOver 2014-2021 (%) 1 1 1 1 1 1 1 1 1 1 1

Figure 39. Beef Cattle Ranches
1
5
1
4
2
0
6
4
10
0
2
4
6
8
10
12
Overall Cash Flow Position Maintain Wealth
Num
ber o
f Far
ms
Economic and Financial Position Over the Period, 2017-2021, for all Cattle Ranches
Good Marginal Poor

Average NCFI 25 & 75 Percentile NCFI 5 & 95 Percentile NCFI Prob. of Cash Flow Deficit
Figure 40. Net Cash Farm Income and Probabilities of a Cash Flow Deficit:Beef Cattle Ranches
1 1 1 1 1 10
50
100
150
200
250
300
350
400
450
2014 2015 2016 2017 2018 2019 2020 2021
($1,
000'
s)
NVB650 Nevada Cattle Ranch
1 1 1 1 1 10
50
100
150
200
250
300
350
400
450
2014 2015 2016 2017 2018 2019 2020 2021
($1,
000'
s)
NVSB550 Southern Nevada Cattle Ranch
1 1 1 1346
67
-100
-50
0
50
100
150
200
250
300
350
2014 2015 2016 2017 2018 2019 2020 2021
($1,
000'
s)
MTB600 Montana Cattle Ranch
1
6599 99 99 99
-400
-300
-200
-100
0
100
200
300
400
500
2014 2015 2016 2017 2018 2019 2020 2021
($1,
000'
s)
WYB475 Wyoming Cattle Ranch
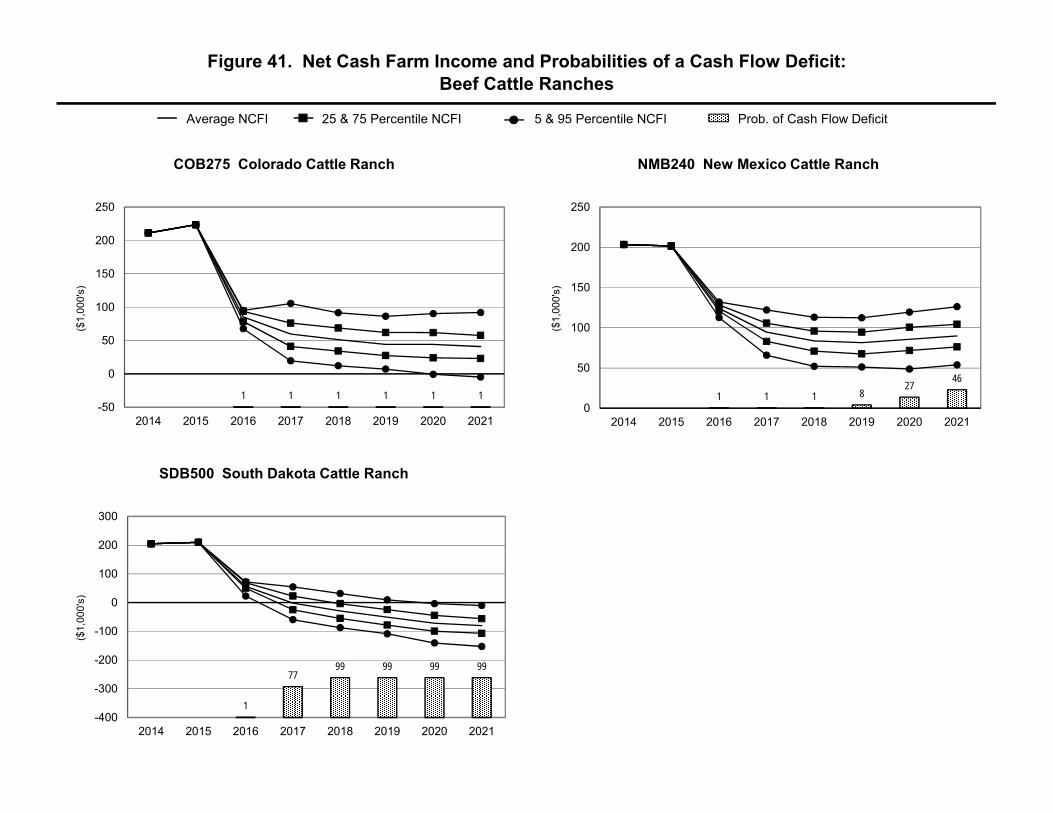
Average NCFI 25 & 75 Percentile NCFI 5 & 95 Percentile NCFI Prob. of Cash Flow Deficit
Figure 41. Net Cash Farm Income and Probabilities of a Cash Flow Deficit:Beef Cattle Ranches
1 1 1 1 1 1-50
0
50
100
150
200
250
2014 2015 2016 2017 2018 2019 2020 2021
($1,
000'
s)
COB275 Colorado Cattle Ranch
1 1 1 827
46
0
50
100
150
200
250
2014 2015 2016 2017 2018 2019 2020 2021
($1,
000'
s)
NMB240 New Mexico Cattle Ranch
1
7799 99 99 99
-400
-300
-200
-100
0
100
200
300
2014 2015 2016 2017 2018 2019 2020 2021
($1,
000'
s)
SDB500 South Dakota Cattle Ranch

Average NCFI 25 & 75 Percentile NCFI 5 & 95 Percentile NCFI Prob. of Cash Flow Deficit
Figure 42. Net Cash Farm Income and Probabilities of a Cash Flow Deficit:Beef Cattle Ranches
1 1 1 1 1334
-100
-50
0
50
100
150
200
250
300
2014 2015 2016 2017 2018 2019 2020 2021
($1,
000'
s)
TXRB400 Rolling Plains Texas Cattle Ranch
34
93 99 99 99 99
-150
-100
-50
0
50
100
150
200
2014 2015 2016 2017 2018 2019 2020 2021
($1,
000'
s)
TXSB275 South Texas Cattle Ranch
1 1 1 1 1 10
50
100
150
200
250
300
2014 2015 2016 2017 2018 2019 2020 2021
($1,
000'
s)
MOB250 Southwest Missouri Cattle Ranch
1 1 1 1 1 10
100
200
300
400
500
600
700
2014 2015 2016 2017 2018 2019 2020 2021
($1,
000'
s)
FLB1155 Florida Cattle Ranch

APPENDIX A:
CHARACTERISTICS OF
REPRESENTATIVE FARMS

2016 CHARACTERISTICS OF PANEL FARMS PRODUCING FEED GRAINS AND OILSEEDS IAG1350 IAG1350 is a 1,350-acre northwestern Iowa (Webster County) grain farm. The farm is
moderate-sized for the region and plants 880 acres of corn and 470 acres of soybeans annually. Sixty-nine percent of this farm’s 2016 receipts come from corn production.
IAG3400 This 3,400-acre large-sized grain farm is located in northwestern Iowa (Webster County).
It plants 1,870 acres of corn and 1,530 acres of soybeans each year, realizing 62 percent of receipts from corn production.
NEG2400 South-central Nebraska (Dawson County) is home to this 2,400-acre grain farm. This
farm plants sixty-seven percent of cultivated acres to corn and thirty-three percent to soybeans. The farm splits its corn acres evenly between yellow and white food-grade corn. Sixty-eight percent of gross receipts are derived from corn sales.
NEG4300 This is a 4,300-acre grain farm located in south-central Nebraska (Dawson County). This
operation plants 3,000 acres of corn and 1,000 acres of soybeans each year. Remaining acres are planted to alfalfa. A portion (25 percent) of the corn acreage is food-grade corn. In 2016, 74 percent of total receipts were generated from corn production.
NDG3000 NDG3000 is a 3,000-acre, moderate-sized, south central North Dakota (Barnes County)
grain farm that plants 500 acres of wheat, 1,000 acres of corn, and 1,500 acres of soybeans. One hundred acres are enrolled in the Conservation Reserve Program. The farm generated 46 percent of 2016 receipts from soybean sales and 42 percent from corn sales.
NDG8000 This is an 8,000-acre, large-sized grain farm in south central North Dakota (Barnes
County) that grows 3,000 acres of soybeans, 3,000 acres of corn, 1,500 acres of wheat, and 250 acres of barley annually. The remaining acreage is enrolled in the Conservation Reserve Program. Soybean and corn sales accounted for 83 percent of 2016 receipts.
ING1000 Shelby County, Indiana, is home to this 1,000-acre moderate-sized feedgrain farm. This
farm annually plants corn and soybeans in a 50/50 rotation. Due to this farm’s proximity to Indianapolis, land development pressures will likely constrain further expansion of this operation. Fifty-three percent of 2016 receipts came from corn sales.
ING2200 ING2200 is a large-sized grain farm located in east central Indiana (Shelby County).
This farm plants 1,100 acres to corn and 1,100 acres to soybeans each year. In 2016, 56 percent of gross receipts were generated by corn sales.

Appendix Table A1. Characteristics of Panel Farms Producing Feed Grains.
IAG1350 IAG3400 NEG2400 NEG4300 NDG3000 NDG8000 ING1000 ING2200
County Webster Webster Dawson Dawson Barnes Barnes Shelby Shelby
Total Cropland 1,350.00 3,400.00 2,400.00 4,300.00 3,000.00 8,000.00 1,000.00 2,200.00
Acres Owned 290.00 1,100.00 600.00 2,150.00 720.00 4,000.00 300.00 770.00
Acres Leased 1,060.00 2,300.00 1,800.00 2,150.00 2,280.00 4,000.00 700.00 1,430.00
Assets ($1000)
Total 3,613.00 12,102.00 6,034.00 20,142.00 4,082.00 24,517.00 3,518.00 10,002.00
Real Estate 2,781.00 10,231.00 4,413.00 16,330.00 2,856.00 19,509.00 2,488.00 8,041.00
Machinery 831.00 1,871.00 1,621.00 3,813.00 1,187.00 4,810.00 571.00 1,467.00
Other & Livestock 0.00 0.00 0.00 0.00 39.00 198.00 459.00 494.00
Debt/Asset Ratios
Total 0.33 0.17 0.24 0.24 0.27 0.22 0.17 0.22
Intermediate 0.20 0.10 0.23 0.20 0.22 0.25 0.26 0.26
Long Run 0.17 0.17 0.17 0.17 0.17 0.18 0.13 0.14
2016 Gross Receipts ($1,000)*
Total 799.50 1,774.20 1,818.90 3,207.30 1,007.00 2,944.30 536.30 1,287.60
Corn 554.90 1,099.40 1,243.40 2,371.70 422.70 1,356.10 281.40 716.10
0.69 0.62 0.68 0.74 0.42 0.46 0.53 0.56
Wheat 0.00 0.00 0.00 0.00 112.40 396.30 0.00 0.00
0.00 0.00 0.00 0.00 0.11 0.14 0.00 0.00
Soybeans 244.60 674.90 575.50 650.20 459.40 1,075.20 248.60 557.00
0.31 0.38 0.32 0.20 0.46 0.37 0.46 0.43
Hay 0.00 0.00 0.00 185.50 0.00 0.00 0.00 0.00
0.00 0.00 0.00 0.06 0.00 0.00 0.00 0.00
Other Receipts 0.00 0.00 0.00 0.00 0.00 17.50 0.00 0.00
0.00 0.00 0.00 0.00 0.00 0.01 0.00 0.00
2016 Planted Acres**
Total 1,350.00 3,400.00 2,400.00 4,300.00 3,100.00 8,000.00 1,000.00 2,200.00
Corn 880.00 1,870.00 1,600.00 3,000.00 1,000.00 3,000.00 500.00 1,100.00
0.65 0.55 0.67 0.70 0.32 0.38 0.50 0.50
Wheat 0.00 0.00 0.00 0.00 500.00 1,500.00 0.00 0.00
0.00 0.00 0.00 0.00 0.16 0.19 0.00 0.00
Soybeans 470.00 1,530.00 800.00 1,000.00 1,500.00 3,000.00 500.00 1,100.00
0.35 0.45 0.33 0.23 0.48 0.38 0.50 0.50
Hay 0.00 0.00 0.00 300.00 0.00 0.00 0.00 0.00
0.00 0.00 0.00 0.07 0.00 0.00 0.00 0.00
CRP 0.00 0.00 0.00 0.00 100.00 250.00 0.00 0.00
0.00 0.00 0.00 0.00 0.03 0.03 0.00 0.00
*Receipts for 2016 are included to indicate the relative importance of each enterprise to the farm. Percents
indicate the percentage of the total receipts accounted for by the livestock categories and the crops.
**Acreages for 2016 are included to indicate the relative importance of each enterprise to the farm. Total
planted acreage may exceed total cropland available due to double cropping. Percents indicate the percentage
of total planted acreage accounted for by the crop.

2016 PANEL FARMS PRODUCING FEED GRAINS AND OILSEEDS MOCG2300 MOCG2300 is a 2,300-acre grain farm located in central Missouri (Carroll County) and
plants 1,150 acres of corn and 1,150 acres of soybeans annually. This farm is located in the Missouri River bottom, an area with a large concentration of livestock production. This farm generated 53 percent of its total revenue from corn and 46 percent from soybeans during 2016.
MOCG4200 This is a 4,200-acre central Missouri (Carroll County) grain farm with 2,310 acres of corn
and 1,890 acres of soybeans. This farm is located in the Missouri River bottom, an area with a large concentration of livestock production. Corn sales accounted for 62 percent of farm receipts and soybeans accounted for 38 percent in 2016.
MONG2300 MONG2300 is a 2,300-acre diversified northwest Missouri grain farm centered in
Nodaway County. MONG2300 plants 1,125 acres of corn, 1,125 acres of soybeans, and 200 acres of hay annually. The farm also has a 300-head cow-calf herd. Proximity to the Missouri River increases marketing options for area grain farmers due to easily accessible river grain terminals. In 2016, 39 percent of the farm’s total receipts were from corn, 38 percent from soybeans, and 21 percent from cattle sales.
LANG2500 This is a 2,500-acre northeast Louisiana (Madison Parish) diversified grain farm. This
farm harvests 500 acres of rice, 875 acres of soybeans, 375 acres of cotton, and 750 acres of corn. For 2016, 55 percent of farm receipts came from corn and soybean sales.
TNG2500 This is a 2,500-acre, moderate-sized grain farm in West Tennessee (Gibson County).
Annually, this farm plants 875 acres of corn, 1,625 acres of soybeans, and 750 acres of wheat (planted before soybeans) in a region of Tennessee recognized for the high level of implementation of conservation practices by farmers. For 2016, 35 percent of farm receipts were from sales of corn and 50 percent from soybeans.
TNG4500 West Tennessee (Gibson County) is home to this 4,500-acre, large-sized grain farm.
Farmers in this part of Tennessee are known for their early and continued adoption of conservation practices, including widespread implementation of no-till farming. TNG4500 plants 1,687.5 acres of corn, 562.5 acres of wheat, 1,687.5 acres of soybeans (562.5 of which are double-cropped after wheat), and 1,125 acres of cotton. The farm generated 29 percent of its 2016 gross receipts from sales of corn and 25 percent from soybeans.
NCSP2000 A 2,000-acre diversified farm located in southern North Carolina (Bladen County).
NCSP2000 plants 400 acres of peanuts, 1,100 acres of corn, and 500 acres of soybeans. Sixty-six percent of receipts for this farm came from corn and soybean sales in 2016; the balance of receipts came from peanut sales.
SCG3500 A 3,500-acre, large-sized South Carolina (Clarendon County) grain farm with 1,200 acres
of corn, 1,000 acres of cotton, 700 acres of peanuts, and 600 acres of soybeans. The farm generated 34 percent of 2016 receipts from corn sales and 10 percent from soybean sales.

Appendix Table A2. Characteristics of Panel Farms Producing Feed Grains.
MOCG2300 MOCG4200 MONG2300 LANG2500 TNG2500 TNG4500 NCSP2000 SCG3500
County Carroll Carroll Nodaway Madison Gibson Gibson Bladen Clarendon
Total Cropland 2,300.00 4,200.00 2,300.00 2,500.00 2,500.00 4,500.00 2,000.00 3,500.00
Acres Owned 1,380.00 1,800.00 1,150.00 500.00 375.00 1,125.00 700.00 1,400.00
Acres Leased 920.00 2,400.00 1,150.00 2,000.00 2,125.00 3,375.00 1,300.00 2,100.00
Pastureland
Acres Owned 0.00 0.00 450.00 0.00 0.00 0.00 0.00 0.00
Acres Leased 0.00 0.00 150.00 0.00 0.00 0.00 0.00 0.00
Assets ($1000)
Total 12,551.00 16,807.00 10,673.00 3,804.00 3,587.00 8,955.00 5,162.00 6,239.00
Real Estate 10,596.00 13,217.00 8,540.00 2,083.00 2,075.00 6,325.00 2,762.00 3,635.00
Machinery 1,361.00 2,044.00 1,358.00 1,721.00 1,317.00 2,186.00 1,683.00 2,244.00
Other & Livestock 594.00 1,547.00 776.00 0.00 195.00 444.00 717.00 360.00
Debt/Asset Ratios
Total 0.17 0.14 0.17 0.42 0.25 0.19 0.25 0.27
Intermediate 0.21 0.20 0.29 0.19 0.23 0.36 0.07 0.38
Long Run 0.14 0.14 0.15 0.14 0.13 0.14 0.12 0.15
Number of Livestock
Beef Cows 0.00 0.00 300.00 0.00 0.00 0.00 0.00 0.00
2016 Gross Receipts ($1,000)*
Total 1,085.00 1,929.10 1,460.80 1,460.80 1,199.70 2,900.50 1,477.90 2,595.40
Cattle 0.00 0.00 302.60 0.00 0.00 0.00 0.00 0.00
0.00 0.00 0.21 0.00 0.00 0.00 0.00 0.00
Corn 576.20 1,198.10 575.60 430.00 415.90 834.90 762.70 877.50
0.53 0.62 0.39 0.29 0.35 0.29 0.52 0.34
Wheat 0.00 0.00 0.00 0.00 179.30 201.30 0.00 0.00
0.00 0.00 0.00 0.00 0.15 0.07 0.00 0.00
Soybeans 497.90 731.00 548.80 372.00 604.50 721.80 203.40 254.40
0.46 0.38 0.38 0.26 0.50 0.25 0.14 0.10
Cotton 0.00 0.00 0.00 294.10 0.00 1,087.10 0.00 722.90
0.00 0.00 0.00 0.20 0.00 0.38 0.00 0.28
Peanuts 0.00 0.00 0.00 0.00 0.00 0.00 428.20 523.60
0.00 0.00 0.00 0.00 0.00 0.00 0.29 0.20
Other Receipts 0.00 0.00 12.80 0.00 0.00 0.00 0.00 0.00
0.00 0.00 0.01 0.00 0.00 0.00 0.00 0.00
2016 Planted Acres**
Total 2,300.00 4,200.00 2,900.00 2,500.00 3,250.00 5,062.50 2,000.00 3,500.00
Corn 1,150.00 2,310.00 1,125.00 750.00 875.00 1,687.50 1,100.00 1,200.00
0.50 0.55 0.39 0.30 0.27 0.33 0.55 0.34
Wheat 0.00 0.00 0.00 0.00 750.00 562.50 0.00 0.00
0.00 0.00 0.00 0.00 0.23 0.11 0.00 0.00
Soybeans 1,150.00 1,890.00 1,125.00 875.00 1,625.00 1,687.50 500.00 600.00
0.50 0.45 0.39 0.35 0.50 0.33 0.25 0.17
Cotton 0.00 0.00 0.00 375.00 0.00 1,125.00 0.00 1,000.00
0.00 0.00 0.00 0.15 0.00 0.22 0.00 0.29
Peanuts 0.00 0.00 0.00 0.00 0.00 0.00 400.00 700.00
0.00 0.00 0.00 0.00 0.00 0.00 0.20 0.20
CRP 0.00 0.00 50.00 0.00 0.00 0.00 0.00 0.00
0.00 0.00 0.02 0.00 0.00 0.00 0.00 0.00
Improved Pasture 0.00 0.00 400.00 0.00 0.00 0.00 0.00 0.00
0.00 0.00 0.14 0.00 0.00 0.00 0.00 0.00
*Receipts for 2016 are included to indicate the relative importance of each enterprise to the farm. Percents
indicate the percentage of the total receipts accounted for by the livestock categories and the crops.
**Acreages for 2016 are included to indicate the relative importance of each enterprise to the farm. Total
planted acreage may exceed total cropland available due to double cropping. Percents indicate the percentage
of total planted acreage accounted for by the crop.

2016 PANEL FARMS PRODUCING FEED GRAINS AND OILSEEDS TXNP3450 This is a 3,450-acre diversified grain farm located on the northern High Plains of Texas
(Moore County). This farm plants 160 acres of cotton, 1,430 acres of irrigated corn, 345 acres of irrigated sorghum for seed production, and 1,170 acres of irrigated wheat annually. Seventy-one percent of total receipts are generated from corn sales.
TXNP10640 TXNP10640 is a large-sized diversified grain farm located in the Texas Panhandle
(Moore County). This farm annually plants 3,113 acres of cotton (2,640 irrigated/473 dryland); 4,000 acres of irrigated corn; 2,105 acres of grain sorghum (530 irrigated for seed production/1,102 dryland/473 irrigated for commercial use); and 713 acres of winter wheat (240 irrigated/473 dryland). Forty-three percent of 2016 cash receipts were derived from corn sales.
TXPG2500 The Texas Panhandle is home to this 2,500-acre farm (Deaf Smith County). Annually,
wheat is planted on 847 acres (480 irrigated and 367 dryland), 1270 acres planted to irrigated corn, 200 irrigated acres are planted to cotton, and grain sorghum is planted on 183 dryland acres. Seventy-three percent of 2016 cash receipts were generated by corn sales.
TXHG2700 This 2,700-acre grain farm is located on the Blackland Prairie of Texas (Hill County).
On this farm, 1,400 acres of corn, 300 acres of sorghum, 300 acres of cotton, and 700 acres of wheat are planted annually. Grain sales accounted for 64 percent of 2016 receipts with cotton accounting for fifteen percent of sales. Forty beef cows live on 300 acres of improved pasture and contribute approximately five percent of total receipts.
TXWG1600 This 1,600-acre farm is located on the Blackland Prairie of Texas (Williamson County).
TXWG1600 plants 750 acres of corn, 300 acres of sorghum, 400 acres of cotton, and 150 acres of winter wheat annually. Additionally, this farm has a 40-head beef cow herd that is pastured on rented ground that cannot be farmed. Grain sales accounted for 49 percent of 2016 receipts with cotton accounting for 37 percent of sales.
TXUG1600 TXUG1600 is a diversified cotton and grain farm located in Uvalde County, Texas. This
farm plants 150 acres of corn, 700 acres of cotton, and 750 acres of wheat (500 irrigated/250 dryland) each year. All crops except the dryland wheat are grown under irrigation. In 2016, grain sales accounted for 17 percent of farm receipts; the balance came from cotton sales.

Appendix Table A3. Characteristics of Panel Farms Producing Feed Grains.
TXNP3450 TXNP10640 TXPG2500 TXHG2700 TXWG1600 TXUG1600
County Moore Moore Deaf Smith Hill Williamson Uvalde
Total Cropland 3,450.00 10,640.00 2,500.00 2,700.00 1,600.00 1,600.00
Acres Owned 2,590.00 3,511.00 1,875.00 400.00 150.00 0.00
Acres Leased 860.00 7,129.00 625.00 2,300.00 1,450.00 1,600.00
Pastureland
Acres Owned 0.00 0.00 0.00 60.00 30.00 0.00
Acres Leased 0.00 0.00 0.00 240.00 170.00 0.00
Assets ($1000)
Total 8,205.00 16,451.00 5,386.00 2,077.00 1,668.00 518.00
Real Estate 6,289.00 8,933.00 3,312.00 1,126.00 1,003.00 0.00
Machinery 1,276.00 5,464.00 2,073.00 892.00 607.00 470.00
Other & Livestock 641.00 2,053.00 0.00 60.00 58.00 48.00
Debt/Asset Ratios
Total 0.03 0.13 0.23 0.57 0.40 0.14
Intermediate 0.08 0.11 0.25 0.20 0.33 0.16
Long Run 0.03 0.16 0.17 0.22 0.17 0.00
Number of Livestock
Beef Cows 0.00 0.00 0.00 40.00 40.00 0.00
2016 Gross Receipts ($1,000)*
Total 1,868.60 6,319.50 1,511.60 581.40 520.30 1,299.10
Cattle 0.00 0.00 0.00 30.40 33.10 0.00
0.00 0.00 0.00 0.05 0.06 0.00
Corn 1,321.80 2,700.80 1,103.70 245.10 180.50 96.80
0.71 0.43 0.73 0.42 0.35 0.08
Grain Sorghum 131.90 891.00 14.50 35.40 46.40 0.00
0.07 0.14 0.01 0.06 0.09 0.00
Wheat 218.80 87.70 125.90 91.60 25.40 120.30
0.12 0.01 0.08 0.16 0.05 0.09
Cotton 128.70 2,366.60 148.90 85.20 191.90 1,056.10
0.07 0.37 0.10 0.15 0.37 0.81
Other Receipts 0.00 0.00 65.00 0.00 0.00 0.00
0.00 0.00 0.04 0.00 0.00 0.00
2016 Planted Acres**
Total 3,105.00 9,931.00 2,500.00 3,000.00 1,600.00 1,600.00
Corn 1,430.00 4,000.00 1,270.00 1,400.00 750.00 150.00
0.46 0.40 0.51 0.47 0.47 0.09
Grain Sorghum 345.00 2,105.00 183.00 300.00 300.00 0.00
0.11 0.21 0.07 0.10 0.19 0.00
Wheat 1,170.00 713.00 847.00 700.00 150.00 750.00
0.38 0.07 0.34 0.23 0.09 0.47
Cotton 160.00 3,113.00 200.00 300.00 400.00 700.00
0.05 0.31 0.08 0.10 0.25 0.44
Improved Pasture 0.00 0.00 0.00 300.00 0.00 0.00
0.00 0.00 0.00 0.10 0.00 0.00
*Receipts for 2016 are included to indicate the relative importance of each enterprise to the farm. Percents
indicate the percentage of the total receipts accounted for by the livestock categories and the crops.
**Acreages for 2016 are included to indicate the relative importance of each enterprise to the farm. Total
planted acreage may exceed total cropland available due to double cropping. Percents indicate the percentage
of total planted acreage accounted for by the crop.

2016 CHARACTERISTICS OF PANEL FARMS PRODUCING WHEAT WAW2000 This is a 2,000-acre moderate-sized grain farm in the Palouse of southeastern Washington
(Whitman County). It plants 1,320 acres of wheat, 140 acres of barley, and 540 acres of dry peas. Disease concerns dictate rotating a minimum acreage of barley and peas to maintain wheat yields. This farm generated 72 percent of 2016 receipts from wheat.
WAW8000 A 8,000-acre, large-sized grain farm in the Palouse of southeastern Washington (Whitman
County). Annually, this farm allocates 4,950 acres to wheat and 2,400 acres to dry peas. Diseases that inhibit wheat yield dictate the rotation of a minimum acreage of peas. Wheat sales accounted for 65 percent of 2016 receipts.
WAAW4500 South-central Washington (Adams County) is home to this 4,500-acre, large-sized wheat farm.
Annually, this farm plants 2,000 acres of wheat in a wheat-fallow rotation. Additionally, 500 acres are enrolled in CRP. In 2016, 95 percent of the farm’s income came from wheat.
ORW4100 ORW3600 is a 4,100-acre large-sized grain farm located in northeastern Oregon (Morrow
County). This farm plants 1,950 acres annually in a wheat-fallow rotation, with 200 additional acres enrolled in a CRP contract. Eighty-eight percent of this farm’s 2016 total receipts came from wheat sales.
MTW7000 North-central Montana (Chouteau County) is home to this 7,000-acre farm on which 4,200 acres
of wheat (2,800 acres of winter wheat, 1,400 acres of spring wheat) are planted each year. MTW4500 uses no-till production practices. In 2016, 91 percent of cash income came from wheat.
COW3000 A 3,000-acre northeast Colorado (Washington County), moderate-sized farm that plants 1,012
acres of winter wheat and 675 acres of corn each year. COW3000 has adopted minimum tillage practices on most of its acres. This farm generated 50 percent of its receipts from wheat and 41 percent from corn.
COW5640 A 5,640-acre, large-sized northeast Colorado (Washington County) wheat farm. It plants 1,900
acres of wheat, 890 acres of millet, and 890 acres of corn. During 2016, 47 percent of gross receipts came from wheat sales and 25 percent came from corn sales.
KSCW2000 South central Kansas (Sumner County) is home to this 2,000-acre, moderate-sized grain farm.
KSCW2000 plants 1,000 acres of winter wheat, 333 acres of soybeans, 333 acres of sorghum, and 334 acres of corn each year. For 2016, 38 percent of gross receipts came from wheat.
KSCW5300 A 5,300-acre, large-sized grain farm in south central Kansas (Sumner County) that plants 3,445
acres of winter wheat, 795 acres of corn, 795 acres of soybeans, and 265 acres of sorghum. Fifty-four percent of this farm’s 2016 total receipts were generated from sales of winter wheat.
KSNW4000 This is a 4,000-acre, moderate-sized northwest Kansas (Thomas County) grain farm. This farm
plants 1,500 acres of winter wheat (wheat-fallow rotation), 1,000 acres of corn, and 500 acres of sorghum. This farm generated 39 percent of 2016 receipts from wheat and 54 percent of its receipts from feedgrains.
KSNW5980 KSNW5980 is a 5,980-acre, large-sized northwest Kansas (Thomas County) grain farm that
annually plants 1,820 acres of winter wheat, 2,290 acres of corn, 740 acres of sorghum, and 130 acres of soybeans. The farm generated 19 percent of receipts from wheat and 74 percent from feedgrains during 2016.

Appendix Table A4. Characteristics of Panel Farms Producing Wheat.
WAW2000 WAW8000 WAAW4500 ORW4100 MTW7000 COW3000 COW5640 KSCW2000 KSCW5300 KSNW4000 KSNW5980
County Whitman Whitman Adams Morrow Chouteau Washington Washington Sumner Sumner Thomas Thomas
Total Cropland 2,000.00 8,000.00 4,000.00 4,100.00 7,000.00 3,000.00 5,640.00 2,000.00 5,300.00 4,000.00 5,980.00
Acres Owned 800.00 2,310.00 2,000.00 1,600.00 4,200.00 2,100.00 1,880.00 700.00 1,325.00 1,170.00 1,800.00
Acres Leased 1,200.00 5,690.00 2,000.00 2,500.00 2,800.00 900.00 3,760.00 1,300.00 3,975.00 2,830.00 4,180.00
Pastureland
Acres Owned 0.00 0.00 0.00 0.00 0.00 200.00 0.00 0.00 0.00 400.00 500.00
Assets ($1000)
Total 2,180.00 11,258.00 2,291.00 1,894.00 6,293.00 4,107.00 4,144.00 2,931.00 5,028.00 4,767.00 10,094.00
Real Estate 1,680.00 7,511.00 1,789.00 932.00 4,663.00 3,645.00 2,958.00 2,085.00 3,709.00 3,701.00 8,220.00
Machinery 449.00 3,717.00 485.00 753.00 1,326.00 334.00 1,027.00 804.00 1,300.00 1,049.00 1,843.00
Other & Livestock 50.00 31.00 17.00 209.00 304.00 128.00 159.00 43.00 18.00 17.00 31.00
Debt/Asset Ratios
Total 0.13 0.28 0.36 0.25 0.19 0.18 0.28 0.36 0.17 0.28 0.29
Intermediate 0.02 0.13 0.20 0.14 0.28 0.10 0.25 0.48 0.18 0.22 0.21
Long Run 0.16 0.14 0.17 0.14 0.17 0.16 0.15 0.16 0.17 0.17 0.17
2016 Gross Receipts ($1,000)*
Total 621.10 2,700.30 322.00 317.50 835.20 293.60 601.50 386.90 895.30 657.10 1,165.80
Wheat 444.30 1,757.70 304.40 278.00 762.90 145.40 281.60 145.70 485.90 252.70 226.50
0.72 0.65 0.95 0.88 0.91 0.50 0.47 0.38 0.54 0.39 0.19
Grain Sorghum 0.00 0.00 0.00 0.00 0.00 0.00 0.00 62.50 39.10 89.70 133.10
0.00 0.00 0.00 0.00 0.00 0.00 0.00 0.16 0.04 0.14 0.11
Barley 22.30 0.00 0.00 0.00 0.00 0.00 0.00 0.00 0.00 0.00 0.00
0.04 0.00 0.00 0.00 0.00 0.00 0.00 0.00 0.00 0.00 0.00
Corn 0.00 0.00 0.00 0.00 0.00 121.20 147.10 94.70 202.70 259.50 664.40
0.00 0.00 0.00 0.00 0.00 0.41 0.25 0.25 0.23 0.40 0.57
Soybeans 0.00 0.00 0.00 0.00 0.00 0.00 0.00 79.50 152.60 0.00 73.30
0.00 0.00 0.00 0.00 0.00 0.00 0.00 0.21 0.17 0.00 0.06
Dry Peas 154.50 921.90 0.00 0.00 0.00 0.00 0.00 0.00 0.00 0.00 0.00
0.25 0.34 0.00 0.00 0.00 0.00 0.00 0.00 0.00 0.00 0.00
Millet 0.00 0.00 0.00 0.00 0.00 0.00 126.70 0.00 0.00 0.00 0.00
0.00 0.00 0.00 0.00 0.00 0.00 0.21 0.00 0.00 0.00 0.00
Other Receipts 0.00 20.70 17.50 11.00 0.00 9.00 9.00 0.00 0.00 5.60 7.50
0.00 0.01 0.05 0.04 0.00 0.03 0.02 0.00 0.00 0.01 0.01
2016 Planted Acres**
Total 2,000.00 7,600.00 2,500.00 2,150.00 4,200.00 1,987.50 3,930.00 2,000.00 5,300.00 3,000.00 4,980.00
Wheat 1,320.00 4,950.00 2,000.00 1,950.00 4,200.00 1,012.50 1,900.00 1,000.00 3,445.00 1,500.00 1,820.00
0.66 0.65 0.80 0.91 1.00 0.51 0.48 0.50 0.65 0.50 0.37
Grain Sorghum 0.00 0.00 0.00 0.00 0.00 0.00 0.00 333.00 265.00 500.00 740.00
0.00 0.00 0.00 0.00 0.00 0.00 0.00 0.17 0.05 0.17 0.15
Barley 140.00 0.00 0.00 0.00 0.00 0.00 0.00 0.00 0.00 0.00 0.00
0.07 0.00 0.00 0.00 0.00 0.00 0.00 0.00 0.00 0.00 0.00
Corn 0.00 0.00 0.00 0.00 0.00 675.00 890.00 333.00 795.00 1,000.00 2,290.00
0.00 0.00 0.00 0.00 0.00 0.34 0.23 0.17 0.15 0.33 0.46
Soybeans 0.00 0.00 0.00 0.00 0.00 0.00 0.00 334.00 795.00 0.00 130.00
0.00 0.00 0.00 0.00 0.00 0.00 0.00 0.17 0.15 0.00 0.03
Dry Peas 540.00 2,400.00 0.00 0.00 0.00 0.00 0.00 0.00 0.00 0.00 0.00
0.27 0.32 0.00 0.00 0.00 0.00 0.00 0.00 0.00 0.00 0.00
Millet 0.00 0.00 0.00 0.00 0.00 0.00 890.00 0.00 0.00 0.00 0.00
0.00 0.00 0.00 0.00 0.00 0.00 0.23 0.00 0.00 0.00 0.00
CRP 0.00 250.00 500.00 200.00 0.00 300.00 250.00 0.00 0.00 0.00 0.00
0.00 0.03 0.20 0.09 0.00 0.15 0.06 0.00 0.00 0.00 0.00
*Receipts for 2016 are included to indicate the relative importance of each enterprise to the farm. Percents
indicate the percentage of the total receipts accounted for by the livestock categories and the crops.
**Acreages for 2016 are included to indicate the relative importance of each enterprise to the farm. Total
planted acreage may exceed total cropland available due to double cropping. Percents indicate the percentage
of total planted acreage accounted for by the crop.

2016 CHARACTERISTICS OF PANEL FARMS PRODUCING COTTON TXSP2500 A 2,500-acre Texas South Plains (Dawson County) cotton farm that is moderate-sized for
the area. TXSP2500 plants 1,297 acres of cotton (1,012 dryland, 285 irrigated), 500 acres of grain sorghum (405 dryland, 95 irrigated), and 702 acres of peanuts (607 dryland, 95 irrigated). For 2016, 53 percent of receipts came from cotton.
TXSP4500 The Texas South Plains (Dawson County) is home to this 4,500-acre, large-sized cotton
farm that grows 4,047 acres of cotton (2,667 dryland, 1,380 irrigated), 225 irrigated peanuts, and 120 acres of wheat. Cotton sales comprised 81 percent of 2016 receipts.
TXEC5000 This 5,000-acre farm is located on the Eastern Caprock of the Texas South Plains
(Crosby County). Annually, 4,150 acres are planted to cotton (2,100 irrigated and 2,050 dryland), 550 acres to sorghum (250 irrigated and 300 dryland), and 300 acres to dryland wheat. In 2016, cotton sales accounted for 88 percent of gross receipts.
TXRP2500 TXRP2500 is a 2,500-acre cotton farm located in the Rolling Plains of Texas (Jones
County). This farm plants 1,000 acres of cotton and 1,000 acres of winter wheat each year. The area is limited by rainfall, and the farm uses a conservative level of inputs. Sixty-two percent of 2016 farm receipts came from cotton sales. Fifty head of beef cows generated ten percent of farm receipts.
TXMC1800 This 1,800-acre cotton farm is located on the Coastal Plain of southeast Texas (Wharton
County). TXMC1800 farms 348 acres of sorghum, 756 acres of cotton, and 696 acres of corn. In 2016, cotton sales comprised 56 percent of total cash receipts on this operation.
TXCB3000 A 3,000-acre cotton farm located on the Texas Coastal Bend (San Patricio County) that
farms 1,350 acres of cotton, 1,500 acres of sorghum, and 150 acres of corn annually. Sixty percent of 2016 cash receipts were generated by cotton.
TXCB9200 Nueces County, Texas is home to this 9,200-acre farm. Annually, 3,680 acres are planted
to cotton, 3,680 acres to sorghum, and 1,840 acres of corn. Cotton sales accounted for 54 percent of 2016 receipts.
TXVC4500 This 4,500-acre farm is located in the lower Rio Grande Valley of Texas (Willacy
County) and plants 1,395 acres to cotton (500 irrigated and 995 acres dryland), 2,880 acres to sorghum, and 225 acres to sugarcane. In 2016, 43 percent of TXVC4500’s cash receipts were generated by cotton sales.

Appendix Table A5. Characteristics of Panel Farms Producing Cotton.
TXSP2500 TXSP4500 TXEC5000 TXRP2500 TXMC1800 TXCB3000 TXCB9200 TXVC4500
County Dawson Dawson Crosby Jones Wharton San Patricio Nueces Willacy
Total Cropland 2,500.00 4,500.00 5,000.00 2,500.00 1,800.00 3,000.00 9,200.00 4,500.00
Acres Owned 500.00 900.00 1,000.00 875.00 180.00 600.00 920.00 1,500.00
Acres Leased 2,000.00 3,600.00 4,000.00 1,625.00 1,620.00 2,400.00 8,280.00 3,000.00
Pastureland
Acres Leased 0.00 0.00 0.00 700.00 0.00 0.00 0.00 0.00
Assets ($1000)
Total 1,308.00 3,110.00 4,345.00 1,203.00 1,718.00 2,451.00 5,433.00 6,097.00
Real Estate 447.00 1,026.00 1,401.00 941.00 666.00 1,527.00 2,439.00 4,323.00
Machinery 762.00 1,770.00 2,943.00 197.00 1,053.00 642.00 2,944.00 1,602.00
Other & Livestock 100.00 315.00 0.00 66.00 0.00 281.00 50.00 172.00
Debt/Asset Ratios
Total 0.19 0.19 0.29 0.31 0.41 0.16 0.25 0.14
Intermediate 0.24 0.24 0.28 0.06 0.29 0.19 0.27 0.08
Long Run 0.15 0.15 0.15 0.17 0.17 0.17 0.16 0.17
Number of Livestock
Beef Cows 0.00 0.00 0.00 50.00 0.00 0.00 0.00 0.00
2016 Gross Receipts ($1,000)*
Total 884.30 1,941.30 2,084.90 447.10 855.90 1,043.70 3,649.50 1,778.40
Cattle 0.00 0.00 0.00 45.10 0.00 0.00 0.00 0.00
0.00 0.00 0.00 0.10 0.00 0.00 0.00 0.00
Cotton 465.70 1,576.50 1,828.20 275.60 477.90 621.20 1,967.90 772.70
0.53 0.81 0.88 0.62 0.56 0.60 0.54 0.43
Grain Sorghum 47.40 0.00 60.30 0.00 83.70 263.60 724.80 610.10
0.05 0.00 0.03 0.00 0.10 0.25 0.20 0.34
Wheat 0.00 54.10 12.70 74.60 0.00 0.00 0.00 0.00
0.00 0.03 0.01 0.17 0.00 0.00 0.00 0.00
Corn 0.00 0.00 0.00 0.00 225.00 33.20 567.10 0.00
0.00 0.00 0.00 0.00 0.26 0.03 0.16 0.00
Peanuts 166.30 159.90 0.00 0.00 0.00 0.00 0.00 0.00
0.19 0.08 0.00 0.00 0.00 0.00 0.00 0.00
2016 Planted Acres**
Total 2,500.00 4,167.00 5,000.00 2,000.00 1,800.00 3,000.00 9,200.00 4,500.00
Cotton 1,297.50 3,717.00 4,150.00 1,000.00 756.00 1,350.00 3,680.00 1,395.00
0.52 0.89 0.83 0.50 0.42 0.45 0.40 0.31
Grain Sorghum 500.00 0.00 550.00 0.00 348.00 1,500.00 3,680.00 2,880.00
0.20 0.00 0.11 0.00 0.19 0.50 0.40 0.64
Wheat 0.00 225.00 300.00 1,000.00 0.00 0.00 0.00 0.00
0.00 0.05 0.06 0.50 0.00 0.00 0.00 0.00
Corn 0.00 0.00 0.00 0.00 696.00 150.00 1,840.00 0.00
0.00 0.00 0.00 0.00 0.39 0.05 0.20 0.00
Peanuts 702.50 225.00 0.00 0.00 0.00 0.00 0.00 0.00
0.28 0.05 0.00 0.00 0.00 0.00 0.00 0.00
*Receipts for 2016 are included to indicate the relative importance of each enterprise to the farm. Percents
indicate the percentage of the total receipts accounted for by the livestock categories and the crops.
**Acreages for 2016 are included to indicate the relative importance of each enterprise to the farm. Total
planted acreage may exceed total cropland available due to double cropping. Percents indicate the percentage
of total planted acreage accounted for by the crop.

2016 CHARACTERISTICS OF PANEL FARMS PRODUCING COTTON TNC2500 A 2,500-acre, moderate-sized West Tennessee (Fayette County) cotton farm. TNC2500
consists of 250 acres of cotton, 250 acres of grain sorghum, 1,250 acres of soybeans, 500 acres of corn, and 30 acres enrolled in CRP. Cotton accounted for 17 percent of 2016 gross receipts, with corn and soybeans contributing 19 percent and 41 percent, respectively.
TNC4050 TNC4050 is a 4,050-acre, large-sized West Tennessee (Haywood County) cotton farm.
This farm plants 2,025 acres of cotton, 1,425 acres of soybeans, 600 acres of corn, and 475 acres of wheat each year. During 2016, cotton sales generated 61 percent of gross receipts.
ALC3000 A 3,000-acre cotton farm located in northern Alabama (Lawrence County) that plants 300
acres to cotton, 1,200 acres to corn, 1,500 acres of soybeans and 1,200 acres to wheat (double cropped with soybeans) annually. This farm was early to adopt no-till cropping practices. Cotton sales accounted for 13 percent of total farm receipts during 2016.
GAC2300 Southwest Georgia (Decatur County) is home to a 2,300-acre cotton farm that plants
1,200 acres to cotton, 550 acres to peanuts, and 550 acres to corn. In 2016, farm receipts were comprised of cotton sales (44 percent), corn (17 percent), and peanut sales (22 percent). The farm also runs a 125-head beef cow herd, generating 4 percent of 2016 receipts.
SCC2000 SCC2000 is a moderate-sized, 2,000-acre grain farm in South Carolina (Calhoun County)
consisting of 650 acres of corn, 350 acres of cotton, 400 acres of peanuts, and 600 acres of soybeans. Fifteen percent of the farm’s receipts were from cotton sales during 2016.
NCC1700 This is a 1,700-acre cotton farm located on the upper coastal plain of North Carolina
(Wayne County). NCC1700 plants 225 acres of cotton, 330 acres of wheat, and 1,325 acres of soybeans annually. Cotton accounted for 16 percent of this farm’s 2016 receipts.
NCNP1600 A 1,600-acre diversified farm located in northern North Carolina (Edgecombe County).
NCNP1600 plants 320 acres of peanuts, 160 acres of corn, 560 acres of cotton, 560 acres of soybeans. Twenty-five percent of receipts for this farm came from peanut sales in 2016; the balance came from cotton and feedgrain/oilseed sales.

Appendix Table A6. Characteristics of Panel Farms Producing Cotton.
TNC2500 TNC4050 ALC3000 GAC2300 SCC2000 NCC1700 NCNP1600
County Fayette Haywood Lawrence Decatur Orangeburg Wayne Edgecombe
Total Cropland 2,500.00 4,050.00 3,000.00 2,300.00 2,000.00 1,700.00 1,600.00
Acres Owned 250.00 1,000.00 0.00 1,150.00 550.00 225.00 600.00
Acres Leased 2,250.00 3,050.00 3,000.00 1,150.00 1,450.00 1,475.00 1,000.00
Pastureland
Acres Owned 0.00 0.00 0.00 100.00 200.00 0.00 0.00
Acres Leased 0.00 0.00 0.00 100.00 0.00 0.00 0.00
Assets ($1000)
Total 2,118.00 6,689.00 3,530.00 9,730.00 3,796.00 2,754.00 3,976.00
Real Estate 804.00 4,852.00 568.00 7,284.00 2,276.00 1,382.00 2,476.00
Machinery 694.00 1,240.00 2,386.00 1,711.00 1,520.00 1,307.00 1,402.00
Other & Livestock 619.00 597.00 576.00 735.00 0.00 66.00 99.00
Debt/Asset Ratios
Total 0.07 0.27 0.25 0.26 0.27 0.37 0.39
Intermediate 0.05 0.33 0.33 0.35 0.32 0.31 0.35
Long Run 0.10 0.15 0.16 0.16 0.17 0.16 0.12
Number of Livestock
Beef Cows 0.00 0.00 0.00 125.00 0.00 0.00 0.00
2016 Gross Receipts ($1,000)*
Total 1,225.40 2,514.40 1,563.10 2,410.60 1,408.50 937.30 1,066.60
Cattle 0.00 0.00 0.00 94.60 0.00 0.00 0.00
0.00 0.00 0.00 0.04 0.00 0.00 0.00
Cotton 208.00 1,524.00 197.30 1,052.30 203.60 149.30 312.60
0.17 0.61 0.13 0.44 0.15 0.16 0.29
Grain Sorghum 70.90 0.00 0.00 0.00 0.00 0.00 0.00
0.06 0.00 0.00 0.00 0.00 0.00 0.00
Wheat 0.00 119.20 275.90 0.00 0.00 70.80 0.00
0.00 0.05 0.18 0.00 0.00 0.08 0.00
Soybeans 503.40 473.00 481.20 0.00 213.00 489.20 248.30
0.41 0.19 0.31 0.00 0.15 0.52 0.23
Corn 234.80 249.40 606.50 411.20 497.30 0.00 77.40
0.19 0.10 0.39 0.17 0.35 0.00 0.07
Peanuts 0.00 0.00 0.00 524.90 310.60 0.00 266.10
0.00 0.00 0.00 0.22 0.22 0.00 0.25
Other Receipts 194.30 4.00 0.00 0.00 9.00 210.00 0.00
0.01 0.00 0.00 0.00 0.01 0.22 0.00
2016 Planted Acres**
Total 2,280.00 4,525.00 4,200.00 2,500.00 2,000.00 1,880.00 1,600.00
Cotton 250.00 2,025.00 300.00 1,200.00 350.00 225.00 560.00
0.11 0.45 0.07 0.48 0.18 0.12 0.35
Grain Sorghum 250.00 0.00 0.00 0.00 0.00 0.00 0.00
0.11 0.00 0.00 0.00 0.00 0.00 0.00
Wheat 0.00 475.00 1,200.00 0.00 0.00 330.00 0.00
0.00 0.11 0.29 0.00 0.00 0.18 0.00
Soybeans 1,250.00 1,425.00 1,500.00 0.00 600.00 1,325.00 560.00
0.55 0.32 0.36 0.00 0.30 0.71 0.35
Corn 500.00 600.00 1,200.00 550.00 650.00 0.00 160.00
0.22 0.13 0.29 0.22 0.33 0.00 0.10
Peanuts 0.00 0.00 0.00 550.00 400.00 0.00 320.00
0.00 0.00 0.00 0.22 0.20 0.00 0.20
CRP 30.00 0.00 0.00 0.00 0.00 0.00 0.00
0.01 0.00 0.00 0.00 0.00 0.00 0.00
*Receipts for 2016 are included to indicate the relative importance of each enterprise to the farm. Percents
indicate the percentage of the total receipts accounted for by the livestock categories and the crops.
**Acreages for 2016 are included to indicate the relative importance of each enterprise to the farm. Total
planted acreage may exceed total cropland available due to double cropping. Percents indicate the percentage
of total planted acreage accounted for by the crop.

2016 CHARACTERISTICS OF PANEL FARMS PRODUCING RICE CAR550 CAR550 is a 550-acre moderate-sized rice farm in the Sacramento Valley of
California (Sutter and Yuba Counties) that plants 500 acres of rice annually. This farm generated 92 percent of 2016 gross receipts from rice sales.
CAR3000 This is a 3,000-acre rice farm located in the Sacramento Valley of California
(Sutter and Yuba Counties) that is large-sized for the region. CAR3000 plants 3,000 acres of rice annually. In 2016, 93 percent of total receipts were generated from rice sales.
CABR1300 The Sacramento Valley (Butte County) is home to CABR1300, a 1,300-acre rice
farm. CABR1300 harvests 1,200 acres of rice annually, generating 93 percent of 2016 farm receipts from rice sales.
CACR800 CACR800 is a 800-acre rice farm located in the Sacramento Valley of California
(Colusa County). This farm harvests 800 acres of rice each year. During 2016, 93 percent of farm receipts were realized from rice sales.
TXR1500 This 1,500-acre rice farm located west of Houston, Texas (Colorado County) is
moderate-sized for the region. TXR1500 harvests 600 acres of rice. The farm generated 86 percent of its receipts from rice during 2016.
TXR3000 TXR3000 is a 3,000-acre, large-sized rice farm located west of Houston, Texas
(Colorado County). This farm harvests 1,500 acres of rice annually. TXR3000 realized 89 percent of 2016 gross receipts from rice sales.
TXBR1800 The Texas Gulf Coast (Matagorda County) is home to this 1,800-acre rice farm.
TXBR1800 generally plants a third of its acres to rice annually and fallows the remainder. The farm generated 89 percent of its receipts from rice during 2016.
TXER3200 This 3,200-acre rice farm is located in the Texas Gulf Coast (Wharton County).
TXER3200 harvests 1,067 acres of rice each year. The farm also grows 107 acres of soybeans and 960 acres of corn annually. Sixty-eight percent of 2016 receipts came from rice sales.

Appendix Table A7. Characteristics of Panel Farms Producing Rice.
CAR550 CAR3000 CABR1300 CACR800 TXR1500 TXR3000 TXBR1800 TXER3200
County Sutter Sutter Butte Colusa Colorado Colorado Matagorda Wharton
Total Cropland 550.00 3,000.00 1,300.00 800.00 1,500.00 3,000.00 1,800.00 3,200.00
Acres Owned 275.00 769.00 520.00 320.00 405.00 0.00 0.00 640.00
Acres Leased 275.00 2,231.00 780.00 480.00 1,095.00 3,000.00 1,800.00 2,560.00
Assets ($1000)
Total 3,520.00 12,014.00 8,794.00 5,349.00 2,329.00 1,505.00 1,081.00 2,631.00
Real Estate 2,773.00 9,122.00 6,454.00 3,892.00 1,066.00 63.00 140.00 1,462.00
Machinery 747.00 2,892.00 1,620.00 371.00 1,001.00 1,036.00 914.00 1,169.00
Other & Livestock 0.00 0.00 719.00 1,086.00 261.00 407.00 26.00 0.00
Debt/Asset Ratios
Total 0.24 0.20 0.19 0.14 0.17 0.10 0.26 0.39
Intermediate 0.12 0.25 0.29 0.14 0.22 0.13 0.23 0.18
Long Run 0.18 0.17 0.19 0.15 0.14 0.15 0.00 0.17
2016 Gross Receipts ($1,000)*
Total 689.80 4,141.50 1,742.80 1,150.80 728.20 1,445.00 890.00 1,484.80
Rice 635.80 3,834.60 1,613.10 1,065.00 625.30 1,288.00 788.40 1,011.30
0.92 0.93 0.93 0.93 0.86 0.89 0.89 0.68
Soybeans 0.00 0.00 0.00 0.00 0.00 0.00 0.00 26.10
0.00 0.00 0.00 0.00 0.00 0.00 0.00 0.02
Corn 0.00 0.00 0.00 0.00 0.00 0.00 0.00 302.40
0.00 0.00 0.00 0.00 0.00 0.00 0.00 0.20
Other Receipts 0.00 0.00 0.00 0.00 10.00 5.00 0.00 0.00
0.00 0.00 0.00 0.00 0.01 0.00 0.00 0.00
2016 Planted Acres**
Total 500.00 3,000.00 1,200.00 800.00 600.00 1,500.00 1,200.00 2,134.00
Rice 500.00 3,000.00 1,200.00 800.00 600.00 1,500.00 1,200.00 1,067.00
1.00 1.00 1.00 1.00 1.00 1.00 1.00 0.50
Soybeans 0.00 0.00 0.00 0.00 0.00 0.00 0.00 107.00
0.00 0.00 0.00 0.00 0.00 0.00 0.00 0.05
Corn 0.00 0.00 0.00 0.00 0.00 0.00 0.00 960.00
0.00 0.00 0.00 0.00 0.00 0.00 0.00 0.45
*Receipts for 2016 are included to indicate the relative importance of each enterprise to the farm. Percents
indicate the percentage of the total receipts accounted for by the livestock categories and the crops.
**Acreages for 2016 are included to indicate the relative importance of each enterprise to the farm. Total
planted acreage may exceed total cropland available due to double cropping. Percents indicate the percentage
of total planted acreage accounted for by the crop.

2016 CHARACTERISTICS OF PANEL FARMS PRODUCING RICE LASR2000 A 2,000-acre southwest Louisiana (Acadia, Jeff Davis, and Vermilion parishes)
rice farm, LASR2000 is moderate-sized for the area. This farm harvests 1,000 acres of rice and 500 acres of soybeans. During 2016, 56 percent of gross receipts were generated from rice sales.
ARMR6500 ARMR6500 is a 6,500-acre diversified rice farm in southeast Arkansas (Desha
County) that plants 650 acres of rice, 3,900 acres of soybeans, and 1,950 acres of corn. For 2016, 11 percent of gross receipts came from rice sales, 30 percent from corn sales, and 55 percent from soybean sales.
ARSR3240 ARSR3240 is a 3,240-acre, large-sized Arkansas (Arkansas County) rice farm
that harvests 1,458 acres of rice, 1,458 acres of soybeans, and 324 acres of corn each year. Fifty percent of this farm’s 2016 receipts came from rice sales.
ARWR2500 East central Arkansas (Cross County) is home to this 2,500-acre rice farm.
Moderate-sized for the region, ARWR2500 annually plants 1,250 acres each to rice and soybeans. During 2016, rice sales generated 56 percent of gross receipts.
ARHR4000 ARHR4000 is a 4,000-acre large-sized northeast Arkansas (Lawrence County)
rice farm that annually harvests 2,400 acres of rice, 1,350 acres of soybeans, and 250 acres of corn. Rice sales accounted for 65 percent of 2016 farm receipts.
MSDR5000 MSDR5000 is a 5,000-acre Mississippi Delta (Bolivar County) rice farm that
annually harvests 1,667 acres of rice, 2,833 acres of soybeans, and 500 acres of corn. Rice sales accounted for 39 percent of 2016 farm receipts. Soybeans account for 47 percent and corn 10 percent of receipts.
MOBR4000 MOBR4000 is a 4,000-acre Missouri Bootheal (Pemiscot County) rice farm. The
farm annually harvests 1,320 acres of rice, 1,800 acres of soybeans and 880 acres of corn. Rice sales accounted for 43 percent of farm receipts in 2016.

Appendix Table A8. Characteristics of Panel Farms Producing Rice.
LASR2000 ARMR6500 ARSR3240 ARWR2500 ARHR4000 MSDR5000 MOBR4000
County Acadia Desha Arkansas Cross Lawrence Bolivar Pemiscot
Total Cropland 2,000.00 6,500.00 3,240.00 2,500.00 4,000.00 5,000.00 4,000.00
Acres Owned 200.00 1,200.00 648.00 1,250.00 1,000.00 3,000.00 1,000.00
Acres Leased 1,800.00 5,300.00 2,592.00 1,250.00 3,000.00 2,000.00 3,000.00
Assets ($1000)
Total 2,341.00 8,873.00 5,459.00 7,742.00 8,833.00 17,962.00 10,399.00
Real Estate 1,269.00 5,678.00 3,610.00 5,973.00 5,934.00 14,059.00 7,026.00
Machinery 1,072.00 3,154.00 1,849.00 1,724.00 2,843.00 3,716.00 3,373.00
Other & Livestock 0.00 41.00 0.00 45.00 55.00 186.00 0.00
Debt/Asset Ratios
Total 0.36 0.33 0.27 0.26 0.20 0.18 0.36
Intermediate 0.38 0.26 0.20 0.26 0.06 0.31 0.34
Long Run 0.17 0.17 0.16 0.14 0.15 0.15 0.15
2016 Gross Receipts ($1,000)*
Total 1,148.50 4,056.60 1,975.60 1,460.70 2,393.20 3,108.40 2,049.60
Rice 643.70 440.90 990.70 817.80 1,561.50 1,207.90 872.10
0.56 0.11 0.50 0.56 0.65 0.39 0.43
Soybeans 151.20 2,238.00 643.50 517.50 477.10 1,444.80 635.00
0.13 0.55 0.33 0.35 0.20 0.47 0.31
Corn 0.00 1,207.40 180.70 0.00 125.60 306.30 426.30
0.00 0.30 0.09 0.00 0.05 0.10 0.21
2016 Planted Acres**
Total 1,500.00 6,500.00 3,240.00 2,500.00 4,000.00 5,000.00 4,000.00
Rice 1,000.00 650.00 1,458.00 1,250.00 2,400.00 1,667.00 1,320.00
0.67 0.10 0.45 0.50 0.60 0.33 0.33
Soybeans 500.00 3,900.00 1,458.00 1,250.00 1,350.00 2,833.00 1,800.00
0.33 0.60 0.45 0.50 0.34 0.57 0.45
Corn 0.00 1,950.00 324.00 0.00 250.00 500.00 880.00
0.00 0.30 0.10 0.00 0.06 0.10 0.22
*Receipts for 2016 are included to indicate the relative importance of each enterprise to the farm. Percents
indicate the percentage of the total receipts accounted for by the livestock categories and the crops.
**Acreages for 2016 are included to indicate the relative importance of each enterprise to the farm. Total
planted acreage may exceed total cropland available due to double cropping. Percents indicate the percentage
of total planted acreage accounted for by the crop.

2016 CHARACTERISTICS OF PANEL FARMS PRODUCING MILK CAD2000 A 2,000-cow, large-sized central California (Tulare County) dairy, the farm plants
1,750 acres of hay/silage for which it employs custom harvesting. Milk sales generated 91 percent of 2016 total receipts.
WAD300 A 300-cow, moderate-sized northern Washington (Whatcom County) dairy. This
farm plants 250 acres of silage and generated 94 percent of its 2016 gross receipts from milk sales.
WAD850 An 850-cow, large-sized northern Washington (Whatcom County) dairy. This
farm plants 605 acres for silage annually. During 2016, 93 percent of this farm’s gross receipts came from milk.
IDD3000 A 3,000-cow, large-sized dairy located in the Magic Valley of Idaho (Twin Falls
County). This farm plants 1,250 acres of corn silage annually. Milk sales account for 93 percent of 2016 gross receipts.
NVD1000 A 1,000-cow, moderate-sized Nevada (Churchill County) dairy. This farm plants
375 acres of hay and 250 acres of corn silage annually. Milk sales accounted for 91 percent of NVD1000’s gross receipts for 2016.
TXND3800 A 3,800-cow, large-sized dairy located in the South Plains of Texas (Bailey
County). This farm plants 1,920 acres of corn silage annually. Milk sales account for 88 percent of 2016 gross receipts.
TXCD1500 A 1,500-cow, large-sized central Texas (Erath County) dairy, TXCD1500 plants
466 acres of silage and 308 acres of hay annually. During 2016, milk sales accounted for 90 percent of receipts.
TXED400 A 400-cow, moderate-sized northeast Texas (Hopkins County) dairy. This farm
has 400 acres of silage and 125 acres of hay. During 2016, milk sales represented 88 percent of annual receipts.
WID145 A 145-cow, moderate-sized eastern Wisconsin (Winnebago County) dairy, the
farm plants 210 acres of silage, 70 acres for hay, 140 acres of corn, and 130 acres of soybeans. Milk constituted 85 percent of this farm’s 2016 receipts.
WID1000 A 1000-cow, large-sized eastern Wisconsin (Winnebago County) dairy, the farm
plants 650 acres of hay, 650 acres of silage, and 600 acres of corn. Milk sales comprised 91 percent of the farm’s 2016 receipts.

Appendix Table A9. Characteristics of Panel Farms Producing Milk.
CAD2000 WAD300 WAD850 IDD3000 NVD1000 TXND3800 TXCD1500 TXED400 WID145 WID1000
County Tulare Whatcom Whatcom Twin Falls Churchill Bailey Erath HopkinsWinnebagoWinnebago
Total Cropland 1,200.00 250.00 605.00 1,500.00 200.00 1,920.00 616.00 950.00 600.00 2,000.00
Acres Owned 700.00 125.00 300.00 1,500.00 150.00 1,920.00 253.00 475.00 330.00 800.00
Acres Leased 500.00 125.00 305.00 0.00 50.00 0.00 363.00 475.00 270.00 1,200.00
Pastureland
Acres Owned 0.00 0.00 0.00 0.00 0.00 0.00 264.00 0.00 40.00 0.00
Assets ($1000)
Total 24,943.00 3,984.00 11,715.00 31,103.00 8,126.00 30,468.00 9,002.00 2,763.00 3,399.00 11,690.00
Real Estate 15,929.00 3,025.00 7,337.00 18,510.00 3,359.00 12,730.00 3,662.00 1,594.00 2,181.00 7,177.00
Machinery 1,573.00 260.00 981.00 1,129.00 619.00 2,258.00 1,497.00 356.00 784.00 1,243.00
Other & Livestock 7,442.00 700.00 3,397.00 11,464.00 4,149.00 15,480.00 3,843.00 813.00 434.00 3,269.00
Debt/Asset Ratios
Total 0.19 0.13 0.19 0.15 0.12 0.21 0.13 0.29 0.23 0.19
Intermediate 0.09 0.06 0.07 0.03 0.04 0.23 0.05 0.02 0.18 0.10
Long Run 0.23 0.14 0.25 0.20 0.22 0.25 0.24 0.25 0.25 0.26
Number of Livestock
Dairy Cows 2,000.00 300.00 850.00 3,000.00 1,000.00 3,800.00 1,500.00 400.00 145.00 1,000.00
Cwt Milk/Cow 267.00 227.00 282.00 273.00 261.00 237.00 211.00 152.00 276.00 290.00
2016 Gross Receipts ($1,000)*
Total 8,919.40 1,103.30 4,023.60 13,896.10 4,664.10 16,195.90 6,037.40 1,109.20 765.70 5,396.10
Milk 8,080.60 1,036.50 3,728.00 12,896.70 4,245.40 14,169.10 5,442.40 975.00 650.70 4,925.20
0.91 0.94 0.93 0.93 0.91 0.88 0.90 0.88 0.85 0.91
Dairy Cattle 817.10 66.70 295.70 999.50 418.60 1,992.00 595.10 134.20 64.10 380.40
0.09 0.06 0.07 0.07 0.09 0.12 0.10 0.12 0.08 0.07
Hay 0.00 0.00 0.00 0.00 0.00 0.00 0.00 0.00 16.50 0.00
0.00 0.00 0.00 0.00 0.00 0.00 0.00 0.00 0.02 0.00
Corn 0.00 0.00 0.00 0.00 0.00 0.00 0.00 0.00 0.50 66.60
0.00 0.00 0.00 0.00 0.00 0.00 0.00 0.00 0.00 0.01
Soybeans 0.00 0.00 0.00 0.00 0.00 0.00 0.00 0.00 24.70 0.00
0.00 0.00 0.00 0.00 0.00 0.00 0.00 0.00 0.03 0.00
2016 Planted Acres**
Total 1,750.00 250.00 605.00 1,250.00 625.00 1,920.00 774.00 600.00 600.00 2,000.00
Hay 750.00 0.00 0.00 0.00 375.00 0.00 308.00 200.00 70.00 650.00
0.43 0.00 0.00 0.00 0.60 0.00 0.40 0.33 0.12 0.33
Silage 1,000.00 250.00 605.00 1,250.00 250.00 1,920.00 466.00 400.00 210.00 650.00
0.57 1.00 1.00 1.00 0.40 1.00 0.60 0.67 0.35 0.33
Corn 0.00 0.00 0.00 0.00 0.00 0.00 0.00 0.00 140.00 600.00
0.00 0.00 0.00 0.00 0.00 0.00 0.00 0.00 0.23 0.30
Soybeans 0.00 0.00 0.00 0.00 0.00 0.00 0.00 0.00 130.00 0.00
0.00 0.00 0.00 0.00 0.00 0.00 0.00 0.00 0.22 0.00
*Receipts for 2016 are included to indicate the relative importance of each enterprise to the farm. Percents
indicate the percentage of the total receipts accounted for by the livestock categories and the crops.
**Acreages for 2016 are included to indicate the relative importance of each enterprise to the farm. Total
planted acreage may exceed total cropland available due to double cropping. Percents indicate the percentage
of total planted acreage accounted for by the crop.

2016 CHARACTERISTICS OF PANEL FARMS PRODUCING MILK (continued) NYWD500 A 500-cow, moderate-sized western New York (Wyoming County) dairy. This
farm plants 50 acres of corn, 950 acres of silage, and double crops 450 acres of haylage annually. Milk sales accounted for 93 percent of the gross receipts for this farm in 2016.
NYWD1200 A 1,200-cow, large-sized western New York (Wyoming County) dairy. This farm
plants 1,900 acres of silage and 200 acres of corn annually. Milk sales accounted for 92 percent of the gross receipts for this farm in 2016.
NYCD180 A 180-cow, moderate-sized central New York (Cayuga County) dairy. This farm
plants 50 acres of corn, and 350 acres of silage annually. Milk sales accounted for 89 percent of the gross receipts for this farm in 2016.
NYCD675 A 675-cow, large-sized central New York (Cayuga County) dairy. This farm
plants 1,225 acres of silage and 275 acres of corn annually. Milk sales accounted for 91 percent of the gross receipts for this farm in 2016.
VTD160 A 160-cow, moderate-sized Vermont (Washington County) dairy. VTD160
plants 25 acres of hay and 235 acres of silage annually. Milk accounted for 91 percent of the 2016 receipts for this farm.
VTD400 A 400-cow, large-sized Vermont (Washington County) dairy. This farm plants75
acres of hay and 975 acres of silage annually. Milk sales represent 81 percent of VTD400’s gross receipts in 2016.
MOGD550 A 550-cow, grazing dairy in southwest Missouri (Dade County), the farm grazes
cows on 460 acres of improved pasture cut for hay. The dairy uses minimal inputs with 9,000 lbs of milk per cow. Milk accounted for 89 percent of gross farm receipts for 2016.
MOGD400 A 400-cow, grazing dairy in southwest Missouri (Dade County), the farm grazes
cows on 280 acres of improved pasture. The dairy uses low inputs with 13,000 lbs of milk per cow. Milk accounted for 88 percent of gross farm receipts for 2016.
FLND550 A 550-cow, moderate-sized north Florida (Lafayette County) dairy. The dairy
grows 130 acres of hay and 600 acres of silage each year. All other feed requirements are purchased in a pre-mixed ration. Milk sales accounted for 91 percent of the farm receipts.
FLSD1750 A 1,750-cow, large-sized south central Florida (Okeechobee County) dairy,
FLSD1750 plants 300 acres of hay and 300 acres of silage annually. Milk sales represent 94 percent of 2016 total receipts.
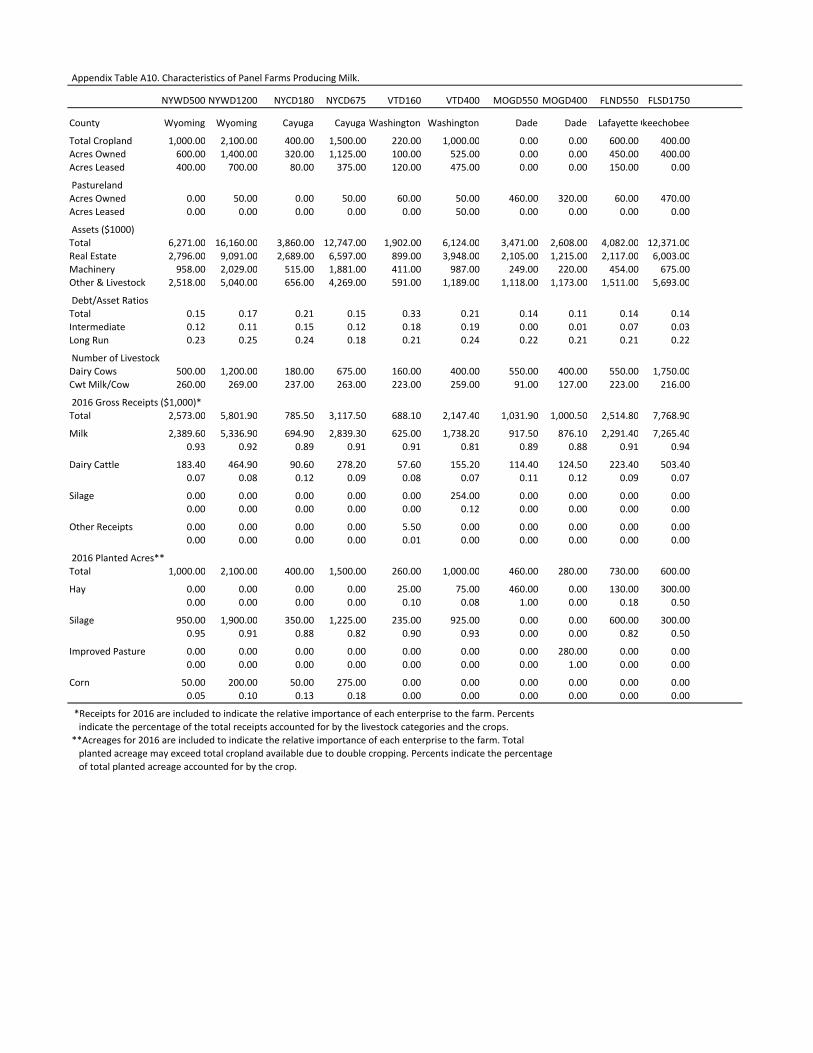
Appendix Table A10. Characteristics of Panel Farms Producing Milk.
NYWD500 NYWD1200 NYCD180 NYCD675 VTD160 VTD400 MOGD550 MOGD400 FLND550 FLSD1750
County Wyoming Wyoming Cayuga Cayuga Washington Washington Dade Dade LafayetteOkeechobee
Total Cropland 1,000.00 2,100.00 400.00 1,500.00 220.00 1,000.00 0.00 0.00 600.00 400.00
Acres Owned 600.00 1,400.00 320.00 1,125.00 100.00 525.00 0.00 0.00 450.00 400.00
Acres Leased 400.00 700.00 80.00 375.00 120.00 475.00 0.00 0.00 150.00 0.00
Pastureland
Acres Owned 0.00 50.00 0.00 50.00 60.00 50.00 460.00 320.00 60.00 470.00
Acres Leased 0.00 0.00 0.00 0.00 0.00 50.00 0.00 0.00 0.00 0.00
Assets ($1000)
Total 6,271.00 16,160.00 3,860.00 12,747.00 1,902.00 6,124.00 3,471.00 2,608.00 4,082.00 12,371.00
Real Estate 2,796.00 9,091.00 2,689.00 6,597.00 899.00 3,948.00 2,105.00 1,215.00 2,117.00 6,003.00
Machinery 958.00 2,029.00 515.00 1,881.00 411.00 987.00 249.00 220.00 454.00 675.00
Other & Livestock 2,518.00 5,040.00 656.00 4,269.00 591.00 1,189.00 1,118.00 1,173.00 1,511.00 5,693.00
Debt/Asset Ratios
Total 0.15 0.17 0.21 0.15 0.33 0.21 0.14 0.11 0.14 0.14
Intermediate 0.12 0.11 0.15 0.12 0.18 0.19 0.00 0.01 0.07 0.03
Long Run 0.23 0.25 0.24 0.18 0.21 0.24 0.22 0.21 0.21 0.22
Number of Livestock
Dairy Cows 500.00 1,200.00 180.00 675.00 160.00 400.00 550.00 400.00 550.00 1,750.00
Cwt Milk/Cow 260.00 269.00 237.00 263.00 223.00 259.00 91.00 127.00 223.00 216.00
2016 Gross Receipts ($1,000)*
Total 2,573.00 5,801.90 785.50 3,117.50 688.10 2,147.40 1,031.90 1,000.50 2,514.80 7,768.90
Milk 2,389.60 5,336.90 694.90 2,839.30 625.00 1,738.20 917.50 876.10 2,291.40 7,265.40
0.93 0.92 0.89 0.91 0.91 0.81 0.89 0.88 0.91 0.94
Dairy Cattle 183.40 464.90 90.60 278.20 57.60 155.20 114.40 124.50 223.40 503.40
0.07 0.08 0.12 0.09 0.08 0.07 0.11 0.12 0.09 0.07
Silage 0.00 0.00 0.00 0.00 0.00 254.00 0.00 0.00 0.00 0.00
0.00 0.00 0.00 0.00 0.00 0.12 0.00 0.00 0.00 0.00
Other Receipts 0.00 0.00 0.00 0.00 5.50 0.00 0.00 0.00 0.00 0.00
0.00 0.00 0.00 0.00 0.01 0.00 0.00 0.00 0.00 0.00
2016 Planted Acres**
Total 1,000.00 2,100.00 400.00 1,500.00 260.00 1,000.00 460.00 280.00 730.00 600.00
Hay 0.00 0.00 0.00 0.00 25.00 75.00 460.00 0.00 130.00 300.00
0.00 0.00 0.00 0.00 0.10 0.08 1.00 0.00 0.18 0.50
Silage 950.00 1,900.00 350.00 1,225.00 235.00 925.00 0.00 0.00 600.00 300.00
0.95 0.91 0.88 0.82 0.90 0.93 0.00 0.00 0.82 0.50
Improved Pasture 0.00 0.00 0.00 0.00 0.00 0.00 0.00 280.00 0.00 0.00
0.00 0.00 0.00 0.00 0.00 0.00 0.00 1.00 0.00 0.00
Corn 50.00 200.00 50.00 275.00 0.00 0.00 0.00 0.00 0.00 0.00
0.05 0.10 0.13 0.18 0.00 0.00 0.00 0.00 0.00 0.00
*Receipts for 2016 are included to indicate the relative importance of each enterprise to the farm. Percents
indicate the percentage of the total receipts accounted for by the livestock categories and the crops.
**Acreages for 2016 are included to indicate the relative importance of each enterprise to the farm. Total
planted acreage may exceed total cropland available due to double cropping. Percents indicate the percentage
of total planted acreage accounted for by the crop.

2016 CHARACTERISTICS OF PANEL RANCHES PRODUCING BEEF CATTLE NVB650 NVB650 is a 650-cow ranch located in northeastern Nevada (Elko County). The operation
consists of 1,300 acres of owned hay meadow and 8,725 acres of owned range, supplemented by 3,560 AUMs of public land. Each year, the ranch harvests 975 acres of hay. Annually, cattle sales represent all of the ranch’s receipts.
NVSB550 NVSB550 is a 550-cow ranch located in southeastern Nevada (Lincoln County). The operation
consists of 125 acres of owned hay meadow and 275 acres of owned range, supplemented by 6,600 AUMs of public land. Annually, cattle sales represent 94 percent of the ranch’s receipts.
MTB600 A 600-cow ranch located on the eastern plains of Montana (Custer County), MTB600 runs cows
on a combination of owned land and land leased from federal, state, and private sources. The ranch owns 14,000 acres of pasture. 800 acres of hay are produced annually. Also, all deeded acres are leased for hunting. Cattle sales represented 99 percent of this ranch’s 2016 receipts.
WYB475 This 475-cow ranch is located in north central Wyoming (Washakie County). The ranch leases
2750 AUMs from the U.S. Forest Service and owns 1,500 acres of range. Annually, the ranch harvests 330 acres of alfalfa and grass hay on owned ground. In 2016, cattle sales accounted for 86 percent of gross receipts.
COB275 This 275-cow ranch is located in northwestern Colorado (Routt County). Federal land provides
seven percent of the ranch’s grazing needs. The ranch owns 2,300 acres of rangeland, and the cattle graze federal land during the summer. Cattle sales accounted for 62 percent of the ranch’s 2016 total receipts.
NMB240 NMB240 is a 240-cow ranch located in northeastern New Mexico (Union County). During 2016,
93 percent of gross receipts were derived from cattle sales with the balance of receipts generated from fee hunting.
SDB500 SDB500 is a 500-cow West River (Meade County, South Dakota) beef cattle ranch. This
operation produces hay on 1,500 acres of owned cropland, and runs its cows on 6,000 acres of owned native range. In 2016, cattle sales accounted for 100 percent of gross receipts.
MOB250 A 250-cow beef cattle operation is the focal point of this diversified livestock and crop farm
located in southwest Missouri (Dade County). MOB250 plants 120 acres of corn, 120 acres of wheat, 160 acres of soybeans, and 280 acres of hay. Improved pasture makes up another 570 acres of this ranch. During 2016, cattle sales comprised 61 percent of gross receipts.
TXRB400 The western Rolling Plains of Texas (King County) is home to this 400-head cow-calf operation.
This ranch operates on 20,000 acres (half owned, half leased) of native range. Eighty-three percent of 2016 receipts came from cattle sales, while 17 percent came from fee hunting.
TXSB275 A 275-head cow-calf operation is the central focus of this full-time agricultural operation in south
central Texas (Gonzales County). Contract broiler production and hunting income are vital to the ranch’s viability. Cattle sales accounted for 87 percent of 2016 gross receipts.
FLB1155 This is a 1,155-cow ranch located in central Florida (Osceola County). FLB1155 runs cows on
5,400 acres of owned improved pasture, from which 3,560 acres of hay are harvested annually. Sales of sod are a burgeoning source of agricultural income for area ranches. During 2016, cattle sales represented 89 percent of total receipts.
OTHERS Five other representative farms have beef cattle operations along with their crop production
(MONG2300, TXHG2700, TXWG1600, TXRP2500, and GAC2300). These farming operations have from 40 to 300 cows. Cattle contributed from 4 to 21 percent of gross receipts for these farms in 2016.

Appendix Table A11. Characteristics of Panel Farms Producing Beef Cattle.
NVB650 NVSB550 MTB600 WYB475 COB275 NMB240 SDB500 MOB250 TXRB400 TXSB275 FLB1155
County Elko Lincoln Custer Washakie Routt Union Meade Dade King Gonzales Osceola
Total Cropland 1,300.00 125.00 0.00 330.00 650.00 0.00 1,500.00 280.00 0.00 0.00 5,400.00
Acres Owned 1,300.00 125.00 0.00 330.00 450.00 0.00 1,500.00 175.00 0.00 0.00 5,400.00
Acres Leased 0.00 0.00 0.00 0.00 200.00 0.00 0.00 105.00 0.00 0.00 0.00
Pastureland
Acres Owned 8,725.00 275.00 14,000.00 1,500.00 2,300.00 10,072.00 6,000.00 570.00 10,000.00 900.00 0.00
Acres Leased 0.00 0.00 0.00 0.00 0.00 2,261.00 700.00 280.00 10,000.00 775.00 0.00
Federal AUMs Leas 3,560.00 6,600.00 1,350.00 2,750.00 200.00 0.00 0.00 0.00 0.00 0.00 0.00
State/Private AUM 2,000.00 0.00 7,600.00 700.00 750.00 0.00 0.00 0.00 0.00 0.00 0.00
Assets ($1000)
Total 8,198.00 2,880.00 8,291.00 2,795.00 14,548.00 7,516.00 7,961.00 3,311.00 8,862.00 5,213.00 25,944.00
Real Estate 6,629.00 1,181.00 6,811.00 1,594.00 13,571.00 6,787.00 6,400.00 1,885.00 7,680.00 4,678.00 23,555.00
Machinery 466.00 423.00 359.00 350.00 455.00 156.00 475.00 342.00 145.00 140.00 259.00
Other & Livestock 1,103.00 1,276.00 1,121.00 851.00 522.00 573.00 1,086.00 1,084.00 1,037.00 394.00 2,130.00
Debt/Asset Ratios
Total 0.02 0.05 0.01 0.04 0.02 0.01 0.01 0.03 0.01 0.02 0.01
Intermediate 0.09 0.13 0.05 0.10 0.16 0.08 0.04 0.12 0.02 0.08 0.05
Long Run 0.01 0.01 0.01 0.01 0.01 0.01 0.01 0.01 0.01 0.01 0.01
Number of Livestock
Beef Cows 650.00 550.00 600.00 475.00 275.00 240.00 500.00 250.00 400.00 275.00 1,155.00
2016 Gross Receipts ($1,000)*
Total 596.50 545.40 456.00 453.10 252.20 252.10 362.80 357.90 458.50 255.20 848.70
Cattle 596.50 514.90 451.00 391.40 155.90 233.10 362.80 217.90 378.50 222.70 754.70
1.00 0.94 0.99 0.86 0.62 0.93 1.00 0.61 0.83 0.87 0.89
Corn 0.00 0.00 0.00 0.00 0.00 0.00 0.00 66.30 0.00 0.00 0.00
0.00 0.00 0.00 0.00 0.00 0.00 0.00 0.19 0.00 0.00 0.00
Soybeans 0.00 0.00 0.00 0.00 0.00 0.00 0.00 43.50 0.00 0.00 0.00
0.00 0.00 0.00 0.00 0.00 0.00 0.00 0.12 0.00 0.00 0.00
Wheat 0.00 0.00 0.00 0.00 0.00 0.00 0.00 21.50 0.00 0.00 0.00
0.00 0.00 0.00 0.00 0.00 0.00 0.00 0.06 0.00 0.00 0.00
Hay 0.00 30.50 0.00 51.70 87.80 0.00 0.00 0.00 0.00 0.00 0.00
0.00 0.06 0.00 0.11 0.35 0.00 0.00 0.00 0.00 0.00 0.00
Other Receipts 0.00 0.00 5.00 10.00 8.50 19.00 0.00 6.00 80.00 32.50 94.00
0.00 0.00 0.01 0.02 0.03 0.08 0.00 0.00 0.17 0.13 0.11
2016 Planted Acres**
Total 975.00 125.00 800.00 330.00 650.00 0.00 1,500.00 1,250.00 0.00 500.00 3,560.00
Corn 0.00 0.00 0.00 0.00 0.00 0.00 0.00 120.00 0.00 0.00 0.00
0.00 0.00 0.00 0.00 0.00 0.00 0.00 0.10 0.00 0.00 0.00
Soybeans 0.00 0.00 0.00 0.00 0.00 0.00 0.00 160.00 0.00 0.00 0.00
0.00 0.00 0.00 0.00 0.00 0.00 0.00 0.13 0.00 0.00 0.00
Wheat 0.00 0.00 0.00 0.00 0.00 0.00 0.00 120.00 0.00 0.00 0.00
0.00 0.00 0.00 0.00 0.00 0.00 0.00 0.10 0.00 0.00 0.00
Hay 975.00 125.00 800.00 330.00 650.00 0.00 1,500.00 280.00 0.00 100.00 3,560.00
1.00 1.00 1.00 1.00 1.00 0.00 1.00 0.22 0.00 0.20 1.00
*Receipts for 2016 are included to indicate the relative importance of each enterprise to the farm. Percents
indicate the percentage of the total receipts accounted for by the livestock categories and the crops.
**Acreages for 2016 are included to indicate the relative importance of each enterprise to the farm. Total
planted acreage may exceed total cropland available due to double cropping. Percents indicate the percentage
of total planted acreage accounted for by the crop.

APPENDIX B:
LIST OF PANEL FARM
COOPERATORS

FEED GRAIN FARMS (CONTINUED) Indiana Facilitators Mr. Scott Gabbard - Extension Educator, Shelby County, Purdue Cooperative Extension Panel Participants Mr. David Brown Mr. Kevin Carson Mr. Jerry Drake Mr. Gary Everhart Mr. Richard Fix Mr. Darrell Linville Mr. Mark Nigh Mr. Gary Robards Mr. Ken Simpson Mr. Doug Theobald Mr. Keith Theobald Mr. Jeremy Weaver Iowa Facilitators Mr. Jerry Chizek - County Extension Director, Webster County Panel Participants Mr. Robert Anderson Mr. Dean Black Mr. Perry Black Mr. A.J. Blair Mr. Brian Carver Mr. Jason Carver Mr. and Mrs. Jim Carver Mr. Kevin Carver Mr. Gregg Hora Mr. Larry Lane Mr. Todd Lundgren Mr. Robert Lynch Mr. William Secor Mr. Doug Stanek Mr. Jason Stanek Mr. Loren Wuebker Louisiana Facilitators Mr. Kurt Guidry - Professor, LSU Ag Center Panel Participants Mr. R. Berry Barham Mr. Jess Barr Mr. John Carroll Mr. Randy Miller Mr. Buddy Page Louisiana - Northeast Facilitators Mr. Kurt Guidry - Professor, LSU Ag Center Panel Participants Mr. Damian Bollich Mr. Mark Brown Mr. Fred Franklin Mr. Ed Greer Mr. Lindy Lingo Mr. Ed Patrick

FEED GRAIN FARMS (CONTINUED) Missouri - Central Facilitators Mr. Parman Green - Farm Management Specialist, University of Missouri-Columbia Panel Participants Mr. Joe Brockmeier Mr. Mark Casner Mr. Kyle Durham Mr. Dennis Germann Mr. Ron Gibson Mr. Todd Gibson Mr. Dale Griffith Mr. Jack Harriman Mr. Mike Hisle Mr. Preston Hisle Mr. Glenn Kaiser Mr. David Kipping Mr. Robert Kipping Mr. Gerald Kitchen Mr. Rob Korff Mr. Craig Linneman Mr. Ron Linneman Mr. Terry Reimer Mr. Mike Ritchhart Mr. James Wheeler Missouri - Northwest Panel Participants Mr. Jack Baldwin Mr. Gary Ecker Mr. Kevin Rosenbohm Mr. Roger Vest Nebraska - Central Facilitators Mr. Bruce Treffer - Extension Educator, Dawson County Panel Participants Mr. Jim Aden Mr. Rob Anderson Mr. Bart Beattie Mr. Jeremy Geiger Mr. Greg Hueftle Mr. Pat Luther Mr. Tim Maline Mr. Clark McPheeters Mr. Scott McPheeters Mr. Rod Reynolds Mr. Dave Rowe Mr. Paul Stieb Mr. Dan Strauss North Dakota Facilitators Dr. Dwight Aakre - Extension Associate-Farm Management, North Dakota State University Mr. Randy Grueneich - County Extension Agent, North Dakota State University Panel Participants Mr. Jim Broten Mr. Wade Bruns Mr. Mike Clemens Mr. Jack Formo Mr. Leland Guscette Mr. Raymond Haugen Mr. Greg Shanenko Mr. Anthony Thilmony Mr. Arvid Winkler

FEED GRAIN FARMS (CONTINUED) South Carolina Facilitators Dr. Todd Davis - Assistant Professor/Extension Economist, Clemson University Mr. Scott Mickey Panel Participants Mr. Troy Allen Ms. Vikki Brogdon Mr. Cag Brunson Mr. Chris Cogdill Mr. Harry DuRant Mr. Sam DuRant Mr. Jason Gamble Mr. Steven Gamble Mr. Barry Hutto Mr. Tommy Lee Mr. Joe McKeower Mr. John Michael Parimuha Tennessee Facilitators Mr. Ranson Goodman - Extension Agent & County Director, Henry County Mr. Jeff Lannom - Extension Agent & County Director, Weakley County Mr. Tim Smith - County Extension Agent, Obion County Panel Participants Mr. Jason Crabtree Mr. James S. Davis Mr. John Erwin Mr. Mike Freeman Mr. David Grant Mr. Wayne Grant Mr. Bob Grooms Mr. Donald Parker Mr. Doug Schoolfield Mr. Jamie Tuck Mr. Gilbert Workman, Jr. Texas - Northern Blackland Prairie Facilitators Mr. Ryan Collett - County Extension Agent, Hill County Mr. Marty Jungman - County Extension Agent, Hill County Panel Participants Mr. Justin Kaska Mr. Kenneth Machac Mr. Chad Radke Mr. John Sawyer Mr. Aaron Walters Texas - Northern High Plains Facilitators Dr. Steve Amosson - Extension Economist - Management, Texas A&M University Mr. Marcel Fischbacher - County Extension Agent, Moore County Panel Participants Mr. Kerry Cartrite Mr. Tommy Cartrite Mr. Brent Clark Mr. Justin Garrett Mr. Kelly Hays Mr. Casey Kimbrell Mr. Tom Moore Mr. H.D. Morton Mr. Stan Spain Mr. Wesley Spurlock Mr. Darren Stallwitz Mr. Dee Vaughan Mr. Willie Wieck Ms. Linda Williams

FEED GRAIN FARMS (CONTINUED) Texas - Panhandle Facilitators Mr. Rick Auckerman - County Extension Agent, Texas Cooperative Extension Mr. Michael Clayman - Regional Vice President, First Ag Credit Panel Participants Mr. Michael Carlson Mr. Roy Carlson Mr. Greg Chavez Mr. Steve Hoffman Mr. Bob Meyer Mr. Harold Sides Texas - Southern Blackland Prairie Facilitators Mr. Dustin Coufal - County Extension Agent, Williamson County Panel Participants Mr. Terry Pekar Mr. Herbert Raesz Mr. Doug Schernik Mr. Ken Seggern Mr. Donald Stolte Texas - Southwest Facilitators Mr. Chet Smith - County Extension Agent, Uvalde County Panel Participants Mr. Jimmy Carnes Mr. Ralph Hesse Mr. Mark Landry Mr. Danny Parker

WHEAT FARMS Colorado Facilitators Mr. John Deering - Ag Business Agent, Colorado State University Mr. Dennis Kaan - Director, Golden Plains Area Extension, Colorado State University Panel Participants Mr. Rollie Deering Mr. Ward Deering Mr. David Foy Mr. William Harman Ms. Gisele Jefferson Mr. Terry Kuntz Mr. Dave Lillich Mr. Max Olsen Ms. Sara Olsen Mr. Ken Remington Mr. Craig Saxton Mr. Calvin Schaffert Mr. Harlan Schaffert Mr. Dave Wagers Mr. John Wright Kansas - Northwest Facilitators Dr. Dan O'Brien - Area Extension Director, Kansas State University Mr. Mark Wood - Extension Agricultural Economist, Kansas Farm Mgmt. Association Panel Participants Mr. Steve Busse Rich Calliham Mr. Richard Calliham Mr. Sam Crouse Mr. Dennis Franklin Mr. Lyman Goetsch Mr. Lee Juenemann Mr. Brian Laufer Mr. Lance Leebrick Mr. Harold Mizell Mr. Steve Schertz Kansas - South Central Facilitators Mr. Gary Cramer - County Extension Agent, Sedgwick County Mr. Johnny Roberts - County Extension Agent, Sumner County Panel Participants Mr. Dennis Gruenbacher Mr. Doug Hisken Mr. Kent Ott Mr. David Reichenberger Mr. Nick Steffen Troy & Julia Strnad Mr. Jim Stuhlsatz Mr. Tim Turek Mr. Robert White Montana - North Central Facilitators Mr. Lochiel Edwards Panel Participants Mr. Darin Arganbright Mr. Steve Bahnmiller Mr. Duane Beirwagen Mr. Will Roehm Mr. Dan Works Oregon - North Central Facilitators Jon Farquharson Panel Participants Mr. Dana Heideman Mr. Bill Jepsen Mr. Joe McElligott Mr. Craig Miles Mrs. Shannon Rust Mr. Tim Rust

WHEAT FARMS (CONTINUED) Washington Facilitators Mr. Aaron Esser - County Director, WSU Extension Panel Participants Mr. Dan Hille Mr. Allan Koch Mr. Mike Miller Mr. Tim Smith Mr. Steve Taylor Washington - Palouse Facilitators Dr. Janet Schmidt - Extension Faculty, Washington State University Mr. Steve Van Vleet - Extension Agronomist, Washington State University Panel Participants Mr. Ben Barstow Mr. Steve Camp Mr. Asa Clark Mr. Gavin Clark Mr. Scot Cocking Mr. Tom Cocking Mr. David Harlow Ms. Kenda Hergert Mr. Dean Kinzer Mr. Brian Largent Mr. Gary Largent Mr. Michael Largent Mr. Steve Mader Mr. Clark Miller Mr. Bruce Nelson Mr. Randy Suess Mr. David Swannack Mr. Del Teade Mr. Steve Teade Mr. Jon Whitman

COTTON FARMS Alabama Panel Participants Mr. James Blythe Mr. Paul Clark Dr. Steve Ford Mr. William Lee Ms. Larkin Martin Mr. Ron Terry Arkansas - Adams Land Co. Gin Facilitators Mr. Dave Freeze - CEA Mississippi County, U of Arkansas Cooperative Extension Mr. Ronnie Kennett Mr. Blake McClelland Ms. Jenny Stacks Dr. Brad Watkins - Research Assistant Professor, U. of Arkansas Cooperative Extension Panel Participants Mr. Chad Costner Mr. Heath Donner Mr. Todd Edwards Mr. Cole Hawkins Mr. Justin Hawkins Mr. Randy Jackson Mr. David Wildy Georgia - Southwest Facilitators Mr. Rome Ethredge - County Extension Coordinator, Seminole County Mr. Mitchell May - County Extension Coordinator, Decatur County Dr. Don Shurley - Professor/Economist - Cotton, University of Georgia Dr. Nathan Smith - Assistant Professor, Extension Economist, University of Georgia Panel Participants Mr. Andy Bell Mr. Jerry Jones Mr. Willard Mims Mr. Raymond Thompson North Carolina Facilitators Dr. Blake Brown Mr. Gary Bullen Mr. Kevin Johnson - County Extension Agent, Wayne County Panel Participants Mr. Landis Brantham, Jr. Mr. Willie Howell Mr. David B. Mitchell, Sr. Mr. Danny C. Pierce Mr. Craig West Mr. Bryant Worley South Carolina Facilitators Dr. Todd Davis - Assistant Professor/Extension Economist, Clemson University Mr. Scott Mickey Panel Participants Mr. James Bookhart Mr. Corrin F. "Bud" Bowers Mr. Johnny & Debbie Crider Mr. Jimmie Griner Mr. Henry Herndon Mr. Bates Houck Mr. Dean & Richard Hutto Mr. Doug Jarrell Mr. J. O. Patterson Mr. Jeff Sandifer Mr. Stephen Still

COTTON FARMS (CONTINUED) Tennessee Facilitators Mr. Jim Castellaw - Extension Area Specialist, Farm Management Dr. Chism Craig - University of Tennessee Mr. Chuck Danehower - Extension Area Specialist, Farm Management Mr. Chris Main - Cotton Specialist Ms. Tracey Sullivan - County Extension Agent, Haywood County Mr. Jeff Via - County Extension Director, Fayette County Panel Participants Mr. Harris Armour, III Mr. Chuck Dacus Mr. R. Morris English, Jr. Mr. Lee Graves Mr. Dewayne Hendrix Mr. Tom Karcher Mr. Allen King Mr. John King Mr. Travis Lonon Mr. William E. Powers Mr. Ronald Woods Texas - Coastal Bend Facilitators Mr. Duane Campion - County Extension Agent, San Patricio County and Aransas County Mr. Mark Miller - Chief Operations Officer, Texas AgFinance Mr. Jeff Nunley - Executive Director, South Texas Cotton & Grain Association Mr. John Parker - Vice President, Texas AgFinance Mr. Jeff Stapper - County Extension Agent, Nueces County Mr. Mac Young - Extension Specialist-Risk Management, Texas AgriLife Extension Panel Participants Mr. Travis Adams Mr. Marvin Beyer, Jr. Mr. Brad Bickham Mr. Jimmy Dodson Mr. Jon Gwynn Mr. Darrell Lawhon Mr. Larry McNair Mr. Andrew Miller Mr. Toby Robertson Mr. Darby Salge Mr. David Weaver Mr. Jon Whatley Texas - Eastern Caprock Facilitators Mr. Clay Miller - Vice President, Ag Texas Farm Credit Services Panel Participants Mr. Lloyd Arthur Mr. Brooks Ellison Mr. Edwin Moore Mr. Marvin Schoepf Texas - Mid Coast Facilitators Mr. Jeff Nunley - Executive Director, South Texas Cotton & Grain Association Mr. Jimmy Roppolo - General Manager, Farmers Co-op of El Campo Mr. Jimmy Schulz - Sales Coordinator, Farmers Co-op of El Campo Panel Participants Mr. Jimmy Barosh Mr. Keith Bram Mr. Brent Cerny Mr. Glenn Emshosf Mr. Daniel Gavranovic Mr. Rob Kainer Mr. Cedric Popp Mr. Michael Popp

COTTON FARMS (CONTINUED) Texas - Rio Grande Valley Facilitators Mr. Omar Gonzales - County Extension Agent Mr. Luis Ribera - District Economist, Texas Cooperative Extension Panel Participants Mr. Gary Busse Mr. Derrick Swanberg Mr. Marshall Swanberg Mr. Mark Willis Texas - Rolling Plains Facilitators Mr. Steven Estes - County Extension Agent, Texas AgriLife Extension Panel Participants Mr. Rex Ford Mr. Kelly Head Mr. Michael McLellan Mr. Brian Sandbothe Mr. Mike Sloan Mr. Dale Spurgin Mr. Ferdie Walker Mr. Terry White Texas - Southern High Plains Facilitators Dr. Jackie Smith - Extension Economist - Management, Texas A&M University Mr. Jeff Wyatt - County Extension Agent, Dawson County Panel Participants Mr. Steven Archer Mr. Brad Boyd Mr. Andy Bratcher Mr. Terry Coleman Mr. Will Cozart Mr. Kirk Tidwell Mr. Johnny Ray Todd Mr. Donald Vogler Mr. David Warren

RICE FARMS Arkansas Facilitators Mr. Steve Kelley Mr. Wes Kirkpatrick - County Agent, U. of Arkansas Cooperative Extension Dr. Brad Watkins - Research Assistant Professor, U. of Arkansas Cooperative Extension Panel Participants Mr. Jeff Keeter Mr. Joe Mencer Mr. Matt Miles Mr. Jim Whitaker Mr. Sam Whitaker Arkansas - East Central-Arkansas County Facilitators Mr. Chuck Capps Mr. Bill Free - Riceland Foods, Inc. Dr. Brad Watkins - Research Assistant Professor, U. of Arkansas Cooperative Extension Panel Participants Mr. Derek Bohanan Mr. Monty Bohanan Mr. Jerry Burkett Mr. Dusty Hoskyn Mr. David Jessup Arkansas - East Central-Cross County Facilitators Dr. Brad Watkins - Research Assistant Professor, U. of Arkansas Cooperative Extension Mr. Rick Wimberley - County Extension Agent - Staff Chair, U. of Arkansas Cooperative Panel Participants Mr. Corbin Brown Mr. John Cooper Mr. Byron Holmes, Jr. Mr. Keith Lockley Mr. Bryan Moery Mr. Roger Pohlner Arkansas - Northeast-Lawrence County Facilitators Mr. Mike Andrews Mr. Herb Ginn Dr. Brad Watkins - Research Assistant Professor, U. of Arkansas Cooperative Extension Panel Participants Mr. Greg Baltz Mr. Jeremy Baltz Mr. Kyle Baltz Mr. Hunter Burris Mr. Ricky Burris Mr. Terry Gray Mr. Tori Hicks Mr. Aaron Manning Mr. Bruce Manning Mr. Dwain Morris Mr. Ray Stone California - Butte County Facilitators Dr. Cass Mutters - Farm Advisor, University of California Panel Participants Mr. Ken Anderson Mr. Mike Boeger Mr. Lee Carrico Mr. Tom Coleman Mr. Eric Larrabee Mr. Brad Mattson Mr. Steve Rystrom Mr. Josh Sheppard Mr. Lance Tennis Mr. Eric Waterbury

RICE FARMS (CONTINUED) California - Colusa County Facilitators Dr. Cass Mutters - Farm Advisor, University of California Panel Participants Mr. Don Bransford Mr. Mike Lux Mr. Charles Marsh Mr. Joe Struckmeyer Mr. Robert Sutton California - Sutter County Facilitators Dr. Chris Greer - Farm Advisor, University of California Panel Participants Mr. Paul Baggett Mr. Steve Butler Mr. Jack DeWitt Mr. Scott Leathers Mr. Ned Lemenager Mr. Paul Lowery Mr. Walt Trevethan Mr. Scott Tucker Mr. Bob Van Dyke Mr. Wayne Vineyard Louisiana - Southwest-Acadiana Facilitators Mr. Barrett Courville - County Extension Agent, Acadia Parish Mr. Stuart Gauthier - County Extension Agent, Vermilion Parish Mr. Kurt Guidry - Professor, LSU Ag Center Mr. Allen Hogan - County Extension Agent, Jeff Davis Parish Panel Participants Mr. Tommy Faulk Mr. David Lacour Mr. Jackie Loewer Mr. Christian Richard Mr. Brian Wild Mr. Fred Zaunbrecher Missouri - Bootheel West Panel Participants Mr. Rodney Eaker Mr. Rusty Eaker Mr. John French Mr. Eric Patterson Mr. Frank Smody Mr. Mike Smody Mr. Brian Yarbro Texas - Bay City-Matagorda County Facilitators Mr. Brent Batchelor - County Extension Agent, Matagorda County Panel Participants Mr. Donnie Bulanek Mr. Mike Burnside Mr. Barrett Franz Mr. Billy Mann Mr. Curt Mowery Mr. Joey Sliva Mr. Paul Sliva Texas - Eagle Lake-Colorado County Panel Participants Mr. Andy Anderson Mr. Steve Balas Mr. Kenneth Danklefs Mr. W.A. "Billy" Hefner, III Mr. Jason Hlavinka Mr. Ira Lapham Mr. Patrick Pavlu Mr. Bryan Wiese

RICE FARMS (CONTINUED) Texas - El Campo-Wharton County Panel Participants Mr. L.G. Raun Mr. Layton Raun Mr. Glen Rod Mr. Robert Shoemate

DAIRY FARMS California Facilitators Mrs. Carol Collar - County Dairy Specialist, California Cooperative Extension Mr. Carl Matz Panel Participants Mr. Chuck Draxler Mr. Dino Giacomazzi Mr. James Netto Mr. Jason Starr Mr. Jeff Wilbur Mr. John Zonneveld Florida - North Facilitators Ms. Mary Sowerby - Regional Dairy Extension Specialist, UofF Extension Mr. Chris Vann - County Extension Agent, Lafayette County Panel Participants Mr. Eddie Fredriksson Mr. Johan Heijkoop Mr. Brack Jackson Mr. Seth Jackson Mr. Terry Reagan Florida - South Facilitators Mr. Ray Hodge Panel Participants Mr. Ben Butler Mr. Bob Butler Mr. Woody Larson Mr. Keith Rucks Mr. Sutton Rucks, Jr. Mr. Glynn Rutledge Mr. Bob Rydzewski Mr. Tom Watkins Idaho Facilitators Mr. Bob Naerebout - Executive Director, Idaho Dairymen's Association Mr. Rick Naerebout Panel Participants Mr. Mike Aardema Mr. James Boer Mr. Scott Haag Mr. Dan Kluth Mr. Arie Roeloffs Ms. Jeannie Wolverton Missouri Facilitators Mr. Stacey Hamilton - Dairy Specialist and Dade Co. Program Director Panel Participants Mr. Dale Carter Mr. Tony Finch Mr. Charles Fletcher Mr. Kevin Fletcher Mr. Clay McQuiddy Mr. Mike Meier Mr. Brian Patton Mr. Bernie Van Dalfsen Mr. Kevin Vanderpoel

DAIRY FARMS (CONTINUED) Nevada - Fallon Facilitators Mr. Bob Fletcher Dr. Tom Harris - Dept. of Resource Econ, University of Nevada Ms. Pam Powell - Extension Agent Panel Participants Mr. Pete Homma Mr. Newell Mills Mr. Alan Perazzo Mr. David Perazzo Mr. Charles Turner Mr. Jeff Whitaker New York - Western Facilitators Ms. Joan Petzen - Farm Business Mngt Specialist, Cornell Cooperative Extension Panel Participants Ms. Tammy Andrews Mr. Gerry Coyne Mr. Malachy Coyne Mr. Peter Dueppengiesser Ms. Kitty Dziedzic Mr. John Emerling Mr. Walter Faryna Mr. Tom and Bill Fitch Mr. Craig Harkins Mr. John Knopf Mr. Jeff Mulligan Ed & Jody Neal Mr. John Noble Mr. Steve Sondericker Mr. Ken Van Slyke Texas - Central Facilitators Dr. Jason Johnson - Area Economist, TexasAgriLIfe Extension Mr. Whit Weems - County Extension Agent, Erath County Panel Participants Mr. Frans Beukeboom Mr. Johann DeBoer Mr. Stanley Haedge Mr. Johan Koke Mr. Clemens Kuiper Mr. Henk Postmus Mr. Pete Whitefield Texas - Northeast Facilitators Mr. G. H. Cain - Dairy Farmers of America Mr. Ron Tosh - Field Supervisor, Dairy Farmers of America Dr. Mario Villarino - County Agent, Texas Cooperative Extension Panel Participants Mr. Alan Bullock Mr. Blake Fisher Mr. Don Smith Mr. Jerry Spencer Mr. Mark Sustaire Texas - South Plains Facilitators Ms. Janet Claborn - Director of Economic Development Mr. Curtis Preston - County Extension Agent Bailey County Panel Participants Mr. Tom Alger Mr. Larry Hancock Mr. David Lawerence Mr. Reed Mulliken Mr. Joe Osterkamp Mr. Bob Wade

DAIRY FARMS (CONTINUED) Vermont Facilitators Dr. Bob Parsons - Asst. Professor-Farm Management, University of Vermont Panel Participants Mr. Paul Bourbeau Mr. David Conant Mr. Ted Foster Mr. Kim Harvey Mr. Steven Jones Mrs. Polly McEwing Mr. Les Pike Mr. & Mrs. Stanley Scribner Mr. Onan Whitcomb Washington Facilitators Mr. Chris Benedict - Extension Faculty, Whatcom County Panel Participants Mr. Ed Blok Mr. Ron Bronsema Mr. Rod & Jon De Jong Mr. Larry DeHaan Mr. Ed Pomeroy Mr. Jeff Rainey Mr. Galen Smith Mr. John Steensma Mr. Harold Van Berkum Mr. Peter Vlas Wisconsin Facilitators Mr. Nick Schneider - County Agent, Winnebago County Agriculture Agent Panel Participants Mr. Ben Hesselink Mr. Mike Hesselink Ms. Linda Hodorff Mr. Matt Hunter Mr. Jim Kasten Mr. and Mrs. Charlie Knigge Mr. Pete Knigge Mr. Joe Kuehnl Mr. Larry Pollack Mr. John Ruedinger Mr. Rob Stone Mr. Dean Strauss Mr. Jason Vorpahl

BEEF PRODUCERS Colorado Facilitators Mr. Todd Hagenbuch - County Extension Agent, Routt County Panel Participants Mr. Doug Carlson Mr. Jay Fetcher Mr. Kurt Frentress Mr. Larry Monger Mr. Jim Rossi Mr. Wayne Shoemaker Florida Panel Participants Mr. Mike Adams Mr. Wes Carlton Mr. Alan Kelley Mr. Cary Lightsey Mr. Ralph Pelaez Mr. Bert Tucker Dr. Fred Tucker Mr. Wes Williamson Missouri - Southwest Facilitators Mr. Brian Gillen - Agricultural Science Instructor, Lockwood High School Panel Participants Mr. Steve Allison Mr. Chuck Daniel Mr. Scott Daniel Mr. Randall Erisman Mr. James A. Nivens Mr. Mike Theurer Mr. Gary D. Wolf Montana Facilitators Mr. Michael Schuldt - County Extension Agent, Custer County Panel Participants Mr. Clarence Brown Mr. Art Drange Mr. Levi Foreman Mr. Alyn Haughian Mr. Jeff Okerman Mr. Scot Robinson Mr. Andy Zook Nevada Facilitators Dr. Tom Harris - Dept. of Resource Econ, University of Nevada Ms. Desiree Seal Dr. Ron Torell - Custom A.I. & Ranch Consulting Panel Participants Mr. Tom Barnes Mr. and Mrs. Brad & Dani Dalton Mr. and Mrs. Jay Dalton Mr. Jon Griggs Mr. and Mrs. Mitch & Rhonda Mr. and Mrs. Sam Mori Mr. and Mrs. Ed Sarman Mr. and Mrs. Craig Spratling New Mexico Facilitators Mr. Blair Clavel - County Extension Director, Harding County Dr. Manny Encinias - Extension Beef Cattle Specialist, New Mexico State University Panel Participants Mr. Justin Bennett Mr. Damon Brown Mr. John Gilbert Mr. John Vincent Mr. Derek Walker

BEEF PRODUCERS (CONTINUED) South Dakota Facilitators Adele Harty Mr. Dan Oedekoven - Director, West River Agricultural Center, South Dakota State University Mr. Dave Ollila Mr. Ken Olson Ms. Shannon Sand Panel Participants Alan & Jill Bishop John & Lance Frei Mr. Lynn C. Frey Mr. Leo E. Grubl Mr. Wayne Oedekoven Mr. Larry Stomprud Texas - Rolling Plains Facilitators Mr. Stan Bevers - Extension Economist - Management, Texas A&M University Mr. Kevin Brendle - County Extension Agent, Dickens County Mr. Ryan Martin - County Extension Agent, Motley County Mr. Toby Oliver - County Extension Agent, King County Panel Participants Mr. Greg Arnold Hon. Duane Daniel Mr. Steve Drennan Mr. Leland Foster Mr. Glenn Springer Texas - South Facilitators Mr. Dwight Sexton - County Extension Agent, Gonzales County Panel Participants Mr. Steve Breitschopf Mr. Brian Fink Mr. Mitchell Hardcastle Mr. Michael Kuck Mr. William L. Quinney Wyoming Facilitators Mr. Jim Gill - Senior University Extension Educator, Washakie County Panel Participants Mr. Hugh Baird Mr. Tim Flitner Mr. Vance Lungren Mr. Dan Rice Mr. Gary Rice

PEANUT FARMS North Carolina - Elizabethtown Facilitators Dr. Blake Brown Mr. Gary Bullen Mr. Bob Sutter Panel Participants Mr. Robert Byrd Mr. Les Galloway Mr. Alex Jordan Mr. Dan Ward North Carolina - Rocky Mount Facilitators Dr. Blake Brown Mr. Gary Bullen Mr. Bob Sutter Panel Participants Mr. Clarke Fox Mr. Wayne Harrell Mr. Donnie White