Repower_Offshore Foundations for Wind Turbines_Current Trends for Jacket Substructures
32
Conference “Offshore Foundations for Wind Turbines” Current trends for jacket substructures Dr.-Ing. Marc Seidel REpower Systems SE
Transcript of Repower_Offshore Foundations for Wind Turbines_Current Trends for Jacket Substructures
Conference
“Offshore Foundations for
Wind Turbines”
Current trends for jacket
substructures
Dr.-Ing. Marc Seidel
REpower Systems SE
2
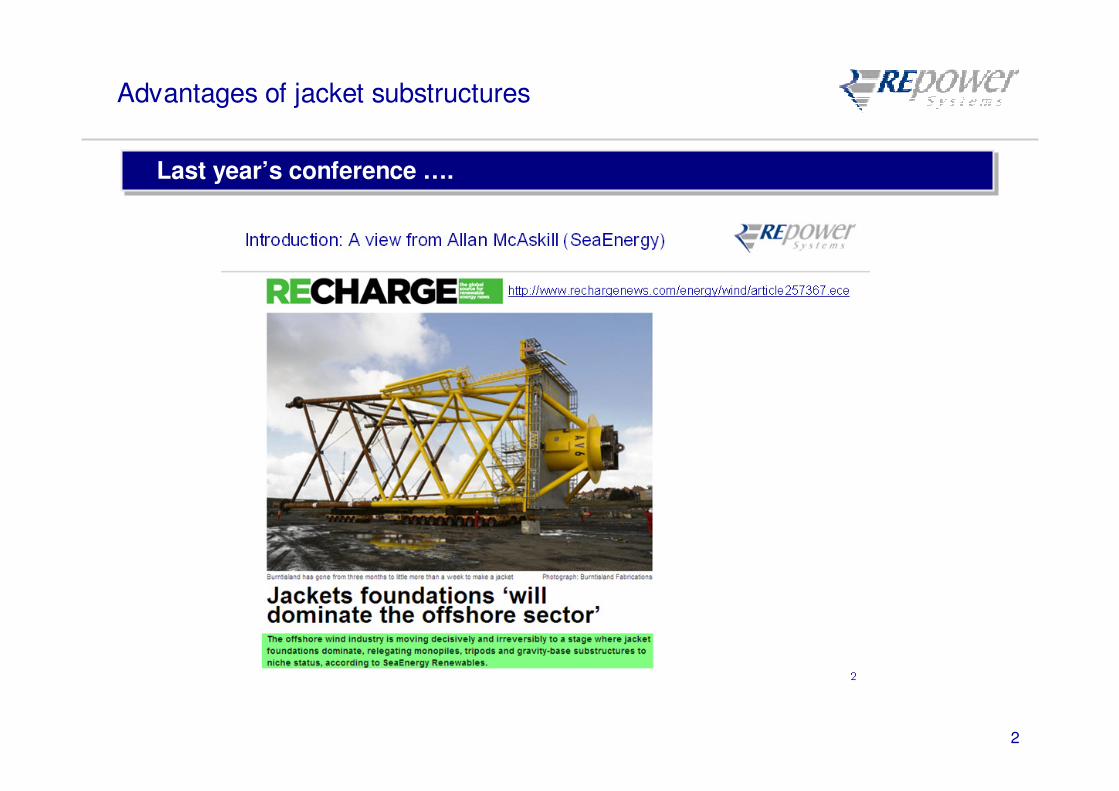
Advantages of jacket substructures
Last year’s conference ….Last year’s conference ….
3
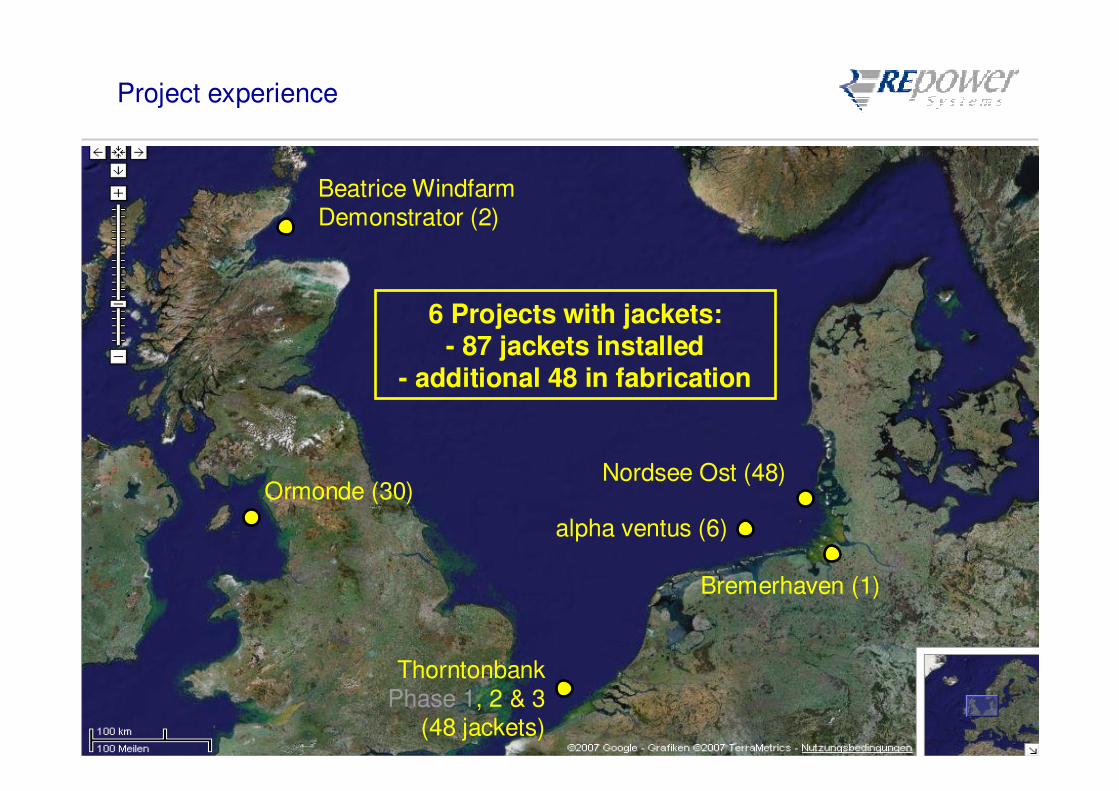
Project experience
Beatrice Windfarm Demonstrator (2)
ThorntonbankPhase 1, 2 & 3
(48 jackets)
alpha ventus (6)
Ormonde (30)
6 Projects with jackets: - 87 jackets installed
- additional 48 in fabrication
Nordsee Ost (48)
Bremerhaven (1)
4
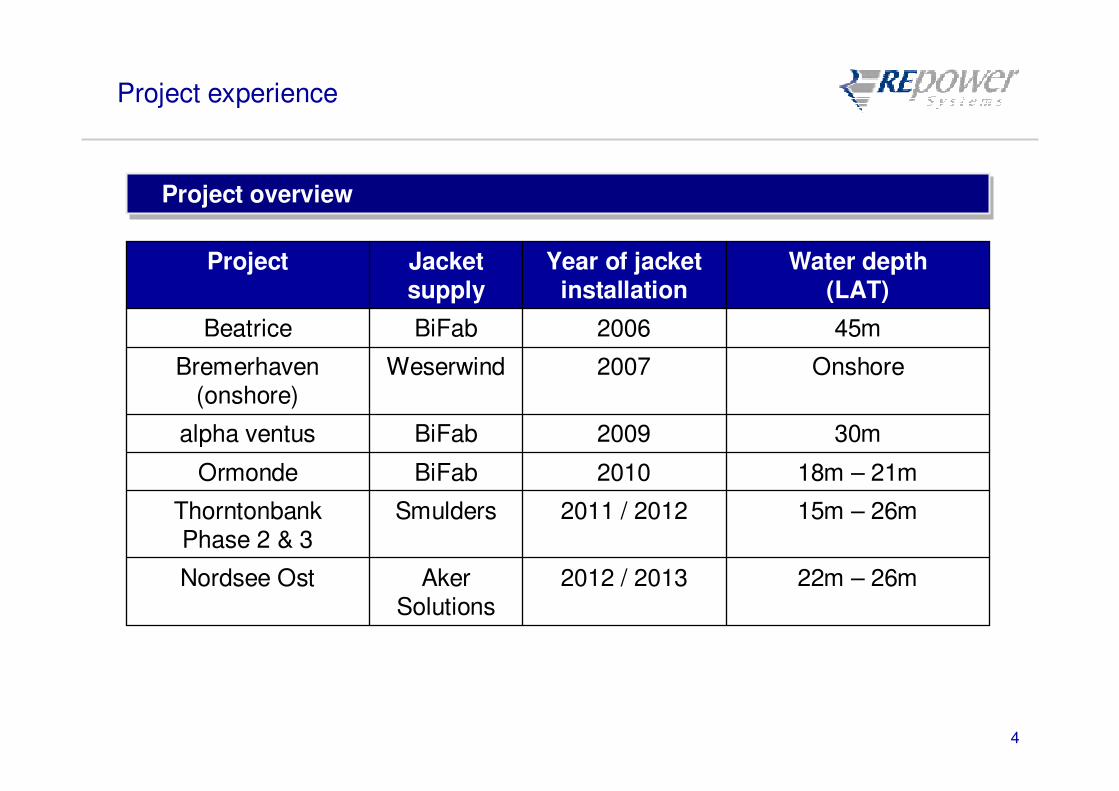
Project experience
22m – 26m2012 / 2013Aker Solutions
Nordsee Ost
15m – 26m2011 / 2012SmuldersThorntonbank Phase 2 & 3
18m – 21m2010BiFabOrmonde
30m2009BiFabalpha ventus
Onshore2007WeserwindBremerhaven (onshore)
45m2006BiFabBeatrice
Water depth (LAT)
Year of jacket installation
Jacket supply
Project
Project overviewProject overview
5
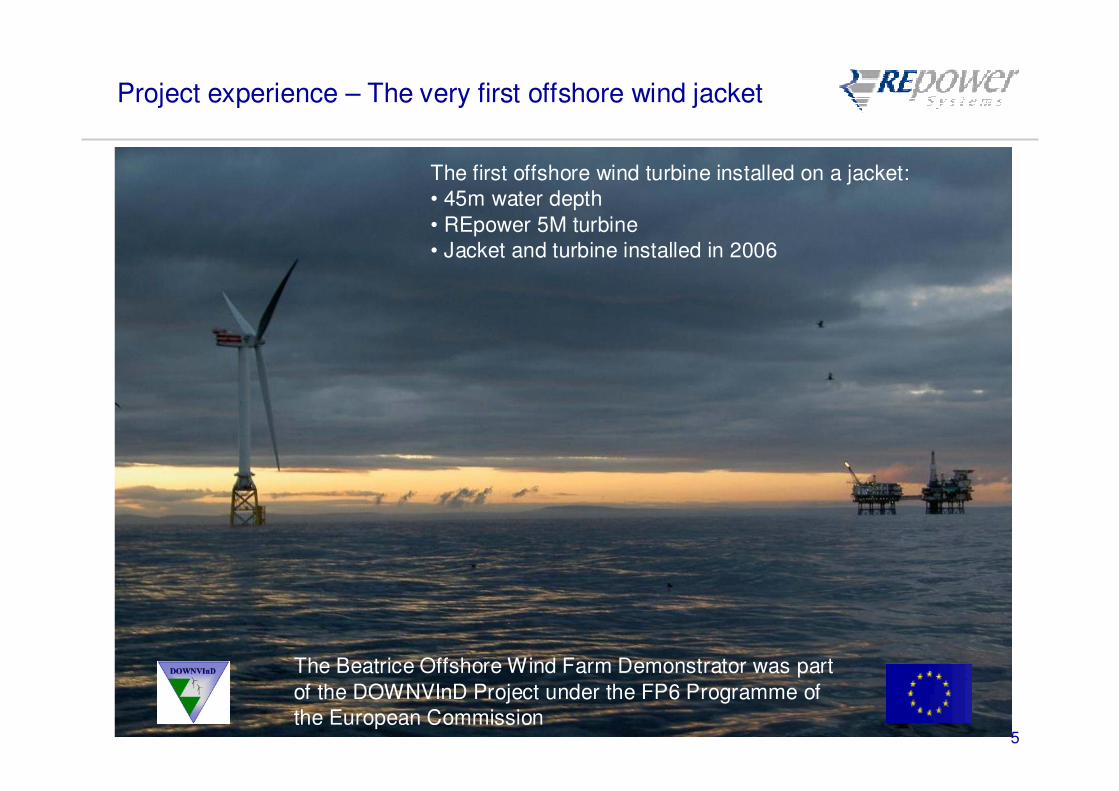
Project experience – The very first offshore wind jacket
The Beatrice Offshore Wind Farm Demonstrator was part
of the DOWNVInD Project under the FP6 Programme of
the European Commission
The first offshore wind turbine installed on a jacket:
• 45m water depth
• REpower 5M turbine
• Jacket and turbine installed in 2006

6
Project experience – Jackets for “Thorntonbank Phase 2”

7
Project experience – Jackets for “Thorntonbank Phase 2”
8
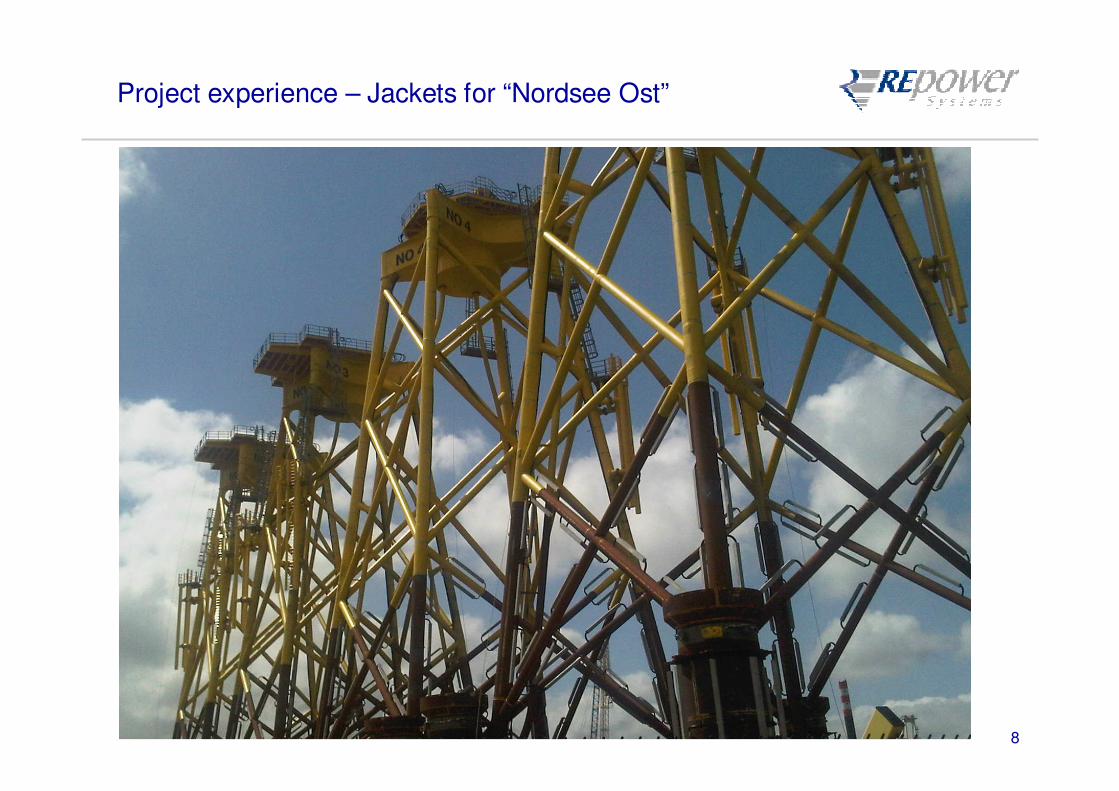
Project experience – Jackets for “Nordsee Ost”

99
Jacket fabrication
Market overview – capacities and plansMarket overview – capacities and plans
8050Emden, GermanySIAG
15030Hadrian Yard, Wallsend,
Tyne&Wear, UK
Offshore Group
Newcastle Limited
5050Aalborg, DKBladt Industries
Company Location Capacity 2012 Capacity 2016
AMBAU GmbH Cuxhaven, Germany 0 40 - 60
Burntisland
Fabrications LimitedBurntisland, UK 80 150
Weserwind Bremerhaven, Germany 80 80
Base case:- Jacket with footprint of 25 x 25m
- Total height: 65m - Weight incl. secondary structures (excl. piles): 650t
Base case:- Jacket with footprint of 25 x 25m
- Total height: 65m - Weight incl. secondary structures (excl. piles): 650t
10
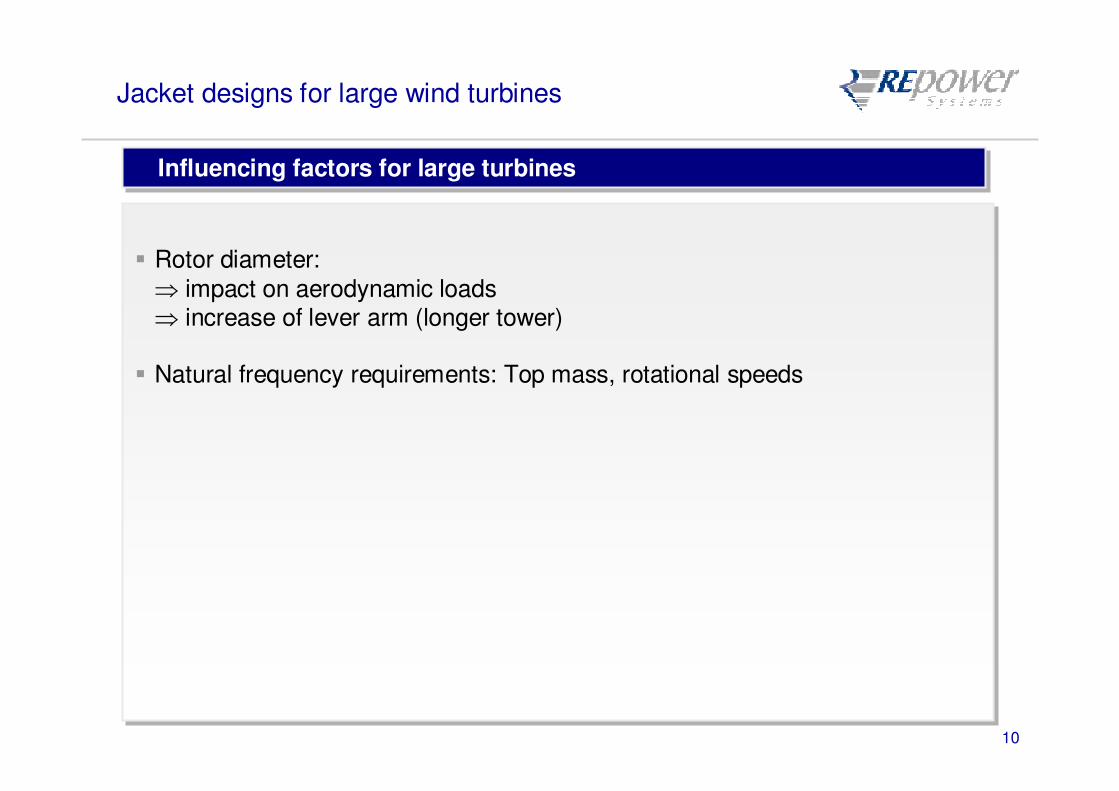
Jacket designs for large wind turbines
Influencing factors for large turbinesInfluencing factors for large turbines
Rotor diameter:
⇒ impact on aerodynamic loads⇒ increase of lever arm (longer tower)
Natural frequency requirements: Top mass, rotational speeds
Rotor diameter:
⇒ impact on aerodynamic loads⇒ increase of lever arm (longer tower)
Natural frequency requirements: Top mass, rotational speeds
11
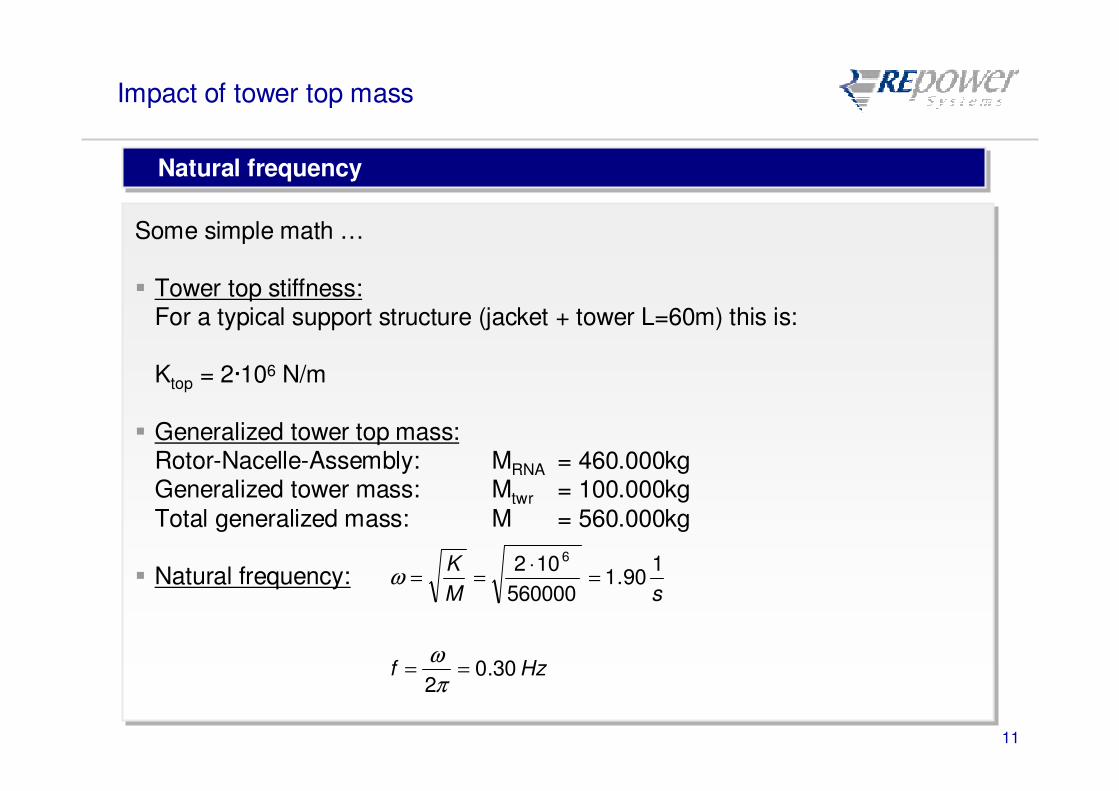
Impact of tower top mass
Natural frequencyNatural frequency
Some simple math …
Tower top stiffness:For a typical support structure (jacket + tower L=60m) this is:
Ktop = 2·106 N/m
Generalized tower top mass:Rotor-Nacelle-Assembly: MRNA = 460.000kgGeneralized tower mass: Mtwr = 100.000kg
Total generalized mass: M = 560.000kg
Natural frequency:
Some simple math …
Tower top stiffness:For a typical support structure (jacket + tower L=60m) this is:
Ktop = 2·106 N/m
Generalized tower top mass:Rotor-Nacelle-Assembly: MRNA = 460.000kgGeneralized tower mass: Mtwr = 100.000kg
Total generalized mass: M = 560.000kg
Natural frequency:
Hzf
sM
K
30.02
190.1
560000
102 6
==
=⋅
==
π
ω
ω

12
Impact of tower top mass
Frequency tuningFrequency tuning
First natural frequency shall be between 1p (rotational speed) and 3p (blade passing frequency) excitations
For f=0.30 Hz, this is ideally fulfilled for the REpower 6M rotational speed range, as
f1P,max = 12 rpm / 60s = 0.200 Hz
f3P,min = 7.5rpm / 60s · 3
= 0.375 Hz
First natural frequency shall be between 1p (rotational speed) and 3p (blade passing frequency) excitations
For f=0.30 Hz, this is ideally fulfilled for the REpower 6M rotational speed range, as
f1P,max = 12 rpm / 60s = 0.200 Hz
f3P,min = 7.5rpm / 60s · 3
= 0.375 Hz
0
0.2
0.4
0.6
0.8
1
1.2
0 0.1 0.2 0.3 0.4 0.5 0.6 0.7Frequency [Hz]
3p Range1p Range

13
Impact of tower top mass
Frequency tuningFrequency tuning
What happens for a REpower turbine, if we would have a lower top mass?
Assume: 100t less top mass, i.e. 460.000kg total generalized mass
Change in natural frequency:
A lower top mass would bring us closer to the limits, whichwould not be favourablefor the design!
What happens for a REpower turbine, if we would have a lower top mass?
Assume: 100t less top mass, i.e. 460.000kg total generalized mass
Change in natural frequency:
A lower top mass would bring us closer to the limits, whichwould not be favourablefor the design!
Hzf
sM
K
33.02
109.2
460000
102 6
==
=⋅
==
π
ω
ω
0
0.2
0.4
0.6
0.8
1
1.2
0 0.1 0.2 0.3 0.4 0.5 0.6 0.7Frequency [Hz]
3p Range1p Range
14
Impact of tower top mass
Frequency tuningFrequency tuning
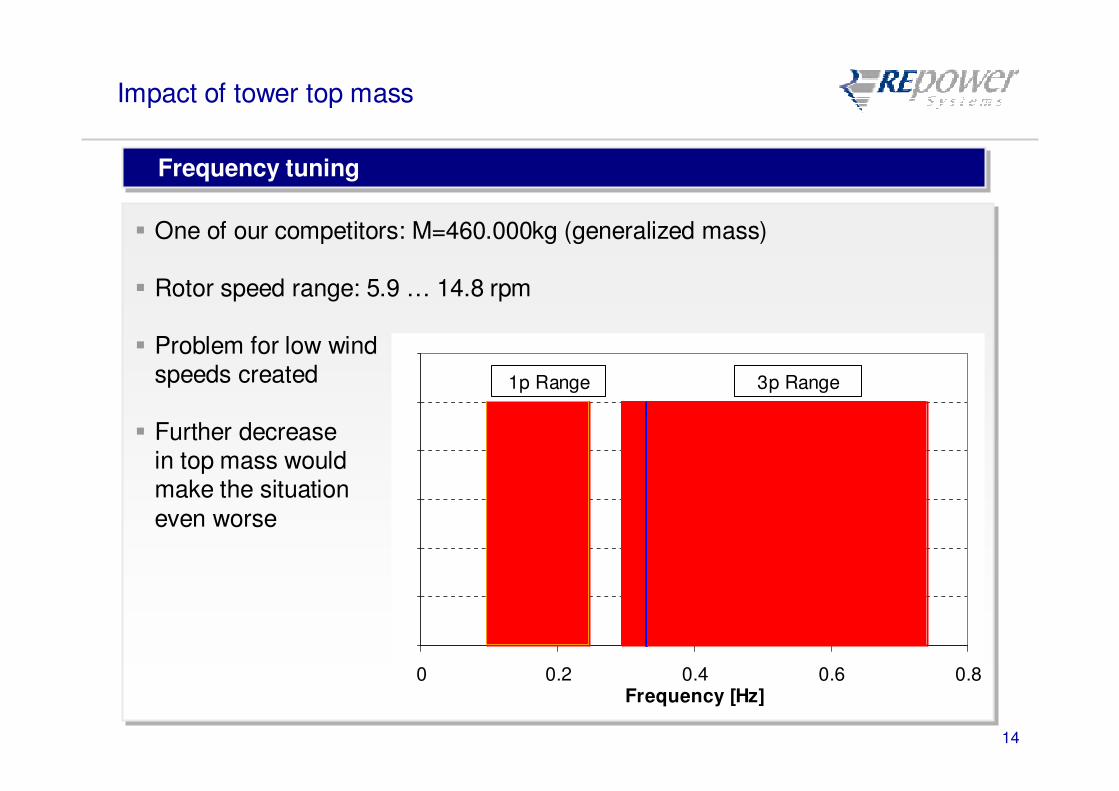
One of our competitors: M=460.000kg (generalized mass)
Rotor speed range: 5.9 … 14.8 rpm
Problem for low wind speeds created
Further decreasein top mass wouldmake the situation
even worse
One of our competitors: M=460.000kg (generalized mass)
Rotor speed range: 5.9 … 14.8 rpm
Problem for low wind speeds created
Further decreasein top mass wouldmake the situation
even worse
0
0.2
0.4
0.6
0.8
1
1.2
0 0.2 0.4 0.6 0.8Frequency [Hz]
3p Range1p Range

15
Impact of tower top mass
Impact on loads / costs for the substructureImpact on loads / costs for the substructure
Higher mass = higher loads = higher costs?
Some simple considerations:
If the support structure is infinitely stiff, then the impact on loads depends on the ratio of wind loads to dead weight
For the 6M at tower bottom:Dead weight – 6%Wind load – 94%
Hence, tower top weight is not significant in this case.
For a flexible system, it gets slightly more complicated
16
Impact of tower top mass
Impact on loads / costs for the substructureImpact on loads / costs for the substructure
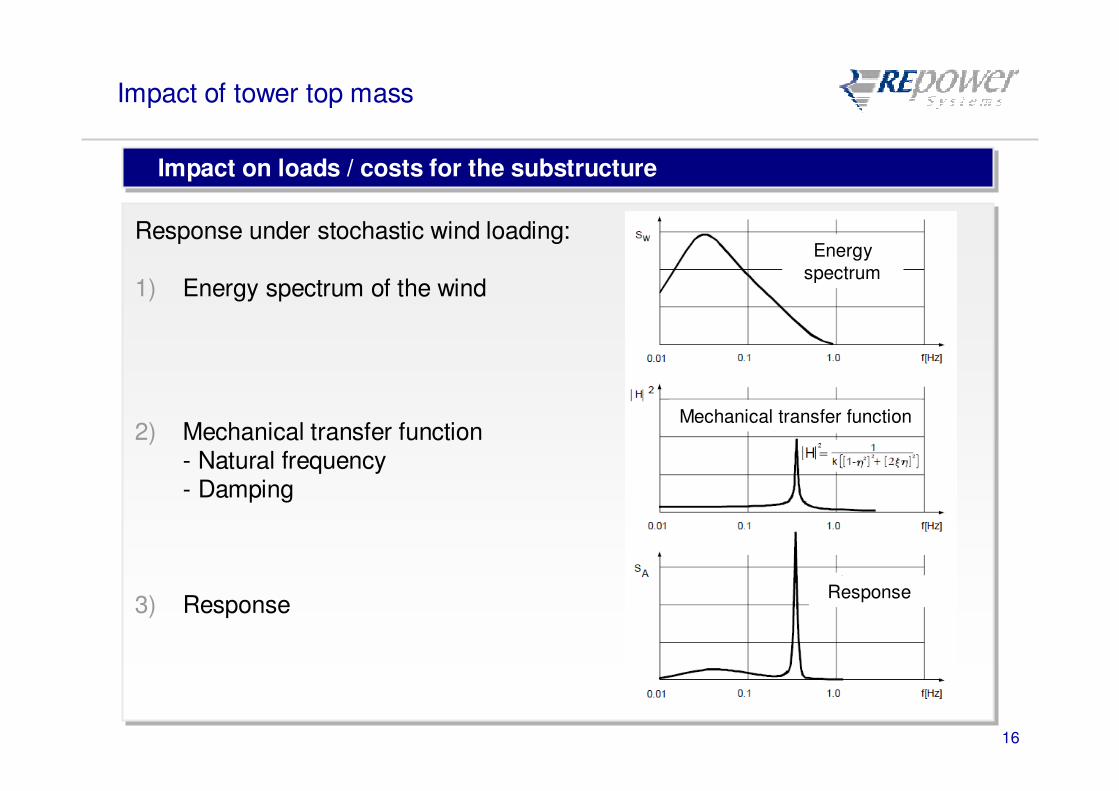
Response under stochastic wind loading:
1) Energy spectrum of the wind
2) Mechanical transfer function- Natural frequency- Damping
3) Response
Response under stochastic wind loading:
1) Energy spectrum of the wind
2) Mechanical transfer function- Natural frequency- Damping
3) Response
Energy
spectrum
Mechanical transfer function
Response
17
Impact of tower top mass
Impact on loads / costs for the substructureImpact on loads / costs for the substructure
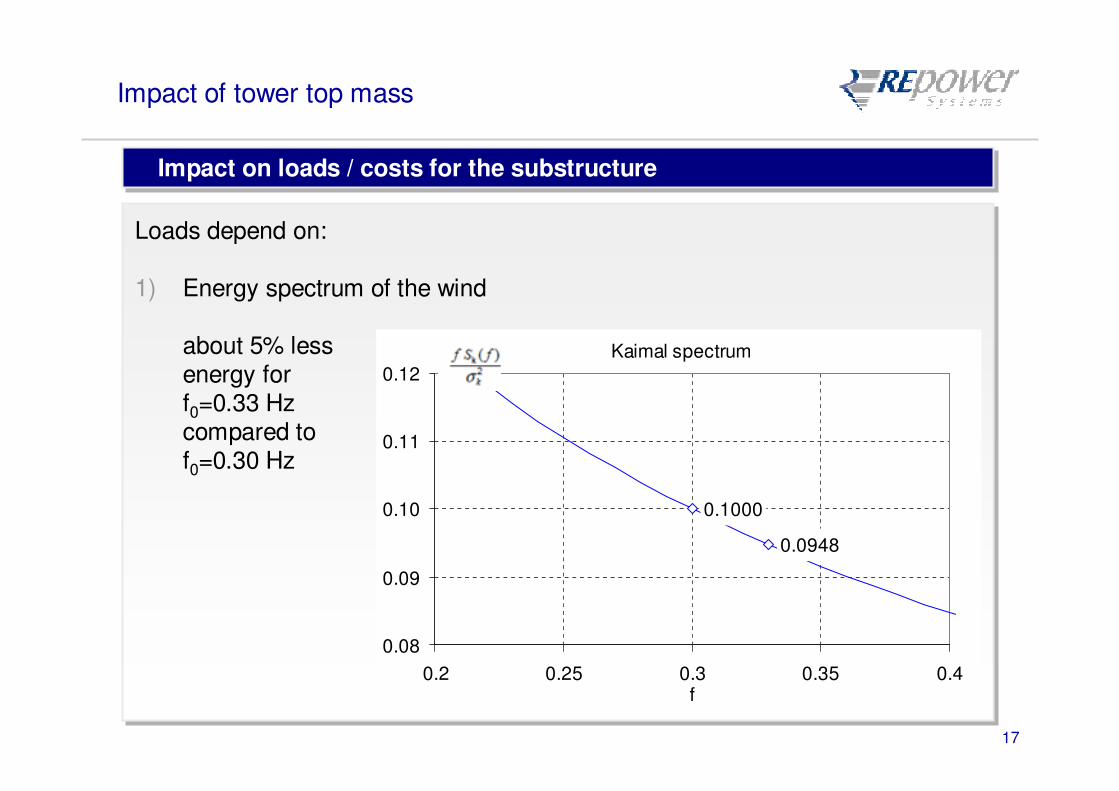
Loads depend on:
1) Energy spectrum of the wind
about 5% lessenergy for f0=0.33 Hz compared tof0=0.30 Hz
Loads depend on:
1) Energy spectrum of the wind
about 5% lessenergy for f0=0.33 Hz compared tof0=0.30 Hz
Kaimal spectrum
0.1000
0.0948
0.08
0.09
0.10
0.11
0.12
0.2 0.25 0.3 0.35 0.4f
18
Impact of tower top mass
Impact on loads / costs for the substructureImpact on loads / costs for the substructure
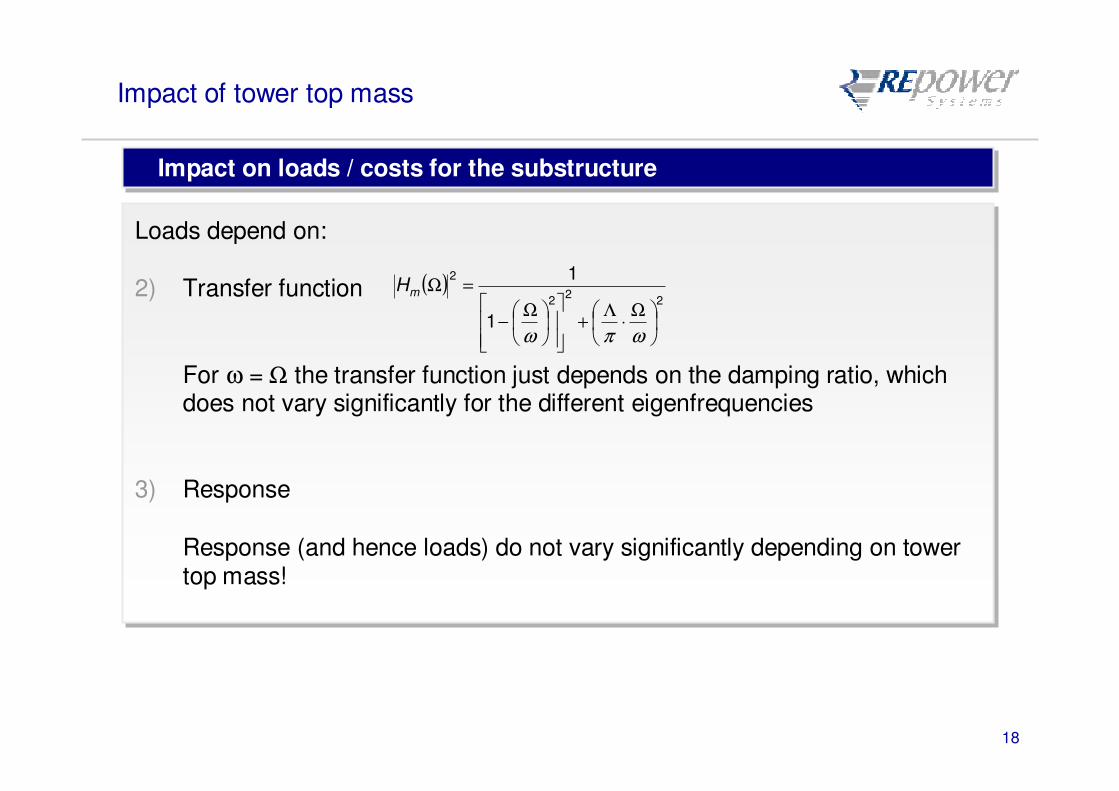
Loads depend on:
2) Transfer function
For ω = Ω the transfer function just depends on the damping ratio, which does not vary significantly for the different eigenfrequencies
3) Response
Response (and hence loads) do not vary significantly depending on tower top mass!
Loads depend on:
2) Transfer function
For ω = Ω the transfer function just depends on the damping ratio, which does not vary significantly for the different eigenfrequencies
3) Response
Response (and hence loads) do not vary significantly depending on tower top mass!
( )2
22
2
1
1
Ω⋅
Λ+
Ω−
=Ω
ωπω
mH
19
Impact of tower top mass
Impact on loads / costs for the substructureImpact on loads / costs for the substructure
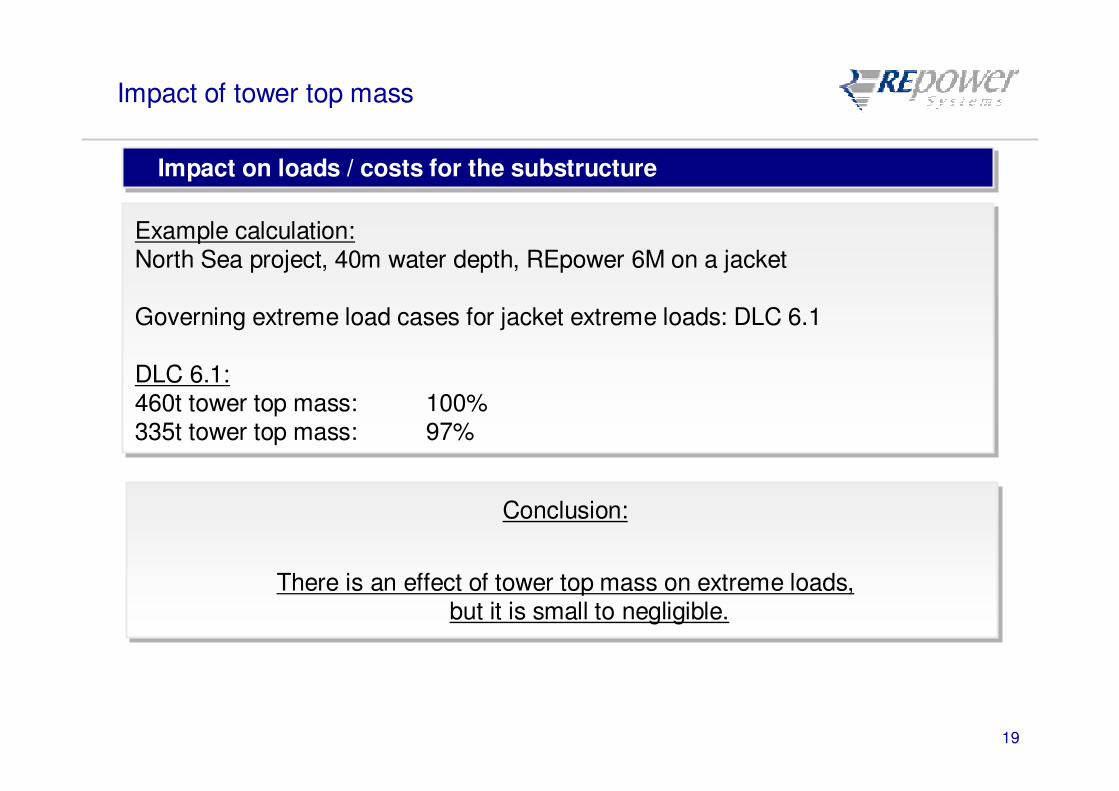
Example calculation:North Sea project, 40m water depth, REpower 6M on a jacket
Governing extreme load cases for jacket extreme loads: DLC 6.1
DLC 6.1:460t tower top mass: 100%335t tower top mass: 97%
Example calculation:North Sea project, 40m water depth, REpower 6M on a jacket
Governing extreme load cases for jacket extreme loads: DLC 6.1
DLC 6.1:460t tower top mass: 100%335t tower top mass: 97%
Conclusion:
There is an effect of tower top mass on extreme loads, but it is small to negligible.
Conclusion:
There is an effect of tower top mass on extreme loads, but it is small to negligible.
20
Impact of tower top mass
Impact on loads / costs for the substructureImpact on loads / costs for the substructure
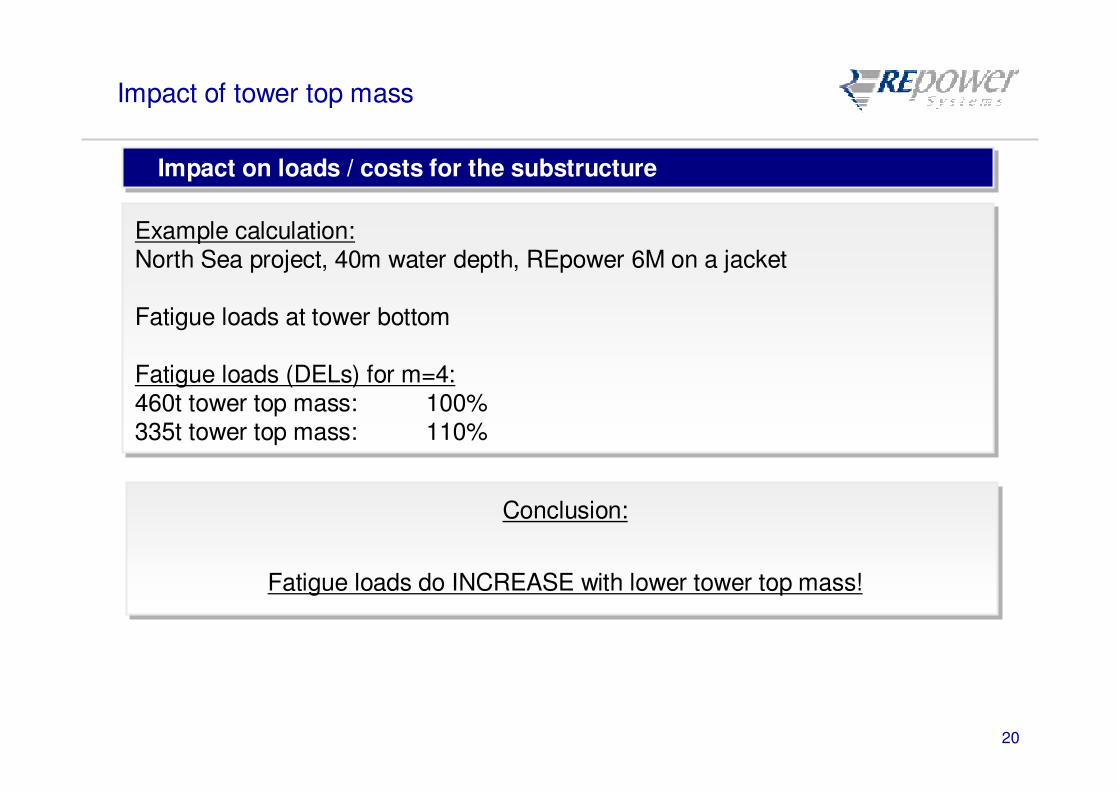
Example calculation:North Sea project, 40m water depth, REpower 6M on a jacket
Fatigue loads at tower bottom
Fatigue loads (DELs) for m=4:460t tower top mass: 100%335t tower top mass: 110%
Example calculation:North Sea project, 40m water depth, REpower 6M on a jacket
Fatigue loads at tower bottom
Fatigue loads (DELs) for m=4:460t tower top mass: 100%335t tower top mass: 110%
Conclusion:
Fatigue loads do INCREASE with lower tower top mass!
Conclusion:
Fatigue loads do INCREASE with lower tower top mass!
21
BSH requirements
Key issues for BSH approvalKey issues for BSH approval
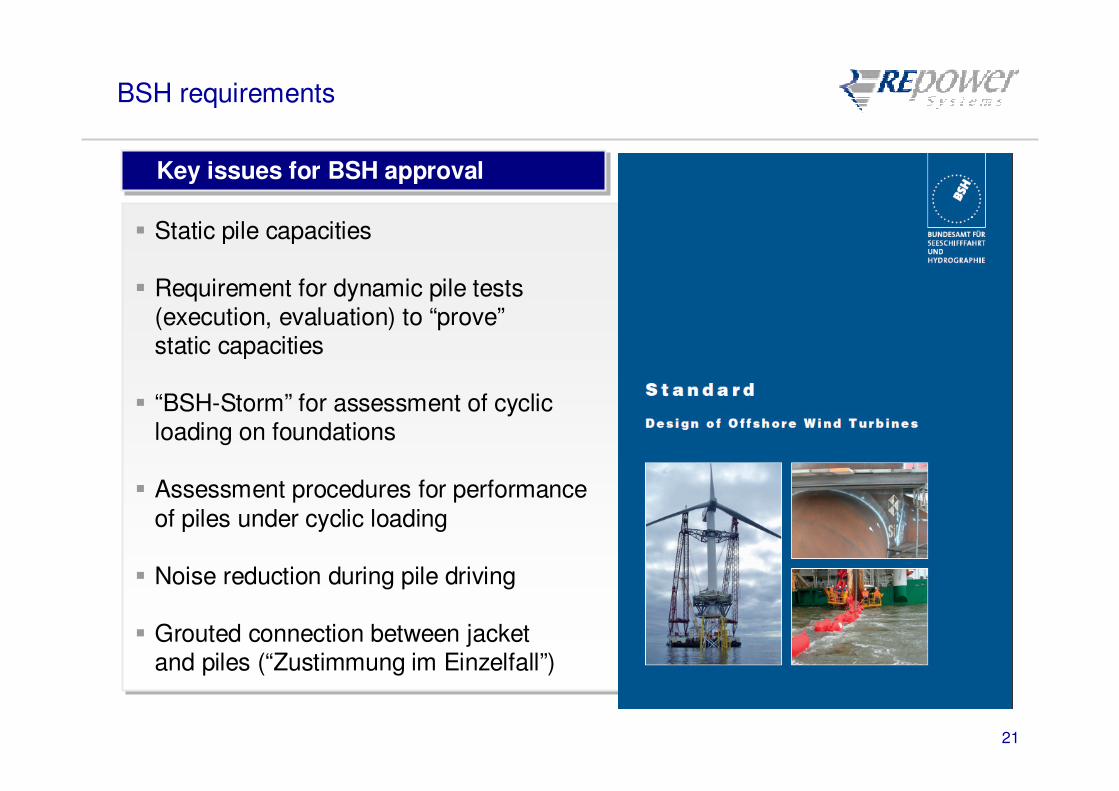
Static pile capacities
Requirement for dynamic pile tests (execution, evaluation) to “prove”static capacities
“BSH-Storm” for assessment of cyclic loading on foundations
Assessment procedures for performance
of piles under cyclic loading
Noise reduction during pile driving
Grouted connection between jacket and piles (“Zustimmung im Einzelfall”)

22
BSH requirements: 35h storm event / cyclic loading
IEC 61400-3 / BSHIEC 61400-3 / BSH
Basis for assessment of cyclic loading for piles is the “35h-storm” (adapted from Norsok standard N-003 “Action and action effects”, Ed. 2, Sept. 2007)
Basis for assessment of cyclic loading for piles is the “35h-storm” (adapted from Norsok standard N-003 “Action and action effects”, Ed. 2, Sept. 2007)
0.000
0.200
0.400
0.600
0.800
1.000
1.200
-17.50 -12.50 -7.50 -2.50 2.50 7.50 12.50 17.50
Wind
Wave
Wind (stepped)
Waves (stepped)
23
BSH requirements: 35h storm event / cyclic loading
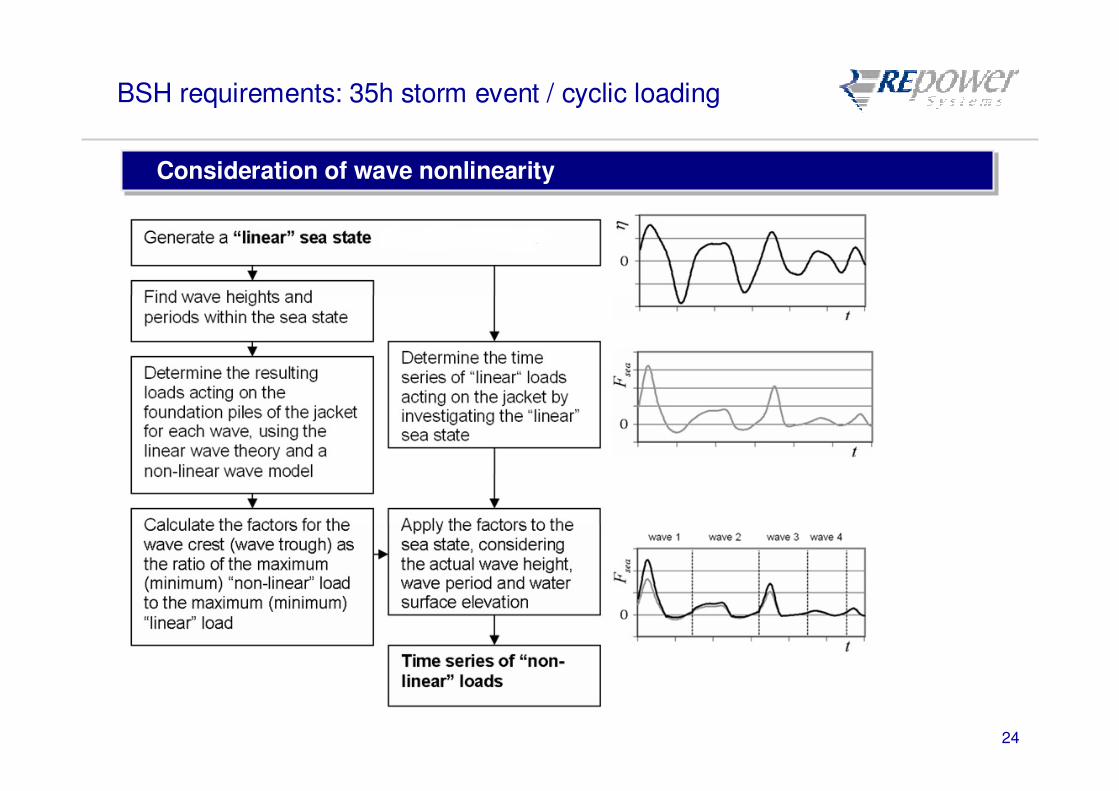
Consideration of wave nonlinearityConsideration of wave nonlinearity
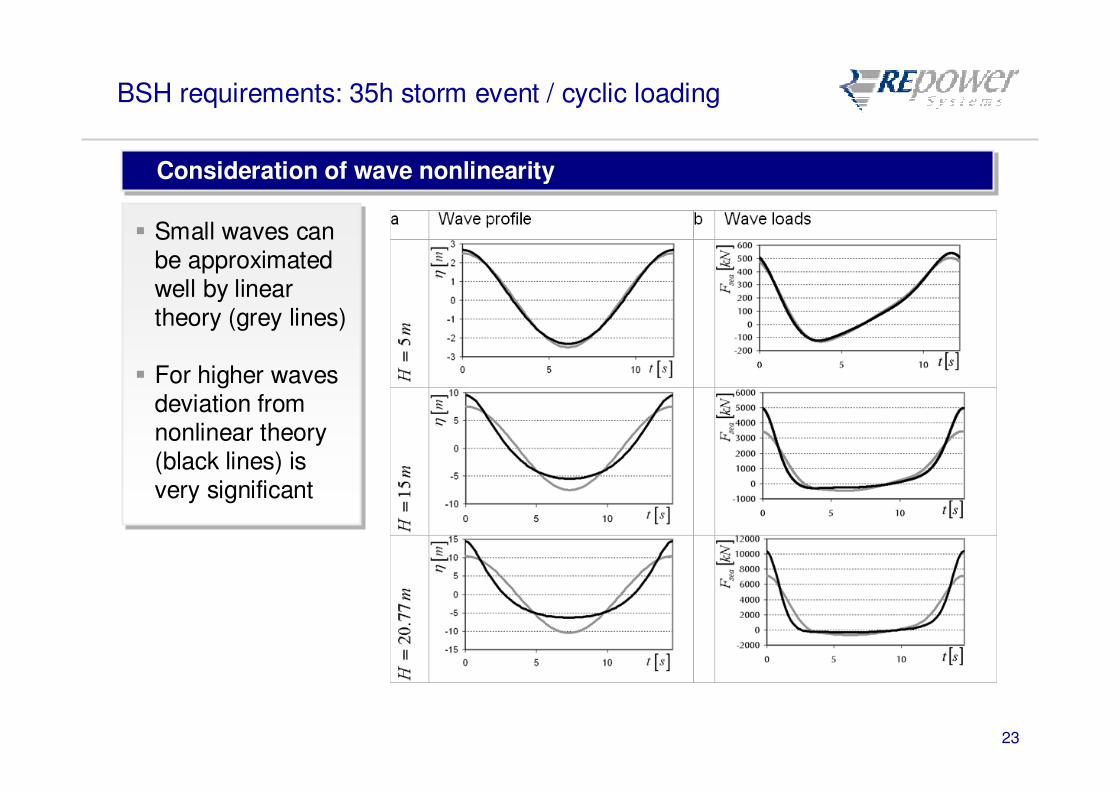
Small waves can be approximated well by linear theory (grey lines)
For higher waves deviation from nonlinear theory (black lines) is very significant
Small waves can be approximated well by linear theory (grey lines)
For higher waves deviation from nonlinear theory (black lines) is very significant
24
BSH requirements: 35h storm event / cyclic loading
Consideration of wave nonlinearityConsideration of wave nonlinearity
25
BSH requirements: 35h storm event / cyclic loading
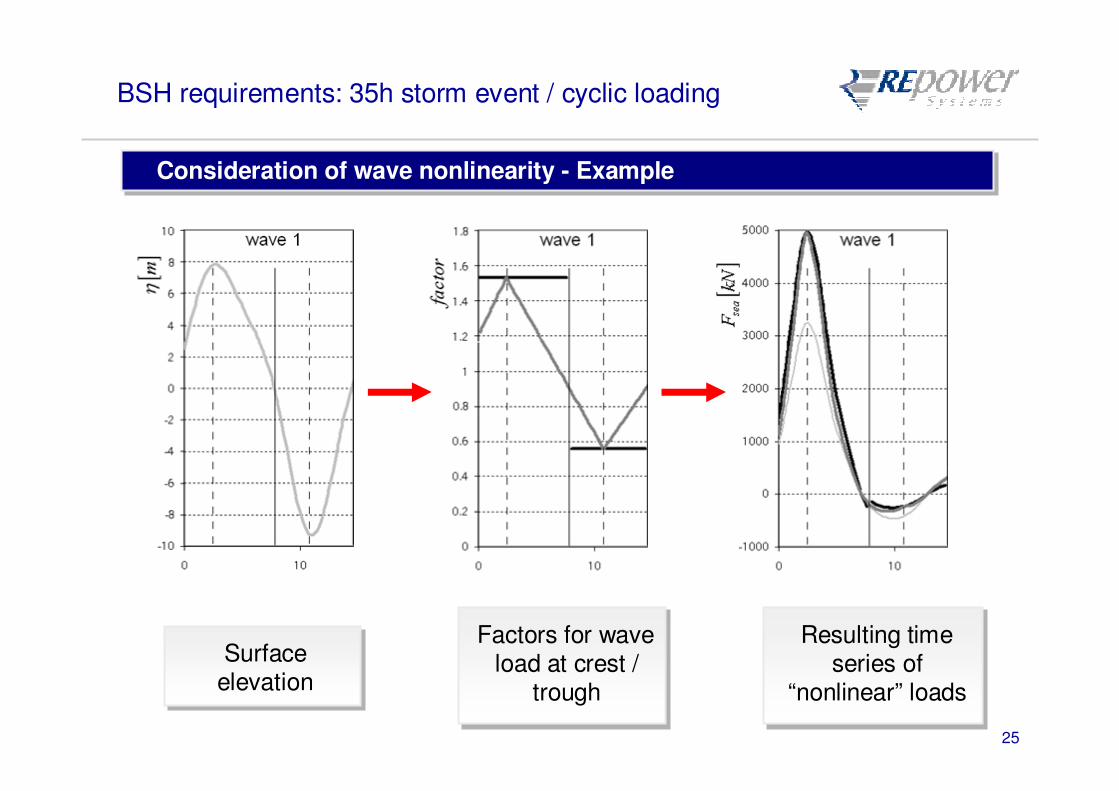
Surfaceelevation
Surfaceelevation
Factors for wave load at crest /
trough
Factors for wave load at crest /
trough
Resulting time series of
“nonlinear” loads
Resulting time series of
“nonlinear” loads
Consideration of wave nonlinearity - ExampleConsideration of wave nonlinearity - Example
26
BSH requirements: 35h storm event / cyclic loading
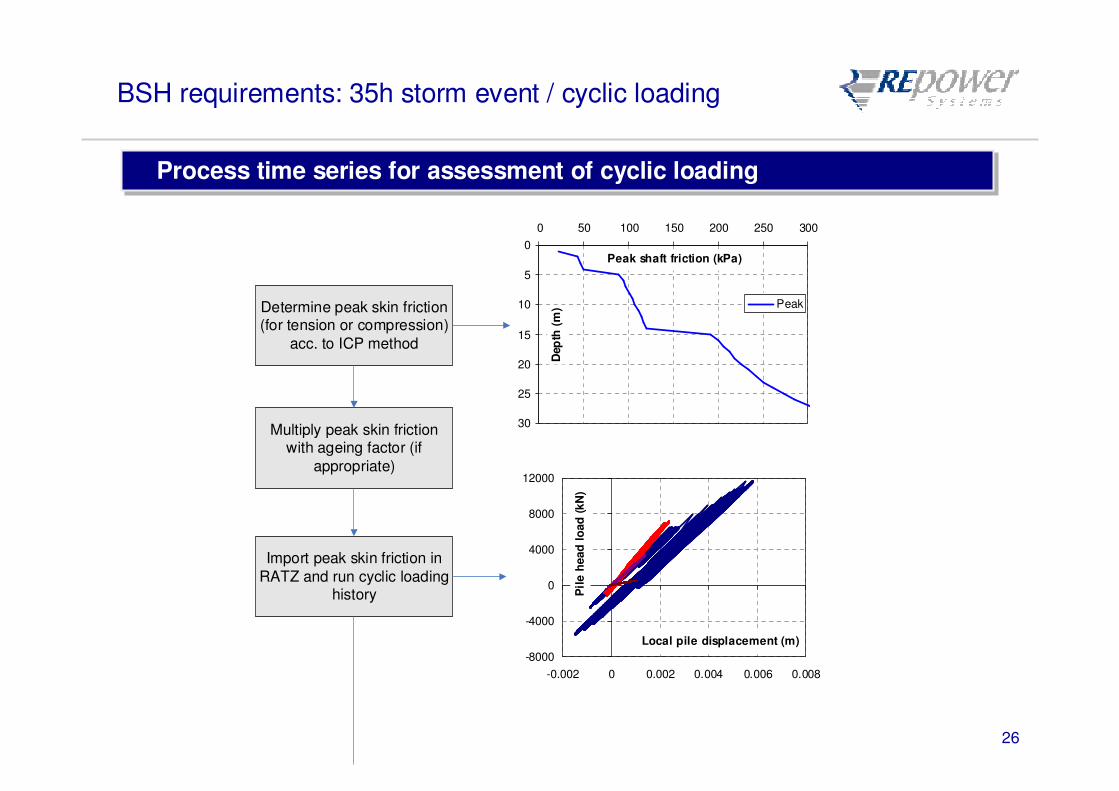
Determine peak skin friction (for tension or compression)
acc. to ICP method
Multiply peak skin friction with ageing factor (if
appropriate)
Import peak skin friction in
RATZ and run cyclic loading history
0
5
10
15
20
25
30
0 50 100 150 200 250 300
Peak shaft friction (kPa)
Dep
th (
m) Peak
-8000
-4000
0
4000
8000
12000
-0.002 0 0.002 0.004 0.006 0.008
Local pile displacement (m)
Pil
e h
ead
lo
ad
(kN
)
Process time series for assessment of cyclic loadingProcess time series for assessment of cyclic loading

27
BSH requirements: 35h storm event / cyclic loading
Evaluate degradation of peak skin friction
Determine pile capacity
Shaft friction degradation (kPa)34
84
149163
234
286
21
89
191
212219
234
286
62
134
15
49
120
0
5
10
15
20
25
30
0 50 100 150 200 250 300
Dep
th (
m)
Process time series for assessment of cyclic loadingProcess time series for assessment of cyclic loading
28
BSH requirements: Assessment of cyclic loading
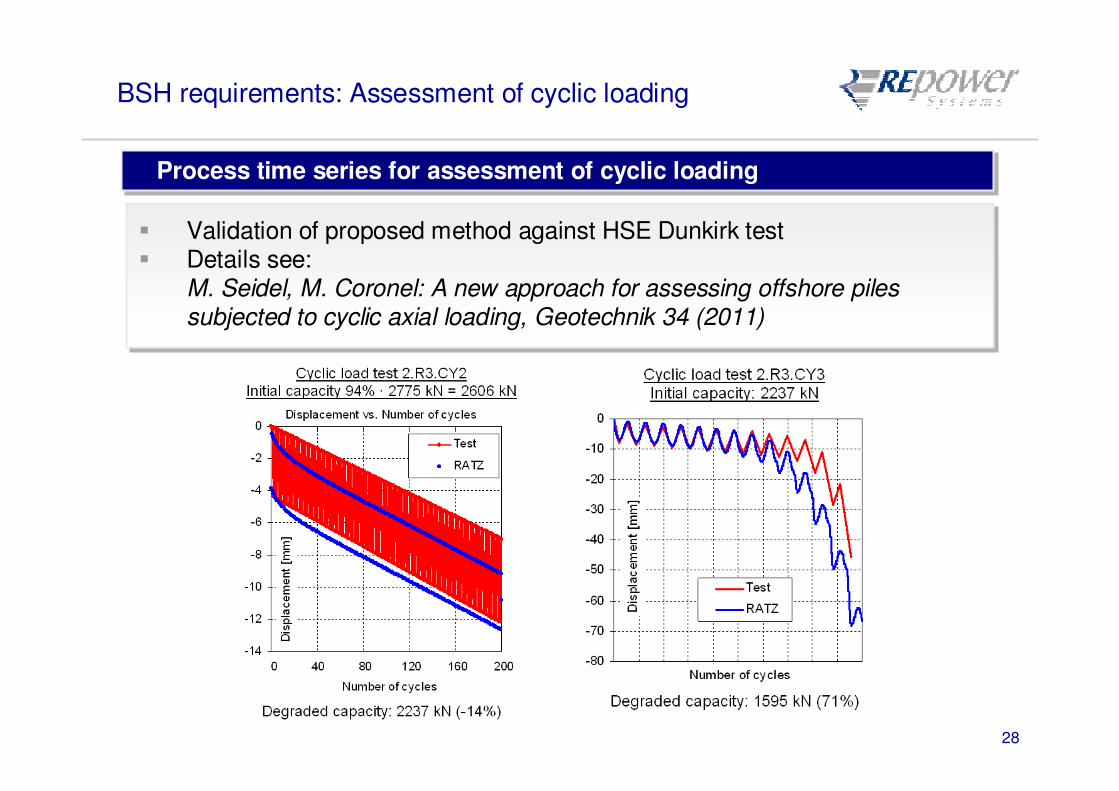
Process time series for assessment of cyclic loadingProcess time series for assessment of cyclic loading
Validation of proposed method against HSE Dunkirk test Details see:
M. Seidel, M. Coronel: A new approach for assessing offshore piles subjected to cyclic axial loading, Geotechnik 34 (2011)
Validation of proposed method against HSE Dunkirk test Details see:
M. Seidel, M. Coronel: A new approach for assessing offshore piles subjected to cyclic axial loading, Geotechnik 34 (2011)
29
Summary and conclusions
GeneralGeneral
Jackets have emerged as the preferred substructure solution for deeper waters and larger turbines
Significant experience with >100 jackets installed exists with REpower turbines
Further projects are in the planning phase with >200 jackets at the moment
Jackets have emerged as the preferred substructure solution for deeper waters and larger turbines
Significant experience with >100 jackets installed exists with REpower turbines
Further projects are in the planning phase with >200 jackets at the moment
30
Summary and conclusions
Impact of increasing turbine sizeImpact of increasing turbine size
Tower top weight:
For a 6MW turbine, a weight of 450-500t is ideal to achieve a first natural period within the required limits.
Smaller top weights can create resonance problems which require non-optimal rotational speeds at some wind speeds.
Loads vs. top mass:
A smaller nacelle mass does not lead to smaller loads – on the contrary, governing fatigue loads do even INCREASE when top mass is reduced.
31
Summary and conclusions
BSH approval processBSH approval process
Assessment of piles:
Methods have evolved to evaluate cyclic loading, this is not the big issue any more
Bigger problems arise with “static” capacities, which form the basis for the assessment!
“Proving” capacities with dynamic pile tests is very problematic – more details about this later at this conference
Grouted connections are another difficult subject – will also be discussed later at this conference
32
REpower Offshore Engineering