REPORTS Simple Scaling of Catastrophic Landslide...
5
Simple Scaling of Catastrophic Landslide Dynamics Göran Ekström* and Colin P. Stark Catastrophic landslides involve the acceleration and deceleration of millions of tons of rock and debris in response to the forces of gravity and dissipation. Their unpredictability and frequent location in remote areas have made observations of their dynamics rare. Through real-time detection and inverse modeling of teleseismic data, we show that landslide dynamics are primarily determined by the length scale of the source mass. When combined with geometric constraints from satellite imagery, the seismically determined landslide force histories yield estimates of landslide duration, momenta, potential energy loss, mass, and runout trajectory. Measurements of these dynamical properties for 29 teleseismogenic landslides are consistent with a simple acceleration model in which height drop and rupture depth scale with the length of the failing slope. S eismic radiation from landslides is broad- band and complex (1). Short-period waves result from the myriad momentum exchanges taking place within the granular mass and along its sliding boundary. They are distributed in time and low in amplitude compared with the impul- sive radiation associated with the sudden stress drop in tectonic earthquakes. Long-period waves radiated by landslides are simpler: They are gen- erated by the broad cycle of unloading and re- loading of the solid Earth (2–4) induced by the bulk acceleration and deceleration of the landslide mass. The corresponding momentum exchange is complicated by entrainment and deposition (5–7) during motion and by topographic undulations along the slide path (8). Characteristic unloading- reloading times in large landslides are several tens of seconds, making them efficient sources of seis- mic waves at periods of that order (9). Traditional earthquake monitoring conducted by national and international agencies is designed for detection of impulsive short-period seismic waves and for location of associated tectonic earthquakes and explosions. Landslide detections are rare. A complementary method based on near- real-time data from the Global Seismographic Network (GSN) allows for the detection of seis- mic events through continuous back-projection of the long-period wavefield (10–12). This event- detection algorithm detects >90% of magnitude M ≥ 5.0 shallow earthquakes reported by other agencies and identifies about 10 events each month that are not in other seismicity catalogs. Some of these unassociated events have been correlated with large-scale glacier calving (13, 14) and volcanic unrest (15). Here, we identify and investigate an- other subset of these events associated with cata- strophic (large and fast) landslides. The event-detection algorithm locates events with an initial accuracy of 20 to 100 km (10). A terrestrial landslide source is established by com- bining this geographic location with satellite imag- ery, field photographs, news reports, local seismic recordings, and other sources. A comprehensive investigation of 195 unassociated detections for 2010 led to the identification of 11 major land- slides (table S1, events 16 to 26). All of the seis- mically detected landslides generated long-period surface waves (SW) roughly equivalent to a mag- nitude M SW ∼ 5 tectonic earthquake, and all were recorded at multiple seismographic stations. Tec- tonically generated surface-wave signals of this magnitude are routinely used to determine earth- quake fault geometries and seismic moments (16), suggesting that similar methods could also be used to provide a quantitative characterization of the detected landslides. For example, Kanamori and co-workers ( 17, 18) measured a subhorizon- tal force of ∼150 s duration and maximum am- plitude ∼10 13 N associated with the massive debris avalanche after the 1980 eruption of Mount St. Helens volcano (table S1). Seismological analyses of long-period data have usually focused on single landslide events and typically have been limited to estimation of the average slide direction (often only in the horizontal), peak force, and duration of sliding (19–22). Field observations, by contrast, frequently suggest complex three-dimensional (3D) landslide trajectories, and numerical modeling has highlighted the effects of such complexity on the radiated seismic waves (7, 8). We developed an inverse method (12) to in- fer the 3D force sequence generated by bulk landslide motion (23)—from which we can de- duce the trajectory of slip and dynamic proper- ties. The new algorithm builds on and extends established methods used in earthquake analysis ( 12, 16). When applied to one of the largest land- slides of 2010, this approach results in a first- order characterization of the event (Fig. 1). On 4 January of that year, our algorithm ( 10, 11) auto- matically detected a seismic event of long-period magnitude M SW ≈ 5.3 at 08:36 GMT and roughly located the source in northern Pakistan (table S1). None of the international earthquake-monitoring agencies ISC, IDC, or NEIC reported this event. After anecdotal reports that a major landslide had struck the village of Attabad that morning—block- ing the Karakoram Highway, damming the Hunza River, and causing several fatalities (24)—we in- spected long-period waveform data recorded on proximal stations and established that the seis- mic signal was likely caused by the Attabad slope failure. This association was confirmed by our inverse model, which provided a more accurate source location within 15 km of Attabad and which pointed to a direction of motion down to the south-southwest, consistent with local reports. These reports also indicated a time of failure consistent with the seismic detection. The estimated time sequence of forces in- duced by acceleration of the Hunza-Attabad land- slide indicates a roughly sinusoidal sequence lasting ∆t ∼ 60 s (Fig. 1A). The 3D force vector components vary in a synchronous fashion, which suggests a consistent azimuth of acceleration and Lamont-Doherty Earth Observatory of Columbia University, Palisades, NY 10964, USA. *Corresponding author. E-mail: [email protected] Fig. 1. Landslide force history and trajectory for the Hunza-Attabad land- slide. (A) Inversion of the landslide force history F(t) (LFH) of this event, pinning the time of main failure at 08:37 UT (table S1). (B) The planform trajectory of landslide motion deduced by doubly integrating the LFH and scaling by the runout distance mapped in (C). (C) Satellite-image mapping of the landslide scar and runout. The es- timated centers of the source (“src”) and deposits (“dpo”) are indicated; their spatial separation was used to estimate D h , determine the effective mass, and scale the displacement trajectory D(t). East North Up A 1 km dam lake C src dpo -600 -400 -200 0 -200 0 -800 mN mE src dpo B 22 MARCH 2013 VOL 339 SCIENCE www.sciencemag.org 1416 REPORTS on April 8, 2016 Downloaded from on April 8, 2016 Downloaded from on April 8, 2016 Downloaded from on April 8, 2016 Downloaded from
Transcript of REPORTS Simple Scaling of Catastrophic Landslide...

Simple Scaling of CatastrophicLandslide DynamicsGöran Ekström* and Colin P. Stark
Catastrophic landslides involve the acceleration and deceleration of millions of tons of rock anddebris in response to the forces of gravity and dissipation. Their unpredictability and frequent locationin remote areas have made observations of their dynamics rare. Through real-time detection andinverse modeling of teleseismic data, we show that landslide dynamics are primarily determined bythe length scale of the source mass. When combined with geometric constraints from satellite imagery,the seismically determined landslide force histories yield estimates of landslide duration, momenta,potential energy loss, mass, and runout trajectory. Measurements of these dynamical properties for29 teleseismogenic landslides are consistent with a simple acceleration model in which height drop andrupture depth scale with the length of the failing slope.
Seismic radiation from landslides is broad-band and complex (1). Short-period wavesresult from the myriad momentum exchanges
taking place within the granular mass and alongits sliding boundary. They are distributed in timeand low in amplitude compared with the impul-sive radiation associated with the sudden stressdrop in tectonic earthquakes. Long-period wavesradiated by landslides are simpler: They are gen-erated by the broad cycle of unloading and re-loading of the solid Earth (2–4) induced by thebulk acceleration and deceleration of the landslidemass. The corresponding momentum exchange iscomplicated by entrainment and deposition (5–7)during motion and by topographic undulationsalong the slide path (8). Characteristic unloading-reloading times in large landslides are several tensof seconds, making them efficient sources of seis-mic waves at periods of that order (9).
Traditional earthquake monitoring conductedby national and international agencies is designedfor detection of impulsive short-period seismicwaves and for location of associated tectonicearthquakes and explosions. Landslide detectionsare rare. A complementary method based on near-real-time data from the Global SeismographicNetwork (GSN) allows for the detection of seis-
mic events through continuous back-projection ofthe long-period wavefield (10–12). This event-detection algorithm detects >90% of magnitudeM ≥ 5.0 shallow earthquakes reported by otheragencies and identifies about 10 events eachmonththat are not in other seismicity catalogs. Some ofthese unassociated events have been correlatedwithlarge-scale glacier calving (13, 14) and volcanicunrest (15). Here, we identify and investigate an-other subset of these events associated with cata-strophic (large and fast) landslides.
The event-detection algorithm locates eventswith an initial accuracy of 20 to 100 km (10). Aterrestrial landslide source is established by com-bining this geographic location with satellite imag-ery, field photographs, news reports, local seismicrecordings, and other sources. A comprehensiveinvestigation of 195 unassociated detections for2010 led to the identification of 11 major land-slides (table S1, events 16 to 26). All of the seis-mically detected landslides generated long-periodsurface waves (SW) roughly equivalent to a mag-nitudeMSW ∼ 5 tectonic earthquake, and all wererecorded at multiple seismographic stations. Tec-tonically generated surface-wave signals of thismagnitude are routinely used to determine earth-quake fault geometries and seismic moments(16), suggesting that similar methods could alsobe used to provide a quantitative characterizationof the detected landslides. For example, Kanamoriand co-workers (17, 18) measured a subhorizon-
tal force of ∼150 s duration and maximum am-plitude∼1013N associatedwith themassive debrisavalanche after the 1980 eruption of Mount St.Helens volcano (table S1). Seismological analysesof long-period data have usually focused on singlelandslide events and typically have been limitedto estimation of the average slide direction (oftenonly in the horizontal), peak force, and durationof sliding (19–22). Field observations, by contrast,frequently suggest complex three-dimensional (3D)landslide trajectories, and numerical modeling hashighlighted the effects of such complexity on theradiated seismic waves (7, 8).
We developed an inverse method (12) to in-fer the 3D force sequence generated by bulklandslide motion (23)—from which we can de-duce the trajectory of slip and dynamic proper-ties. The new algorithm builds on and extendsestablished methods used in earthquake analysis(12, 16). When applied to one of the largest land-slides of 2010, this approach results in a first-order characterization of the event (Fig. 1). On4 January of that year, our algorithm (10, 11) auto-matically detected a seismic event of long-periodmagnitudeMSW ≈ 5.3 at 08:36 GMTand roughlylocated the source in northern Pakistan (table S1).None of the international earthquake-monitoringagencies ISC, IDC, or NEIC reported this event.After anecdotal reports that a major landslide hadstruck the village of Attabad that morning—block-ing the Karakoram Highway, damming the HunzaRiver, and causing several fatalities (24)—we in-spected long-period waveform data recorded onproximal stations and established that the seis-mic signal was likely caused by the Attabad slopefailure. This association was confirmed by ourinverse model, which provided a more accuratesource location within 15 km of Attabad andwhich pointed to a direction of motion down tothe south-southwest, consistent with local reports.These reports also indicated a time of failureconsistent with the seismic detection.
The estimated time sequence of forces in-duced by acceleration of the Hunza-Attabad land-slide indicates a roughly sinusoidal sequencelasting ∆t ∼ 60 s (Fig. 1A). The 3D force vectorcomponents vary in a synchronous fashion, whichsuggests a consistent azimuth of acceleration and
Lamont-Doherty Earth Observatory of Columbia University,Palisades, NY 10964, USA.
*Corresponding author. E-mail: [email protected]
Fig. 1. Landslide force history andtrajectory for the Hunza-Attabad land-slide. (A) Inversion of the landslideforce history F(t) (LFH) of this event,pinning the time of main failure at08:37 UT (table S1). (B) The planformtrajectory of landslide motion deducedby doubly integrating the LFH andscaling by the runout distance mappedin (C). (C) Satellite-image mapping ofthe landslide scar and runout. The es-timated centers of the source (“src”)and deposits (“dpo”) are indicated;their spatial separation was used toestimate Dh, determine the effectivemass, and scale the displacement trajectory D(t).
EastNorth
Up
A
1 km
dam lake
C
src
dpo-600
-400
-200
0-200
0
-800
mN
mE
src
dpo
B
22 MARCH 2013 VOL 339 SCIENCE www.sciencemag.org1416
REPORTS
on A
pril
8, 2
016
Dow
nloa
ded
from
on
Apr
il 8,
201
6D
ownl
oade
d fr
om o
n A
pril
8, 2
016
Dow
nloa
ded
from
on
Apr
il 8,
201
6D
ownl
oade
d fr
om
deceleration and therefore a linear runout. Duringthe first 25 s the force vector points consistently tothe north-northeast with an upward vertical com-ponent, indicating reaction to acceleration of theslide mass downhill in the south-southwest direc-tion. The subsequent time series reflects reversalof the force vector during deceleration, as theslide mass approached the bottom of the valley.
Because the negated force history is equiv-alent to the rate of change of bulk landslide mo-mentum over time (23), its integration gives the
bulk momentum over time p(t) = (mv)(t). Thistime series is constrained to be stationary duringinversion. Assuming a constant bulk mass mover time, further integration gives the mass-scaled, 3D vector trajectory of motion mD(t).If an independent measure of landslide vol-ume or mass m is available, we can divide bym to obtain the 3D runout D(t) and compare itagainst terrain data and postfailure imagery totest the validity of the inversion results andthe assumption of constant mass. Alternative-
ly, we can estimate the bulk landslide mass bycomparing the mass-scaled maximum horizontaldisplacement mDh with a center-of-mass displace-ment estimated from terrain data and imagery.Using the second approach, illustrated in satelliteimagery of Hunza-Attabad (Fig. 1C), we esti-mated a horizontal center-of-mass displacement of940 m, which gave a mass of m ≈ 1.4 × 10¹¹ kgand the runout path D(t) shown in Fig. 1B. Eval-uation in the field has estimated the depositedvolume at ~45 million m3 (24). Assuming a debris
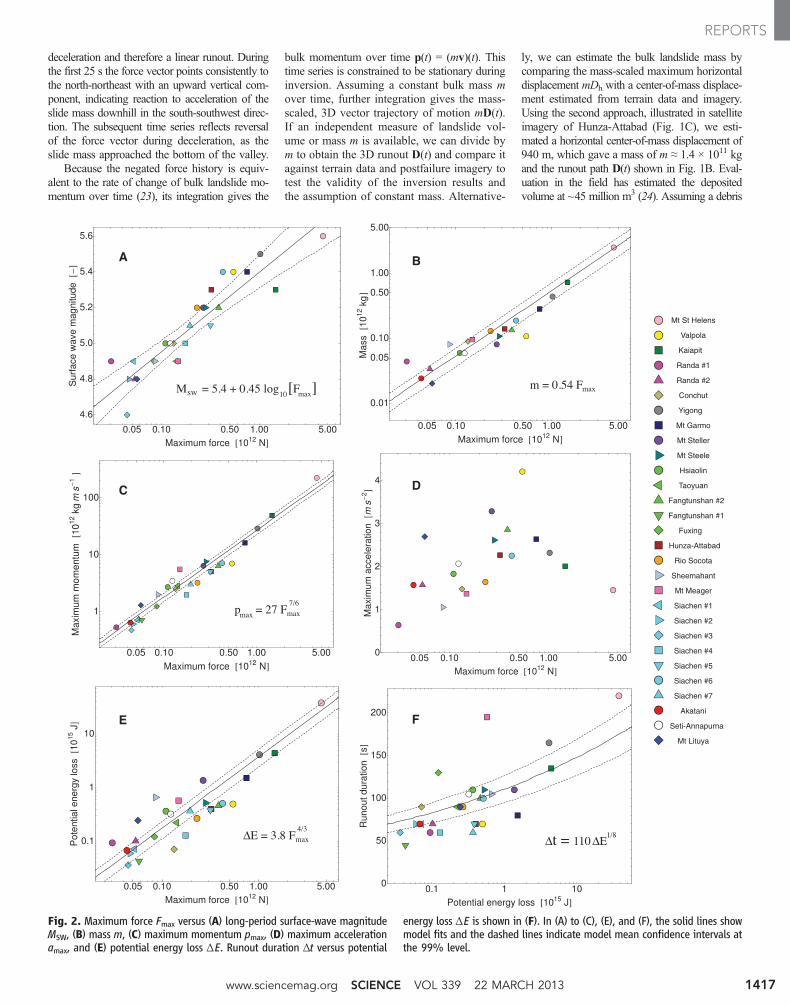
Fig. 2. Maximum force Fmax versus (A) long-period surface-wave magnitudeMSW, (B) mass m, (C) maximum momentum pmax, (D) maximum accelerationamax, and (E) potential energy loss ∆E. Runout duration ∆t versus potential
energy loss ∆E is shown in (F). In (A) to (C), (E), and (F), the solid lines showmodel fits and the dashed lines indicate model mean confidence intervals atthe 99% level.
www.sciencemag.org SCIENCE VOL 339 22 MARCH 2013 1417
REPORTS
density of 2400 kg m−3, this suggests a sourcemass of ∼1.1 × 10¹¹ kg, broadly consistent withour estimate.
We applied the technique of landslide seismicdetection and source inversion to a total of 29events spanning 1980–2012 (table S1). This setincludes the three largest landslides of the last 33years: Mount St. Helens in 1980 (table S1), Kaiapitin 1988 (25), and Yìgòng in 2000 (26). Of these 29events, 27 were recorded on global network sta-tions and the two smallest—at Fangtúnshan/Tàimalin Taiwan (27) in 2009 and Akatani in Japan (28)in 2011—were well recorded on regional net-works. By analyzing all 29 landslides in a meth-odologically consistent fashion, we generatedempirical constraints on catastrophic landslidedynamics spanning three orders of magnitude offailure mass that can be used with confidence inanalyses of scaling (tables S1 and Fig. 2).
A practical result is the logarithmic relation-ship (Fig. 2A) that we see between the long-periodmagnitude MSW and the maximum force Fmax.The magnitude estimates span MSW ≈ 4.6 to 5.6and are available only for the 27 global detec-tions. The maximum forces here span Fmax ≈ 4 ×10¹⁰ to 5 × 10¹² N and are typically associatedwith the acceleration phase of the landslide. Thecorrelation is strong, suggesting that the maxi-mum force can be estimated from the long-periodmagnitude alone (to within a factor of 2) and priorto waveform modeling.
We find a consistent pattern of scaling (Fig.2, B to F) among the inferred dynamic proper-ties that can be explained with a very simple mod-el of slope collapse and acceleration in which asingle length scale L determines all the geomet-rical properties of the landslide source and itsacceleration phase (12). The simple model andthe inversion results indicate a linear depen-dence of landslide mass on maximum force m ≈0.54Fmax (Fig. 2B). They indicate no scalingdependence, but much variability (Fig. 2D), forpeak acceleration a ≈ 2 m s−2. Observed scalingdependencies on maximum force match modeldeductions: Peak momentum is pmax ≈ 27F7=6
max
(Fig. 2C), potential energy loss is ΔE ≈ 3:8F4=3max
(Fig. 2E), and runout duration isΔt ≈ 127F1=6max.
Similarly, we find dependencies on potential en-ergy loss such as ∆t ≈ 110∆E1/8 (Fig. 2F) andpmax ≈ 10∆E7/8 that accord with the model. To-gether our results indicate peak kinetic energy ison average about 24% of potential energy loss.A practical outcome is that the mass-force rela-tion can be combined with the observed scalingbetween magnitude and force to provide an ap-proximate means of estimating landslide mass(in 1012 kg) from long-period magnitude aloneas m ≈ 0.54 × 102.2MSW−12.
Runout duration ∆t and trajectory D(t) in-ferred seismically reflect the phase of major heightdrop and thus large force. For some landslides,however, particularly for those running onto anddown glaciers [such as Mount Garmo (29) in2001 and Mount Lituya in 2012], a second, longerphase of low gradient, likely low-deceleration run-out, was mapped on imagery, but not recordedin the long-period seismicity. Such long-runoutevents likely indicate unusually low rates of en-ergy dissipation as a result of frictional meltingof glacial ice.
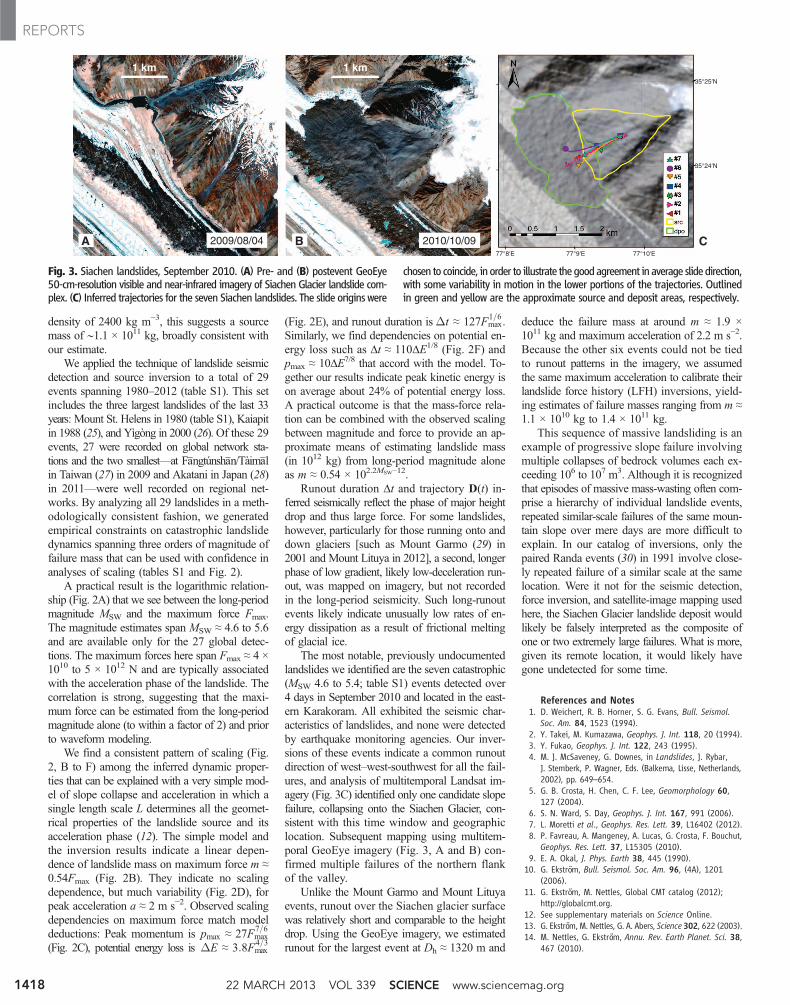
The most notable, previously undocumentedlandslides we identified are the seven catastrophic(MSW 4.6 to 5.4; table S1) events detected over4 days in September 2010 and located in the east-ern Karakoram. All exhibited the seismic char-acteristics of landslides, and none were detectedby earthquake monitoring agencies. Our inver-sions of these events indicate a common runoutdirection of west–west-southwest for all the fail-ures, and analysis of multitemporal Landsat im-agery (Fig. 3C) identified only one candidate slopefailure, collapsing onto the Siachen Glacier, con-sistent with this time window and geographiclocation. Subsequent mapping using multitem-poral GeoEye imagery (Fig. 3, A and B) con-firmed multiple failures of the northern flankof the valley.
Unlike the Mount Garmo and Mount Lituyaevents, runout over the Siachen glacier surfacewas relatively short and comparable to the heightdrop. Using the GeoEye imagery, we estimatedrunout for the largest event at Dh ≈ 1320 m and
deduce the failure mass at around m ≈ 1.9 ×10¹¹ kg and maximum acceleration of 2.2 m s−2.Because the other six events could not be tiedto runout patterns in the imagery, we assumedthe same maximum acceleration to calibrate theirlandslide force history (LFH) inversions, yield-ing estimates of failure masses ranging from m ≈1.1 × 10¹⁰ kg to 1.4 × 10¹¹ kg.
This sequence of massive landsliding is anexample of progressive slope failure involvingmultiple collapses of bedrock volumes each ex-ceeding 106 to 107 m3. Although it is recognizedthat episodes of massive mass-wasting often com-prise a hierarchy of individual landslide events,repeated similar-scale failures of the same moun-tain slope over mere days are more difficult toexplain. In our catalog of inversions, only thepaired Randa events (30) in 1991 involve close-ly repeated failure of a similar scale at the samelocation. Were it not for the seismic detection,force inversion, and satellite-image mapping usedhere, the Siachen Glacier landslide deposit wouldlikely be falsely interpreted as the composite ofone or two extremely large failures. What is more,given its remote location, it would likely havegone undetected for some time.
References and Notes1. D. Weichert, R. B. Horner, S. G. Evans, Bull. Seismol.
Soc. Am. 84, 1523 (1994).2. Y. Takei, M. Kumazawa, Geophys. J. Int. 118, 20 (1994).3. Y. Fukao, Geophys. J. Int. 122, 243 (1995).4. M. J. McSaveney, G. Downes, in Landslides, J. Rybar,
J. Stemberk, P. Wagner, Eds. (Balkema, Lisse, Netherlands,2002), pp. 649–654.
5. G. B. Crosta, H. Chen, C. F. Lee, Geomorphology 60,127 (2004).
6. S. N. Ward, S. Day, Geophys. J. Int. 167, 991 (2006).7. L. Moretti et al., Geophys. Res. Lett. 39, L16402 (2012).8. P. Favreau, A. Mangeney, A. Lucas, G. Crosta, F. Bouchut,
Geophys. Res. Lett. 37, L15305 (2010).9. E. A. Okal, J. Phys. Earth 38, 445 (1990).
10. G. Ekström, Bull. Seismol. Soc. Am. 96, (4A), 1201(2006).
11. G. Ekström, M. Nettles, Global CMT catalog (2012);http://globalcmt.org.
12. See supplementary materials on Science Online.13. G. Ekström, M. Nettles, G. A. Abers, Science 302, 622 (2003).14. M. Nettles, G. Ekström, Annu. Rev. Earth Planet. Sci. 38,
467 (2010).
Fig. 3. Siachen landslides, September 2010. (A) Pre- and (B) postevent GeoEye50-cm-resolution visible and near-infrared imagery of Siachen Glacier landslide com-plex. (C) Inferred trajectories for the seven Siachen landslides. The slide origins were
chosen to coincide, in order to illustrate thegoodagreement in average slidedirection,with some variability in motion in the lower portions of the trajectories. Outlinedin green and yellow are the approximate source and deposit areas, respectively.
22 MARCH 2013 VOL 339 SCIENCE www.sciencemag.org1418
REPORTS
15. A. Shuler, G. Ekström, J. Volcanol. Geotherm. Res. 181,219 (2009).
16. G. Ekström, M. Nettles, A. M. Dziewonski, Phys. EarthPlanet. Inter. 200-201, 1 (2012).
17. H. Kanamori, J. W. Given, J. Geophys. Res. 87, 5422 (1982).18. H. Kanamori, J. W. Given, T. Lay, J. Geophys. Res. 89,
1856 (1984).19. H. S. Hasegawa, H. Kanamori, Bull. Seismol. Soc. Am. 77,
1984 (1987).20. E. E. Brodsky, E. Gordeev, H. Kanamori, Geophys. Res. Lett.
30, 2236 (2003).21. M. La Rocca et al., Bull. Seismol. Soc. Am. 94, 1850
(2004).22. N. A. Pino, M. Ripepe, G. B. Cimini, Geophys. Res. Lett.
31, L02605 (2004).23. W. G. Pariseau, Eng. Geol. 16, 111 (1980).
24. D. Petley, Int. Water Power Dam Constr. 63, 27(2011).
25. M. Peart, Q. J. Eng. Geol. 24, 399 (1991).26. Y.-J. Shang et al., Geomorphology 54, 225 (2003).27. C.-H. Lin, H. Kumagai, M. Ando, T.-C. Shin, Geophys. Res.
Lett. 37, L22309 (2010).28. M. Yamada, Y. Matsushi, M. Chigira, J. Mori, Geophys.
Res. Lett. 39, L13301 (2012).29. V. M. Kotlyakov et al., Mater. Gliatsiologicheskikh
Issledovanii 95, 221 (2003).30. E. Eberhardt, D. Stead, J. S. Coggan, Int. J. Rock Mech.
Min. Sci. 41, 69 (2004).
Acknowledgments: We are grateful to C.-W. Lin, R.-J. Rau,S.-P. Lee, Hongey Chen, S.-H. Liu, and Y.-C. Tsang for helpwith analysis of landslides triggered by Typhoon Morakot; to
E. Choi and M. Reitz for discussions on landslide mechanics;and to D. Petley for help and information on several of thelandslide events reported here. Data are available in thesupplementary materials. This research was supported byNSF Awards EAR-0824694, EAR-1150072, and EAR-1227083.
Supplementary Materialswww.sciencemag.org/cgi/content/full/339/6126/1416/DC1Materials and MethodsSupplementary TextFig. S1Table S1References (31–50)
19 November 2012; accepted 30 January 201310.1126/science.1232887
Two Modes of Change in SouthernOcean Productivity Over thePast Million YearsS. L. Jaccard,1 C. T. Hayes,2,5 A. Martínez-García,1 D. A. Hodell,3 R. F. Anderson,2,5
D. M. Sigman,4 G. H. Haug1
Export of organic carbon from surface waters of the Antarctic Zone of the Southern Oceandecreased during the last ice age, coinciding with declining atmospheric carbon dioxide (CO2)concentrations, signaling reduced exchange of CO2 between the ocean interior and theatmosphere. In contrast, in the Subantarctic Zone, export production increased into ice agescoinciding with rising dust fluxes, thus suggesting iron fertilization of subantarctic phytoplankton.Here, a new high-resolution productivity record from the Antarctic Zone is compiled with parallelsubantarctic data over the past million years. Together, they fit the view that the combination of these twomodes of Southern Ocean change determines the temporal structure of the glacial-interglacialatmospheric CO2 record, including during the interval of “lukewarm” interglacials between450 and 800 thousand years ago.
Antarctic ice core measurements reveal thatregional air temperatures and atmospher-ic CO2 concentration (pCO2) were tight-
ly correlated over glacial-interglacial cycles of thepast 800 thousand years (ky) (1). Many studieshave inferred a dominant role for the SouthernOcean in modulating glacial-interglacial varia-bility of atmospheric pCO2 (2). The central roleof the Southern Ocean is thought to reflect itsleverage on the global efficiency of the biolog-ical pump, in which the production, sinking, anddeep remineralization of organic matter seques-ters carbon in the ocean interior, lowering at-mospheric CO2. Dense subsurface water massesoutcrop in the Southern Ocean, providing ex-change pathways between the deep ocean andthe atmosphere. Vertical exchange of water causesdeeply sequestered CO2 and nutrients to be mixedto the surface, fueling high rates of phytoplank-
ton productivity. Today, the Southern Ocean isthe principal leak in the biological pump, be-cause export production is inadequate to preventthe evasion of deeply sequestered carbon whenwaters are exposed to the atmosphere. The polarCO2 leak can be directly inhibited during gla-cial stages by factors such as increased sea-ice
cover (3) and/or changes in buoyancy forcingand convection (4, 5). In addition, the glacialCO2 reduction associated with these mecha-nisms would have been amplified by iron fer-tilization of the Subantarctic Zone (SAZ) of theSouthern Ocean (6, 7) and associated alkalinityfeedbacks (8).
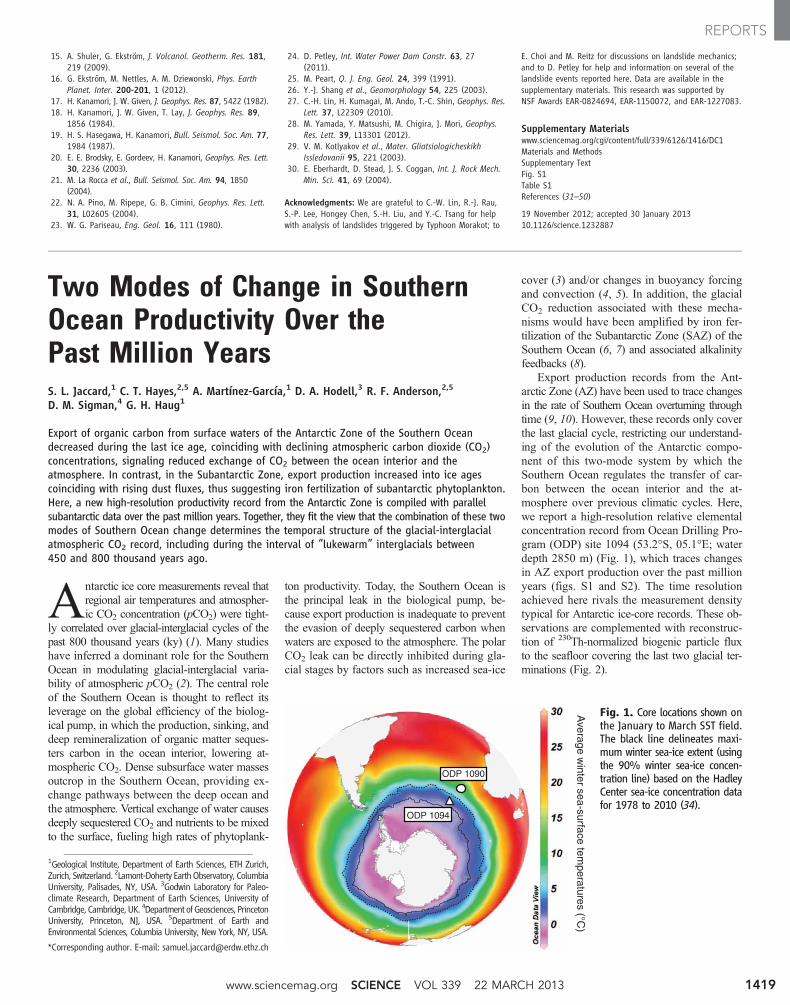
Export production records from the Ant-arctic Zone (AZ) have been used to trace changesin the rate of Southern Ocean overturning throughtime (9, 10). However, these records only coverthe last glacial cycle, restricting our understand-ing of the evolution of the Antarctic compo-nent of this two-mode system by which theSouthern Ocean regulates the transfer of car-bon between the ocean interior and the at-mosphere over previous climatic cycles. Here,we report a high-resolution relative elementalconcentration record from Ocean Drilling Pro-gram (ODP) site 1094 (53.2°S, 05.1°E; waterdepth 2850 m) (Fig. 1), which traces changesin AZ export production over the past millionyears (figs. S1 and S2). The time resolutionachieved here rivals the measurement densitytypical for Antarctic ice-core records. These ob-servations are complemented with reconstruc-tion of 230Th-normalized biogenic particle fluxto the seafloor covering the last two glacial ter-minations (Fig. 2).
1Geological Institute, Department of Earth Sciences, ETH Zurich,Zurich, Switzerland. 2Lamont-Doherty Earth Observatory, ColumbiaUniversity, Palisades, NY, USA. 3Godwin Laboratory for Paleo-climate Research, Department of Earth Sciences, University ofCambridge, Cambridge,UK. 4Department ofGeosciences, PrincetonUniversity, Princeton, NJ, USA. 5Department of Earth andEnvironmental Sciences, Columbia University, New York, NY, USA.
*Corresponding author. E-mail: [email protected]
Fig. 1. Core locations shown onthe January to March SST field.The black line delineates maxi-mum winter sea-ice extent (usingthe 90% winter sea-ice concen-tration line) based on the HadleyCenter sea-ice concentration datafor 1978 to 2010 (34).
Average w
inter sea-surface temperatures (°C
)
ODP 1094
ODP 1090
www.sciencemag.org SCIENCE VOL 339 22 MARCH 2013 1419
REPORTS

DOI: 10.1126/science.1232887, 1416 (2013);339 Science
Göran Ekström and Colin P. StarkSimple Scaling of Catastrophic Landslide Dynamics
This copy is for your personal, non-commercial use only.
clicking here.colleagues, clients, or customers by , you can order high-quality copies for yourIf you wish to distribute this article to others
here.following the guidelines
can be obtained byPermission to republish or repurpose articles or portions of articles
): April 8, 2016 www.sciencemag.org (this information is current as of
The following resources related to this article are available online at
/content/339/6126/1416.full.htmlversion of this article at:
including high-resolution figures, can be found in the onlineUpdated information and services,
/content/suppl/2013/03/20/339.6126.1416.DC1.html can be found at: Supporting Online Material
/content/339/6126/1416.full.html#relatedfound at:
can berelated to this article A list of selected additional articles on the Science Web sites
/content/339/6126/1416.full.html#ref-list-1, 10 of which can be accessed free:cites 43 articlesThis article
/content/339/6126/1416.full.html#related-urls6 articles hosted by HighWire Press; see:cited by This article has been
/cgi/collection/geochem_physGeochemistry, Geophysics
subject collections:This article appears in the following
registered trademark of AAAS. is aScience2013 by the American Association for the Advancement of Science; all rights reserved. The title
CopyrightAmerican Association for the Advancement of Science, 1200 New York Avenue NW, Washington, DC 20005. (print ISSN 0036-8075; online ISSN 1095-9203) is published weekly, except the last week in December, by theScience
on A
pril
8, 2
016
Dow
nloa
ded
from