Reporting Student Data File Format - Texas Assessment · STAAR 3–8 REPORTING STUDENT DATA FILE...
31
STAAR Grades 3–8 2018 Test Administrations Reporting Student Data File Format
Transcript of Reporting Student Data File Format - Texas Assessment · STAAR 3–8 REPORTING STUDENT DATA FILE...
STAAR Grades 3–8 2018 Test Administrations
Reporting Student Data File Format
STAAR 3–8 REPORTING STUDENT DATA FILE FORMAT
2 of 31
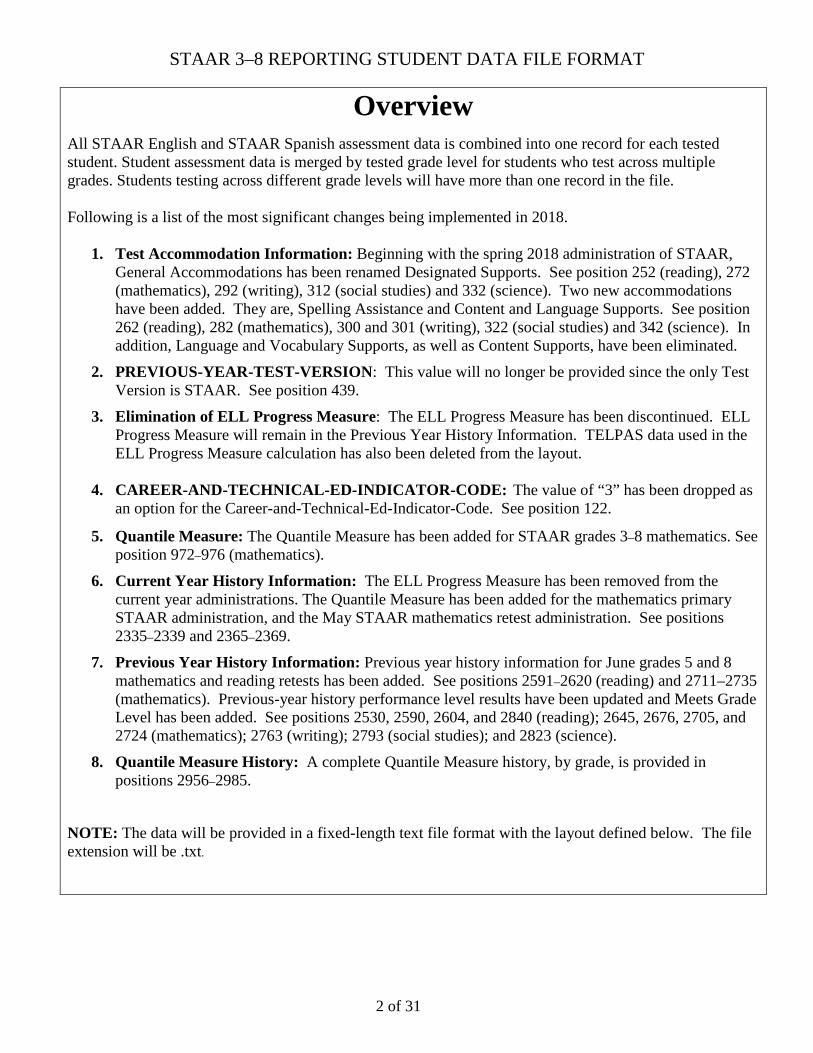
Overview
All STAAR English and STAAR Spanish assessment data is combined into one record for each tested student. Student assessment data is merged by tested grade level for students who test across multiple grades. Students testing across different grade levels will have more than one record in the file. Following is a list of the most significant changes being implemented in 2018.
1. Test Accommodation Information: Beginning with the spring 2018 administration of STAAR,
General Accommodations has been renamed Designated Supports. See position 252 (reading), 272 (mathematics), 292 (writing), 312 (social studies) and 332 (science). Two new accommodations have been added. They are, Spelling Assistance and Content and Language Supports. See position 262 (reading), 282 (mathematics), 300 and 301 (writing), 322 (social studies) and 342 (science). In addition, Language and Vocabulary Supports, as well as Content Supports, have been eliminated.
2. PREVIOUS-YEAR-TEST-VERSION: This value will no longer be provided since the only Test Version is STAAR. See position 439.
3. Elimination of ELL Progress Measure: The ELL Progress Measure has been discontinued. ELL Progress Measure will remain in the Previous Year History Information. TELPAS data used in the ELL Progress Measure calculation has also been deleted from the layout.
4. CAREER-AND-TECHNICAL-ED-INDICATOR-CODE: The value of “3” has been dropped as an option for the Career-and-Technical-Ed-Indicator-Code. See position 122.
5. Quantile Measure: The Quantile Measure has been added for STAAR grades 3–8 mathematics. See position 972–976 (mathematics).
6. Current Year History Information: The ELL Progress Measure has been removed from the current year administrations. The Quantile Measure has been added for the mathematics primary STAAR administration, and the May STAAR mathematics retest administration. See positions 2335–2339 and 2365–2369.
7. Previous Year History Information: Previous year history information for June grades 5 and 8 mathematics and reading retests has been added. See positions 2591–2620 (reading) and 2711–2735 (mathematics). Previous-year history performance level results have been updated and Meets Grade Level has been added. See positions 2530, 2590, 2604, and 2840 (reading); 2645, 2676, 2705, and 2724 (mathematics); 2763 (writing); 2793 (social studies); and 2823 (science).
8. Quantile Measure History: A complete Quantile Measure history, by grade, is provided in positions 2956–2985.
NOTE: The data will be provided in a fixed-length text file format with the layout defined below. The file extension will be .txt.
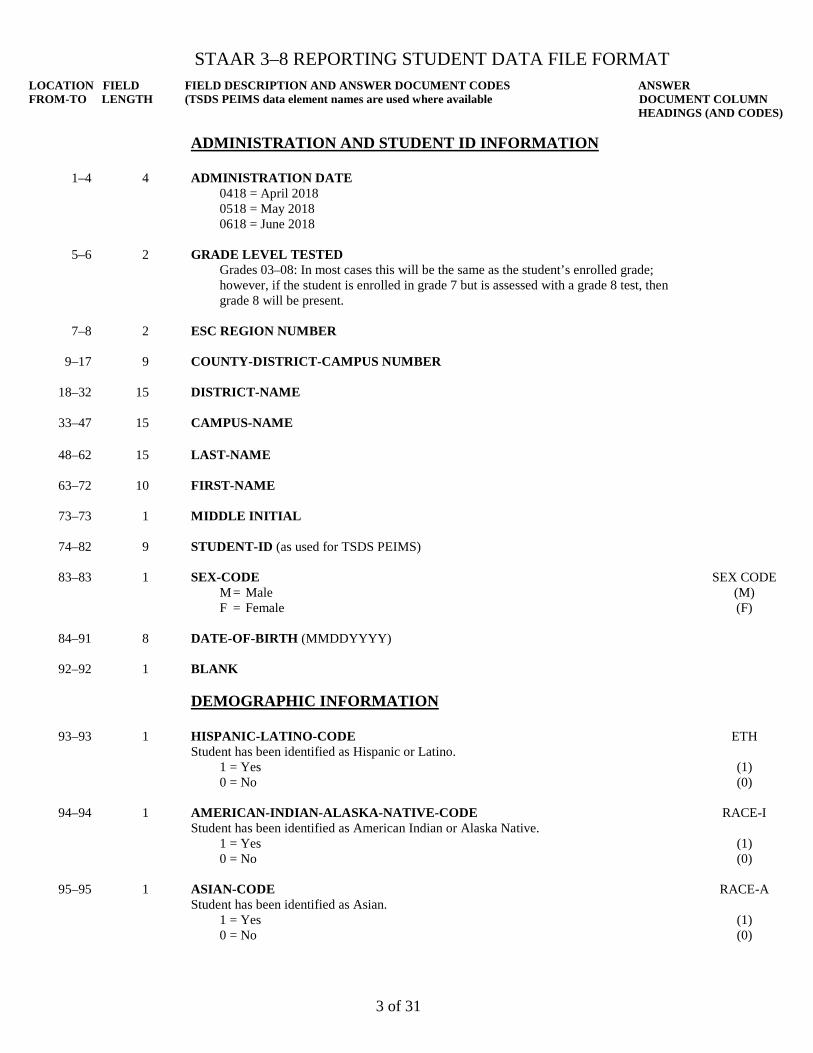
STAAR 3–8 REPORTING STUDENT DATA FILE FORMAT LOCATION FIELD FIELD DESCRIPTION AND ANSWER DOCUMENT CODES ANSWER FROM-TO LENGTH (TSDS PEIMS data element names are used where available DOCUMENT COLUMN HEADINGS (AND CODES)
3 of 31
ADMINISTRATION AND STUDENT ID INFORMATION
1–4 4 ADMINISTRATION DATE 0418 = April 2018 0518 = May 2018 0618 = June 2018
5–6 2 GRADE LEVEL TESTED Grades 03–08: In most cases this will be the same as the student’s enrolled grade; however, if the student is enrolled in grade 7 but is assessed with a grade 8 test, then grade 8 will be present.
7–8 2 ESC REGION NUMBER
9–17 9 COUNTY-DISTRICT-CAMPUS NUMBER
18–32 15 DISTRICT-NAME
33–47 15 CAMPUS-NAME
48–62 15 LAST-NAME
63–72 10 FIRST-NAME
73–73 1 MIDDLE INITIAL
74–82 9 STUDENT-ID (as used for TSDS PEIMS)
83–83 1 SEX-CODE M = Male F = Female
SEX CODE (M) (F)
84–91 8 DATE-OF-BIRTH (MMDDYYYY)
92–92 1 BLANK
DEMOGRAPHIC INFORMATION
93–93 1 HISPANIC-LATINO-CODE Student has been identified as Hispanic or Latino.
1 = Yes 0 = No
ETH
(1) (0)
94–94 1 AMERICAN-INDIAN-ALASKA-NATIVE-CODE
Student has been identified as American Indian or Alaska Native. 1 = Yes 0 = No
RACE-I
(1) (0)
95–95 1 ASIAN-CODE
Student has been identified as Asian. 1 = Yes 0 = No
RACE-A
(1) (0)

STAAR 3–8 REPORTING STUDENT DATA FILE FORMAT LOCATION FIELD FIELD DESCRIPTION AND ANSWER DOCUMENT CODES ANSWER FROM-TO LENGTH (TSDS PEIMS data element names are used where available DOCUMENT COLUMN HEADINGS (AND CODES)
4 of 31
96–96 1
BLACK-AFRICAN-AMERICAN-CODE Student has been identified as Black or African American.
1 = Yes 0 = No
RACE-B
(1) (0)
97–97 1 NATIVE-HAWAIIAN-PACIFIC-ISLANDER-CODE
Student has been identified as Native Hawaiian or Other Pacific Islander. 1 = Yes 0 = No
RACE-P
(1) (0)
98–98 1 WHITE-CODE
Student has been identified as White. 1 = Yes 0 = No
RACE-W
(1) (0)
99–99 1 ETHNICITY/RACE REPORTING CATEGORY
H = Hispanic/Latino I = American Indian or Alaska Native A = Asian B = Black or African American P = Native Hawaiian or Other Pacific Islander W = White T = Two or More Races N = No Information Provided
100–100 1 ECONOMIC-DISADVANTAGE-CODE 1 = Eligible for free meals under the National School Lunch and Child Nutrition
Program 2 = Eligible for reduced-price meals under the National School Lunch and Child
Nutrition Program 9 = Other economic disadvantage 0 = Not identified as economically disadvantaged
ED (01)
(02)
(99) (00)
101–101 1 TITLE-I-PART-A-INDICATOR-CODE 6 = Student attends campus with school-wide program 7 = Student participates in program at targeted assistance school 8 = Student is previous participant in program at targeted assistance school (not a
current participant) 9 = Student does not attend a Title I, Part A school but receives Title I, Part A
services because the student is homeless 0 = Student does not currently participate in and has not previously participated in
program at current campus
TIA (6) (7) (8)
(9)
(0)
102–102 1 MIGRANT-INDICATOR-CODE Student has been identified as a migrant student.
1 = Yes 0 = No
MS
(1) (0)
103–106 4 BLANK
STAAR 3–8 REPORTING STUDENT DATA FILE FORMAT LOCATION FIELD FIELD DESCRIPTION AND ANSWER DOCUMENT CODES ANSWER FROM-TO LENGTH (TSDS PEIMS data element names are used where available DOCUMENT COLUMN HEADINGS (AND CODES)
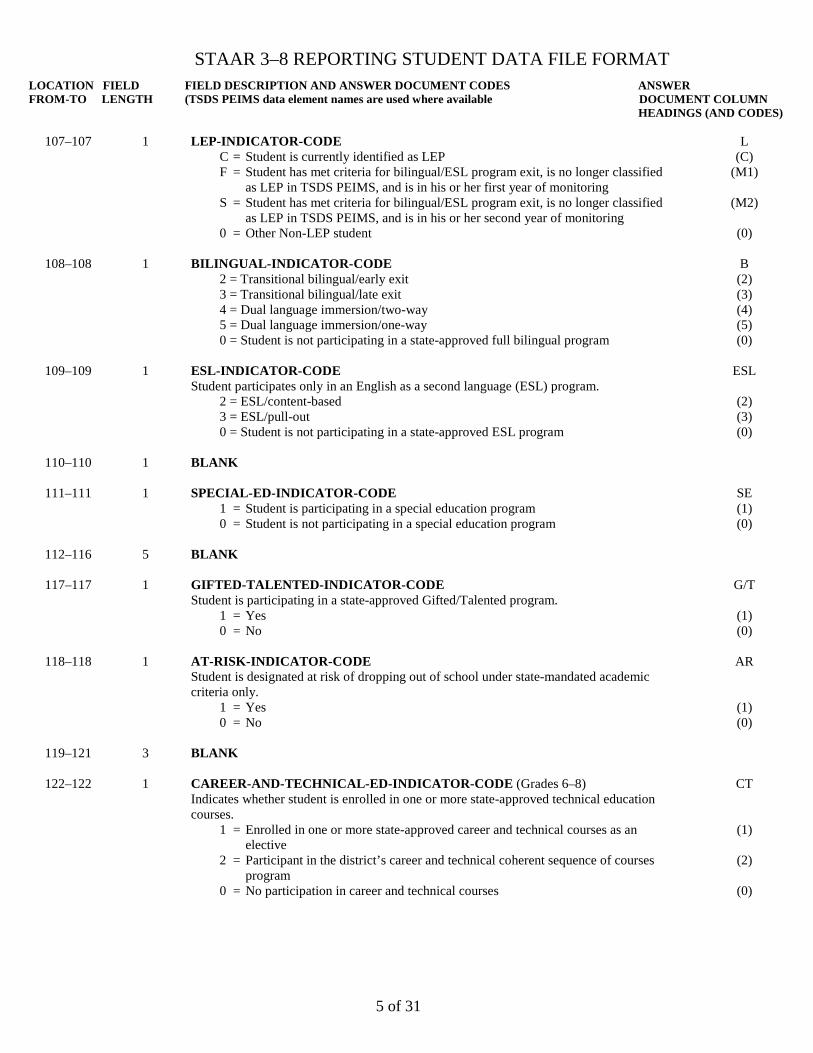
5 of 31
107–107 1
LEP-INDICATOR-CODE C = Student is currently identified as LEP F = Student has met criteria for bilingual/ESL program exit, is no longer classified
as LEP in TSDS PEIMS, and is in his or her first year of monitoring S = Student has met criteria for bilingual/ESL program exit, is no longer classified
as LEP in TSDS PEIMS, and is in his or her second year of monitoring 0 = Other Non-LEP student
L (C)
(M1)
(M2)
(0)
108–108 1 BILINGUAL-INDICATOR-CODE 2 = Transitional bilingual/early exit 3 = Transitional bilingual/late exit 4 = Dual language immersion/two-way 5 = Dual language immersion/one-way 0 = Student is not participating in a state-approved full bilingual program
B (2) (3) (4) (5) (0)
109–109 1 ESL-INDICATOR-CODE Student participates only in an English as a second language (ESL) program.
2 = ESL/content-based 3 = ESL/pull-out 0 = Student is not participating in a state-approved ESL program
ESL
(2) (3) (0)
110–110 1 BLANK
111–111 1 SPECIAL-ED-INDICATOR-CODE 1 = Student is participating in a special education program 0 = Student is not participating in a special education program
SE (1) (0)
112–116 5 BLANK
117–117 1 GIFTED-TALENTED-INDICATOR-CODE Student is participating in a state-approved Gifted/Talented program.
1 = Yes 0 = No
G/T
(1) (0)
118–118 1 AT-RISK-INDICATOR-CODE Student is designated at risk of dropping out of school under state-mandated academic criteria only.
1 = Yes 0 = No
AR
(1) (0)
119–121 3 BLANK
122–122 1 CAREER-AND-TECHNICAL-ED-INDICATOR-CODE (Grades 6–8) Indicates whether student is enrolled in one or more state-approved technical education courses.
1 = Enrolled in one or more state-approved career and technical courses as an elective
2 = Participant in the district’s career and technical coherent sequence of courses program
0 = No participation in career and technical courses
CT
(1)
(2)
(0)
STAAR 3–8 REPORTING STUDENT DATA FILE FORMAT LOCATION FIELD FIELD DESCRIPTION AND ANSWER DOCUMENT CODES ANSWER FROM-TO LENGTH (TSDS PEIMS data element names are used where available DOCUMENT COLUMN HEADINGS (AND CODES)
6 of 31
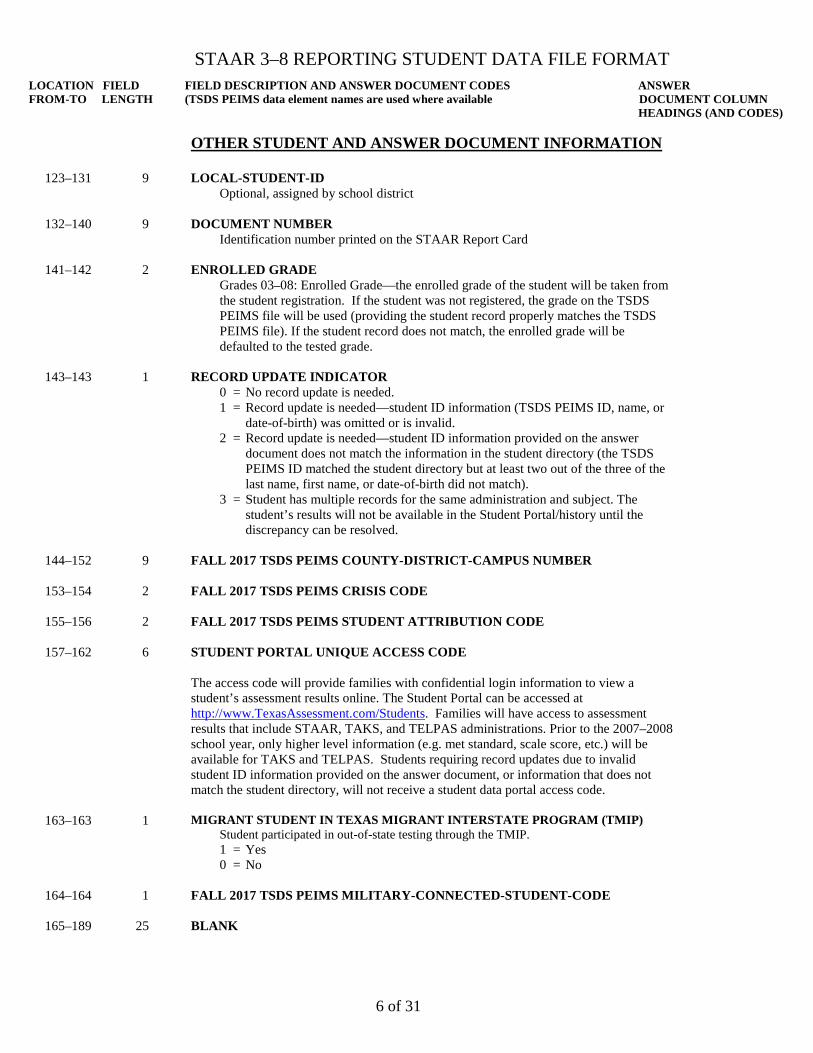
OTHER STUDENT AND ANSWER DOCUMENT INFORMATION
123–131 9 LOCAL-STUDENT-ID Optional, assigned by school district
132–140 9 DOCUMENT NUMBER Identification number printed on the STAAR Report Card
141–142 2 ENROLLED GRADE Grades 03–08: Enrolled Grade—the enrolled grade of the student will be taken from the student registration. If the student was not registered, the grade on the TSDS PEIMS file will be used (providing the student record properly matches the TSDS PEIMS file). If the student record does not match, the enrolled grade will be defaulted to the tested grade.
143–143 1 RECORD UPDATE INDICATOR 0 = No record update is needed. 1 = Record update is needed—student ID information (TSDS PEIMS ID, name, or
date-of-birth) was omitted or is invalid. 2 = Record update is needed—student ID information provided on the answer
document does not match the information in the student directory (the TSDS PEIMS ID matched the student directory but at least two out of the three of the last name, first name, or date-of-birth did not match).
3 = Student has multiple records for the same administration and subject. The student’s results will not be available in the Student Portal/history until the discrepancy can be resolved.
144–152 9 FALL 2017 TSDS PEIMS COUNTY-DISTRICT-CAMPUS NUMBER
153–154 2 FALL 2017 TSDS PEIMS CRISIS CODE
155–156 2 FALL 2017 TSDS PEIMS STUDENT ATTRIBUTION CODE
157–162
6 STUDENT PORTAL UNIQUE ACCESS CODE The access code will provide families with confidential login information to view a student’s assessment results online. The Student Portal can be accessed at http://www.TexasAssessment.com/Students. Families will have access to assessment results that include STAAR, TAKS, and TELPAS administrations. Prior to the 2007–2008 school year, only higher level information (e.g. met standard, scale score, etc.) will be available for TAKS and TELPAS. Students requiring record updates due to invalid student ID information provided on the answer document, or information that does not match the student directory, will not receive a student data portal access code.
163–163 1 MIGRANT STUDENT IN TEXAS MIGRANT INTERSTATE PROGRAM (TMIP) Student participated in out-of-state testing through the TMIP. 1 = Yes 0 = No
164–164 1 FALL 2017 TSDS PEIMS MILITARY-CONNECTED-STUDENT-CODE
165–189 25 BLANK
STAAR 3–8 REPORTING STUDENT DATA FILE FORMAT LOCATION FIELD FIELD DESCRIPTION AND ANSWER DOCUMENT CODES ANSWER FROM-TO LENGTH (TSDS PEIMS data element names are used where available DOCUMENT COLUMN HEADINGS (AND CODES)
7 of 31
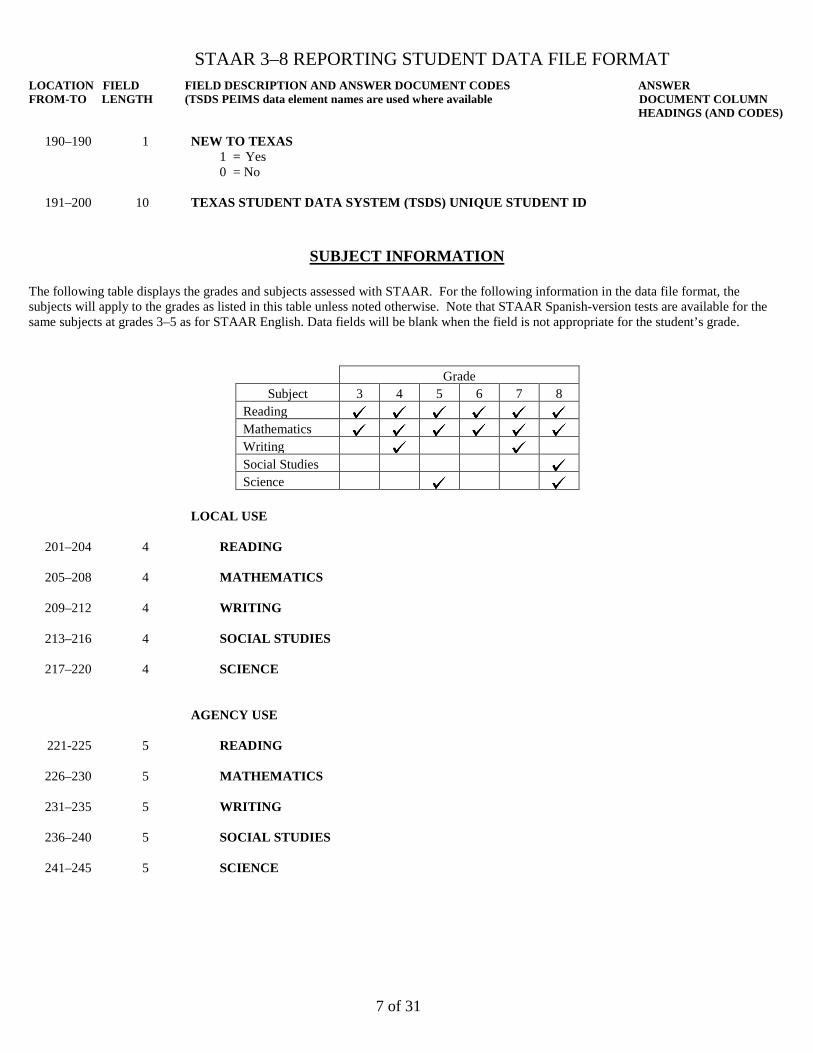
190–190 1 NEW TO TEXAS 1 = Yes 0 = No
191–200 10 TEXAS STUDENT DATA SYSTEM (TSDS) UNIQUE STUDENT ID
SUBJECT INFORMATION
The following table displays the grades and subjects assessed with STAAR. For the following information in the data file format, the subjects will apply to the grades as listed in this table unless noted otherwise. Note that STAAR Spanish-version tests are available for the same subjects at grades 3–5 as for STAAR English. Data fields will be blank when the field is not appropriate for the student’s grade.
Grade
Subject 3 4 5 6 7 8 Reading
Mathematics
Writing
Social Studies
Science
LOCAL USE
201–204
4 READING
205–208
4 MATHEMATICS
209–212
4 WRITING
213–216 4 SOCIAL STUDIES
217–220 4 SCIENCE
AGENCY USE
221-225 5 READING
226–230
5 MATHEMATICS
231–235
5 WRITING
236–240
5 SOCIAL STUDIES
241–245 5 SCIENCE

STAAR 3–8 REPORTING STUDENT DATA FILE FORMAT LOCATION FIELD FIELD DESCRIPTION AND ANSWER DOCUMENT CODES ANSWER FROM-TO LENGTH (TSDS PEIMS data element names are used where available DOCUMENT COLUMN HEADINGS (AND CODES)
8 of 31
EOC/ABOVE GRADE
246–246 1 READING 1 = Yes 0 = No
(R)
247–247 1 MATHEMATICS 1 = Yes 0 = No
(M)
248–248 1 SOCIAL STUDIES 1 = Yes 0 = No
(SS)
249–249 1 SCIENCE 1 = Yes 0 = No
(S)
250–251 2 BLANK
ACCOMMODATIONS INFORMATION
TEST ACCOMMODATIONS—READING 252–252 1 Designated Supports
1 = Yes 0 = No
(DS)
253–253 1 Braille 1 = Yes 0 = No
(BR)
254–254 1 Large Print 1 = Yes 0 = No
(LP)
255–255 1 BLANK
256–256 1 Extra Day 1 = Yes 0 = No
(XD)
257–258 2 BLANK
259–259 1 Text-To-Speech 1 = Yes 0 = No
260–261 2 BLANK
262–262 1 Content and Language Supports 1 = Yes 0 = No
263–271 9 BLANK
STAAR 3–8 REPORTING STUDENT DATA FILE FORMAT LOCATION FIELD FIELD DESCRIPTION AND ANSWER DOCUMENT CODES ANSWER FROM-TO LENGTH (TSDS PEIMS data element names are used where available DOCUMENT COLUMN HEADINGS (AND CODES)
9 of 31
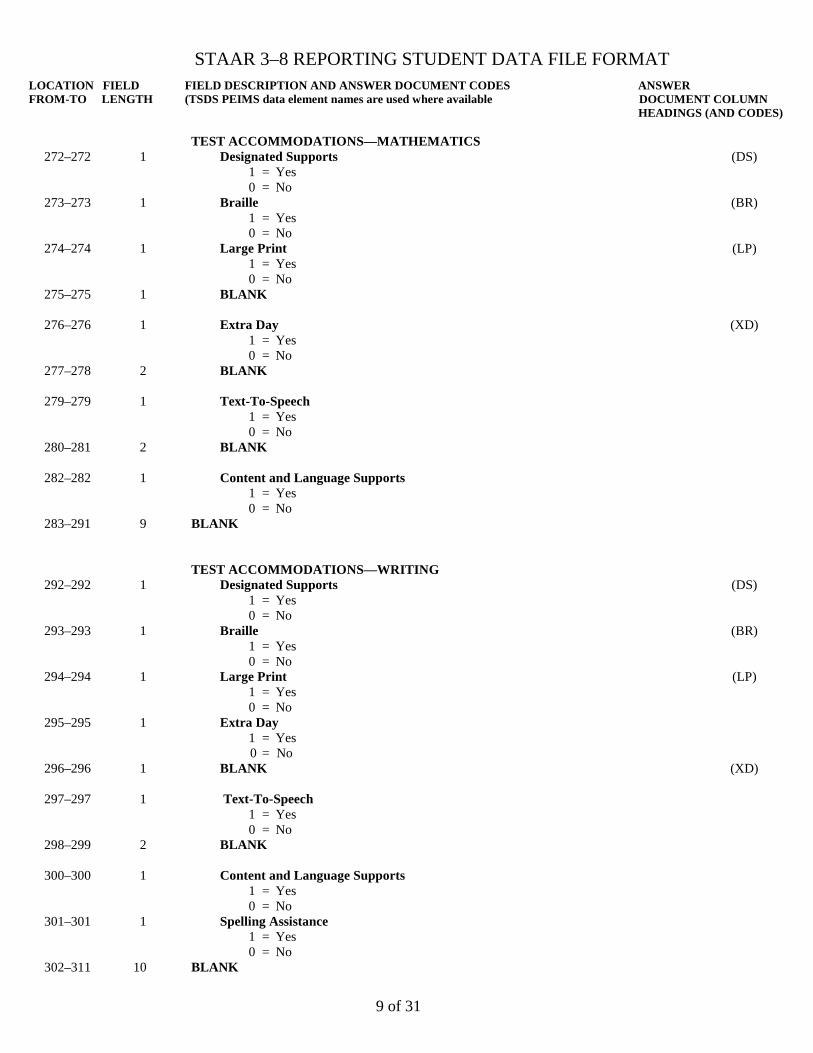
TEST ACCOMMODATIONS—MATHEMATICS
272–272 1 Designated Supports
1 = Yes 0 = No
(DS)
273–273
1 Braille 1 = Yes 0 = No
(BR)
274–274
1 Large Print 1 = Yes 0 = No
(LP)
275–275
1 BLANK
276–276
1 Extra Day 1 = Yes 0 = No
(XD)
277–278
2 BLANK
279–279
1 Text-To-Speech 1 = Yes 0 = No
280–281
2 BLANK
282–282
1 Content and Language Supports 1 = Yes 0 = No
283–291 9 BLANK
TEST ACCOMMODATIONS—WRITING
292–292
1 Designated Supports 1 = Yes 0 = No
(DS)
293–293 1 Braille 1 = Yes 0 = No
(BR)
294–294 1 Large Print 1 = Yes 0 = No
(LP)
295–295 1 Extra Day 1 = Yes 0 = No
296–296 1 BLANK
(XD)
297–297 1 Text-To-Speech 1 = Yes 0 = No
298–299 2 BLANK
300–300 1 Content and Language Supports 1 = Yes 0 = No
301–301 1 Spelling Assistance 1 = Yes 0 = No
302–311 10 BLANK
STAAR 3–8 REPORTING STUDENT DATA FILE FORMAT LOCATION FIELD FIELD DESCRIPTION AND ANSWER DOCUMENT CODES ANSWER FROM-TO LENGTH (TSDS PEIMS data element names are used where available DOCUMENT COLUMN HEADINGS (AND CODES)
10 of 31
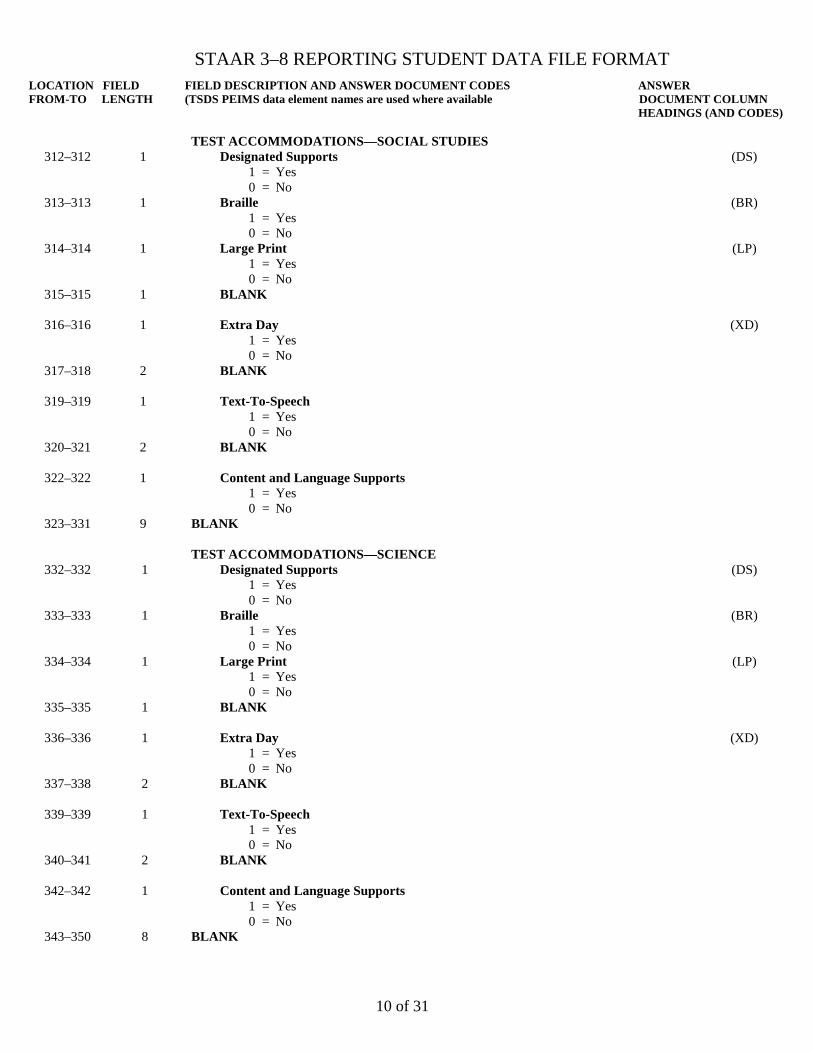
TEST ACCOMMODATIONS—SOCIAL STUDIES
312–312 1 Designated Supports
1 = Yes 0 = No
(DS)
313–313 1 Braille 1 = Yes 0 = No
(BR)
314–314 1 Large Print 1 = Yes 0 = No
(LP)
315–315 1 BLANK
316–316 1 Extra Day 1 = Yes 0 = No
(XD)
317–318 2 BLANK
319–319 1 Text-To-Speech 1 = Yes 0 = No
320–321 2 BLANK
322–322 1 Content and Language Supports 1 = Yes 0 = No
323–331 9 BLANK
TEST ACCOMMODATIONS—SCIENCE 332–332 1 Designated Supports
1 = Yes 0 = No
(DS)
333–333 1 Braille 1 = Yes 0 = No
(BR)
334–334 1 Large Print 1 = Yes 0 = No
(LP)
335–335 1 BLANK
336–336 1 Extra Day 1 = Yes 0 = No
(XD)
337–338 2 BLANK
339–339 1 Text-To-Speech 1 = Yes 0 = No
340–341 2 BLANK
342–342 1 Content and Language Supports 1 = Yes 0 = No
343–350 8 BLANK
STAAR 3–8 REPORTING STUDENT DATA FILE FORMAT LOCATION FIELD FIELD DESCRIPTION AND ANSWER DOCUMENT CODES ANSWER FROM-TO LENGTH (TSDS PEIMS data element names are used where available DOCUMENT COLUMN HEADINGS (AND CODES)
11 of 31
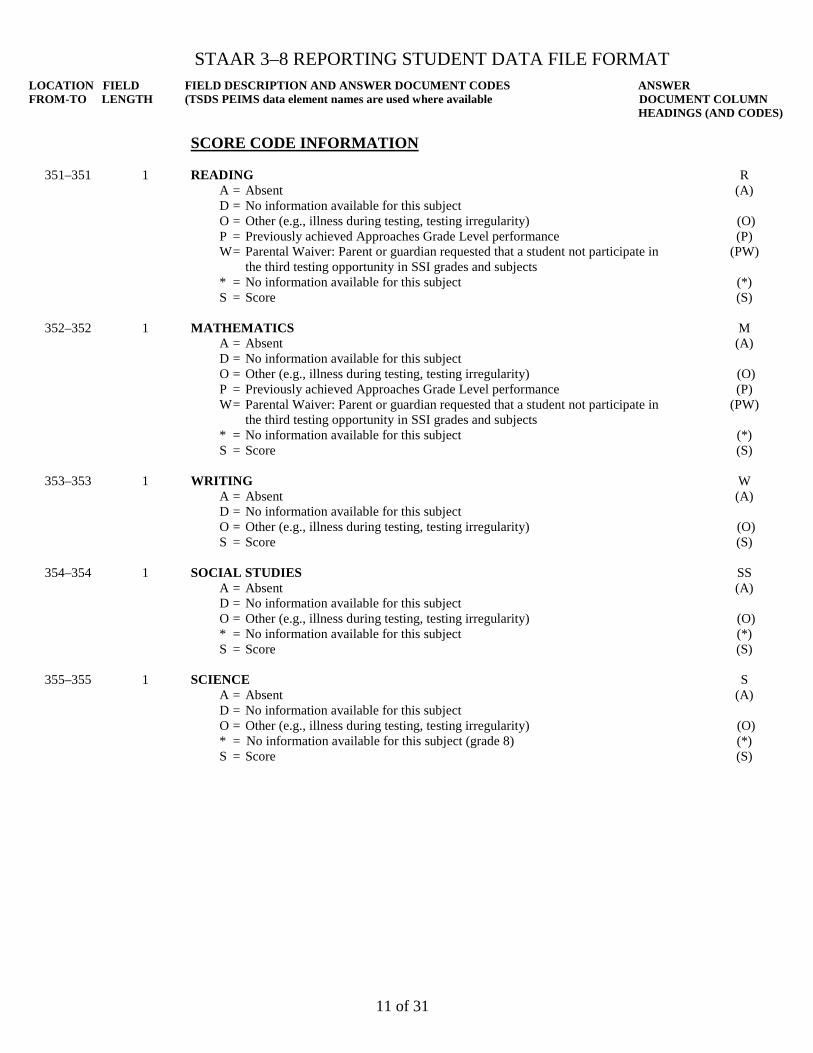
SCORE CODE INFORMATION
351–351 1 READING A = Absent D = No information available for this subject O = Other (e.g., illness during testing, testing irregularity) P = Previously achieved Approaches Grade Level performance W = Parental Waiver: Parent or guardian requested that a student not participate in
the third testing opportunity in SSI grades and subjects * = No information available for this subject S = Score
R (A)
(O) (P)
(PW)
(*) (S)
352–352 1 MATHEMATICS
A = Absent D = No information available for this subject O = Other (e.g., illness during testing, testing irregularity) P = Previously achieved Approaches Grade Level performance W = Parental Waiver: Parent or guardian requested that a student not participate in
the third testing opportunity in SSI grades and subjects * = No information available for this subject S = Score
M (A)
(O) (P)
(PW)
(*) (S)
353–353 1 WRITING
A = Absent D = No information available for this subject O = Other (e.g., illness during testing, testing irregularity) S = Score
W (A)
(O) (S)
354–354 1 SOCIAL STUDIES
A = Absent D = No information available for this subject O = Other (e.g., illness during testing, testing irregularity) * = No information available for this subject S = Score
SS (A)
(O) (*) (S)
355–355 1 SCIENCE A = Absent D = No information available for this subject O = Other (e.g., illness during testing, testing irregularity) * = No information available for this subject (grade 8) S = Score
S (A)
(O) (*) (S)

STAAR 3–8 REPORTING STUDENT DATA FILE FORMAT LOCATION FIELD FIELD DESCRIPTION AND ANSWER DOCUMENT CODES ANSWER FROM-TO LENGTH (TSDS PEIMS data element names are used where available DOCUMENT COLUMN HEADINGS (AND CODES)
12 of 31
SCORE CODE DEFAULT INFORMATION The following information is provided to inform you when a score code is gridded as an “O” and when it is defaulted to an “O” or a “P”.
356–356 1 READING 3 = the score code was defaulted to “P” because the history file indicates that the
student previously achieved Approaches Grade Level performance 2 = the score code was defaulted to “O” because the score code was gridded as “P”
and the student ID information matched the history file but the history file record did not indicate that the student achieved Approaches Grade Level performance
1 = the score code was defaulted to “O” because either the score code was left blank or multiple values were gridded in the score code field
0 = the score code was not defaulted
357–357 1 MATHEMATICS 3 = the score code was defaulted to “P” because the history file indicates that the
student previously achieved Approaches Grade Level performance 2 = the score code was defaulted to “O” because the score code was gridded as “P”
and the student ID information matched the history file but the history file record did not indicate that the student achieved Approaches Grade Level performance
1 = the score code was defaulted to “O” because either the score code was left blank or multiple values were gridded in the score code field
0 = the score code was not defaulted
358–358 1 WRITING 1 = the score code was defaulted to “O” because either the score code was left blank
or multiple values were gridded in the score code field 0 = the score code was not defaulted
359–359 1 SOCIAL STUDIES 1 = the score code was defaulted to “O” because either the score code was left blank
or multiple values were gridded in the score code field 0 = the score code was not defaulted
360–360 1 SCIENCE 1 = the score code was defaulted to “O” because either the score code was left blank
or multiple values were gridded in the score code field 0 = the score code was not defaulted
361–400 40 BLANK

STAAR 3–8 REPORTING STUDENT DATA FILE FORMAT LOCATION FIELD FIELD DESCRIPTION AND ANSWER DOCUMENT CODES ANSWER FROM-TO LENGTH (TSDS PEIMS data element names are used where available DOCUMENT COLUMN HEADINGS (AND CODES)
13 of 31
READING SUBJECT INFORMATIONThe following table shows the number of items for each reporting category and grade tested on the STAAR reading tests.
STAAR
Reporting Category Grade 1 2 3 Total
Reading
3 5 15 14 34 4 8 15 13 36 5 8 16 14 38 6 8 17 15 40 7 8 18 16 42 8 8 19 17 44
401–406 6
READING REPORTING CATEGORY SCORES Number of items correct by reporting category.
407–408 2 READING RAW SCORE
409–412 4 READING SCALE SCORE
413–413 1 READING LANGUAGE VERSION E = English S = Spanish
414–414 1 READING TEST VERSION S = STAAR
415–415 1 READING TEST ADMINISTRATION MODE O = Online test administration P = Paper test administration
(Students who take a STAAR with Embedded Supports test using a test booklet will be designated as having a paper test administration.)
416–422 7 BLANK
423–423 1 MEETS GRADE LEVEL IN READING 1 = Yes 0 = No
424–424 1 APPROACHES GRADE LEVEL IN READING 1 = Yes 0 = No
425–425 1 MASTERS GRADE LEVEL IN READING
1 = Yes 0 = No

STAAR 3–8 REPORTING STUDENT DATA FILE FORMAT LOCATION FIELD FIELD DESCRIPTION AND ANSWER DOCUMENT CODES ANSWER FROM-TO LENGTH (TSDS PEIMS data element names are used where available DOCUMENT COLUMN HEADINGS (AND CODES)
14 of 31
READING STAAR PROGRESS MEASURE INFORMATION
426–426 1 STAAR PROGRESS MEASURE (grades 4–8) Information about the STAAR Progress Measure may be found on TEA’s website at http://tea.texas.gov/student.assessment/staar/. This field will be blank if the STAAR Progress Measure is not applicable for the student’s test or could not be calculated. 2 = Accelerated 1 = Expected 0 = Limited
427–428 2 BLANK
429–429 1 ON TRACK TO MEET GRADE LEVEL Information about the STAAR On-Track measure can be found in the “STAAR On-Track Measure Q&A” document on TEA's website. 1 = Yes 0 = No
The following previous-year data are used in conjunction with the current administration data to determine the STAAR Progress Measure. The previous-year data are only supplied when the current tested grade is 4–8. This area will be blank if the previous-year data are not found.
430–433 4 PREVIOUS-YEAR ADMINISTRATION DATE
434–437 4 PREVIOUS-YEAR SCALE SCORE
438–438 1 PREVIOUS-YEAR LANGUAGE VERSION See position 413 for list of values.
439–439 1 BLANK
440–440 1 PREVIOUS-YEAR SCORE CODE See position 351 for list of values.
441–441 1 BLANK
442–442 1 PREVIOUS-YEAR MASTERS GRADE LEVEL 1 = Yes 0 = No
443–444 2 PREVIOUS-YEAR TESTED GRADE
445–450 6 BLANK
STAAR 3–8 REPORTING STUDENT DATA FILE FORMAT LOCATION FIELD FIELD DESCRIPTION AND ANSWER DOCUMENT CODES ANSWER FROM-TO LENGTH (TSDS PEIMS data element names are used where available DOCUMENT COLUMN HEADINGS (AND CODES)
15 of 31
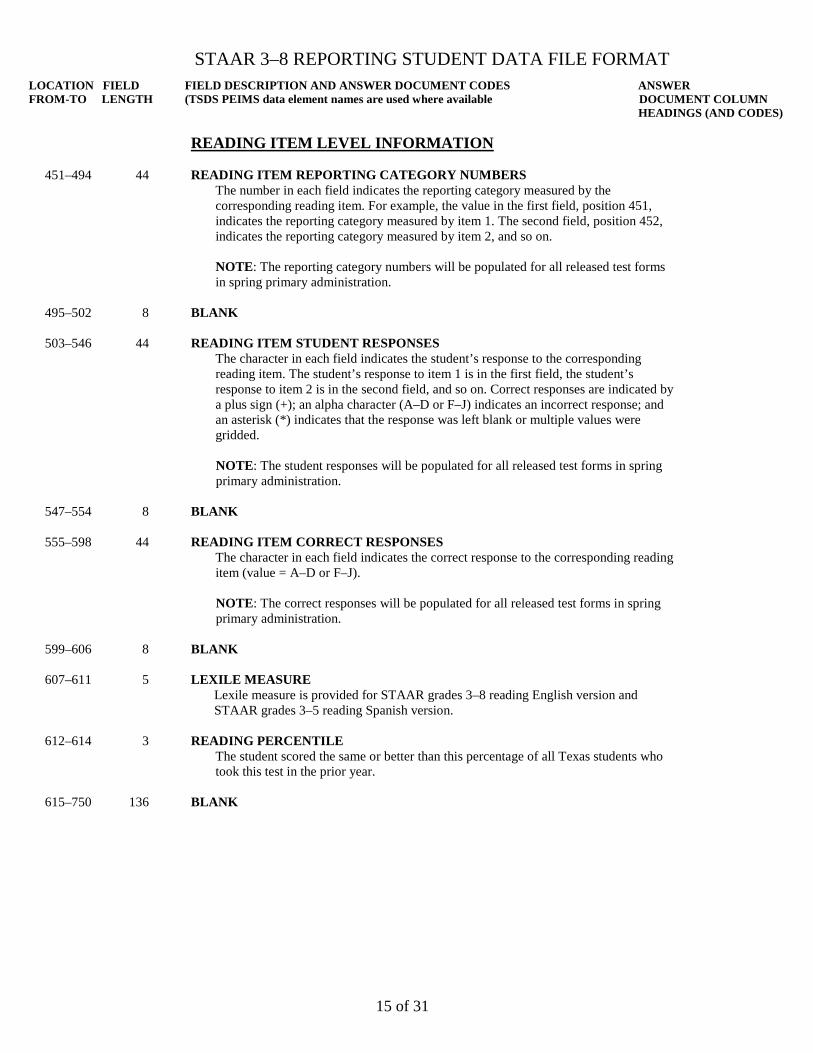
READING ITEM LEVEL INFORMATION
451–494 44 READING ITEM REPORTING CATEGORY NUMBERS The number in each field indicates the reporting category measured by the corresponding reading item. For example, the value in the first field, position 451, indicates the reporting category measured by item 1. The second field, position 452, indicates the reporting category measured by item 2, and so on.
NOTE: The reporting category numbers will be populated for all released test forms in spring primary administration.
495–502 8 BLANK
503–546 44 READING ITEM STUDENT RESPONSES The character in each field indicates the student’s response to the corresponding reading item. The student’s response to item 1 is in the first field, the student’s response to item 2 is in the second field, and so on. Correct responses are indicated by a plus sign (+); an alpha character (A–D or F–J) indicates an incorrect response; and an asterisk (*) indicates that the response was left blank or multiple values were gridded.
NOTE: The student responses will be populated for all released test forms in spring primary administration.
547–554 8 BLANK
555–598 44 READING ITEM CORRECT RESPONSES The character in each field indicates the correct response to the corresponding reading item (value = A–D or F–J).
NOTE: The correct responses will be populated for all released test forms in spring primary administration.
599–606 8 BLANK
607–611 5 LEXILE MEASURE Lexile measure is provided for STAAR grades 3–8 reading English version and STAAR grades 3–5 reading Spanish version.
612–614 3 READING PERCENTILE The student scored the same or better than this percentage of all Texas students who took this test in the prior year.
615–750 136 BLANK
STAAR 3–8 REPORTING STUDENT DATA FILE FORMAT LOCATION FIELD FIELD DESCRIPTION AND ANSWER DOCUMENT CODES ANSWER FROM-TO LENGTH (PEIMS data element names are used where available) DOCUMENT COLUMN HEADINGS (AND CODES)
16 of 31
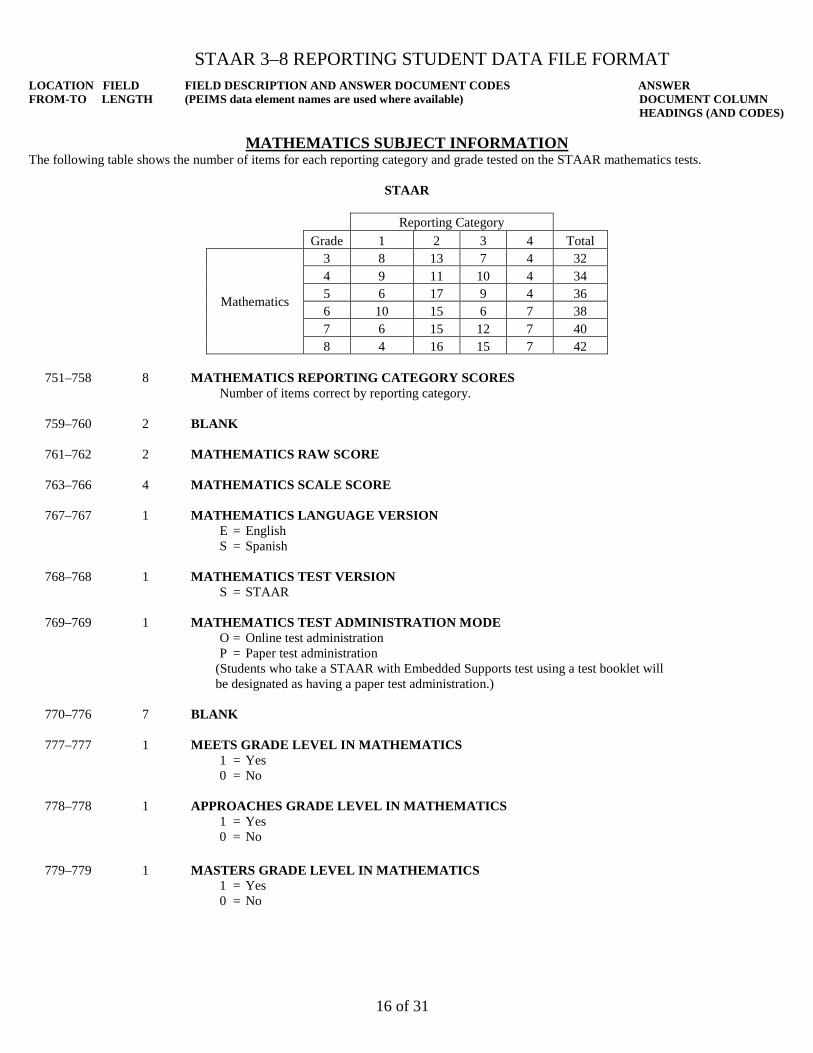
MATHEMATICS SUBJECT INFORMATION The following table shows the number of items for each reporting category and grade tested on the STAAR mathematics tests.
STAAR
Reporting Category Grade 1 2 3 4 Total
Mathematics
3 8 13 7 4 32 4 9 11 10 4 34 5 6 17 9 4 36 6 10 15 6 7 38 7 6 15 12 7 40 8 4 16 15 7 42
751–758 8
MATHEMATICS REPORTING CATEGORY SCORES Number of items correct by reporting category.
759–760 2 BLANK
761–762 2 MATHEMATICS RAW SCORE
763–766 4 MATHEMATICS SCALE SCORE
767–767 1 MATHEMATICS LANGUAGE VERSION E = English S = Spanish
768–768 1 MATHEMATICS TEST VERSION S = STAAR
769–769 1 MATHEMATICS TEST ADMINISTRATION MODE O = Online test administration P = Paper test administration
(Students who take a STAAR with Embedded Supports test using a test booklet will be designated as having a paper test administration.)
770–776 7 BLANK
777–777 1 MEETS GRADE LEVEL IN MATHEMATICS 1 = Yes 0 = No
778–778 1 APPROACHES GRADE LEVEL IN MATHEMATICS 1 = Yes 0 = No
779–779 1 MASTERS GRADE LEVEL IN MATHEMATICS 1 = Yes 0 = No
STAAR 3–8 REPORTING STUDENT DATA FILE FORMAT LOCATION FIELD FIELD DESCRIPTION AND ANSWER DOCUMENT CODES ANSWER FROM-TO LENGTH (PEIMS data element names are used where available) DOCUMENT COLUMN HEADINGS (AND CODES)
17 of 31
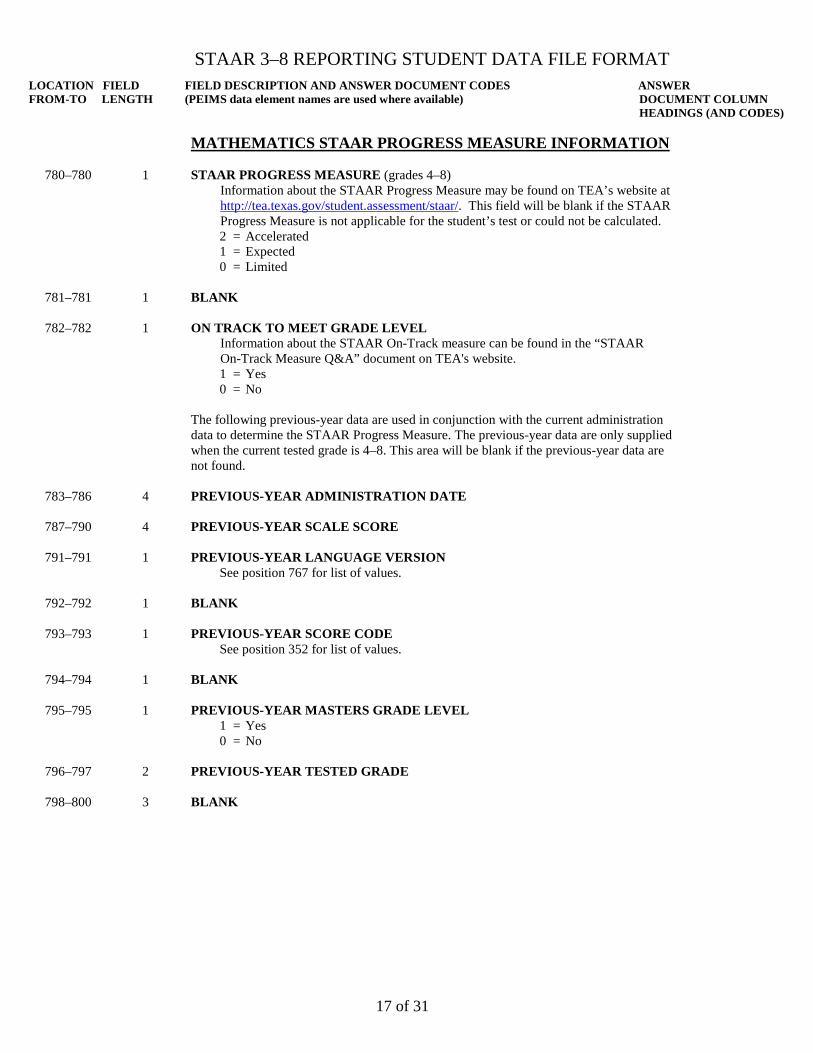
MATHEMATICS STAAR PROGRESS MEASURE INFORMATION
780–780 1 STAAR PROGRESS MEASURE (grades 4–8) Information about the STAAR Progress Measure may be found on TEA’s website at http://tea.texas.gov/student.assessment/staar/. This field will be blank if the STAAR Progress Measure is not applicable for the student’s test or could not be calculated. 2 = Accelerated 1 = Expected 0 = Limited
781–781 1 BLANK
782–782 1 ON TRACK TO MEET GRADE LEVEL Information about the STAAR On-Track measure can be found in the “STAAR On-Track Measure Q&A” document on TEA's website. 1 = Yes 0 = No
The following previous-year data are used in conjunction with the current administration data to determine the STAAR Progress Measure. The previous-year data are only supplied when the current tested grade is 4–8. This area will be blank if the previous-year data are not found.
783–786 4 PREVIOUS-YEAR ADMINISTRATION DATE
787–790 4 PREVIOUS-YEAR SCALE SCORE
791–791 1 PREVIOUS-YEAR LANGUAGE VERSION See position 767 for list of values.
792–792 1 BLANK
793–793 1 PREVIOUS-YEAR SCORE CODE See position 352 for list of values.
794–794 1 BLANK
795–795 1 PREVIOUS-YEAR MASTERS GRADE LEVEL 1 = Yes 0 = No
796–797 2 PREVIOUS-YEAR TESTED GRADE
798–800 3 BLANK
STAAR 3–8 REPORTING STUDENT DATA FILE FORMAT LOCATION FIELD FIELD DESCRIPTION AND ANSWER DOCUMENT CODES ANSWER FROM-TO LENGTH (PEIMS data element names are used where available) DOCUMENT COLUMN HEADINGS (AND CODES)
18 of 31
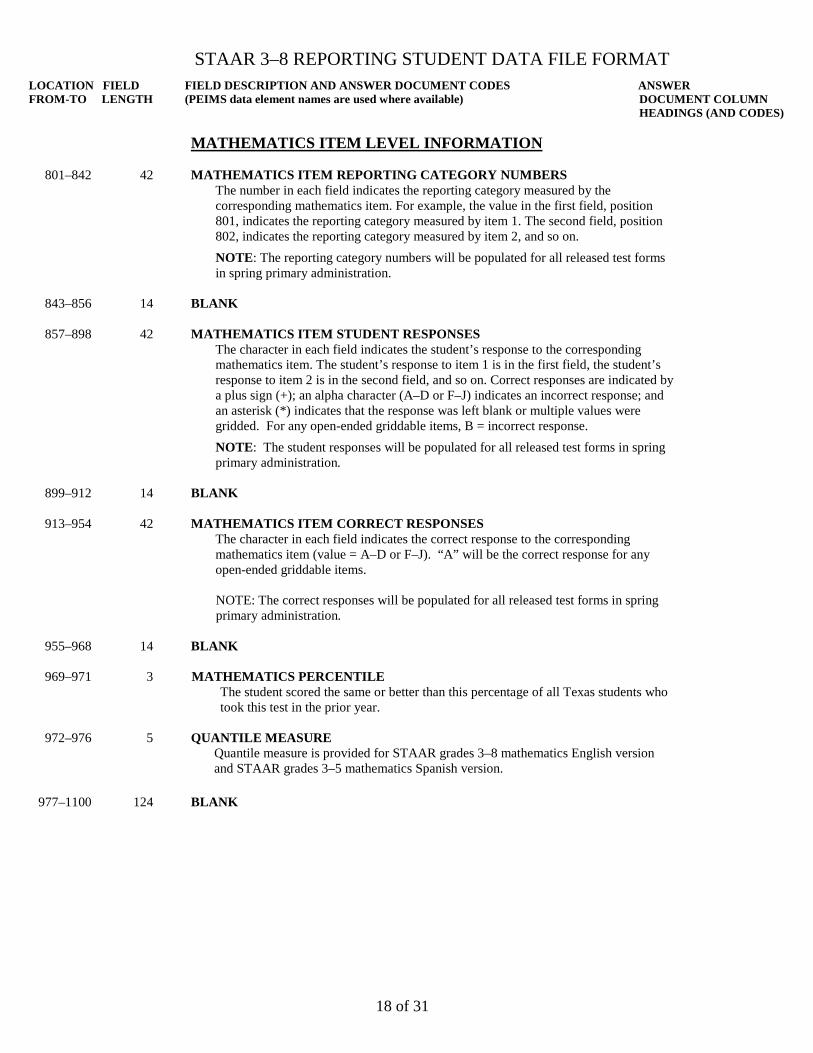
MATHEMATICS ITEM LEVEL INFORMATION
801–842 42 MATHEMATICS ITEM REPORTING CATEGORY NUMBERS The number in each field indicates the reporting category measured by the corresponding mathematics item. For example, the value in the first field, position 801, indicates the reporting category measured by item 1. The second field, position 802, indicates the reporting category measured by item 2, and so on.
NOTE: The reporting category numbers will be populated for all released test forms in spring primary administration.
843–856 14 BLANK
857–898 42 MATHEMATICS ITEM STUDENT RESPONSES The character in each field indicates the student’s response to the corresponding mathematics item. The student’s response to item 1 is in the first field, the student’s response to item 2 is in the second field, and so on. Correct responses are indicated by a plus sign (+); an alpha character (A–D or F–J) indicates an incorrect response; and an asterisk (*) indicates that the response was left blank or multiple values were gridded. For any open-ended griddable items, B = incorrect response.
NOTE: The student responses will be populated for all released test forms in spring primary administration.
899–912 14 BLANK
913–954 42 MATHEMATICS ITEM CORRECT RESPONSES The character in each field indicates the correct response to the corresponding mathematics item (value = A–D or F–J). “A” will be the correct response for any open-ended griddable items.
NOTE: The correct responses will be populated for all released test forms in spring primary administration.
955–968 14 BLANK
969–971 3 MATHEMATICS PERCENTILE The student scored the same or better than this percentage of all Texas students who took this test in the prior year.
972–976 5 QUANTILE MEASURE Quantile measure is provided for STAAR grades 3–8 mathematics English version and STAAR grades 3–5 mathematics Spanish version.
977–1100 124 BLANK
STAAR 3–8 REPORTING STUDENT DATA FILE FORMAT LOCATION FIELD FIELD DESCRIPTION AND ANSWER DOCUMENT CODES ANSWER FROM-TO LENGTH (PEIMS data element names are used where available) DOCUMENT COLUMN HEADINGS (AND CODES)
19 of 31
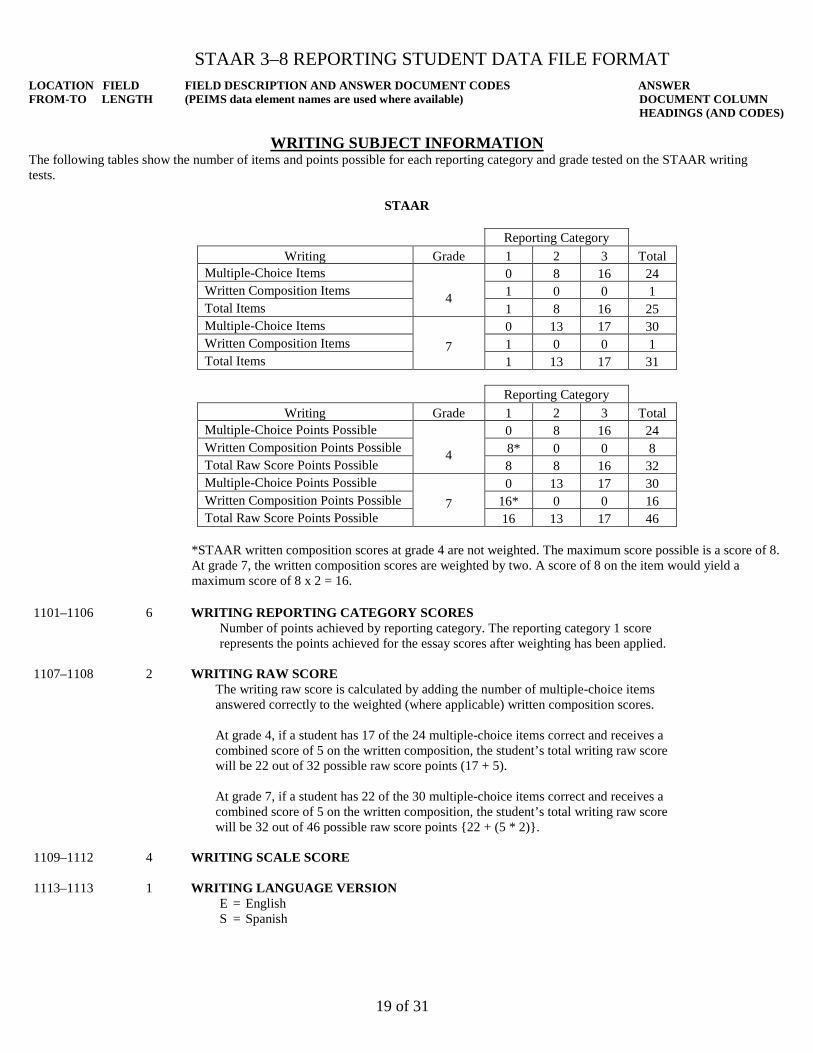
WRITING SUBJECT INFORMATION The following tables show the number of items and points possible for each reporting category and grade tested on the STAAR writing tests.
STAAR
Reporting Category Writing Grade 1 2 3 Total
Multiple-Choice Items
4
0 8 16 24 Written Composition Items 1 0 0 1 Total Items 1 8 16 25 Multiple-Choice Items
7
0 13 17 30 Written Composition Items 1 0 0 1 Total Items 1 13 17 31
Reporting Category
Writing Grade 1 2 3 Total Multiple-Choice Points Possible
4
0 8 16 24 Written Composition Points Possible 8* 0 0 8 Total Raw Score Points Possible 8 8 16 32 Multiple-Choice Points Possible
7
0 13 17 30 Written Composition Points Possible 16* 0 0 16 Total Raw Score Points Possible 16 13 17 46
*STAAR written composition scores at grade 4 are not weighted. The maximum score possible is a score of 8. At grade 7, the written composition scores are weighted by two. A score of 8 on the item would yield a maximum score of 8 x 2 = 16.
1101–1106 6
WRITING REPORTING CATEGORY SCORES Number of points achieved by reporting category. The reporting category 1 score represents the points achieved for the essay scores after weighting has been applied.
1107–1108 2 WRITING RAW SCORE The writing raw score is calculated by adding the number of multiple-choice items answered correctly to the weighted (where applicable) written composition scores. At grade 4, if a student has 17 of the 24 multiple-choice items correct and receives a combined score of 5 on the written composition, the student’s total writing raw score will be 22 out of 32 possible raw score points (17 + 5). At grade 7, if a student has 22 of the 30 multiple-choice items correct and receives a combined score of 5 on the written composition, the student’s total writing raw score will be 32 out of 46 possible raw score points {22 + (5 * 2)}.
1109–1112 4 WRITING SCALE SCORE
1113–1113
1 WRITING LANGUAGE VERSION E = English S = Spanish

STAAR 3–8 REPORTING STUDENT DATA FILE FORMAT LOCATION FIELD FIELD DESCRIPTION AND ANSWER DOCUMENT CODES ANSWER FROM-TO LENGTH (PEIMS data element names are used where available) DOCUMENT COLUMN HEADINGS (AND CODES)
20 of 31
1114–1114 1
WRITING TEST VERSION S = STAAR
1115–1115 1 WRITING TEST ADMINISTRATION MODE O = Online test administration P = Paper test administration
(Students who take a STAAR with Embedded Supports test using a test booklet will be designated as having a paper test administration.)
1116–1122 7 BLANK
1123–1123 1 MEETS GRADE LEVEL IN WRITING 1 = Yes 0 = No
1124–1124 1 APPROACHES GRADE LEVEL IN WRITING 1 = Yes 0 = No
1125–1125 1 MASTERS GRADE LEVEL IN WRITING 1 = Yes 0 = No
1126–1126 1 WRITTEN COMPOSITION SCORE Two ratings (0–4) are added together to determine the final STAAR written composition score. Possible scores for the STAAR written compositions are 0 and 2–8. The type of writing for STAAR written compositions is expository. The description for each STAAR score point is listed below. 0 = Nonscorable 2 = Very Limited 3 = Between Very Limited and Basic 4 = Basic 5 = Between Basic and Satisfactory 6 = Satisfactory 7 = Between Satisfactory and Accomplished 8 = Accomplished
1127–1200 74 BLANK
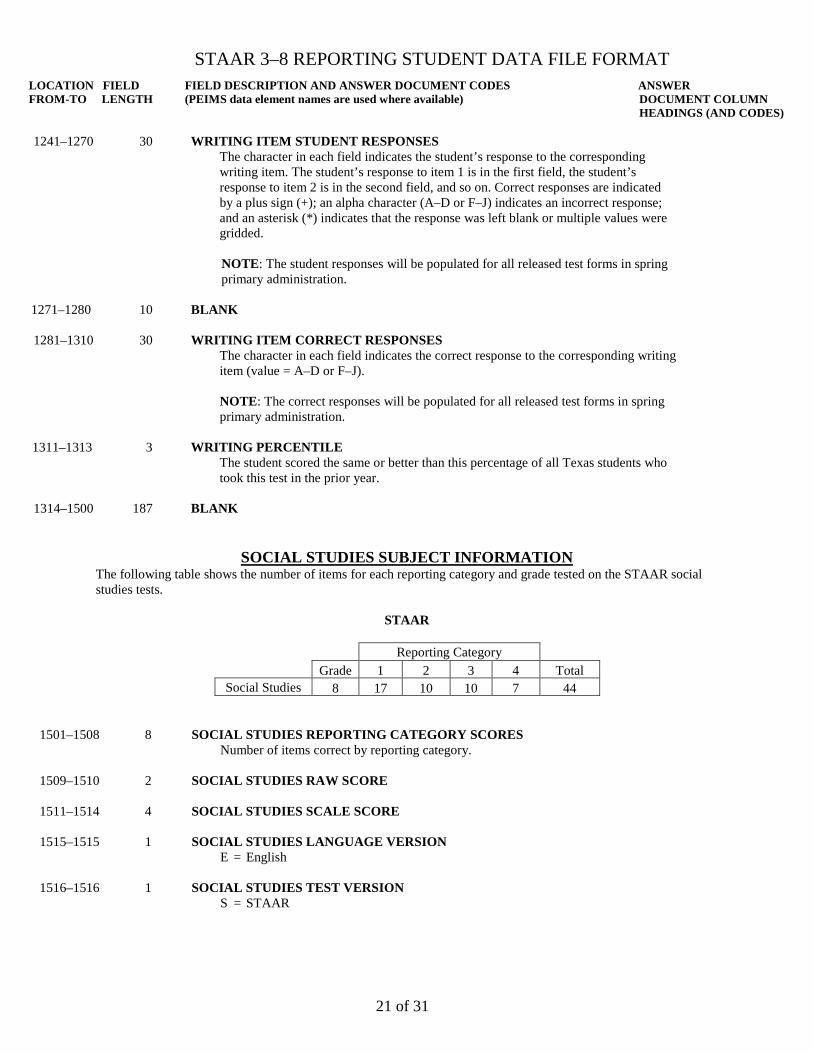
WRITING ITEM LEVEL INFORMATION
1201–1230 30
WRITING ITEM REPORTING CATEGORY NUMBERS The number in each field indicates the reporting category measured by the corresponding writing item. For example, the value in the first field, position 1201, indicates the reporting category measured by item 1. The second field, position 1202, indicates the reporting category measured by item 2, and so on.
NOTE: The reporting category numbers will be populated for all released test forms in spring primary administration.
1231–1240 10 BLANK
STAAR 3–8 REPORTING STUDENT DATA FILE FORMAT LOCATION FIELD FIELD DESCRIPTION AND ANSWER DOCUMENT CODES ANSWER FROM-TO LENGTH (PEIMS data element names are used where available) DOCUMENT COLUMN HEADINGS (AND CODES)
21 of 31
1241–1270 30
WRITING ITEM STUDENT RESPONSES The character in each field indicates the student’s response to the corresponding writing item. The student’s response to item 1 is in the first field, the student’s response to item 2 is in the second field, and so on. Correct responses are indicated by a plus sign (+); an alpha character (A–D or F–J) indicates an incorrect response; and an asterisk (*) indicates that the response was left blank or multiple values were gridded. NOTE: The student responses will be populated for all released test forms in spring primary administration.
1271–1280 10 BLANK
1281–1310 30 WRITING ITEM CORRECT RESPONSES The character in each field indicates the correct response to the corresponding writing item (value = A–D or F–J).
NOTE: The correct responses will be populated for all released test forms in spring primary administration.
1311–1313 3 WRITING PERCENTILE The student scored the same or better than this percentage of all Texas students who
took this test in the prior year.
1314–1500 187 BLANK
SOCIAL STUDIES SUBJECT INFORMATION The following table shows the number of items for each reporting category and grade tested on the STAAR social studies tests.
STAAR
Reporting Category Grade 1 2 3 4 Total
Social Studies 8 17 10 10 7 44
1501–1508 8
SOCIAL STUDIES REPORTING CATEGORY SCORES Number of items correct by reporting category.
1509–1510 2 SOCIAL STUDIES RAW SCORE
1511–1514 4 SOCIAL STUDIES SCALE SCORE
1515–1515 1 SOCIAL STUDIES LANGUAGE VERSION E = English
1516–1516 1 SOCIAL STUDIES TEST VERSION S = STAAR
STAAR 3–8 REPORTING STUDENT DATA FILE FORMAT LOCATION FIELD FIELD DESCRIPTION AND ANSWER DOCUMENT CODES ANSWER FROM-TO LENGTH (PEIMS data element names are used where available) DOCUMENT COLUMN HEADINGS (AND CODES)
22 of 31
1517–1517 1
SOCIAL STUDIES TEST ADMINISTRATION MODE O = Online test administration P = Paper test administration
(Students who take a STAAR with Embedded Supports test using a test booklet will be designated as having a paper test administration.)
1518–1524 7 BLANK
1525–1525 1 MEETS GRADE LEVEL IN SOCIAL STUDIES 1 = Yes 0 = No
1526–1526 1 APPROACHES GRADE LEVEL IN SOCIAL STUDIES 1 = Yes 0 = No
1527–1527 1 MASTERS GRADE LEVEL IN SOCIAL STUDIES 1 = Yes 0 = No
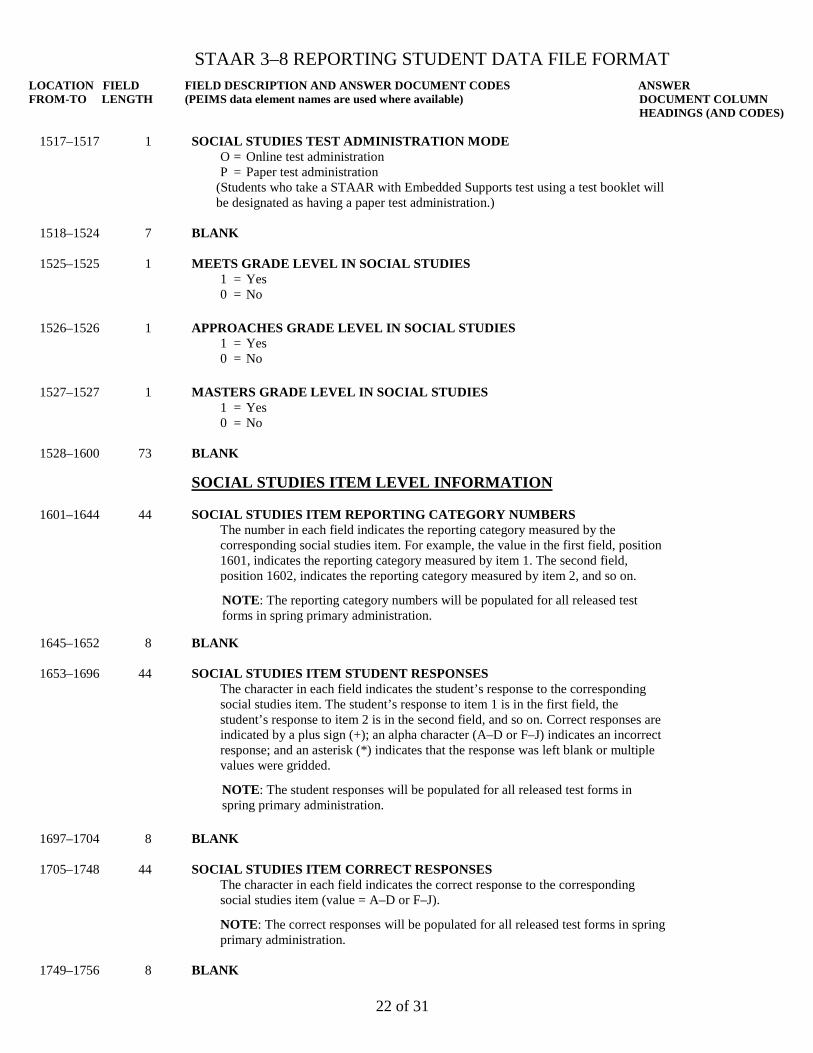
1528–1600 73 BLANK
SOCIAL STUDIES ITEM LEVEL INFORMATION
1601–1644 44 SOCIAL STUDIES ITEM REPORTING CATEGORY NUMBERS The number in each field indicates the reporting category measured by the corresponding social studies item. For example, the value in the first field, position 1601, indicates the reporting category measured by item 1. The second field, position 1602, indicates the reporting category measured by item 2, and so on.
NOTE: The reporting category numbers will be populated for all released test forms in spring primary administration.
1645–1652 8 BLANK
1653–1696 44 SOCIAL STUDIES ITEM STUDENT RESPONSES The character in each field indicates the student’s response to the corresponding social studies item. The student’s response to item 1 is in the first field, the student’s response to item 2 is in the second field, and so on. Correct responses are indicated by a plus sign (+); an alpha character (A–D or F–J) indicates an incorrect response; and an asterisk (*) indicates that the response was left blank or multiple values were gridded.
NOTE: The student responses will be populated for all released test forms in spring primary administration.
1697–1704 8 BLANK
1705–1748 44 SOCIAL STUDIES ITEM CORRECT RESPONSES The character in each field indicates the correct response to the corresponding social studies item (value = A–D or F–J).
NOTE: The correct responses will be populated for all released test forms in spring primary administration.
1749–1756 8 BLANK
STAAR 3–8 REPORTING STUDENT DATA FILE FORMAT LOCATION FIELD FIELD DESCRIPTION AND ANSWER DOCUMENT CODES ANSWER FROM-TO LENGTH (PEIMS data element names are used where available) DOCUMENT COLUMN HEADINGS (AND CODES)
23 of 31
1757–1759 3
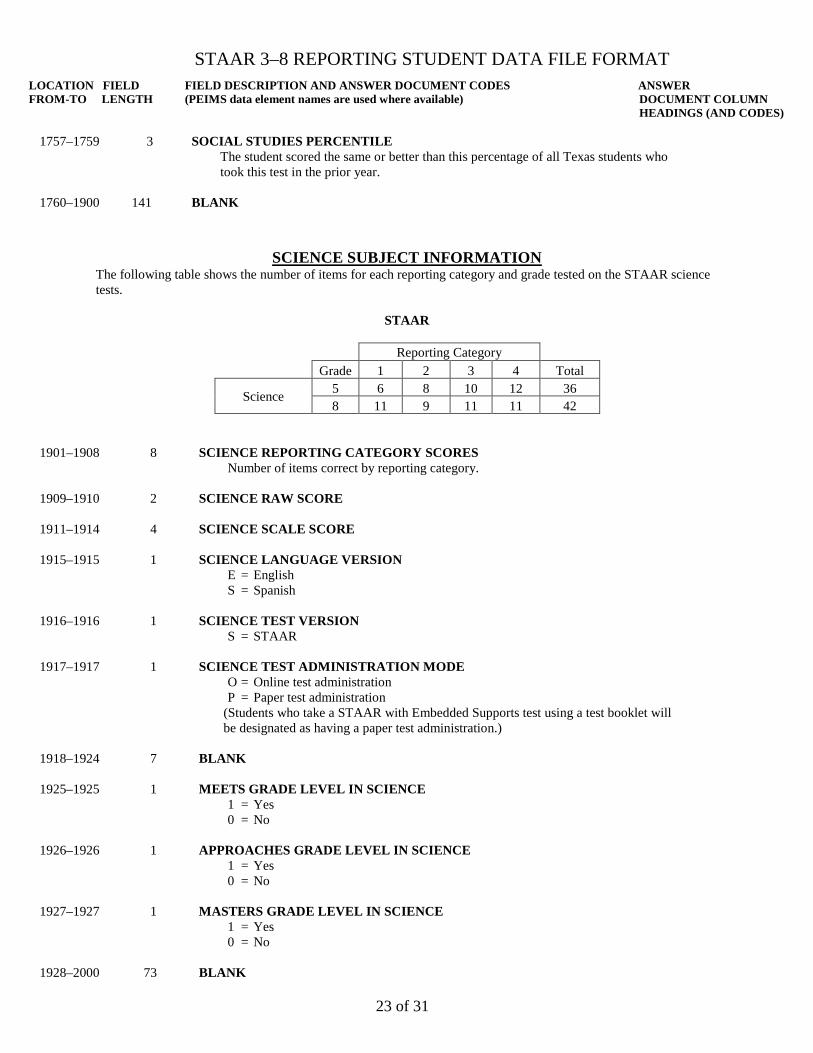
SOCIAL STUDIES PERCENTILE The student scored the same or better than this percentage of all Texas students who took this test in the prior year.
1760–1900 141 BLANK
SCIENCE SUBJECT INFORMATION
The following table shows the number of items for each reporting category and grade tested on the STAAR science tests.
STAAR
Reporting Category Grade 1 2 3 4 Total
Science 5 6 8 10 12 36 8 11 9 11 11 42
1901–1908 8
SCIENCE REPORTING CATEGORY SCORES Number of items correct by reporting category.
1909–1910 2 SCIENCE RAW SCORE
1911–1914 4 SCIENCE SCALE SCORE
1915–1915 1 SCIENCE LANGUAGE VERSION E = English S = Spanish
1916–1916 1 SCIENCE TEST VERSION S = STAAR
1917–1917 1 SCIENCE TEST ADMINISTRATION MODE O = Online test administration P = Paper test administration
(Students who take a STAAR with Embedded Supports test using a test booklet will be designated as having a paper test administration.)
1918–1924 7 BLANK
1925–1925 1 MEETS GRADE LEVEL IN SCIENCE 1 = Yes 0 = No
1926–1926 1 APPROACHES GRADE LEVEL IN SCIENCE 1 = Yes 0 = No
1927–1927 1 MASTERS GRADE LEVEL IN SCIENCE 1 = Yes 0 = No
1928–2000 73 BLANK
STAAR 3–8 REPORTING STUDENT DATA FILE FORMAT LOCATION FIELD FIELD DESCRIPTION AND ANSWER DOCUMENT CODES ANSWER FROM-TO LENGTH (PEIMS data element names are used where available) DOCUMENT COLUMN HEADINGS (AND CODES)
24 of 31
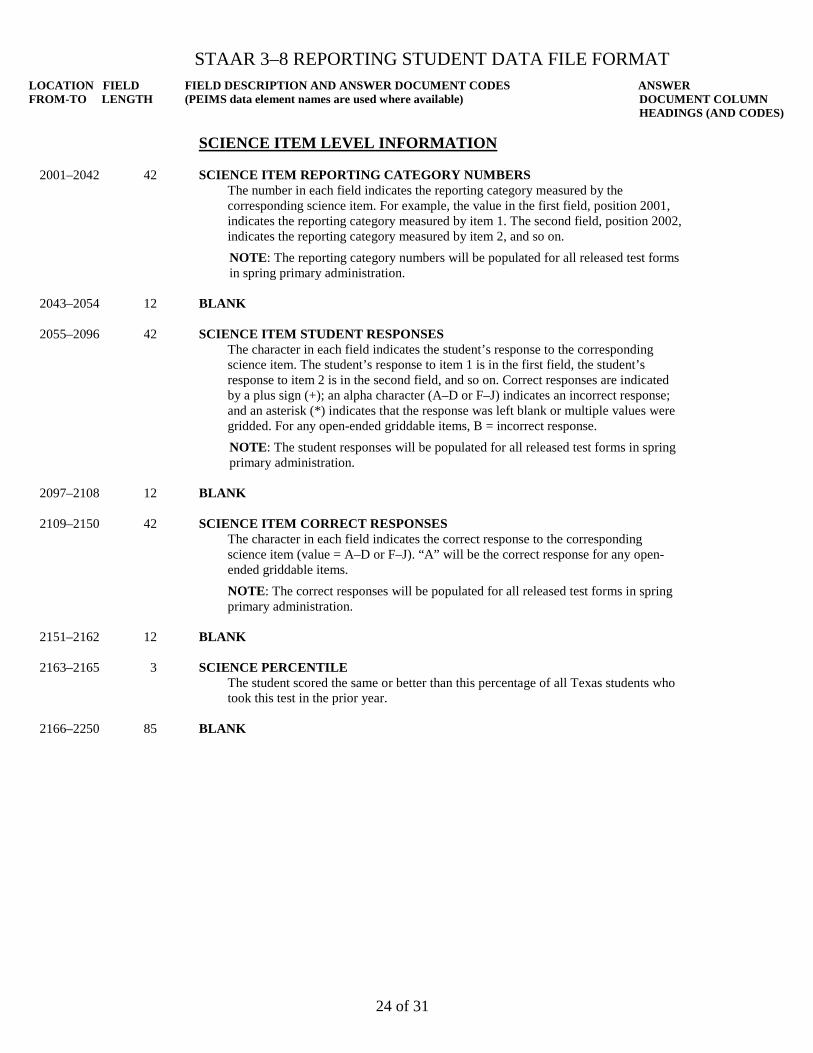
SCIENCE ITEM LEVEL INFORMATION
2001–2042 42 SCIENCE ITEM REPORTING CATEGORY NUMBERS The number in each field indicates the reporting category measured by the corresponding science item. For example, the value in the first field, position 2001, indicates the reporting category measured by item 1. The second field, position 2002, indicates the reporting category measured by item 2, and so on.
NOTE: The reporting category numbers will be populated for all released test forms in spring primary administration.
2043–2054 12 BLANK
2055–2096 42 SCIENCE ITEM STUDENT RESPONSES
The character in each field indicates the student’s response to the corresponding science item. The student’s response to item 1 is in the first field, the student’s response to item 2 is in the second field, and so on. Correct responses are indicated by a plus sign (+); an alpha character (A–D or F–J) indicates an incorrect response; and an asterisk (*) indicates that the response was left blank or multiple values were gridded. For any open-ended griddable items, B = incorrect response.
NOTE: The student responses will be populated for all released test forms in spring primary administration.
2097–2108 12 BLANK
2109–2150 42 SCIENCE ITEM CORRECT RESPONSES The character in each field indicates the correct response to the corresponding science item (value = A–D or F–J). “A” will be the correct response for any open-ended griddable items.
NOTE: The correct responses will be populated for all released test forms in spring primary administration.
2151–2162 12 BLANK
2163–2165 3 SCIENCE PERCENTILE The student scored the same or better than this percentage of all Texas students who took this test in the prior year.
2166–2250 85 BLANK
STAAR 3–8 REPORTING STUDENT DATA FILE FORMAT LOCATION FIELD FIELD DESCRIPTION AND ANSWER DOCUMENT CODES ANSWER FROM-TO LENGTH (PEIMS data element names are used where available) DOCUMENT COLUMN HEADINGS (AND CODES)
25 of 31
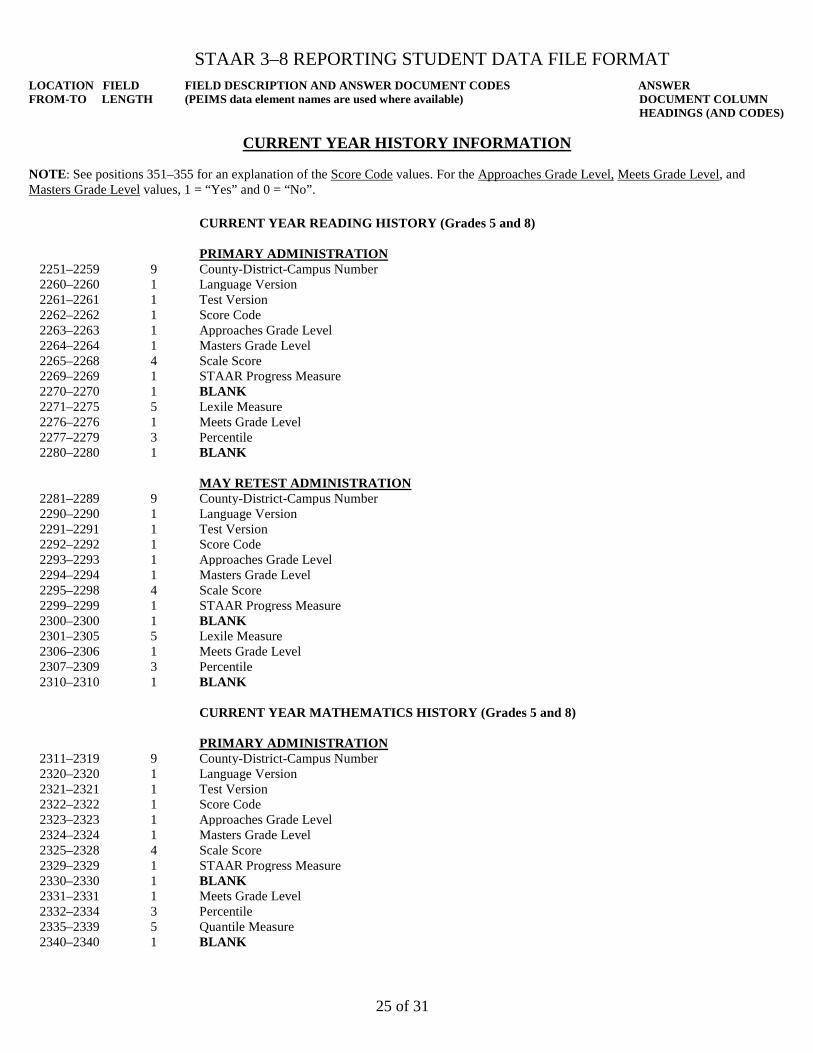
CURRENT YEAR HISTORY INFORMATION NOTE: See positions 351–355 for an explanation of the Score Code values. For the Approaches Grade Level, Meets Grade Level, and Masters Grade Level values, 1 = “Yes” and 0 = “No”.
CURRENT YEAR READING HISTORY (Grades 5 and 8)
PRIMARY ADMINISTRATION 2251–2259 9 County-District-Campus Number 2260–2260 1 Language Version 2261–2261 1 Test Version 2262–2262 1 Score Code 2263–2263 1 Approaches Grade Level 2264–2264 1 Masters Grade Level 2265–2268 4 Scale Score 2269–2269 1 STAAR Progress Measure 2270–2270 1 BLANK 2271–2275 5 Lexile Measure 2276–2276 1 Meets Grade Level 2277–2279 3 Percentile 2280–2280 1 BLANK
MAY RETEST ADMINISTRATION 2281–2289 9 County-District-Campus Number 2290–2290 1 Language Version 2291–2291 1 Test Version 2292–2292 1 Score Code 2293–2293 1 Approaches Grade Level 2294–2294 1 Masters Grade Level 2295–2298 4 Scale Score 2299–2299 1 STAAR Progress Measure 2300–2300 1 BLANK 2301–2305 5 Lexile Measure 2306–2306 1 Meets Grade Level 2307–2309 3 Percentile 2310–2310 1 BLANK
CURRENT YEAR MATHEMATICS HISTORY (Grades 5 and 8)
PRIMARY ADMINISTRATION 2311–2319 9 County-District-Campus Number 2320–2320 1 Language Version 2321–2321 1 Test Version 2322–2322 1 Score Code 2323–2323 1 Approaches Grade Level 2324–2324 1 Masters Grade Level 2325–2328 4 Scale Score 2329–2329 1 STAAR Progress Measure 2330–2330 1 BLANK 2331–2331 1 Meets Grade Level 2332–2334 3 Percentile 2335–2339 5 Quantile Measure 2340–2340 1 BLANK
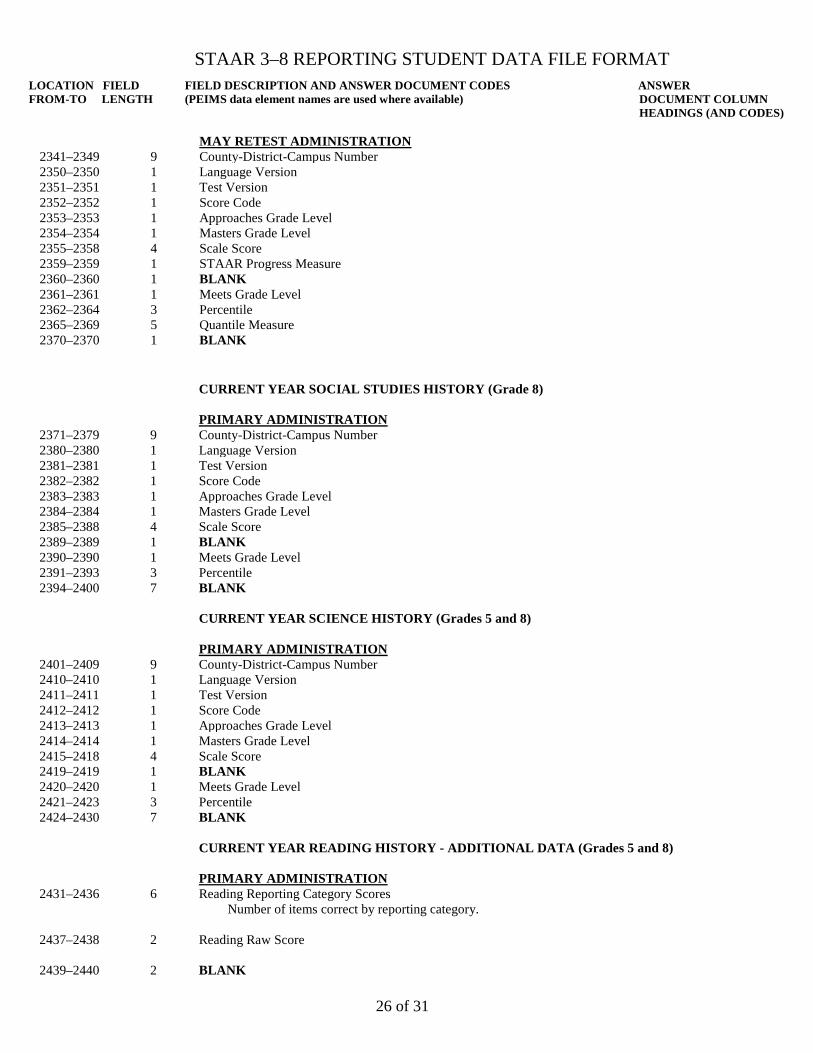
STAAR 3–8 REPORTING STUDENT DATA FILE FORMAT LOCATION FIELD FIELD DESCRIPTION AND ANSWER DOCUMENT CODES ANSWER FROM-TO LENGTH (PEIMS data element names are used where available) DOCUMENT COLUMN HEADINGS (AND CODES)
26 of 31
MAY RETEST ADMINISTRATION
2341–2349 9 County-District-Campus Number 2350–2350 1 Language Version 2351–2351 1 Test Version 2352–2352 1 Score Code 2353–2353 1 Approaches Grade Level 2354–2354 1 Masters Grade Level 2355–2358 4 Scale Score 2359–2359 1 STAAR Progress Measure 2360–2360 2361–2361 2362–2364
1 1 3
BLANK Meets Grade Level Percentile
2365–2369 5 Quantile Measure 2370–2370 1 BLANK
CURRENT YEAR SOCIAL STUDIES HISTORY (Grade 8)
PRIMARY ADMINISTRATION 2371–2379 9 County-District-Campus Number 2380–2380 1 Language Version 2381–2381 1 Test Version 2382–2382 1 Score Code 2383–2383 1 Approaches Grade Level 2384–2384 1 Masters Grade Level 2385–2388 4 Scale Score 2389–2389 1 BLANK 2390–2390 1 Meets Grade Level 2391–2393 3 Percentile 2394–2400 7 BLANK
CURRENT YEAR SCIENCE HISTORY (Grades 5 and 8)
PRIMARY ADMINISTRATION 2401–2409 9 County-District-Campus Number 2410–2410 1 Language Version 2411–2411 1 Test Version 2412–2412 1 Score Code 2413–2413 1 Approaches Grade Level 2414–2414 1 Masters Grade Level 2415–2418 4 Scale Score 2419–2419 2420–2420 2421–2423
1 1 3
BLANK Meets Grade Level Percentile
2424–2430 7 BLANK
CURRENT YEAR READING HISTORY - ADDITIONAL DATA (Grades 5 and 8) PRIMARY ADMINISTRATION
2431–2436 6 Reading Reporting Category Scores Number of items correct by reporting category.
2437–2438 2 Reading Raw Score
2439–2440 2 BLANK
STAAR 3–8 REPORTING STUDENT DATA FILE FORMAT LOCATION FIELD FIELD DESCRIPTION AND ANSWER DOCUMENT CODES ANSWER FROM-TO LENGTH (PEIMS data element names are used where available) DOCUMENT COLUMN HEADINGS (AND CODES)
27 of 31
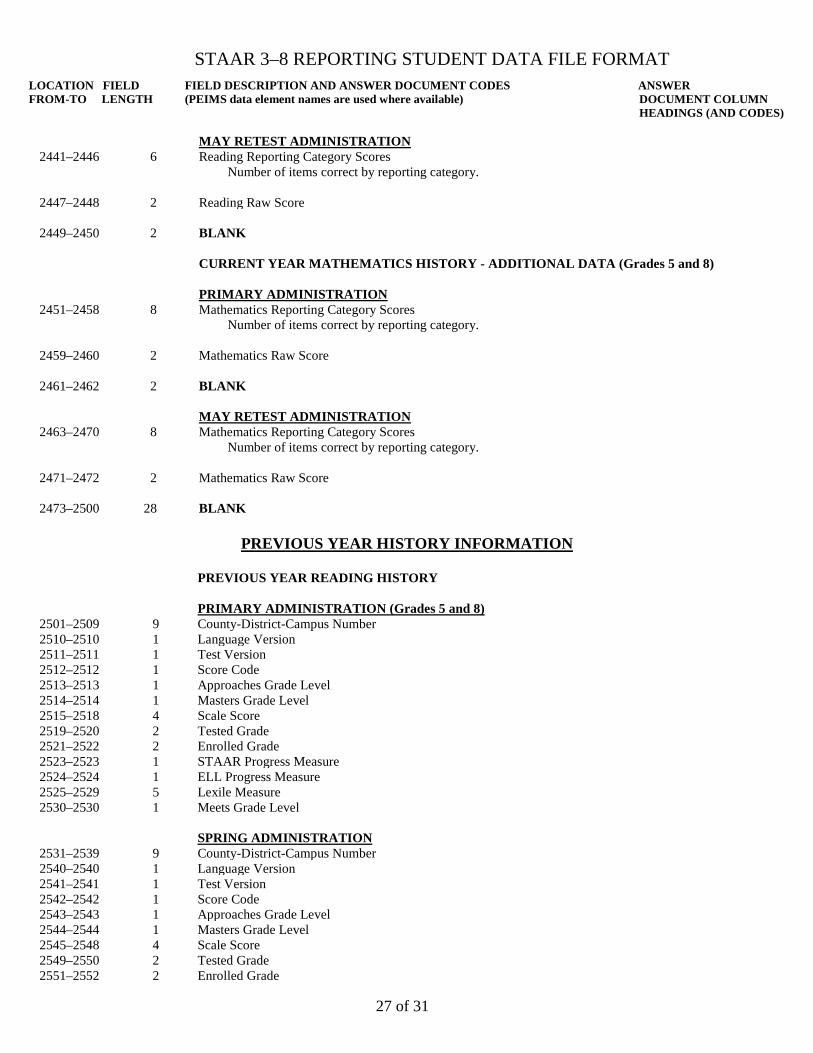
MAY RETEST ADMINISTRATION
2441–2446 6 Reading Reporting Category Scores
Number of items correct by reporting category.
2447–2448 2 Reading Raw Score
2449–2450 2 BLANK CURRENT YEAR MATHEMATICS HISTORY - ADDITIONAL DATA (Grades 5 and 8) PRIMARY ADMINISTRATION
2451–2458 8 Mathematics Reporting Category Scores Number of items correct by reporting category.
2459–2460 2 Mathematics Raw Score
2461–2462 2 BLANK MAY RETEST ADMINISTRATION
2463–2470 8 Mathematics Reporting Category Scores Number of items correct by reporting category.
2471–2472 2 Mathematics Raw Score
2473–2500 28 BLANK
PREVIOUS YEAR HISTORY INFORMATION
PREVIOUS YEAR READING HISTORY
PRIMARY ADMINISTRATION (Grades 5 and 8) 2501–2509 9 County-District-Campus Number 2510–2510 1 Language Version 2511–2511 1 Test Version 2512–2512 1 Score Code 2513–2513 1 Approaches Grade Level 2514–2514 1 Masters Grade Level 2515–2518 4 Scale Score 2519–2520 2 Tested Grade 2521–2522 2 Enrolled Grade 2523–2523 1 STAAR Progress Measure 2524–2524 1 ELL Progress Measure 2525–2529 5 Lexile Measure 2530–2530 1 Meets Grade Level
SPRING ADMINISTRATION 2531–2539 9 County-District-Campus Number 2540–2540 1 Language Version 2541–2541 1 Test Version 2542–2542 1 Score Code 2543–2543 1 Approaches Grade Level 2544–2544 1 Masters Grade Level 2545–2548 4 Scale Score 2549–2550 2 Tested Grade 2551–2552 2 Enrolled Grade
STAAR 3–8 REPORTING STUDENT DATA FILE FORMAT LOCATION FIELD FIELD DESCRIPTION AND ANSWER DOCUMENT CODES ANSWER FROM-TO LENGTH (PEIMS data element names are used where available) DOCUMENT COLUMN HEADINGS (AND CODES)
28 of 31
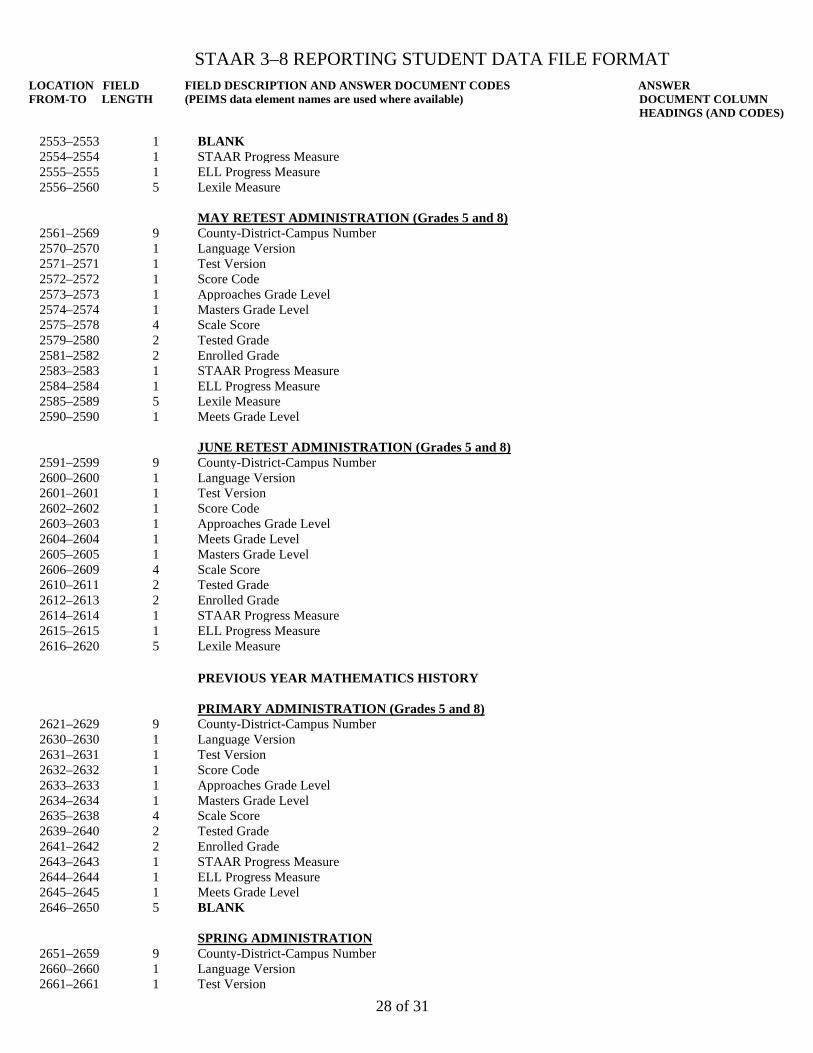
2553–2553 1
BLANK
2554–2554 1 STAAR Progress Measure 2555–2555 1 ELL Progress Measure 2556–2560 5 Lexile Measure
MAY RETEST ADMINISTRATION (Grades 5 and 8) 2561–2569 9 County-District-Campus Number 2570–2570 1 Language Version 2571–2571 1 Test Version 2572–2572 1 Score Code 2573–2573 1 Approaches Grade Level 2574–2574 1 Masters Grade Level 2575–2578 4 Scale Score 2579–2580 2 Tested Grade 2581–2582 2 Enrolled Grade 2583–2583 1 STAAR Progress Measure 2584–2584 1 ELL Progress Measure 2585–2589 5 Lexile Measure 2590–2590 1 Meets Grade Level
JUNE RETEST ADMINISTRATION (Grades 5 and 8) 2591–2599 9 County-District-Campus Number 2600–2600 1 Language Version 2601–2601 1 Test Version 2602–2602 1 Score Code 2603–2603 1 Approaches Grade Level 2604–2604 1 Meets Grade Level 2605–2605 1 Masters Grade Level 2606–2609 4 Scale Score 2610–2611 2 Tested Grade 2612–2613 2 Enrolled Grade 2614–2614 1 STAAR Progress Measure 2615–2615 1 ELL Progress Measure 2616–2620 5 Lexile Measure
PREVIOUS YEAR MATHEMATICS HISTORY
PRIMARY ADMINISTRATION (Grades 5 and 8) 2621–2629 9 County-District-Campus Number 2630–2630 1 Language Version 2631–2631 1 Test Version 2632–2632 1 Score Code 2633–2633 1 Approaches Grade Level 2634–2634 1 Masters Grade Level 2635–2638 4 Scale Score 2639–2640 2 Tested Grade 2641–2642 2 Enrolled Grade 2643–2643 1 STAAR Progress Measure 2644–2644 1 ELL Progress Measure 2645–2645 1 Meets Grade Level 2646–2650 5 BLANK
SPRING ADMINISTRATION 2651–2659 9 County-District-Campus Number 2660–2660 1 Language Version 2661–2661 1 Test Version
STAAR 3–8 REPORTING STUDENT DATA FILE FORMAT LOCATION FIELD FIELD DESCRIPTION AND ANSWER DOCUMENT CODES ANSWER FROM-TO LENGTH (PEIMS data element names are used where available) DOCUMENT COLUMN HEADINGS (AND CODES)
29 of 31
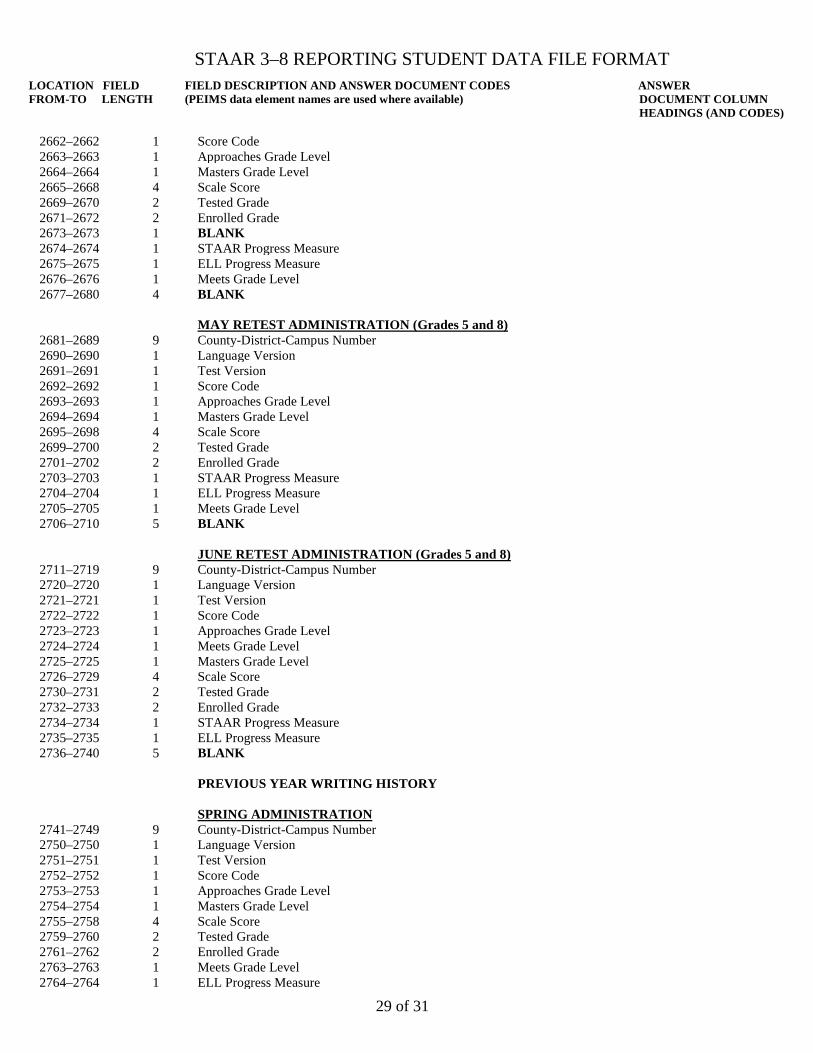
2662–2662 1
Score Code
2663–2663 1 Approaches Grade Level 2664–2664 1 Masters Grade Level 2665–2668 4 Scale Score 2669–2670 2 Tested Grade 2671–2672 2 Enrolled Grade 2673–2673 1 BLANK 2674–2674 1 STAAR Progress Measure 2675–2675 1 ELL Progress Measure 2676–2676 1 Meets Grade Level 2677–2680 4 BLANK
MAY RETEST ADMINISTRATION (Grades 5 and 8) 2681–2689 9 County-District-Campus Number 2690–2690 1 Language Version 2691–2691 1 Test Version 2692–2692 1 Score Code 2693–2693 1 Approaches Grade Level 2694–2694 1 Masters Grade Level 2695–2698 4 Scale Score 2699–2700 2 Tested Grade 2701–2702 2 Enrolled Grade 2703–2703 1 STAAR Progress Measure 2704–2704 1 ELL Progress Measure 2705–2705 1 Meets Grade Level 2706–2710 5 BLANK
JUNE RETEST ADMINISTRATION (Grades 5 and 8) 2711–2719 9 County-District-Campus Number 2720–2720 1 Language Version 2721–2721 1 Test Version 2722–2722 1 Score Code 2723–2723 1 Approaches Grade Level 2724–2724 1 Meets Grade Level 2725–2725 1 Masters Grade Level 2726–2729 4 Scale Score 2730–2731 2 Tested Grade 2732–2733 2 Enrolled Grade 2734–2734 1 STAAR Progress Measure 2735–2735 1 ELL Progress Measure 2736–2740 5 BLANK
PREVIOUS YEAR WRITING HISTORY
SPRING ADMINISTRATION 2741–2749 9 County-District-Campus Number 2750–2750 1 Language Version 2751–2751 1 Test Version 2752–2752 1 Score Code 2753–2753 1 Approaches Grade Level 2754–2754 1 Masters Grade Level 2755–2758 4 Scale Score 2759–2760 2 Tested Grade 2761–2762 2 Enrolled Grade 2763–2763 1 Meets Grade Level 2764–2764 1 ELL Progress Measure
STAAR 3–8 REPORTING STUDENT DATA FILE FORMAT LOCATION FIELD FIELD DESCRIPTION AND ANSWER DOCUMENT CODES ANSWER FROM-TO LENGTH (PEIMS data element names are used where available) DOCUMENT COLUMN HEADINGS (AND CODES)
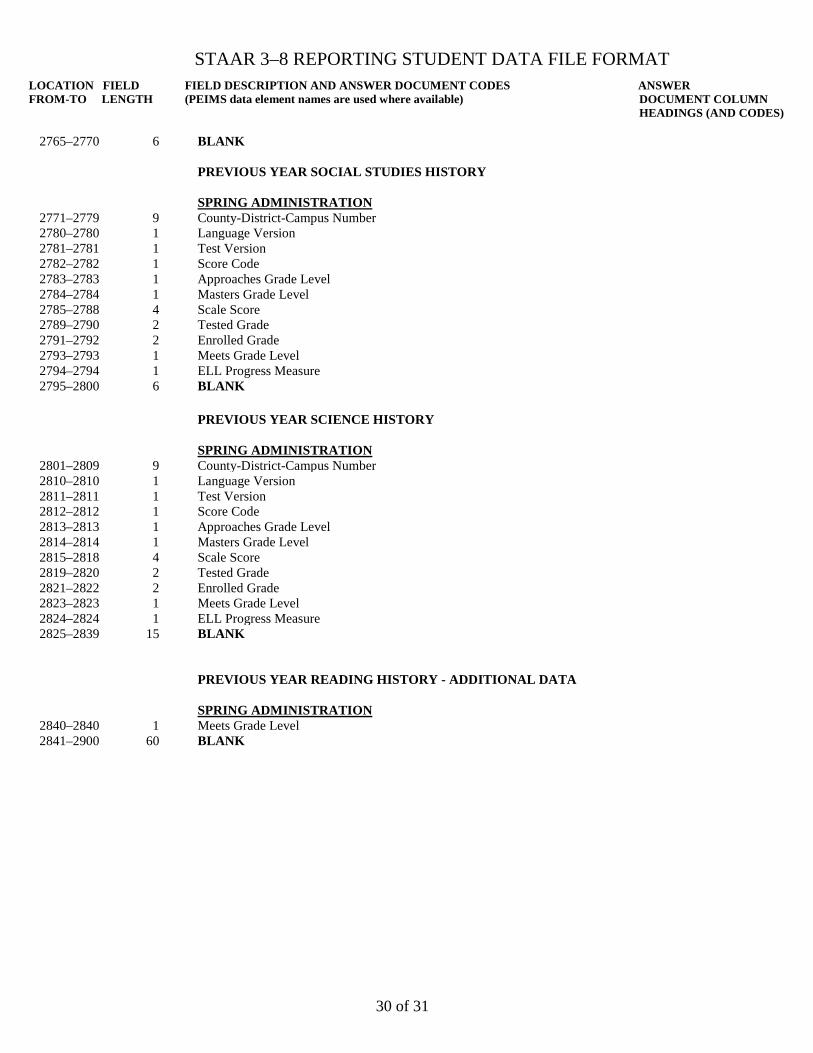
30 of 31
2765–2770 6
BLANK
PREVIOUS YEAR SOCIAL STUDIES HISTORY
SPRING ADMINISTRATION 2771–2779 9 County-District-Campus Number 2780–2780 1 Language Version 2781–2781 1 Test Version 2782–2782 1 Score Code 2783–2783 1 Approaches Grade Level 2784–2784 1 Masters Grade Level 2785–2788 4 Scale Score 2789–2790 2 Tested Grade 2791–2792 2 Enrolled Grade 2793–2793 1 Meets Grade Level 2794–2794 1 ELL Progress Measure 2795–2800 6 BLANK
PREVIOUS YEAR SCIENCE HISTORY
SPRING ADMINISTRATION 2801–2809 9 County-District-Campus Number 2810–2810 1 Language Version 2811–2811 1 Test Version 2812–2812 1 Score Code 2813–2813 1 Approaches Grade Level 2814–2814 1 Masters Grade Level 2815–2818 4 Scale Score 2819–2820 2 Tested Grade 2821–2822 2 Enrolled Grade 2823–2823 1 Meets Grade Level 2824–2824 1 ELL Progress Measure 2825–2839 15 BLANK
PREVIOUS YEAR READING HISTORY - ADDITIONAL DATA
SPRING ADMINISTRATION 2840–2840 1 Meets Grade Level 2841–2900 60
BLANK
STAAR 3–8 REPORTING STUDENT DATA FILE FORMAT LOCATION FIELD FIELD DESCRIPTION AND ANSWER DOCUMENT CODES ANSWER FROM-TO LENGTH (PEIMS data element names are used where available) DOCUMENT COLUMN HEADINGS (AND CODES)
31 of 31
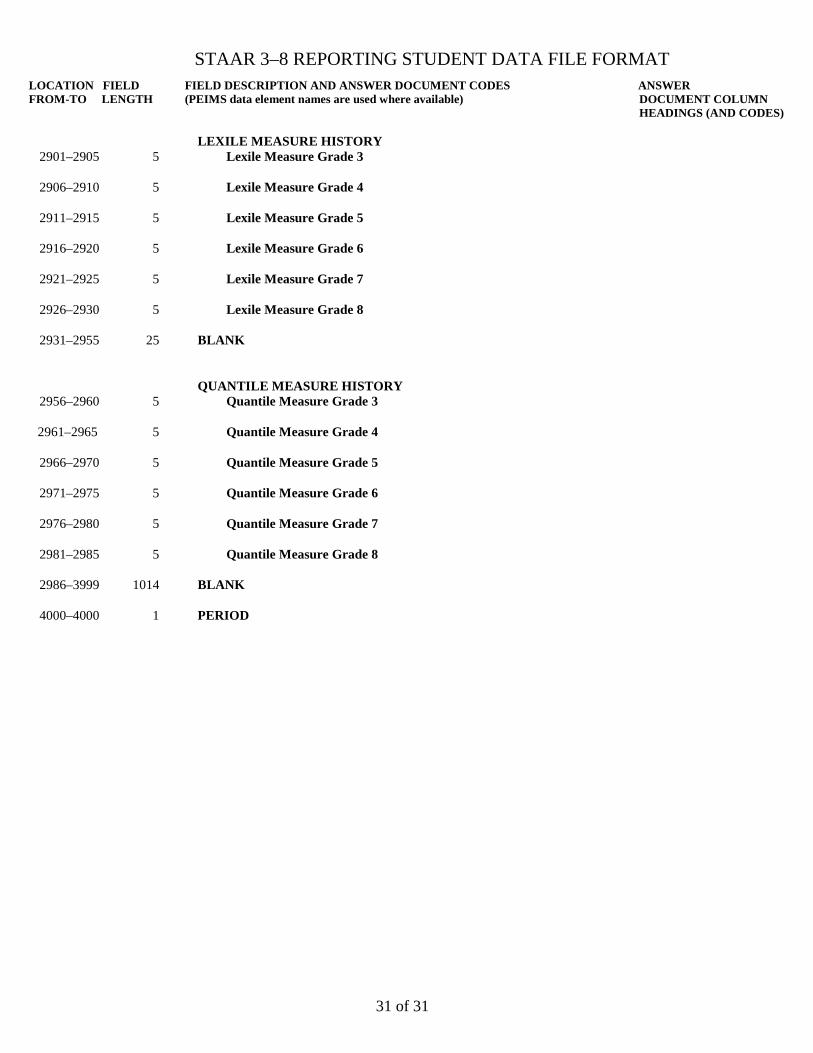
LEXILE MEASURE HISTORY
2901–2905 5 Lexile Measure Grade 3
2906–2910 5 Lexile Measure Grade 4
2911–2915 5 Lexile Measure Grade 5
2916–2920 5 Lexile Measure Grade 6
2921–2925 5 Lexile Measure Grade 7
2926–2930 5 Lexile Measure Grade 8
2931–2955 25 BLANK
QUANTILE MEASURE HISTORY
2956–2960 5 Quantile Measure Grade 3
2961–2965 5 Quantile Measure Grade 4
2966–2970 5 Quantile Measure Grade 5
2971–2975 5 Quantile Measure Grade 6
2976–2980 5 Quantile Measure Grade 7
2981–2985 5 Quantile Measure Grade 8 2986–3999 1014 BLANK
4000–4000 1 PERIOD