Report to the DTI Strand, Castlefreke, Clonakilty, Co. Cork Telephone 00 353 23 40665 or 00 353 87...
82
Offshore seabirds in the SEA 7 area Northern Fulmar, at sea © Claire Pollock, Cork Ecology Report to the DTI October 2006 C C ORK ♦ ♦ E E COLOGY Claire Pollock & Colin Barton Long Strand, Castlefreke, Clonakilty, Co. Cork Telephone 00 353 23 40665 or 00 353 87 2323 623 Website: www.corkecology.net E-mail: [email protected]
Transcript of Report to the DTI Strand, Castlefreke, Clonakilty, Co. Cork Telephone 00 353 23 40665 or 00 353 87...

Offshore seabirds in the SEA 7 area
Northern Fulmar, at sea
© Claire Pollock, Cork Ecology
Report to the DTI
October 2006
CC OO RR KK ♦♦ EE CC OO LL OO GG YY Claire Pollock & Colin Barton
Long Strand, Castlefreke, Clonakilty, Co. Cork
Telephone 00 353 23 40665 or 00 353 87 2323 623 Website: www.corkecology.net E-mail: [email protected]
Offshore seabirds in SEA 7
Cork Ecology 2 October 2006
This document was produced as part of the UK Department of Trade and Industry's offshore energy Strategic Environmental Assessment programme. The SEA programme is funded and managed by the DTI and coordinated on their behalf by Geotek Ltd and Hartley Anderson Ltd.
Crown Copyright, all rights reserved
This report should be cited as:
Pollock, C & Barton, C. 2006. Offshore seabirds in the SEA 7 area. A report to the DTI.
Offshore seabirds in SEA 7
Cork Ecology 3 October 2006
Non-technical Summary
Introduction
• Seabird distribution in offshore waters of the SEA 7 area was reviewed primarily using the European Seabirds at Sea (ESAS) database.
Objectives
The aims of this study were:
• To provide an overview of individual species offshore distribution in SEA 7
• To identify, where possible, offshore areas in SEA 7 that are important for seabirds
• To assess offshore seabird vulnerability to surface pollution in SEA 7
• To provide a brief outline on the potential for offshore SPAs in the offshore waters of SEA 7
• To highlight major gaps in understanding and survey coverage in the offshore waters of SEA 7
Methodology
• Ship-based and aerial survey data for the SEA 7 area collected between 1979 and 2005 were provided by ESAS.
• Offshore waters were defined as greater than 200 m in depth and the offshore distribution of seventeen species of seabirds were reviewed.
Species accounts
• Northern Fulmar, Northern Gannet and Black-legged Kittiwake were the most abundant species recorded on ESAS surveys in offshore waters of the SEA 7 area.
• The SEA 7 area was also important for European Storm-petrel and Leach’s Storm-petrel.
Important offshore areas in SEA 7
• Generally seabird densities were low in offshore waters. Important areas were along the shelf break, Rockall Trough and Rockall Bank.
• Species diversity of seabirds was low in offshore waters compared to inshore waters, although more species were recorded during the summer months.
Offshore seabirds in SEA 7
Cork Ecology 4 October 2006
Vulnerability to surface pollution
• Seabird vulnerability to surface pollution in offshore waters of SEA 7 was generally low, although moderate at times along the shelf break.
• The waters around the offshore seabird colonies of St Kilda, Flannan Isles, North Rona and Sula Sgeir were highly vulnerable during the breeding season.
• St Kilda represents the largest concentration of breeding seabirds in the UK and has many conservation designations including SPA status.
Potential for offshore SPA
• Currently there are no SPAs in offshore waters apart from offshore seabird colonies and up to 2 km of water around them. JNCC are to commence work addressing offshore SPAs for feeding and other aggregations of seabirds soon.
• Combining all ESAS data for all months showed that the shelf edge and the Rockall Bank were the areas where highest seabird densities were likely to be encountered in SEA 7. These areas could be a start point for the offshore SPA work.
Survey coverage
• Greatest survey coverage in offshore waters of SEA 7 was achieved during the summer months, with many gaps in winter.
• Overall, coverage in SEA 7 was the lowest of all SEA areas, with only a quarter of the recommended area surveyed.
Conclusions
• Overall, there are large gaps in coverage in the offshore waters of SEA 7, particularly during the winter months. However, seabird density and species diversity is generally low beyond the shelf edge.
• Although the inshore and shelf waters of SEA 7 are of more importance for seabirds and are most vulnerable to surface pollution, seabird surveys in the offshore waters of SEA 7 should be continued to improve existing data and to determine long term trends and short term fluctuations in the offshore distribution of seabirds.
Recommendations
Based on this review, it is recommended that:
Further studies should be conducted to identify important areas for seabirds in offshore waters in SEA 7, including feeding areas for European Storm-petrel and Leach’s Storm-petrel.
Offshore survey coverage in SEA 7 should be increased throughout the year.
Offshore seabirds in SEA 7
Cork Ecology 5 October 2006
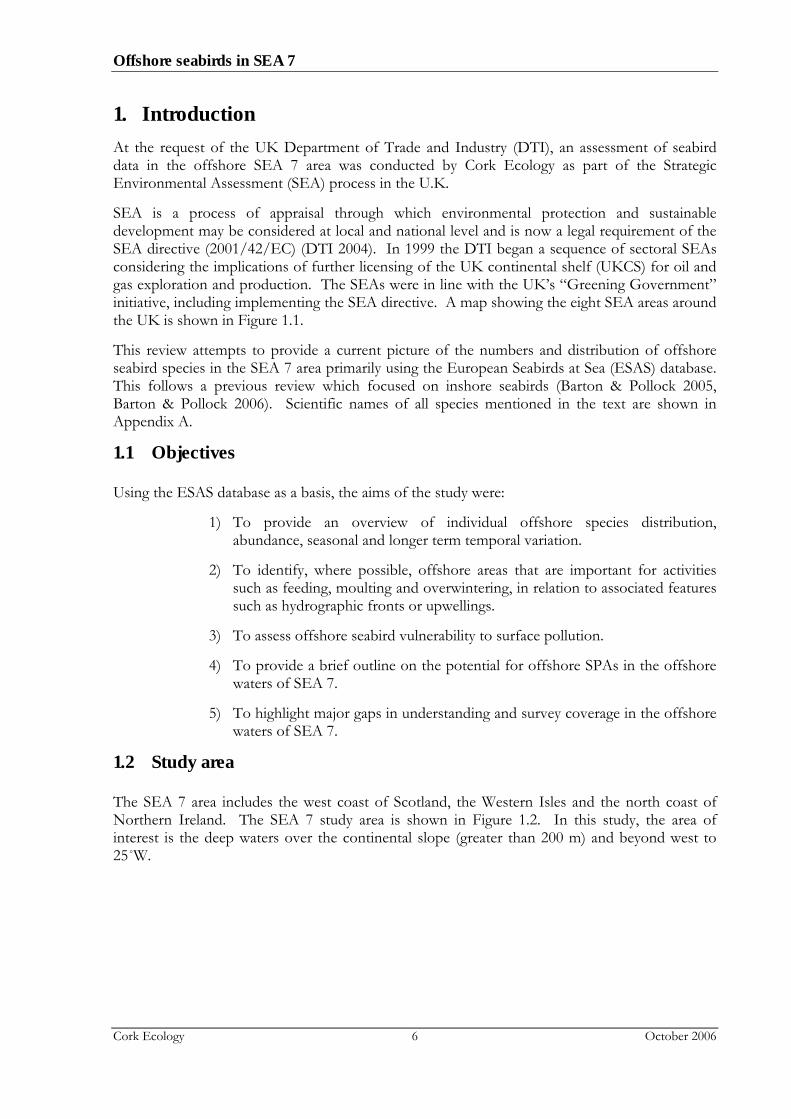
Table of Contents
1. Introduction .............................................................................................................. 6 1.1 Objectives....................................................................................................................................6 1.2 Study area ....................................................................................................................................6 1.3 Offshore species .........................................................................................................................9
2. Methods ...................................................................................................................10 2.1 Data sources..............................................................................................................................10 2.2 Data analysis..............................................................................................................................11
3. Species Accounts .....................................................................................................14 3.1 Northern Fulmar ......................................................................................................................14 3.2 Great Shearwater ......................................................................................................................17 3.3 Manx Shearwater ......................................................................................................................17 3.4 Sooty Shearwater ......................................................................................................................19 3.5 European Storm-petrel............................................................................................................21 3.6 Leach’s Storm-petrel ................................................................................................................23 3.7 Northern Gannet......................................................................................................................25 3.8 Pomarine Skua ..........................................................................................................................27 3.9 Arctic Skua ................................................................................................................................28 3.10 Long-tailed Skua .......................................................................................................................29 3.11 Great Skua .................................................................................................................................30 3.12 Lesser Black-backed Gull........................................................................................................32 3.13 Great Black-backed Gull .........................................................................................................34 3.14 Black-legged Kittiwake ............................................................................................................35 3.15 Arctic Tern ................................................................................................................................37 3.16 Little Auk...................................................................................................................................38 3.17 Atlantic Puffin...........................................................................................................................40
4. Important offshore areas in SEA 7 ..........................................................................43 4.1 Species diversity........................................................................................................................51
5. Vulnerability to surface pollution ............................................................................53 5.1 Vulnerability maps....................................................................................................................53 5.2 Offshore seabird colonies in the SEA 7 area .......................................................................61
6. Potential for offshore SPAs in SEA 7.......................................................................64 7. Survey coverage in the SEA 7 area ..........................................................................66
7.1 Survey effort..............................................................................................................................66 7.2 Gaps in coverage ......................................................................................................................67
8. Conclusions .............................................................................................................68 9. Recommendations...................................................................................................69 10. Acknowledgements..................................................................................................69 11. References................................................................................................................70
Appendix A 72
Appendix B 74
Appendix C 76
Offshore seabirds in SEA 7
Cork Ecology 6 October 2006
1. Introduction At the request of the UK Department of Trade and Industry (DTI), an assessment of seabird data in the offshore SEA 7 area was conducted by Cork Ecology as part of the Strategic Environmental Assessment (SEA) process in the U.K.
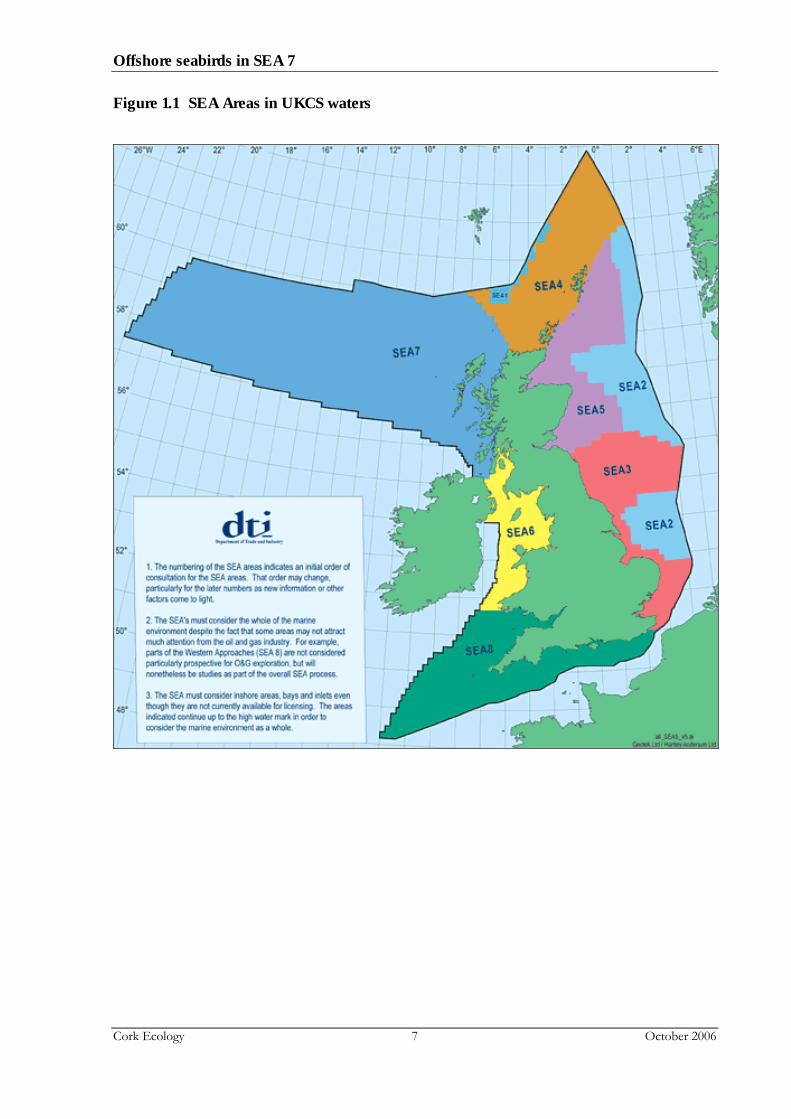
SEA is a process of appraisal through which environmental protection and sustainable development may be considered at local and national level and is now a legal requirement of the SEA directive (2001/42/EC) (DTI 2004). In 1999 the DTI began a sequence of sectoral SEAs considering the implications of further licensing of the UK continental shelf (UKCS) for oil and gas exploration and production. The SEAs were in line with the UK’s “Greening Government” initiative, including implementing the SEA directive. A map showing the eight SEA areas around the UK is shown in Figure 1.1.
This review attempts to provide a current picture of the numbers and distribution of offshore seabird species in the SEA 7 area primarily using the European Seabirds at Sea (ESAS) database. This follows a previous review which focused on inshore seabirds (Barton & Pollock 2005, Barton & Pollock 2006). Scientific names of all species mentioned in the text are shown in Appendix A.
1.1 Objectives
Using the ESAS database as a basis, the aims of the study were:
1) To provide an overview of individual offshore species distribution, abundance, seasonal and longer term temporal variation.
2) To identify, where possible, offshore areas that are important for activities such as feeding, moulting and overwintering, in relation to associated features such as hydrographic fronts or upwellings.
3) To assess offshore seabird vulnerability to surface pollution.
4) To provide a brief outline on the potential for offshore SPAs in the offshore waters of SEA 7.
5) To highlight major gaps in understanding and survey coverage in the offshore waters of SEA 7.
1.2 Study area
The SEA 7 area includes the west coast of Scotland, the Western Isles and the north coast of Northern Ireland. The SEA 7 study area is shown in Figure 1.2. In this study, the area of interest is the deep waters over the continental slope (greater than 200 m) and beyond west to 25˚W.
Offshore seabirds in SEA 7
Cork Ecology 7 October 2006
Figure 1.1 SEA Areas in UKCS waters

Offshore seabirds in SEA 7
Cork Ecology 8 October 2006
Figure 1.2 Major oceanographic features, bathymetry and seabird colonies in SEA 7 area
1
432765
9 108
1112
13
14
A
B
C
D
E
E
E
56N
57N
58N
59N
60N
23W 22W 21W 20W 19W 18W 17W 16W 15W 14W 13W 12W 11W 10W 9W 8W 7W 6W 5W Key
Oceanographic features Major seabird colonies A Hatton Bank 1 North Rona & Sula Sgeir
B Rockall Bank 2 Flannan Isles
C Rosemary Bank 3 Cellar Head, Lewis
D Anton Dohrn Seamount 4 Handa
E Rockall Trough 5 St Kilda
6 Shiant Islands
Bathymetry 7 Priest Island
8 Berneray & Mingulay
200 m
9 Canna
10 Rum
500 m
11 Coll
12 Treshnish Isles
1,000 m
13 Colonsay
14 Rathlin Island

Offshore seabirds in SEA 7
Cork Ecology 9 October 2006
1.3 Offshore species
This review focuses on 17 seabird species regularly found in the offshore waters of SEA 7 (Table 1.1). Some species such as Northern Fulmar are resident throughout the year, while others are seasonal visitors to the area, for example Manx Shearwater occurs in the area between March and October. In addition, species such as Long-tailed Skua migrate SEA 7 in spring and autumn.
Twenty seven species of seabird totalling over one million pairs of birds breed within the SEA 7 area (JNCC, Seabird 2000 data). Of these 27 species, 22 species breed within the SEA 7 area in nationally important numbers (i.e. more than 1 % of the British breeding population). Breeding numbers in a British and biogeographic context for the 17 offshore species considered in this review are shown in Table 1.1. See Barton & Pollock (2005 & 2006) for information on inshore seabird species.
An indication of the at-sea distribution in SEA 7 and the other SEA areas of the 17 offshore seabird species considered in this review is also shown in Table 1.1.
Table 1.1 Overview of importance of SEA 7 area for species considered in this review
Species Numbers breeding in SEA 7 as % of British
population1
Numbers breeding in SEA 7 as % of
biogeographic population1
Important SEA areas based on ESAS data2
Northern Fulmar 28.7 3.5 – 5.3 1, 4, 5, 7 Great Shearwater - - 7 Manx Shearwater 40.3 – 45.5 30.8 – 37.2 6, 7, 8 Sooty Shearwater - - 4, 7
European Storm-petrel 33.9 – 53.9 1.7 – 3.8 7, 8 Leach’s Storm-petrel 99.9 1.0 7
Northern Gannet 27.5 18.4 5, 7, 8 Pomarine Skua - - 3, 5, 7
Arctic Skua 10.4 0.6 – 1.5 5 Long-tailed Skua - - 5, 7
Great Skua 5.7 3.5 4, 5, 7, 8 Lesser Black-backed Gull 2.7 1.7 6, 7, 8 Great Black-backed Gull 25.6 4.0 – 4.5 3, 5, 6, 7, 8 Black-legged Kittiwake 11.2 1.4 – 1.7 3, 4, 5, 6, 7, 8
Arctic Tern 12.1 0.4 – 1.3 5, 6, 7 Little Auk - - 3, 5
Atlantic Puffin 41.3 3.6 – 4.4 3, 5, 7 1 JNCC, Seabird 2000 database 2 Based on Stone et al 1995 and Mackay & Giménez 2004
Numbers of Manx Shearwater are internationally important with up to 37 % of the biogeographic population breeding in the SEA 7 area. Northern Gannet is also important in an international context in the region.
In a national context, Leach’s Storm-petrel is the most significant with almost 100 % of the breeding population occurring in the SEA 7 area. However internationally, this is only c. 1 % of the biogeographic population. Atlantic Puffin, Manx Shearwater, European Storm-petrel, Northern Gannet, Northern Fulmar and Great Black-backed Gull are also important species with over 20 % of the British population of each species breeding in the SEA 7 area.

Offshore seabirds in SEA 7
Cork Ecology 10 October 2006
2. Methods 2.1 Data sources
This review attempts to collate existing information, to provide a current picture of the numbers and distribution of offshore seabird species in the SEA 7 area. The ESAS database is the most comprehensive source of data for offshore seabirds in European waters and forms the basis for this review. Data from other sources are incorporated where available.
ESAS surveys
The Seabirds at Sea Team (SAST) of the Joint Nature Conservation Committee (JNCC) has conducted both ship-based and aerial surveys in the waters around Britain since 1979 to study seabird and cetacean distribution and abundance (e.g. Tasker et al 1987). Data from these surveys, and from other European countries, have been incorporated into the European Seabirds at Sea (ESAS) database (e.g. Stone et al 1995). Ship-based and aerial survey data for the SEA 7 area collected between 1979 and 2005 were provided by ESAS.
Several JNCC reports are relevant to the study area (Tasker et al 1990; Webb et al 1990; Stone et al 1995; Webb et al 1995; Pollock et al 1997; Pollock et al 2000). Mackey & Giménez (2004) reported on seabirds in the SEA 6,7, & 8 areas, concentrating on offshore seabird species, while Mackey et al (2004) reported on seabird distribution, density and abundance in Ireland’s Atlantic Margin.
Seabird 2000
Seabird 2000 was a seabird census of breeding seabirds in Britain and Ireland conducted between 1998 and 2002 (Mitchell et al 2004). Data from major colonies are shown in individual species accounts. Additional data for some species for St Kilda, Flannan Isles, North Rona and Sula Sgeir were provided by the JNCC Seabird 2000 database.
Natura 2000 in UK Offshore Waters
Marine SPAs (mSPAs) are currently being considered for all species included in this review. Three types of mSPA around the UK are being considered. They are extensions to SPA breeding colonies, inshore areas used by birds in the non-breeding season (divers, grebes & seaduck), and marine feeding areas (Johnston et al 2002). As yet, no offshore SPAs have been designated.
JNCC have conducted aerial surveys of divers, grebes and seaduck in inshore waters of SEA 7 since 2003 (Dean et al 2003, Dean et al 2004a, Dean et al 2004b, Wilson et al 2006) as part of the mSPA process. While the data have not yet been added to the ESAS database, JNCC supplied relevant data for SEA 7 for this review and they have been incorporated into the vulnerability maps (see section 5).
Offshore seabirds in SEA 7
Cork Ecology 11 October 2006
2.2 Data analysis
2.2.1 Study area
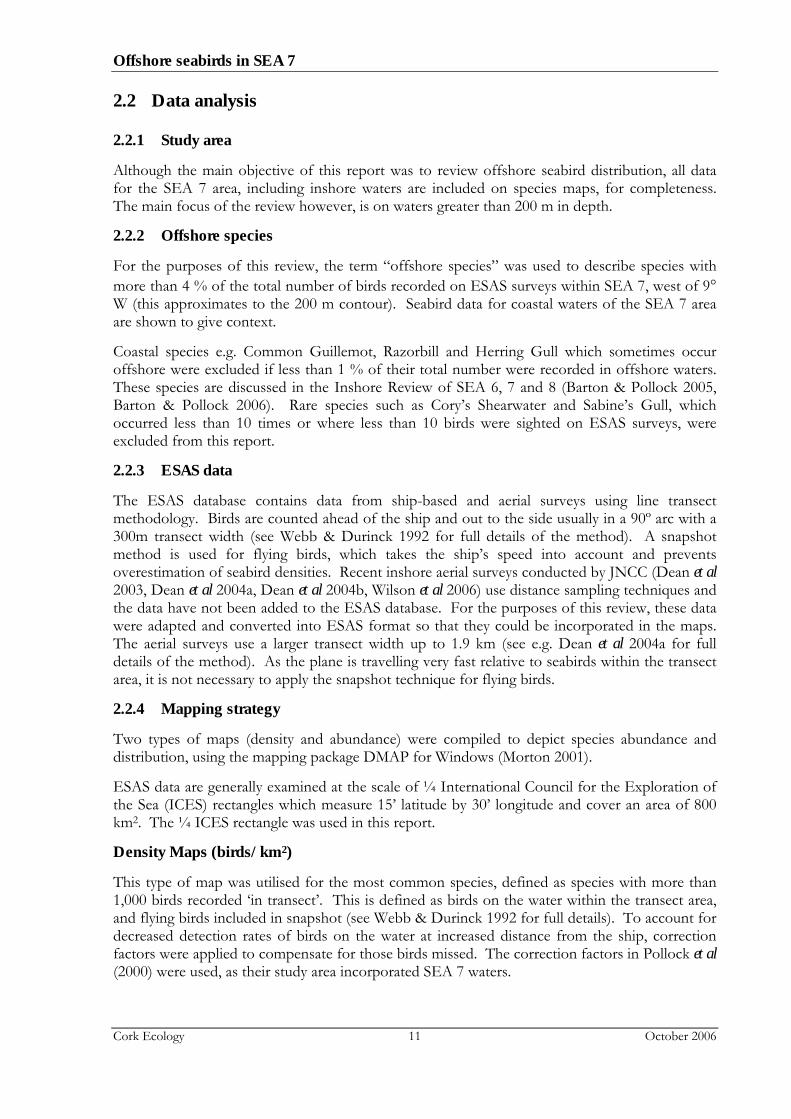
Although the main objective of this report was to review offshore seabird distribution, all data for the SEA 7 area, including inshore waters are included on species maps, for completeness. The main focus of the review however, is on waters greater than 200 m in depth.
2.2.2 Offshore species
For the purposes of this review, the term “offshore species” was used to describe species with more than 4 % of the total number of birds recorded on ESAS surveys within SEA 7, west of 9° W (this approximates to the 200 m contour). Seabird data for coastal waters of the SEA 7 area are shown to give context.
Coastal species e.g. Common Guillemot, Razorbill and Herring Gull which sometimes occur offshore were excluded if less than 1 % of their total number were recorded in offshore waters. These species are discussed in the Inshore Review of SEA 6, 7 and 8 (Barton & Pollock 2005, Barton & Pollock 2006). Rare species such as Cory’s Shearwater and Sabine’s Gull, which occurred less than 10 times or where less than 10 birds were sighted on ESAS surveys, were excluded from this report.
2.2.3 ESAS data
The ESAS database contains data from ship-based and aerial surveys using line transect methodology. Birds are counted ahead of the ship and out to the side usually in a 90º arc with a 300m transect width (see Webb & Durinck 1992 for full details of the method). A snapshot method is used for flying birds, which takes the ship’s speed into account and prevents overestimation of seabird densities. Recent inshore aerial surveys conducted by JNCC (Dean et al 2003, Dean et al 2004a, Dean et al 2004b, Wilson et al 2006) use distance sampling techniques and the data have not been added to the ESAS database. For the purposes of this review, these data were adapted and converted into ESAS format so that they could be incorporated in the maps. The aerial surveys use a larger transect width up to 1.9 km (see e.g. Dean et al 2004a for full details of the method). As the plane is travelling very fast relative to seabirds within the transect area, it is not necessary to apply the snapshot technique for flying birds.
2.2.4 Mapping strategy
Two types of maps (density and abundance) were compiled to depict species abundance and distribution, using the mapping package DMAP for Windows (Morton 2001).
ESAS data are generally examined at the scale of ¼ International Council for the Exploration of the Sea (ICES) rectangles which measure 15’ latitude by 30’ longitude and cover an area of 800 km2. The ¼ ICES rectangle was used in this report.
Density Maps (birds/km2)
This type of map was utilised for the most common species, defined as species with more than 1,000 birds recorded ‘in transect’. This is defined as birds on the water within the transect area, and flying birds included in snapshot (see Webb & Durinck 1992 for full details). To account for decreased detection rates of birds on the water at increased distance from the ship, correction factors were applied to compensate for those birds missed. The correction factors in Pollock et al (2000) were used, as their study area incorporated SEA 7 waters.

Offshore seabirds in SEA 7
Cork Ecology 12 October 2006
Average densities for each ¼ ICES rectangle were calculated by dividing the total number of birds within a 300 m strip by the total area surveyed (See Webb & Durinck 1992 for further details). Monthly density maps were created, and depending on the distribution patterns, seasonal maps were compiled.
Abundance maps (birds/km travelled)
Abundance maps were used for less abundant species. All data including sightings of birds outside the 300 m band transect were utilised. Species with more than 100 birds but less than 1,000 ‘in transect’ were mapped as abundance. To calculate abundance for each ¼ ICES rectangle, the total number of birds was divided by the distance travelled. Again, monthly and seasonal abundance maps were compiled.
2.2.5 Total Seabird Density
As well as individual species maps, seabird data for all species were combined and density maps were produced to show overall species density in the SEA 7 area. These maps attempt to identify important areas for seabirds.
Correction factors were applied to birds on the water ‘in transect’ from shipboard surveys and to all birds recorded on aerial surveys, as the speed of the plane effectively makes the counts instantaneous. Correction factors for 200 m and 300 m transects followed Pollock et al (2000) or Stone et al (1995), if the species was not listed in Pollock et al (2000).
Aerial surveys in inshore waters since 2003 focussed on divers, grebes and seaduck. The correction factors used above were inappropriate in this case as transect widths of 881 m and 956 m from the survey track line were used. For most species there were insufficient data to calculate correction factors, and so uncorrected density values were used in the analysis. However for Great Northern Diver, Common Eider and Long-tailed Duck, correction factors were calculated (Table 2.1). Correction factors were based on a mean transect width of 919 m, using the following formula:
nA x 7.8
nA + nB + nC + nD = correction factor
Where nA = total number of birds in Band A (i.e. 118 m)
And nA + nB + nC + nD = the total number of birds in Bands A – D i.e. 919 m
If the detection rate is similar in all bands, the number of birds seen in all distance bands (A-D) out to 919 m should be the equivalent of 7.8 times the number of birds seen in Band A, assuming that all birds in Band A (118 m) are detected.
Table 2.1 Correction factors for aerial survey data
Species Correction Factor 1
Great Northern Diver 5.03
Common Eider 4.36
Long-tailed Duck 5.26 1 Based on 919 m outer transect width
Offshore seabirds in SEA 7
Cork Ecology 13 October 2006
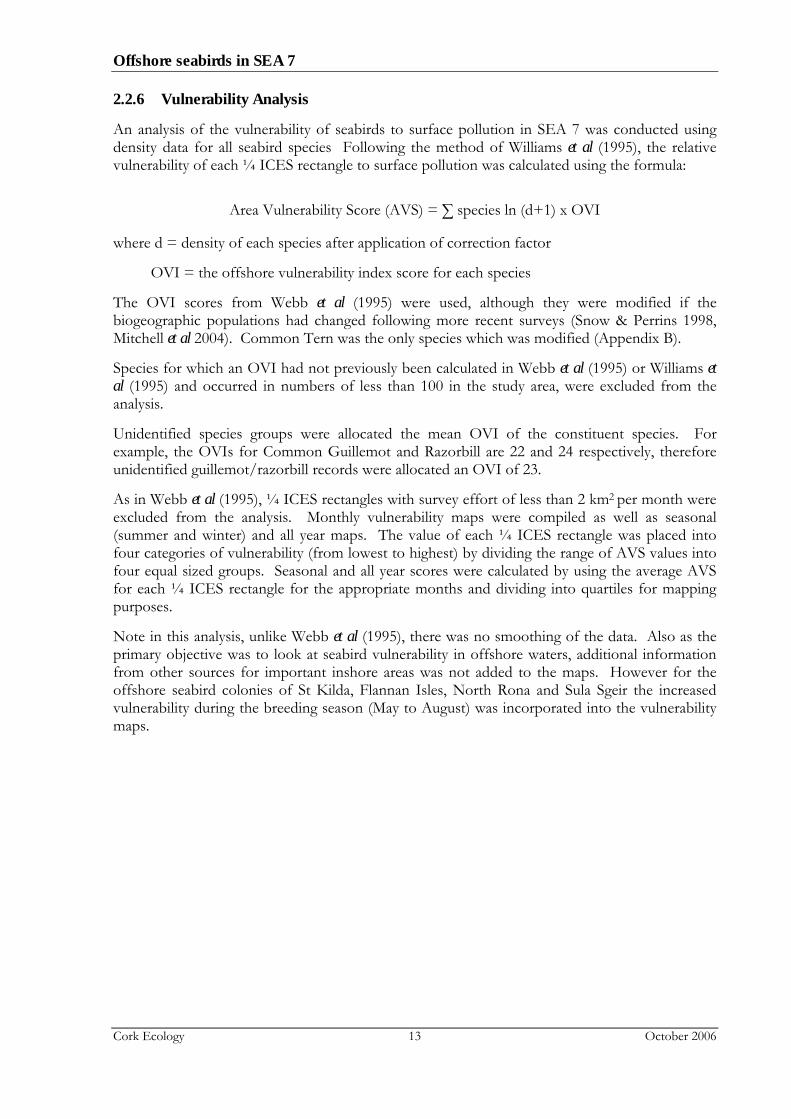
2.2.6 Vulnerability Analysis
An analysis of the vulnerability of seabirds to surface pollution in SEA 7 was conducted using density data for all seabird species Following the method of Williams et al (1995), the relative vulnerability of each ¼ ICES rectangle to surface pollution was calculated using the formula:
Area Vulnerability Score (AVS) = ∑ species ln (d+1) x OVI
where d = density of each species after application of correction factor
OVI = the offshore vulnerability index score for each species
The OVI scores from Webb et al (1995) were used, although they were modified if the biogeographic populations had changed following more recent surveys (Snow & Perrins 1998, Mitchell et al 2004). Common Tern was the only species which was modified (Appendix B).
Species for which an OVI had not previously been calculated in Webb et al (1995) or Williams et al (1995) and occurred in numbers of less than 100 in the study area, were excluded from the analysis.
Unidentified species groups were allocated the mean OVI of the constituent species. For example, the OVIs for Common Guillemot and Razorbill are 22 and 24 respectively, therefore unidentified guillemot/razorbill records were allocated an OVI of 23.
As in Webb et al (1995), ¼ ICES rectangles with survey effort of less than 2 km2 per month were excluded from the analysis. Monthly vulnerability maps were compiled as well as seasonal (summer and winter) and all year maps. The value of each ¼ ICES rectangle was placed into four categories of vulnerability (from lowest to highest) by dividing the range of AVS values into four equal sized groups. Seasonal and all year scores were calculated by using the average AVS for each ¼ ICES rectangle for the appropriate months and dividing into quartiles for mapping purposes.
Note in this analysis, unlike Webb et al (1995), there was no smoothing of the data. Also as the primary objective was to look at seabird vulnerability in offshore waters, additional information from other sources for important inshore areas was not added to the maps. However for the offshore seabird colonies of St Kilda, Flannan Isles, North Rona and Sula Sgeir the increased vulnerability during the breeding season (May to August) was incorporated into the vulnerability maps.

Offshore seabirds in SEA 7
Cork Ecology 14 October 2006
3. Species Accounts Seventeen species of seabirds were considered in this review. Raw numbers of offshore seabirds recorded in the SEA 7 area on ESAS surveys are shown in Table 3.1. Northern Fulmar, Northern Gannet and Black-legged Kittiwake were the most abundant species recorded.
Table 3.1 Raw numbers of offshore seabirds in SEA 7 from ESAS database, August 1980 to September 2005
Species SEA 7
Northern Fulmar 278,296
Northern Gannet 97,503
Black-legged Kittiwake 60,364
Manx Shearwater 39,375
Atlantic Puffin 28,464
Great black-backed Gull 14,181
European Storm-petrel 8,103
Lesser black-backed Gull 7,956
Sooty Shearwater 2,638
Great Skua 1,579
Leach’s Storm-petrel 1,504
Arctic Tern 876
Great Shearwater 672
Arctic Skua 467
Little Auk 258
Pomarine Skua 243
Long-tailed Skua 201
The following species accounts give a brief outline of distribution and abundance within the SEA 7 area for the 17 offshore species considered in this report.
3.1 Northern Fulmar
Numbers of Northern Fulmars around the UK have increased considerably since the mid-19th century and the distribution of birds has also expanded accordingly. This population expansion began in Iceland in the mid-18th century, spreading to the Faroe Islands by the mid-19th century, before reaching Shetland and the rest of Britain and Ireland (Pennington et al 2004). The species is now one of the commonest species of seabird found around northern Britain.
Overall, the Scottish population was estimated at 485,852 apparently occupied sites by Seabird 2000, which represented a 4 % decline on the previous Seabird Colony Register survey between 1985 and 1988 (Mitchell et al 2004). An estimated 28.7 % of the British population breeds within the SEA 7 area, (JNCC, Seabird 2000 database). The major colonies for Northern Fulmar in SEA 7 are shown in Table 3.2.

Offshore seabirds in SEA 7
Cork Ecology 15 October 2006
Table 3.2 Major breeding colonies for Northern Fulmar in SEA 7 area (after Mitchell et al 2004)
Site Apparently Occupied Sites (AOS)
St Kilda 68,448
Mingulay 8,424
Shiant Islands 4,387
Cellar Head, Lewis 3,812
Sula Sgeir 3,916 1
North Rona 3,520
Handa 3,550 1 Not surveyed during Seabird 2000, count from 1985-88 (Mitchell et al 2004)
Distribution within SEA 7
Northern Fulmars were widely distributed throughout the SEA 7 area in all months. Peak densities were recorded in April, with the lowest densities recorded in November. Northern Fulmar accounted for almost 80 % of seabirds in offshore waters in the JNCC Atlantic Frontier project, north and west of Scotland (Pollock et al 2000).
Between January and May Northern Fulmar were widespread at generally low densities in offshore areas, with concentrations along the shelf edge, to the north west of the Anton Dohrn seamount and over the Hatton Bank (Figure 3.1).
Figure 3.1 Fulmar density in SEA 7 area from January to May
56N
57N
58N
59N
60N
23W 22W 21W 20W 19W 18W 17W 16W 15W 14W 13W 12W 11W 10W 9W 8W 7W 6W 5W
5.00 +2.00 - 4.991.00 - 1.990.01 - 0.99No birds
Blank = not surveyed
DENSITY (birds/km2)
Offshore seabirds in SEA 7
Cork Ecology 16 October 2006
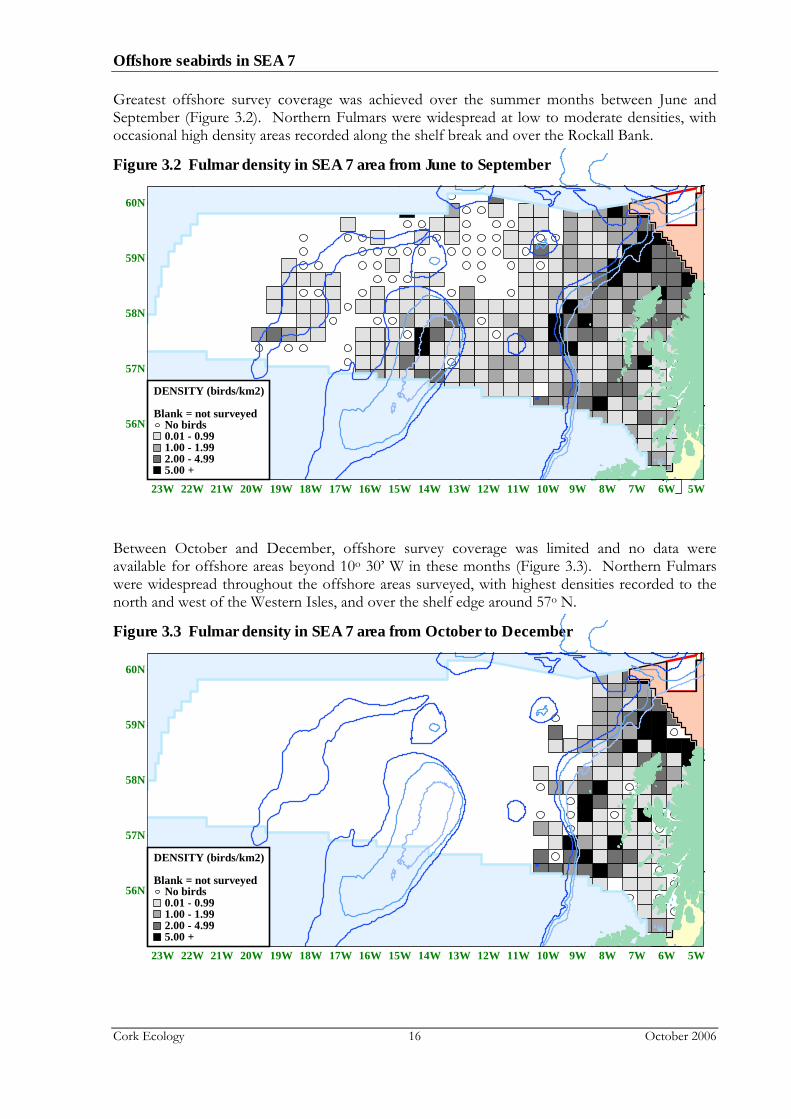
Greatest offshore survey coverage was achieved over the summer months between June and September (Figure 3.2). Northern Fulmars were widespread at low to moderate densities, with occasional high density areas recorded along the shelf break and over the Rockall Bank.
Figure 3.2 Fulmar density in SEA 7 area from June to September
56N
57N
58N
59N
60N
23W 22W 21W 20W 19W 18W 17W 16W 15W 14W 13W 12W 11W 10W 9W 8W 7W 6W 5W
5.00 +2.00 - 4.991.00 - 1.990.01 - 0.99No birds
Blank = not surveyed
DENSITY (birds/km2)
Between October and December, offshore survey coverage was limited and no data were available for offshore areas beyond 10o 30’ W in these months (Figure 3.3). Northern Fulmars were widespread throughout the offshore areas surveyed, with highest densities recorded to the north and west of the Western Isles, and over the shelf edge around 57o N.
Figure 3.3 Fulmar density in SEA 7 area from October to December
56N
57N
58N
59N
60N
23W 22W 21W 20W 19W 18W 17W 16W 15W 14W 13W 12W 11W 10W 9W 8W 7W 6W 5W
5.00 +2.00 - 4.991.00 - 1.990.01 - 0.99No birds
Blank = not surveyed
DENSITY (birds/km2)

Offshore seabirds in SEA 7
Cork Ecology 17 October 2006
3.2 Great Shearwater
Great Shearwaters breed on islands in the South Atlantic, and occur in highest numbers in waters west of Britain and Ireland during late summer and autumn on migration, with occasional records of birds remaining over the winter months.
Distribution within SEA 7
The majority of Great Shearwaters were recorded between July and October on ESAS surveys, with single birds seen over shelf waters west of Scotland in January and February. Peak numbers were recorded in August and September (Figure 3.4).
Figure 3.4 Great Shearwater abundance in SEA 7 area in August and September
56N
57N
58N
59N
60N
23W 22W 21W 20W 19W 18W 17W 16W 15W 14W 13W 12W 11W 10W 9W 8W 7W 6W 5W
1.00 +0.50 - 0.990.10 - 0.490.01 - 0.09No birds
Blank = not surveyed
ABUNDANCE (birds/km)
Birds were predominantly concentrated in an area of deep water (> 1,000 m depth) over the Rockall Trough and Bank around 57o N. Highest abundance was over the eastern edge of the Rockall Bank and close to the shelf break, west of Mull.
3.3 Manx Shearwater
Most of the world population of Manx Shearwaters breed around Britain and Ireland, with between 40.3 and 45.5 % of the British population occurring within the SEA 7 (JNCC, Seabird 2000 database). The UK population is thought to be fairly stable, although as Seabird 2000 was the first comprehensive national survey, a direct comparison with previous surveys was not possible (Mitchell et al 2004). The majority of Manx Shearwaters that breed in Britain and Ireland winter off the South American coast, and the species is generally absent from UK waters between October and March. The major breeding colonies for Manx Shearwater in SEA 7 are shown in Table 3.3.
Offshore seabirds in SEA 7
Cork Ecology 18 October 2006
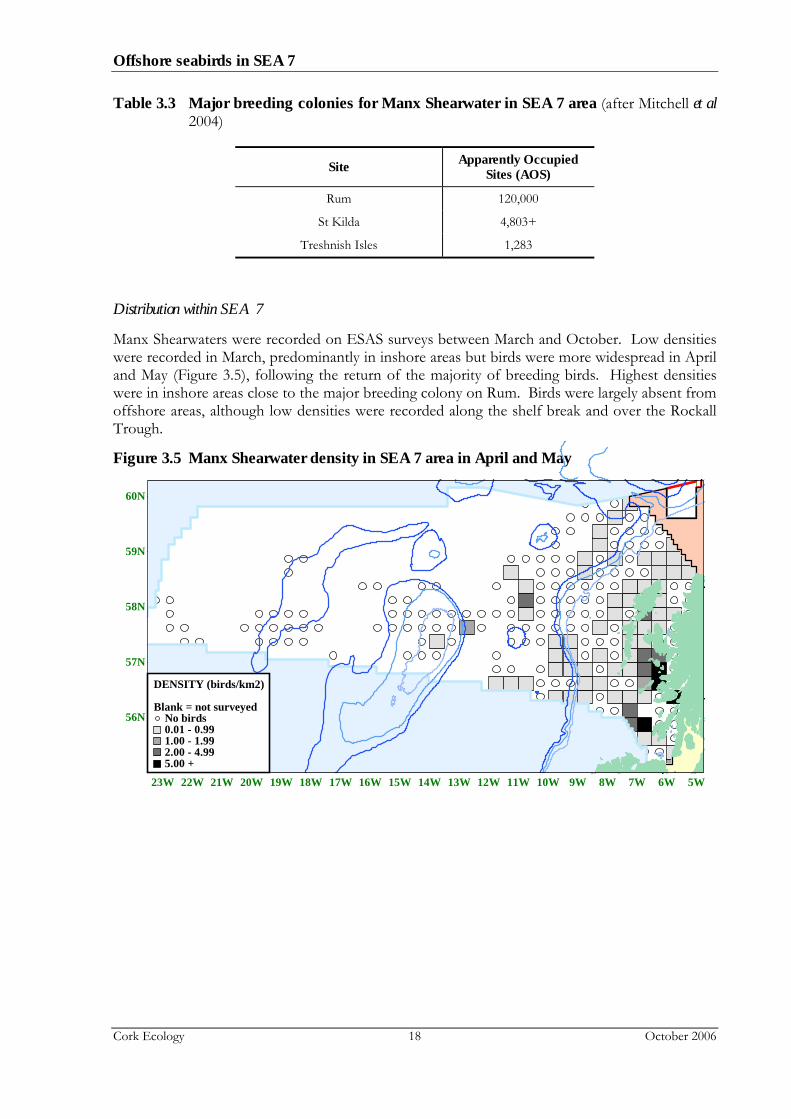
Table 3.3 Major breeding colonies for Manx Shearwater in SEA 7 area (after Mitchell et al 2004)
Site Apparently Occupied Sites (AOS)
Rum 120,000
St Kilda 4,803+
Treshnish Isles 1,283
Distribution within SEA 7
Manx Shearwaters were recorded on ESAS surveys between March and October. Low densities were recorded in March, predominantly in inshore areas but birds were more widespread in April and May (Figure 3.5), following the return of the majority of breeding birds. Highest densities were in inshore areas close to the major breeding colony on Rum. Birds were largely absent from offshore areas, although low densities were recorded along the shelf break and over the Rockall Trough.
Figure 3.5 Manx Shearwater density in SEA 7 area in April and May
56N
57N
58N
59N
60N
23W 22W 21W 20W 19W 18W 17W 16W 15W 14W 13W 12W 11W 10W 9W 8W 7W 6W 5W
5.00 +2.00 - 4.991.00 - 1.990.01 - 0.99No birds
Blank = not surveyed
DENSITY (birds/km2)

Offshore seabirds in SEA 7
Cork Ecology 19 October 2006
In contrast, birds were more widely scattered in low densities offshore between June and September, with occasional high density patches encountered (Figure 3.5). Highest densities offshore were concentrated over the Rockall Bank in August and September.
Figure 3.5 Manx Shearwater density in SEA 7 area from June to September
56N
57N
58N
59N
60N
23W 22W 21W 20W 19W 18W 17W 16W 15W 14W 13W 12W 11W 10W 9W 8W 7W 6W 5W
5.00 +2.00 - 4.991.00 - 1.990.01 - 0.99No birds
Blank = not surveyed
DENSITY (birds/km2)
Birds were encountered over the Hatton Bank during offshore surveys in June. Overall, highest densities were recorded during August, with numbers of birds recorded decreasing rapidly into September. Very low densities were recorded in October, in inshore waters.
3.4 Sooty Shearwater
Sooty Shearwaters are passage visitors to the North Atlantic during their non-breeding season. The first birds tend to arrive in British waters in July, with most birds leaving again by November.
Distribution within SEA 7
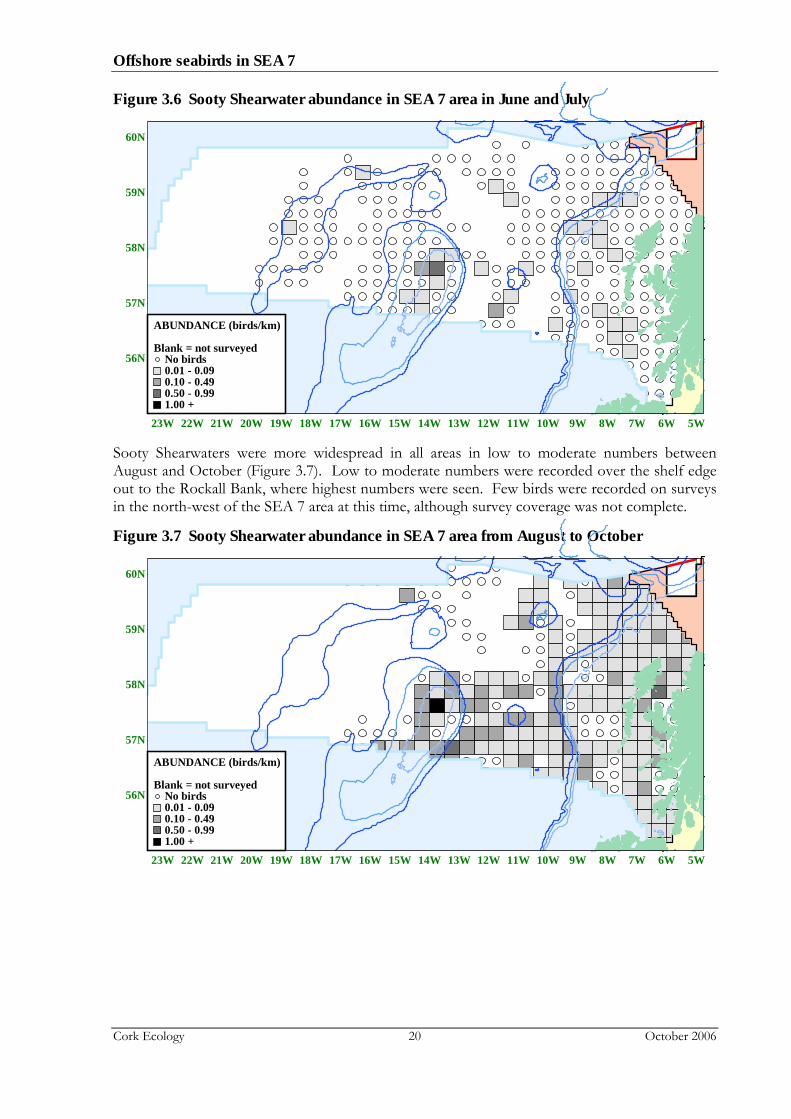
On ESAS surveys, the majority of Sooty Shearwaters were recorded between June and October. Two birds were seen to the west and south-west of St Kilda in March, and a single bird was recorded west of St Kilda in May. Birds were distributed widely in low numbers in June and July over shelf waters to the west and south-west of the Western Isles. Further offshore, birds were concentrated particularly over the Rockall Bank and around the Anton Dohrn Seamount (Figure 3.6).
Offshore seabirds in SEA 7
Cork Ecology 20 October 2006
Figure 3.6 Sooty Shearwater abundance in SEA 7 area in June and July
56N
57N
58N
59N
60N
23W 22W 21W 20W 19W 18W 17W 16W 15W 14W 13W 12W 11W 10W 9W 8W 7W 6W 5W
1.00 +0.50 - 0.990.10 - 0.490.01 - 0.09No birds
Blank = not surveyed
ABUNDANCE (birds/km)
Sooty Shearwaters were more widespread in all areas in low to moderate numbers between August and October (Figure 3.7). Low to moderate numbers were recorded over the shelf edge out to the Rockall Bank, where highest numbers were seen. Few birds were recorded on surveys in the north-west of the SEA 7 area at this time, although survey coverage was not complete.
Figure 3.7 Sooty Shearwater abundance in SEA 7 area from August to October
56N
57N
58N
59N
60N
23W 22W 21W 20W 19W 18W 17W 16W 15W 14W 13W 12W 11W 10W 9W 8W 7W 6W 5W
1.00 +0.50 - 0.990.10 - 0.490.01 - 0.09No birds
Blank = not surveyed
ABUNDANCE (birds/km)

Offshore seabirds in SEA 7
Cork Ecology 21 October 2006
By November, the abundance of Sooty Shearwaters was much lower, with the majority of records over the shelf break north of the Western Isles (Figure 3.8). Coverage was limited at this time of year.
Figure 3.8 Sooty Shearwater abundance in SEA 7 area in November
56N
57N
58N
59N
60N
23W 22W 21W 20W 19W 18W 17W 16W 15W 14W 13W 12W 11W 10W 9W 8W 7W 6W 5W
1.00 +0.50 - 0.990.10 - 0.490.01 - 0.09No birds
Blank = not surveyed
ABUNDANCE (birds/km)
3.5 European Storm-petrel
The European Storm-petrel is a pelagic species, only coming ashore to breed on remote offshore islands. Accurate censusing of their breeding numbers is very difficult due to the remoteness of these colonies, and the fact that they nest in burrows. The first comprehensive survey of breeding European Storm-petrels in Britain and Ireland was only achieved during Seabird 2000, between 1999 and 2002. An estimated 33.9 – 53.9 % of the British breeding population breeds within the SEA 7 area (JNCC, Seabird 2000 database). The major breeding colonies for European Storm-petrel in SEA 7 are shown in Table 3.4.
Table 3.4 Major breeding colonies for European Storm-petrel in SEA 7 area (after Mitchell et al 2004)
Site Apparently Occupied Sites (AOS)
Treshnish Isles 5,040
Priest Island 4,400
St Kilda 1,121
Distribution within SEA 7
European Storm-petrels were recorded on ESAS surveys between April and November, with the majority of records between June and September.
Offshore seabirds in SEA 7
Cork Ecology 22 October 2006
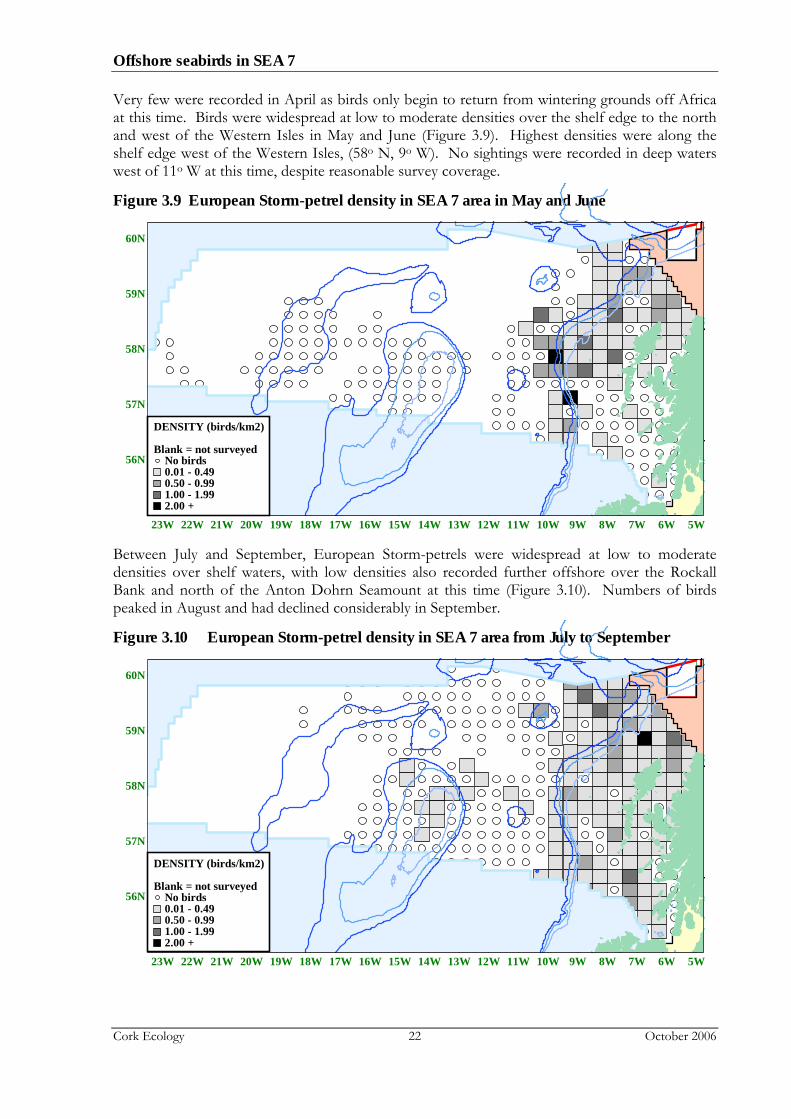
Very few were recorded in April as birds only begin to return from wintering grounds off Africa at this time. Birds were widespread at low to moderate densities over the shelf edge to the north and west of the Western Isles in May and June (Figure 3.9). Highest densities were along the shelf edge west of the Western Isles, (58o N, 9o W). No sightings were recorded in deep waters west of 11o W at this time, despite reasonable survey coverage.
Figure 3.9 European Storm-petrel density in SEA 7 area in May and June
56N
57N
58N
59N
60N
23W 22W 21W 20W 19W 18W 17W 16W 15W 14W 13W 12W 11W 10W 9W 8W 7W 6W 5W
2.00 +1.00 - 1.990.50 - 0.990.01 - 0.49No birds
Blank = not surveyed
DENSITY (birds/km2)
Between July and September, European Storm-petrels were widespread at low to moderate densities over shelf waters, with low densities also recorded further offshore over the Rockall Bank and north of the Anton Dohrn Seamount at this time (Figure 3.10). Numbers of birds peaked in August and had declined considerably in September.
Figure 3.10 European Storm-petrel density in SEA 7 area from July to September
56N
57N
58N
59N
60N
23W 22W 21W 20W 19W 18W 17W 16W 15W 14W 13W 12W 11W 10W 9W 8W 7W 6W 5W
2.00 +1.00 - 1.990.50 - 0.990.01 - 0.49No birds
Blank = not surveyed
DENSITY (birds/km2)

Offshore seabirds in SEA 7
Cork Ecology 23 October 2006
Few European Storm-petrels were recorded in October and November, as the majority of birds would have left the area for the winter at this time (Figure 3.11). Birds were primarily restricted to inshore areas such as the Minch and shelf waters, although limited offshore survey coverage was achieved in these months.
Figure 3.11 European Storm-petrel density in SEA 7 area in October & November
56N
57N
58N
59N
60N
23W 22W 21W 20W 19W 18W 17W 16W 15W 14W 13W 12W 11W 10W 9W 8W 7W 6W 5W
2.00 +1.00 - 1.990.50 - 0.990.01 - 0.49No birds
Blank = not surveyed
DENSITY (birds/km2)
In general, European Storm-petrels were under represented on ESAS surveys because of their small size and their habit of flying low over the water (Pollock et al 2000).
3.6 Leach’s Storm-petrel
Like European Storm-petrels, Leach’s Storm-petrels are also pelagic, only coming ashore to breed on remote offshore islands. Surveys of breeding birds have been virtually impossible due to the nocturnal nature of the species, combined with the remoteness of the breeding colonies. An accurate census of breeding colonies was a major aim for Seabird 2000. Three colonies in the SEA 7 area hold 99.9 % of the British breeding population of Leach’s Storm-petrel (Table 3.5) (Mitchell et al 2004).
Table 3.5 Major breeding colonies for Leach’s Storm-petrel in SEA 7 area (after Mitchell et al 2004)
Site Apparently Occupied Sites (AOS)
St Kilda 45,433
Flannan Isles 1,425
North Rona 1,132
Distribution within SEA 7
ESAS surveys recorded Leach’s Storm-petrels between April and November. There were no winter records as the species spends the winter months in the tropics.
Offshore seabirds in SEA 7
Cork Ecology 24 October 2006
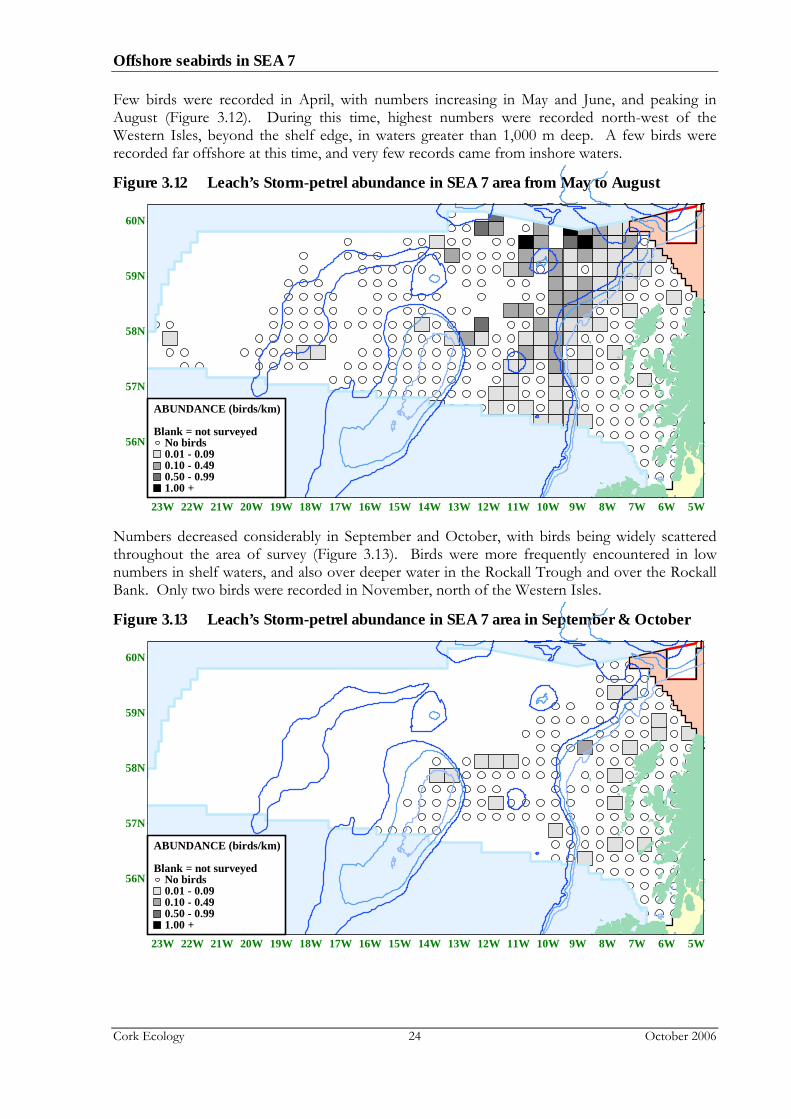
Few birds were recorded in April, with numbers increasing in May and June, and peaking in August (Figure 3.12). During this time, highest numbers were recorded north-west of the Western Isles, beyond the shelf edge, in waters greater than 1,000 m deep. A few birds were recorded far offshore at this time, and very few records came from inshore waters.
Figure 3.12 Leach’s Storm-petrel abundance in SEA 7 area from May to August
56N
57N
58N
59N
60N
23W 22W 21W 20W 19W 18W 17W 16W 15W 14W 13W 12W 11W 10W 9W 8W 7W 6W 5W
1.00 +0.50 - 0.990.10 - 0.490.01 - 0.09No birds
Blank = not surveyed
ABUNDANCE (birds/km)
Numbers decreased considerably in September and October, with birds being widely scattered throughout the area of survey (Figure 3.13). Birds were more frequently encountered in low numbers in shelf waters, and also over deeper water in the Rockall Trough and over the Rockall Bank. Only two birds were recorded in November, north of the Western Isles.
Figure 3.13 Leach’s Storm-petrel abundance in SEA 7 area in September & October
56N
57N
58N
59N
60N
23W 22W 21W 20W 19W 18W 17W 16W 15W 14W 13W 12W 11W 10W 9W 8W 7W 6W 5W
1.00 +0.50 - 0.990.10 - 0.490.01 - 0.09No birds
Blank = not surveyed
ABUNDANCE (birds/km)
Offshore seabirds in SEA 7
Cork Ecology 25 October 2006
Like European Storm-petrels, Leach’s Storm-petrels were under represented on ESAS surveys because of their small size and their habit of flying low over the water (Pollock et al 2000).
3.7 Northern Gannet
Northern Gannets breed at several colonies around the coasts of Britain and Ireland, and tend to migrate south after the breeding season. Northern Gannets are currently censused every 10 years, with the most recent census in 2003/04 (Wanless et al 2005). There are three breeding colonies within the SEA 7 area, the largest of which is St. Kilda, with smaller colonies on Sula Sgeir and the Flannan Isles. These three colonies support an estimated 27.5 % of the British population, based on data from Wanless et al (2005).
Numbers at St Kilda increased by 19 % on the previous 1994/95 survey, while numbers at Sula Sgeir decreased by 12 %. The Flannan Isles showed the largest increase, with numbers up 92 % in 2004 compared to 1994/95 (Mitchell et al 2004). Recent counts from the colonies of Northern Gannet in SEA 7 are shown in Table 3.6.
Table 3.6 Major breeding colonies for Northern Gannet in SEA 7 area in 2004 (after Wanless et al 2005)
Site Apparently Occupied
Sites/Nests (AOS/AON)
St Kilda 59,622 AOS
Sula Sgeir 9,225 AOS
Flannan Isles 2,760 AOS
Distribution within SEA 7
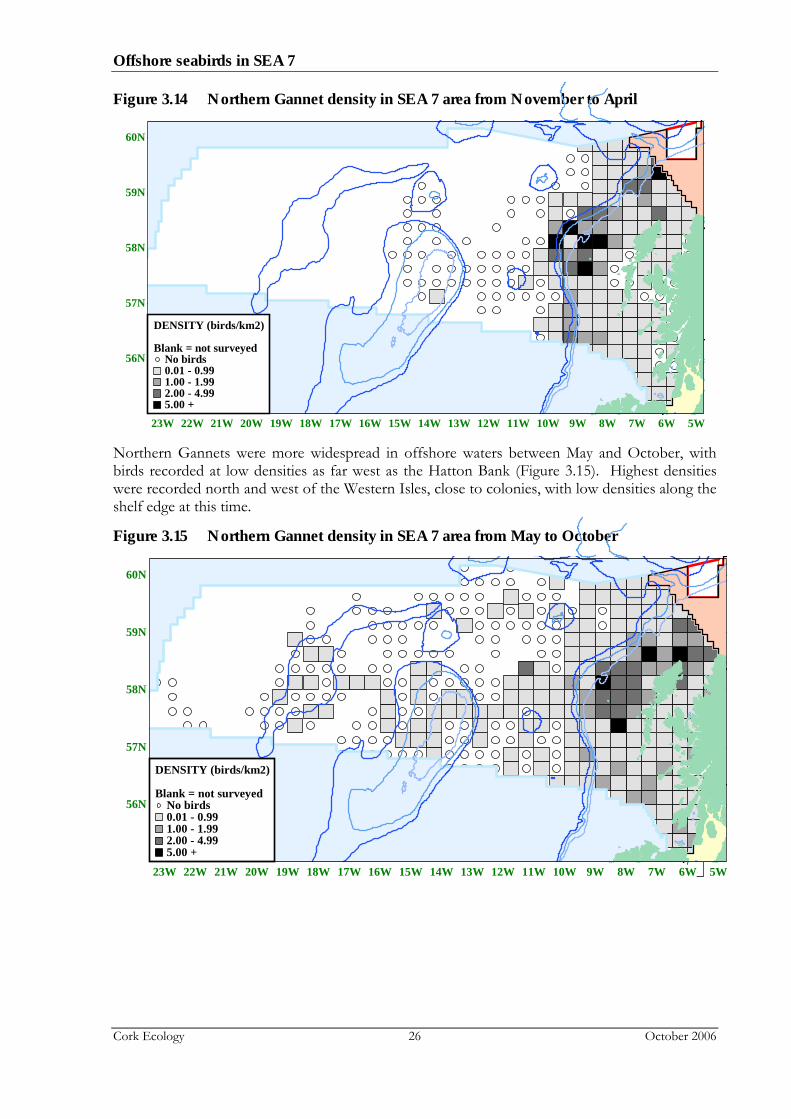
ESAS surveys recorded Northern Gannets in all months of the year. Peak densities were recorded in August, with lowest densities in November. Between November and April, highest densities were recorded along the shelf edge (Figure 3.14). Although survey coverage in offshore areas was not extensive, few birds were recorded in deep waters away from the east of the Rockall Trough. Northern Gannets were widespread at low densities over shelf waters at this time.
Offshore seabirds in SEA 7
Cork Ecology 26 October 2006
Figure 3.14 Northern Gannet density in SEA 7 area from November to April
56N
57N
58N
59N
60N
23W 22W 21W 20W 19W 18W 17W 16W 15W 14W 13W 12W 11W 10W 9W 8W 7W 6W 5W
5.00 +2.00 - 4.991.00 - 1.990.01 - 0.99No birds
Blank = not surveyed
DENSITY (birds/km2)
Northern Gannets were more widespread in offshore waters between May and October, with birds recorded at low densities as far west as the Hatton Bank (Figure 3.15). Highest densities were recorded north and west of the Western Isles, close to colonies, with low densities along the shelf edge at this time.
Figure 3.15 Northern Gannet density in SEA 7 area from May to October
56N
57N
58N
59N
60N
23W 22W 21W 20W 19W 18W 17W 16W 15W 14W 13W 12W 11W 10W 9W 8W 7W 6W 5W
5.00 +2.00 - 4.991.00 - 1.990.01 - 0.99No birds
Blank = not surveyed
DENSITY (birds/km2)
Offshore seabirds in SEA 7
Cork Ecology 27 October 2006
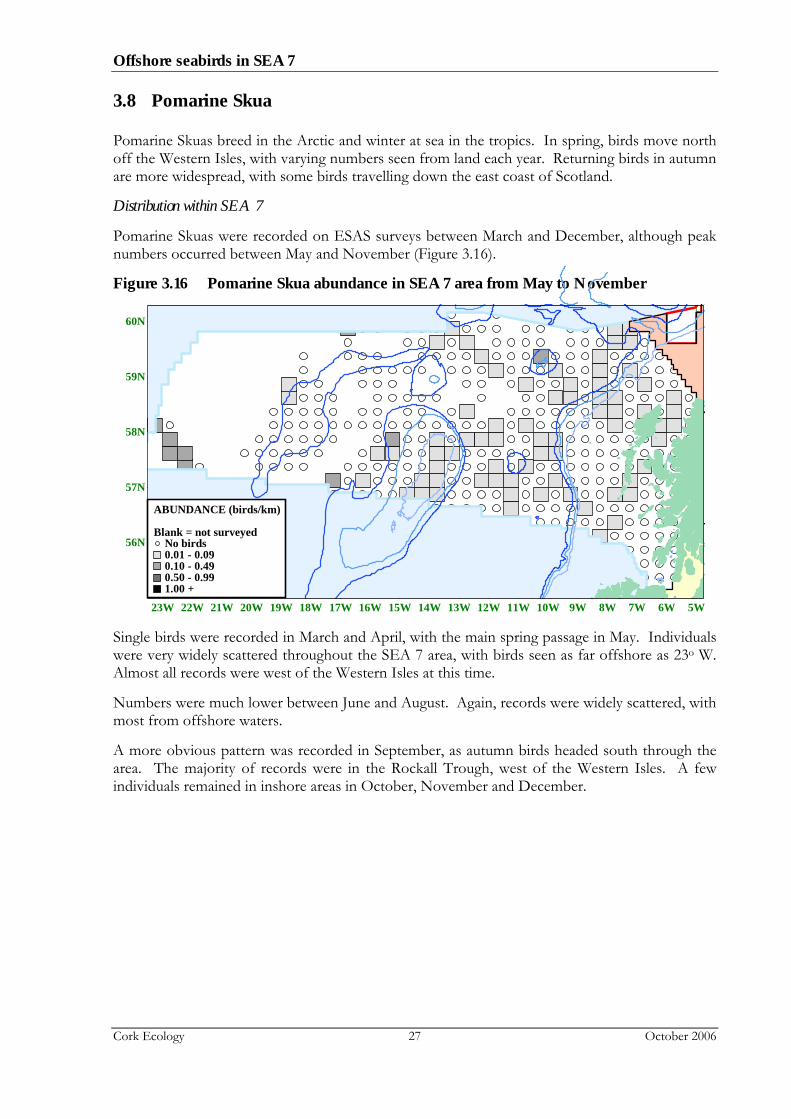
3.8 Pomarine Skua
Pomarine Skuas breed in the Arctic and winter at sea in the tropics. In spring, birds move north off the Western Isles, with varying numbers seen from land each year. Returning birds in autumn are more widespread, with some birds travelling down the east coast of Scotland.
Distribution within SEA 7
Pomarine Skuas were recorded on ESAS surveys between March and December, although peak numbers occurred between May and November (Figure 3.16).
Figure 3.16 Pomarine Skua abundance in SEA 7 area from May to November
56N
57N
58N
59N
60N
23W 22W 21W 20W 19W 18W 17W 16W 15W 14W 13W 12W 11W 10W 9W 8W 7W 6W 5W
1.00 +0.50 - 0.990.10 - 0.490.01 - 0.09No birds
Blank = not surveyed
ABUNDANCE (birds/km)
Single birds were recorded in March and April, with the main spring passage in May. Individuals were very widely scattered throughout the SEA 7 area, with birds seen as far offshore as 23o W. Almost all records were west of the Western Isles at this time.
Numbers were much lower between June and August. Again, records were widely scattered, with most from offshore waters.
A more obvious pattern was recorded in September, as autumn birds headed south through the area. The majority of records were in the Rockall Trough, west of the Western Isles. A few individuals remained in inshore areas in October, November and December.
Offshore seabirds in SEA 7
Cork Ecology 28 October 2006
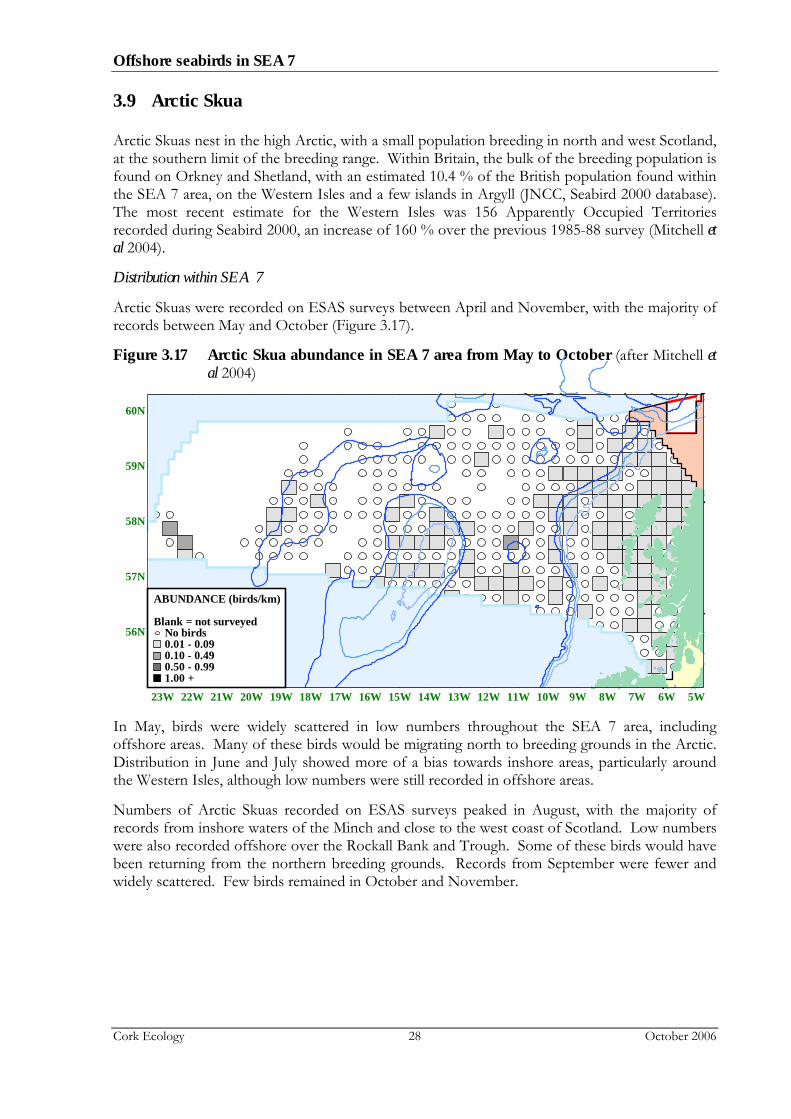
3.9 Arctic Skua
Arctic Skuas nest in the high Arctic, with a small population breeding in north and west Scotland, at the southern limit of the breeding range. Within Britain, the bulk of the breeding population is found on Orkney and Shetland, with an estimated 10.4 % of the British population found within the SEA 7 area, on the Western Isles and a few islands in Argyll (JNCC, Seabird 2000 database). The most recent estimate for the Western Isles was 156 Apparently Occupied Territories recorded during Seabird 2000, an increase of 160 % over the previous 1985-88 survey (Mitchell et al 2004).
Distribution within SEA 7
Arctic Skuas were recorded on ESAS surveys between April and November, with the majority of records between May and October (Figure 3.17).
Figure 3.17 Arctic Skua abundance in SEA 7 area from May to October (after Mitchell et al 2004)
56N
57N
58N
59N
60N
23W 22W 21W 20W 19W 18W 17W 16W 15W 14W 13W 12W 11W 10W 9W 8W 7W 6W 5W
1.00 +0.50 - 0.990.10 - 0.490.01 - 0.09No birds
Blank = not surveyed
ABUNDANCE (birds/km)
In May, birds were widely scattered in low numbers throughout the SEA 7 area, including offshore areas. Many of these birds would be migrating north to breeding grounds in the Arctic. Distribution in June and July showed more of a bias towards inshore areas, particularly around the Western Isles, although low numbers were still recorded in offshore areas.
Numbers of Arctic Skuas recorded on ESAS surveys peaked in August, with the majority of records from inshore waters of the Minch and close to the west coast of Scotland. Low numbers were also recorded offshore over the Rockall Bank and Trough. Some of these birds would have been returning from the northern breeding grounds. Records from September were fewer and widely scattered. Few birds remained in October and November.
Offshore seabirds in SEA 7
Cork Ecology 29 October 2006
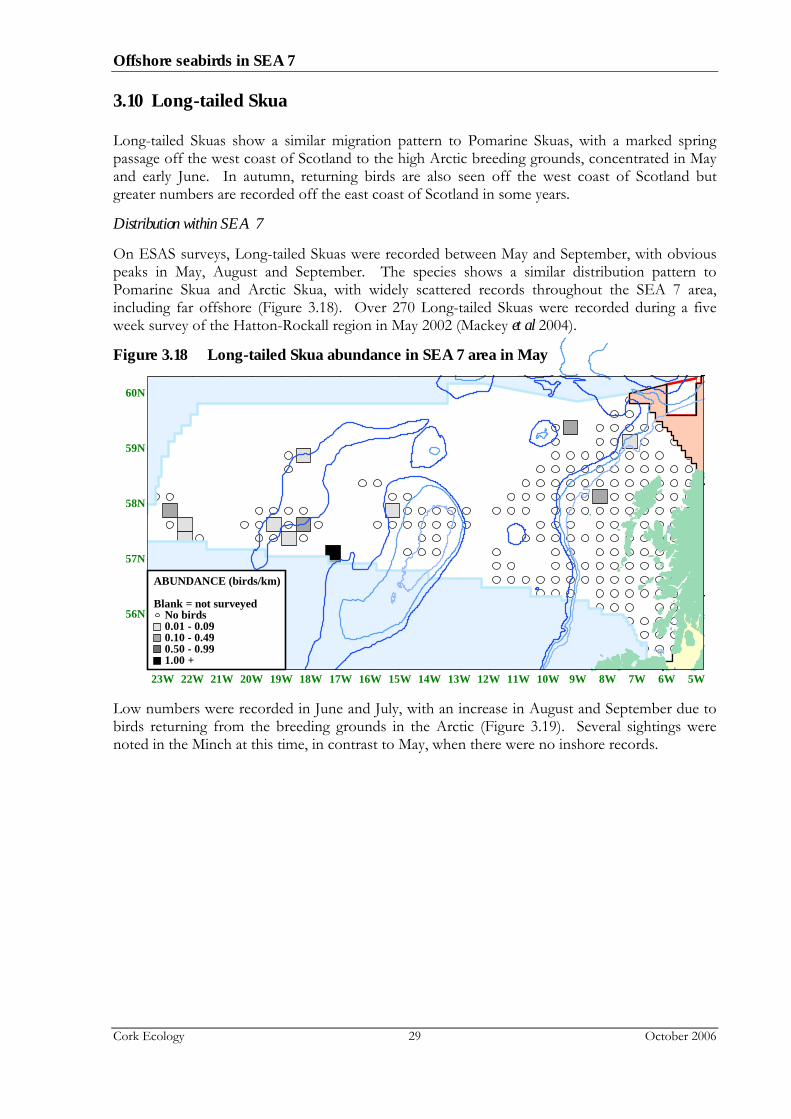
3.10 Long-tailed Skua
Long-tailed Skuas show a similar migration pattern to Pomarine Skuas, with a marked spring passage off the west coast of Scotland to the high Arctic breeding grounds, concentrated in May and early June. In autumn, returning birds are also seen off the west coast of Scotland but greater numbers are recorded off the east coast of Scotland in some years.
Distribution within SEA 7
On ESAS surveys, Long-tailed Skuas were recorded between May and September, with obvious peaks in May, August and September. The species shows a similar distribution pattern to Pomarine Skua and Arctic Skua, with widely scattered records throughout the SEA 7 area, including far offshore (Figure 3.18). Over 270 Long-tailed Skuas were recorded during a five week survey of the Hatton-Rockall region in May 2002 (Mackey et al 2004).
Figure 3.18 Long-tailed Skua abundance in SEA 7 area in May
56N
57N
58N
59N
60N
23W 22W 21W 20W 19W 18W 17W 16W 15W 14W 13W 12W 11W 10W 9W 8W 7W 6W 5W
1.00 +0.50 - 0.990.10 - 0.490.01 - 0.09No birds
Blank = not surveyed
ABUNDANCE (birds/km)
Low numbers were recorded in June and July, with an increase in August and September due to birds returning from the breeding grounds in the Arctic (Figure 3.19). Several sightings were noted in the Minch at this time, in contrast to May, when there were no inshore records.

Offshore seabirds in SEA 7
Cork Ecology 30 October 2006
Figure 3.19 Long-tailed Skua abundance in SEA 7 area in August and September
56N
57N
58N
59N
60N
23W 22W 21W 20W 19W 18W 17W 16W 15W 14W 13W 12W 11W 10W 9W 8W 7W 6W 5W
1.00 +0.50 - 0.990.10 - 0.490.01 - 0.09No birds
Blank = not surveyed
ABUNDANCE (birds/km)
3.11 Great Skua
The majority of the world’s Great Skua population breed on Shetland, Orkney and Iceland, although the breeding range has expanded in recent years (Mitchell et al 2004). The SEA 7 area holds an estimated 5.7 % of the British breeding population (JNCC, Seabird 2000 database), with new small colonies discovered on the Western Isles and the west of Scotland in recent years. The major breeding colonies for Great Skua in SEA 7 are shown in Table 3.7.
Table 3.7 Major breeding colonies for Great Skua in SEA 7 Area (after Mitchell et al 2004)
Site Apparently Occupied Territories (AOT)
St Kilda 240
Handa 195
Distribution and abundance within SEA 7
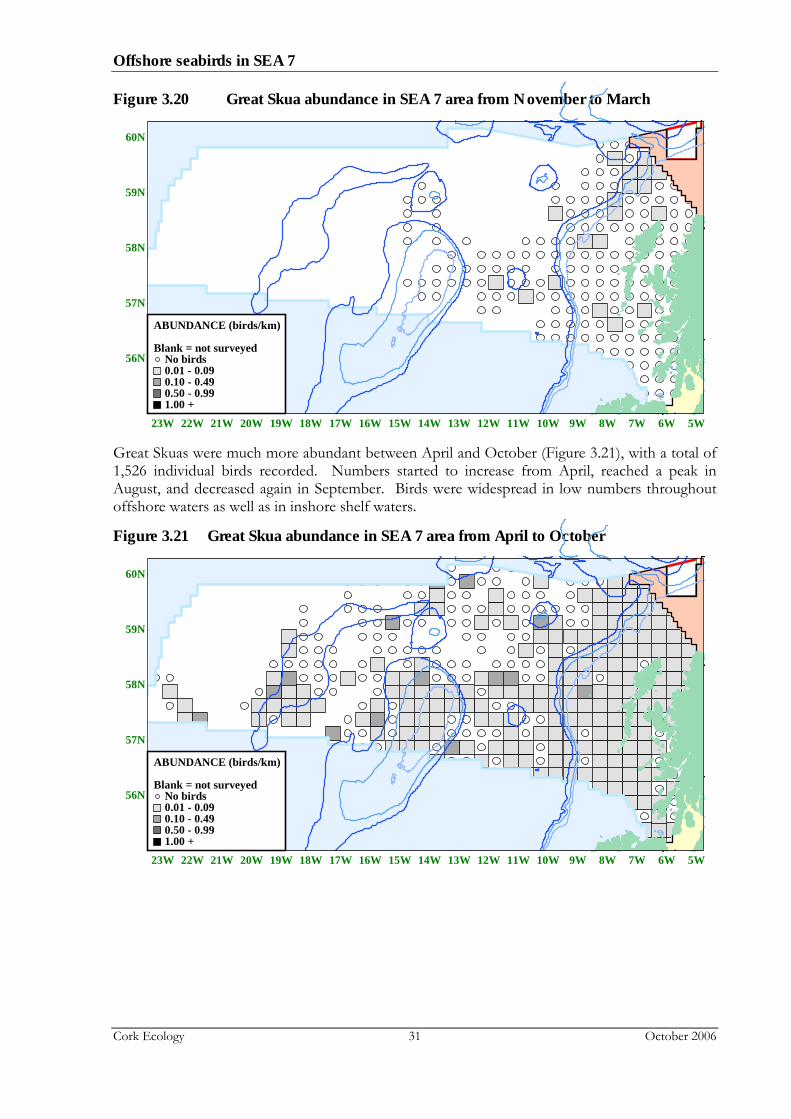
Great Skuas were recorded on ESAS surveys in all months except January. Few birds were recorded between November and March (Figure 3.20), with low numbers observed to the north and west of the western Isles and a few birds scattered to the south. The majority of birds occurred inshore of the shelf break at this time.
Offshore seabirds in SEA 7
Cork Ecology 31 October 2006
Figure 3.20 Great Skua abundance in SEA 7 area from November to March
56N
57N
58N
59N
60N
23W 22W 21W 20W 19W 18W 17W 16W 15W 14W 13W 12W 11W 10W 9W 8W 7W 6W 5W
1.00 +0.50 - 0.990.10 - 0.490.01 - 0.09No birds
Blank = not surveyed
ABUNDANCE (birds/km)
Great Skuas were much more abundant between April and October (Figure 3.21), with a total of 1,526 individual birds recorded. Numbers started to increase from April, reached a peak in August, and decreased again in September. Birds were widespread in low numbers throughout offshore waters as well as in inshore shelf waters.
Figure 3.21 Great Skua abundance in SEA 7 area from April to October
56N
57N
58N
59N
60N
23W 22W 21W 20W 19W 18W 17W 16W 15W 14W 13W 12W 11W 10W 9W 8W 7W 6W 5W
1.00 +0.50 - 0.990.10 - 0.490.01 - 0.09No birds
Blank = not surveyed
ABUNDANCE (birds/km)

Offshore seabirds in SEA 7
Cork Ecology 32 October 2006
3.12 Lesser Black-backed Gull
Lesser Black-backed Gulls were once considered a complete migrant to Britain, with only occasional birds present in winter, but increasing numbers now over-winter, predominantly in the southern half of Britain. Within the SEA 7 area, the species is a partial migrant, with most birds moving south during the winter months.
Although the overall UK breeding population has expanded in recent years, numbers of breeding birds around north west Scotland have showed a decline e.g. Lochaber –47 % decline, Skye & Lochalsh –88 % decline, Western Isles –5% decline (Mitchell et al 2004). The SEA 7 area holds an estimated 2.7 % of the British population in small, scattered colonies (JNCC, Seabird 2000 database).
Distribution within SEA 7
Lesser Black-backed Gulls were recorded in all months on ESAS surveys, with lowest densities in November, and highest densities in April. Between November and March, low densities were recorded in the Minch and in inshore waters west of Scotland, with a few individuals scattered further offshore (Figure 3.22).
Figure 3.22 Lesser Black-backed Gull density in SEA 7 area from November to March
56N
57N
58N
59N
60N
23W 22W 21W 20W 19W 18W 17W 16W 15W 14W 13W 12W 11W 10W 9W 8W 7W 6W 5W
5.00 +2.00 - 4.991.00 - 1.990.01 - 0.99No birds
Blank = not surveyed
DENSITY (birds/km2)

Offshore seabirds in SEA 7
Cork Ecology 33 October 2006
There was a large influx of birds recorded in April and May. Generally low densities were recorded in offshore areas such as the Hatton Bank, Rockall Bank and Rockall Trough, although some moderate to high density patches were recorded over the shelf break (Figure 3.23).
Figure 3.23 Lesser Black-backed Gull density in SEA 7 area in April and May
56N
57N
58N
59N
60N
23W 22W 21W 20W 19W 18W 17W 16W 15W 14W 13W 12W 11W 10W 9W 8W 7W 6W 5W
5.00 +2.00 - 4.991.00 - 1.990.01 - 0.99No birds
Blank = not surveyed
DENSITY (birds/km2)
Low densities were recorded offshore between June and September, but survey coverage was not available for offshore areas in October (Figure 3.24). Low densities were also recorded along the shelf break and in inshore waters (see also Barton & Pollock 2005).
Figure 3.24 Lesser Black-backed Gull density in SEA 7 area from June to October
56N
57N
58N
59N
60N
23W 22W 21W 20W 19W 18W 17W 16W 15W 14W 13W 12W 11W 10W 9W 8W 7W 6W 5W
5.00 +2.00 - 4.991.00 - 1.990.01 - 0.99No birds
Blank = not surveyed
DENSITY (birds/km2)
Offshore seabirds in SEA 7
Cork Ecology 34 October 2006
3.13 Great Black-backed Gull
During the 20th century numbers of Great Black-backed Gulls increased dramatically. Great Black-backed Gulls are more marine than Lesser Black-backed Gulls, and nest almost exclusively in coastal habitats. In Britain, the species breeds mainly on the west coast of Scotland, the Inner and Outer Hebrides, and in the Northern Isles although numbers counted during Seabird 2000 showed a slight decline on a national scale compared to the last survey in 1985-88 (Mitchell et al 2004).
The SEA 7 area holds an estimated 25.6 % of the British breeding population (JNCC, Seabird 2000 database), with important breeding concentrations on the Western Isles and the Inner Hebrides. Declines were noted in these areas during Seabird 2000 e.g. Skye & Lochalsh –56 % decline, Western Isles –23% decline (Mitchell et al 2004). The major breeding colonies for Great Black-backed Gull in SEA 7 are shown in Table 3.8.
Table 3.8 Major breeding colonies for Great Black-backed Gull in SEA 7 area (after Mitchell et al 2004)
Site Apparently Occupied Nests (AON)
North Rona 983
Treshnish Islands 342
Shiant Islands 310
Coll 177
Distribution within SEA 7
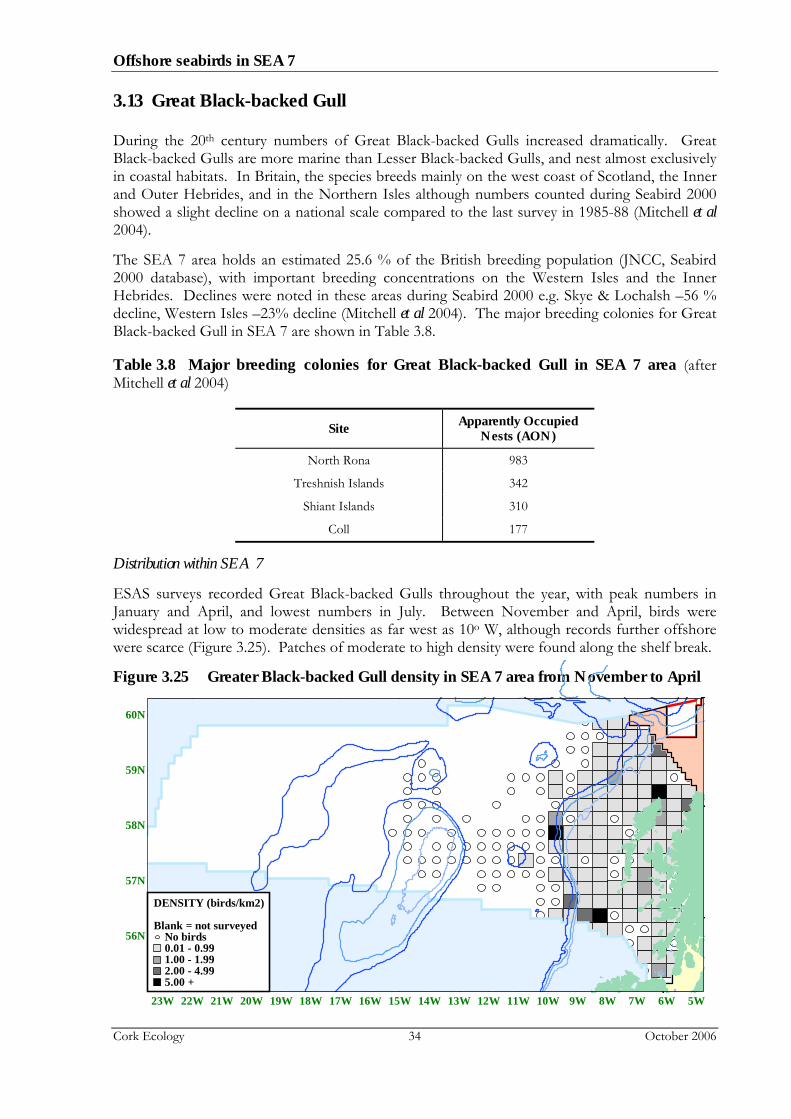
ESAS surveys recorded Great Black-backed Gulls throughout the year, with peak numbers in January and April, and lowest numbers in July. Between November and April, birds were widespread at low to moderate densities as far west as 10o W, although records further offshore were scarce (Figure 3.25). Patches of moderate to high density were found along the shelf break.
Figure 3.25 Greater Black-backed Gull density in SEA 7 area from November to April
56N
57N
58N
59N
60N
23W 22W 21W 20W 19W 18W 17W 16W 15W 14W 13W 12W 11W 10W 9W 8W 7W 6W 5W
5.00 +2.00 - 4.991.00 - 1.990.01 - 0.99No birds
Blank = not surveyed
DENSITY (birds/km2)
Offshore seabirds in SEA 7
Cork Ecology 35 October 2006
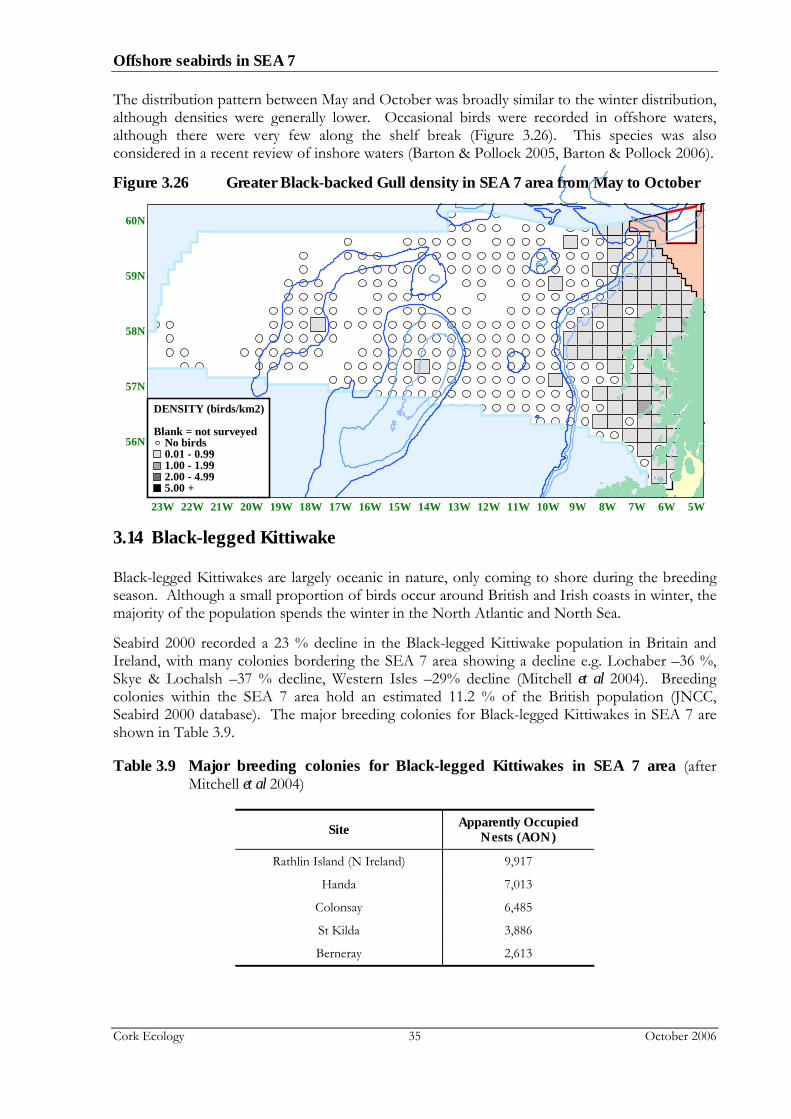
The distribution pattern between May and October was broadly similar to the winter distribution, although densities were generally lower. Occasional birds were recorded in offshore waters, although there were very few along the shelf break (Figure 3.26). This species was also considered in a recent review of inshore waters (Barton & Pollock 2005, Barton & Pollock 2006).
Figure 3.26 Greater Black-backed Gull density in SEA 7 area from May to October
56N
57N
58N
59N
60N
23W 22W 21W 20W 19W 18W 17W 16W 15W 14W 13W 12W 11W 10W 9W 8W 7W 6W 5W
5.00 +2.00 - 4.991.00 - 1.990.01 - 0.99No birds
Blank = not surveyed
DENSITY (birds/km2)
3.14 Black-legged Kittiwake
Black-legged Kittiwakes are largely oceanic in nature, only coming to shore during the breeding season. Although a small proportion of birds occur around British and Irish coasts in winter, the majority of the population spends the winter in the North Atlantic and North Sea.
Seabird 2000 recorded a 23 % decline in the Black-legged Kittiwake population in Britain and Ireland, with many colonies bordering the SEA 7 area showing a decline e.g. Lochaber –36 %, Skye & Lochalsh –37 % decline, Western Isles –29% decline (Mitchell et al 2004). Breeding colonies within the SEA 7 area hold an estimated 11.2 % of the British population (JNCC, Seabird 2000 database). The major breeding colonies for Black-legged Kittiwakes in SEA 7 are shown in Table 3.9.
Table 3.9 Major breeding colonies for Black-legged Kittiwakes in SEA 7 area (after Mitchell et al 2004)
Site Apparently Occupied Nests (AON)
Rathlin Island (N Ireland) 9,917
Handa 7,013
Colonsay 6,485
St Kilda 3,886
Berneray 2,613

Offshore seabirds in SEA 7
Cork Ecology 36 October 2006
Distribution within SEA 7
ESAS surveys recorded Black-legged Kittiwakes throughout the year, with peak numbers in August, and lowest numbers in March. Between January and April, birds were widespread in inshore waters. Further offshore, peak densities were recorded along the shelf break (Figure 3.27). Densities were lower in waters greater than 1,000 m deep and were mostly distributed over the Rockall Trough and Bank.
Figure 3.27 Black-legged Kittiwake density in SEA 7 area from January to April
56N
57N
58N
59N
60N
23W 22W 21W 20W 19W 18W 17W 16W 15W 14W 13W 12W 11W 10W 9W 8W 7W 6W 5W
5.00 +2.00 - 4.991.00 - 1.990.01 - 0.99No birds
Blank = not surveyed
DENSITY (birds/km2)
Between May and September, highest densities were recorded in inshore waters close to breeding colonies (see Barton & Pollock 2005). Birds were widespread at low densities offshore over the Rockall Trough and Bank and the Hatton Bank, becoming more scattered at greater distance from the coast (Figure 3.28).
Figure 3.28 Black-legged Kittiwake density in SEA 7 area from May to September
56N
57N
58N
59N
60N
23W 22W 21W 20W 19W 18W 17W 16W 15W 14W 13W 12W 11W 10W 9W 8W 7W 6W 5W
5.00 +2.00 - 4.991.00 - 1.990.01 - 0.99No birds
Blank = not surveyed
DENSITY (birds/km2)
Offshore seabirds in SEA 7
Cork Ecology 37 October 2006
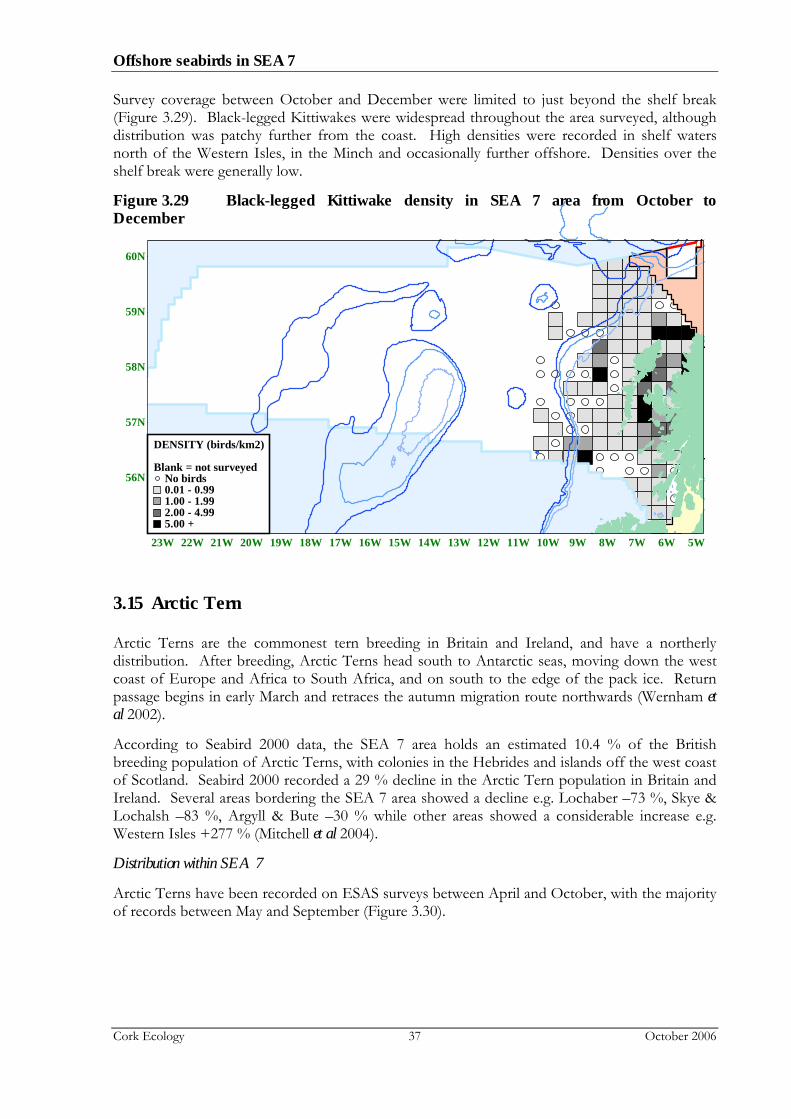
Survey coverage between October and December were limited to just beyond the shelf break (Figure 3.29). Black-legged Kittiwakes were widespread throughout the area surveyed, although distribution was patchy further from the coast. High densities were recorded in shelf waters north of the Western Isles, in the Minch and occasionally further offshore. Densities over the shelf break were generally low.
Figure 3.29 Black-legged Kittiwake density in SEA 7 area from October to December
56N
57N
58N
59N
60N
23W 22W 21W 20W 19W 18W 17W 16W 15W 14W 13W 12W 11W 10W 9W 8W 7W 6W 5W
5.00 +2.00 - 4.991.00 - 1.990.01 - 0.99No birds
Blank = not surveyed
DENSITY (birds/km2)
3.15 Arctic Tern
Arctic Terns are the commonest tern breeding in Britain and Ireland, and have a northerly distribution. After breeding, Arctic Terns head south to Antarctic seas, moving down the west coast of Europe and Africa to South Africa, and on south to the edge of the pack ice. Return passage begins in early March and retraces the autumn migration route northwards (Wernham et al 2002).
According to Seabird 2000 data, the SEA 7 area holds an estimated 10.4 % of the British breeding population of Arctic Terns, with colonies in the Hebrides and islands off the west coast of Scotland. Seabird 2000 recorded a 29 % decline in the Arctic Tern population in Britain and Ireland. Several areas bordering the SEA 7 area showed a decline e.g. Lochaber –73 %, Skye & Lochalsh –83 %, Argyll & Bute –30 % while other areas showed a considerable increase e.g. Western Isles +277 % (Mitchell et al 2004).
Distribution within SEA 7
Arctic Terns have been recorded on ESAS surveys between April and October, with the majority of records between May and September (Figure 3.30).

Offshore seabirds in SEA 7
Cork Ecology 38 October 2006
Figure 3.30 Arctic Tern abundance in SEA 7 area from May to September
56N
57N
58N
59N
60N
23W 22W 21W 20W 19W 18W 17W 16W 15W 14W 13W 12W 11W 10W 9W 8W 7W 6W 5W
1.00 +0.50 - 0.990.10 - 0.490.01 - 0.09No birds
Blank = not surveyed
ABUNDANCE (birds/km)
Low numbers of early returning birds were recorded in April, with greater numbers seen in May, when birds were encountered as far offshore as 23o W. Distribution in June and July was concentrated around breeding colonies on the Western Isles and other west coast islands, although occasional birds were recorded in low numbers in offshore areas. Birds were more widespread in offshore areas in August, in low to moderate numbers. Numbers dropped considerably by September, with the majority of records coming from offshore areas. Low numbers remained in the Minch in October.
3.16 Little Auk
Little Auks breed in the high Arctic, with large colonies in Spitzbergen and Greenland. In winter, Little Auks are pelagic, and are generally found offshore, only visible from land following strong onshore winds (Lack 1986).
Distribution within SEA 7
The majority of Little Auks were recorded on ESAS surveys between November and March, with a few sightings between April and October.
Peak numbers were recorded in November, with most birds recorded along the shelf break and in the north east of the Rockall Trough, with smaller concentrations at the northern end of the Minch. A similar pattern was recorded in December, although numbers were lower. Offshore survey coverage was greater to the west of the Western Isles in January and February when concentrations were recorded over the Rockall Bank. Birds were widely scattered in March although less offshore coverage was achieved (Figure 3.31).

Offshore seabirds in SEA 7
Cork Ecology 39 October 2006
Figure 3.31 Little Auk abundance in SEA 7 area from November to March
56N
57N
58N
59N
60N
23W 22W 21W 20W 19W 18W 17W 16W 15W 14W 13W 12W 11W 10W 9W 8W 7W 6W 5W
1.00 +0.50 - 0.990.10 - 0.490.01 - 0.09No birds
Blank = not surveyed
ABUNDANCE (birds/km)
Little Auks were occasionally recorded between April and October (Figure 3.32). Only one was seen in April, north of the Western Isles, but offshore surveys in May recorded small numbers over the Hatton Bank. One was recorded over the Anton Dohrn Seamount in June, and a single bird was recorded close inshore in August. There were no sightings in July or September.
Figure 3.32 Little Auk abundance in SEA 7 area from April to October
56N
57N
58N
59N
60N
23W 22W 21W 20W 19W 18W 17W 16W 15W 14W 13W 12W 11W 10W 9W 8W 7W 6W 5W
1.00 +0.50 - 0.990.10 - 0.490.01 - 0.09No birds
Blank = not surveyed
ABUNDANCE (birds/km)
Offshore seabirds in SEA 7
Cork Ecology 40 October 2006
3.17 Atlantic Puffin
Atlantic Puffins are largely pelagic, only coming ashore to breed between March and August. After breeding, birds from north-west Britain and Ireland disperse widely, with ringed birds recovered in Newfoundland and Greenland, the Canary Islands and the Mediterranean (Mitchell et al 2004).
An estimated 41.3 % of the British breeding population of Atlantic Puffins are found within the SEA 7 area (JNCC, Seabird 2000 database). Although Seabird 2000 recorded an increase in the Atlantic Puffin population in Scotland, several areas bordering the SEA 7 area showed a decline e.g. Lochaber –6 %, Skye & Lochalsh –82 %, Argyll & Bute –1 %, Western Isles -5 % (Mitchell et al 2004). The major breeding colonies for Atlantic Puffins in SEA 7 are shown in Table 3.10.
Table 3.10 Major breeding colonies for Atlantic Puffins in SEA 7 area (after Mitchell et al 2004)
Site Apparently Occupied Burrows (AOB)
St Kilda 142,264
Flannan Isles 15,761
North Rona 5,265
Berneray 1,979
Canna 945
Handa 735
Distribution within SEA 7
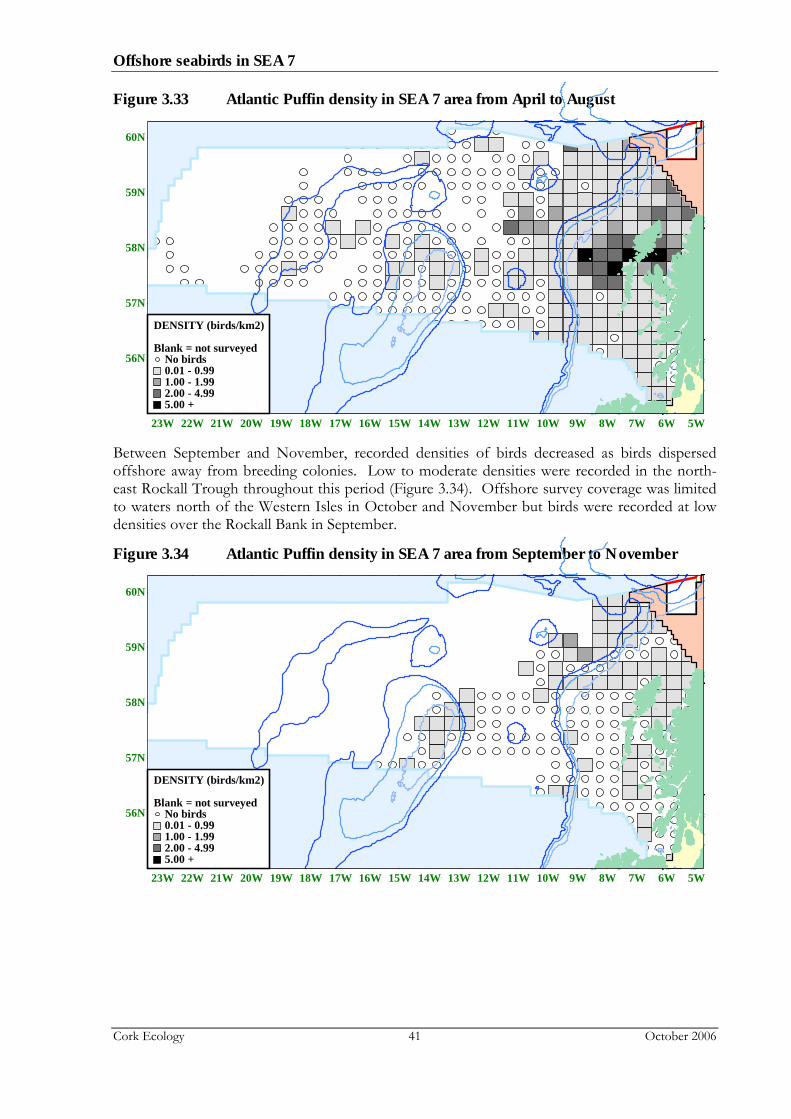
ESAS surveys recorded Atlantic Puffins in all months, although the majority of records were between April and November. Highest densities of Atlantic Puffins were recorded between April and August (Figure 3.33). Birds were widespread in inshore areas, with highest densities recorded around the Western Isles and in the Minch. Offshore, birds were widely scattered at low densities along the shelf break and eastern edge of the Rockall Trough, and as far west as the Hatton Bank. Offshore survey coverage was most extensive in May and June, with less coverage in July and August.
Offshore seabirds in SEA 7
Cork Ecology 41 October 2006
Figure 3.33 Atlantic Puffin density in SEA 7 area from April to August
56N
57N
58N
59N
60N
23W 22W 21W 20W 19W 18W 17W 16W 15W 14W 13W 12W 11W 10W 9W 8W 7W 6W 5W
5.00 +2.00 - 4.991.00 - 1.990.01 - 0.99No birds
Blank = not surveyed
DENSITY (birds/km2)
Between September and November, recorded densities of birds decreased as birds dispersed offshore away from breeding colonies. Low to moderate densities were recorded in the north-east Rockall Trough throughout this period (Figure 3.34). Offshore survey coverage was limited to waters north of the Western Isles in October and November but birds were recorded at low densities over the Rockall Bank in September.
Figure 3.34 Atlantic Puffin density in SEA 7 area from September to November
56N
57N
58N
59N
60N
23W 22W 21W 20W 19W 18W 17W 16W 15W 14W 13W 12W 11W 10W 9W 8W 7W 6W 5W
5.00 +2.00 - 4.991.00 - 1.990.01 - 0.99No birds
Blank = not surveyed
DENSITY (birds/km2)

Offshore seabirds in SEA 7
Cork Ecology 42 October 2006
In December, few birds were detected on surveys, although offshore survey coverage was limited to waters north of the Western Isles. Birds were occasionally encountered in January and February, and numbers began to increase slightly in March north of the Western Isles and in the Minch, although densities were still low (Figure 3.35).
Figure 3.35 Atlantic Puffin density in SEA 7 area from December to March
56N
57N
58N
59N
60N
23W 22W 21W 20W 19W 18W 17W 16W 15W 14W 13W 12W 11W 10W 9W 8W 7W 6W 5W
5.00 +2.00 - 4.991.00 - 1.990.01 - 0.99No birds
Blank = not surveyed
DENSITY (birds/km2)
Offshore seabirds in SEA 7
Cork Ecology 43 October 2006
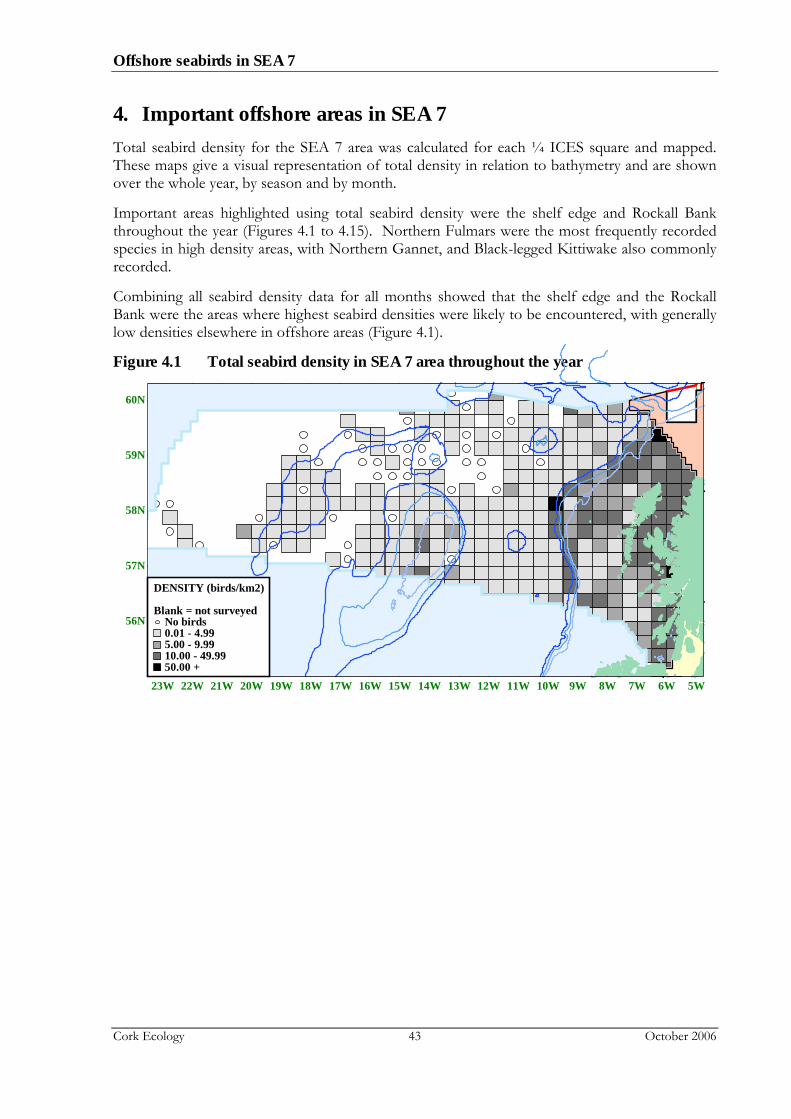
4. Important offshore areas in SEA 7 Total seabird density for the SEA 7 area was calculated for each ¼ ICES square and mapped. These maps give a visual representation of total density in relation to bathymetry and are shown over the whole year, by season and by month.
Important areas highlighted using total seabird density were the shelf edge and Rockall Bank throughout the year (Figures 4.1 to 4.15). Northern Fulmars were the most frequently recorded species in high density areas, with Northern Gannet, and Black-legged Kittiwake also commonly recorded.
Combining all seabird density data for all months showed that the shelf edge and the Rockall Bank were the areas where highest seabird densities were likely to be encountered, with generally low densities elsewhere in offshore areas (Figure 4.1).
Figure 4.1 Total seabird density in SEA 7 area throughout the year
56N
57N
58N
59N
60N
23W 22W 21W 20W 19W 18W 17W 16W 15W 14W 13W 12W 11W 10W 9W 8W 7W 6W 5W
50.00 +10.00 - 49.995.00 - 9.990.01 - 4.99No birds
Blank = not surveyed
DENSITY (birds/km2)
Offshore seabirds in SEA 7
Cork Ecology 44 October 2006
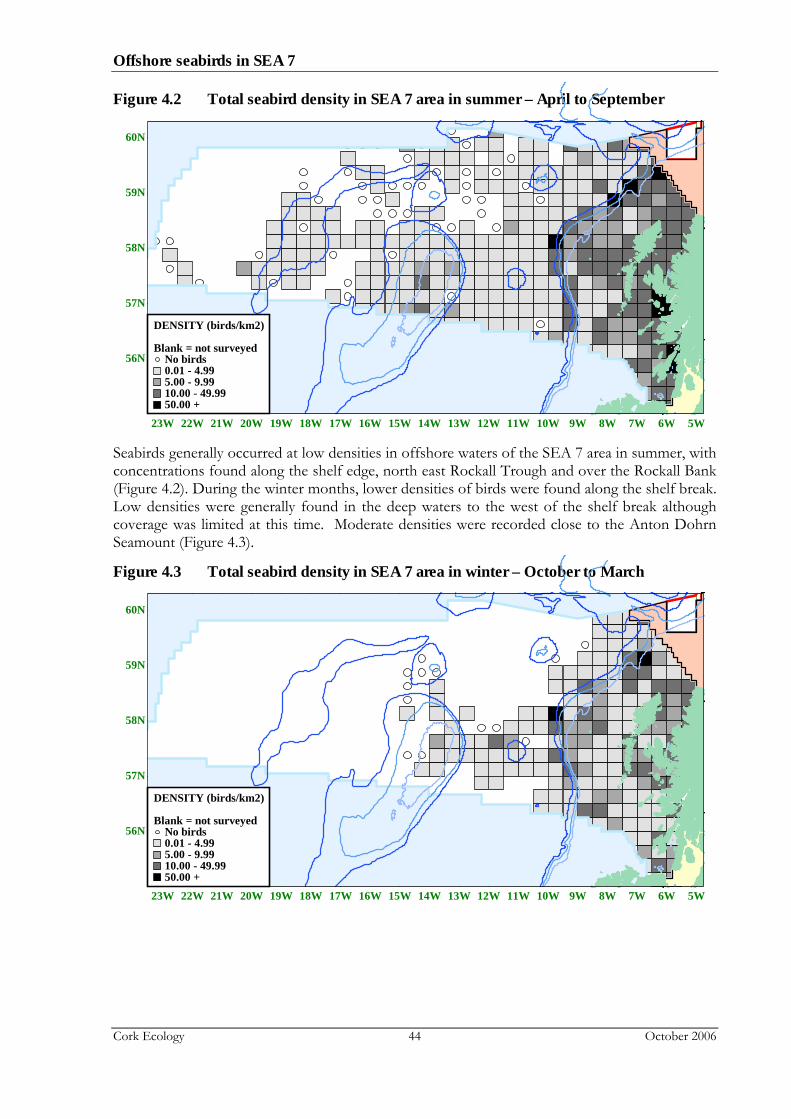
Figure 4.2 Total seabird density in SEA 7 area in summer – April to September
56N
57N
58N
59N
60N
23W 22W 21W 20W 19W 18W 17W 16W 15W 14W 13W 12W 11W 10W 9W 8W 7W 6W 5W
50.00 +10.00 - 49.995.00 - 9.990.01 - 4.99No birds
Blank = not surveyed
DENSITY (birds/km2)
Seabirds generally occurred at low densities in offshore waters of the SEA 7 area in summer, with concentrations found along the shelf edge, north east Rockall Trough and over the Rockall Bank (Figure 4.2). During the winter months, lower densities of birds were found along the shelf break. Low densities were generally found in the deep waters to the west of the shelf break although coverage was limited at this time. Moderate densities were recorded close to the Anton Dohrn Seamount (Figure 4.3).
Figure 4.3 Total seabird density in SEA 7 area in winter – October to March
56N
57N
58N
59N
60N
23W 22W 21W 20W 19W 18W 17W 16W 15W 14W 13W 12W 11W 10W 9W 8W 7W 6W 5W
50.00 +10.00 - 49.995.00 - 9.990.01 - 4.99No birds
Blank = not surveyed
DENSITY (birds/km2)
Offshore seabirds in SEA 7
Cork Ecology 45 October 2006
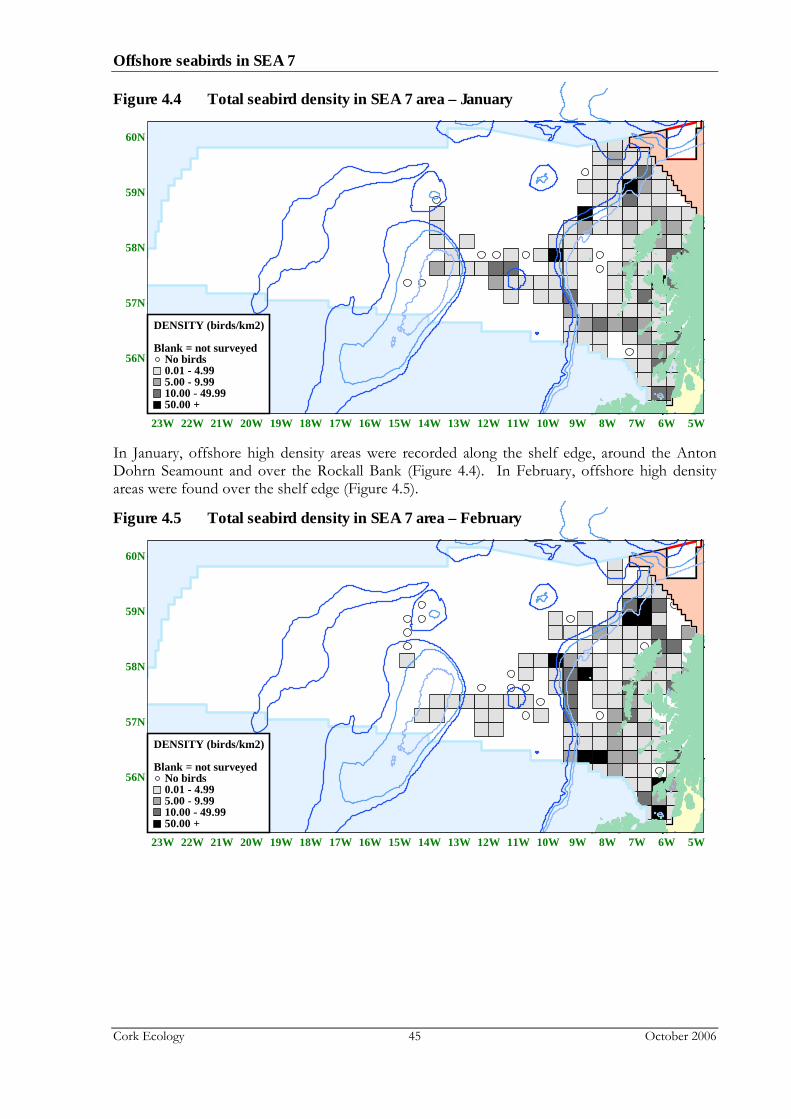
Figure 4.4 Total seabird density in SEA 7 area – January
56N
57N
58N
59N
60N
23W 22W 21W 20W 19W 18W 17W 16W 15W 14W 13W 12W 11W 10W 9W 8W 7W 6W 5W
50.00 +10.00 - 49.995.00 - 9.990.01 - 4.99No birds
Blank = not surveyed
DENSITY (birds/km2)
In January, offshore high density areas were recorded along the shelf edge, around the Anton Dohrn Seamount and over the Rockall Bank (Figure 4.4). In February, offshore high density areas were found over the shelf edge (Figure 4.5).
Figure 4.5 Total seabird density in SEA 7 area – February
56N
57N
58N
59N
60N
23W 22W 21W 20W 19W 18W 17W 16W 15W 14W 13W 12W 11W 10W 9W 8W 7W 6W 5W
50.00 +10.00 - 49.995.00 - 9.990.01 - 4.99No birds
Blank = not surveyed
DENSITY (birds/km2)
Offshore seabirds in SEA 7
Cork Ecology 46 October 2006
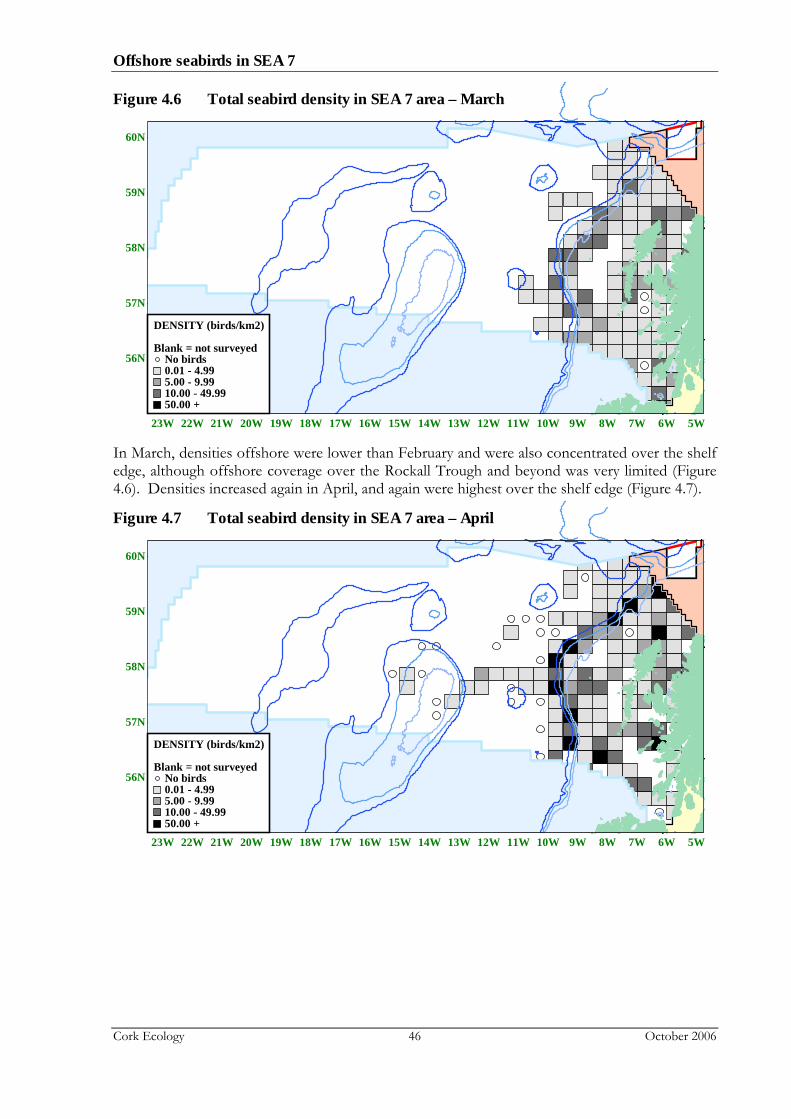
Figure 4.6 Total seabird density in SEA 7 area – March
56N
57N
58N
59N
60N
23W 22W 21W 20W 19W 18W 17W 16W 15W 14W 13W 12W 11W 10W 9W 8W 7W 6W 5W
50.00 +10.00 - 49.995.00 - 9.990.01 - 4.99No birds
Blank = not surveyed
DENSITY (birds/km2)
In March, densities offshore were lower than February and were also concentrated over the shelf edge, although offshore coverage over the Rockall Trough and beyond was very limited (Figure 4.6). Densities increased again in April, and again were highest over the shelf edge (Figure 4.7).
Figure 4.7 Total seabird density in SEA 7 area – April
56N
57N
58N
59N
60N
23W 22W 21W 20W 19W 18W 17W 16W 15W 14W 13W 12W 11W 10W 9W 8W 7W 6W 5W
50.00 +10.00 - 49.995.00 - 9.990.01 - 4.99No birds
Blank = not surveyed
DENSITY (birds/km2)
Offshore seabirds in SEA 7
Cork Ecology 47 October 2006
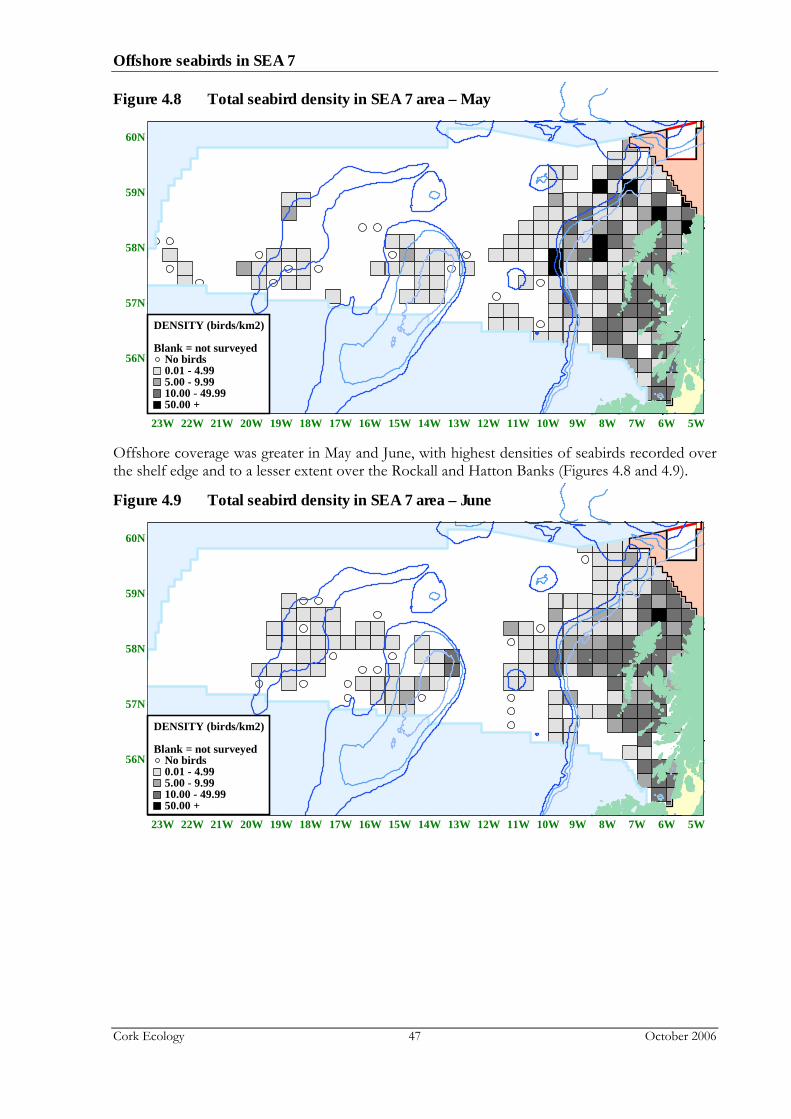
Figure 4.8 Total seabird density in SEA 7 area – May
56N
57N
58N
59N
60N
23W 22W 21W 20W 19W 18W 17W 16W 15W 14W 13W 12W 11W 10W 9W 8W 7W 6W 5W
50.00 +10.00 - 49.995.00 - 9.990.01 - 4.99No birds
Blank = not surveyed
DENSITY (birds/km2)
Offshore coverage was greater in May and June, with highest densities of seabirds recorded over the shelf edge and to a lesser extent over the Rockall and Hatton Banks (Figures 4.8 and 4.9).
Figure 4.9 Total seabird density in SEA 7 area – June
56N
57N
58N
59N
60N
23W 22W 21W 20W 19W 18W 17W 16W 15W 14W 13W 12W 11W 10W 9W 8W 7W 6W 5W
50.00 +10.00 - 49.995.00 - 9.990.01 - 4.99No birds
Blank = not surveyed
DENSITY (birds/km2)
Offshore seabirds in SEA 7
Cork Ecology 48 October 2006
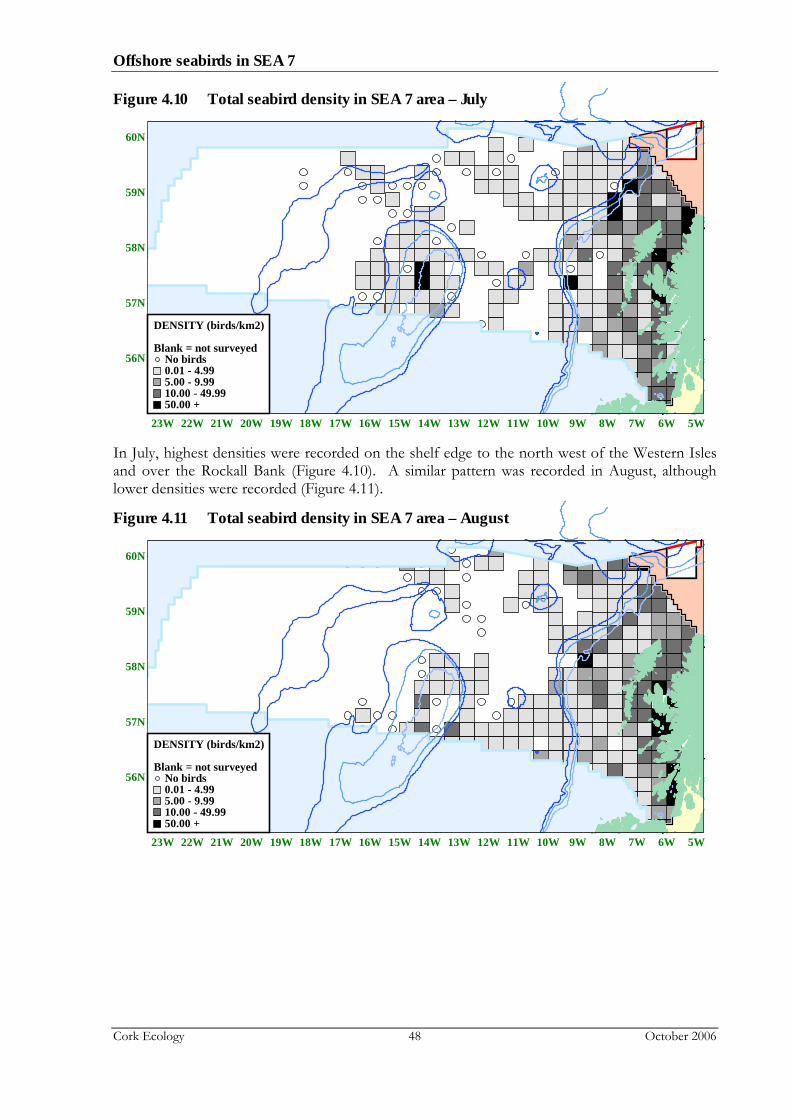
Figure 4.10 Total seabird density in SEA 7 area – July
56N
57N
58N
59N
60N
23W 22W 21W 20W 19W 18W 17W 16W 15W 14W 13W 12W 11W 10W 9W 8W 7W 6W 5W
50.00 +10.00 - 49.995.00 - 9.990.01 - 4.99No birds
Blank = not surveyed
DENSITY (birds/km2)
In July, highest densities were recorded on the shelf edge to the north west of the Western Isles and over the Rockall Bank (Figure 4.10). A similar pattern was recorded in August, although lower densities were recorded (Figure 4.11).
Figure 4.11 Total seabird density in SEA 7 area – August
56N
57N
58N
59N
60N
23W 22W 21W 20W 19W 18W 17W 16W 15W 14W 13W 12W 11W 10W 9W 8W 7W 6W 5W
50.00 +10.00 - 49.995.00 - 9.990.01 - 4.99No birds
Blank = not surveyed
DENSITY (birds/km2)
Offshore seabirds in SEA 7
Cork Ecology 49 October 2006
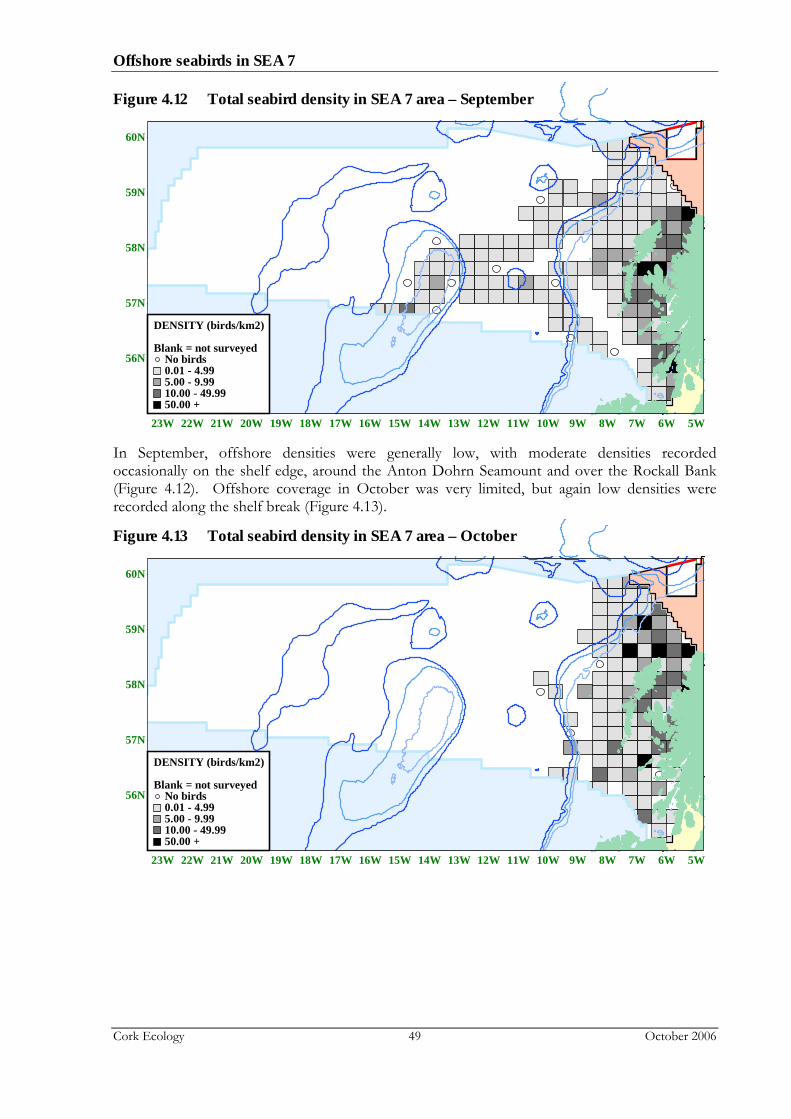
Figure 4.12 Total seabird density in SEA 7 area – September
56N
57N
58N
59N
60N
23W 22W 21W 20W 19W 18W 17W 16W 15W 14W 13W 12W 11W 10W 9W 8W 7W 6W 5W
50.00 +10.00 - 49.995.00 - 9.990.01 - 4.99No birds
Blank = not surveyed
DENSITY (birds/km2)
In September, offshore densities were generally low, with moderate densities recorded occasionally on the shelf edge, around the Anton Dohrn Seamount and over the Rockall Bank (Figure 4.12). Offshore coverage in October was very limited, but again low densities were recorded along the shelf break (Figure 4.13).
Figure 4.13 Total seabird density in SEA 7 area – October
56N
57N
58N
59N
60N
23W 22W 21W 20W 19W 18W 17W 16W 15W 14W 13W 12W 11W 10W 9W 8W 7W 6W 5W
50.00 +10.00 - 49.995.00 - 9.990.01 - 4.99No birds
Blank = not surveyed
DENSITY (birds/km2)
Offshore seabirds in SEA 7
Cork Ecology 50 October 2006
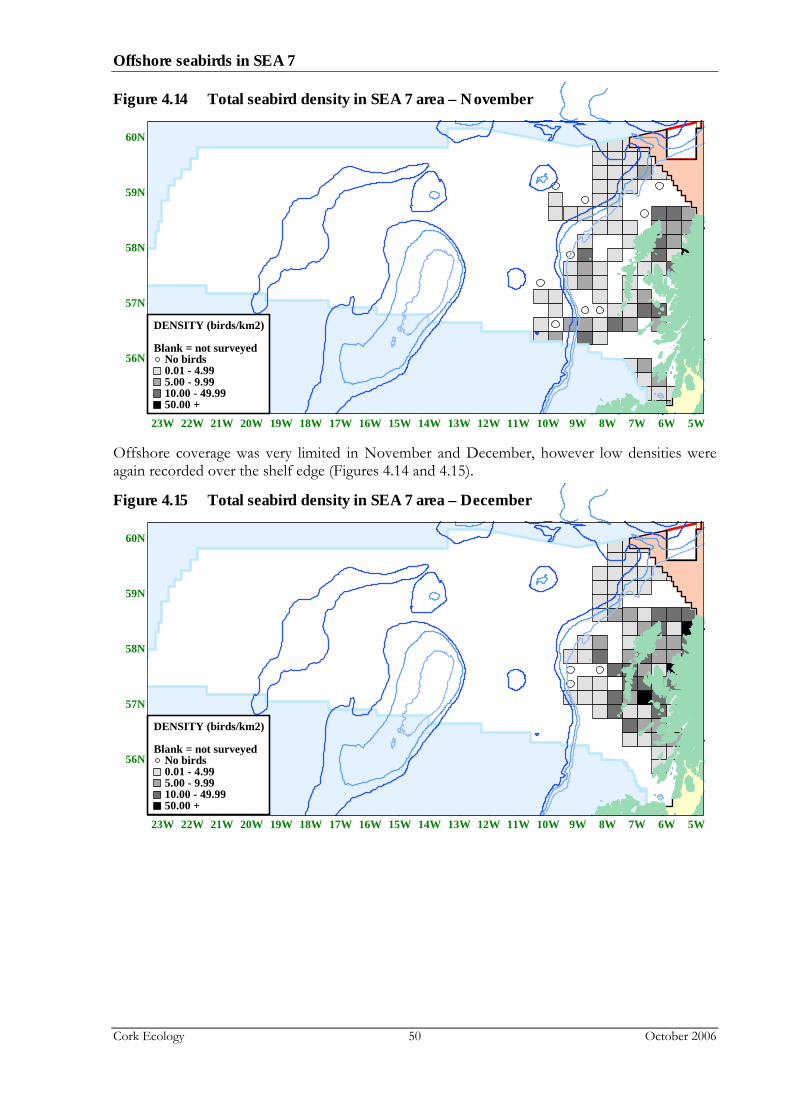
Figure 4.14 Total seabird density in SEA 7 area – November
56N
57N
58N
59N
60N
23W 22W 21W 20W 19W 18W 17W 16W 15W 14W 13W 12W 11W 10W 9W 8W 7W 6W 5W
50.00 +10.00 - 49.995.00 - 9.990.01 - 4.99No birds
Blank = not surveyed
DENSITY (birds/km2)
Offshore coverage was very limited in November and December, however low densities were again recorded over the shelf edge (Figures 4.14 and 4.15).
Figure 4.15 Total seabird density in SEA 7 area – December
56N
57N
58N
59N
60N
23W 22W 21W 20W 19W 18W 17W 16W 15W 14W 13W 12W 11W 10W 9W 8W 7W 6W 5W
50.00 +10.00 - 49.995.00 - 9.990.01 - 4.99No birds
Blank = not surveyed
DENSITY (birds/km2)

Offshore seabirds in SEA 7
Cork Ecology 51 October 2006
4.1 Species diversity
Overall species diversity in the summer months (April to September) and winter months (October to March) is shown in Figures 4.16 & 4.17. Generally, species diversity was highest in inshore shelf waters where over 15 species were recorded, with fewer species in offshore areas. In summer, more than 15 species were recorded in some areas of the shelf break, while the Rockall Bank and Rockall Trough held between 5 and 14 species. Less than 5 species were recorded in most other offshore areas. Species diversity was highest over the Rockall Bank in July and September, with Northern Fulmar, Northern Gannet and Black-legged Kittiwake being the most common species. Other species regularly recorded in these areas in summer included Great Shearwater, Manx Shearwater, Sooty Shearwater, Great Skua and Lesser Black-backed Gull.
Figure 4.16 Species diversity in SEA 7 area in summer (April to September)
56N
57N
58N
59N
60N
23W 22W 21W 20W 19W 18W 17W 16W 15W 14W 13W 12W 11W 10W 9W 8W 7W 6W 5W
15+ species10-14 species5-9 species1-4 speciesNo birds
Blank = not surveyed
Species diversity

Offshore seabirds in SEA 7
Cork Ecology 52 October 2006
Although survey coverage was not as extensive in the winter period, lowest species diversity was again recorded in offshore waters. Between 5 and 14 species were recorded in the north east Rockall Trough and along the shelf break between October and December (Figure 4.17). Less than 5 species were recorded in most other parts of the Rockall Trough and Rockall Bank, with Northern Fulmar, Northern Gannet and Black-legged Kittiwake being the most common species.
Figure 4.17 Species diversity in SEA 7 area in winter (October to March)
56N
57N
58N
59N
60N
23W 22W 21W 20W 19W 18W 17W 16W 15W 14W 13W 12W 11W 10W 9W 8W 7W 6W 5W
15+ species10-14 species5-9 species1-4 speciesNo birds
Blank = not surveyed
Species diversity
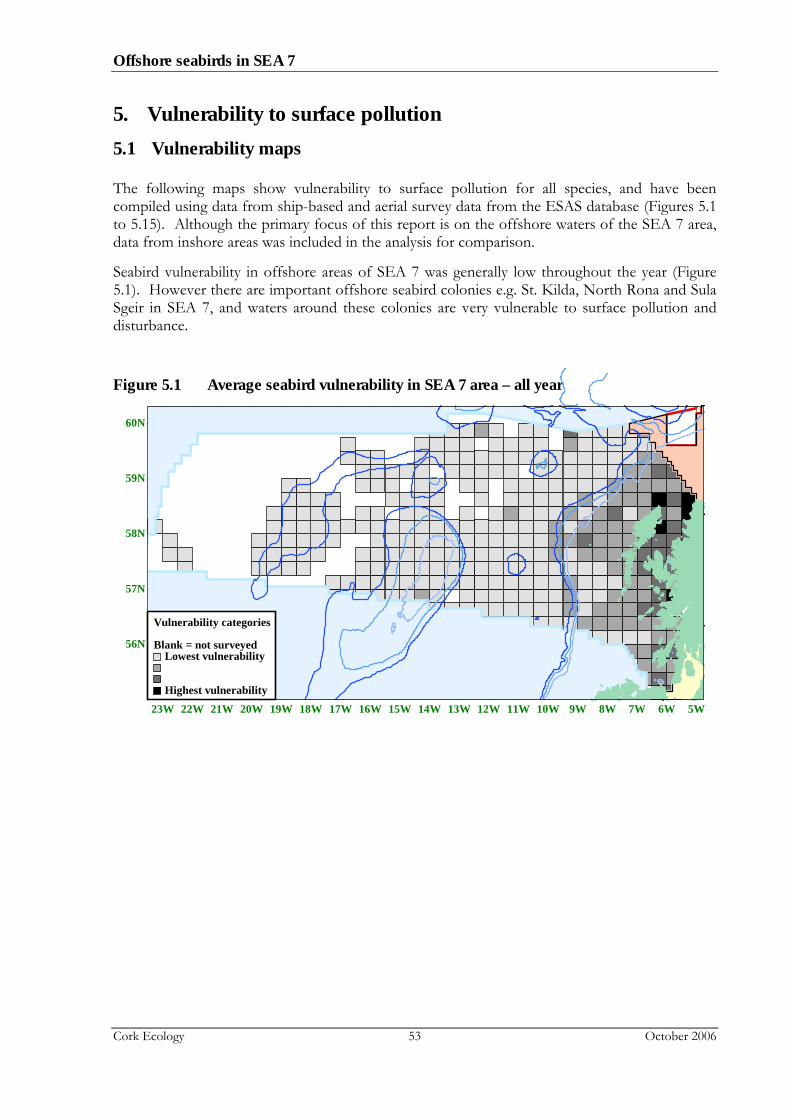
Offshore seabirds in SEA 7
Cork Ecology 53 October 2006
5. Vulnerability to surface pollution 5.1 Vulnerability maps
The following maps show vulnerability to surface pollution for all species, and have been compiled using data from ship-based and aerial survey data from the ESAS database (Figures 5.1 to 5.15). Although the primary focus of this report is on the offshore waters of the SEA 7 area, data from inshore areas was included in the analysis for comparison.
Seabird vulnerability in offshore areas of SEA 7 was generally low throughout the year (Figure 5.1). However there are important offshore seabird colonies e.g. St. Kilda, North Rona and Sula Sgeir in SEA 7, and waters around these colonies are very vulnerable to surface pollution and disturbance.
Figure 5.1 Average seabird vulnerability in SEA 7 area – all year
56N
57N
58N
59N
60N
23W 22W 21W 20W 19W 18W 17W 16W 15W 14W 13W 12W 11W 10W 9W 8W 7W 6W 5W
Highest vulnerability
Lowest vulnerabilityBlank = not surveyed
Vulnerability categories
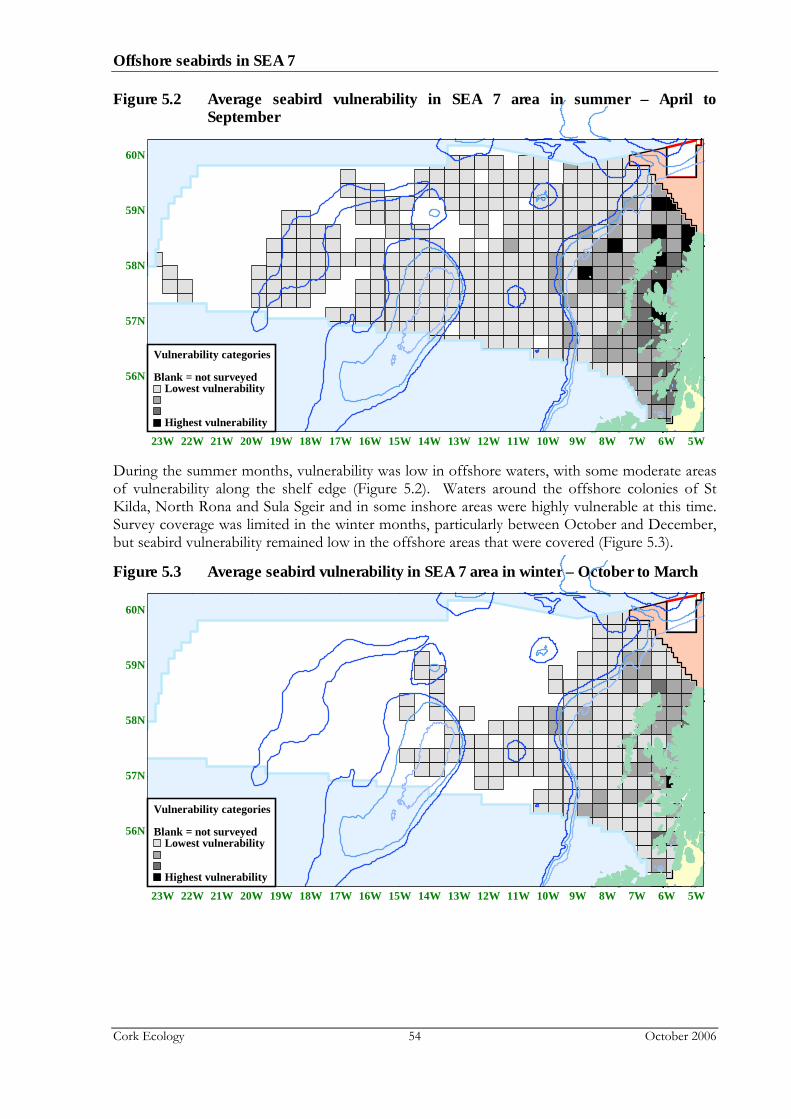
Offshore seabirds in SEA 7
Cork Ecology 54 October 2006
Figure 5.2 Average seabird vulnerability in SEA 7 area in summer – April to September
56N
57N
58N
59N
60N
23W 22W 21W 20W 19W 18W 17W 16W 15W 14W 13W 12W 11W 10W 9W 8W 7W 6W 5W
Highest vulnerability
Lowest vulnerabilityBlank = not surveyed
Vulnerability categories
During the summer months, vulnerability was low in offshore waters, with some moderate areas of vulnerability along the shelf edge (Figure 5.2). Waters around the offshore colonies of St Kilda, North Rona and Sula Sgeir and in some inshore areas were highly vulnerable at this time. Survey coverage was limited in the winter months, particularly between October and December, but seabird vulnerability remained low in the offshore areas that were covered (Figure 5.3).
Figure 5.3 Average seabird vulnerability in SEA 7 area in winter – October to March
56N
57N
58N
59N
60N
23W 22W 21W 20W 19W 18W 17W 16W 15W 14W 13W 12W 11W 10W 9W 8W 7W 6W 5W
Highest vulnerability
Lowest vulnerabilityBlank = not surveyed
Vulnerability categories

Offshore seabirds in SEA 7
Cork Ecology 55 October 2006
Seabird vulnerability to surface pollutants in the SEA 7 area by month are shown in Figures 5.4 to 5.15. Most offshore waters showed low monthly vulnerability, with moderate areas along the shelf break in April and around the offshore colonies of St Kilda, North Rona and Sula Sgeir during the summer months.
Figure 5.4 Seabird vulnerability in SEA 7 area - January
56N
57N
58N
59N
60N
23W 22W 21W 20W 19W 18W 17W 16W 15W 14W 13W 12W 11W 10W 9W 8W 7W 6W 5W
Highest vulnerability
Lowest vulnerabilityBlank = not surveyed
Vulnerability categories
Figure 5.5 Seabird vulnerability in SEA 7 area - February
56N
57N
58N
59N
60N
23W 22W 21W 20W 19W 18W 17W 16W 15W 14W 13W 12W 11W 10W 9W 8W 7W 6W 5W
Highest vulnerability
Lowest vulnerabilityBlank = not surveyed
Vulnerability categories

Offshore seabirds in SEA 7
Cork Ecology 56 October 2006
Figure 5.6 Seabird vulnerability in SEA 7 area - March
56N
57N
58N
59N
60N
23W 22W 21W 20W 19W 18W 17W 16W 15W 14W 13W 12W 11W 10W 9W 8W 7W 6W 5W
Highest vulnerability
Lowest vulnerabilityBlank = not surveyed
Vulnerability categories
Figure 5.7 Seabird vulnerability in SEA 7 area - April
56N
57N
58N
59N
60N
23W 22W 21W 20W 19W 18W 17W 16W 15W 14W 13W 12W 11W 10W 9W 8W 7W 6W 5W
Highest vulnerability
Lowest vulnerabilityBlank = not surveyed
Vulnerability categories

Offshore seabirds in SEA 7
Cork Ecology 57 October 2006
Figure 5.8 Seabird vulnerability in SEA 7 area - May
56N
57N
58N
59N
60N
23W 22W 21W 20W 19W 18W 17W 16W 15W 14W 13W 12W 11W 10W 9W 8W 7W 6W 5W
Highest vulnerability
Lowest vulnerabilityBlank = not surveyed
Vulnerability categories
Figure 5.9 Seabird vulnerability in SEA 7 area - June
56N
57N
58N
59N
60N
23W 22W 21W 20W 19W 18W 17W 16W 15W 14W 13W 12W 11W 10W 9W 8W 7W 6W 5W
Highest vulnerability
Lowest vulnerabilityBlank = not surveyed
Vulnerability categories

Offshore seabirds in SEA 7
Cork Ecology 58 October 2006
Figure 5.10 Seabird vulnerability in SEA 7 area - July
56N
57N
58N
59N
60N
23W 22W 21W 20W 19W 18W 17W 16W 15W 14W 13W 12W 11W 10W 9W 8W 7W 6W 5W
Highest vulnerability
Lowest vulnerabilityBlank = not surveyed
Vulnerability categories
Figure 5.11 Seabird vulnerability in SEA 7 area - August
56N
57N
58N
59N
60N
23W 22W 21W 20W 19W 18W 17W 16W 15W 14W 13W 12W 11W 10W 9W 8W 7W 6W 5W
Highest vulnerability
Lowest vulnerabilityBlank = not surveyed
Vulnerability categories
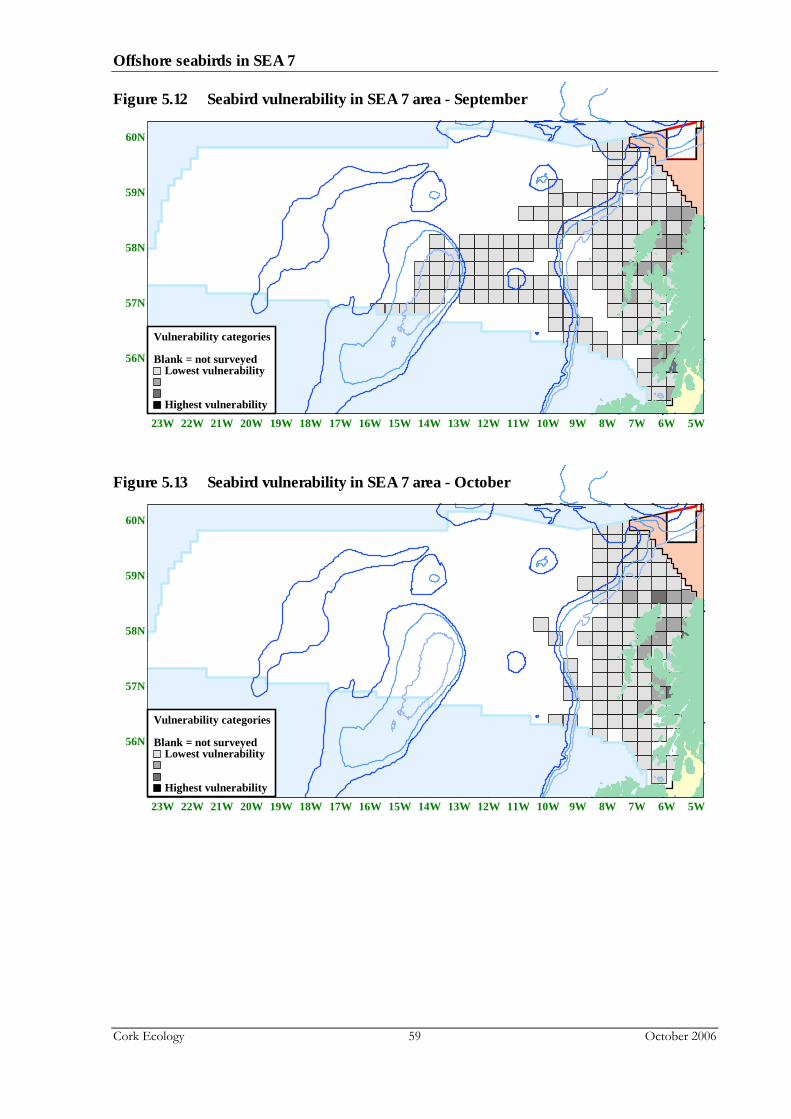
Offshore seabirds in SEA 7
Cork Ecology 59 October 2006
Figure 5.12 Seabird vulnerability in SEA 7 area - September
56N
57N
58N
59N
60N
23W 22W 21W 20W 19W 18W 17W 16W 15W 14W 13W 12W 11W 10W 9W 8W 7W 6W 5W
Highest vulnerability
Lowest vulnerabilityBlank = not surveyed
Vulnerability categories
Figure 5.13 Seabird vulnerability in SEA 7 area - October
56N
57N
58N
59N
60N
23W 22W 21W 20W 19W 18W 17W 16W 15W 14W 13W 12W 11W 10W 9W 8W 7W 6W 5W
Highest vulnerability
Lowest vulnerabilityBlank = not surveyed
Vulnerability categories

Offshore seabirds in SEA 7
Cork Ecology 60 October 2006
Figure 5.14 Seabird vulnerability in SEA 7 area - November
56N
57N
58N
59N
60N
23W 22W 21W 20W 19W 18W 17W 16W 15W 14W 13W 12W 11W 10W 9W 8W 7W 6W 5W
Highest vulnerability
Lowest vulnerabilityBlank = not surveyed
Vulnerability categories
Figure 5.15 Seabird vulnerability in SEA 7 area - December
56N
57N
58N
59N
60N
23W 22W 21W 20W 19W 18W 17W 16W 15W 14W 13W 12W 11W 10W 9W 8W 7W 6W 5W
Highest vulnerability
Lowest vulnerabilityBlank = not surveyed
Vulnerability categories

Offshore seabirds in SEA 7
Cork Ecology 61 October 2006
5.2 Offshore seabird colonies in the SEA 7 area
St Kilda
St Kilda is a group of remote Scottish islands lying in the North Atlantic about 70 km west of North Uist in the Outer Hebrides. The St Kilda group consists of the largest island of Hirta, nearby Dun and Soay, and Boreray with its flanking pinnacles of Stac Lee and Stac an Armin together with some smaller rocky islets. The islands are steep, with precipitous cliffs reaching 430 m on Hirta and 380 m on Soay and Boreray.
The total seabird breeding population on St Kilda is one of the largest concentrations in the North Atlantic and the largest in the UK, with 16 species of breeding seabirds (Table 5.1). St Kilda is designated as an SPA because of the nationally and internationally important numbers of Leach’s Storm-petrel, European Storm-petrel, Northern Gannet, Great Skua and Atlantic Puffin that breed there. St Kilda also qualifies as an SPA as it is an internationally important assemblage of breeding seabirds (JNCC 2001).
In addition, St Kilsa was designated as a marine Special Area of Conservation (SAC) in March 2005, for the reefs and submerged or partially submerged sea caves habitats, which are listed on Annex I of the EU Habitats Directive. The vegetated sea cliffs are a qualifying terrestrial interest of the SAC. The islands are also designated as a Biosphere Reserve, a National Nature Reserve, a SSSI, and a World Heritage Site (SNH 2006).
Table 5.1 Numbers of breeding seabirds on St Kilda as a percentage of the Britain & Ireland population
Species St Kilda population Percentage of Britain & Ireland total population
Northern Fulmar 68,448 AOS 1 12.7 % Manx Shearwater 4,803+ AOS 1 1.4 %
European Storm-petrel 1,121+ AOS 1 1.4 % Leach’s Storm-petrel 45,433 AOS 1 94.0 %
Northern Gannet 59,622 AOS 2 22.9 % European Shag 19 AON 3 < 0.1 %
Arctic Skua 1 AOT 3 < 0.1 % Great Skua 240 AOT 1 2.5 %
Common Gull 1 AON 3 < 0.1 % Lesser black-backed Gull 16 AON 3 < 0.1 %
Herring Gull 29 AOT 3 0.1 % Great black-backed Gull 25 AOT 3 0.1 % Black-legged Kittiwake 3,886 AON 3 0.9 %
Common Guillemot 23,393 Individuals 3 1.5 % Razorbill 2,521 Individuals 3 1.2 %
Atlantic Puffin 142,264 AOB 1 23.7 % 1 Mitchell et al 2004 2 Wanless et al 2005 3 JNCC, Seabird 2000 database

Offshore seabirds in SEA 7
Cork Ecology 62 October 2006
Flannan Isles
The Flannan Isles are a group of six rocky islands, with outlying skerries, which lie about 30 km west of Lewis, off the north-west coast of Scotland. The vegetation of the islands is predominantly maritime grassland. The Flannan Isles have been designated as an SPA because of the internationally important assemblage of breeding seabirds there, including Northern Fulmar, Leach's Storm-petrel, Black-legged Kittiwake, Common Guillemot, Razorbill and Atlantic Puffin (Table 5.2). Breeding numbers of Leach’s Storm-petrel are internationally important (JNCC 2001).
The islands are also designated as an Important Bird Area (IBA), and a Site of Special Scientific Iinterest (SSSI) (Birdlife International 2005).
Table 5.2 Numbers of breeding seabirds on the Flannan Isles as a percentage of the Britain & Ireland population
Species Flannan Isles population Percentage of Britain & Ireland total population
Northern Fulmar 7,735 AOS 3 1.4 % European Storm-petrel 7 AOS 3 < 0.1 % Leach’s Storm-petrel 1,425 AOS 1 2.9 %
Northern Gannet 2,760 AOS 2 1.1 % European Shag 77 AON 3 0.2 %
Great Skua 1 AON 3 < 0.1 % Lesser black-backed Gull 9 AOT 3 < 0.1 %
Herring Gull 20 AOT 3 < 0.1 %
Great black-backed Gull 55 AOT 3 0.3 %
Black-legged Kittiwake 1,392 3 0.3 % Common Guillemot 14,638 Individuals 1 0.9 %
Razorbill 1,569 Individuals 1 0.7 % Atlantic Puffin 15,761 AOB 1 2.6 %
1 Mitchell et al 2004 2 Wanless et al 2005 3 JNCC, Seabird 2000 database
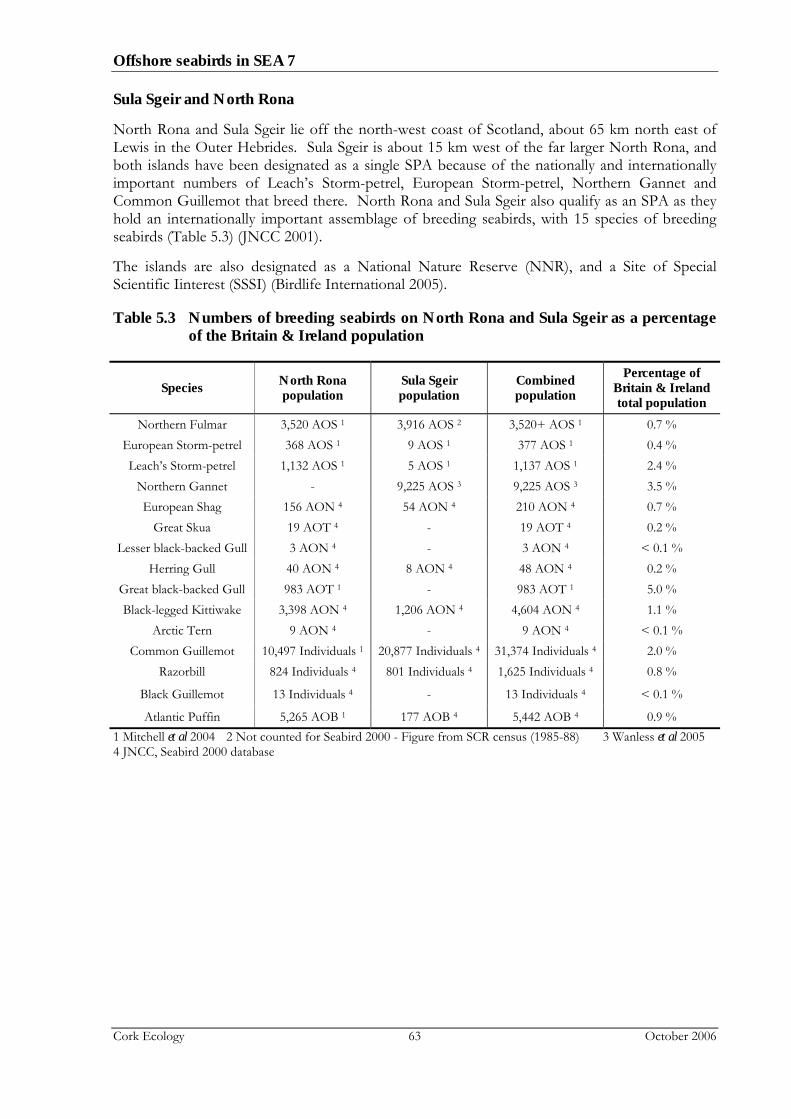
Offshore seabirds in SEA 7
Cork Ecology 63 October 2006
Sula Sgeir and North Rona
North Rona and Sula Sgeir lie off the north-west coast of Scotland, about 65 km north east of Lewis in the Outer Hebrides. Sula Sgeir is about 15 km west of the far larger North Rona, and both islands have been designated as a single SPA because of the nationally and internationally important numbers of Leach’s Storm-petrel, European Storm-petrel, Northern Gannet and Common Guillemot that breed there. North Rona and Sula Sgeir also qualify as an SPA as they hold an internationally important assemblage of breeding seabirds, with 15 species of breeding seabirds (Table 5.3) (JNCC 2001).
The islands are also designated as a National Nature Reserve (NNR), and a Site of Special Scientific Iinterest (SSSI) (Birdlife International 2005).
Table 5.3 Numbers of breeding seabirds on North Rona and Sula Sgeir as a percentage of the Britain & Ireland population
Species North Rona population
Sula Sgeir population
Combined population
Percentage of Britain & Ireland total population
Northern Fulmar 3,520 AOS 1 3,916 AOS 2 3,520+ AOS 1 0.7 % European Storm-petrel 368 AOS 1 9 AOS 1 377 AOS 1 0.4 % Leach’s Storm-petrel 1,132 AOS 1 5 AOS 1 1,137 AOS 1 2.4 %
Northern Gannet - 9,225 AOS 3 9,225 AOS 3 3.5 % European Shag 156 AON 4 54 AON 4 210 AON 4 0.7 %
Great Skua 19 AOT 4 - 19 AOT 4 0.2 % Lesser black-backed Gull 3 AON 4 - 3 AON 4 < 0.1 %
Herring Gull 40 AON 4 8 AON 4 48 AON 4 0.2 % Great black-backed Gull 983 AOT 1 - 983 AOT 1 5.0 % Black-legged Kittiwake 3,398 AON 4 1,206 AON 4 4,604 AON 4 1.1 %
Arctic Tern 9 AON 4 - 9 AON 4 < 0.1 % Common Guillemot 10,497 Individuals 1 20,877 Individuals 4 31,374 Individuals 4 2.0 %
Razorbill 824 Individuals 4 801 Individuals 4 1,625 Individuals 4 0.8 %
Black Guillemot 13 Individuals 4 - 13 Individuals 4 < 0.1 %
Atlantic Puffin 5,265 AOB 1 177 AOB 4 5,442 AOB 4 0.9 % 1 Mitchell et al 2004 2 Not counted for Seabird 2000 - Figure from SCR census (1985-88) 3 Wanless et al 2005 4 JNCC, Seabird 2000 database

Offshore seabirds in SEA 7
Cork Ecology 64 October 2006
6. Potential for offshore SPAs in SEA 7 The EU Birds Directive (79/409/EEC) provides for protection, management and control of naturally occurring wild birds within the European Union through a range of mechanisms. One of the key provisions is the establishment of an internationally co-ordinated network of protected areas. Member States are required to identify and classify the most suitable areas in size and number for rare and vulnerable species listed on Annex I of the Directive. In addition, provision must also be made for regularly occurring migratory species, regarding their breeding, moulting and wintering areas as well as staging posts along their migration routes. Designated sites are known as special protection areas (SPAs).
Table 6.1 shows the status of offshore species considered in this report, in relation to the EU Birds Directive.
Table 6.1 EU Birds Directive status of offshore species in the SEA 7 area considered in this report
Species Birds Directive status
Northern Fulmar Migrant
Great Shearwater Migrant
Manx Shearwater Migrant
Sooty Shearwater Migrant
European Storm-petrel Annex I
Leach’s Storm-petrel Annex I
Northern Gannet Migrant
Pomarine Skua Migrant
Arctic Skua Migrant
Long-tailed Skua Migrant
Great Skua Migrant
Lesser black-backed Gull Migrant
Great black-backed Gull Migrant
Black-legged Kittiwake Migrant
Arctic Tern Annex I
Little Auk Migrant
Atlantic Puffin Migrant
Note: Migrant = regularly occurring migratory species (Article 4.2, Birds Directive)
Annex I = listed on Annex I of Birds Directive
Three Annex I species, European Storm-petrel, Leach’s Storm-petrel and Arctic Tern are found in the offshore waters of SEA7. Almost all the Britain and Ireland breeding population of Leach’s Storm-petrels and up to half of the Britain and Ireland breeding population of European Storm-petrels breed in SEA 7 waters. Important feeding areas for these two species need to be considered for SPA status.
Offshore seabirds in SEA 7
Cork Ecology 65 October 2006
Studies examining seaward extensions of existing breeding seabird colony SPAs recommended that the marine SPA boundary around colonies be increased by two km for Northern Gannet, and 1 km for Common Guillemot, Razorbill and Atlantic Puffin. This extension should apply to all colonies where 1 or more of these species is included in the breeding seabird assemblage (McSorley et al 2003). This would include offshore seabird colonies in the SEA 7 area, such as St Kilda, Flannan Isles, North Rona and Sula Sgeir (see Section 5.2). Such seaward extensions would not include feeding areas for European Storm-petrel and Leach’s Storm-petrel, which feed further offshore. Both these species require protection based on their breeding numbers in the SEA 7 area, and their Annex I status.
Some preliminary analyses to assess the suitability of using ESAS data to determine marine feeding areas by spatial analysis have been conducted (Johnston et al 2002). The analyses used different criteria to define inshore and offshore species than were used for this review, resulting in a slightly different suite of species being considered. This review considered species regularly occurring in waters greater than 200 m deep, whereas Johnston et al (2002) considered offshore species those where “50 % of ESAS database records occurred at greater than 15 km from the coast”.
Species considered to be offshore by Johnston et al (2002) and not covered here were Herring Gull, Common Tern, Common Guillemot and Razorbill. These species were covered in the Inshore Review of SEA 6, 7 and 8 (Barton & Pollock 2005, Barton & Pollock 2006).
Three offshore species considered in this report (Great Shearwater, Pomarine Skua and Long-tailed Skua) were not considered for spatial analysis by Johnston et al (2002) as there were less than 400 records of each in the ESAS database.
Species with more than 400 records in the ESAS database were considered suitable for spatial analysis, although no further work has been conducted yet. It is anticipated that the marine SPA work addressing offshore SPAs for feeding and other aggregations of birds will commence very soon, and is scheduled to take two years (Jim Reid, pers comm.).
The major difficulty with selecting potential offshore Special Protection Areas in the SEA 7 area is that offshore waters generally support low densities of seabirds, and that the existing ESAS data does not show any obvious hotspots. Seabirds are very mobile, moving from one food source to another, often a considerable distance away, and therefore are not tied to one area.
Combining all ESAS seabird density data for all months showed that the shelf edge and the Rockall Bank were the areas where highest seabird densities were likely to be encountered, with generally low densities elsewhere in offshore areas. Other studies also highlighted the importance of the shelf edge for seabird species (e.g. Pollock et al 1997, Pollock et al 2000). These areas could be used as the start point of the upcoming JNCC marine SPA work.
Terrestrial SPA selection primarily focussed on designating multi-species SPAs and it may be that offshore areas that hold higher densities of seabirds such as the Rockall Bank could be suitable areas to consider for designation. It must also be kept in mind that survey effort has been limited in offshore waters of the SEA 7 area, and several years of data would be needed to confirm the importance of particular areas for feeding or moulting seabirds.
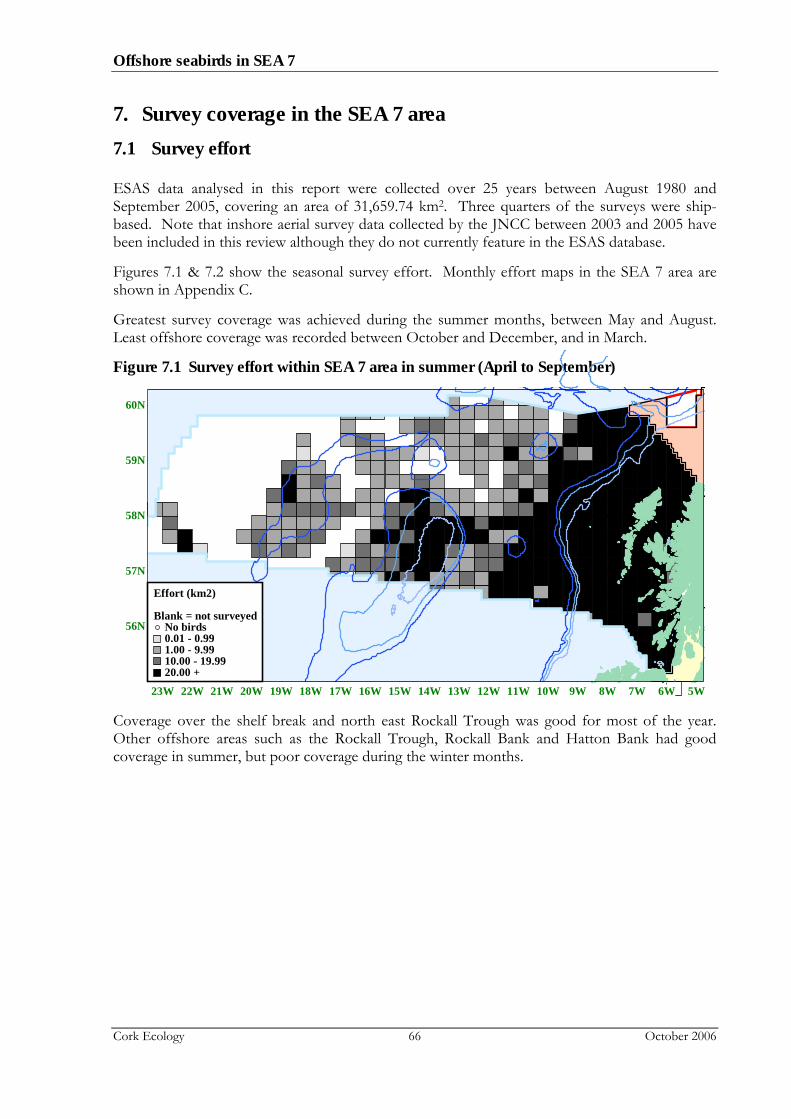
Offshore seabirds in SEA 7
Cork Ecology 66 October 2006
7. Survey coverage in the SEA 7 area 7.1 Survey effort
ESAS data analysed in this report were collected over 25 years between August 1980 and September 2005, covering an area of 31,659.74 km2. Three quarters of the surveys were ship-based. Note that inshore aerial survey data collected by the JNCC between 2003 and 2005 have been included in this review although they do not currently feature in the ESAS database.
Figures 7.1 & 7.2 show the seasonal survey effort. Monthly effort maps in the SEA 7 area are shown in Appendix C.
Greatest survey coverage was achieved during the summer months, between May and August. Least offshore coverage was recorded between October and December, and in March.
Figure 7.1 Survey effort within SEA 7 area in summer (April to September)
56N
57N
58N
59N
60N
23W 22W 21W 20W 19W 18W 17W 16W 15W 14W 13W 12W 11W 10W 9W 8W 7W 6W 5W
20.00 +10.00 - 19.991.00 - 9.990.01 - 0.99No birds
Blank = not surveyed
Effort (km2)
Coverage over the shelf break and north east Rockall Trough was good for most of the year. Other offshore areas such as the Rockall Trough, Rockall Bank and Hatton Bank had good coverage in summer, but poor coverage during the winter months.

Offshore seabirds in SEA 7
Cork Ecology 67 October 2006
Figure 7.2 Survey effort within SEA 7 area in winter (October to March)
56N
57N
58N
59N
60N
23W 22W 21W 20W 19W 18W 17W 16W 15W 14W 13W 12W 11W 10W 9W 8W 7W 6W 5W
20.00 +10.00 - 19.991.00 - 9.990.01 - 0.99No birds
Blank = not surveyed
Effort (km2)
7.2 Gaps in coverage
A recent analysis of gaps in survey coverage for all SEA areas found that in SEA 7, 7 % of the total area was surveyed which was 25 % of the overall suggested target amount (Pollock & Barton 2006). This was the lowest overall coverage in all SEA areas. During the summer months, just under 33 % of the target coverage was achieved, while in winter just under 20 % of the recommended survey coverage was achieved (Pollock & Barton 2006).
Offshore seabirds in SEA 7
Cork Ecology 68 October 2006
8. Conclusions Overall, there are large gaps in coverage in the offshore waters of SEA 7, particularly during the winter months. However, based on survey work conducted to date, seabird density and species diversity is generally low beyond the shelf edge. ESAS surveys found that the most commonly recorded species in offshore waters was Northern Fulmar, which is very abundant and not threatened. Northern Gannet and Black-legged Kittiwake were also commonly recorded in the offshore waters of SEA 7. The SEA 7 area was also important for European Storm-petrel and Leach’s Storm-petrel.
Species vulnerability in offshore areas was generally low. However there are important offshore seabird colonies e.g. St. Kilda, Flannan Isles, North Rona and Sula Sgeir in SEA 7, and waters around these colonies are very important feeding and resting areas for breeding seabirds. These waters are therefore very vulnerable to surface pollution during the breeding season.
The major difficulty with selecting potential offshore Special Protection Areas in the SEA 7 area is that offshore waters generally support low densities of seabirds, and that the existing ESAS data does not show any obvious hotspots.
Combining all ESAS seabird density data for all months showed that the shelf edge and the Rockall Bank were the areas where highest seabird densities were likely to be encountered, with generally low densities elsewhere in offshore areas. These areas could be used as the start point of the upcoming JNCC marine SPA work addressing offshore SPAs for feeding and other aggregations of birds. Feeding areas for European Storm-petrel and Leach’s Storm-petrel should be identified as part of this study.
Terrestrial SPA selection primarily focussed on designating multi-species SPAs and it may be that offshore areas that hold higher densities of seabirds such as the Rockall Bank could be suitable areas to consider for designation. Several years of data would be needed to confirm the importance of particular areas for feeding or moulting seabirds.
Although the inshore and shelf waters of SEA 7 are of more importance for seabirds and are most vulnerable to surface pollution, seabird surveys in the offshore waters of SEA 7 should be continued to improve existing data and to determine long term trends and short term fluctuations in the offshore distribution of seabirds.

Offshore seabirds in SEA 7
Cork Ecology 69 October 2006
9. Recommendations Based on this review, it is recommended that:
Further studies should be conducted to identify important areas for seabirds in offshore waters in SEA 7, including feeding areas for European Storm-petrel and Leach’s Storm-petrel
Offshore survey coverage in SEA 7 should be increased throughout the year.
10. Acknowledgements Thanks to Andy Webb of the JNCC Seabirds at Sea Team for providing ESAS survey data and to the ESAS partners (UK SAST, NIOZ, Ornis Consult, NINA, Vogelwarte Helgoland, INB (Belgium) & CMRC) for allowing the data to be used. Thanks also to Dr Ian Mitchell and Tim Dunn (JNCC) for supplying Seabird 2000 data for St Kilda.
Thanks to John Hartley of Hartley Anderson for input at the start of this review and to Quentin Huggett and Sally Marine of Geotek for logistical support.

Offshore seabirds in SEA 7
Cork Ecology 70 October 2006
11. References Barton, C. & Pollock, C. 2005. A review of inshore seabird distribution and abundance in SEA areas 6, 7 & 8. A report to the DTI. Available at http://www.offshore-sea.org.uk/site/scripts/consultation_download_info.php?downloadID=154
Barton, C., & Pollock, C. 2006. A technical update of inshore seabird species in SEA areas 6, 7 & 8. A report to the DTI.
BirdLife International. 2005. BirdLife's online World Bird Database: the site for bird conservation. Version 2.0. Cambridge, UK: BirdLife International. Available at http://www.birdlife.org
Dean, B.J., Webb, A., McSorley, C.A. and Reid, J.B. 2003. Aerial surveys of UK inshore areas for wintering seaduck, divers and grebes: 2000/01 and 2001/02. JNCC Report, No.333.
Dean, B.J., Webb, A., McSorley, C.A. and Reid, J.B. 2004a. Surveillance of wintering seaduck, divers and grebes in UK inshore areas: Aerial surveys 2002/03. JNCC Report, No. 345.
Dean, B.J., Webb, A., McSorley, C.A., Schofield, R.A. and Reid, J.B. 2004b. Surveillance of wintering seaduck, divers and grebes in UK inshore areas: Aerial surveys and shore-based counts 2003/04. JNCC Report, No. 357.
Department of Trade and Industry (DTI) Strategic Environmental Assessment website. 2004. http://www.offshore-sea.org.uk/site/
JNCC. 2001. Special Protection Areas. http://www.jncc.gov.uk/page-162
Johnston, C.M., Turnbull, C.G. & Tasker, M.L. 2002. Natura 2000 in UK offshore waters: advice to support the implementation of the EC Habitats and Birds Directives in UK offshore waters. JNCC Report 325. Joint Nature Conservation Committee, Peterborough.
Lack, P. (Ed). 1986. The atlas of wintering birds in Britain and Ireland. T & A.D. Poyser, Calton.
Mackey, M. & Giménez, D.P. 2004. SEA 678 Data Report for Offshore Seabird Populations. A report for the DTI. Available at http://www.offshore-sea.org.uk/site/scripts/consultation_download_info.php?downloadID=92
Mackey, M., Ó Cadhla, O., Kelly, T.C., Aguilar de Soto, N. & Connolly, N. 2004. Cetaceans and Seabirds of Ireland’s Atlantic Margin. Volume I – Seabird distribution, density & abundance. Report on research carried out under the Irish Infrastructure Programme (PIP): Rockall Studies Group (RSG) projects 98/6 and 00/13, Porcupine Studies Group project P00/15 and Offshore Support Group (OSG) project 99/38. 95pp. University College Cork.
McSorley, C.A., Dean, B.J., Webb, A. & Reid, J.B. 2003. Seabird use of waters adjacent to colonies: Implications for seaward extensions to existing breeding seabird colony Special Protection Areas. JNCC Report No. 329. JNCC, Peterborough.
Mitchell, P.I., Newton, S.F., Ratcliffe, N. & Dunn, T.E. 2004. Seabird populations of Britain and Ireland. T & AD Poyser, London.
Morton, A.J. 2001. DMAP for Windows. www.dmap.co.uk
Pennington, M., Osborn, K., Harvey, P., Riddington, R., Okill, D., Ellis, P. & Heubeck, M. 2004. Birds of Shetland. Christopher Helm.

Offshore seabirds in SEA 7
Cork Ecology 71 October 2006
Pollock, C. & Barton, C. 2006. An analysis of ESAS seabird surveys in UK waters to highlight gaps in coverage. A report to the DTI.
Pollock, C.M., Reid, J.B., Webb, A. & Tasker, M.L. 1997. The distribution of seabirds and cetaceans in the waters around Ireland. JNCC Report, No. 267.
Pollock, C.M., Mavor R., Weir, C.R., Reid, A., White, R.W., Tasker, M.L., Webb, A. & Reid, J.B. 2000. The distribution of seabirds and marine mammals in the Atlantic Frontier, north and west of Scotland. Joint Nature Conservation Committee.
Scottish Natural Heritage. 2006. St Kilda Special Area of Conservation Advice under Regulation 33(2) of The Conservation (Natural Habitats, &c.) Regulations 1994 (as amended). http://www.snh.org.uk/pdfs/about/directives/St_Kilda.pdf#search=%22St%20Kilda%20SAC%20site%20description%22
Snow, D.W. & Perrins, C.M. (Eds). 1998. The Birds of the Western Palearctic. Volume 1. Concise Edition. Oxford University Press.
Stone, C.J., Webb, A., Barton, C., Ratcliffe, N., Reed, T.C., Tasker, M.L., Camphuysen, C.J. & Pienkowski, M.W. 1995. An atlas of seabird distribution in north-west European waters. Peterborough, Joint Nature Conservation Committee.
Tasker, M.L., Webb, A., Hall, A.J., Pienkowski, M.W. & Langslow, D.R. 1987. Seabirds in the North Sea. Nature Conservancy Council, Peterborough.
Tasker, M.L., Webb, A., Harrison, N.M. & Pienkowski, M.W. 1990. Vulnerable concentrations of marine birds west of Britain. Nature Conservancy Council, Peterborough.
Wanless S, Murray S & Harris M.P. 2005. The status of Northern Gannet in Britain & Ireland in 2003/04. British Birds 98:280-294
Webb A. & Durinck J. 1992. Counting birds from ships. In: Manual for aeroplane and ship surveys of waterfowl and seabirds, eds. J. Komdeur, J. Bertelsen & G. Cracknell, 24-37. Slimbridge, I.W.R.B. Special Publication No.19.
Webb A., Harrison, N.M., Leaper, G.M., Steele, R.D., Tasker, M.L. & Pienkowski, M.W. 1990. Seabird distribution west of Britain. NCC, Peterborough.
Webb, A., Stronach, A., Tasker, M.L. & Stone, C.J. 1995. Vulnerable concentrations of seabirds south and west of Britain. JNCC, Peterborough.
Wernham, C.V., Toms, M.P., Marchant, J.H., Clark, J.A., Siriwardena, G.M. & Baillie, S.R. (eds). 2002. The Migration Atlas: movements of the birds of Britain and Ireland. T. & A.D. Poyser, London.
Williams, J.M., Tasker, M.L., Carter, I.C. & Webb, A. 1995. A method of assessing seabird vulnerability to surface pollutants. Ibis, 137 (supplement): 147-152.
Wilson, L.J., Dean, B.J., Webb, A., McSorley, C.A. and Reid, J.B. 2006. Wintering seaducks, divers and grebes in UK inshore areas: Aerial surveys and shore-based counts 2004/05. JNCC Report, No. 371.
Offshore seabirds in SEA 7
Cork Ecology 72 October 2006
APPENDIX A Scientific names of species mentioned in the text
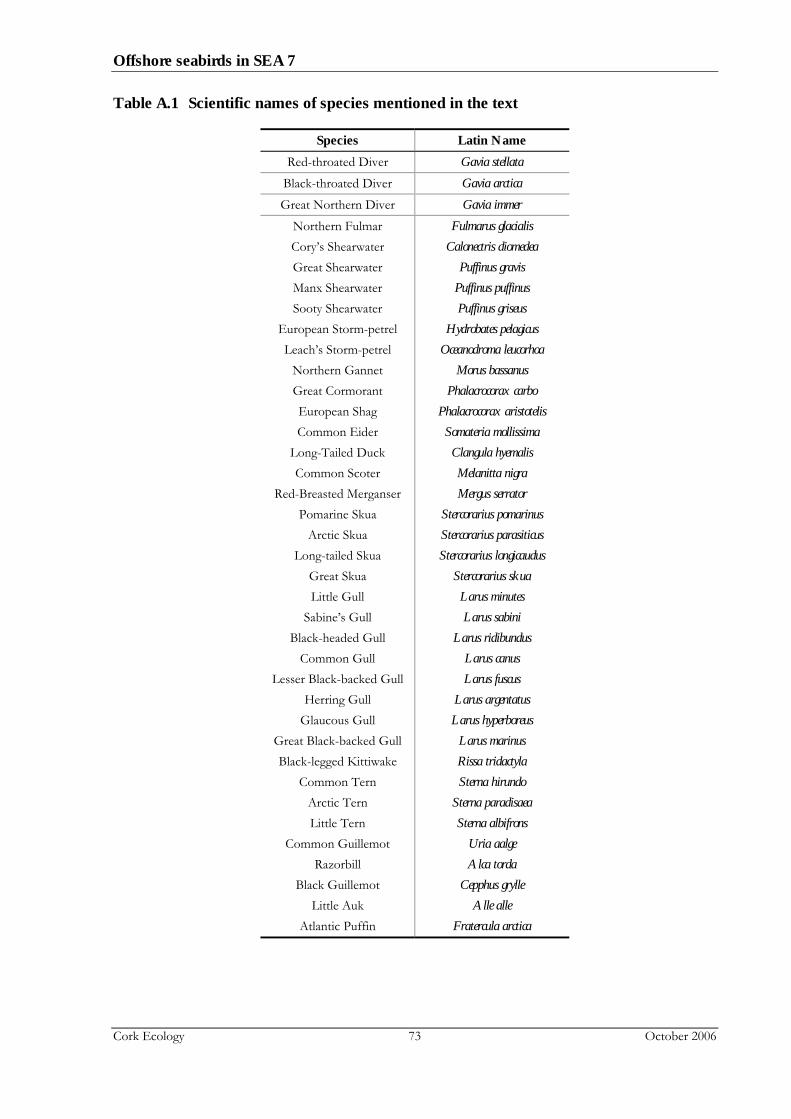
Offshore seabirds in SEA 7
Cork Ecology 73 October 2006
Table A.1 Scientific names of species mentioned in the text
Species Latin Name Red-throated Diver Gavia stellata
Black-throated Diver Gavia arctica Great Northern Diver Gavia immer
Northern Fulmar Fulmarus glacialis Cory’s Shearwater Calonectris diomedea Great Shearwater Puffinus gravis Manx Shearwater Puffinus puffinus Sooty Shearwater Puffinus griseus
European Storm-petrel Hydrobates pelagicus Leach’s Storm-petrel Oceanodroma leucorhoa
Northern Gannet Morus bassanus Great Cormorant Phalacrocorax carbo European Shag Phalacrocorax aristotelis Common Eider Somateria mollissima
Long-Tailed Duck Clangula hyemalis Common Scoter Melanitta nigra
Red-Breasted Merganser Mergus serrator Pomarine Skua Stercorarius pomarinus
Arctic Skua Stercorarius parasiticus Long-tailed Skua Stercorarius longicaudus
Great Skua Stercorarius skua Little Gull Larus minutes
Sabine’s Gull Larus sabini Black-headed Gull Larus ridibundus
Common Gull Larus canus Lesser Black-backed Gull Larus fuscus
Herring Gull Larus argentatus Glaucous Gull Larus hyperboreus
Great Black-backed Gull Larus marinus Black-legged Kittiwake Rissa tridactyla
Common Tern Sterna hirundo Arctic Tern Sterna paradisaea Little Tern Sterna albifrons
Common Guillemot Uria aalge Razorbill Alca torda
Black Guillemot Cepphus grylle Little Auk Alle alle
Atlantic Puffin Fratercula arctica

Offshore seabirds in SEA 7
Cork Ecology 74 October 2006
APPENDIX B Oil Vulnerability Index (OVI) scores
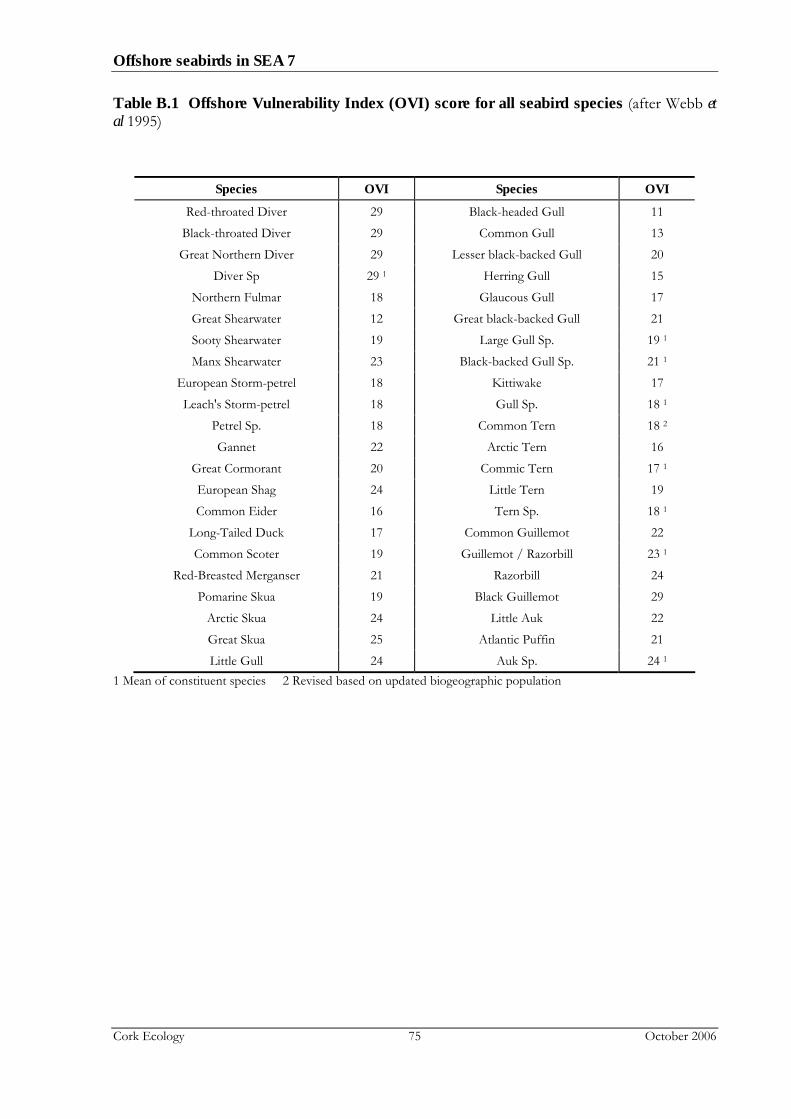
Offshore seabirds in SEA 7
Cork Ecology 75 October 2006
Table B.1 Offshore Vulnerability Index (OVI) score for all seabird species (after Webb et al 1995)
Species OVI Species OVI
Red-throated Diver 29 Black-headed Gull 11 Black-throated Diver 29 Common Gull 13 Great Northern Diver 29 Lesser black-backed Gull 20
Diver Sp 29 1 Herring Gull 15 Northern Fulmar 18 Glaucous Gull 17 Great Shearwater 12 Great black-backed Gull 21 Sooty Shearwater 19 Large Gull Sp. 19 1 Manx Shearwater 23 Black-backed Gull Sp. 21 1
European Storm-petrel 18 Kittiwake 17 Leach's Storm-petrel 18 Gull Sp. 18 1
Petrel Sp. 18 Common Tern 18 2 Gannet 22 Arctic Tern 16
Great Cormorant 20 Commic Tern 17 1 European Shag 24 Little Tern 19 Common Eider 16 Tern Sp. 18 1
Long-Tailed Duck 17 Common Guillemot 22 Common Scoter 19 Guillemot / Razorbill 23 1
Red-Breasted Merganser 21 Razorbill 24 Pomarine Skua 19 Black Guillemot 29
Arctic Skua 24 Little Auk 22 Great Skua 25 Atlantic Puffin 21 Little Gull 24 Auk Sp. 24 1
1 Mean of constituent species 2 Revised based on updated biogeographic population
Offshore seabirds in SEA 7
Cork Ecology 76 October 2006
APPENDIX C Monthly effort maps

Offshore seabirds in SEA 7
Cork Ecology 77 October 2006
Figure C.1 Survey effort within SEA 7 area in January
56N
57N
58N
59N
60N
23W 22W 21W 20W 19W 18W 17W 16W 15W 14W 13W 12W 11W 10W 9W 8W 7W 6W 5W
20.00 +10.00 - 19.991.00 - 9.990.01 - 0.99No birds
Blank = not surveyed
Effort (km2)
Figure C.2 Survey effort within SEA 7 area in February
56N
57N
58N
59N
60N
23W 22W 21W 20W 19W 18W 17W 16W 15W 14W 13W 12W 11W 10W 9W 8W 7W 6W 5W
20.00 +10.00 - 19.991.00 - 9.990.01 - 0.99No birds
Blank = not surveyed
Effort (km2)
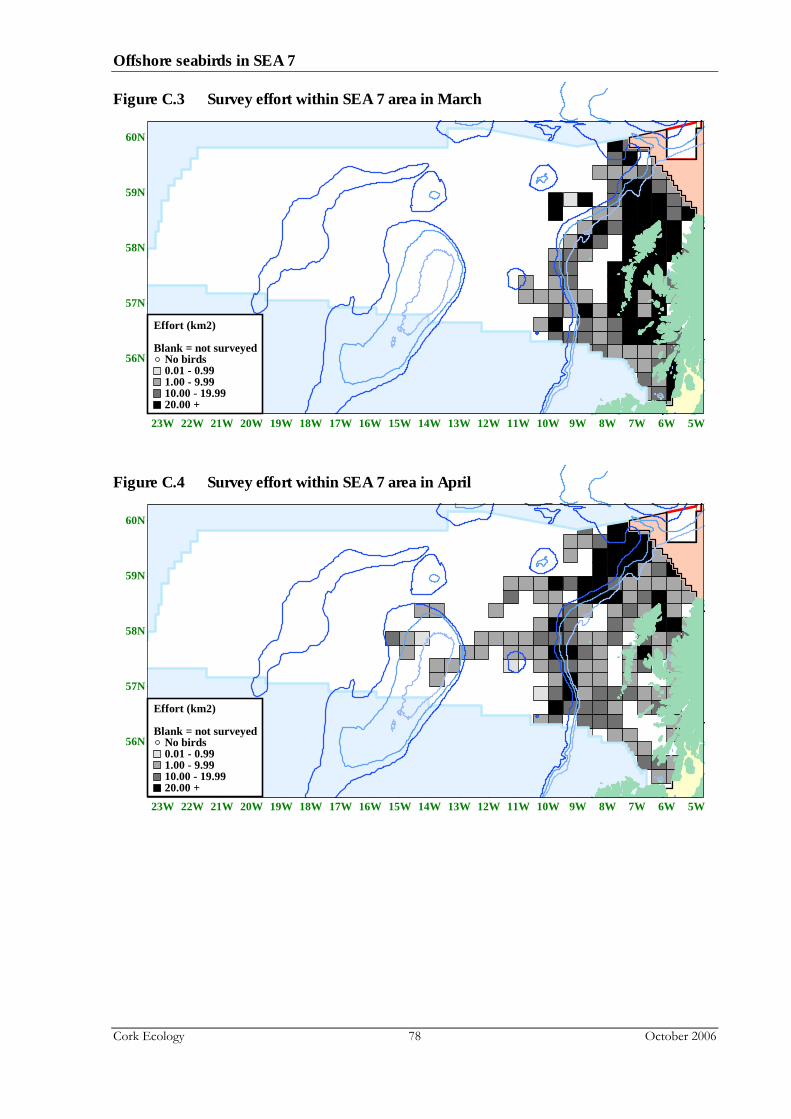
Offshore seabirds in SEA 7
Cork Ecology 78 October 2006
Figure C.3 Survey effort within SEA 7 area in March
56N
57N
58N
59N
60N
23W 22W 21W 20W 19W 18W 17W 16W 15W 14W 13W 12W 11W 10W 9W 8W 7W 6W 5W
20.00 +10.00 - 19.991.00 - 9.990.01 - 0.99No birds
Blank = not surveyed
Effort (km2)
Figure C.4 Survey effort within SEA 7 area in April
56N
57N
58N
59N
60N
23W 22W 21W 20W 19W 18W 17W 16W 15W 14W 13W 12W 11W 10W 9W 8W 7W 6W 5W
20.00 +10.00 - 19.991.00 - 9.990.01 - 0.99No birds
Blank = not surveyed
Effort (km2)
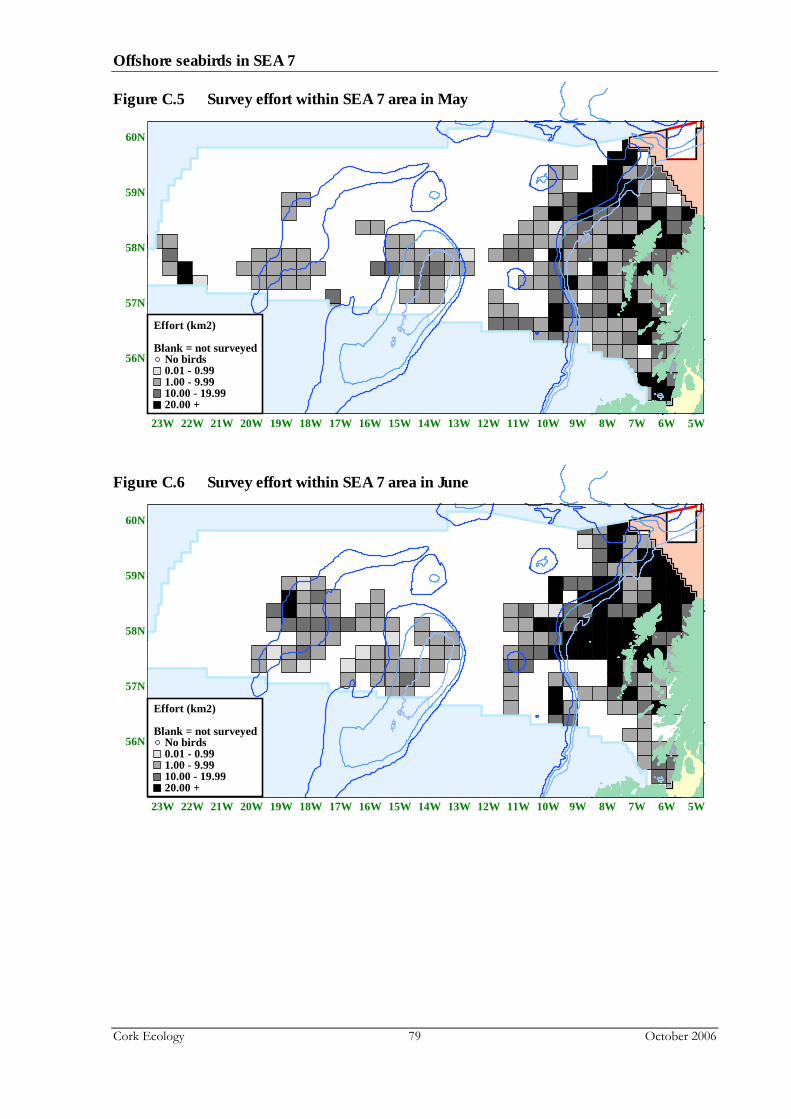
Offshore seabirds in SEA 7
Cork Ecology 79 October 2006
Figure C.5 Survey effort within SEA 7 area in May
56N
57N
58N
59N
60N
23W 22W 21W 20W 19W 18W 17W 16W 15W 14W 13W 12W 11W 10W 9W 8W 7W 6W 5W
20.00 +10.00 - 19.991.00 - 9.990.01 - 0.99No birds
Blank = not surveyed
Effort (km2)
Figure C.6 Survey effort within SEA 7 area in June
56N
57N
58N
59N
60N
23W 22W 21W 20W 19W 18W 17W 16W 15W 14W 13W 12W 11W 10W 9W 8W 7W 6W 5W
20.00 +10.00 - 19.991.00 - 9.990.01 - 0.99No birds
Blank = not surveyed
Effort (km2)
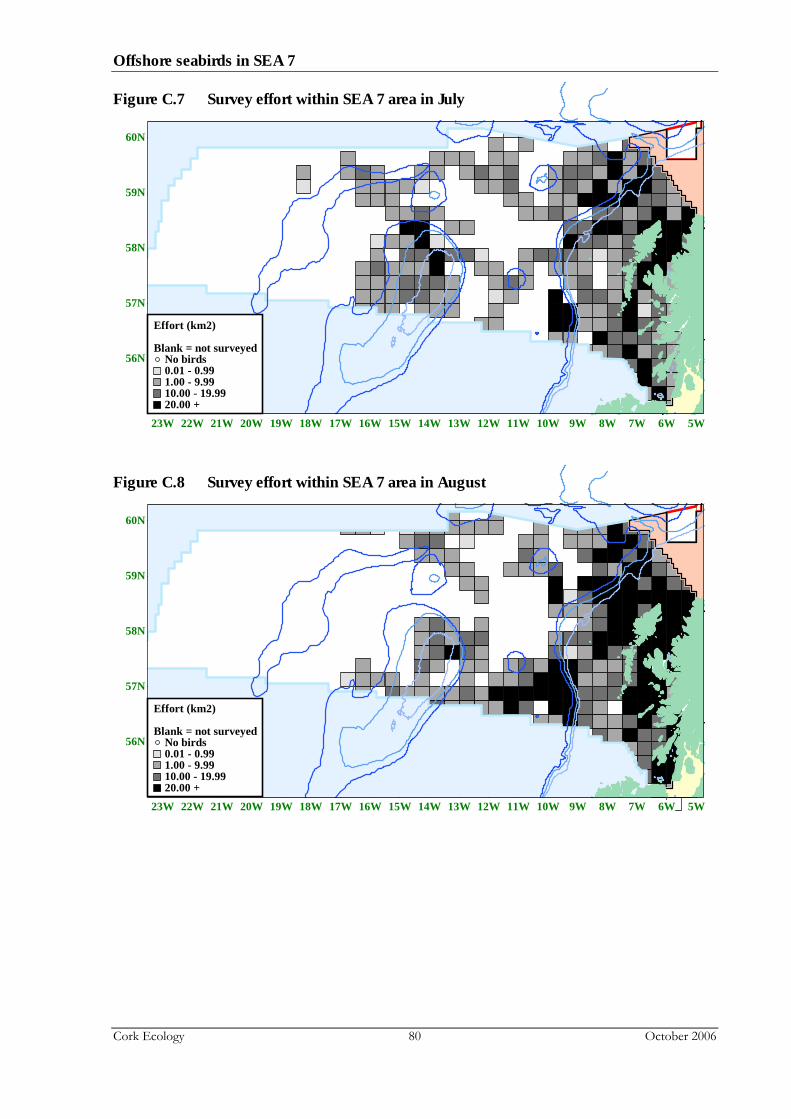
Offshore seabirds in SEA 7
Cork Ecology 80 October 2006
Figure C.7 Survey effort within SEA 7 area in July
56N
57N
58N
59N
60N
23W 22W 21W 20W 19W 18W 17W 16W 15W 14W 13W 12W 11W 10W 9W 8W 7W 6W 5W
20.00 +10.00 - 19.991.00 - 9.990.01 - 0.99No birds
Blank = not surveyed
Effort (km2)
Figure C.8 Survey effort within SEA 7 area in August
56N
57N
58N
59N
60N
23W 22W 21W 20W 19W 18W 17W 16W 15W 14W 13W 12W 11W 10W 9W 8W 7W 6W 5W
20.00 +10.00 - 19.991.00 - 9.990.01 - 0.99No birds
Blank = not surveyed
Effort (km2)

Offshore seabirds in SEA 7
Cork Ecology 81 October 2006
Figure C.9 Survey effort within SEA 7 area in September
56N
57N
58N
59N
60N
23W 22W 21W 20W 19W 18W 17W 16W 15W 14W 13W 12W 11W 10W 9W 8W 7W 6W 5W
20.00 +10.00 - 19.991.00 - 9.990.01 - 0.99No birds
Blank = not surveyed
Effort (km2)
Figure C.10 Survey effort within SEA 7 area in October
56N
57N
58N
59N
60N
23W 22W 21W 20W 19W 18W 17W 16W 15W 14W 13W 12W 11W 10W 9W 8W 7W 6W 5W
20.00 +10.00 - 19.991.00 - 9.990.01 - 0.99No birds
Blank = not surveyed
Effort (km2)
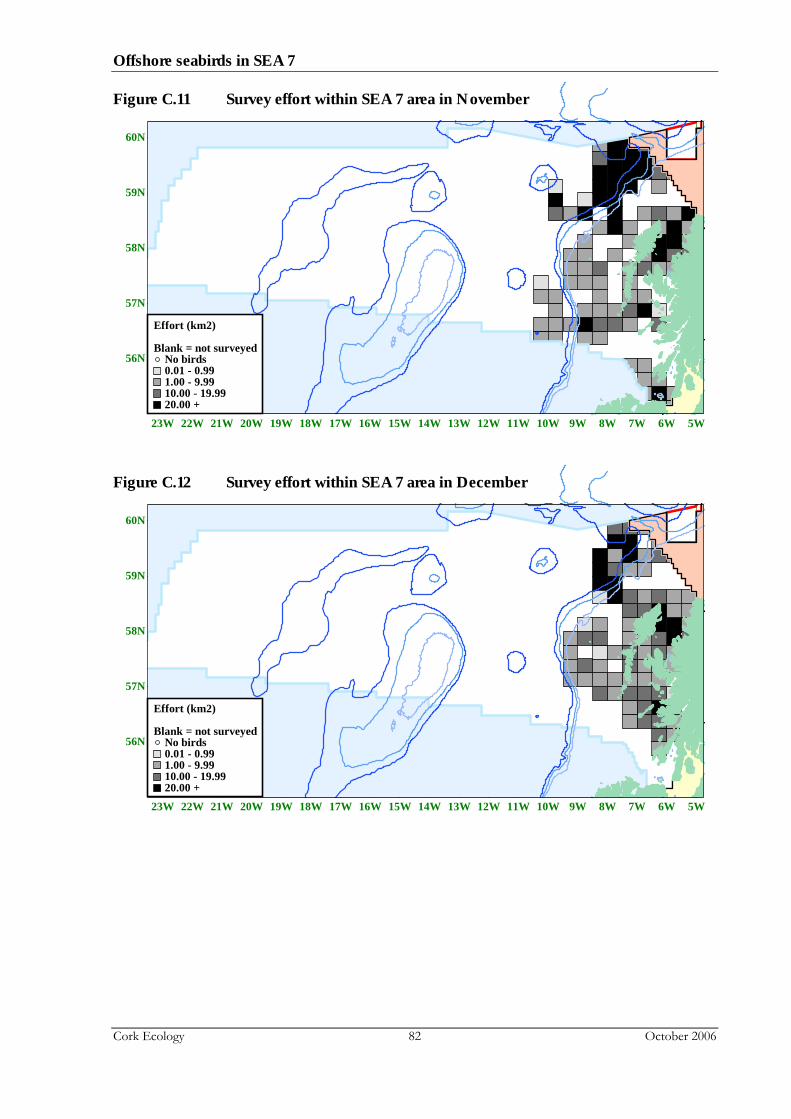
Offshore seabirds in SEA 7
Cork Ecology 82 October 2006
Figure C.11 Survey effort within SEA 7 area in November
56N
57N
58N
59N
60N
23W 22W 21W 20W 19W 18W 17W 16W 15W 14W 13W 12W 11W 10W 9W 8W 7W 6W 5W
20.00 +10.00 - 19.991.00 - 9.990.01 - 0.99No birds
Blank = not surveyed
Effort (km2)
Figure C.12 Survey effort within SEA 7 area in December
56N
57N
58N
59N
60N
23W 22W 21W 20W 19W 18W 17W 16W 15W 14W 13W 12W 11W 10W 9W 8W 7W 6W 5W
20.00 +10.00 - 19.991.00 - 9.990.01 - 0.99No birds
Blank = not surveyed
Effort (km2)