Report to Congress on Medicaid and CHIP March 2019 · In Chapter 2, we examine UPL supplemental...
152
Report to Congress on Medicaid and CHIP MARCH 2019 Medicaid and CHIP Payment and Access Commission
-
Upload
nguyenthien -
Category
Documents
-
view
213 -
download
0
Transcript of Report to Congress on Medicaid and CHIP March 2019 · In Chapter 2, we examine UPL supplemental...

Report to Congress on Medicaid and CHIP
MARCH 2019
Medicaid and CHIP Payment and Access Commission

About MACPAC The Medicaid and CHIP Payment and Access Commission (MACPAC) is a non-partisan legislative branch agency that provides policy and data analysis and makes recommendations to Congress, the Secretary of the U.S. Department of Health and Human Services, and the states on a wide array of issues affecting Medicaid and the State Children’s Health Insurance Program (CHIP). The U.S. Comptroller General appoints MACPAC’s 17 commissioners, who come from diverse regions across the United States and bring broad expertise and a wide range of perspectives on Medicaid and CHIP.
MACPAC serves as an independent source of information on Medicaid and CHIP, publishing issue briefs and data reports throughout the year to support policy analysis and program accountability. The Commission’s authorizing statute, 42 USC 1396, outlines a number of areas for analysis, including:
• payment;• eligibility; • enrollment and retention;• coverage;• access to care;• quality of care; and• the programs’ interaction with Medicare and the health care system generally.
MACPAC’s authorizing statute also requires the Commission to submit reports to Congress by March 15 and June 15 of each year. In carrying out its work, the Commission holds public meetings and regularly consults with state officials, congressional and executive branch staff, beneficiaries, health care providers, researchers, and policy experts.

Medicaid and CHIP Payment and Access Commission
Report to Congress on Medicaid and CHIP
MARCH 2019


Advising Congress onMedicaid and CHIP Policy
Commissioners
Penny Thompson, MPA, Chair Stacey Lampkin, FSA, MAAA,
MPA, Vice ChairMelanie Bella, MBABrian BurwellMartha Carter, DHSc, MBA,
APRN, CNMFrederick Cerise, MD, MPH Kisha Davis, MD, MPHToby Douglas, MPP, MPH Leanna GeorgeDarin GordonChristopher Gorton, MD, MHSA Charles Milligan, JD, MPH Sheldon Retchin, MD, MSPH William Scanlon, PhDPeter Szilagyi, MD, MPHAlan Weil, JD, MPPKatherine Weno, DDS, JD
Anne L. Schwartz, PhD, Executive Director
March 15, 2019
The Honorable Mike Pence President of the Senate The Capitol Washington, DC 20510
The Honorable Nancy Pelosi Speaker of the House The Capitol Washington, DC 20515
Dear Mr. Vice President and Madam Speaker:
On behalf of the Medicaid and CHIP Payment and Access Commission (MACPAC), I am pleased to submit the March 2019 Report to Congress on Medicaid and CHIP.
This report addresses Medicaid hospital payment policy, a critical area of interest to Congress. Medicaid spends more on hospital services than any other type of service; these accounted for one-third of total Medicaid spending in fiscal year (FY) 2017. This year, we focus on disproportionate share hospital (DSH) and upper payment limit (UPL) supplemental payments, making recommendations that would—if adopted—advance Medicaid’s statutory principles of efficiency, economy, quality, and access in hospital payment, as well as improve access to data that would strengthen oversight.
In Chapter 1 we consider the reductions to DSH allotments to states, scheduled to go into effect October 1 of this year. These cuts were included in the Patient Protection and Affordable Care Act (ACA, P.L. 111-148, as amended) under the assumption that the expected increase in the number of people with health insurance (under both Medicaid and the health insurance exchanges) would lead to reductions in hospital uncompensated care and thereby lessen the need for DSH payments. Although initially scheduled to take effect in FY 2014, the cuts have been delayed several times.
Although uninsurance has declined since the ACA went into effect, hospitals, particularly those serving low-income communities, continue to experience high levels of uncompensated care. Although we are concerned that the magnitude of DSH cuts assumed under current law could affect the financial viability of some safety-net hospitals, over the past year, the Commission has focused on budget-neutral ways to restructure funding under current law.
If Congress chooses to go ahead with DSH reductions, the Commission offers a plan to mitigate their impact and improve the relationship between state allotment amounts and uncompensated care costs. Specifically, we recommend more gradually phasing in the reductions, using any unspent funds first, and changing the methodology to reduce allotments in a way that gradually improves the relationship between DSH allotments and the number of non-elderly low-income individuals in a state, after adjusting for differences in hospital costs in different geographic areas.
Medicaid and CHIP Payment and Access Commission
1800 M Street NW Suite 650 South Washington, DC 20036
www.macpac.gov 202-350-2000202-273-2452

In Chapter 2, we examine UPL supplemental payments, another significant source of Medicaid funds for hospitals, totaling $13.0 billion in FY 2017. Our review of data submitted by states to the Centers for Medicare & Medicaid Services (CMS) to demonstrate their compliance with upper payment limits, found large discrepancies between UPL spending reported by states and actual spending claimed for federal matching funds. Although some of these discrepancies may be due to technical issues (for example, differences in the reporting period), many states appear to be exceeding the UPL, and many data elements are missing. To ensure that UPL limits are properly calculated and enforced, the Commission recommends that the Secretary of Health and Human Services create new process controls and use the limits calculated with these data in the review of claimed expenditures. In addition, the Commission recommends that hospital-specific UPL demonstration data and methods be made publicly available in a standard format that enables analysis.
Our final chapter presents the statutorily required analysis on the relationship between DSH allotments to states and measures of need for such funds. In this chapter, we update findings from our past three March reports with previously unavailable data from DSH audits. Our new analysis shows that although charity care and bad debt are declining, Medicaid shortfall (the difference between a hospital’s Medicaid payments and its costs of providing services to Medicaid-enrolled patients) is growing. Medicaid shortfall, in fact, outpaced the decline in unpaid costs of care for uninsured patients in state plan rate years 2013 and 2014 for DSH hospitals.
The analyses and recommendations presented in the March 2019 report were informed by the Commission’s analysis of program data and interviews with hospital administrators and state Medicaid officials, as well as by our ongoing discussions with CMS staff and various associations representing hospitals. MACPAC is committed to providing in-depth, non-partisan analyses of Medicaid and CHIP policy, and we hope this report will prove useful to Congress as it considers future policy development affecting these programs. This document fulfills our statutory mandate to report each year by March 15.
Sincerely,
Penny Thompson, MPA Chair
Medicaid and CHIP Paymentand Access Commissionwww.macpac.gov

Commission Members and Terms
viiReport to Congress on Medicaid and CHIP
Commission Members and TermsPenny Thompson, MPA, Chair Ellicott City, MD
Stacey Lampkin, FSA, MAAA, MPA, Vice Chair Tallahassee, FL
Term Expires April 2019Brian Burwell Watson Health Cambridge, MA
Toby Douglas, MPP, MPH Kaiser Permanente Davis, CA
Christopher Gorton, MD, MHSA Medford, MA
Stacey Lampkin, FSA, MAAA, MPA Mercer Government Human Services Consulting Tallahassee, FL
Penny Thompson, MPA Penny Thompson Consulting, LLC Ellicott City, MD
Alan Weil, JD, MPP Health Affairs Bethesda, MD
Term Expires April 2020Martha Carter, DHSc, MBA, APRN, CNM Culloden, WV
Frederick Cerise, MD, MPH Parkland Health and Hospital System Dallas, TX
Kisha Davis, MD, MPH CHI Health Care Gaithersburg, MD
Darin Gordon Gordon & Associates Nashville, TN
William Scanlon, PhD Independent Consultant Oak Hill, VA
Term Expires April 2021Melanie Bella, MBA Cityblock Health Philadelphia, PA
Leanna George Beneficiary Representative Benson, NC
Charles Milligan, JD, MPH UnitedHealthcare Community Plan of New Mexico Albuquerque, NM
Sheldon Retchin, MD, MSPH The Ohio State University Columbus, OH
Peter Szilagyi, MD, MPH University of California, Los Angeles Los Angeles, CA
Katherine Weno, DDS, JD Independent Public Health Consultant Iowa City, IA

Commission Staff
viii March 2019
Commission StaffAnne L. Schwartz, PhD, Executive Director
Office of the Executive DirectorAnnie Andrianasolo, MBA Executive Administrator
Kathryn Ceja Director of Communications
Kohl Fallin, MPS Communications Specialist
Policy DirectorsMoira Forbes, MBA Kate Kirchgraber, MA
Principal AnalystsKirstin Blom, MIPA
Martha Heberlein, MA
Joanne Jee, MPH Principal Analyst and Congressional Liaison
Erin McMullen, MPP
Jessica Morris, MPA Principal Analyst and Contracting Officer
Robert Nelb, MPH
Chris Park, MS
Kristal Vardaman, MSPH
John Wedeles, DrPH
Senior AnalystKacey Buderi, MPA
AnalystsMadeline Britvec
Kayla Holgash, MPH
Nisha Kurani, MPP
Research AssistantIlham Dehry
Operations and FinanceRicardo Villeta, MBA, Deputy Director of Operations, Finance, and Management
James Boissonnault, MA, Chief Information Officer
Allissa Jones, Administrative Assistant
Kevin Ochieng, IT Specialist
Ken Pezzella, CGFM, Chief Financial Officer
Brian Robinson, Financial Analyst
Eileen Wilkie, Administrative Officer

Acknowledgments
ixReport to Congress on Medicaid and CHIP
AcknowledgmentsThe Commission would like to thank the following individuals for their generous contributions of time, expertise, and insight that were essential as MACPAC prepared the March 2019 Report to Congress on Medicaid and CHIP:
Melisa Byrd, Richard Cuno, Nancy Dolson, Kristin Fan, Benjamin Finder, Janet Freeze, Zina Gontscharow, Rory Howe, Larry Kocot, Sayeh Nikpay, Molly Collins Offner, Erin O’Malley, Jeremy Silanskis, Jeff Stensland, and Christopher Thompson.
Special thanks to Deidre Gifford and her team at the Center for Medicaid and CHIP Services for their close review of the materials in this report.
We also are grateful to Paula Gordon and Chuck Emig for their thorough copyediting, and Dave Rinaldo and his talented team at CHIEF for their assistance in publishing this report.

Table of Contents
x March 2019
Table of ContentsCommission Members and Terms ...................................................................................................................... vii
Commission Staff ................................................................................................................................................ viii
Acknowledgments ................................................................................................................................................. ix
Executive Summary: March 2019 Report to Congress on Medicaid and CHIP .............................................. xiv
Introduction ............................................................................................................................................ xix
Endnotes .................................................................................................................................................. xix
References ............................................................................................................................................... xx
Chapter 1: Improving the Structure of Disproportionate Share Hospital Allotment Reductions ................. 1
Recommendations .................................................................................................................................... 2
Key Points ................................................................................................................................................... 2
Current Structure of DSH Allotment Reductions ..................................................................................... 4
Policy Goals ................................................................................................................................................ 6
Commission Recommendations .............................................................................................................. 7
State-by-State Effects ............................................................................................................................. 14
Next Steps ................................................................................................................................................ 18
Endnotes ................................................................................................................................................... 18
References ............................................................................................................................................... 19
Commission Vote on Recommendations .............................................................................................. 22
APPENDIX 1A: State-Level Data ...............................................................................................................23
APPENDIX 1B: Methodology for Estimating the Effects of the Disproportionate Share Hospital Allotment Reduction Recommendations ................................................................................................30
Chapter 2: Oversight of Upper Payment Limit Supplemental Payments to Hospitals .............................. 35
Recommendations .................................................................................................................................. 36
Key Points ................................................................................................................................................. 36
Background .............................................................................................................................................. 38
Uses of UPL Payments ............................................................................................................................ 38
History of UPL Policy ............................................................................................................................... 40
Current UPL Requirements ..................................................................................................................... 41
Analysis of State UPL Demonstrations .................................................................................................. 43
State and CMS Perspectives .................................................................................................................. 46
Commission Recommendations ............................................................................................................ 47
Next Steps ................................................................................................................................................ 49

Table of Contents
xiReport to Congress on Medicaid and CHIP
Endnotes ................................................................................................................................................... 50
References ............................................................................................................................................... 51
Commission Vote on Recommendations .............................................................................................. 54
APPENDIX 2A: Methods ...........................................................................................................................55
Endnotes .......................................................................................................................................... 56
Chapter 3: Annual Analysis of Disproportionate Share Hospital Allotments to States ............................ 57
Key Points ................................................................................................................................................. 58
Background .............................................................................................................................................. 60
Changes in the Number of Uninsured Individuals .................................................................................... 65
Changes in the Amount of Hospital Uncompensated Care .................................................................. 65
Hospitals with High Levels of Uncompensated Care That Also Provide Essential Community Services ............................................................................................................... 71
DSH Allotment Reductions ..................................................................................................................... 74
Next Steps ................................................................................................................................................ 79
Endnotes ................................................................................................................................................... 79
References ............................................................................................................................................... 82
APPENDIX 3A: State-Level Data ...............................................................................................................85
APPENDIX 3B: Methodology and Data Limitations .............................................................................. 111
Primary Data Sources ................................................................................................................... 111
Working Definition of Essential Community Services ................................................................ 112
Projections of DSH Allotments .................................................................................................... 113
Appendix .............................................................................................................................................. 115
Authorizing Language from the Social Security Act (42 USC 1396) ................................................ 116
Biographies of Commissioners ............................................................................................................ 123
Biographies of Staff ............................................................................................................................... 127
List of BoxesBOX 1-1. Types of Medicaid Payments Used to Pay for Costs of Care Provided to
Medicaid-Enrolled Patients .......................................................................................................... 17
BOX 2-1. Medicare Hospital Payment Methods ......................................................................................... 42
BOX 3-1. Glossary of Key Medicaid Disproportionate Share Hospital Terminology ................................ 61
BOX 3-2. Data Sources and Definitions of Uncompensated Care Costs .................................................. 67
BOX 3-3. Factors Affecting Medicaid Hospital Costs ................................................................................ 72

Table of Contents
xii March 2019
BOX 3-4. Identifying Hospitals with High Levels of Uncompensated Care That Provide Essential Community Services for Low-Income, Uninsured, and Other Vulnerable Populations ............ 73
BOX 3-5. Factors Used in Disproportionate Share Hospital Health Reform Reduction Methodology ................................................................................................................ 77
List of FiguresFIGURE 1-1. DSH Allotments as a Share of Hospital Uncompensated Care Costs
Relative to the National Average, FY 2023 .................................................................................... 5
FIGURE 1-2. Federal DSH Funding Under Various Policy Options, FYs 2019–2029 ........................................ 8
FIGURE 1-3. Projected Reduction in State DSH Spending as a Share of Total Medicaid Hospital Spending under MACPAC Recommendations, FY 2023 ............................................. 15
FIGURE 2-1. Maximum Allowable Upper Payment Limit Supplemental Payments ....................................... 39
FIGURE 3-1. DSH Spending as a Share of Total Medicaid Benefit Spending, by State, FY 2017 .................. 62
FIGURE 3-2. Share of Hospitals Receiving DSH Payments and Share of DSH Payments to Deemed DSH Hospitals, by State, SPRY 2014 ............................................................................ 64
FIGURE 3-3. Charity Care and Bad Debt as a Share of Hospital Operating Expenses, 2016 ........................ 68
FIGURE 3-4. Medicaid Shortfall as a Share of Total Uncompensated Care Costs for DSH Hospitals, SPRY 2014 ........................................................................................................... 69
FIGURE 3-5. Aggregate Hospital Operating Margins Before and After DSH Payments, All Hospitals versus Deemed DSH Hospitals, 2016 .................................................................... 75
FIGURE 3-6. Aggregate Hospital Total Margins Before and After DSH Payments, All Hospitals versus Deemed DSH Hospitals, 2016 .................................................................... 75
FIGURE 3-7. Decrease in State DSH Allotments as a Percentage of Unreduced Allotments, by State, FY 2020 ................................................................................... 78
List of TablesTABLE 1-1. Correlation between Potential DSH Allotment Factors and
Total Hospital Uncompensated Care .................................................................................................. 11
TABLE 1-2. Aggregate Percentage Change in DSH Allotments under Various Scenarios, FY 2023 .......... 12
TABLE 1-3. Characteristics of States with Projected Reductions in DSH Payments Greater Than or Equal To 10 Percent of Medicaid Hospital Spending under MACPAC Recommendations, FY 2023 ...16
TABLE 1A-1. State-Level Factors in Recommended DSH Allotment Reduction Formula ............................. 23
TABLE 1A-2. DSH Allotment Changes under Status Quo and MACPAC Recommendations, FY 2023 ........................................................................................ 25
TABLE 1A-3. Reductions in DSH Spending as a Share of Total Medicaid Payments to Hospitals under Status Quo and MACPAC Recommendations, FY 2023 ................................. 28

Table of Contents
xiiiReport to Congress on Medicaid and CHIP
TABLE 1B-1. Inflation-Based DSH Allotment Increases Attributable to DSH Allotment Reductions ........................................................................................................... 31
TABLE 1B-2. Total Medicaid Hospital Spending Estimated Using Various Sources for Selected States, FY 2016 .............................................................................................................. 33
TABLE 2-1. Targeting of UPL Payments .......................................................................................................... 40
TABLE 2-2. Number of States Using Each Method for Determining UPL Limits, SFY 2016 ........................ 42
TABLE 2-3. State Hospital-Specific UPL Demonstrations with Missing Payment Data, SFY 2016 ............ 44
TABLE 2-4. State-Reported Hospital Spending, by Source, SFY 2016 .......................................................... 45
TABLE 2A-1. Data Sources and Definitions for State UPL Demonstrations and CMS-64 Expenditure Reports ...................................................................................................................... 55
TABLE 3-1. Distribution of DSH Spending by Hospital Characteristics, SPRY 2014 .................................... 63
TABLE 3-2. Uncompensated Care for DSH Hospitals, SPRYs 2013–2014 ................................................... 70
TABLE 3-3. Components of Medicaid Shortfall Reported on DSH Audits by State Expansion Status, SPRYs 2013–2014 ................................................................................ 71
TABLE 3-4. Percent Change in Components of Uncompensated Care for DSH Hospitals, SPRYs 2012–2014 ......................................................................................................................... 72
TABLE 3A-1. State DSH Allotments, FYs 2019 and 2020 ................................................................................. 85
TABLE 3A-2. FY 2020 DSH Allotment Reductions, by State ............................................................................ 87
TABLE 3A-3. Number of Uninsured Individuals and Uninsured Rate, by State, 2013–2017 ........................... 89
TABLE 3A-4. State Levels of Uncompensated Care, 2015–2016 ..................................................................... 91
TABLE 3A-5. Number and Share of Hospitals Receiving DSH Payments and Meeting Other Criteria, by State, 2014 ......................................................................................... 94
TABLE 3A-6. Number and Share of Hospital Beds and Medicaid Days Provided by Deemed DSH Hospitals, by State, 2014 ....................................................................................... 96
TABLE 3A-7. FY 2019 DSH Allotment per Uninsured Individual, by State ....................................................... 99
TABLE 3A-8. FY 2019 Unreduced DSH Allotments as a Percentage of Hospital Uncompensated Care, by State, 2016 ......................................................................... 102
TABLE 3A-9. FY 2019 DSH Allotment per Deemed DSH Hospital Providing at Least One Essential Community Service, by State .......................................................................................... 105
TABLE 3A-10. Medicaid Payments to DSH Hospitals as a Share of Costs, by State, SPRY 2014 ................. 108
TABLE 3B-1. Essential Community Services, by Data Source ....................................................................... 113
TABLE 3B-2. Data Sources for Factors Used in the CMS DSH Allotment Reduction Model ....................... 113

Executive Summary
xiv March 2019
Executive Summary: March 2019 Report to Congress on Medicaid and CHIPMedicaid spends more on hospital services than any other type of service. Medicaid expenditures for hospital services, at $177.5 billion, accounted for one-third of total Medicaid spending in fiscal year (FY) 2017. Congress has an interest in ensuring that Medicaid beneficiaries have access to hospital services and that payments to hospitals are based on principles of efficiency and economy, as the Medicaid statute prescribes. The three chapters of the March 2019 Report to Congress on Medicaid and CHIP look at these issues from three different angles.
Chapter 1 addresses reductions to disproportionate share hospital (DSH) allotments; this funding enables states to make supplemental payments to offset the cost of uncompensated care. Unless Congress takes action, these cuts will begin to take effect on October 1, 2019. The Commission is concerned that the magnitude of DSH cuts assumed under current law could affect the financial viability of some safety-net hospitals. Chapter 1 provides three recommendations to minimize the impact of the cuts on safety-net hospitals and better align the existing allotment methodology with the cost of uncompensated care.
Chapter 2 examines upper payment limit (UPL) payments, a significant source of Medicaid funding for hospitals, exceeding DSH payments. Previous MACPAC analyses have noted the lack of data regarding these payments, observing that incomplete information on this important source of hospital financing affects policymakers’ ability to fully understand hospital spending in Medicaid.
New analyses in Chapter 2 raise additional concerns about UPL data accuracy and completeness. The analyses note large discrepancies between spending reported on state UPL demonstrations and actual spending reported on CMS expenditure reports, as well as missing hospital and payment data for many states. Chapter 2 contains
recommendations to improve oversight of hospital-specific UPL demonstration data, to ensure they are complete, accurate, and linked to the process used for claiming expenditures for the purposes of federal match. In addition, MACPAC calls for the release of hospital-specific UPL demonstration data in a standard format that provides the public with access to the data.
Chapter 3 contains MACPAC’s annual statutorily required DSH analyses. The analyses in this chapter underscore MACPAC’s prior findings that DSH allotments have little meaningful relationship to measures of uncompensated care at the state level. Much of the variation in state DSH allotments reflects their basis on historic patterns of spending. We also find that Centers for Medicare & Medicaid Services methodology for implementing DSH allotment reductions would preserve most of this historical variation.
Summaries of each chapter in the March 2019 Report to Congress on Medicaid and CHIP are presented below.
CHAPTER 1: Improving the Structure of Disproportionate Share Hospital Allotment ReductionsMedicaid DSH payments are statutorily required payments intended to offset hospitals’ uncompensated care costs for Medicaid-enrolled and uninsured patients and support the financial stability of safety-net hospitals. Total state DSH spending is limited by federal allotments, which vary widely by state. DSH allotments were first made available in FY 1993 based on each state’s DSH spending in FY 1992, and they currently have little meaningful relationship to the level of uncompensated care in a state.
The Patient Protection and Affordable Care Act (ACA, P.L. 111-148, as amended) included reductions to DSH allotments under the assumption that the number of people with health insurance would increase, due to the expansion of Medicaid to a new group of non-disabled adults and the

Executive Summary
xvReport to Congress on Medicaid and CHIP
availability of subsidized health insurance on health insurance exchanges. This, in turn, would lead to reductions in hospital uncompensated care and thereby reduce the need for DSH payments.
In fact, MACPAC’s analyses over the past three years have shown that hospitals continue to have substantial levels of uncompensated care even though the number of uninsured individuals has declined since 2013. Although increased coverage under the ACA has reduced unpaid costs of care for uninsured individuals, there has been a net increase in hospital uncompensated care costs for DSH hospitals because of an increase in Medicaid shortfall, which is the difference between a hospital’s Medicaid payments and its costs of providing services to Medicaid-enrolled patients.
Reductions in DSH allotments—which have been delayed several times since 2014 when they were first scheduled to take effect—are currently scheduled for FY 2020, beginning with a reduction of $4 billion in FY 2020 and then increasing to $8 billion a year in FYs 2021–2025. Although the Commission is concerned that the magnitude of DSH cuts assumed under current law could affect the financial viability of some safety-net hospitals, in response to congressional interest, our work has focused on budget-neutral ways to restructure funding under current law.
In this report, the Commission makes the following three recommendations to improve the relationship between DSH allotments and measures related to hospital uncompensated care costs; apply reductions in a manner that is independent of state policy choices; and phase in changes in an orderly way:
• If Congress chooses to proceed with DSH allotment reductions in current law, it should revise Section 1923 of the Social Security Act to change the schedule of DSH allotment reductions to $2 billion in FY 2020, $4 billion in FY 2021, $6 billion in FY 2022, and $8 billion a year in FYs 2023–2029, in order to phase in DSH allotment reductions more gradually without increasing federal spending.
• In order to minimize the effects of DSH allotment reductions on hospitals that currently receive DSH payments, Congress should revise Section 1923 of the Social Security Act to require the Secretary of the U.S. Department of Health and Human Services to apply reductions to states with DSH allotments that are projected to be unspent before applying reductions to other states.
• In order to reduce the wide variation in state DSH allotments based on historical DSH spending, Congress should revise Section 1923 of the Social Security Act to require the Secretary of the U.S. Department of Health and Human Services to develop a methodology to distribute reductions in a way that gradually improves the relationship between DSH allotments and the number of non-elderly low-income individuals in a state, after adjusting for differences in hospital costs in different geographic areas.
Because some states may respond to DSH allotment reductions by changing other Medicaid payments to hospitals, MACPAC will continue to holistically examine Medicaid hospital payments. The Commission has outlined a long-term hospital payment work plan that will consider all types of Medicaid payments to hospitals in relation to the statutory goals of efficiency, economy, quality, and access to care.
CHAPTER 2: Oversight of Upper Payment Limit Supplemental Payments to HospitalsUPL supplemental payments were the largest type of Medicaid hospital supplemental payment reported in FY 2017. The UPL is an upper limit on fee-for-service (FFS) payments, defined as a reasonable estimate of the amount that would have been paid for the same services under Medicare. States can make UPL payments as long as they do not exceed the difference between FFS base payments and the UPL in the aggregate.

Executive Summary
xvi March 2019
To better understand states’ methods for calculating UPL payments, MACPAC examined hospital-level data from state UPL demonstrations for state fiscal year (SFY) 2016 and aggregate, state-level UPL data for SFYs 2014–2016, the first and only years for which data were available. Our analyses raised questions about the accuracy and completeness of the data used to monitor compliance.
We found large discrepancies between spending reported on state UPL demonstrations and actual spending reported on CMS expenditure reports, and missing hospital and payment data for many states. Moreover, it did not appear that the limits calculated on UPL demonstrations were used in the review of claimed expenditures.
To address these concerns, the Commission recommends that:
• The Secretary of the U.S. Department of Health and Human Services should establish process controls to ensure that annual hospital upper payment limit demonstration data are accurate and complete and that the limits calculated with these data are used in the review of claimed expenditures.
• To help inform development of payment methods that promote efficiency and economy, the Secretary of the U.S. Department of Health and Human Services should make hospital-specific upper payment limit demonstration data and methods publicly available in a standard format that enables analysis.
Better data and process controls will help ensure proper enforcement of existing limits and can help inform development of new payment policies that promote efficiency and economy. The Commission will continue to pursue this area of inquiry in the coming year.
CHAPTER 3: Annual Analysis of Disproportionate Share Hospital Allotments to StatesMACPAC is statutorily required to report annually on the relationship between state allotments and several potential indicators of hospitals’ need for DSH funds:
• changes in the number of uninsured individuals;
• amounts and sources of hospitals’ uncompensated care costs; and
• the number of hospitals with high levels of uncompensated care that also provide essential community services for low-income, uninsured, and vulnerable populations.
In Chapter 3 we update findings from the past three March reports using new DSH audit data on changes in the number of uninsured individuals and levels of hospital uncompensated care. This is the first comprehensive information available on the early effects of the ACA coverage expansion on hospitals. We also provide updated information on deemed DSH hospitals, which are required by statute to receive DSH payments because they serve a high share of Medicaid-enrolled and low-income patients. Among the findings in Chapter 3:
• In 2017, 28.5 million people, or 8.8 percent of the U.S. population, were uninsured, about the same percentage as in 2016. The number of uninsured individuals has declined 32 percent since 2013, with the largest declines in states that expanded Medicaid under the ACA.
• Hospitals reported $35.0 billion in hospital charity care and bad debt on Medicare cost reports in 2016, an 8 percent decline from 2015.
• Hospitals reported $20.0 billion in Medicaid shortfall in 2016, a 24 percent increase from the amount reported in 2015. Since 2013, the

Executive Summary
xviiReport to Congress on Medicaid and CHIP
amount of Medicaid shortfall for all hospitals has increased by $6.8 billion.
• In 2016, deemed DSH hospitals continued to report lower aggregate operating margins than other hospitals, but total margins—which include government appropriations and revenue not directly related to patient care— were similar between deemed DSH hospitals and all hospitals. Aggregate operating and total margins for deemed DSH hospitals would have been about 4 percentage points lower without DSH payments.
Despite the coverage gains since enactment of the ACA, state plan rate year (SPRY) 2014 DSH audit data show a net increase in total uncompensated care costs for DSH hospitals because of an increase in Medicaid shortfall. For hospitals included in SPRY 2013 and 2014 DSH audits, the increase in Medicaid shortfall ($4.0 billion) was more than twice as large as the decline in unpaid costs of care for uninsured patients ($1.6 billion).
Chapter 3 also presents information on FY 2020 DSH allotments before and after implementation of federal DSH allotment reductions. Under current law, the first round of reductions—$4 billion or 31 percent of unreduced amounts—will take effect in FY 2020. Reductions are scheduled to increase to $8 billion in FYs 2021–2025, which is more than half of states’ unreduced allotment amounts.
The analyses in this chapter underscore MACPAC’s prior findings that DSH allotments have little meaningful relationship to measures meant to identify those hospitals most in need. Although much of the variation in state DSH allotment amounts reflects the basis of these allotments in historic patterns of spending, we also find that CMS’s methodology for implementing DSH allotment reductions would preserve most of this historical variation.


Introduction
xixReport to Congress on Medicaid and CHIP
IntroductionMedicaid spends more on hospital services than any other type of service. In 2017, Medicaid expenditures for hospital care totaled $177.5 billion, accounting for fully one-third of total Medicaid spending (OACT 2018). A substantial portion of these funds were in the form of supplemental payments. In fiscal year 2017, Medicaid spent $18.1 billion in disproportionate share hospital (DSH) payments and $13.0 billion in hospital payments under rules that allow states to make additional payments up to the amount that would have been paid under Medicare payment principles, referred to as upper payment limit (UPL) supplemental payments.
From its first report in March 2011, MACPAC has expressed interest in better understanding how hospital payment policies relate to the principles of efficiency, economy, quality, and access set forth in Section 1902(a)(30)(A) of the Social Security Act (MACPAC 2011). In March 2014, we reported on state use of non-DSH supplemental payments, noting not only the importance of these payments to providers but also that the lack of complete data at the provider level hinders the ability of policymakers to fully understand spending in the program (MACPAC 2014). In February 2016, we issued a special report on DSH allotments to states, noting that there is little meaningful relationship between these amounts and either the number of uninsured individuals or hospitals’ uncompensated care costs (MACPAC 2016). We have updated this analysis three times since (including in this report), each time noting little change from our initial findings (MACPAC 2018, 2017).
This report focuses entirely on hospital supplemental payments, with two chapters related to DSH allotments and one focused on compliance with the UPL. We make recommendations in both of these areas that would, if adopted, move Medicaid payment policy toward meeting statutory goals and improve access to data that could be used
for additional analysis and monitoring related to these goals. We call for statutory changes that would change the distribution of DSH allotments to states if Congress allows reductions to go forward in fiscal year 2020. We also call for agency actions to improve compliance with the UPL and make provider-level data publicly available. These recommendations were informed by the Commission’s analysis of program data and interviews with hospital administrators and state Medicaid officials, as well as by our ongoing discussions with Centers for Medicare & Medicaid Services staff and various associations representing hospitals.
MACPAC’s work on Medicaid hospital payment policy will continue beyond this report with analyses focused on base payments (payments made for individual services), supplemental payments, and efforts to tie such payments to outcomes. We will continue to document and analyze the different methods states use to pay hospitals, explore the relationship between payment policy and state financing decisions, and consider how these factors affect the provision of services to Medicaid beneficiaries. We anticipate that this work will lead to future recommendations to ensure that Medicaid hospital payment policy leads to efficient and economical use of public dollars while assuring access to appropriate and high-quality care.
Endnotes1 Estimates of Medicaid hospital spending in National Expenditure Accounts data include both fee-for-service and managed care payments for inpatient and outpatient hospitals. They also include payments for nursing facility services and home health services provided by hospitals.
2 Additional information on all types of Medicaid payments to hospitals is provided in MACPAC’s issue brief, Medicaid Base and Supplemental Payments to Hospitals (MACPAC 2019).

Introduction
xx March 2019
ReferencesMedicaid and CHIP Payment and Access Commission (MACPAC). 2019. Medicaid base and supplemental payments to hospitals. Washington, DC: MACPAC. https://www.macpac.gov/publication/medicaid-base-and-supplemental-payments-to-hospitals/.
Medicaid and CHIP Payment and Access Commission (MAPCAC). 2018. Chapter 3: Annual analysis of disproportionate share allotments to states. In Report to Congress on Medicaid and CHIP. March 2018. Washington, DC: MACPAC. https://www.macpac.gov/publication/annual-analysis-of-disproportionate-share-hospital-allotments-to-states/.
Medicaid and CHIP Payment and Access Commission (MACPAC). 2017. Chapter 2: Analyzing disproportionate share allotments to states. In Report to Congress on Medicaid and CHIP. March 2017. Washington, DC: MACPAC. https://www.macpac.gov/publication/analyzing-disproportionate-share-hospital-allotments-to-states/.
Medicaid and CHIP Payment and Access Commission (MACPAC). 2016. Report to Congress on Medicaid disproportionate share hospital payments. February 2016. Washington, DC: MACPAC. https://www.macpac.gov/publication/report-to-congress-on-medicaid-disproportionate-share-hospital-payments/.
Medicaid and CHIP Payment and Access Commission (MACPAC). 2014. Chapter 6: Examining the policy implications of Medicaid non-disproportionate share hospital supplemental payments. In Report to the Congress on Medicaid and CHIP. March 2014. Washington, DC: MACPAC. https://www.macpac.gov/publication/ch-6-examining-the-policy-implications-of-medicaid-non-disproportionate-share-hospital-supplemental-payments/.
Medicaid and CHIP Payment and Access Commission (MACPAC). 2011. Chapter 5: Examining Medicaid payment policy. In Report to the Congress on Medicaid and CHIP. March 2011. Washington, DC: MACPAC. https://www.macpac.gov/publication/ch-5-examining-medicaid-payment-policy/.
Office of the Actuary (OACT), Centers for Medicare & Medicaid Services, U.S. Department of Health and Human Services. 2018. National health expenditures by type of service and source of funds: Calendar years 1960–2017. Baltimore, MD: OACT. https://www.cms.gov/Research-Statistics-Data-and-Systems/Statistics-Trends-and-Reports/NationalHealthExpendData/NationalHealthAccountsHistorical.html.

Chapter 1:
Improving the Structure of Disproportionate Share Hospital Allotment Reductions

Chapter 1: Improving the Structure of Disproportionate Share Hospital Allotment Reductions
2 March 2019
Improving the Structure of Disproportionate Share Hospital Allotment ReductionsRecommendations1.1 If Congress chooses to proceed with disproportionate share hospital (DSH) allotment reductions in
current law, it should revise Section 1923 of the Social Security Act to change the schedule of DSH allotment reductions to $2 billion in fiscal year (FY) 2020, $4 billion in FY 2021, $6 billion in FY 2022, and $8 billion a year in FYs 2023–2029, in order to phase in DSH allotment reductions more gradually without increasing federal spending.
1.2 In order to minimize the effects of disproportionate share hospital (DSH) allotment reductions on hospitals that currently receive DSH payments, Congress should revise Section 1923 of the Social Security Act to require the Secretary of the U.S. Department of Health and Human Services to apply reductions to states with DSH allotments that are projected to be unspent before applying reductions to other states.
1.3 In order to reduce the wide variation in state disproportionate share hospital (DSH) allotments based on historical DSH spending, Congress should revise Section 1923 of the Social Security Act to require the Secretary of the U.S. Department of Health and Human Services to develop a methodology to distribute reductions in a way that gradually improves the relationship between DSH allotments and the number of non-elderly low-income individuals in a state, after adjusting for differences in hospital costs in different geographic areas.
Key Points• Under current law, DSH allotments will be reduced by $4 billion in FY 2020 and $8 billion a year in FYs
2021–2025.
• Although such cuts could affect the financial viability of safety-net hospitals, our analysis responded to Congressional interest in restructuring funding in a budget-neutral way.
• The Commission’s recommendations aim to advance three policy goals:
– improving the relationship between DSH allotments and measures related to hospital uncompensated care costs;
– applying reductions to states independent of state policy choices; and
– phasing in changes in an orderly way.
• If DSH allotment reductions take effect, phasing them in gradually will give states and hospitals more time to respond.
• Reducing unspent DSH funding first minimizes the amount of reductions to DSH funds that are currently paid to providers.
• Basing DSH allotment reductions on the number of non-elderly low-income individuals in a state reduces variations in DSH allotments based on historical spending. This measure is related to hospital uncompensated care costs and is independent of state policy choices.
• Relative to current law, these recommendations result in larger reductions for states with unspent DSH funds and smaller reductions for states with low DSH allotments. These effects are independent of a state’s Medicaid expansion status.

Chapter 1: Improving the Structure of Disproportionate Share Hospital Allotment Reductions
3Report to Congress on Medicaid and CHIP
CHAPTER 1: Improving the Structure of Disproportionate Share Hospital Allotment ReductionsMedicaid disproportionate share hospital (DSH) payments are statutorily required payments intended to offset hospitals’ uncompensated care costs for Medicaid-enrolled and uninsured patients and to support the financial stability of safety-net hospitals. Total state DSH spending is limited by federal allotments, which vary widely by state. DSH allotments were first made available in fiscal year (FY) 1993 based on each state’s DSH spending in FY 1992, and they currently have little meaningful relationship to the level of uncompensated care in a state.
The Patient Protection and Affordable Care Act (ACA, P.L. 111-148, as amended) included reductions to DSH allotments under the assumption that the expected increase in the number of people with health insurance due to state Medicaid expansions and the availability of subsidized health insurance on health insurance exchanges would lead to reductions in hospital uncompensated care and thereby lessen the need for DSH payments. DSH allotment reductions were initially scheduled to take effect in FY 2014, but they have been delayed several times. Under current law, DSH allotments are scheduled to be reduced by $4 billion in FY 2020 and $8 billion a year in FYs 2021–2025. For FY 2026 and beyond, allotments will return to their higher, unreduced amounts.
MACPAC’s prior analyses have shown that hospitals continue to have substantial levels of uncompensated care even though the number of uninsured individuals has declined since 2013. As discussed further in Chapter 3 of this report, although increased coverage under the ACA has reduced hospital unpaid costs of care for uninsured
individuals, there has been a net increase in hospital uncompensated costs for DSH hospitals because of an increase in Medicaid shortfall (the difference between a hospital’s Medicaid payments and its costs of providing services to Medicaid-enrolled patients).
Hospital trade associations have been calling on Congress to delay DSH cuts once again, but doing so will require Congress to come up with cuts elsewhere to offset the budgetary impact of such delays. This has led to congressional interest in MACPAC conducting analyses of and providing advice on policies that would mitigate the effects of allotment reductions on providers and rationalize the distribution of reductions across states. Although the Commission is concerned that the magnitude of DSH cuts assumed under current law could affect the financial viability of some safety-net hospitals, the work we have done over the past year has focused on budget-neutral ways to restructure funding under current law.
This chapter presents the Commission’s analyses of and recommendations for changing the structure of DSH allotment reductions to advance the following policy goals:
• improving the relationship between DSH allotments and measures related to hospital uncompensated care costs;
• applying reductions to states that are independent of state policy choices; and
• phasing in changes in an orderly way.
Specifically, the Commission makes three recommendations:
• If Congress chooses to proceed with DSH allotment reductions in current law, it should revise Section 1923 of the Social Security Act to change the schedule of DSH allotment reductions to $2 billion in FY 2020, $4 billion in FY 2021, $6 billion in FY 2022, and $8 billion a year in FYs 2023–2029, in order to phase in DSH allotment reductions more gradually without increasing federal spending.

Chapter 1: Improving the Structure of Disproportionate Share Hospital Allotment Reductions
4 March 2019
• In order to minimize the effects of DSH allotment reductions on hospitals that currently receive DSH payments, Congress should revise Section 1923 of the Social Security Act to require the Secretary of the U.S. Department of Health and Human Services to apply reductions to states with DSH allotments that are projected to be unspent before applying reductions to other states.
• In order to reduce the wide variation in state DSH allotments based on historical DSH spending, Congress should revise Section 1923 of the Social Security Act to require the Secretary of the U.S. Department of Health and Human Services to develop a methodology to distribute reductions in a way that gradually improves the relationship between DSH allotments and the number of non-elderly low-income individuals in a state, after adjusting for differences in hospital costs in different geographic areas.
These recommendations draw on MACPAC’s analysis of multiple sources of data on hospital payment and financing as well as qualitative work that included interviews with DSH hospital executives, state officials, and other stakeholders, and a roundtable discussion on the future of DSH policy that brought together perspectives of states, the Centers for Medicare & Medicaid Services (CMS), hospitals, researchers, and consumer advocates.
The analyses in this chapter focus on DSH allotments to states, but the Commission plans to continue examining other DSH policies in the future, such as the targeting of DSH payments to providers within each state and the use of DSH funding to promote access to care in appropriate settings.1 The Commission will consider these DSH policies and others in relation to other types of Medicaid payments to hospitals as part of its long-term hospital payment work plan (MACPAC 2018).
Current Structure of DSH Allotment ReductionsIn response to a rapid growth in DSH spending, Congress enacted the Medicaid Voluntary Contribution and Provider-Specific Tax Amendments (P.L. 102-234) in 1991.2 The law required CMS to establish state-specific caps (referred to as allotments) on the amount of federal funds that could be used to make DSH payments beginning in FY 1993. The allotments were initially based on each state’s FY 1992 DSH spending. Although Congress has made several incremental adjustments to these allotments, the states that spent the most in FY 1992 still have the largest allotments, and the states that spent the least in FY 1992 still have the smallest allotments. Additional background information about DSH policy and the current variation in state DSH allotments is provided in Chapter 3 of this report.
In FY 2019, $12.6 billion in federal funds were allotted for DSH payments. The schedule of reductions under current law is $4 billion in FY 2020 and $8 billion each year for FYs 2021–2025. The reductions under this schedule are larger and extend over a longer period of time than those scheduled by the ACA. For example, under the ACA, DSH allotment reductions were scheduled to begin at $0.5 billion in FY 2014 and were scheduled to end at $4 billion in FY 2020.
To implement these reductions, CMS developed a methodology for distributing DSH allotment reductions among states using criteria specified in statute (§ 1923(f)(7) of the Social Security Act (the Act)). The statute requires CMS to apply greater DSH reductions to states with lower uninsured rates, states that do not target their DSH payments to hospitals with high levels of uncompensated care, and states that do not target their DSH payments to hospitals that serve a high share of Medicaid-enrolled patients.3 The statute also directs CMS to apply smaller reductions to states that are statutorily designated as low-DSH states because they had low levels of DSH spending relative to other states in FY 2000.4 In 2013, CMS finalized

Chapter 1: Improving the Structure of Disproportionate Share Hospital Allotment Reductions
5Report to Congress on Medicaid and CHIP
a methodology for the DSH reductions that had initially been scheduled to take effect in FYs 2014 and 2015, but it did not finalize a methodology for subsequent years (CMS 2013). In July 2017, CMS proposed changes to this methodology that would have applied for FY 2018 and beyond, but the proposed rule was never finalized (CMS 2017). However, because the statutory factors that CMS is required to consider in its reduction methodology have not changed, we do not expect that CMS will develop a new methodology for the FY 2020 cuts.5
Although the statute requires CMS to base allotment reductions on factors other than historical DSH spending, CMS’s methodology is projected to preserve much of the variation in DSH funding that exists today. For example, before and after DSH reductions, there is no meaningful relationship between DSH allotments and hospital uncompensated care costs (Figure 1-1). In addition,
even though the targeting factors in CMS’s methodology are intended to encourage states to target DSH payments to hospitals that need them most, these factors are unlikely to change state policies and may even result in larger reductions for some states that do target DSH payments to deemed DSH hospitals, that is, hospitals that are statutorily required to receive DSH payments because they serve a high share of Medicaid and low-income patients (MACPAC 2017b).
MACPAC provided comments on CMS’s proposed reduction formula in August 2017, but these comments were limited to regulatory changes that CMS could make under current law (MACPAC 2017b). In order to change the factors used in the DSH allotment reduction formula, Congress would need to change the factors listed in the statute (§ 1923(f)(7) of the Act).
FIGURE 1-1. DSH Allotments as a Share of Hospital Uncompensated Care Costs Relative to the National Average, FY 2023
02468
1012141618
50% belowor more
30% – 49%below
10% – 29%below
Within 10% ofnational average
10% – 29%above
30% – 49%above
50% aboveor more
Unreduced allotments Reduced allotments (current law)
Num
ber o
f sta
tes
DSH allotments as a share of uncompensated care costs
Notes: DSH is disproportionate share hospital. FY is fiscal year. DSH allotments as a share of hospital uncompensated care in the state were calculated using 2016 Medicare cost reports, which define uncompensated care as charity care and bad debt. The number of states includes the District of Columbia. In FY 2023, federal unreduced allotments are projected to equal 40 percent of 2016 hospital uncompensated care costs, and reduced allotments are projected to equal 17 percent of 2016 hospital uncompensated care costs. Additional information about the relationship between DSH allotments and hospital uncompensated care costs is provided in Chapter 3 of this report.
Source: MACPAC, 2019, analysis of CBO 2018, 2014 as-filed DSH audits, the CMS Medicaid Budget and Expenditure System, and Medicare cost reports.

Chapter 1: Improving the Structure of Disproportionate Share Hospital Allotment Reductions
6 March 2019
Policy GoalsMACPAC identified three policy goals to guide its deliberations on how to improve the distribution of DSH allotment reductions among states:
• improving the relationship between DSH allotments and measures related to hospital uncompensated care costs;
• applying reductions to states that are independent of state policy choices; and
• phasing in changes in an orderly way.
Relating DSH allotments to hospital uncompensated care costsThe Commission has long held that DSH funding should be better targeted to states that have higher levels of uncompensated care, consistent with the original statutory intent. DSH payments were initially established in 1981 to account for “the situation of hospitals which serve a disproportionate number of low-income patients with special needs” (§ 1902(a)(13)(A)(iv) of the Act), and in 1993, Congress established hospital-specific limits for DSH payments based on a hospital’s overall uncompensated care costs for Medicaid-enrolled and uninsured patients.
Although hospitals can use the DSH funding that they receive for various purposes, DSH hospital executives whom we interviewed during the summer and fall of 2016 reported that DSH funds were primarily used to offset hospital uncompensated care costs. Some DSH hospitals also reported using DSH funds to support the development of particular programs for low-income patients or to improve the overall financial viability of their health system, but these uses of DSH funding are more difficult to quantify (MACPAC 2017c).
Applying reductions independent of state policy choicesIt is the Commission’s view that the development of DSH policy should be considered in terms of all
types of payments that hospitals receive. States can make a number of different types of Medicaid payments to hospitals, including base payments for services and non-DSH supplemental payments. However, from a hospital’s perspective, the total amount of Medicaid payments received is more important than the amount received from DSH or any other Medicaid payment stream.
The close relationship between state DSH payment policies and other state policy decisions was a key theme raised at an expert roundtable on the future of DSH policy that MACPAC convened in the fall of 2017. For example, California’s decision to target its DSH payments to designated public hospitals in 2005 was accompanied by increases in non-DSH supplemental payments to hospitals that were previously receiving DSH payments. The states, hospitals, and other stakeholders participating in the roundtable cautioned that large changes in state DSH funding could cause some states to reconsider their other coverage, financing, and payment policies (MACPAC 2017d).
The amounts and types of hospital uncompensated care costs are directly affected by state coverage choices. For example, hospitals in states that have expanded Medicaid report lower unpaid costs of care for uninsured individuals but higher Medicaid shortfall than hospitals in states that have not expanded Medicaid. Deemed DSH hospitals, which are statutorily required to receive DSH payments because they serve a high share of Medicaid and low-income patients, reported negative operating margins before DSH payments in both expansion and non-expansion states in 2016.6
Other factors also affect hospital uncompensated care costs. For example, policies that promote the use of high-deductible health plans may reduce the number of uninsured individuals but increase hospital bad debt expenses for patients who have insurance but are unable to pay their deductibles.7 In addition, policies to change Medicaid base payment rates affect the amount of Medicaid shortfall that hospitals report.

Chapter 1: Improving the Structure of Disproportionate Share Hospital Allotment Reductions
7Report to Congress on Medicaid and CHIP
Phasing in changes in an orderly wayBecause DSH is an important source of revenue for many safety-net hospitals, cuts in DSH funding may disrupt the services that these hospitals provide. For example, in 2016, DSH payments accounted for about 4 percent of hospital operating costs for deemed DSH hospitals. Without DSH payments, these hospitals would have reported operating margins of negative 6 percent in the aggregate. Several of the DSH hospitals that we profiled noted that if their DSH funding were reduced, they might need to cut services or staff to maintain their financial viability (MACPAC 2017c).
During our expert roundtable, which occurred one month before the FY 2018 DSH cuts had been scheduled to take effect, hospital executives reported that uncertainty about future levels of DSH funding was affecting their ability to adequately plan for the future (MACPAC 2017d).
During the summer of 2018, MACPAC interviewed state officials and stakeholders in five states to learn more about the development of Medicaid hospital payment policies, including the time needed to implement changes. Many of the new payment policies that we examined took several years to implement. For example, Louisiana’s process of converting DSH payments to increased base payment rates to providers took about 3 years, including 9 months for stakeholder consultation, 8 months for payment design, and 10 months for implementation of changes to policies, contracts, and information systems (Marks et al. 2018).
Commission RecommendationsBecause DSH allotment reductions are currently scheduled to take effect in FY 2020, the Commission focused its efforts in 2018 on assessing a range of policy options to better distribute DSH reductions assuming no further delays. We limited our analyses to changes that would be budget neutral for the federal government
and did not evaluate the question of whether the total amount of DSH funding under current law should change.
The Commission’s recommendations, rationale, and implications are described below. Additional information on the potential state-by-state effects of the recommended policy is provided in Appendix 1A of this report.
Recommendation 1.1If Congress chooses to proceed with disproportionate share hospital (DSH) allotment reductions in current law, it should revise Section 1923 of the Social Security Act to change the schedule of DSH allotment reductions to $2 billion in FY 2020, $4 billion in FY 2021, $6 billion in FY 2022, and $8 billion a year in FYs 2023–2029, in order to phase in DSH allotment reductions more gradually without increasing federal spending.
Rationale
If DSH allotment reductions take effect, phasing in DSH reductions gradually will help to mitigate disruptions for DSH hospitals by providing more time to plan for potential changes before the full amount of reductions takes effect. Phasing in reductions will also give states time to adjust other types of Medicaid hospital payment policies to account for DSH funding changes if they so choose.
The recommended DSH reduction allotment amounts reflect the Commission’s intent to change the schedule and distribution of available DSH funding without changing federal spending. Because the Congressional Budget Office (CBO) does not assume that extending reductions results in dollar-for-dollar federal savings, the amount of funding reduced in FYs 2026–2029 must be larger than the amount of DSH funding added in FYs 2020–2022 for total federal spending to remain unchanged.
Design considerations. The specific amount of reductions in each year could be calibrated to further minimize the change in federal spending based on CBO’s final estimate of the costs and

Chapter 1: Improving the Structure of Disproportionate Share Hospital Allotment Reductions
8 March 2019
savings of specific legislation. Although the Commission intended this policy to be budget-neutral, CBO estimates that this recommendation would result in federal budget savings ranging from $1.0 billion to $5.0 billion over the FY 2019–2029 budget window. Any savings from CBO’s final estimate of legislation to implement the Commission’s recommendations could be used to reduce the final amount of reductions after they are phased in or to phase in reductions more gradually.
Under current law, reductions are applied against unreduced DSH allotments, which increase annually based on inflation (Figure 1-2). DSH allotment reductions do not change the amount of this inflation-based increase even though the total amount of available DSH funding is lower. For example, under current law, the portion of inflation-based DSH allotment increases attributable to reduced DSH allotment amounts is projected to be
$297 million in FY 2023. In the scenarios below, the Commission assumed that these additional funds would be directed toward states with historically low DSH allotments, but these funds could be used for other purposes.
The Commission’s recommendation focuses on the current 10-year budget window used by CBO. In FY 2030 and subsequent years, DSH allotments would return to their higher, unreduced amount. At that time, Congress would be able to examine the early effects of DSH allotment reductions and decide how to proceed with DSH policy in the future.
Under current law, Tennessee does not have a DSH allotment for FY 2026 and beyond.8 Under the scenarios that we analyzed, we assumed that Tennessee, like other states, would be given a permanent DSH allotment that would increase annually based on inflation.9
FIGURE 1-2. Federal DSH Funding Under Various Policy Options, FYs 2019–2029 (billions)
Fede
ral D
SH fu
ndin
g (b
illio
ns)
Year
$0.0
$5.0
$10.0
$15.0
$20.0
20192020
20212022
20232024
20252026
20272028
2029
Current law Extended phase-inof reductions
Unreduced allotments
Notes: DSH is disproportionate share hospital. FY is fiscal year.
Source: MACPAC, 2019, analysis of CBO 2018 and the CMS Medicaid Budget and Expenditure System.

Chapter 1: Improving the Structure of Disproportionate Share Hospital Allotment Reductions
9Report to Congress on Medicaid and CHIP
Implications
Federal spending. CBO estimates that this policy will reduce federal spending by $1.0 billion to $5.0 billion over the FY 2020–2029 budget window.
States. Compared to current law, this policy will provide states with additional time to change state hospital payment policies in order to mitigate the full effects of DSH reductions.
Enrollees. It is difficult to predict how the change will affect enrollees because access to hospital services is also affected by how states and hospitals respond to DSH allotment reductions. However, phasing in DSH reductions may reduce the number of providers that respond to these cuts with an immediate reduction of services.
Providers. Providers will have smaller reductions in DSH funding in FYs 2020–2022, but larger reductions in FYs 2026–2028. The introduction of this phase-in period will provide more time for providers to adapt to the reduced levels of DSH funding.
Recommendation 1.2In order to minimize the effects of disproportionate share hospital (DSH) allotment reductions on hospitals that currently receive DSH payments, Congress should revise Section 1923 of the Social Security Act to require the Secretary of the U.S. Department of Health and Human Services to apply reductions to states with DSH allotments that are projected to be unspent before applying reductions to other states.
Rationale
Reducing unspent DSH funds first minimizes the amount of reductions to DSH funds that are currently paid to providers. In FY 2016, $1.2 billion in federal DSH allotments went unspent, an amount that has been relatively consistent over the past several years.10
In some states, unspent DSH funds cannot be spent because the state’s DSH allotment exceeds the total amount of hospital uncompensated care
in the state.11 In FY 2016, about half of unspent DSH allotments were attributable to four states (Connecticut, New Hampshire, New Jersey, and Pennsylvania) and the District of Columbia, all of which had FY 2016 DSH allotments (including both state and federal funds) that were larger than the total amount of hospital uncompensated care in the state reported by hospitals on 2016 Medicare cost reports.12 These states also accounted for half of unspent DSH funds in FY 2015.
Design considerations. Congress can implement this policy by changing the statutory factors that CMS uses to distribute DSH allotment reductions as opposed to changing the total amount of reductions required by statute. In the scenarios that MACPAC analyzed, we assumed that reductions would be applied to unspent DSH funding first, before distributing remaining reductions among states according to other factors in the reduction methodology.
To project unspent DSH funding in the future, we averaged unspent DSH funding for the three most recent fiscal years available (FYs 2014–2016).13 We did this because even though the share of state DSH allotments that are unspent year-to-year is relatively consistent for most states, averaging unspent funds in recent years helps smooth any year-to-year variation. We calculated unspent DSH funding using spending reported to CMS in the Medicaid Budget and Expenditure System, which records DSH spending net of any prior period adjustments.14
We did not analyze the effects of applying reductions to allotments that continue to be unspent after reductions take effect in FY 2020. It is difficult to project unspent funds in the future because they will be affected by changes in hospital uncompensated care and changes in state Medicaid payment policies. However, Congress could consider changing current law to allow unspent DSH funds to be made available to other states in a process similar to the process currently used for unspent State Children’s Health Insurance Program (CHIP) allotments.15

Chapter 1: Improving the Structure of Disproportionate Share Hospital Allotment Reductions
10 March 2019
A statutory provision that provides authority for CMS to apply DSH allotment reductions through a quarterly disallowance of DSH payments (§ 1923(f)(7)(A)(i)(II) of the Act) could be removed to help clarify that reductions to unspent DSH funding do not affect DSH payments currently made to providers. Striking this provision from the Act would not change current CMS practice: in previous rulemaking, CMS clarified that it will not recoup DSH payments through this process and that DSH allotment reductions will not necessarily result in a corresponding reduction in DSH payments if a state has unspent DSH funds (CMS 2013).
Implications
Federal spending. Applying reductions to unspent DSH funding first is likely to increase federal spending because it distributes more DSH funds to states that are likely to spend the additional amounts. CBO did not provide an estimate for this recommendation as a stand-alone policy separate from the recommendation to phase in the allotment reductions more gradually.
States. This policy will minimize the effects of reductions on states that currently spend their full DSH allotments.
Enrollees. It is difficult to predict how the change may affect enrollees because access to hospital services is also affected by how states and hospitals respond to DSH allotment reductions. However, by minimizing the effects of reductions on providers, this policy may reduce the number of providers that reduce services immediately in response to DSH reductions.
Providers. This policy will have less of an impact on providers than current law because it minimizes the effect of reductions on DSH funds that are currently spent on DSH payments to them.
Recommendation 1.3In order to reduce the wide variation in state disproportionate share hospital (DSH) allotments based on historical DSH spending, Congress
should revise Section 1923 of the Social Security Act to require the Secretary of the U.S. Department of Health and Human Services to develop a methodology to distribute reductions in a way that gradually improves the relationship between DSH allotments and the number of non-elderly low-income individuals in a state, after adjusting for differences in hospital costs in different geographic areas.
Rationale
The Commission has long held that state DSH allotments should better relate to current measures of need rather than to historical spending. Hospital uncompensated care costs are one indication of a state’s need for DSH funding, because DSH payments to an individual hospital cannot exceed a hospital’s uncompensated care costs for Medicaid-enrolled and uninsured patients. However, a state’s need for DSH funding can also be defined by its demographic characteristics. For example, when DSH payments were first established in 1981, they were intended to support hospitals that served “low-income patients with special needs” (§ 1902(a)(13)(A)(iv) of the Act).
The DSH allotment reduction methodology currently prescribed in statute is projected to preserve much of the historical variation in DSH payments. The Commission provided comments on CMS’s proposed reduction formula in August 2017 and considered recommending further changes to this methodology, but ultimately concluded that a new statutory formula was needed (MACPAC 2017b). Although CMS’s methodology incorporates some current measures of need, such as the share of a state’s population that is uninsured, it does not meaningfully improve the relationship between DSH allotments and these factors.
The Commission considered the approach of distributing DSH allotment reductions based on hospital uncompensated care costs in each state, but rejected it because of concerns about the accuracy and completeness of available data. Medicare cost reports provide data on uncompensated care costs for all hospitals in a state, but the definition of uncompensated

Chapter 1: Improving the Structure of Disproportionate Share Hospital Allotment Reductions
11Report to Congress on Medicaid and CHIP
care used does not align with the Medicaid DSH definition. In addition, stakeholders have raised concerns about the accuracy of these data (CMS 2015). Medicaid DSH audits contain more accurate information on uncompensated care costs, but they are only available for DSH hospitals and are subject to a three-year data lag.
Instead, the Commission focused its analyses on potential proxy measures for uncompensated care costs that are related to the number of people in a state who are likely to have uncompensated care costs. The Commission examined three potential measures that could be used for this purpose:
• the number of uninsured individuals;
• the number of Medicaid-enrolled and uninsured individuals; and
• the number of non-elderly low-income individuals.
Because uncompensated care costs are affected by hospital costs as well as the number of people who receive uncompensated care, we adjusted each measure based on a statewide composite of the Medicare wage index. Regardless of whether this specific wage-adjustment formula is used, the
Commission recommends that the new allotment formula account for differences in hospital costs in different geographic areas.
To evaluate each of the three potential measures, we examined each measure’s relationship to hospital uncompensated care costs and the potential effects of the policy on states that expanded Medicaid and those that did not. Based on these analyses, the Commission ruled out using the number of Medicaid enrollees and uninsured individuals because it is not well correlated with hospital uncompensated care costs and is subject to change based on state policy choices. The Commission had a robust discussion about whether allotments should be based on the number of uninsured individuals or on the number of non-elderly low-income individuals in a state, and ultimately decided to recommend using the non-elderly low-income measure.
The number of uninsured individuals and the number of non-elderly low-income individuals in a state are both factors that are moderately correlated with hospital uncompensated care costs (Table 1-1). The number of uninsured individuals
TABLE 1-1. Correlation between Potential DSH Allotment Factors and Total Hospital Uncompensated Care
Potential DSH allotment factors
Correlation to total uncompensated care reported on Medicare cost reports (CY 2016)
Correlation to uncompensated care for deemed DSH hospitals
reported on DSH audits (SFY 2014)
Number of uninsured individuals 0.87 0.68Number of Medicaid-enrolled and uninsured individuals 0.60 0.59Number of non-elderly low-income individuals 0.69 0.67
Notes: DSH is disproportionate share hospital. CY is calendar year. SFY is state fiscal year. Non-elderly low-income individuals are defined as individuals under age 65 with family incomes less than 200 percent of the federal poverty level. Medicare cost reports define uncompensated care as charity care and bad debt. Medicaid DSH audits define uncompensated care as the sum of unpaid costs of care for uninsured individuals and Medicaid shortfall. Deemed DSH hospitals are statutorily required to receive DSH payments because they serve a high share of Medicaid and low-income patients. Correlations between measures and levels of uncompensated care are represented by Pearson’s correlation coefficient. A coefficient of 0 represents no linear correlation and a coefficient of 1 represents a perfect linear correlation. Potential DSH allotment factors were adjusted to account for differences in labor costs in different geographic areas using a statewide composite of the Medicare wage index. CY 2016 data for the factors were compared to uncompensated care reported on 2016 Medicare cost reports, and CY 2014 data for the factors were compared to uncompensated care reported on SFY 2014 DSH audits.
Source: MACPAC, 2019, analysis of Census 2019, CMS 2018a, CMS-64 enrollment data for quarter ending September 30, 2016 as of September 18, 2018, 2014 as-filed DSH audits, and Medicare cost reports.
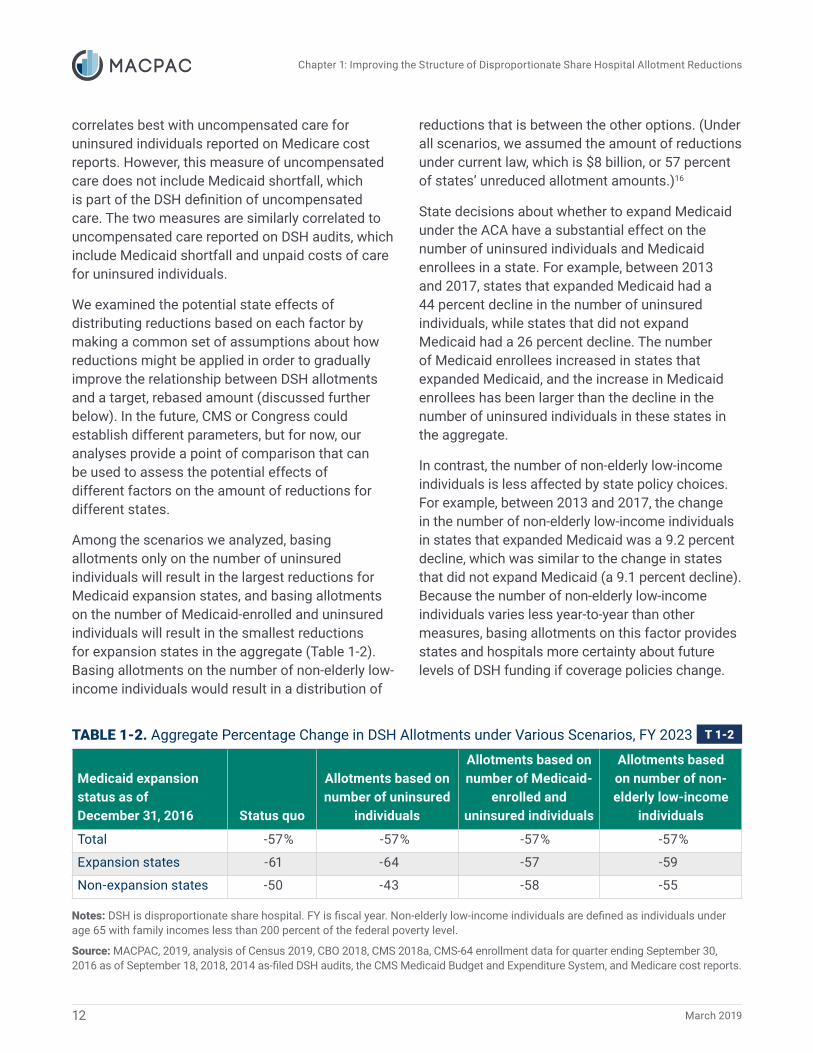
Chapter 1: Improving the Structure of Disproportionate Share Hospital Allotment Reductions
12 March 2019
correlates best with uncompensated care for uninsured individuals reported on Medicare cost reports. However, this measure of uncompensated care does not include Medicaid shortfall, which is part of the DSH definition of uncompensated care. The two measures are similarly correlated to uncompensated care reported on DSH audits, which include Medicaid shortfall and unpaid costs of care for uninsured individuals.
We examined the potential state effects of distributing reductions based on each factor by making a common set of assumptions about how reductions might be applied in order to gradually improve the relationship between DSH allotments and a target, rebased amount (discussed further below). In the future, CMS or Congress could establish different parameters, but for now, our analyses provide a point of comparison that can be used to assess the potential effects of different factors on the amount of reductions for different states.
Among the scenarios we analyzed, basing allotments only on the number of uninsured individuals will result in the largest reductions for Medicaid expansion states, and basing allotments on the number of Medicaid-enrolled and uninsured individuals will result in the smallest reductions for expansion states in the aggregate (Table 1-2). Basing allotments on the number of non-elderly low-income individuals would result in a distribution of
reductions that is between the other options. (Under all scenarios, we assumed the amount of reductions under current law, which is $8 billion, or 57 percent of states’ unreduced allotment amounts.)16
State decisions about whether to expand Medicaid under the ACA have a substantial effect on the number of uninsured individuals and Medicaid enrollees in a state. For example, between 2013 and 2017, states that expanded Medicaid had a 44 percent decline in the number of uninsured individuals, while states that did not expand Medicaid had a 26 percent decline. The number of Medicaid enrollees increased in states that expanded Medicaid, and the increase in Medicaid enrollees has been larger than the decline in the number of uninsured individuals in these states in the aggregate.
In contrast, the number of non-elderly low-income individuals is less affected by state policy choices. For example, between 2013 and 2017, the change in the number of non-elderly low-income individuals in states that expanded Medicaid was a 9.2 percent decline, which was similar to the change in states that did not expand Medicaid (a 9.1 percent decline). Because the number of non-elderly low-income individuals varies less year-to-year than other measures, basing allotments on this factor provides states and hospitals more certainty about future levels of DSH funding if coverage policies change.
TABLE 1-2. Aggregate Percentage Change in DSH Allotments under Various Scenarios, FY 2023
Medicaid expansion status as of December 31, 2016 Status quo
Allotments based on number of uninsured
individuals
Allotments based on number of Medicaid-
enrolled and uninsured individuals
Allotments based on number of non-elderly low-income
individuals
Total -57% -57% -57% -57%
Expansion states -61 -64 -57 -59
Non-expansion states -50 -43 -58 -55
Notes: DSH is disproportionate share hospital. FY is fiscal year. Non-elderly low-income individuals are defined as individuals under age 65 with family incomes less than 200 percent of the federal poverty level.
Source: MACPAC, 2019, analysis of Census 2019, CBO 2018, CMS 2018a, CMS-64 enrollment data for quarter ending September 30, 2016 as of September 18, 2018, 2014 as-filed DSH audits, the CMS Medicaid Budget and Expenditure System, and Medicare cost reports.

Chapter 1: Improving the Structure of Disproportionate Share Hospital Allotment Reductions
13Report to Congress on Medicaid and CHIP
It is important to note that insurance status will continue to be a factor in other aspects of DSH policy. For example, hospital unpaid costs of care for uninsured individuals affect the total amount of DSH payments that an individual hospital can receive, and many states use this measure as a factor for determining how DSH funds are distributed within a state.17
Design considerations. To estimate the state-level effects of this recommendation, we made several assumptions about how reductions might be applied to gradually improve the relationship between DSH allotments and the number of non-elderly low-income individuals in a state. (More details about the specific assumptions that we used to estimate the effects of different scenarios are included in Appendix 1B of this report.) However, the Commission is not recommending specific parameters for this policy. Different parameters would change the effects of reductions on particular states, but the total amount of reductions would stay the same because the total amount of DSH allotment reductions is fixed.
In our analyses, we defined low-income as having a family income of less than 200 percent of the federal poverty level (FPL), which is the definition of low-income currently used in the CHIP statute (§ 2110(c)(4) of the Act).18 The majority of uninsured individuals have family incomes below 200 percent FPL and more than two-thirds of non-elderly low-income individuals are uninsured or enrolled in Medicaid or other public coverage (Berchick et al. 2018). We used American Community Survey (ACS) five-year estimates because they are more accurate than the ACS one-year estimates, thus reducing the possibility of changes due to normal statistical variation (Census 2018).
To improve the relationship between DSH allotments and the number of non-elderly low-income individuals in a state, we assumed that states would receive reductions to their DSH allotments based on how their unreduced allotments compared to a target, fully rebased allotment amount. We also assumed that states
with allotments below the rebased amount would receive small increases to their allotments equal to the portion of inflation-based DSH allotment increases that are attributable to allotment reductions (discussed as a design consideration for Recommendation 1.1, above).
To minimize disruption for states with allotments above the rebased amount, we assumed upper bounds on the amount of reductions as well as on the amount of increases that a state could receive each year. CMS’s current reduction formula establishes an upper bound of a 90 percent reduction in DSH payments, but to ensure that reductions are phased in more gradually, we assumed a maximum reduction amount of 30 percent per year. To mitigate the costs of applying an upper bound on DSH allotment reductions, we assumed a 5 percent upper bound on increases to DSH allotments and applied any excess reductions to unspent DSH allotments below the rebased amount.
The upper and lower bounds affect the overall pace of rebasing. Under the approach we analyzed, 26 states would have allotments within 10 percent of the rebased amount by FY 2023. By FY 2029, 45 states and the District of Columbia would have allotments within 10 percent of the rebased amount.
The details of the reduction methodology could be specified in statute or delegated to CMS to define, through regulation within statutorily defined parameters. The rulemaking process would give CMS the opportunity to solicit comments from stakeholders on the specific details of the reduction methodology. However, because DSH allotment reductions are scheduled to take effect in FY 2020, which begins October 1, 2019, the amount of time CMS has to finalize a new regulation is shorter than the amount of time CMS had to finalize the DSH allotment reduction methodology after the passage of the ACA.
Implications
Federal spending. CBO did not estimate this recommendation as a stand-alone policy separate from the recommendations to phase in the

Chapter 1: Improving the Structure of Disproportionate Share Hospital Allotment Reductions
14 March 2019
allotment reductions more gradually and to apply the allotment reductions first to states that would not be projected to spend their entire allotments.
States. Compared to current law, this policy will result in larger DSH allotment reductions for states with above average DSH allotments per non-elderly low-income individual and smaller reductions for states with below-average DSH allotments per non-elderly low-income individual. This policy does not change the total amount of reductions for all states.
Enrollees. It is difficult to predict how the change may affect enrollees because access to hospital services is also affected by how states and hospitals respond to DSH allotment reductions. The proposed rebasing policy does not change the total amount of reductions but it changes which states are most affected.
Providers. This policy will affect providers differently based on their states, but the total amount of reductions in DSH funding is unchanged. We project that most states will be able to continue to make the same amount of DSH payments to deemed DSH hospitals as under current law if they target remaining DSH funds to these providers.
State-by-State EffectsBelow we review the estimated effects of the recommendations relative to current law and total Medicaid hospital spending when allotment reductions are fully phased in during FY 2023. Complete information about the state-by-state effects is provided in Appendix 1A of this report. More information about the assumptions we used to estimate how CMS might apply reductions to gradually improve the relationship between DSH allotments and the number of non-elderly low-income individuals in a state are described in Appendix 1B of this report.
Recommendations compared to current lawCompared to current law, our recommendations result in larger DSH allotment reductions for states with unspent DSH funding. For example, in FY 2023, the total DSH allotment reductions for states with more than 50 percent of their DSH allotment unspent is projected to be $617 million, which is about twice as much as the amount of reductions for these states projected under current law ($327 million). However, the net effect on DSH payments to providers in these states will be smaller than the cut to DSH allotments, because these states were not previously spending their full DSH allotment.
The recommendations also result in smaller reductions for states with low ratios of DSH allotments per non-elderly low-income individual. For example, total DSH funding for states with a ratio of allotments per non-elderly low-income individual below 50 percent of the national average is projected to be almost twice as large under the proposed policy as under the status quo in FY 2023 ($597 million for the status quo versus $1.0 billion under the proposed policy). States that are statutorily designated as low-DSH states also receive small reductions under CMS’s current methodology, but states that receive the biggest percentage point increase in DSH funding under the recommended policy relative to the status quo are those that have low ratios of DSH allotments per non-elderly low-income individual but do not meet the current definition of a low-DSH state (e.g., Arizona, Florida, and Virginia).
Reductions relative to total Medicaid hospital spendingThe Commission’s recommendations assume the same level of funding as under current law, but it is important to consider DSH funding in the context of total Medicaid hospital spending. In FY 2023, the total amount of reductions scheduled is $8 billion, which is more than half of state DSH allotments, but only 5 percent of total projected Medicaid hospital spending.

Chapter 1: Improving the Structure of Disproportionate Share Hospital Allotment Reductions
15Report to Congress on Medicaid and CHIP
Notes: DSH is disproportionate share hospital. FY is fiscal year. Reductions in DSH spending exclude reductions applied to unspent DSH funding. Non-elderly low-income individuals are defined as individuals under age 65 with family incomes less than 200 percent of the federal poverty level. Total Medicaid hospital spending includes fee-for-service base payments, supplemental payments, and an estimate of managed care payments to hospitals. The number of states includes the District of Columbia.
Source: MACPAC, 2019, analysis of Census 2019, CBO 2018, CMS 2018a, OACT 2018, 2014 as-filed DSH audits, and the CMS Medicaid Budget and Expenditure System.
FIGURE 1-3. Projected Reduction in State DSH Spending as a Share of Total Medicaid Hospital Spending under MACPAC Recommendations, FY 2023
Num
ber o
f sta
tes
Projected reduction in state DSH spending as a share of total hospital spending, FY 2023
0
5
10
15
20
25
Less than 1% 1% – 4% 5% – 9% 10% or more
More than 50% below average
Within 50% of average
More than 50% above average
State ratio of DSH allotment per non-elderly low-income individual as a share of the national average (before reductions)
ArizonaArkansasDelawareFloridaHawaiiIdahoIowaMontanaNevadaNew MexicoN. DakotaOklahomaOregonS. DakotaTennesseeUtahVirginiaWyoming
CaliforniaColoradoIllinoisKansasKentuckyMichiganNebraskaN. CarolinaVermontW. Virginia
GeorgiaIndianaMassachusettsMississippiOhioTexasWashington
AlabamaLouisianaMissouriNew HampshireNew JerseyRhode IslandS. Carolina
District of ColumbiaNew YorkPennsylvania
ConnecticutMaine
AlaskaMarylandMinnesotaWisconsin
Under the Commission’s recommendations, 34 states are projected to have DSH payment reductions that are less than 5 percent of total Medicaid hospital spending, including all states with ratios of DSH allotments per non-elderly low-income individual less than 50 percent of the national average (Figure 1-3). These states include all 17 states that are statutorily designated as low-
DSH states because they had low levels of DSH spending relative to other states in FY 2000. An additional 17 states that do not meet the definition of low-DSH states are also projected to have DSH payment reductions that are less than 5 percent of total Medicaid hospital spending because they have relatively low ratios of DSH allotments per non-elderly low-income individual.

Chapter 1: Improving the Structure of Disproportionate Share Hospital Allotment Reductions
16 March 2019
Seven states are projected to have reductions in DSH spending greater than or equal to 10 percent of their total Medicaid hospital spending in FY 2023 (Table 1-3). All of these states are projected to receive reductions up to the upper limit that we assumed in our analysis (30 percent per year, which is a 76 percent cumulative reduction by FY 2023) because they have particularly high DSH allotments relative to the number of non-elderly low-income individuals in their state. Among these states, Alabama and Rhode Island are projected to have FY 2023 DSH reductions that are smaller than under current law, while other states in this group are projected to have larger reductions than under current law.
Some states may be able to offset some of the effects of DSH allotment reductions by increasing other types of Medicaid payments to hospitals (Box 1-1). For example, Rhode Island reported $145 million in Medicaid shortfall for DSH hospitals
in state fiscal year 2014, which is more than the $119 million reduction in DSH spending for Rhode Island projected in FY 2023 under the Commission’s recommendations (state and federal funds combined). States could also minimize the effects of reductions on particular types of hospitals, such as deemed DSH hospitals, by targeting remaining DSH funds to them rather than broadly distributing DSH payments to all hospitals in the state. However, these types of changes could take several years for states to implement and may be difficult to finance if states have to change the source of non-federal share used for these payments.
Louisiana is currently in the process of shifting $379 million in DSH payments to base rate increases for hospitals (an amount equal to 12 percent of total hospital payments in FY 2016). This policy is intended to reduce the state’s reliance on supplemental payments because base payments are more closely tied to services that are provided
TABLE 1-3. Characteristics of States with Projected Reductions in DSH Payments Greater Than or Equal To 10 Percent of Medicaid Hospital Spending under MACPAC Recommendations, FY 2023
State
Projected reduction in DSH spending, millions (percent of total Medicaid hospital spending) Medicaid shortfall
for DSH hospitals, millions (SPRY 2014)
Share of DSH payments to deemed
DSH hospitals(SPRY 2014)Current law
MACPAC recommendations
Alabama $416 (15%) $412 (14%) $124 6%Louisiana1 662 (14) 1,009 (21) 525 73Missouri 448 (10) 604 (13) –2 49New Hampshire –3 109 (15) N/A3 23New Jersey 719 (12) 970 (16) 393 82Rhode Island 137 (12) 119 (10) 145 17South Carolina 349 (14) 442 (17) 164 39
Notes: DSH is disproportionate share hospital. FY is fiscal year. SPRY is state plan rate year. N/A is not applicable. Total Medicaid hospital spending includes fee-for-service base payments, supplemental payments, and an estimate of managed care payments to hospitals.
– Dash indicates zero.1 Louisiana is currently planning to reduce DSH spending by $379 million in 2019 and shift these funds to base-rate increases for hospitals. This change in policy is not reflected in the estimates of projected reductions in DSH spending above.2 Missouri did not report any Medicaid shortfall in the aggregate on its SPRY 2014 DSH audit.3 Under current law, the projected reduction in DSH payments for New Hampshire is less than the amount of DSH funding that is projected to be unspent, so we do not project a reduction in DSH payments to providers.
Source: MACPAC, 2019, analysis of Census 2019, CBO 2018, CMS 2018a, OACT 2018, 2014 as-filed DSH audits, and the CMS Medicaid Budget and Expenditure System.

Chapter 1: Improving the Structure of Disproportionate Share Hospital Allotment Reductions
17Report to Congress on Medicaid and CHIP
BOX 1-1. Types of Medicaid Payments Used to Pay for Costs of Care Provided to Medicaid-Enrolled Patients
States make a number of different types of payments to hospitals and have broad flexibility to design their own payment methods. However, each type of Medicaid payment is subject to its own unique rules and limitations. Common types of Medicaid payments to hospitals include:
Base payments. In fee-for-service (FFS) and managed care delivery systems, base payments pay for specific services provided to Medicaid enrollees. Different base rates can be applied for different types of hospitals, but ultimately, payments are based on Medicaid utilization and delivery of services.
Upper payment limit (UPL) payments. UPL payments are lump-sum supplemental payments that are intended to fill in the difference between FFS base payments and the amount that Medicare would have paid for the same service (See note). States can make additional UPL payments to providers as long as aggregate FFS payments to a class of providers is below a reasonable estimate of the amount that Medicare would have paid.
Directed payments. In managed care, states can direct plans to use a portion of their capitation rate to increase payments to providers. Directed payments must be based on utilization and delivery of services, distributed based on the same terms for all providers in a class, and advance at least one of the goals in the state’s quality strategy. Directed payments also cannot be contingent on the provider’s willingness to provide intergovernmental transfer financing.
Disproportionate share hospital (DSH) payments. DSH payments are statutorily required payments for hospitals that serve a high share of Medicaid-enrolled and low-income patients. DSH payments to an individual hospital cannot exceed the hospital’s uncompensated care costs, defined as the sum of Medicaid shortfall and hospital unpaid costs of care for uninsured patients.
Additional information on all types of Medicaid payments to hospitals is provided in MACPAC’s issue brief, Medicaid Base and Supplemental Payments to Hospitals (MACPAC 2019). Additional information on UPL payments is provided in Chapter 2 of this report.
Note: Although the term UPL payments is not defined in statute or regulation, we use this term to distinguish supplemental payments that are subject to the UPL from those that are not, such as DSH payments and supplemental payments authorized under Section 1115 demonstrations.
to Medicaid enrollees. Although Louisiana plans to make the same total amount of payments to hospitals under the new policy, some stakeholders we spoke with during the summer of 2018 were concerned that the distribution of payments might change. DSH payments in the state are distributed based on hospital uncompensated care costs, while base payments are distributed based on Medicaid utilization (Marks et al. 2018).
In SPRY 2014, about $2.4 billion in DSH payments (14 percent of total DSH payments) were made to institutions for mental diseases (IMDs), which are eligible to receive Medicaid payment for services provided to individuals age 21–64 only under limited circumstances. IMD services for Medicaid-eligible patients that cannot otherwise be paid for by Medicaid are reported as uncompensated care costs for Medicaid DSH purposes. Medicaid

Chapter 1: Improving the Structure of Disproportionate Share Hospital Allotment Reductions
18 March 2019
managed care organizations can make payments for some services provided to these individuals under the in-lieu of services provision (42 CFR 438.6(e)). CMS has recently expanded opportunities for states to pay for IMD services using Section 1115 waiver authority. These policies may reduce the amount of uncompensated care that these facilities report in the future (CMS 2018b).
Next StepsIf DSH allotment reductions take effect as scheduled, the Commission will monitor the effects of these reductions on states, providers, and enrollees. While we know that DSH funds are an important source of revenue for many safety-net hospitals, little information is available to suggest how states and hospitals will respond.
Because some states may respond to DSH allotment reductions by changing other Medicaid payments to hospitals, we will continue to examine Medicaid hospital payments holistically. The Commission has outlined a long-term hospital payment work plan that will consider all types of Medicaid payments to hospitals in relation to the statutory goals of efficiency, economy, quality, and access (MACPAC 2018).
Endnotes1 Chapter 3 of MACPAC’s March 2017 report reviews approaches for improving the targeting of DSH payments to providers (MACPAC 2017a).
2 The total amount of DSH payments increased from $1.3 billion in 1990 to $17.7 billion in 1992 (Holahan et al. 1998).
3 Additional information about the factors in CMS’s current DSH allotment reduction methodology is provided in Chapter 3 of this report.
4 Low-DSH states are defined in statute as states with FY 2000 DSH expenditures that were less than 3 percent of total
state Medicaid medical assistance expenditures for FY 2000. CMS’s reduction methodology allocates a smaller proportion of the total DSH allotment reductions to low-DSH states.
5 To implement DSH allotment reductions under current law, CMS would need to finalize its 2017 DSH reduction rule or propose a new rule to finalize its methodology.
6 In 2016, operating margins for deemed DSH hospitals in expansion states were negative 9.2 percent before DSH payments, and operating margins for deemed DSH hospitals in non-expansion states were negative 1.2 percent before DSH payments. Deemed DSH hospitals in expansion states also reported lower operating margins before DSH payments in 2013 (negative 8.5 percent) than deemed DSH hospitals in non-expansion states (negative 1.2 percent). Additional information about hospital margins and the limits of available data are provided in Chapter 3 of this report.
7 Bad debt expenses are expected payment amounts that a hospital is not able to collect from patients who, according to the hospital’s determination, have the financial capacity to pay. Bad debt for individuals with insurance is not included in the Medicaid DSH definition of uncompensated care.
8 Under current law, the DSH allotment for Tennessee is fixed in statute at $53.1 million until FY 2025 and then returns to $0 in FY 2026. Tennessee does not have a permanent DSH allotment under current law because the state used its DSH funding in the budget neutrality calculations of its Section 1115 waiver when DSH limits were first established.
9 The ACA made a similar change for Hawaii, which previously did not have a permanent DSH allotment for the same reasons as Tennessee.
10 Our analysis excludes unspent DSH funding that is reported for California and Massachusetts ($1.2 billion total) because these states use their DSH allotment in the budget neutrality assumptions in their Section 1115 waivers. Although DSH allotments for these states are reported as unspent in the CMS Medicaid Budget and Expenditure System (MBES), we treated these funds as spent in our analyses. In our analyses, we did not apply any other special adjustments for states that use DSH funding in the budget neutrality assumptions for their Section 1115 waivers.
Chapter 1: Improving the Structure of Disproportionate Share Hospital Allotment Reductions
19Report to Congress on Medicaid and CHIP
11 By law, DSH payments to an individual hospital cannot exceed that hospital’s level of uncompensated care.
12 Medicare cost reports define uncompensated care as charity care and bad debt, including uncompensated care for individuals with insurance, which is not part of the Medicaid DSH definition of uncompensated care. Medicare cost reports do not include reliable information on Medicaid shortfall, which is part of the DSH definition of uncompensated care.
13 In general, states have up to two years to spend DSH funds from their allotment for a given year. However, in some circumstances, states may withhold DSH funds and make DSH payments at a later date. For example, Texas withheld 3.5 percent of all DSH payments beginning in FY 2014 pending the outcome of litigation related to the calculation of Medicaid shortfall for DSH audits (HMA 2016).
14 For example, if DSH payments to a hospital were recouped as a result of the findings of a state’s DSH audit, these recouped funds would be reported as a prior period adjustment and would be reported as unspent in the CMS MBES.
15 For additional information about the process for allocating unspent funds in CHIP, see MACPAC’s issue brief, Federal CHIP funding: When Will States Exhaust Allotments? (MACPAC 2017e).
16 These scenarios also assume implementation of MACPAC’s other recommendations to phase in reductions gradually and to apply reductions to unspent DSH funding first. Additional information about the methodology used to estimate DSH allotment reductions under various scenarios is provided in Appendix 1B of this report.
17 Based on MACPAC’s review of state DSH targeting policies in 2016, about half of states (24) distributed DSH payments based on hospital uncompensated costs (MACPAC 2017a).
18 The current federal poverty measure does not account for differences in cost of living in different geographic areas, but the U.S. Census Bureau does not regularly report state-level data that can be used to make this adjustment. For example, the U.S. Census Bureau calculates a supplemental poverty measure annually that considers the costs of food, clothing, shelter, and utilities in different geographic areas, but these data are not reported at the state level (Fox 2018).
19 To implement DSH allotment reductions that were initially scheduled to take effect October 1, 2013, CMS issued a proposed rule in September 2013 and a final rule in September 2014.
ReferencesBerchick, E., E.R. Hood, and J.C. Barnett. 2018. Health insurance coverage in the United States: 2017. Current population reports, P60-264. Washington, DC: U.S. Government Printing Office. https://www.census.gov/content/dam/Census/library/publications/2018/demo/p60-264.pdf.
Centers for Medicare & Medicaid Services (CMS), U.S. Department of Health and Human Services. 2018a. FY 2019 IPPS final rule homepage. Baltimore, MD: CMS. https://www.cms.gov/Medicare/Medicare-Fee-for-Service-Payment/AcuteInpatientPPS/FY2019-IPPS-Final-Rule-Home-Page.html.
Centers for Medicare & Medicaid Services (CMS), U.S. Department of Health and Human Services. 2018b. Letter from Mary Mayhew to state Medicaid directors regarding “Opportunities to design innovative service delivery systems for adults with a serious mental illness or children with a serious emotional disturbance.” November 13, 2018. https://www.medicaid.gov/federal-policy-guidance/downloads/smd18011.pdf.
Centers for Medicare & Medicaid Services (CMS), U.S. Department of Health and Human Services. 2017. Medicaid program: State disproportionate share hospital allotment reductions. Proposed rule. Federal Register 82, no. 144 (July 28): 33155–35171. https://www.federalregister.gov/d/2017-15962.
Centers for Medicare & Medicaid Services (CMS), U.S. Department of Health and Human Services. 2013. Medicaid program: State disproportionate share hospital allotment reductions. Final rule. Federal Register 78, no. 181 (September 18): 57293–57313. https://www.federalregister.gov/a/2013-22686.
Centers for Medicare & Medicaid Services (CMS), U.S. Department of Health and Human Services. 2015. Medicare program: Hospital inpatient prospective payment systems

Chapter 1: Improving the Structure of Disproportionate Share Hospital Allotment Reductions
20 March 2019
for acute care hospitals and the long-term care hospital prospective payment system policy changes and fiscal year 2016 rates; revisions of quality reporting requirements for specific providers, including changes related to the electronic health record incentive program; extensions of the Medicare-dependent, small rural hospital program and the low-volume payment adjustment for hospitals. Final rule. Federal Register 80, no. 158 (August 17): 49325–49886. https://www.federalregister.gov/d/2015-19049.
Congressional Budget Office (CBO). 2018. An update to the economic outlook: 2018 to 2028. Washington, DC: CBO. https://www.cbo.gov/publication/54318.
Fox, L. 2018. The supplemental poverty measure: 2017. Current population reports, P60-265. Suitland, MD: U.S. Census Bureau. https://www.census.gov/library/publications/2018/demo/p60-265.html.
Health Management Associates (HMA). 2016. Evaluation of uncompensated care and Medicaid payments in Texas hospitals and the role of Texas’ uncompensated care pool. Austin, TX: Texas Health and Human Services Commission. https://hhs.texas.gov/reports/2016/08/evaluation-uncompensated-care-medicaid-payments-texas-hospitals-role-texas-uc-pool.
Holahan, J., B.K. Bruen, and D. Liska. 1998. The decline in Medicaid spending growth in 1996: Why did it happen? Washington, DC: Urban Institute. http://webarchive.urban.org/UploadedPDF/410365.pdf.
Marks, T., K. Gifford, S. Perlin, et al. 2018. Factors affecting the development of Medicaid hospital payment policies: Findings from structured interviews in five states. Final report to the Medicaid and CHIP Payment and Access Commission. Washington, DC: Health Management Associates. https://www.macpac.gov/publication/factors-affecting-the-development-of-medicaid-hospital-payment-policies-findings-from-structured-interviews-in-five-states.
Medicaid and CHIP Payment and Access Commission (MACPAC). 2019. Medicaid base and supplemental payments to hospitals. Washington, DC: MACPAC. https://www.macpac.gov/publication/medicaid-base-and-supplemental-payments-to-hospitals/.
Medicaid and CHIP Payment and Access Commission (MACPAC). 2018. Medicaid hospital payment: Policy issues and Commission analytic plan. Washington, DC: MACPAC. https://www.macpac.gov/publication/medicaid-hospital-payment-policy-issues-and-commission-analytic-plan/.
Medicaid and CHIP Payment and Access Commission (MACPAC). 2017a. Chapter 3: Improving the targeting of disproportionate share hospital payments to providers. In Report to Congress on Medicaid and CHIP. March 2017. Washington, DC: MACPAC. https://www.macpac.gov/publication/improving-the-targeting-of-disproportionate-share-hospital-payments-to-providers/.
Medicaid and CHIP Payment and Access Commission (MACPAC). 2017b. Letter from Penny Thompson to Thomas E. Price regarding “CMS-2394-P Medicaid program: Disproportionate share hospital allotment reductions.” August 28, 2017. https://www.macpac.gov/publication/comments-on-proposed-dsh-reduction-rule/.
Medicaid and CHIP Payment and Access Commission (MACPAC). 2017c. Profiles of disproportionate share hospitals. Washington, DC: MACPAC. https://www.macpac.gov/publication/profiles-of-disproportionate-share-hospitals/.
Medicaid and CHIP Payment and Access Commission (MACPAC). 2017d. Themes from expert roundtable on DSH payments and next steps for MACPAC work. October 2017. Washington, DC: MACPAC. https://www.macpac.gov/publication/themes-from-expert-roundtable-on-dsh-payments-and-next-steps-for-macpac-work/.
Medicaid and CHIP Payment and Access Commission (MACPAC). 2017e. Federal CHIP funding: When will states exhaust allotments. July 2017. Washington, DC: MACPAC. https://www.macpac.gov/publication/federal-chip-funding-when-will-states-exhaust-allotments/.
Office of the Actuary (OACT), Centers for Medicare & Medicaid Services, U.S. Department of Health and Human Services. 2018. National health expenditures historical and projections: 1960–2026. Baltimore, MD: OACT.

Chapter 1: Improving the Structure of Disproportionate Share Hospital Allotment Reductions
21Report to Congress on Medicaid and CHIP
https://www.cms.gov/Research-Statistics-Data-and-Systems/Statistics-Trends-and-Reports/NationalHealthExpendData/NationalHealthAccountsProjected.html.
U.S. Census Bureau (Census). 2019. American Community Survey. Suitland, MD: Census. https://factfinder.census.gov.
U.S. Census Bureau (Census). 2018. American community survey: When to use 1-year, 3-year, or 5-year estimates. September 6. Suitland, MD: Census. https://www.census.gov/programs-surveys/acs/guidance/estimates.html.

Commission Vote on Recommendations
22 March 2019
Commission Vote on RecommendationsIn its authorizing language in the Social Security Act (42 USC 1396), Congress requires MACPAC to review Medicaid and CHIP program policies and make recommendations related to those policies to Congress, the Secretary of the U.S. Department of Health and Human Services, and the states in its reports to Congress, which are due by March 15 and June 15 of each year. Each Commissioner must vote on each recommendation, and the votes for each recommendation must be published in the reports. The recommendations included in this report, and the corresponding voting record below, fulfill this mandate.
Per the Commission’s policies regarding conflicts of interest, the Commission’s conflict of interest committee convened prior to the vote to review and discuss whether any conflicts existed relevant to the recommendations on improving the structure of disproportionate share hospital allotment reductions. It determined that, under the particularly, directly, predictably, and significantly standard that governs its deliberations, no Commissioner has an interest that presents a potential or actual conflict of interest.
The Commission voted on the recommendations in this chapter on January 24, 2019, voting on all three recommendations as one package.
Improving the Structure of Disproportionate Share Hospital Allotment Reductions1.1 If Congress chooses to proceed with disproportionate share hospital (DSH) allotment reductions in
current law, it should revise Section 1923 of the Social Security Act to change the schedule of DSH allotment reductions to $2 billion in FY 2020, $4 billion in FY 2021, $6 billion in FY 2022, and $8 billion a year in FYs 2023–2029, in order to phase in DSH allotment reductions more gradually without increasing federal spending.
1.2 In order to minimize the effects of disproportionate share hospital (DSH) allotment reductions on hospitals that currently receive DSH payments, Congress should revise Section 1923 of the Social Security Act to require the Secretary of the U.S. Department of Health and Human Services to apply reductions to states with DSH allotments that are projected to be unspent before applying reductions to other states.
1.3 In order to reduce the wide variation in state disproportionate share hospital (DSH) allotments based on historical DSH spending, Congress should revise Section 1923 of the Social Security Act to require the Secretary of the U.S. Department of Health and Human Services to develop a methodology to distribute reductions in a way that gradually improves the relationship between DSH allotments and the number of non-elderly low-income individuals in a state, after adjusting for differences in hospital costs in different geographic areas.
Yes: Bella, Burwell, Carter, Cerise, Davis, Douglas, George, Gorton, Lampkin, Milligan, Retchin, Scanlon, Szilagyi, Thompson, Weil, Weno
No: Gordon
1610
YesNoNot voting

Chapter 1: APPENDIX 1A
23Report to Congress on Medicaid and CHIP
APPENDIX 1A: State-Level DataTABLE 1A-1. State-Level Factors in Recommended DSH Allotment Reduction Formula
State
Average share of DSH allotment unspent (FYs 2014–2016)
Number of non-elderly low-income individuals, millions
(CYs 2013–2017)
Statewide composite of the Medicare wage index
(FY 2019)
Total 9% 88.9 N/A Alabama 0 1.6 0.8Alaska 50 0.2 1.2Arizona 0 2.2 1.1Arkansas 20 1.0 0.8California ―1 11.5 1.4Colorado 0 1.3 1.0Connecticut 67 0.7 1.3Delaware 20 0.2 1.1District of Columbia 10 0.2 1.0Florida 3 6.0 0.9Georgia 0 3.3 0.9Hawaii 56 0.3 1.3Idaho 0 0.5 0.9Illinois 3 3.3 1.0Indiana 11 1.9 1.0Iowa 37 0.7 0.9Kansas 0 0.8 0.9Kentucky 0 1.4 0.9Louisiana 3 1.6 0.8Maine 74 0.3 1.0Maryland 32 1.1 1.0Massachusetts ―1 1.3 1.4Michigan 10 2.8 1.0Minnesota 66 1.2 1.1Mississippi 0 1.1 0.8Missouri 13 1.7 0.9Montana 0 0.3 1.0Nebraska 16 0.5 0.9Nevada 0 0.9 1.1New Hampshire 65 0.2 1.1New Jersey 19 1.8 1.2New Mexico 2 0.8 0.9New York 0 5.2 1.2

Chapter 1: APPENDIX 1A
24 March 2019
TABLE 1A-1. (continued)
State
Average share of DSH allotment unspent (FYs 2014–2016)
Number of non-elderly low-income individuals, millions
(CYs 2013–2017)
Statewide composite of the Medicare wage index
(FY 2019)
North Carolina 1% 3.1 0.9North Dakota 91 0.2 1.0Ohio 0 3.2 0.9Oklahoma 30 1.2 0.9Oregon 1 1.2 1.2Pennsylvania 24 3.0 1.0Rhode Island 0 0.2 1.1South Carolina 1 1.5 0.9South Dakota 93 0.2 1.0Tennessee 3 2.1 0.8Texas 4 8.7 0.9Utah 3 0.8 1.0Vermont 14 0.1 1.0Virginia 27 1.8 0.9Washington 7 1.7 1.1West Virginia 28 0.6 0.8Wisconsin 68 1.4 1.0Wyoming 1 0.1 1.0
Notes: FY is fiscal year. CY is calendar year. N/A is not applicable. Non-elderly low-income individuals are defined as individuals under age 65 with family incomes less than 200 percent of the federal poverty level. The statewide Medicare wage index was developed based on a weighted average of each hospital’s final Medicare wage index and the number of provider hours used in the hospital’s wage index calculation.
― Dash indicates zero; 0% indicates a non-zero amount less than 0.5 percent that rounds to zero.1 We considered DSH funding for California and Massachusetts to be fully spent in our analysis because these states use their DSH allotment in the budget neutrality assumptions in their Section 1115 waivers.
Source: MACPAC, 2019, analysis of Census 2019, CMS 2018a, and the CMS Medicaid Budget and Expenditure System.

Chapter 1: A
PPEND
IX 1A
25Report to C
ongress on Medicaid and C
HIP
TABLE 1A-2. DSH Allotment Changes under Status Quo and MACPAC Recommendations, FY 2023 (federal funds, millions)
State
Unreduced allotment amount
Status quoMACPAC
recommendations Percentage point change in DSH reductions (Recommended
policy minus status quo)
Average share of DSH
allotment unspent
(FYs 2014–2016)
Unreduced DSH allotment per
non-elderly low-income individual (wage adjusted) as a share of the national average
Dollar change
Percent change
Dollar change
Percent change
Total $13,925 -$8,000 -57% -$8,000 -57% ― 9% 100%Alabama 390 -299 -77 -297 -76 1% 0 210Alaska 26 -4 -14 -13 -50 -36 50 84Arizona 129 -73 -57 17 13 70 0 37Arkansas 55 -14 -26 -7 -13 13 20 44California 1,391 -728 -52 -330 -24 29 ―1 56Colorado 117 -58 -50 -33 -28 21 0 59Connecticut 254 -139 -55 -197 -78 -23 67 191Delaware 11 -2 -17 1 10 27 20 32District of Columbia 78 -51 -65 -61 -78 -13 10 298Florida 254 -134 -53 50 20 73 3 31Georgia 341 -147 -43 -154 -45 -2 0 78Hawaii 12 -2 -13 -1 -12 1 56 23Idaho 21 -3 -15 4 21 37 0 28Illinois 273 -106 -39 -60 -22 17 3 54Indiana 271 -155 -57 -153 -56 1 11 98Iowa 50 -8 -16 -13 -27 -11 37 48Kansas 52 -32 -61 -9 -17 43 0 52Kentucky 184 -127 -69 -104 -57 12 0 99Louisiana 870 -454 -52 -667 -77 -24 3 449Maine 133 -49 -37 -112 -84 -47 74 266Maryland 97 -58 -60 -29 -30 30 32 58Massachusetts 387 -315 -81 -274 -71 11 ―1 147Michigan 336 -254 -76 -159 -47 28 10 81Minnesota 95 -14 -15 -44 -46 -31 66 50Mississippi 194 -87 -45 -136 -70 -25 0 145

Chapter 1: A
PPEND
IX 1A
26M
arch 2019
TABLE 1A-2. (continued)
State
Unreduced allotment amount
Status quoMACPAC
recommendations Percentage point change in DSH reductions (Recommended
policy minus status quo)
Average share of DSH
allotment unspent
(FYs 2014–2016)
Unreduced DSH allotment per
non-elderly low-income individual (wage adjusted) as a share of the national average
Dollar change
Percent change
Dollar change
Percent change
Missouri $601 -$370 -62% -$475 -79% -18% 13% 264%Montana 14 -3 -21 3 21 42 0 33Nebraska 36 -7 -20 -7 -20 -0 16 53Nevada 59 -13 -22 5 8 30 0 39New Hampshire 203 -107 -52 -186 -92 -39 65 548New Jersey 817 -516 -63 -658 -81 -17 19 243New Mexico 26 -4 -16 5 21 36 2 24New York 2,039 -1,300 -64 -1,550 -76 -12 0 219North Carolina 374 -227 -61 -189 -50 10 1 86North Dakota 12 -1 -9 -7 -62 -53 91 51Ohio 516 -415 -81 -332 -64 16 0 120Oklahoma 46 -7 -16 2 3 19 30 28Oregon 57 -13 -22 12 21 43 1 28Pennsylvania 712 -514 -72 -521 -73 -1 24 159Rhode Island 83 -72 -87 -63 -76 11 0 205South Carolina 416 -251 -60 -316 -76 -16 1 206South Dakota 14 -1 -7 -8 -54 -47 93 42Tennessee2 59 – – 11 20 20 3 22Texas 1,214 -512 -42 -688 -57 -14 4 99Utah 25 -6 -25 5 20 44 3 22Vermont 29 -24 -85 -19 -68 17 14 132Virginia 111 -74 -67 -19 -17 49 27 44Washington 235 -179 -76 -106 -45 31 7 78West Virginia 86 -54 -63 -55 -64 -1 28 118Wisconsin 120 -14 -12 -61 -51 -39 68 57Wyoming 0 0 -18 0 21 39 1 1

Chapter 1: A
PPEND
IX 1A
27Report to C
ongress on Medicaid and C
HIP
TABLE 1A-2. (continued)
Notes: DSH is disproportionate share hospital. FY is fiscal year. Non-elderly low-income individuals are defined as individuals under age 65 with family incomes less than 200 percent of the federal poverty level. DSH allotments per non-elderly low-income individual were adjusted to account for differences in labor costs in different geographic areas using a statewide composite of the Medicare wage index.
― Dash indicates zero; $0 or -$0 indicates an amount between $0.5 million and -$0.5 million that rounds to zero. 0% or -0% indicates an amount between 0.5% and -0.5% that rounds to zero. 1 We considered DSH funding for California and Massachusetts to be fully spent in our analysis because these states use their DSH allotment in the budget neutrality assumptions in their Section 1115 waivers.2 Under current law, DSH allotments for Tennessee are fixed in statute and are not subject to DSH allotment reductions. In this analysis, we assumed that DSH allotment increases and reductions would be applied to Tennessee in the same manner as other states.
Source: MACPAC, 2019, analysis of Census 2019, CBO 2018, CMS 2018a, 2014 as-filed DSH audits, and the CMS Medicaid Budget and Expenditure System.

Chapter 1: APPENDIX 1A
28 March 2019
TABLE 1A-3. Reductions in DSH Spending as a Share of Total Medicaid Payments to Hospitals under Status Quo and MACPAC Recommendations, FY 2023 (millions, state and federal funds)
State
Projected total
Medicaid hospital
spending
Status quoMACPAC
recommendationsMedicaid shortfall
reported for all DSH hospitals in state (SPRY
2014)
Share of DSH payments to deemed DSH
hospitals (SPRY 2014)
Dollar change
Percent change
Dollar change
Percent change
Total $240,603 -$12,267 -5% -$12,088 -5% $12,266 70%Alabama 2,858 -416 -15 -412 -14 124 6Alaska 800 – – – – – 68Arizona 5,841 -105 -2 – – 817 100Arkansas 1,548 -5 -0 – – 23 100California 39,570 -1,456 -4 -660 -2 380 97Colorado 3,962 -116 -3 -66 -2 29 63Connecticut 2,444 – – -52 -2 236 20Delaware 825 – – – – 18 100District of Columbia 956 -61 -6 -76 -8 45 100Florida 10,134 -208 -2 – – – 86Georgia 4,411 -217 -5 -227 -5 148 56Hawaii 958 – – – – – N/AIdaho 647 -4 -1 – – – 56Illinois 7,866 -192 -2 -101 -1 – 100Indiana 3,230 -189 -6 -186 -6 47 61Iowa 1,752 – – – – 50 100Kansas 1,448 -55 -4 -16 -1 94 38Kentucky 3,287 -177 -5 -145 -4 205 70Louisiana 4,768 -662 -14 -990 -21 525 73Maine 811 – – -21 -3 8 100Maryland 3,626 -54 -1 – – – 60Massachusetts 6,964 -631 -9 -548 -8 – N/AMichigan 6,498 -345 -5 -198 -3 264 41Minnesota 3,149 – – – – 190 92Mississippi 1,985 -114 -6 -178 -9 – 66Missouri 4,506 -448 -10 -609 -14 – 49Montana 897 -5 -1 – – 18 15Nebraska 567 -2 -0 -3 -0 150 85Nevada 1,408 -20 -1 – – 156 95New Hampshire 723 – – -107 -15 –1 23New Jersey 5,910 -719 -12 -1,004 -17 393 82New Mexico 2,220 -5 -0 – – – 80

Chapter 1: APPENDIX 1A
29Report to Congress on Medicaid and CHIP
TABLE 1A-3. (continued)
State
Projected total
Medicaid hospital
spending
Status quoMACPAC
recommendationsMedicaid shortfall
reported for all DSH hospitals in state (SPRY
2014)
Share of DSH payments to deemed DSH
hospitals (SPRY 2014)
Dollar change
Percent change
Dollar change
Percent change
New York $33,100 -$2,597 -8% -$3,096 -9% $4,284 73North Carolina 7,531 -333 -4 -276 -4 – 71North Dakota 323 – – – – – 34Ohio 8,952 -658 -7 -526 -6 $809 33Oklahoma 2,437 – – – – – 36Oregon 2,760 -19 -1 – – – 52Pennsylvania 8,851 -661 -7 -676 -8 1,977 53Rhode Island 1,149 -137 -12 -119 -10 145 17South Carolina 2,578 -349 -14 -441 -17 164 39South Dakota 318 – – – – 49 43Tennessee2 3,586 – – – – – 66Texas 20,070 -808 -4 -1,109 -6 – 83Utah 894 -8 -1 – – – 6Vermont 661 -37 -6 -28 -4 77 43Virginia 2,819 -89 -3 – – 9 91Washington 3,643 -324 -9 -178 -5 563 63West Virginia 1,567 -40 -3 -41 -3 –1 60Wisconsin 2,616 – – – – 263 52Wyoming 179 0 0 – – 7 29
Notes: DSH is disproportionate share hospital. FY is fiscal year. SPRY is state plan rate year. N/A is data not available. Reductions in DSH spending exclude reductions applied to unspent DSH funding. Non-elderly low-income individuals are defined as individuals under age 65 with family incomes less than 200 percent of the federal poverty level. Total Medicaid hospital spending includes fee-for-service base payments, supplemental payments, and an estimate of managed care payments to hospitals. Deemed DSH hospitals are statutorily required to receive DSH payments because they serve a high share of Medicaid-enrolled and low-income individuals.
― Dash indicates zero; $0 or -$0 indicates an amount between $0.5 million and -$0.5 million that rounds to zero. 0% or -0% indicates an amount between 0.5% and -0.5% that rounds to zero.1 Medicaid shortfall is not reported for New Hampshire and West Virginia because these states did not include payments from third-party payers when calculating Medicaid shortfall. 2 Under current law, DSH allotments for Tennessee are fixed in statute and are not subject to DSH allotment reductions. Under the rebasing scenarios, we assumed that DSH allotment increases and reductions would be applied to Tennessee in the same manner as other states.
Source: MACPAC, 2019, analysis of Census 2019, CBO 2018, CMS 2018a, OACT 2018, 2014 as-filed DSH audits, and the CMS Medicaid Budget and Expenditure System.

Chapter 1: APPENDIX 1B
30 March 2019
APPENDIX 1B: Methodology for Estimating the Effects of the Disproportionate Share Hospital Allotment Reduction Recommendations To estimate the effects of the disproportionate share hospital (DSH) allotment reduction recommendations in this chapter, we first estimated unreduced DSH allotments under current law using the methodology described in Appendix 3B of this report. Then, we estimated the amount of reduced allotments under the recommended methodology by adjusting the schedule of allotment reductions and the methodology for distributing reductions among states.
Data sourcesThere are three factors in the recommended reduction methodology:
• the number of non-elderly low-income individuals in a state;
• a statewide composite of the Medicaid wage index; and
• projected unspent DSH funding.
We defined non-elderly low-income individuals as those under age 65 with family incomes below 200 percent of the federal poverty level (FPL). We calculated this measure using the 2013–2017 five-year estimates from the American Community Survey (ACS), which are the most reliable data available (Census 2018).
We calculated a statewide composite of the Medicare wage index using data from the fiscal year (FY) 2019
Medicare inpatient prospective payment system final rule. Specifically, we calculated the composite using a weighted average of hospitals’ final Medicare wage index and the number of provider hours used in the hospital’s wage index calculation.
We projected unspent DSH funding by averaging the share of DSH allotments that were unspent in a state from FY 2014 through FY 2016. Because states have up to two years to spend DSH allotment for a given year, FY 2016 is the most recent year of unspent DSH funding available. Because Massachusetts and California use their DSH allotment in the budget neutrality calculation for their Section 1115 demonstrations, we did not consider DSH allotments in these states to be unspent.
To examine the effects of distributing allotment reductions using other measures, we also examined data on the number of uninsured individuals in a state and the number of Medicaid enrollees in a state. We calculated the number of uninsured individuals using 2017 ACS data, the most recent data available, and we calculated the number of Medicaid enrollees using Form CMS-64 enrollment reports. Although the ACS also includes estimates of Medicaid enrollment, we used administrative data submitted to the Centers for Medicare & Medicaid Services (CMS) because it is more accurate. However, one limitation of this approach is that we could not separately identify non-elderly Medicaid enrollees using CMS-64 data. In future years, more detailed Medicaid enrollment information should be available through the Transformed Medicaid Statistical Information System (T-MSIS).
Allotment reduction methodTo estimate the effects of distributing allotments in a way that would gradually improve the relationship between DSH allotments and the number of non-elderly low-income individuals in a state, we first calculated what state allotments would be if they were fully rebased according to this factor. Then, we applied several adjustments to gradually phase in reductions based on the rebased amount.

Chapter 1: APPENDIX 1B
31Report to Congress on Medicaid and CHIP
The rebasing target for each state was calculated by multiplying the number of non-elderly low-income individuals in the state by the national average of DSH funding per non-elderly low-income individual. This amount was adjusted to account for geographic variation in hospital costs by multiplying the amount by the statewide composite of the Medicare wage index.
To phase in rebasing along with allotment reductions, we assumed that most of the reductions would be applied to states with allotments above the rebased amount. We also assumed that states with allotments below the rebased amount would receive small increases to their allotments equal to the portion of inflation-based DSH allotment increases that are attributable to allotment reductions (Table 1B-1). However, in FY 2025 and subsequent years, the amount of this inflation-based increase is larger than the amount of funds needed to fully rebase DSH allotments for states with historically low ratios of DSH allotments per non-elderly low-income individual, so we assumed that the excess funds would be applied as larger inflation-based increases for all states.
To distribute reductions among states, we first applied reductions to projected unspent DSH funds for states with allotments above the rebased amount. At this step, allotments were not reduced below the rebased amount, even if the state had more of its DSH funding that was projected to be unspent.
Next, we applied any remaining reductions to states proportionally based on the difference between their unreduced allotment and the rebased allotment amount (after accounting for reductions due to unspent DSH funding). Similarly, we applied increases to states with allotments below the rebased amount proportionally based on the difference between the state’s unreduced allotment and the rebased amount.
Finally, we compared the percentage change in each state’s DSH allotment to the upper bounds assumed in our analysis. For reductions, we assumed an upper bound of 30 percent a year, excluding reductions applied to unspent DSH funding (resulting in a cumulative reduction of 76 percent by FY 2023). For allotment increases, we assumed an upper bound of 5 percent a year (resulting in a cumulative increase of 22 percent by FY 2023).
TABLE 1B-1. Inflation-Based DSH Allotment Increases Attributable to DSH Allotment Reductions (millions)
YearAggregate DSH allotment reduction
amounts under recommended policyPortion of inflation-based DSH allotment increases
attributable to reduced allotment amounts
FY 2020 $2,000 N/AFY 2021 4,000 $50FY 2022 6,000 150FY 2023 8,000 297FY 2024 8,000 489FY 2025 8,000 678FY 2026 8,000 866FY 2027 8,000 1,054FY 2028 8,000 1,243FY 2029 8,000 1,431
Notes: DSH is disproportionate share hospital. FY is fiscal year. N/A is not applicable.
Source: MACPAC, 2019, analysis of CBO 2018.

Chapter 1: APPENDIX 1B
32 March 2019
Reduction amounts or increases in excess of these upper bounds were pooled together and distributed to other states. Excess reductions were first applied to states that were projected to spend less than their rebased allotments, up to the amount of the estimated unspent funding. Excess reductions or decreases were then distributed to other states proportionally based on their revised allotment amounts after the other steps in the rebasing methodology were performed.
Projections of total Medicaid hospital spendingTo compare reductions to total Medicaid hospital spending in FY 2023, we projected state Medicaid hospital spending using state Medicaid spending data for FY 2017 and estimates about the growth in Medicaid hospital spending from the CMS Office of the Actuary that are used in National Health Expenditure (NHE) projections (OACT 2018). We included fee-for-service spending on Medicaid base payments, DSH and non-DSH supplemental payments, and an estimate of managed care payments to hospitals in each state. This managed care spending estimate was based on total managed care spending reported by the state and the assumption used in CMS’s NHE projections that one-third of managed care payments are attributable to hospital expenditures (after subtracting administrative costs included in the capitation rate, which we assumed were 10 percent of the total capitation rate). For Vermont, we applied the same method to estimate hospital spending in the public managed care organization authorized under the state’s Section 1115 demonstration (which is reported as other care services on CMS expenditure reports).
One limitation of this approach is that it does not account for the fact that hospital spending accounts for a lower share of managed care spending in states that include long-term services and supports (LTSS) in managed care. We could not separately estimate hospital spending for enrollees receiving LTSS in managed care because FY 2017 Medicaid claims and encounter data are not available.
The estimates of state hospital spending that we calculated using this method were similar to the amounts that states reported during MACPAC’s interviews about the development of Medicaid hospital payment policies in five states (Table 1B-2). In Arizona, our estimate was higher than actual spending, likely because the state includes LTSS in managed care and thus spends a lower than average share of managed care spending on hospitals. In Louisiana, Michigan, and Mississippi, our estimates were lower than actual spending, likely because these states made large directed payments and pass-through payments to hospitals in managed care, which are not reported in other sources.
For all states, the approach that we used was more accurate than using Medicaid payment data reported on Medicare cost reports, which do not appear to include complete information on Medicaid supplemental payments. Nationally, CMS’s NHE reported that states spent a total of $189.8 billion on hospital services in FY 2016, but hospitals only reported a total of $120.8 billion in Medicaid revenue on Medicare cost reports (OACT 2018).

Chapter 1: APPENDIX 1B
33Report to Congress on Medicaid and CHIP
TABLE 1B-2. Total Medicaid Hospital Spending Estimated Using Various Sources for Selected States, FY 2016 (millions)
State
Actual payments
reported by states during
interviews
Total payments estimated by MACPAC based on CMS-64 net
expendituresTotal payments reported on
Medicare cost reports
Estimated payments
Percent difference
from actualReported payments
Percent difference
from actual
A B C = (B – A) ÷ A D E = (D – A) ÷ A
Arizona $3,267 $3,980 22% $1,860 -43%Louisiana 3,069 2,841 -7 2,344 -24Michigan 5,413 4,828 -11 4,073 -25Mississippi 1,699 1,566 -8 1,435 -16Virginia 1,969 1,969 0 1,828 -7
Source: MACPAC, 2019, analysis of Marks et al. 2018, CMS-64 net expenditure data as of July 20, 2018, and Medicare cost reports.


Chapter 2:
Oversight of Upper Payment Limit Supplemental Payments to Hospitals

Chapter 2: Oversight of Upper Payment Limit Supplemental Payments to Hospitals
36 March 2019
Oversight of Upper Payment Limit Supplemental Payments to HospitalsRecommendations2.1 The Secretary of the U.S. Department of Health and Human Services should establish process
controls to ensure that annual hospital upper payment limit demonstration data are accurate and complete and that the limits calculated with these data are used in the review of claimed expenditures.
2.2 To help inform development of payment methods that promote efficiency and economy, the Secretary of the U.S. Department of Health and Human Services should make hospital-specific upper payment limit demonstration data and methods publicly available in a standard format that enables analysis.
Key Points• The upper payment limit (UPL) is an upper limit on fee-for-service (FFS) Medicaid payments that
is based on an estimate of the amount that would have been paid for the same services under Medicare payment principles.
• States can make UPL supplemental payments to certain types of providers to make up the difference between Medicaid base payments and the UPL.
– States reported $13.0 billion in UPL payments to hospitals in fiscal year (FY) 2017.
– States can target UPL payments to particular types of hospitals as long as total payments for each class of hospitals are below the UPL in the aggregate.
• In 2013, the Centers for Medicare & Medicaid Services (CMS) began requiring states to annually demonstrate compliance with UPL requirements by submitting data on Medicaid spending relative to the UPL.
• MACPAC’s analysis of UPL demonstrations for state FY 2016 found large discrepancies between spending reported on UPL demonstrations and actual spending reported on CMS expenditure reports.
– In 17 states, the actual amount of UPL payments made appears to exceed the limit calculated on state UPL demonstrations by $2.2 billion in the aggregate.
– State and CMS officials with whom we spoke were not able to fully explain these discrepancies, but it is possible that some differences may be a result of differences in how spending is reported in different sources.
• The limits calculated on UPL demonstrations are not routinely used in the review of claimed expenditures.
• The hospital-level data reported on UPL demonstrations can also help inform analyses of whether payment policies are economic and efficient.

Chapter 2: Oversight of Upper Payment Limit Supplemental Payments to Hospitals
37Report to Congress on Medicaid and CHIP
CHAPTER 2: Oversight of Upper Payment Limit Supplemental Payments to HospitalsStates make several different types of Medicaid payments to hospitals and have broad flexibility to design their own payment methods. The two major categories of payments are (1) base payments for services and (2) supplemental payments, which are typically made in a lump sum for a fixed period of time. Because development of Medicaid hospital payment policy must be considered in terms of all types of Medicaid payments that hospitals receive, MACPAC is undertaking a long-term work plan to examine how state hospital payment policies relate to the statutory goals of efficiency, economy, quality, and access (MACPAC 2018a).
Upper payment limit (UPL) supplemental payments were the largest type of Medicaid hospital supplemental payment reported in fiscal year (FY) 2017 in the aggregate. The UPL is an upper limit on fee-for-service (FFS) payments that is defined as a reasonable estimate of the amount that would have been paid for the same services under Medicare payment principles. States can make FFS supplemental payments (referred to as UPL payments in this chapter) as long as they do not exceed the difference between FFS base payments and the UPL. UPL payments are often targeted to specific groups of hospitals and may result in some hospitals being paid more than what Medicare would have paid as long as total payments to each class of hospitals are below the UPL in the aggregate.1
In 2013, the Centers for Medicare & Medicaid Services (CMS) began requiring states to demonstrate compliance with UPL requirements annually. Previously, states only demonstrated compliance when amending their Medicaid state plans. To better understand the methods that states use to make UPL payments, MACPAC examined
hospital-level data from state UPL demonstrations for state fiscal year (SFY) 2016 and aggregate, state-level UPL data for SFYs 2014–2016, the first and only years for which data were available when MACPAC requested them in the summer of 2018.
Our analyses raise concerns about the accuracy and completeness of the data used to monitor compliance with UPL requirements. We find large discrepancies between spending reported on state UPL demonstrations and actual spending reported on CMS expenditure reports. In 17 states, the actual aggregate amount of UPL payments made in SFY 2016 appears to exceed the limit calculated on state UPL demonstrations by $2.2 billion.
Although more information is needed to verify the potential overpayments that we observed, state and CMS officials with whom we spoke were not able to fully explain these discrepancies. Some UPL spending that appears to be in excess of the UPL could be explained by differences in how spending is reported in different sources. For example, spending reported on UPL demonstrations comes from claims data that are recorded based on the date of service, whereas spending reported on CMS expenditure reports is based on the date the claim was paid. Also, UPL estimates are often submitted prospectively, whereas expenditure reports are submitted after payments have been made. However, we also find that many state UPL demonstrations are missing data on UPL payments entirely, which cannot be explained by differences in data sources.
States and the federal government both have a responsibility to ensure that claimed expenditures do not exceed the UPL. CMS already has many processes in place to promote effective financial management, and it has developed standardized templates to improve the accuracy and completeness of UPL demonstration data in 2019 and subsequent years. However, based on our conversations with state and CMS officials, it does not appear that the limits calculated on UPL demonstrations are routinely used in the review of claimed expenditures.

Chapter 2: Oversight of Upper Payment Limit Supplemental Payments to Hospitals
38 March 2019
To address these concerns, the Commission makes two recommendations:
• The Secretary of the U.S. Department of Health and Human Services should establish process controls to ensure that annual hospital upper payment limit demonstration data are accurate and complete and that the limits calculated with these data are used in the review of claimed expenditures.
• To help inform development of payment methods that promote efficiency and economy, the Secretary of the U.S. Department of Health and Human Services should make hospital-specific upper payment limit demonstration data and methods publicly available in a standard format that enables analysis.
Better data and process controls will help ensure proper enforcement of existing limits and can help inform development of new payment policies that promote efficiency and economy. For example, it would be useful to know whether states apply adjustments to their UPL that result in a limit that is different from the amount that Medicare would have paid for the same service under the current prospective payment system.
BackgroundBefore 1981, Medicaid paid hospitals based on costs using Medicare payment methods. However, after the passage of the Omnibus Budget Reconciliation Act of 1981 (P.L. 97-35), Medicaid payments to hospitals were delinked from Medicare and states were given considerable flexibility to design their own payment methods. To ensure that payments were consistent with the statutory goals of economy and efficiency, CMS established an upper limit on aggregate FFS payments to institutional providers based on an estimate of what would have been paid for the same service under Medicare payment principles (42 CFR 447.272 and 447.321). This limit is referred to as the UPL.
The UPL does not apply to services provided under managed care arrangements.2
If FFS base payments are below the UPL, then states can make UPL supplemental payments as long as these payments do not exceed the difference between base payments and the UPL (Figure 2-1). Although the term UPL payment is not defined in statute or regulation, we use this term to distinguish supplemental payments that are subject to the UPL from those that are not, such as disproportionate share hospital (DSH) payments and supplemental payments authorized under Section 1115 demonstrations.3
In FY 2017, states made a total of $13.0 billion in UPL payments to hospitals. States also made $4.4 billion in UPL payments to other provider types that are subject to UPL requirements, such as nursing facilities.4 This chapter focuses on UPL payments to hospitals because they are the only provider type for which we have complete provider-level data.
UPL payments were the largest type of supplemental payments to hospitals reported in FY 2017, surpassing DSH payments ($12.1 billion).5 Although the majority of Medicaid enrollees are covered under managed care arrangements, FFS payments (base and supplemental) still account for about half of Medicaid payments to hospitals, and supplemental payments account for about half of FFS payments to hospitals. More information about the amounts and types of supplemental payments to hospitals is available in MACPAC’s issue brief, Medicaid Base and Supplemental Payments to Hospitals (MACPAC 2019).
Uses of UPL PaymentsAlthough UPL payments have been permitted since 1981, their use grew rapidly in the early 2000s. In FY 2000, 15 states made hospital UPL payments totaling $4.5 billion (OIG 2001). By FY 2011, 36 states reported UPL payments to hospitals totaling $19.8 billion.6 Since that time, such spending has declined, in part because of the expanded use of
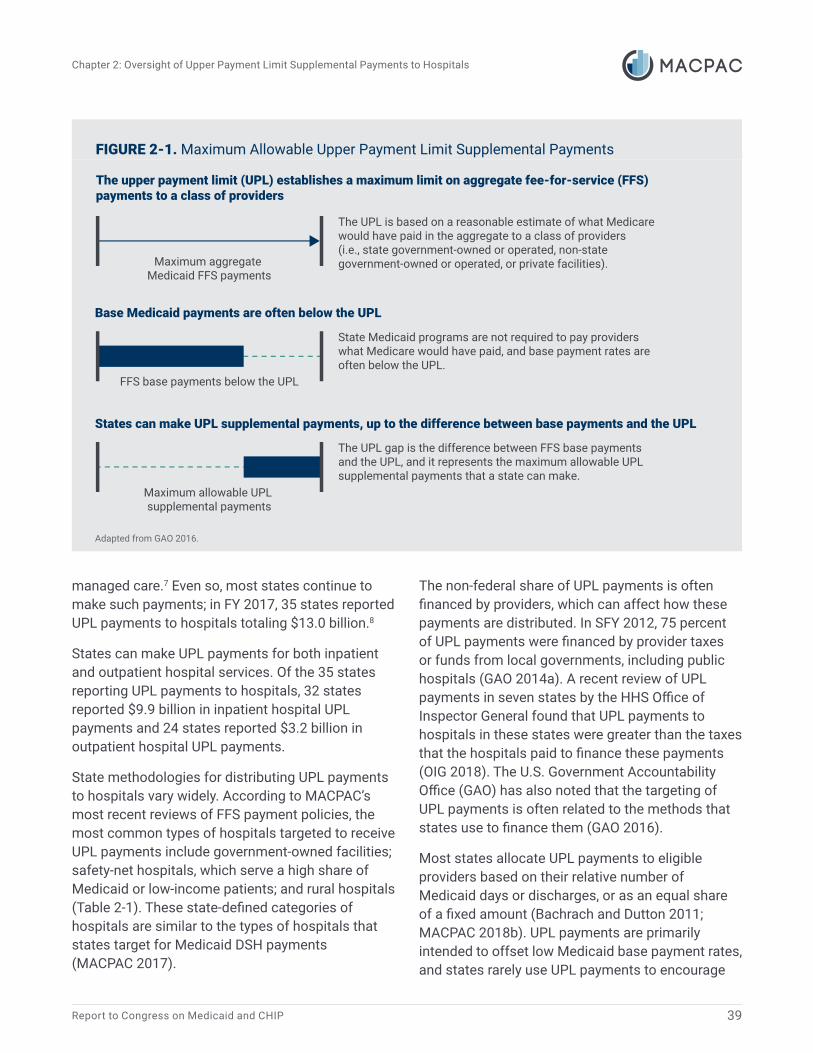
Chapter 2: Oversight of Upper Payment Limit Supplemental Payments to Hospitals
39Report to Congress on Medicaid and CHIP
Adapted from GAO 2016.
The upper payment limit (UPL) establishes a maximum limit on aggregate fee-for-service (FFS) payments to a class of providers
Base Medicaid payments are often below the UPL
States can make UPL supplemental payments, up to the difference between base payments and the UPL
Maximum allowable UPL supplemental payments
Maximum aggregate Medicaid FFS payments
FFS base payments below the UPL
The UPL is based on a reasonable estimate of what Medicare would have paid in the aggregate to a class of providers (i.e., state government-owned or operated, non-state government-owned or operated, or private facilities).
The UPL gap is the difference between FFS base payments and the UPL, and it represents the maximum allowable UPL supplemental payments that a state can make.
State Medicaid programs are not required to pay providers what Medicare would have paid, and base payment rates are often below the UPL.
managed care.7 Even so, most states continue to make such payments; in FY 2017, 35 states reported UPL payments to hospitals totaling $13.0 billion.8
States can make UPL payments for both inpatient and outpatient hospital services. Of the 35 states reporting UPL payments to hospitals, 32 states reported $9.9 billion in inpatient hospital UPL payments and 24 states reported $3.2 billion in outpatient hospital UPL payments.
State methodologies for distributing UPL payments to hospitals vary widely. According to MACPAC’s most recent reviews of FFS payment policies, the most common types of hospitals targeted to receive UPL payments include government-owned facilities; safety-net hospitals, which serve a high share of Medicaid or low-income patients; and rural hospitals (Table 2-1). These state-defined categories of hospitals are similar to the types of hospitals that states target for Medicaid DSH payments (MACPAC 2017).
The non-federal share of UPL payments is often financed by providers, which can affect how these payments are distributed. In SFY 2012, 75 percent of UPL payments were financed by provider taxes or funds from local governments, including public hospitals (GAO 2014a). A recent review of UPL payments in seven states by the HHS Office of Inspector General found that UPL payments to hospitals in these states were greater than the taxes that the hospitals paid to finance these payments (OIG 2018). The U.S. Government Accountability Office (GAO) has also noted that the targeting of UPL payments is often related to the methods that states use to finance them (GAO 2016).
Most states allocate UPL payments to eligible providers based on their relative number of Medicaid days or discharges, or as an equal share of a fixed amount (Bachrach and Dutton 2011; MACPAC 2018b). UPL payments are primarily intended to offset low Medicaid base payment rates, and states rarely use UPL payments to encourage
FIGURE 2-1. Maximum Allowable Upper Payment Limit Supplemental Payments

Chapter 2: Oversight of Upper Payment Limit Supplemental Payments to Hospitals
40 March 2019
TABLE 2-1. Targeting of UPL Payments
Hospital Type
Number of states1
Inpatient UPL Outpatient UPL
Government-owned 23 10Safety-net 20 3Specialty 14 3Children’s 12 3Teaching 12 4Rural 9 0
Notes: UPL is upper payment limit. Safety-net hospitals are defined broadly as hospitals that serve a high share of Medicaid or low-income patients. States can target UPL payments to multiple hospital types. Analysis excludes graduate medical education payments. Analysis of inpatient UPL payment policies based on MACPAC review of state policies as of March 2018 and analysis of outpatient UPL payment policies based on MACPAC review of state policies as of November 2015.1 Number of states includes the District of Columbia.
Source: MACPAC 2018b, 2016a.
delivery system reforms. For example, MACPAC’s 2018 review of inpatient hospital payment policies identified only four states that were making UPL payments to hospitals for the attainment of quality metrics (Colorado, Massachusetts, Washington, and Wisconsin) (MACPAC 2018b). Instead of using UPL authority, states often implement hospital value-based payment initiatives through adjustments to base payment rates or through other payment authorities, such as health homes or primary care case management.9
History of UPL PolicyAlthough states have flexibility in establishing payment methods and amounts, statute requires Medicaid payment policies to be consistent with the principles of efficiency, economy, quality, and access (§ 1902(a)(30)(A) of the Social Security Act). CMS recognized that it was neither economic nor efficient to allow states to make unlimited payments to providers, so it established the UPL via regulation. Medicare payment principles were used to establish an upper limit on Medicaid payments because the Medicare program is also a large federal program and is the largest single payer for hospital services.10 Other payers also often use Medicare payment rates as a benchmark for
hospital payment rates, even though commercial payment rates are often much higher than Medicare.
The regulations establishing the UPL have changed little since 1981. In 1987, CMS required states to calculate the UPL for state government-owned or operated facilities separately from other facilities, and in 2001, CMS required states to calculate the UPL separately for private institutions and non-state, government-owned or operated facilities (CMS 2001, 1987). However, the methods that states can use to calculate the UPL have not changed.11
Since UPL requirements were established, CMS has reviewed compliance with UPL requirements prospectively when states submitted changes to their payment methodologies in their Medicaid state plans. Although this process provides certainty for providers that UPL payments will not change unless the state changes its payment policies, the data and assumptions used to calculate the UPL could become several years old in states that do not make frequent changes to their Medicaid payment policies.
As the use of UPL payments grew in the early 2000s, GAO and OIG made several recommendations to improve CMS’s oversight of UPL requirements, which would increase transparency and accountability for these payments. Specifically, GAO

Chapter 2: Oversight of Upper Payment Limit Supplemental Payments to Hospitals
41Report to Congress on Medicaid and CHIP
recommended that CMS collect hospital-specific data and audit state UPL demonstrations; OIG recommended that CMS use more recent data to assess UPLs and that UPLs be established at the facility level (GAO 2012, OIG 2001).
In response to these concerns, CMS issued a state Medicaid director letter in 2013 requiring states to demonstrate compliance with UPL requirements annually (CMS 2013). CMS provides states with the option of demonstrating UPL compliance prospectively based on estimates of Medicaid spending for the upcoming year, or demonstrating UPL compliance retrospectively based on actual spending.
To help states demonstrate UPL compliance in a standard way, CMS has developed templates for each provider type subject to UPL requirements as well as additional guidance documents that describe allowable methods for calculating the UPL for each type of service (CMS 2019). The templates were issued in 2018, and beginning in SFY 2019, states are required to use them.
Current UPL RequirementsUnder CMS’s current rules, the calculation of the UPL and the maximum allowable amount of UPL supplemental payments involves several steps:
• identifying hospitals subject to the UPL requirements;
• choosing a method for calculating the UPL;
• adjusting the UPL for inflation and other factors; and
• comparing the UPL to Medicaid spending.
Below, we review each of these steps in more detail.
Identifying hospitals subject to UPL requirementsStates are generally required to include all hospitals participating in Medicaid in the state in their UPL
calculations. However, hospitals paid based on actual costs may be excluded, since CMS assumes that payments to these hospitals already comply with the UPL requirements.12 According to MACPAC’s most recent reviews of state FFS payment policies, only 1 state (Idaho) primarily used cost-based payment methods for inpatient services in 2018, and 16 states primarily used cost-based payment methods for outpatient services in 2015 (MACPAC 2018b, 2016a). However, many states use cost-based payment methods for particular types of hospitals. For example, 17 states used cost-based payment methods for inpatient hospital services at critical access hospitals, and 7 states used cost-based payment methods for inpatient hospital services at government-owned hospitals (MACPAC 2018b).13
Choosing a method for calculating the UPLFor hospitals that are included in the UPL demonstrations, states develop an estimate of what Medicare would have paid for hospital services using one of four methods:
• a cost-based method, which is an estimate of facility costs for services provided to Medicaid patients calculated using cost-to-charge ratios from Medicare cost reports;
• a payment-to-charge-based method, which is based on the hospital’s aggregate Medicare payments relative to its charges;
• a price-based method, which is based on what Medicare would have paid for specific diagnosis-related groups (DRGs), after adjusting for differences in acuity between Medicare and Medicaid patients; and
• a per diem method, which is based on average Medicare payments per hospital day.
In SFY 2016, about half of states used cost-based methods for calculating inpatient hospital UPLs and about half used a price-based method (Table 2-2). Most states used cost-based methods for

Chapter 2: Oversight of Upper Payment Limit Supplemental Payments to Hospitals
42 March 2019
TABLE 2-2. Number of States Using Each Method for Determining UPL Limits, SFY 2016
Type of service
Method for determining UPL limits
Total states submittingUPL demonstrations1Cost-based
Payment-to-charge-based Price-based Per diem
Inpatient hospital 32 9 20 10 47Outpatient hospital 44 6 N/A N/A 48
Notes: UPL is upper payment limit. SFY is state fiscal year. N/A is not applicable. Number of states includes the District of Columbia.1 Totals do not add because some states use different methods for different classes of hospitals in the state. States are not required to submit a UPL demonstration if they do not make UPL payments.
Source: MACPAC, 2019, analysis of SFY 2016 state UPL demonstrations.
calculating outpatient hospital UPLs. The price-based and per diem methods do not apply to outpatient hospital UPLs.
Although all methods approximate what Medicare would have paid, the cost-based method is the only one that does not use current Medicare payment rates. In 2016, Medicare payments to hospitals were 90.4 percent of costs, so the cost-based method of calculating the UPL appears to result in a UPL that is higher than what Medicare would have actually paid (MedPAC 2018a). When the UPL was established in 1981, Medicare and Medicaid paid hospitals based on costs. However, since 1983, Medicare has used a prospective payment system that assigns payment based on factors other than costs for most hospitals.
The price-based method of calculating the UPL most closely resembles how Medicare currently pays hospitals, but even using this method, states must make several approximations. Medicare does establish payment rates for all types of DRGs (including perinatal services which are more frequently used by Medicaid enrollees than by Medicare enrollees), but Medicare also makes several types of special payments to hospitals, which are more difficult to calculate in a non-Medicare context (Box 2-1). As a result, many states using the price-based approach estimate Medicare special payments by using aggregate data from CMS about average total Medicare payments per hospital by DRG.
BOX 2-1. Medicare Hospital Payment MethodsCurrently, most Medicare payments to hospitals are made under the prospective payment system (PPS). Specifically, Medicare assigns base payment rates for each service based on the complexity of services (measured by diagnosis-related groups for inpatient hospital services and ambulatory patient classifications for outpatient services) and adjusts those base payment amounts for geographic differences in input prices. Medicare also makes some additional payments to hospitals, referred to as special payments. These include indirect medical education payments, Medicare disproportionate share hospital payments, additional payments for rural sole community hospitals, adjustments for patients with short lengths of stay who are discharged to another hospital or post-acute care setting, and outlier payments for high-cost patients. In 2016, 80.9 percent of inpatient Medicare payments to PPS hospitals were base payments and 19.1 percent were special payments (MedPAC 2018b).

Chapter 2: Oversight of Upper Payment Limit Supplemental Payments to Hospitals
43Report to Congress on Medicaid and CHIP
The payment-to-charge and per diem methods use aggregate payment data to estimate what Medicare would have paid for Medicaid services, but they do not account for differences in patient acuity. In 2015, the average hospital cost per Medicare patient day was 41 percent higher than the average hospital cost per Medicaid patient day, so assuming that Medicaid and Medicare patients have the same level of acuity may result in a UPL that is higher than what Medicare would have actually paid (AHRQ 2017).
Adjusting the UPL for inflation and other factorsBecause data on hospital costs and charges often lag behind the year for which the UPL is being calculated, states adjust historical data to trend it forward. For example, states make adjustments for inflation to better reflect current costs. States are required to use the most recent data available when calculating the UPL, and CMS’s guidance instructs states to use Medicare cost report data that are no more than two years old.
States that choose a cost-based method for determining the UPL can also make adjustments to account for the costs of Medicaid provider taxes. Specifically, the costs of provider taxes can be added to the costs of the services provided, increasing the state’s UPL. However, states cannot make adjustments to account for intergovernmental transfers, which are often used by public hospitals to finance the non-federal share of UPL payments.
Comparing the UPL to Medicaid spendingTo demonstrate compliance with UPL requirements, the adjusted UPL amount reported on state UPL demonstrations must be less than total FFS spending for each class of providers. States have the option of submitting UPL demonstrations prospectively or retrospectively for each state fiscal year. Most states submit UPL demonstrations prospectively, and thus they must estimate FFS spending for the upcoming year based on prior
years’ data. Retrospective UPL demonstrations are based on actual spending.
CMS primarily uses UPL demonstrations to approve UPL payments before they are made and does not routinely use these data in the review of claimed UPL expenditures. When states claim any Medicaid expenditure to draw down federal funds, states must certify that the payments they make are consistent with federal rules. For all payments, CMS can request additional information about expenditures that are reported and can defer payments if they are not sufficiently justified.
Analysis of State UPL DemonstrationsTo better understand the methods that states use to make UPL payments and how the UPL is enforced, MACPAC reviewed data from state UPL demonstrations and compared them with other sources. CMS shared hospital-specific data from the SFY 2016 inpatient hospital UPL demonstrations for 46 states and the District of Columbia and outpatient hospital UPL demonstrations for 47 states and the District of Columbia.14 CMS also provided aggregate, state-level data for SFYs 2014, 2015, and 2016 state UPL demonstrations. We compared UPL demonstration data to spending reported on CMS-64 expenditure reports, which are quarterly reports of expenditures claimed for federal matching funds. We also discussed the UPL review process with CMS staff and with state officials in several states that used various methods for calculating their UPL. Additional information about our methods for comparing UPL demonstration data and CMS expenditure reports is provided in Appendix 2A.
Although the state-reported data on UPL demonstrations indicate that aggregate Medicaid hospital spending is below the UPL in most states, the data reported on UPL demonstrations do not match actual spending reported on CMS expenditure reports. In some states, actual FFS spending appears to have exceeded the state-
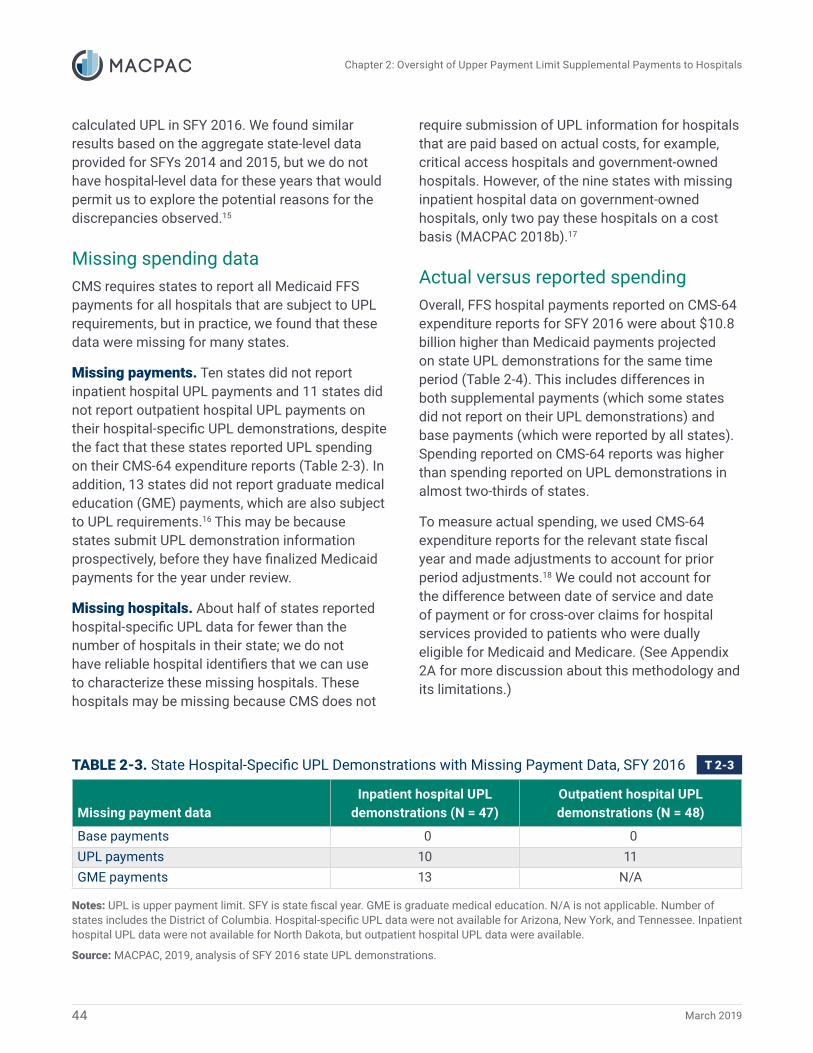
Chapter 2: Oversight of Upper Payment Limit Supplemental Payments to Hospitals
44 March 2019
calculated UPL in SFY 2016. We found similar results based on the aggregate state-level data provided for SFYs 2014 and 2015, but we do not have hospital-level data for these years that would permit us to explore the potential reasons for the discrepancies observed.15
Missing spending dataCMS requires states to report all Medicaid FFS payments for all hospitals that are subject to UPL requirements, but in practice, we found that these data were missing for many states.
Missing payments. Ten states did not report inpatient hospital UPL payments and 11 states did not report outpatient hospital UPL payments on their hospital-specific UPL demonstrations, despite the fact that these states reported UPL spending on their CMS-64 expenditure reports (Table 2-3). In addition, 13 states did not report graduate medical education (GME) payments, which are also subject to UPL requirements.16 This may be because states submit UPL demonstration information prospectively, before they have finalized Medicaid payments for the year under review.
Missing hospitals. About half of states reported hospital-specific UPL data for fewer than the number of hospitals in their state; we do not have reliable hospital identifiers that we can use to characterize these missing hospitals. These hospitals may be missing because CMS does not
require submission of UPL information for hospitals that are paid based on actual costs, for example, critical access hospitals and government-owned hospitals. However, of the nine states with missing inpatient hospital data on government-owned hospitals, only two pay these hospitals on a cost basis (MACPAC 2018b).17
Actual versus reported spendingOverall, FFS hospital payments reported on CMS-64 expenditure reports for SFY 2016 were about $10.8 billion higher than Medicaid payments projected on state UPL demonstrations for the same time period (Table 2-4). This includes differences in both supplemental payments (which some states did not report on their UPL demonstrations) and base payments (which were reported by all states). Spending reported on CMS-64 reports was higher than spending reported on UPL demonstrations in almost two-thirds of states.
To measure actual spending, we used CMS-64 expenditure reports for the relevant state fiscal year and made adjustments to account for prior period adjustments.18 We could not account for the difference between date of service and date of payment or for cross-over claims for hospital services provided to patients who were dually eligible for Medicaid and Medicare. (See Appendix 2A for more discussion about this methodology and its limitations.)
TABLE 2-3. State Hospital-Specific UPL Demonstrations with Missing Payment Data, SFY 2016
Missing payment dataInpatient hospital UPL
demonstrations (N = 47)Outpatient hospital UPL demonstrations (N = 48)
Base payments 0 0UPL payments 10 11GME payments 13 N/A
Notes: UPL is upper payment limit. SFY is state fiscal year. GME is graduate medical education. N/A is not applicable. Number of states includes the District of Columbia. Hospital-specific UPL data were not available for Arizona, New York, and Tennessee. Inpatient hospital UPL data were not available for North Dakota, but outpatient hospital UPL data were available.
Source: MACPAC, 2019, analysis of SFY 2016 state UPL demonstrations.

Chapter 2: Oversight of Upper Payment Limit Supplemental Payments to Hospitals
45Report to Congress on Medicaid and CHIP
TABLE 2-4. State-Reported Hospital Spending, by Source, SFY 2016 (millions)
Type of service
Type of payment
Reported on UPL
demonstrations
Actual spending reported on CMS-
64 expenditure reports Difference
Number of states with actual spending exceeding spending reported on UPL
demonstrations1
InpatientBase $24,216.8 $28,283.8 $4,067.0 30Supplemental 6,056.2 11,543.6 5,487.5 30
OutpatientBase 9,286.7 9,229.6 -57.1 22Supplemental 2,404.8 3,695.7 1,290.9 14
Total $41,964.5 $52,752.7 $10,788.3 28
Notes: SFY is state fiscal year. UPL is upper payment limit. Analysis limited to states that submitted hospital-specific UPL demonstrations and excludes Arizona, New York, and Tennessee. CMS-64 spending is adjusted to account for prior period adjustments. Supplemental payments subject to the UPL include UPL supplemental payments and graduate medical education payments but exclude disproportionate share hospital payments. Numbers do not add due to rounding.1 Number of states includes the District of Columbia.
Source: MACPAC, 2019, analysis of SFY 2016 state UPL demonstrations and the CMS Medicaid Budget and Expenditure System.
UPL complianceIn many states, the actual spending reported on CMS-64 expenditure reports appears to have exceeded the UPL calculated on state UPL demonstrations. Below we examine potential UPL overpayments in three ways:
• whether UPL payments exceeded the difference between base payments and the UPL (referred to as the UPL gap);
• whether base payments and supplemental payments exceeded the UPL; and
• whether base payments and supplemental payments exceeded the UPL after making adjustments to the UPL to account for circumstances where FFS utilization was higher than projected.
UPL payments compared to the UPL gap.Seventeen states reported hospital UPL spending on CMS-64 expenditure reports that appear to have exceeded the UPL gap calculated on SFY 2016 UPL demonstrations. Of these, 12 states appear to have exceeded their inpatient hospital UPL by $1.4 billion in the aggregate, and 7 states appear
to have exceeded their outpatient hospital UPL by $759 million in the aggregate. (Two appear to have exceeded both their inpatient and outpatient UPLs.)
Total FFS spending versus the UPL. Twenty-seven states reported total base and supplemental FFS spending on CMS-64 expenditure reports that appears to have exceeded the state-calculated UPL. Of these, 24 states appear to have exceeded their inpatient hospital UPL by $3.8 billion in the aggregate, and 12 states appear to have exceeded their outpatient UPL by $867 million in the aggregate. (Nine appear to have exceeded both their inpatient and outpatient UPLs.)
Total FFS spending versus the UPL, adjusted for increased utilization. Because increased FFS utilization would increase a state’s UPL, we also compared total FFS spending to an adjusted UPL amount, assuming that the state-calculated UPL would increase proportionally if actual base payment spending was higher than what was projected. After making these adjustments, we find that eight states appear to have exceeded their inpatient hospital UPL by $1.6 billion in the aggregate and that five appear to have exceeded their outpatient UPL by $501 million in the aggregate in SFY 2016.

Chapter 2: Oversight of Upper Payment Limit Supplemental Payments to Hospitals
46 March 2019
State and CMS PerspectivesTo better understand the factors that have contributed to the UPL reporting and compliance issues that we observed, we spoke with Medicaid officials in several states that used various methods for calculating their UPL and with CMS officials overseeing the UPL reporting process. They described several common problems with the current process, including:
• use of different reporting processes for tracking claims in state Medicaid Management Information Systems (MMIS) and payments in the Medicaid Budget and Expenditure System (MBES);
• confusion about reporting requirements; and
• the lack of a process to use state UPL demonstrations in the review of claimed expenditures.
Different reporting processesStates typically use claims data from their MMIS to populate UPL demonstrations because these data can be used to track the date a service was performed and allow states to exclude certain claims, such as cross-over payments for services that are also paid for by Medicare. However, MMIS data do not always include all types of Medicaid spending; spending reported on MMIS is generally lower than that reported on CMS-64 expenditure reports (MACPAC 2018c). It is difficult to identify the spending that is missing because CMS-64 data do not include claims-level detail and only record spending based on the date that the service was paid for. Neither CMS nor the states we contacted have processes to reconcile spending reported on UPL demonstrations with spending reported on CMS-64 expenditure reports.
Confusion about UPL requirementsCMS has updated its UPL demonstration template and revised guidance multiple times, which has been confusing for state staff. However, because
the UPL templates are now required for all states in SFY 2019, state and CMS officials were optimistic that reporting compliance would improve as the process becomes routine. CMS has provided several trainings to help state staff understand how to use the new templates and to emphasize the importance of accurate reporting. However, there were still questions from some of the state staff we spoke with about which data from Medicare cost reports should be used when calculating the UPL.
Even so, state staff generally appreciated the use of standard templates, noting that these were not particularly burdensome to complete. However, staff in one state that tried to use a hybrid of two different UPL calculation methods expressed frustration that the templates did not support the state’s preferred UPL approach. CMS noted that it has been willing to work with states in such circumstances to help states properly submit their UPL demonstrations.
Lack of a process to use state UPL demonstrations in the review of claimed expendituresIt is important to note that CMS does not currently have a process to formally review the accuracy and completeness of UPL demonstrations or use these limits in its review of claimed expenditures. CMS reviews UPL payment methodologies when Medicaid state plans are approved, but does not formally approve UPL demonstrations. As a result, states tend to assume that the UPL calculations they submit are correct and make payments to hospitals accordingly. The state officials we contacted were not aware that actual spending reported on their CMS-64 expenditure report exceeded their state-calculated UPL.
CMS staff described a few instances where they have used UPL demonstration data to issue deferrals in some states, but they noted that states are ultimately responsible for complying with UPL requirements. A deferral is a formal process by which CMS can withhold federal funds for expenditures that do not appear to be proper

Chapter 2: Oversight of Upper Payment Limit Supplemental Payments to Hospitals
47Report to Congress on Medicaid and CHIP
and request additional information from states to support the expenditures that are claimed (42 CFR 430.40). The deferrals that CMS described were instances where states self-reported spending in excess of the UPL on their UPL demonstrations and did not involve using actual spending reported on expenditure reports to verify whether the UPL demonstration data that states submit are correct.
CMS also noted that it is drawing on the experience from its first years of collecting annual UPL demonstration data to improve the process. For example, CMS has made changes to the guidance that it provides states and notes that it is in the process of implementing measures to ensure states are provided with an indication of whether CMS believes their UPL estimate and demonstration data are reasonable and accurate.
Commission RecommendationsIn this chapter, the Commission makes two recommendations to improve the oversight of UPL payments. The rationale and implications of these recommendations are described below.
Recommendation 2.1The Secretary of the U.S. Department of Health and Human Services should establish process controls to ensure that annual hospital upper payment limit demonstration data are accurate and complete and that the limits calculated with these data are used in the review of claimed expenditures.
Rationale
The UPL is intended to provide an upper limit of Medicaid payments to providers based on a reasonable estimate of what would have been paid using Medicare payment principles. CMS currently monitors compliance with UPL requirements when it approves state payment policies, but it is equally important to monitor whether actual UPL payments are consistent with the amounts initially approved.
The information that CMS is currently collecting to monitor UPL compliance is not reliable enough for CMS to ensure that claimed expenditures are consistent with UPL requirements. MACPAC’s analyses found that billions of dollars of payments are currently missing from these reports, including information on the UPL payments that these demonstrations are intended to monitor. Moreover, available payment data do not match the actual amounts of payments that states claimed on CMS expenditure reports in SFY 2016. These discrepancies are so large and widespread that they suggest an underlying problem with the existing process.
Consistent with the types of internal controls that are expected for other types of federal payments, CMS should establish safeguards in the process to ensure that UPL limits are properly calculated and enforced. The Office of Management and Budget Circular A-123, for example, requires federal agencies to manage reporting and data integrity risks, especially those risks that could affect the agency’s decisions or actions based on the report (OMB 2018). Specifically, federal agencies are expected to follow the internal control standards outlined by GAO, which include principles for ensuring data quality and for using available data to monitor performance (GAO 2014b).
Given that the discrepancies we identified have the potential to materially affect CMS’s ability to enforce compliance with UPL requirements, CMS should implement process controls such as:
• requiring states to certify that UPL demonstration data are accurate and complete;
• establishing a process to finalize the limits calculated by states by providing CMS feedback on the state-submitted UPL demonstrations and requiring states to correct any errors identified;
• tracking actual spending against the UPL in CMS’s expenditure reporting systems (either the CMS-64 expenditure reports, which are currently used to track DSH spending against DSH

Chapter 2: Oversight of Upper Payment Limit Supplemental Payments to Hospitals
48 March 2019
limits, or the Transformed Medicaid Statistical Information System (T-MSIS), which captures more detailed claims information); and,
• using this information in its review of claimed expenditures by making final limits and aggregate UPL spending data available to state and federal staff who certify that claimed expenditures comply with federal requirements.
Both states and CMS have responsibilities to ensure that claimed expenditures do not exceed the UPL. However, because CMS is also responsible for defining the UPL requirements, CMS should establish controls to ensure that the UPL is properly enforced.
Because UPL payments are an important source of revenue for many safety-net hospitals, CMS should consider implementing process controls in a way that minimizes the risk that UPL payments are recouped from providers retrospectively. For example, most states currently submit UPL demonstration data prospectively, and if payment limits were finalized on a prospective basis as well, it could provide more certainty from providers about the level of UPL payments that they can receive. CMS could also provide states the opportunity to provide additional information or revise their UPL calculation based on more current data before recouping payments that appear to be made in excess of the UPL, consistent with the standards used in the existing claims review and deferral process (42 CFR 430.40).
Although accurate and complete data are important for all types of providers subject to UPL requirements, our recommendation focuses on the concerns we were able to identify. Complete, facility-specific UPL data were only available for hospital payments at the time of our review.
Implications
Federal spending. According to MACPAC’s review of SFY 2016 UPL demonstrations, 17 states appear to have made UPL payments that exceeded the limit calculated on their state UPL demonstrations by
$2.2 billion in the aggregate. It is possible that some of the potential overpayments that the Commission identified could be explained by differences in how spending is reported in different sources. However, if CMS determines that overpayments were made, it could recoup the federal funds associated with these expenditures.
The Congressional Budget Office (CBO) estimates that this recommendation will not affect federal spending because it enforces existing policy. Depending on how the recommendation is implemented, it could result in increased administrative effort for the federal government, but these changes are not expected to result in increased federal spending.
States. Depending on how the recommendation is implemented, it could affect state administrative effort. Currently, CMS estimates that the administrative burden associated with completing inpatient and outpatient state UPL demonstrations is 80 hours of staff time per response (CMS 2019).
Enrollees. We do not have enough information to assess how this policy would affect Medicaid enrollees. UPL payments are an important source of revenue for many hospitals, but we do not know whether hospitals would receive reduced UPL payments as a result of increased oversight of UPL payments, and if UPL payments were reduced for particular hospitals, we do not know whether these reductions would affect patient care.
Providers. The extent to which providers are affected depends on the extent to which states currently comply with existing UPL requirements. If CMS determines that a state made payments in excess of the UPL, it could result in reduced funding for providers in that state. However, if CMS implements this recommendation by finalizing payment limits on a prospective basis, it could provide more certainty for providers about the UPL payments that they are eligible to receive and reduce the risk that UPL payments are made in error and need to be recouped retrospectively.

Chapter 2: Oversight of Upper Payment Limit Supplemental Payments to Hospitals
49Report to Congress on Medicaid and CHIP
Recommendation 2.2To help inform development of payment methods that promote efficiency and economy, the Secretary of the U.S. Department of Health and Human Services should make hospital-specific upper payment limit demonstration data and methods publicly available in a standard format that enables analysis.
Rationale
Complete data on Medicaid payments is important to understanding whether payments are consistent with federal requirements and for analyzing changes in payment policy. UPL payments were the largest type of hospital supplemental payment reported in FY 2017, but we do not have provider-level data on how the $13.0 billion in UPL payments to hospitals were spent.
CMS already publicly reports hospital-specific data on DSH payments from DSH audits; these data have been useful in MACPAC’s review of DSH policies (MACPAC 2017). Hospital-specific data on UPL payments could help inform similar analyses.
This recommendation builds on the Commission’s prior recommendations that the Secretary of HHS collect and report hospital payment data. In March 2014, the Commission recommended that the Secretary collect and report non-DSH supplemental payment data, and in February 2016, the Commission recommended that the Secretary collect and report data on all Medicaid payments to hospitals for all hospitals that receive them, as well as data on sources of non-federal share necessary to determine net Medicaid payment at the provider level (MACPAC 2016b, 2014).
UPL demonstration data provide useful information that is not otherwise available in other sources. Although the Commission would prefer that CMS collect information on all Medicaid payments to hospitals, UPL demonstrations are an existing data source that can be reported publicly now, without creating a new reporting system.
In addition to data on UPL payments, UPL demonstrations include information on the methods that states use to calculate the UPL, which would be useful in interpreting the data. For example, it would be useful to know whether particular types of payments are intentionally missing and whether states apply adjustments to their UPL that result in a limit that is different from the amount that Medicare would have paid for the same service.
Implications
Federal spending. CBO assumes that this policy would not affect federal Medicaid spending. There may be some additional administrative effort to make reports available, but this activity is not expected to increase federal spending.
States. This policy should have a limited effect on states because states are already required to provide this information to CMS.
Enrollees and providers. This policy would not directly affect Medicaid payments to enrollees or providers.
Next StepsDuring the next year, the Commission plans to continue analyzing Medicaid hospital payments. In particular, we plan to further examine how Medicaid hospital payment amounts compare to Medicare payment rates and the extent to which cost-based payment methods are consistent with the statutory goals of efficiency and economy. As part of this work, the Commission may explore the potential effects of changing the allowable methods of calculating the UPL.
In the future, as data on UPL payments to other providers become available, the Commission may also apply a similar framework to examine payments to other provider types. For example, nursing facility UPL payments are the second-largest type of UPL payments. MACPAC is in the process of updating its compendium of state methods for payment for nursing facility services, which will provide more information on UPL payments to these facilities.

Chapter 2: Oversight of Upper Payment Limit Supplemental Payments to Hospitals
50 March 2019
Endnotes1 Federal rules describe three separate classes of hospital providers, based on ownership (state government-owned or operated, non-state government-owned or operated, and private). UPL payments can be targeted to other groups of hospitals, such as rural hospitals and specialty hospitals.
2 Although managed care payments are not subject to the UPL, they are required to be actuarially sound, meaning that they are projected to provide for all reasonable, appropriate, and attainable costs that are required under the terms of the contract and the operation of the managed care plan (42 CFR 438.4).
3 DSH payments offset hospital uncompensated care costs for Medicaid and uninsured patients. Supplemental payments authorized under Section 1115 demonstrations include uncompensated care pools and delivery system reform incentive payments.
4 Other services for which states are required to submit UPL demonstrations include services provided in nursing facilities, institutions for mental diseases (IMDs), clinics, intermediate care facilities for individuals with intellectual disabilities, psychiatric residential treatment facilities, and other qualified practitioners (CMS 2019). More information about UPL payments for other provider types is available in Chapter 6 of MACPAC’s March 2014 report to Congress (MACPAC 2014).
5 Analysis excludes DSH payments to IMDs.
6 Although the use of supplemental payments grew rapidly during this period, the overall Medicaid payment-to-cost ratio for inpatient hospital services declined from 94.5 percent in 2000 to 88.1 percent in 2016 (AHA 2018).
7 In FY 2011, Texas reported $3.0 billion in UPL payments to hospitals. These payments were transitioned to Section 1115 waiver supplemental payments when the state expanded managed care in FY 2012.
8 Analysis excludes graduate medical education (GME) payments to hospitals, which are also subject to UPL requirements.
9 Shared savings payments to hospitals for health homes or primary care case management generally are not considered
to be payments for hospital services so they are not included in hospital UPL calculations.
10 In 2016, Medicare accounted for about one-quarter of national health spending on hospital care (OACT 2017).
11 When CMS first required that states calculate a separate UPL for non-state government-owned hospitals in 2001, CMS allowed public hospitals to receive UPL payments up to 150 percent of the Medicare estimate. However, in 2002, the UPL for public hospitals was lowered to 100 percent of the Medicare estimate, the same limit that applies to other classes of providers. The regulations provided a transition period for hospitals that were receiving UPL payments in excess of the new limit (CMS 2002).
12 Hospitals with Medicaid payments that are based on actual, reconciled costs are not required to be included in the UPL demonstration, but hospitals that receive cost-based payments that are not reconciled to actual costs are required to be included in the UPL demonstration. Although Medicare currently does not pay most hospitals based on costs, CMS considers cost-based payment to be consistent with Medicare payment principles. Medicare payments to most hospitals are based on the prospective payment system. However, Medicare pays critical access hospitals 101 percent of their costs.
13 Critical access hospitals receive a special payment designation from Medicare because they are small (fewer than 25 beds) and are often the only hospital providers in their communities.
14 Hospital-specific data were not available for Arizona, New York, and Tennessee. Inpatient hospital UPL data were not available for North Dakota, but outpatient hospital UPL data were available.
15 For example, actual UPL payments reported in FY 2014 were $7.5 billion larger than hospital UPL payments reported on SFY 2014 UPL demonstrations and aggregate actual UPL payments reported in FY 2015 were $11.0 billion larger than hospital UPL payments reported in SFY 2015.
16 Medicaid GME payments are a component of Medicaid payments for inpatient hospital services that are subject to the UPL. Some states incorporate GME costs into the calculation of base payments to teaching hospitals, while other states make GME payments as a supplemental payment.

Chapter 2: Oversight of Upper Payment Limit Supplemental Payments to Hospitals
51Report to Congress on Medicaid and CHIP
17 Hospital payments that are financed using certified public expenditures (CPEs) are considered to be cost-based by CMS and are excluded from state UPL demonstrations. We do not have complete information on how hospital payments are financed, but we know that California public hospitals are financed using CPEs, which explains why these payments are excluded. In SFY 2014, these hospitals received $3.7 billion in Medicaid FFS payments (Navigant 2017).
18 Prior period adjustments are retrospective changes to Medicaid spending reported in a prior calendar quarter.
ReferencesAgency for Healthcare Research and Quality (AHRQ), U.S. Department of Health and Human Services. 2017. HCUP fast stats. Rockville, MD: AHRQ. https://www.hcup-us.ahrq.gov/faststats/national/ inpatienttrends.jsp?measure1=02&characteristic1=04&time1 =10& measure2=&characteristic2=01 &time2=10& expansionInfoState =hide&dataTablesState=hide& definitionsState=hide&exportState =hide
American Hospital Association (AHA). 2018. Trendwatch chartbook. Washington, DC: AHA. https://www.aha.org/guidesreports/2018-05-22-trendwatch-chartbook-2018.
Bachrach, D. and M. Dutton. 2011. Medicaid supplemental payments: Where do they fit in payment reform? Hamilton, NJ: Center for Health Care Strategies, Inc. https://www.chcs.org/resource/medicaid-supplemental-payments-where-do-they-fit-in-payment-reform-2/.
Centers for Medicare & Medicaid Services (CMS), U.S. Department of Health and Human Services. 2019. Payment limit demonstrations. Baltimore, MD: CMS. https://www.medicaid.gov/medicaid/finance/payment-limit-demonstrations/index.html.
Centers for Medicare & Medicaid Services (CMS), U.S. Department of Health and Human Services. 2013. Letter from Cindy Mann to state Medicaid directors regarding “Federal and state oversight of Medicaid expenditures.” March 18, 2013. https://www.medicaid.gov/Federal-Policy-Guidance/Downloads/SMD-13-003-02.pdf.
Centers for Medicare & Medicaid Services (CMS), U.S. Department of Health and Human Services. 2002. Medicaid program; Modification of the Medicaid upper payment limit for non-state government-owned or operated hospitals. Final rule. Federal Register 67, no. 13 (January 18): 2602–2611. https://www.federalregister.gov/d/02-1482.
Centers for Medicare & Medicaid Services (CMS), U.S. Department of Health and Human Services. 2001. Medicaid program; Revision to Medicaid upper payment limit requirements for hospital services, nursing facility services, intermediate care facility services for the mentally retarded, and clinic services. Final rule. Federal Register 66, no. 9 (January 12): 3148–3177. https://www.federalregister.gov/d/01-635.
Centers for Medicare & Medicaid Services (CMS), U.S. Department of Health and Human Services. 1987. Medicaid program; Revisions to Medicaid payments for hospital and long-term care facility services. Final rule with comment period. Federal Register 52, no. 144 (July 28): 28141–28148. https://www.gpo.gov/fdsys/pkg/FR-1987-07-28/pdf/FR-1987-07-28.pdf.
Medicaid and CHIP Payment and Access Commission (MACPAC). 2019. Medicaid base and supplemental payments to hospitals. Washington, DC: MACPAC. https://www.macpac.gov/publication/medicaid-base-and-supplemental-payments-to-hospitals/.
Medicaid and CHIP Payment and Access Commission (MACPAC). 2018a. Medicaid hospital payment: Policy issues and Commission analytic plan. January 2018. Washington, DC: MACPAC. https://www.macpac.gov/publication/medicaid-hospital-payment-policy-issues-and-commission-analytic-plan/.
Medicaid and CHIP Payment and Access Commission (MACPAC). 2018b. State Medicaid payment policies for inpatient hospital services. Washington, DC: MACPAC. https://www.macpac.gov/publication/macpac-inpatient-hospital-payment-landscapes/.
Medicaid and CHIP Payment and Access Commission (MACPAC). 2018c. Exhibit 47: Medicaid benefit spending in MSIS and CMS-64 data by state. In MACStats: Medicaid and CHIP Data Book. Washington, DC: MACPAC. December 2018. https://www.macpac.gov/publication/medicaid-benefit-spending-in-msis-and-cms-64-data-by-state/.
https://www.macpac.gov/publication/medicaid-hospital-payment-policy-issues-and-commission-analytic-p

Chapter 2: Oversight of Upper Payment Limit Supplemental Payments to Hospitals
52 March 2019
Medicaid and CHIP Payment and Access Commission (MACPAC). 2017. Chapter 3: Improving the targeting of disproportionate share hospital payments to providers. In Report to Congress on Medicaid and CHIP. March 2017. Washington, DC: MACPAC. https://www.macpac.gov/publication/improving-the-targeting-of-disproportionate-share-hospital-payments-to-providers/.
Medicaid and CHIP Payment and Access Commission (MACPAC). 2016a. State Medicaid payment policies for outpatient hospital services. Washington, DC: MACPAC. https://www.macpac.gov/publication/state-medicaid-payment-policies-for-outpatient-hospital-services/.
Medicaid and CHIP Payment and Access Commission (MACPAC). 2016b. Report to Congress on Medicaid disproportionate share hospital payments. February 2016. Washington, DC: MACPAC. https://www.macpac.gov/publication/report-to-congress-on-medicaid-disproportionate-share-hospital-payments/.
Medicaid and CHIP Payment and Access Commission (MACPAC). 2014. Chapter 6: Examining the policy implications of Medicaid non-disproportionate share hospital supplemental payments. In Report to the Congress on Medicaid and CHIP. March 2014. Washington, DC: MACPAC. https://www.macpac.gov/publication/ch-6-examining-the-policy-implications-of-medicaid-non-disproportionate-share-hospital-supplemental-payments/.
Medicare Payment Advisory Commission (MedPAC). 2018a. Chart 6-19: Overall Medicare margin, 2006–2016. In Health care spending and the Medicare Program. June 2018. Washington, DC: MedPAC. http://www.medpac.gov/docs/default-source/data-book/jun18_databookentirereport_sec.pdf?sfvrsn=0.
Medicare Payment Advisory Commission (MedPAC). 2018b. Chart 6-16: Medicare inpatient payments, by source and PPS hospital group, 2016. In Health care spending and the Medicare Program. June 2018. Washington, DC: MedPAC. http://www.medpac.gov/docs/default-source/data-book/jun18_databookentirereport_sec.pdf?sfvrsn=0.
Medicare Payment Advisory Commission (MedPAC) and Medicaid and CHIP Payment and Access Commission (MACPAC). 2018. Data book: Beneficiaries dually eligible
for Medicare and Medicaid. January 2018. Washington, DC: MedPAC and MACPAC. https://www.macpac.gov/publication/data-book-beneficiaries-dually-eligible-for-medicare-and-medicaid-3.
Navigant. 2017. Evaluation of uncompensated care financing for California hospitals. Sacramento, CA: California Department of Health Care Services. http://www.dhcs.ca.gov/provgovpart/Documents/MediCal2020SecondUCReport.pdf.
Office of the Actuary (OACT), Centers for Medicare & Medicaid Services (CMS). 2017. National health expenditures by type of service and source of funds: Calendar years 1960–2016. Baltimore, MD: OACT. https://www.cms.gov/Research-Statistics-Data-and-Systems/Statistics-Trends-and-Reports/NationalHealthExpendData/NationalHealthAccountsHistorical.html.
Office of Inspector General (OIG), U.S. Department of Health and Human Services (HHS). 2018. Although hospital tax programs in seven states complied with hold-harmless requirements, the tax burden on hospitals was significantly mitigated (A-03-16-00202). HHS: Washington, DC. https://oig.hhs.gov/oas/reports/region3/31600202.pdf.
Office of Inspector General (OIG), U.S. Department of Health and Human Services (HHS). 2001. Review of Medicaid enhanced payments to local public providers and the use of intergovernmental transfers (A-03-00-00216). HHS: Washington, DC. https://oig.hhs.gov/oas/reports/region3/30000216.pdf.
Office of Management and Budget (OMB), Executive Office of the President. 2018. Letter from Mick Mulvaney to the heads of executive departments and agencies regarding “Appendix A to OMB Circular No. A-123, Management of reporting and data integrity risk.” June 6, 2018. https://www.whitehouse.gov/wp-content/uploads/2018/06/M-18-16.pdf.
U.S. Government Accountability Office (GAO). 2016. Federal guidance needed to address concerns about distribution of supplemental payments. Report no. GAO-16-108. Washington, DC: GAO. https://www.gao.gov/products/GAO-16-108.
https://www.macpac.gov/publication/improving-the-targeting-of-disproportionate-share-hospital-paymen
https://www.macpac.gov/publication/improving-the-targeting-of-disproportionate-share-hospital-paymen
https://www.macpac.gov/publication/improving-the-targeting-of-disproportionate-share-hospital-paymen
https://www.macpac.gov/publication/state-medicaid-payment-policies-for-outpatient-hospital-services/
https://www.macpac.gov/publication/state-medicaid-payment-policies-for-outpatient-hospital-services/
https://www.macpac.gov/publication/report-to-congress-on-medicaid-disproportionate-share-hospital-pa
https://www.macpac.gov/publication/report-to-congress-on-medicaid-disproportionate-share-hospital-pa
https://www.macpac.gov/publication/ch-6-examining-the-policy-implications-of-medicaid-non-disproport
https://www.macpac.gov/publication/ch-6-examining-the-policy-implications-of-medicaid-non-disproport
https://www.macpac.gov/publication/ch-6-examining-the-policy-implications-of-medicaid-non-disproport
https://www.macpac.gov/publication/data-book-beneficiaries-dually-eligible-for-medicare-and-medicaid

Chapter 2: Oversight of Upper Payment Limit Supplemental Payments to Hospitals
53Report to Congress on Medicaid and CHIP
U.S. Government Accountability Office (GAO). 2014a. States’ increased reliance on funds from health care providers and local governments warrants improved CMS data collection. Report no. GAO-14-627. Washington, DC: GAO. http://www.gao.gov/products/GAO-14-627.
U.S. Government Accountability Office (GAO). 2014b. Standards for Internal Control in the Federal Government. Report no. GAO-14-704G. Washington, DC: GAO. https://www.gao.gov/assets/670/665712.pdf.
U.S. Government Accountability Office (GAO). 2012. More transparency of and accountability for supplemental payments are needed. Report no. GAO-13-48. Washington, DC: GAO. https://www.gao.gov/products/GAO-13-48.

Commission Vote on Recommendations
54 March 2019
Oversight of Upper Payment Limit Supplemental Payments to Hospitals2.1 The Secretary of the U.S. Department of Health and Human Services should establish process controls
to ensure that annual hospital upper payment limit demonstration data are accurate and complete and that the limits calculated with these data are used in the review of claimed expenditures.
2.2 To help inform development of payment methods that promote efficiency and economy, the Secretary of the U.S. Department of Health and Human Services should make hospital-specific upper payment limit demonstration data and methods publicly available in a standard format that enables analysis.
Yes: Bella, Burwell, Carter, Cerise, Davis, Douglas, George, Gordon, Gorton, Lampkin, Milligan, Retchin, Scanlon, Szilagyi, Thompson, Weil, Weno
Commission Vote on RecommendationsIn its authorizing language in the Social Security Act (42 USC 1396), Congress requires MACPAC to review Medicaid and CHIP program policies and make recommendations related to those policies to Congress, the Secretary of the U.S. Department of Health and Human Services, and the states in its reports to Congress, which are due by March 15 and June 15 of each year. Each Commissioner must vote on each recommendation, and the votes for each recommendation must be published in the reports. The recommendations included in this report, and the corresponding voting record below, fulfill this mandate.
Per the Commission’s policies regarding conflicts of interest, the Commission’s conflict of interest committee convened prior to the vote to review and discuss whether any conflicts existed relevant to the recommendations on oversight of upper payment limit supplemental payments to hospitals. It determined that, under the particularly, directly, predictably, and significantly standard that governs its deliberations, no Commissioner has an interest that presents a potential or actual conflict of interest.
The Commission voted on the recommendations in this chapter on January 24, 2019.
1700
YesNoNot voting

Chapter 2: APPENDIX 2A
55Report to Congress on Medicaid and CHIP
APPENDIX 2A: Methods Form CMS-64 expenditure reports are the official record of state-level Medicaid spending, but states use claims-level data from their Medicaid Management Information Systems (MMIS) to report spending on their annual upper payment limit (UPL) demonstrations. These data sources differ in how spending is reported and how services are defined (Table 2A-1).
In order to compare spending reported in these two data sources, we used CMS-64 data that was as closely aligned with the UPL demonstration data as possible. We made several adjustments to the approach that MACPAC usually uses to report CMS-64 spending in MACStats and other publications:
Time period alignment. We used CMS-64 spending data from the calendar quarters that match the state fiscal years (SFY) of most states (July 1, 2015—June 30, 2016 for SFY 2016).1
Prior period adjustments. We accounted for all prior period adjustments that were applied to SFY 2016 spending as reported through December 2017, and we excluded spending reported in SFY 2016 that was an adjustment to a prior period.
Critical access hospital spending. We did not include hospital spending reported on the critical access hospital line of the CMS-64 expenditure report because this spending is often excluded from UPL demonstrations, and the CMS-64 does not distinguish between inpatient and outpatient
TABLE 2A-1. Data Sources and Definitions for State UPL Demonstrations and CMS-64 Expenditure Reports
Data sources and definitions State UPL demonstrations Form CMS-64 expenditure reports
Data source State Medicaid Management Information System
Federal Medicaid Budget and Expenditure System
Time period State fiscal year Federal calendar quartersDates of service Date service was performed Date federal payment was madeMethod of reporting payments
Adjudicated claim amount Final paid amount (including prior period adjustments)
Excluded hospitals Hospitals paid on a cost-basis (typically critical access hospitals and some government-owned hospitals)
None, although spending on critical access hospitals is reported separately
Excluded payments Cross-over payments for patients dually eligible for Medicare and Medicaid
None
Definition of supplemental payments
UPL and GME payments for FFS only
UPL and GME payments are reported on separate lines
• Section 1115 supplemental payments are sometimes reported on the UPL spending line
• Some states appear to report UPL payments on the base payment spending line (e.g., Missouri)
• Managed care supplemental payments are supposed to be reported as part of managed care capitation payments, but some managed care GME payments may be included on the GME line
Notes: UPL is upper payment limit. GME is graduate medical education. FFS is fee for service.

Chapter 2: APPENDIX 2A
56 March 2019
hospital services. In fiscal year (FY) 2016, states reported $0.8 billion in fee-for-service (FFS) payments for critical access hospitals, which was 1 percent of total non-disproportionate share hospital (DSH) FFS spending on hospitals.
Emergency hospital services. We also did not include emergency hospital services provided to undocumented immigrants because this spending is not reported separately for inpatient and outpatient hospital services, and the Centers for Medicare & Medicaid Services (CMS) guidance does not clarify whether this spending is included in UPL demonstrations or not. In FY 2016, states reported $3.5 billion in FFS payments for emergency hospital services, which was 5 percent of total non-DSH FFS spending on hospitals.
Section 1115 supplemental payments. We excluded supplemental payments authorized under Section 1115 demonstrations from spending reported on the UPL spending line of CMS-64 expenditure reports. In SFY 2016, $7.6 billion in Section 1115 supplemental payments were reported on the UPL spending line of CMS-64 expenditure reports.2
Despite these adjustments, several limitations remain, which may explain some of the differences that we observe between spending reported on UPL demonstrations and spending reported on CMS-64 expenditure reports. These include:
Different methods for tracking dates. The date that a service was performed (used for UPL demonstrations) is earlier than the date that federal payment for the service was made (used on CMS-64 expenditure reports). The CMS-64 reports include a method for tracking the date of service for DSH payments, and it is common for states to report making DSH payments a year or two after the date of service.
Cross-over payments. UPL demonstrations do not include Medicaid payments for cross-over claims for patients who are dually eligible for Medicare and Medicaid, but CMS-64 expenditure reports do not identify this spending separately. Medicaid FFS spending was $1.1 billion on inpatient hospital services and $1.1 billion on outpatient hospital services for full-benefit dually eligible beneficiaries in calendar year 2013 (MedPAC and MACPAC 2018).
Managed care graduate medical education (GME) payments. Only GME payments attributable to FFS are included in state UPL demonstrations, but CMS-64 expenditure reports do not distinguish whether these payments are for managed care or FFS. States reported a total of $2.0 billion in GME payments in SFY 2016 on CMS-64 expenditure reports.
Endnotes1 Four states have state fiscal years that do not end June 30. The state fiscal year ends March 31 in New York, August 31 in Texas, and September 30 in Alabama and Michigan.
2 Section 1115 supplemental payments were identified based on a review of the special terms and conditions for waivers that authorize supplemental payments, and spending on these payments was tracked using the additional spending forms identified in the waiver terms and conditions.

Chapter 3:
Annual Analysis of Disproportionate Share Hospital Allotments to States

Chapter 3: Annual Analysis of Disproportionate Share Hospital Allotments to States
58 March 2019
Annual Analysis of Disproportionate Share Hospital Allotments to StatesKey Points
• MACPAC continues to find no meaningful relationship between states’ disproportionate share hospital (DSH) allotments and the three factors that Congress has asked the Commission to study:
– the number of uninsured individuals;
– the amount and sources of hospitals’ uncompensated care costs; and
– the number of hospitals with high levels of uncompensated care that also provide essential community services for low-income, uninsured, and vulnerable populations.
• In 2017, 28.5 million people were uninsured, a 32 percent decline from 2013.
• The coverage expansions under the Patient Protection and Affordable Care Act (ACA, P.L. 111-148, as amended) are resulting in different effects on the two types of uncompensated care that DSH payments help offset: (1) unpaid costs of care for uninsured individuals, and (2) Medicaid shortfall, the difference between a hospital’s Medicaid payments and its costs of providing services to Medicaid-enrolled patients.
– Charity care and bad debt are declining. Nationally, hospitals reported a $5.7 billion decline in charity care and bad debt from 2013 to 2014.
– Medicaid shortfall is increasing. Hospitals reported a $0.9 billion increase in Medicaid shortfall on the American Hospital Association Annual Survey in the same period.
– For hospitals that received DSH payments in state plan rate years 2013 and 2014 (41 percent of all U.S. hospitals), the increase in Medicaid shortfall reported on DSH audits ($4.0 billion) outpaced the decline in unpaid costs of care for uninsured patients ($1.6 billion) for these years.
– In 2016, hospitals reported a total of $35.0 billion in charity care and bad debt and $20.0 billion in Medicaid shortfall.
• In fiscal year (FY) 2019, $12.6 billion in federal DSH funds were allotted to states ($22.3 billion in state and federal funds combined). These allotments are scheduled to be reduced in fiscal FY 2020, with cuts continuing through FY 2025.
• State DSH allotments, which are based on state DSH spending in FY 1992, vary widely today, and the DSH allotment reduction methodology prescribed by statute is projected to preserve much of that variation.
• In the coming year, the Commission will continue to examine other DSH policy issues as part of its broader examination of all types of Medicaid payments to hospitals.

Chapter 3: Annual Analysis of Disproportionate Share Hospital Allotments to States
59Report to Congress on Medicaid and CHIP
CHAPTER 3: Annual Analysis of Disproportionate Share Hospital Allotments to StatesState Medicaid programs are statutorily required to make disproportionate share hospital (DSH) payments to hospitals that serve a high proportion of Medicaid beneficiaries and other low-income patients. The total amount of such payments is limited by annual federal DSH allotments, which vary widely by state. States can distribute DSH payments to virtually any hospital in their state, but total DSH payments to a hospital cannot exceed the total amount of uncompensated care that the hospital provides. DSH payments help to offset two types of uncompensated care: Medicaid shortfall (the difference between a hospital’s Medicaid payments and its costs of providing services to Medicaid-enrolled patients) and unpaid costs of care for uninsured individuals. More generally, DSH payments also help to support the financial viability of safety-net hospitals.
MACPAC is statutorily required to report annually on the relationship between state allotments and several potential indicators of the need for DSH funds:
• changes in the number of uninsured individuals;
• the amounts and sources of hospitals’ uncompensated care costs; and
• the number of hospitals with high levels of uncompensated care that also provide essential community services for low-income, uninsured, and vulnerable populations.
As in our previous DSH reports, we find little meaningful relationship between DSH allotments and the factors that Congress asked the Commission to study. This is because DSH allotments are largely based on states’ historical DSH spending before federal limits were established. Moreover, the variation is projected to continue after federal DSH allotment reductions take effect.
In this report, we update our previous findings to reflect new information on changes in the number of uninsured individuals and levels of hospital uncompensated care. We also provide updated information on deemed DSH hospitals, which are statutorily required to receive DSH payments because they serve a high share of Medicaid-enrolled and low-income patients. Specifically, we find the following:
• According to the Current Population Survey, 28.5 million people, or 8.8 percent of the U.S. population, were uninsured in 2017, about the same percentage as in 2016. Since 2013, the number of uninsured individuals has declined 32 percent, with the largest declines in states that expanded Medicaid under the Patient Protection and Affordable Care Act (ACA, P.L. 111-148, as amended).1
• Hospitals reported $35.0 billion in hospital charity care and bad debt on Medicare cost reports in 2016, an 8 percent decline from 2015. Because of recent changes in Medicare cost report definitions that affected uncompensated care reported for 2015 and subsequent years, we can no longer compare these data with the amount of uncompensated care reported in 2013.2
• Hospitals reported $20.0 billion in Medicaid shortfall on the American Hospital Association (AHA) annual survey in 2016, a 24 percent increase from the amount reported in 2015. Since 2013, the amount of Medicaid shortfall for all hospitals has increased by $6.8 billion (AHA 2017, 2015).

Chapter 3: Annual Analysis of Disproportionate Share Hospital Allotments to States
60 March 2019
• In 2016, deemed DSH hospitals continued to report lower aggregate operating margins than other hospitals (negative 6.0 percent for deemed DSH hospitals versus negative 0.9 percent for all hospitals). Total margins (which include government appropriations and revenue not directly related to patient care) were similar between deemed DSH hospitals (6.2 percent) and all hospitals (6.7 percent). Aggregate operating and total margins for deemed DSH hospitals would have been about 4 percentage points lower without DSH payments.
In this report, we also present new data on the early effects of the ACA coverage expansions using DSH audit data. While other data suggest that total hospital uncompensated declined in 2014, state plan rate year (SPRY) 2014 DSH audit data show a net increase in total uncompensated care costs for DSH hospitals because of an increase in Medicaid shortfall.3 For hospitals included in SPRY 2013 and 2014 DSH audits, the increase in Medicaid shortfall ($4.0 billion) was more than twice as large as the decline in unpaid costs of care for uninsured patients ($1.6 billion).
We also project fiscal year (FY) 2020 DSH allotments before and after implementation of federal DSH allotment reductions.4 DSH allotment reductions were included in the ACA under the assumption that increased insurance coverage through Medicaid and the exchanges would lead to reductions in hospital uncompensated care and thereby lessen the need for DSH payments. DSH allotment reductions have been delayed several times, most recently in February 2018 by the Bipartisan Budget Act (P.L. 115-123). Under current law, the first round of reductions (amounting to $4 billion or 31 percent of unreduced amounts) is now scheduled to take effect in FY 2020. Reductions are currently scheduled to increase to $8 billion in FYs 2021–2025, which is more than half of states’ unreduced allotment amounts.
Chapter 1 of this report provides the Commission’s recommendations for restructuring DSH allotment reductions. Specifically, the Commission is calling
for phasing in reductions more gradually and changing the methodology for distributing reductions among states to help improve the relationship between DSH allotments and measures related to hospital uncompensated care costs. Although the Commission is concerned that the magnitude of DSH cuts assumed under current law may affect the financial viability of some safety-net hospitals, the Commission’s analyses have focused on budget-neutral ways to restructure available funding.
This chapter focuses on DSH allotments to states, but the Commission is also interested in exploring changes to other policies that would affect the distribution of DSH payments to hospitals within states. The Commission has long held that DSH payments should be better targeted to hospitals that serve a high share of Medicaid-enrolled and low-income uninsured patients and have higher levels of uncompensated care, consistent with the original statutory intent of the law establishing DSH payments. However, development of policy to achieve this goal must be considered in terms of all Medicaid payments that hospitals receive.
BackgroundCurrent DSH allotments vary widely among states, reflecting the evolution of federal policy over time. States began making Medicaid DSH payments in 1981, when Medicaid hospital payments were delinked from Medicare payment levels. Initially, states were slow to make these payments, and in 1987, Congress required states to make payments to hospitals that serve a high share of Medicaid-enrolled and low-income patients, referred to as deemed DSH hospitals. DSH spending grew rapidly in the early 1990s—from $1.3 billion in 1990 to $17.7 billion in 1992—after Congress clarified that DSH payments were not subject to Medicaid’s hospital payment limitations and CMS issued guidance permitting the use of provider taxes to finance the non-federal share of Medicaid payments (Holahan et al. 1998).5

Chapter 3: Annual Analysis of Disproportionate Share Hospital Allotments to States
61Report to Congress on Medicaid and CHIP
In 1991, Congress enacted state-specific caps on the amount of federal funds that could be used to make DSH payments, referred to as allotments (Box 3-1). Allotments were initially established for FY 1993 and were generally based on each state’s FY 1992 DSH spending. Although Congress has made several incremental adjustments to these allotments, the states that spent the most in FY 1992 still have the largest allotments, and the states that spent the least in FY 1992 still have the smallest allotments.6
In FY 2017, federal funds allotted to states for DSH payments totaled $12.0 billion, of which states spent $10.4 billion.7 (States spent $18.1 billion in state and federal funds combined.) DSH allotments that year ranged from less than $15 million in six states (Delaware, Hawaii, Montana, North Dakota, South Dakota, and Wyoming) to more than $1 billion in three states (California, New York, and Texas).
DSH spending accounted for 3.2 percent of total Medicaid benefit spending in FY 2017, an amount
that has been relatively consistent since FY 2011.8 DSH spending as a share of total state Medicaid benefit spending varied widely by state, from less than 1 percent in 9 states to 12.3 percent in New Hampshire (Figure 3-1).
States have up to two years to spend their DSH allotment, and $1.2 billion in federal DSH allotments for FY 2016 went unspent.9 There are two primary reasons states do not spend their full DSH allotment: (1) they lack state funds to provide the non-federal share; and (2) the DSH allotment exceeds the total amount of hospital uncompensated care in the state. As noted above, DSH payments to an individual hospital cannot exceed that hospital’s level of uncompensated care. In FY 2016, half of unspent DSH allotments were attributable to five states (Connecticut, New Hampshire, New Jersey, Pennsylvania, and Washington) and the District of Columbia, all of which had FY 2016 DSH allotments (including both state and federal funds) that were larger than the
BOX 3-1. Glossary of Key Medicaid Disproportionate Share Hospital Terminology
DSH hospital. A hospital that receives disproportionate share hospital (DSH) payments and meets the minimum statutory requirements to be eligible for DSH payments; that is, a Medicaid inpatient utilization rate of at least 1 percent and at least two obstetricians with staff privileges that treat Medicaid enrollees (with certain exceptions for rural and children’s hospitals).
Deemed DSH hospital. A DSH hospital with a Medicaid inpatient utilization rate of at least one standard deviation above the mean for hospitals in the state that receive Medicaid payments, or a low-income utilization rate that exceeds 25 percent. Deemed DSH hospitals are required to receive Medicaid DSH payments (§ 1923(b) of the Social Security Act (the Act)).
State DSH allotment. The total amount of federal funds available to a state for Medicaid DSH payments. To draw down federal DSH funding, states must provide state matching funds at the same matching rate as other Medicaid service expenditures. If a state does not spend the full amount of its allotment for a given year, the unspent portion is not paid to the state and does not carry over to future years. Allotments are determined annually and are generally equal to the prior year’s allotment, adjusted for inflation (§ 1923(f) of the Act).
Hospital-specific DSH limit. The annual limit on DSH payments to individual hospitals, equal to the sum of Medicaid shortfall and unpaid costs of care for uninsured patients for allowable inpatient and outpatient costs.

Chapter 3: Annual Analysis of Disproportionate Share Hospital Allotments to States
62 March 2019
FIGURE 3-1. DSH Spending as a Share of Total Medicaid Benefit Spending, by State, FY 2017
< 1% 1% – 1.9% 2% – 3.9% 4% – 7.9% ≥ 8%
1.1%
2.5%2
1.7%
3.3%
2.7%
5.1%10.5%
4.1% 8.6% 4.3%8.3%
6.6%
3.9%RI: 5.3%
NH: 12.3%
1.9%
2.1%
2.9% 4.5% 5.8%
1.6%
0.6%1.8%2.3%
3.8%
3.1%
VT: 2.3%
CT: 1.8%NJ: 5.4%
1.1%
0.1%
1.2%
1.1%
1.5%
1.3%
1.4%
1.0%1.5%
1.6%
DE: 1.3%MD: 1.3%
DC: 1.8%
0.2%
0.2%0.8%
1.3%
0.6%
0.9% 1.1%0.9%
MA: – ¹
Notes: DSH is disproportionate share hospital. FY is fiscal year.
― Dash indicates zero.1 Massachusetts does not make DSH payments to hospitals because its Section 1115 demonstration allows the state to use all of its DSH funding for the state’s safety-net care pool instead.2 DSH spending for California includes DSH-financed spending under the state’s Global Payment Program, which is authorized under the state’s Section 1115 demonstration.
Source: MACPAC, 2019, analysis of CMS-64 Financial Management Report net expenditure data as of October 19, 2018.
total amount of hospital uncompensated care in the state as reported on 2016 Medicare cost reports.10
In SPRY 2014, 45 percent of U.S. hospitals received DSH payments (Table 3-1).11 States are allowed to make DSH payments to any hospital that has a Medicaid inpatient utilization rate of at least 1 percent, which is true of almost all U.S. hospitals.12 Public teaching hospitals in urban settings received the largest share of total DSH funding. Half of all rural hospitals also received DSH payments, including many critical access hospitals, which
receive a special payment designation from Medicare because they are small and often the only provider in their geographic area. Many states also make DSH payments to institutions for mental diseases (IMDs), which historically have not been eligible for Medicaid payment for services provided to individuals age 21–64, but are eligible for DSH funding.13 In SPRY 2014, Maine made DSH payments exclusively to IMDs, and four states (Alaska, Connecticut, Maryland, and North Dakota) spent more than half of their DSH allotments on DSH payments to IMDs.14

Chapter 3: Annual Analysis of Disproportionate Share Hospital Allotments to States
63Report to Congress on Medicaid and CHIP
TABLE 3-1. Distribution of DSH Spending by Hospital Characteristics, SPRY 2014
Hospital characteristics
Number and share of hospitals
Total DSH spending (millions)
DSH hospitals
All hospitals
DSH hospitals as percentage of all hospitals
in category
Total 2,714 5,969 45% $17,745Hospital typeShort-term acute care hospital 1,887 3,307 57 14,618Critical access hospital 591 1,339 44 378Psychiatric hospital 134 547 24 2,401Long-term care hospital 24 416 6 45Rehabilitation hospital 31 271 11 7Children's hospital 47 89 53 296Urban or rural
Urban 1,457 3,503 42 15,940
Rural 1,257 2,466 51 1,805Hospital ownershipFor-profit 436 1,791 24 1,235Non-profit 1,562 2,931 53 5,466Public 716 1,247 57 11,044Teaching statusNon-teaching hospital 1,901 4,779 40 4,747Low-teaching hospital 462 737 63 2,737High-teaching hospital 351 453 77 10,262Deemed DSH statusDeemed 832 832 100 12,350Not deemed 1,882 5,137 37 5,396
Notes: DSH is disproportionate share hospital. SPRY is state plan rate year, which often coincides with state fiscal year and may not align with the federal fiscal year. Excludes 111 DSH hospitals that did not submit a 2016 Medicare cost report. Low-teaching hospitals have an intern-and-resident-to-bed ratio (IRB) of less than 0.25 and high-teaching hospitals have an IRB equal to or greater than 0.25. Deemed DSH hospitals are statutorily required to receive DSH payments because they serve a high share of Medicaid-enrolled and low-income patients. Total DSH spending includes state and federal funds.
Source: MACPAC, 2019, analysis of 2016 Medicare cost reports and SPRY 2014 as-filed Medicaid DSH audits.
As noted above, states are statutorily required to make DSH payments to deemed DSH hospitals, which serve a high share of Medicaid-enrolled and low-income patients. In SPRY 2014, about 14 percent of U.S. hospitals met this standard. These deemed DSH hospitals constituted just under one-third (31 percent) of DSH hospitals but accounted for more than two-thirds (70 percent) of all DSH payments, receiving $12.4 billion in DSH payments.
Deemed DSH hospitals accounted for about half (52 percent) of all uncompensated care reported for DSH hospitals in SPRY 2014. States vary in how they distribute DSH payments to deemed DSH hospitals, from less than 10 percent of payments in two states (Alabama and Utah) to 100 percent in six states (Arkansas, Arizona, Delaware, Illinois, Iowa, and Maine) and the District of Columbia.

Chapter 3: Annual Analysis of Disproportionate Share Hospital Allotments to States
64 March 2019
State DSH targeting policies are difficult to categorize. States that concentrate DSH payments among a small number of hospitals do not necessarily make the largest share of payments to deemed DSH hospitals (e.g., North Dakota); conversely, some states that distribute DSH payments across most hospitals still target the largest share of DSH payments to those that are deemed DSH hospitals (e.g., New York) (Figure 3-2). States’ criteria for identifying eligible DSH hospitals and how much funding they receive vary, but are often related to hospital ownership, hospital type, and geographic factors. The methods states use to finance the non-federal share of DSH payments may also affect their DSH targeting policies.15 More
information about state DSH targeting policies is included in Chapter 3 of MACPAC’s March 2017 report to Congress (MACPAC 2017a).
State DSH policies change frequently, often as a function of state budgets; the amounts paid to hospitals are more likely to change than the types of hospitals receiving payments. About 9 in 10 of the hospitals that received DSH payments in SPRY 2014 also received DSH payments in SPRY 2013. But about one-quarter of hospitals receiving DSH payments in both SPRY 2013 and SPRY 2014 reported that the amount they received in SPRY 2014 differed (either increased or decreased) from the amount they received in SPRY 2013 by more than 50 percent.
FIGURE 3-2. Share of Hospitals Receiving DSH Payments and Share of DSH Payments to Deemed DSH Hospitals, by State, SPRY 2014
0% 10% 20% 30% 40% 50% 60% 70% 80% 90% 100%
0%
10%
20%
30%
40%
50%
60%
70%
80%
90%
100%
Share of hospitals receiving DSH payments
Shar
e of
DSH
pay
men
ts to
dee
med
DSH
hos
pita
ls MEIA, AR DE AZ DCIL
CANV
MNVAFL, NETX NJNM
LA NYNC KYAK MSTN WA COIN WVMD
ID GA PAORWI MO
VTSD MISCKSOKND OHWY
NHCT
RIMT
AL UT
Notes: DSH is disproportionate share hospital. SPRY is state plan rate year, which often coincides with state fiscal year and may not align with the federal fiscal year. The share of DSH payments to deemed DSH hospitals shown does not account for provider contributions to the non-federal share; these contributions may reduce net payments. Analysis excludes Massachusetts, which does not make DSH payments to hospitals because its Section 1115 demonstration allows the state to use all of its DSH funding for the state’s safety-net care pool instead, and Hawaii, which did not make DSH payments in SPRY 2014.
Source: MACPAC, 2019, analysis of 2016 Medicare cost reports and SPRY 2014 as-filed Medicaid DSH audits.

Chapter 3: Annual Analysis of Disproportionate Share Hospital Allotments to States
65Report to Congress on Medicaid and CHIP
Changes in the Number of Uninsured IndividualsAccording to the Current Population Survey, 28.5 million people, or 8.8 percent of the U.S. population, were uninsured in 2017, which is not statistically different from 2016 (28.1 million, 8.8 percent) (Berchick et al. 2018).16 This number does not include individuals who were uninsured for part of the year.17
The number of uninsured individuals in the United States in 2017 (28.5 million) represented a decline of 13.3 million from the number reported in 2013 (41.8 million), a 32 percent decrease. The decline in the number of uninsured individuals reflects increases in both private and publicly funded health insurance coverage. From 2013 to 2017, the share of the U.S. population with private coverage at some point in the year (including individual insurance purchased through a health insurance exchange) increased 3.0 percentage points to 67.2 percent, and the share of the population covered at some point in the year by publicly funded coverage (including Medicaid) increased 3.2 percentage points to 37.7 percent (Berchick et al. 2018).18
In 2017, most uninsured individuals were low-income adults. About one-quarter (24 percent) of uninsured individuals had family incomes below 100 percent of the federal poverty level (FPL) and almost half (49 percent) had family incomes below 200 percent FPL. Compared to states that did not expand Medicaid, states that expanded Medicaid had lower uninsured rates not only for individuals with family incomes at or below 138 percent FPL, but also for individuals at higher family income levels (Berchick et al. 2018).
The uninsured rate declined in all states between 2013 and 2017, and states that expanded Medicaid had larger declines (5.8 percentage points) than those that did not (4.2 percentage points), according to the American Community Survey. Louisiana, which expanded its Medicaid program in July 2016, had a 1.9 percentage point decrease in its uninsured rate between 2016 and 2017, the largest state decline in that period (Berchick et al. 2018).
Looking ahead, the number of uninsured individuals is expected to increase as the population grows, policies change, and the year-over-year effects of the ACA coverage expansions diminish. For example, in September 2018, the Congressional Budget Office (CBO) estimated that between 2018 and 2019, the number of uninsured individuals will increase by 3 million (CBO 2018a).
CBO’s projections incorporate estimates of the effects of new regulations to promote the use of association health plans and short-term, limited duration insurance plans (EBSA 2018, IRS et al. 2018). These regulations are expected to decrease the number of uninsured individuals. However, some individuals purchasing short-term, limited duration insurance plans are expected to have coverage that does not meet CBO’s minimum definition of health insurance.19
CBO’s estimates do not include the potential effects of a proposed rule issued by the U.S. Department of Homeland Security that would change the definition of public charge for purposes of immigration status. The Kaiser Family Foundation estimates that if this rule is implemented, 2.1 million to 4.9 million enrollees in Medicaid and the State Children’s Health Insurance Program who have at least one non-citizen in their families will disenroll from the programs (Artiga et al. 2018).20
Changes in the Amount of Hospital Uncompensated CareIn considering changes in the amount of uncompensated care, it is important to note that DSH payments cover both unpaid costs of care for uninsured individuals and Medicaid shortfall. Since the implementation of the ACA coverage expansions in 2014, unpaid costs of care for uninsured individuals have declined substantially, particularly in states that have expanded Medicaid. However, as the number of Medicaid enrollees has increased, Medicaid shortfall has also increased.
Chapter 3: Annual Analysis of Disproportionate Share Hospital Allotments to States
66 March 2019
Definitions of uncompensated care vary among data sources, complicating comparisons and our ability to fully understand effects at the hospital level (Box 3-2). The most recently available data on hospital uncompensated care for all hospitals comes from Medicare cost reports, which define uncompensated care as charity care and bad debt. However, Medicare cost reports do not include reliable information on Medicaid shortfall, the difference between a hospital’s costs of care for Medicaid-enrolled patients and the total payments it receives for those services. Medicaid DSH audits include data on both Medicaid shortfall and unpaid costs of care for uninsured individuals for DSH hospitals, but these data are not published until about five years after DSH payments are made.21
Below, we review the most recent uncompensated care data available for all hospitals in 2016 and new data from Medicaid DSH audits that shed light on changes in uncompensated care costs incurred by DSH hospitals between SPRY 2013 and SPRY 2014. Because DSH audit data are used for making Medicaid DSH payments, they are more accurate and better aligned with Medicaid DSH definitions than other data sources.
Unpaid costs of care for uninsured individualsAccording to Medicare cost reports, hospitals reported a total of $35.0 billion in charity care and bad debt in 2016, which was 3.6 percent of hospital operating expenses. These total costs of hospital uncompensated care for 2016 represented a decline from 2015 of $3.1 billion, or 8 percent. The states that expanded Medicaid in 2016 (Montana and Louisiana) reported a 38 percent decline from 2015.
Due to recent changes in Medicare cost report instructions, uncompensated care reported on 2016 Medicare cost reports cannot be compared with 2013 data.22 Previously, MACPAC found that charity care and bad debt reported on Medicare costs reports had declined $8.6 billion (23 percent) between 2013 and 2015 (MACPAC 2018a).
Hospitals have retroactively adjusted their 2015 cost reports to comply with new definitions, but they are not required to update uncompensated care data from 2013.23
As a share of hospital operating expenses, charity care and bad debt varied widely by state in 2016 (Figure 3-3). In the aggregate, hospitals in states that expanded Medicaid under the ACA before December 31, 2016 reported uncompensated care that was less than half of what was reported in non-expansion states (2.3 percent of hospital operating expenses in Medicaid expansion states versus 6.0 percent in states that did not expand Medicaid).
Uncompensated care reported on Medicare cost reports includes the costs of care provided to both uninsured individuals and patients with insurance who cannot pay deductibles, co-payments, or coinsurance. In 2016, about 43 percent of uncompensated care reported was for charity care for uninsured individuals ($15.1 billion), 16 percent was charity care for insured individuals ($5.7 billion), and 40 percent was for bad debt expenses for both insured and uninsured individuals ($14.2 billion).24 Uncompensated care for uninsured individuals is largely affected by the uninsured rate while uncompensated care for patients with insurance is affected by specific features of their health insurance, such as deductibles and other forms of cost sharing. When patients cannot pay cost sharing, these costs often become bad debt expenses for hospitals. In 2016, the share of private-sector enrollees in high-deductible health plans was 46.5 percent, up from 11.4 percent in 2006 (Miller et al. 2018).
Medicaid shortfall According to the AHA annual survey, Medicaid shortfall in 2016 for all U.S. hospitals totaled $20.0 billion, an increase of $3.8 billion from 2015. The aggregate Medicaid payment-to-cost ratio reported on the AHA survey was 88 percent in 2016, a decline from the 90 percent payment-to-cost ratio reported in 2015 (AHA 2017, 2016).

Chapter 3: Annual Analysis of Disproportionate Share Hospital Allotments to States
67Report to Congress on Medicaid and CHIP
BOX 3-2. Data Sources and Definitions of Uncompensated Care Costs
Data SourcesAmerican Hospital Association (AHA) annual survey. An annual survey of hospital finances that provides aggregated national estimates of uncompensated care for community hospitals.
Medicare cost report. An annual report on hospital finances that must be submitted by all hospitals that receive Medicare payments (that is, most U.S. hospitals with the exception of some freestanding children’s hospitals). Medicare cost reports define hospital uncompensated care as bad debt and charity care.
Medicaid disproportionate share hospital (DSH) audit. A statutorily required audit of a DSH hospital’s uncompensated care. The audit ensures that Medicaid DSH payments do not exceed the hospital-specific DSH limit, which is equal to the sum of Medicaid shortfall and the unpaid costs of care for uninsured individuals for allowable inpatient and outpatient costs. Forty-five percent of U.S. hospitals were included on DSH audits in 2014, the latest year for which data are available.
Definitions
Medicare cost report components of uncompensated care
Charity care. Health care services for which a hospital determines the patient does not have the capacity to pay and, based on its charity care policy, either does not charge the patient at all for the services or charges the patient a discounted rate below the hospital’s cost of delivering the care. Charity care costs cannot exceed a hospital’s cost of delivering the care.
Bad debt. Expected payment amounts that a hospital is not able to collect from patients who are determined to have the financial capacity to pay according to the hospital’s charity care policy.
Medicaid DSH audit components of uncompensated care
Unpaid costs of care for uninsured individuals. The difference between a hospital’s costs of providing services to individuals without health coverage and the total amount of payment received for those services. This includes charity care and bad debt for individuals without health coverage and generally excludes charity care and bad debt for individuals with health coverage.
Medicaid shortfall. The difference between a hospital’s costs of providing services to Medicaid-enrolled patients and the total amount of Medicaid payment received for those services (under both fee-for-service and managed care, excluding DSH payments but including other types of supplemental payments). Costs for patients dually eligible for Medicaid and other coverage (such as Medicare) are included, and costs for physician services and other care that does not meet the definition of inpatient and outpatient hospital services are excluded.

Chapter 3: Annual Analysis of Disproportionate Share Hospital Allotments to States
68 March 2019
FIGURE 3-3. Charity Care and Bad Debt as a Share of Hospital Operating Expenses, 2016
< 2.0 2.0% – 2.9% 3.0% – 3.9% 4.0% – 4.9% ≥ 5.0%
2.3%
1.5%
2.8%
1.7%
2.1%
8.1%4.2%
6.8% 4.5% 7.4%6.8%
4.6%
3.3%
3.3%
RI: 2.0%
NH: 2.4%
3.3%
3.2%
3.6% 3.3% 2.0%
1.5%
6.7%2.1%
1.9%6.6%
1.9%
VT: 1.7%
CT: 1.8%NJ: 3.7%
1.3%
6.1%
1.7%
2.6%
3.4%
4.5%
1.9%
3.6%6.8%
DE: 2.1%MD: 3.1%
DC: 1.5%
2.4%
2.2%1.4%
2.4%
2.0%
5.2% 2.7%4.7%
MA: 1.9%
Source: MACPAC, 2019, analysis of 2016 Medicare cost reports.
In contrast to the AHA survey, which provides data for all U.S. hospitals, Medicaid DSH audits provide data on Medicaid shortfall for the subset of hospitals that receive Medicaid DSH payments (45 percent of U.S. hospitals in SPRY 2014).25 In SPRY 2014, DSH hospitals reported a total of $11.8 billion in Medicaid shortfall and an aggregate Medicaid payment-to-cost ratio of 91 percent before DSH payments.
Medicaid shortfall as a share of total uncompensated care for DSH hospitals varies widely across states (Figure 3-4). In SPRY 2014, 15 states reported no Medicaid shortfall for DSH hospitals and 11 states and the District of Columbia reported shortfall that exceeded 50 percent of total DSH hospital uncompensated care. There is also wide variation in Medicaid payment-to-cost ratios
for DSH hospitals. Before DSH payments, Medicaid payments to DSH hospitals ranged from 70 percent of costs in Arizona to 119 percent of costs in Utah in SPRY 2014.26 Complete state-by-state data on Medicaid payments to DSH hospitals as a share of costs for Medicaid-enrolled and uninsured patients is provided in Appendix 3A.
Aggregate data on Medicaid shortfall for DSH hospitals may not reflect the experience of all hospitals in a state because Medicaid payment rates vary by hospital and because the net payment that a hospital receives may be lower than the total payment reported on DSH audits. For example, in the aggregate, DSH hospitals in Mississippi did not report a Medicaid shortfall in SPRY 2014, but 38 of the 58 hospitals that received DSH payments reported

Chapter 3: Annual Analysis of Disproportionate Share Hospital Allotments to States
69Report to Congress on Medicaid and CHIP
FIGURE 3-4. Medicaid Shortfall as a Share of Total Uncompensated Care Costs for DSH Hospitals, SPRY 2014
No shortfall reported < 25% 25% – 49% 50% – 74% ≥ 75%
NS
27%
38%
57%
7%
NS45%
NS 21% 11%20%
NS
69%
17%
RI: 66%
NH: –2
52%
34%
NS 11% 53%
32%
2%2–2
34%NS
53%
VT: 82%
CT: 46%NJ: 19%
–1
20%
NS
18%
NS
NS
70%
NSNS
DE: 56%MD: NS
DC: 68%
29%
NS70%2
58%
47%
NS 23%NS2
MA: –1
Notes: DSH is disproportionate share hospital. SPRY is state plan rate year. NS is no shortfall reported.
― Dash indicates no data available.1 Hawaii and Massachusetts did not submit SPRY 2014 DSH audits because they did not make any DSH payments in SPRY 2014.2 Analysis excludes 87 DSH hospitals that did not include payments from third-party payers when calculating Medicaid shortfall (2 in Minnesota, all DSH hospitals in New Hampshire, 3 in Tennessee, 1 in Virginia, and all DSH hospitals in West Virginia).
Source: MACPAC, 2019, analysis of as-filed SPRY 2014 DSH audit data.
Medicaid shortfall in that year.27 Moreover, Mississippi finances DSH payments with provider taxes, and stakeholders report that net Medicaid payments to hospitals in the state are below costs after adding the costs of these taxes (Marks et al. 2018).
As a result of recent litigation, some states are changing how they report Medicaid shortfall on DSH audits, which will affect the amount of Medicaid shortfall reported in future years. Specifically, hospitals have challenged CMS’s policy of requiring
states to subtract payments from third-party payers (e.g., Medicare and private insurance) when calculating Medicaid shortfall for Medicaid-eligible patients with third-party coverage.28 In March 2018, the U.S. District Court of the District of Columbia ruled against CMS on this issue.29 CMS has appealed the decision, but in December 2018, CMS withdrew its prior subregulatory guidance on this issue and noted that it would not be enforcing its prior policy while the March 2018 decision is operative in its current form (CMS 2018b).

Chapter 3: Annual Analysis of Disproportionate Share Hospital Allotments to States
70 March 2019
Changes in uncompensated care for DSH hospitals between SPRY 2013 and SPRY 2014To examine the effects of the ACA coverage expansions, we reviewed uncompensated care costs reported for the subset of 2,441 hospitals that were included in DSH audits for both SPRY 2013 and SPRY 2014; this subset accounts for 86 percent of the 2,825 hospitals that were included in DSH audits for SPRY 2014 alone.30 These data do not reflect the full effects of coverage expansions, because SPRY 2014 ended on June 30, 2014 for most states.31
For hospitals in this subset, the increase in Medicaid shortfall ($4.0 billion) from SPRY 2013 to SPRY 2014 was larger than the decline in unpaid costs of care for uninsured individuals ($1.6 billion) in the same period (Table 3-2). Increases in total DSH hospital uncompensated care were reported in both expansion and non-expansion states. The total amount of Medicaid shortfall increased more in expansion states than in non-expansion states from SPRY 2013 to SPRY 2014, but the percentage change was larger in non-expansion states because DSH hospitals in these states reported less shortfall in SPRY 2013.
In contrast, other national data for all hospitals suggest that uncompensated care has declined as a result of the ACA coverage expansions, even after accounting for the increase in Medicaid shortfall. Specifically, on Medicare cost reports, hospitals reported a $5.7 billion decrease in charity care and bad debt between 2013 and 2014, which was larger than the $0.9 billion increase in Medicaid shortfall reported on the AHA annual survey for those years.
Below, we examine potential reasons for the observed differences in the effects of the ACA coverage expansions on unpaid costs of care for uninsured individuals and Medicaid shortfall, compare the SPRY 2013–2014 data to prior years, and examine state variation in the amount of reported Medicaid shortfall for DSH hospitals.
Unpaid costs of care for uninsured individuals. The smaller decline in unpaid costs of care reported on DSH audits compared to Medicare cost reports can largely be explained by the fact that SPRY 2014 DSH audits include only half a year of ACA coverage expansions and about half of all U.S. hospitals. For example, the matching DSH hospitals included in our analysis reported a $3.8 billion decline in charity care and bad debt from calendar year 2013 to calendar year 2014, but they reported a $1.6 billion decline in
TABLE 3-2. Uncompensated Care for DSH Hospitals, SPRYs 2013–2014 (billions)
Medicaid expansion status as of June 30, 2014
Unpaid costs of care for uninsured individuals Medicaid shortfall
SPRY 2013
SPRY 2014
Difference (2014 less
2013)Percent change
SPRY 2013
SPRY 2014
Difference (2014 less
2013)Percent change
All states $ 24.7 $ 23.0 -$ 1.6 -7% $ 6.4 $ 10.4 $ 4.0 62%Expansion states 11.5 9.3 -2.2 -19 6.1 8.2 2.2 36 Non-expansion states 13.1 13.7 0.6 5 0.3 2.1 1.8 546
Notes: DSH is disproportionate share hospital. SPRY is state plan rate year. Analysis limited to 2,441 hospitals that received DSH payments in both SPRY 2013 and SPRY 2014 that provided complete information necessary to calculate Medicaid shortfall. Analysis excludes 87 DSH hospitals that did not include payments from third-party payers when calculating Medicaid shortfall (2 in Minnesota, all DSH hospitals in New Hampshire, 3 in Tennessee, 1 in Virginia, and all DSH hospitals in West Virginia). All Medicaid expansion states in this analysis expanded Medicaid on January 1, 2014, except for Michigan, which expanded Medicaid on March 1, 2014. Numbers do not sum due to rounding.
Source: MACPAC, 2019, analysis of 2016 Medicare cost reports and SPRY 2013 and SPRY 2014 as-filed Medicaid DSH audits.

Chapter 3: Annual Analysis of Disproportionate Share Hospital Allotments to States
71Report to Congress on Medicaid and CHIP
those unpaid costs of care for uninsured individuals on DSH audits from SPRY 2013 to SPRY 2014.32
Medicaid shortfall. Overall, Medicaid shortfall appears to be increasing because Medicaid payments are not increasing at the same rate as Medicaid costs (Table 3-3). Total base payments increased in expansion states, presumably because of increased Medicaid enrollment; and in both expansion and non-expansion states, the amount of non-DSH supplemental payments was largely unchanged.33 However, total Medicaid payments increased at a slower rate than Medicaid costs in both expansion and non-expansion states, thus increasing the amount of shortfall reported. Medicaid costs are affected by several different factors, such as Medicaid enrollment, changes in the intensity and mix of services, and inflation, but these components are not separately identified on DSH audits (Box 3-3).
Comparison to prior years. To better understand whether the variation that we observed between SPRY 2013 and SPRY 2014 is a result of ACA coverage expansions, we also compared uncompensated care reported on DSH audits
between SPRY 2012 and SPRY 2013 for hospitals that received DSH payments in all three years (Table 3-4).34 Between SPRY 2012 and SPRY 2013, Medicaid payments for these hospitals increased at a faster rate than Medicaid costs, resulting in a decrease in Medicaid shortfall. However, between SPRY 2013 and SPRY 2014, Medicaid costs increased at a faster rate than Medicaid payments, thus increasing Medicaid shortfall for these hospitals.
Hospitals with High Levels of Uncompensated Care That Also Provide Essential Community ServicesMACPAC is required to provide data identifying hospitals with high levels of uncompensated care that also provide access to essential community services. Given that the concept of essential community services is not defined elsewhere in Medicaid statute or regulation, MACPAC has developed a working definition based on the types of services suggested in the statutory provision
TABLE 3-3. Components of Medicaid Shortfall Reported on DSH Audits by State Expansion Status, SPRYs 2013–2014 (billions)
Category
Expansion states Non-expansion states All states
SPRY 2013
SPRY 2014
Percent change
SPRY 2013
SPRY 2014
Percent change
SPRY 2013
SPRY 2014
Percent change
Base payments $47.8 $53.1 11% $38.8 $39.5 2% $86.6 $92.6 7%Non-DSH supplemental payments 6.0 6.0 0 7.2 7.2 -1 13.3 13.2 0Total Medicaid payments $53.9 $59.1 10% $46.0 $46.7 2% $99.9 $105.8 6%Medicaid costs 59.9 67.4 12 46.4 48.9 5 106.3 116.2 9Medicaid shortfall $6.1 $8.2 36% $0.3 $2.1 546% $6.4 $10.4 62%
Notes: DSH is disproportionate share hospital. SPRY is state plan rate year. Analysis limited to 2,441 hospitals that received DSH payments in both SPRY 2013 and SPRY 2014 that provided complete information necessary to calculate Medicaid shortfall. Analysis excludes 87 DSH hospitals that did not include payments from third-party payers when calculating Medicaid shortfall (2 in Minnesota, all DSH hospitals in New Hampshire, 3 in Tennessee, 1 in Virginia, and all DSH hospitals in West Virginia). All Medicaid expansion states in this analysis expanded Medicaid on January 1, 2014, except for Michigan, which expanded Medicaid on March 1, 2014
Source: MACPAC, 2019, analysis of SPRY 2013 and SPRY 2014 as-filed Medicaid DSH audits.

Chapter 3: Annual Analysis of Disproportionate Share Hospital Allotments to States
72 March 2019
BOX 3-3. Factors Affecting Medicaid Hospital CostsThe cost of hospital care for Medicaid enrollees is affected by the number of Medicaid enrollees using hospital care, the volume and intensity of services used, and unit costs. Below we examine each of these factors in more detail, including information about how these factors changed between 2013 and 2014.
Number of enrollees. Between 2013 and 2014, the number of Medicaid enrollees increased 9 percent (from 59.8 million to 65.1 million), and the number of Medicaid inpatient hospital admissions increased 8 percent (from 7.4 million admissions to 8.0 million) (MACPAC 2018b, AHRQ 2018a). Medicaid enrollment and Medicaid hospital admissions increased more in states that expanded Medicaid than those that did not (Nikpay et al. 2016).
Volume and intensity of services used. Uninsured individuals who gained Medicaid coverage as a result of ACA coverage expansions may have had pent-up demand that resulted in increased use of services immediately after being enrolled. For example, an Avalere Health study examining claims data for Medicaid expansion enrollees across nine state and plan combinations found that the enrollees’ use of hospital care declined during the first year of coverage, resulting in lower average costs for expansion enrollees in the second half of 2014 than in the first half of 2014 (Avalere Health 2018).
Unit costs. The cost of care for a particular unit of service varies by hospital due to a range of market characteristics (e.g., costs of labor and technology) and hospital characteristics (e.g., productivity and efficiency). According to MACPAC’s analysis of data from the Healthcare Cost and Utilization Project, between 2013 and 2014, the average cost per hospital stay nationally increased 1.5 percent, which was the same as the change in the Consumer Price Index for All Urban Consumers during that period (AHRQ 2018b).
TABLE 3-4. Percent Change in Components of Uncompensated Care for DSH Hospitals, SPRYs 2012–2014
Components of uncompensated care SPRYs 2012–2013 SPRYs 2013–2014Unpaid costs of care for uninsured individuals 2.1% -6.3 %Medicaid costs 6.2 10.2 Medicaid payments (base and non-DSH supplemental payments) 7.0 7.0Medicaid shortfall (Medicaid costs minus Medicaid payments) -5.6 61.4
Notes: DSH is disproportionate share hospital. SPRY is state plan rate year. Analysis limited to 2,295 hospitals that received DSH payments in SPRYs 2012, 2013, and 2014. Analysis excludes 87 DSH hospitals in that did not include payments from third-party payers when calculating Medicaid shortfall (2 in Minnesota, all DSH hospitals in New Hampshire, 3 in Tennessee, 1 in Virginia, and all DSH hospitals in West Virginia).
Source: MACPAC, 2019, analysis of SPRY 2012, SPRY 2013, and SPRY 2014 as-filed Medicaid DSH audits.

Chapter 3: Annual Analysis of Disproportionate Share Hospital Allotments to States
73Report to Congress on Medicaid and CHIP
calling for MACPAC’s study and the limits of available data (Box 3-4). In Chapter 3 of MACPAC’s March 2017 report, the Commission analyzed other criteria that could be used to identify hospitals that should receive DSH payments (MACPAC 2017a).
Using data from 2016 Medicare cost reports and the 2016 AHA annual survey, we found that among hospitals that met the deemed DSH criteria in SPRY 2014, 91 percent provided at least one of the services included in MACPAC’s working definition of essential community services, 73 percent provided two of these services, and 59 percent provided
three or more of these services. By contrast, among non-deemed hospitals, 44 percent provided three or more of these services.
Hospital systemsTo examine the continuum of services that hospitals provide, it is necessary to consider services provided by the larger health systems in which hospitals operate. For example, of the 2,472 hospitals that reported providing primary care services in the 2016 AHA annual survey (41 percent
BOX 3-4. Identifying Hospitals with High Levels of Uncompensated Care That Provide Essential Community Services for Low-Income, Uninsured, and Other Vulnerable Populations
The statute requires that MACPAC provide data identifying hospitals with high levels of uncompensated care that also provide access to essential community services for low-income, uninsured, and vulnerable populations, such as graduate medical education, and the continuum of primary through quaternary care, including the provision of trauma care and public health services. Based on the types of services suggested in the statute and the limits of available data, we included the following services in our working definition of essential community services in this report:
• burn services;
• dental services;
• graduate medical education;
• HIV/AIDS care;
• inpatient psychiatric services (through a psychiatric subunit or stand-alone psychiatric hospital);
• neonatal intensive care units;
• obstetrics and gynecology services;
• primary care services;
• substance use disorder services; and
• trauma services.
We also included deemed DSH hospitals that were designated as critical access hospitals because they are often the only hospital in their geographic area. See Appendix 3B for further discussion of our methodology and its limitations.

Chapter 3: Annual Analysis of Disproportionate Share Hospital Allotments to States
74 March 2019
of all hospitals), one-quarter provided access to primary care outside of the hospital setting, either through clinics owned by the larger system or those that contracted directly with the hospital.
In 2016, 69.7 percent of U.S. hospitals were part of health systems, and hospitals within these health systems accounted for 91.6 percent of all U.S. hospital discharges. One-third of all U.S. hospitals (33.8 percent) were part of health systems that included hospitals in multiple states. Of the 626 health systems identified by the Agency for Healthcare Research and Quality, 255 (41 percent) included at least one deemed DSH hospital (AHRQ 2019).
Consistent with industry trends, many health systems provide primary and specialty care through arrangements with physician groups and other hospitals. Between 2007 and 2017, consolidation of physician practices by hospitals increased for all physician types, but was highest among medical and surgical specialty practices (Nikpay et al. 2018).
Compared to hospitals that do not have arrangements with physician groups, health systems may have more capacity to participate in value-based payment arrangements that aim to manage care provided outside of the hospital setting. Of the 68 hospitals that reported participating in a Medicaid accountable care organization in the 2016 AHA annual survey, 65 hospitals (96 percent) were part of health systems.
In December 2015, California received CMS approval for a Section 1115 demonstration to distribute DSH funding as a global payment to health systems that serve a high share of Medicaid and uninsured patients. The demonstration’s interim evaluation found that health systems participating in this program expanded the availability of primary care services and other care outside the hospital setting during the first two years of the program (Timbie et al. 2018). A final evaluation for California’s Global Payment Program is expected in the summer of 2019, and the Commission will continue to monitor these findings.
Hospital marginsHospitals that are part of multihospital health systems may be able to offset financial losses at one hospital with profits from other hospitals in the health system. For example, deemed DSH hospitals that were part of multihospital health systems reported negative aggregate operating margins of -0.6 percent in 2016, but all hospitals in these health systems reported positive aggregate operating margins of 2.1 percent in this period.
In 2016, aggregate hospital operating margins were 1.0 percent lower and aggregate total margins were 0.7 percent higher for all hospitals than in 2015. Many factors affect a hospital’s margins, such as changes in the prices that a hospital can negotiate because of its competitive position in its market and changes in the hospital’s costs (Bai and Anderson 2016). Additionally, margins are an imperfect measure of a hospital’s financial health and may not be reported reliably on Medicare cost reports. Moreover, hospitals that are struggling financially might decide to cut unprofitable services, which would increase their margins in the short term, and hospitals that are doing well financially might make additional investments, which could decrease their margins in the short term.
DSH Allotment ReductionsUnder current law, DSH allotments are scheduled to be reduced by the following annual amounts:
• $4.0 billion in FY 2020;
• $8.0 billion in FY 2021;
• $8.0 billion in FY 2022;
• $8.0 billion in FY 2023;
• $8.0 billion in FY 2024; and
• $8.0 billion in FY 2025.
DSH allotment reductions are applied against unreduced DSH allotments; that is, the amount that

Chapter 3: Annual Analysis of Disproportionate Share Hospital Allotments to States
75Report to Congress on Medicaid and CHIP
FIGURE 3-5. Aggregate Hospital Operating Margins Before and After DSH Payments, All Hospitals versus Deemed DSH Hospitals, 2016
Before DSH payments
After DSH payments
-0.9%
0.5%
-6.0%
-1.7%
-7.0%
-6.0%
-5.0%
-4.0%
-3.0%
-2.0%
-1.0%
0.0%
1.0%
All hospitals
Agg
rega
te o
pera
ting
mar
gins
Deemed DSH hospitals
Notes: DSH is disproportionate share hospital. Operating margins measure income from patient care divided by net patient revenue. Operating margins before DSH payments in 2016 were estimated using state plan rate year (SPRY) 2014 DSH audit data. Analysis excluded outlier hospitals reporting operating margins greater than 1.5 times the interquartile range from the first and third quartiles. Deemed DSH status was estimated based on available data on Medicaid inpatient and low-income utilization rates. For further discussion of this methodology and limitations, see Appendix 3B.
Source: MACPAC, 2019, analysis of 2016 Medicare cost reports and SPRY 2014 DSH audit data.
FIGURE 3-6. Aggregate Hospital Total Margins Before and After DSH Payments, All Hospitals versus Deemed DSH Hospitals, 2016
Before DSH payments andother governmentappropriations
Before DSH payments
After DSH payments
-0.4%
2.3%
6.2%
4.4%5.3%
6.7%
-2.0%
0.0%
2.0%
4.0%
6.0%
8.0%
All hospitals
Agg
rega
te to
tal m
argi
ns
Deemed DSH hospitals
Notes: DSH is disproportionate share hospital. Total margins include revenue not directly related to patient care, such as investment income, parking receipts, and non-DSH state and local subsidies to hospitals. Total margins before DSH payments in 2016 were estimated using state plan rate year (SPRY) 2014 DSH audit data. Other government appropriations include state or local subsidies to hospitals that are not Medicaid payments. Analysis excluded outlier hospitals reporting total margins greater than 1.5 times the interquartile range from the first and third quartiles. Deemed DSH status was estimated based on available data on Medicaid inpatient and low-income utilization rates. For further discussion of this methodology and limitations, see Appendix 3B.
Source: MACPAC, 2019, analysis of 2016 Medicare cost reports and SPRY 2014 DSH audit data.

Chapter 3: Annual Analysis of Disproportionate Share Hospital Allotments to States
76 March 2019
states would have received without DSH allotment reductions. In FY 2020, DSH allotment reductions amount to 31 percent of states’ unreduced DSH allotment amounts; by FY 2025, DSH allotment reductions will be equal to 55 percent of states’ unreduced DSH allotments. In FY 2026 and beyond, there are no DSH allotments reductions scheduled. Thus, under current law, state DSH allotments would return to their higher, unreduced DSH allotment amounts in those years. Unreduced allotments increase each year based on inflation, and these inflation-based increases continue to apply even when DSH allotment reductions take effect.
Chapter 1 of this report provides the Commission’s analyses and recommendations for restructuring DSH allotment reductions by phasing in reductions more gradually and changing the methodology for distributing reductions among states. Here, we examine DSH allotment reductions under current law, which MACPAC is statutorily required to report.
Current law requires CMS to develop a methodology for distributing DSH allotment reductions among states, referred to as the DSH Health Reform Reduction Methodology (DHRM), and directs CMS to use specific criteria, such as applying greater DSH reductions to states with lower uninsured rates and states that do not target their DSH payments to high-need hospitals (Box 3-5). In July 2017, CMS proposed changes to the DHRM for FY 2018 and subsequent years (CMS 2017b).
MACPAC provided comments on CMS’s proposed DSH allotment reduction formula in August 2017 (MACPAC 2017b). Specifically, the Commission encouraged CMS to apply DSH allotment reductions to unspent DSH funding first, to minimize the effects of DSH allotment reductions on hospitals that are currently receiving DSH payments. MACPAC also analyzed the state-by-state effects of CMS’s proposal to increase the relative weight of the uninsured percentage factor and provided technical comments on ways to improve the calculation of various factors in CMS’s proposed methodology.
Although CMS may revise its methodology before making allotment reductions in FY 2020, we used the proposed methodology to estimate FY 2020 DSH allotment reductions below. In FY 2021 through FY 2025, the size of DSH allotment reductions will double from $4 billion to $8 billion, but the distribution of DSH allotment reductions among states is expected to be largely the same if states do not change their DSH targeting policies and if there are no changes in the rate of uninsurance across states.
We also compare FY 2018 DSH allotments to other factors, such as hospital uncompensated care costs. Complete state-by-state information on current DSH allotments and their relationship to the state-by-state data that Congress requested are provided in Appendix 3A.
Reduced DSH allotments compared to unreduced DSH allotmentsThe $4 billion in DSH allotment reductions scheduled to take effect in FY 2020 are projected to affect states differently, with estimated reductions ranging from 3.8 percent to 46.6 percent of unreduced allotment amounts (Figure 3-7). Because of the low-DSH factor, the projected percentage reduction in DSH allotments for the 17 states that meet the low-DSH criteria (8.9 percent in the aggregate) is less than one-third that of the other states (31.4 percent in the aggregate). Among states that do not meet the low-DSH criteria, the projected percentage reduction in DSH allotments is larger for states that expanded Medicaid (33.7 percent in the aggregate) than for states that did not expand Medicaid (27.1 percent in the aggregate).
DSH allotment reductions will result in a corresponding decline in spending only in states that spend their full DSH allotment. For example, 15 states are projected to have FY 2020 DSH allotment reductions that are smaller than the state’s unspent DSH funding in FY 2016, which means that these states could continue to make the same amount of DSH payments in FY 2020 that they made in FY 2016.35

Chapter 3: Annual Analysis of Disproportionate Share Hospital Allotments to States
77Report to Congress on Medicaid and CHIP
BOX 3-5. Factors Used in Disproportionate Share Hospital Health Reform Reduction Methodology
The Disproportionate Share Hospital (DSH) Health Reform Reduction Methodology (DHRM) provides a model for calculating how DSH allotment reductions will be distributed across states. In July 2017, the Centers for Medicare & Medicaid Services (CMS) proposed changes to the DHRM, but as of this writing, the DHRM has not yet been finalized by CMS. As required by statute, the proposed DHRM applies five factors when calculating state DSH allotment reductions:
Low-DSH factor. Allocates a smaller proportion of the total DSH allotment reductions to low-DSH states based on the size of these states’ DSH allotments relative to their total Medicaid expenditures. Low-DSH states are defined in statute as states with FY 2000 DSH expenditures that were less than 3 percent of total state Medicaid medical assistance expenditures for FY 2000. There are 17 low-DSH states, a number that includes Hawaii, whose eligibility as a low-DSH state is based on a special statutory exception (§§ 1923(f)(5) and 1923(f)(6) of the Social Security Act).
Uninsured percentage factor. Imposes larger DSH allotment reductions on states with lower uninsured rates relative to other states. One-half of DSH reductions are based on this factor.
High volume of Medicaid inpatients factor. Imposes larger DSH allotment reductions on states that do not target DSH payments to hospitals with high Medicaid volume. The proportion of a state’s DSH payments made to hospitals with Medicaid inpatient utilization that is one standard deviation above the mean (the same criteria used to determine deemed DSH hospitals) is compared among states. One-quarter of DSH reductions are based on this factor.
High level of uncompensated care factor. Imposes larger reductions on states that do not target DSH payments to hospitals with high levels of uncompensated care. The proportion of a state’s DSH payments made to hospitals with above-average uncompensated care as a proportion of total hospital costs is compared among states. This factor is calculated using DSH audit data, which defines uncompensated care costs as the sum of Medicaid shortfall and unpaid costs of care for uninsured individuals. One-quarter of DSH reductions are based on this factor.
Budget neutrality factor. An adjustment to the high Medicaid and high uncompensated care factors that accounts for DSH allotments that were used as part of the budget neutrality calculations for coverage expansions under Section 1115 waivers. (Four states—Indiana, Maine, Massachusetts, and Wisconsin—and the District of Columbia meet the statutory criteria for the budget neutrality factor.) Specifically, DSH funding used for coverage expansions is excluded from the calculation of whether DSH payments were targeted to high Medicaid or high uncompensated care hospitals.
We do not know how states will respond to these reductions. As noted above, some states distribute DSH funding proportionally among eligible hospitals, while other states target DSH payments to particular hospitals. Thus, some states may apply reductions to all DSH hospitals in their states while
others may reduce DSH payments only to specific hospitals. Because the DHRM proposed by CMS applies larger reductions to states that do not target DSH funds to hospitals with high Medicaid volume or high levels of uncompensated care, states might change their DSH targeting policies to minimize

Chapter 3: Annual Analysis of Disproportionate Share Hospital Allotments to States
78 March 2019
FIGURE 3-7. Decrease in State DSH Allotments as a Percentage of Unreduced Allotments, by State, FY 2020
< 10% 10% – 19.9% 20% – 29.9% 30% – 39.9% ≥ 40%
8.4%
28.3%
11.9%
41.0%
26.7%
22.7%28.0%
24.2%
41.2% 23.1%32.4%
33.0%
34.4%
19.6%
RI: 46.6%
NH: 28.2%
10.6%
32.5%
21.0%30.7%43.3%
40.7%
35.9%34.0%
36.9%32.6%
38.8%
VT: 45.2%
CT: 29.6%NJ: 34.1%
7.2%
9.8%
11.8%
11.4%
8.3%
13.2%
30.7%
7.4%
DE: 9.3%MD: 32.3%
DC: 34.7%
3.8%
4.7%7.9%
8.6%
6.4%
8.4% 14.1%– ¹
MA: 44.1%
FL: 28.4%
Notes: DSH is disproportionate share hospital. FY is fiscal year.1 Tennessee is not subject to DSH allotment reductions because its DSH allotment is specified in statute (§ 1923(f)(6)(A) of the Social Security Act).
Source: MACPAC, 2019, analysis of Census 2019, CBO 2018b, 2016 Medicare cost reports, and the CMS Medicaid Budget and Expenditure System.
their DSH allotment reductions in future years.36
However, the DSH audit data used to calculate the DSH targeting factors in the DHRM have a substantial data lag of about four to five years.
Relationship of DSH allotments to the statutorily required factorsAs in our past reports, we find little meaningful relationship between current DSH allotments and the factors that Congress asked MACPAC to consider.
Changes in number of uninsured individuals. FY 2019 DSH allotments range from less than $100 per uninsured individual in five states to more than
$1,000 per uninsured individual in nine states. Nationally, the average FY 2019 DSH allotment per uninsured individual is $451.
Amount and sources of hospital uncompensated care costs. As a share of hospital charity care and bad debt costs reported on 2016 Medicare cost reports, FY 2019 federal DSH allotments range from less than 10 percent in six states to more than 80 percent in six states. Nationally, FY 2019 federal DSH allotments are equal to 36 percent of hospital charity care and bad debt costs. At the state level, total FY 2018 DSH funding (including state and federal funds combined) exceeds reported hospital charity care and bad debt costs in 12

Chapter 3: Annual Analysis of Disproportionate Share Hospital Allotments to States
79Report to Congress on Medicaid and CHIP
states. Because DSH payments to hospitals may not exceed total uncompensated care costs, states with DSH allotments larger than the amount of uncompensated care in their state may not be able to spend their full DSH allotment.37
Number of hospitals with high levels of uncompensated care that also provide essential community services for low-income, uninsured, and vulnerable populations. Finally, there continues to be no meaningful relationship between state DSH allotments and the number of deemed DSH hospitals in the state that provided at least one of the services included in MACPAC’s working definition of essential community services.
Next StepsThe analyses in this chapter underscore MACPAC’s prior findings that DSH allotments have little meaningful relationship to measures meant to identify those hospitals most in need. Although much of the variation in state DSH allotment amounts reflects the basis of these allotments in historic patterns of spending, we also find that CMS’s methodology for implementing DSH allotment reductions is projected to preserve most of this historical variation.
Chapter 1 of this report provides the Commission’s analyses and recommendations for restructuring the distribution of reductions among states to improve the relationship between DSH allotments and measures related to hospital uncompensated care costs. The chapter also provides recommendations for ways to phase in reductions more gradually to help mitigate disruption for states and providers.
In the coming year, the Commission will continue to examine other DSH policy issues as part of its broader examination of all types of Medicaid payments to hospitals. The Commission has long held that DSH payments should be better targeted to hospitals that serve a high share of Medicaid-
enrolled and low-income uninsured patients and that have higher levels of uncompensated care, consistent with the original statutory intent of the law establishing DSH payments. However, development of policy to achieve this goal must be considered in terms of all Medicaid payments that hospitals receive.
Endnotes1 The ACA gives states the option of expanding Medicaid to adults under age 65 with incomes at or below 138 percent of the federal poverty level (FPL).
2 Specifically, CMS modified the definition of charity care to include uninsured discounts and changed the way that cost-to-charge ratios were applied on Medicare cost reports (CMS 2017a).
3 On Medicare cost reports, hospitals reported a $5.7 billion decrease in charity care and bad debt between 2013 and 2014, which was larger than the $0.9 billion increase in Medicare shortfall reported on the AHA annual survey for those years. Unlike Medicaid DSH audits, these other data sources include both DSH and non-DSH hospitals. Also, definitions of uncompensated care differ among data sources, as discussed further in Box 3-2.
4 At this writing, CMS has not yet finalized its methodology for distributing DSH allotment reductions so our analyses in this chapter reflect the methodology that CMS proposed in July 2017 (CMS 2017b).
5 Medicaid fee-for-service payments for hospitals cannot exceed a reasonable estimate of what Medicare would have paid in the aggregate. DSH payments are not subject to this upper payment limit, but DSH payments to an individual hospital are limited to that hospital’s uncompensated care costs for Medicaid-enrolled and uninsured patients.
6 Additional background information about the history of DSH payment policy is included in Chapter 1 and Appendix A of MACPAC’s first DSH report (MACPAC 2016).
7 Total DSH spending includes an estimate of the portion of California’s Section 1115 waiver spending that is based on the state’s DSH allotment but excludes Massachussetts.

Chapter 3: Annual Analysis of Disproportionate Share Hospital Allotments to States
80 March 2019
8 The American Recovery and Reinvestment Act of 2009 (P.L. 111-5) increased FY 2009 and FY 2010 DSH allotments to 102.5 percent of what they would have been without the law. Since FY 2011, DSH allotments have accounted for 3 percent to 4 percent of total Medicaid benefit spending. Medicaid benefit spending excludes Medicaid spending on state program administration.
9 Analysis excludes unspent DSH funding that is reported for California and Massachusetts ($1.2 billion total) because these states use their DSH allotment in the budget neutrality assumptions for their Section 1115 waivers.
10 Medicare cost reports define uncompensated care as charity care and bad debt, including uncompensated care for individuals with insurance, which is not part of the Medicaid DSH definition of uncompensated care. Medicare cost reports do not include reliable information on Medicaid shortfall, which is part of the Medicaid DSH definition.
11 States report hospital-specific DSH data on a SPRY basis, which often corresponds to the state fiscal year and may not align with the federal fiscal year.
12 DSH hospitals are also required to have at least two obstetricians with staff privileges who will treat Medicaid enrollees (with certain exceptions for rural and children’s hospitals).
13 The Substance Use-Disorder Prevention that Promotes Opioid Recovery and Treatment for Patients and Communities (SUPPORT) Act of 2018 (P.L. 115-271) provides a state option to cover services provided by an IMD for patients with substance use disorders in FYs 2020–2023. Under Medicaid managed care and Section 1115 waivers, states can also make payments for some services provided by an IMD to Medicaid enrollees age 21–64 (42 CFR 438.6(e)).
14 The amount of a state’s federal DSH funds available for IMDs is limited. Each state’s IMD limit is the lesser amount of either the DSH allotment the state paid to IMDs and other mental health facilities in FY 1995 or 33 percent of the state’s FY 1995 DSH allotment.
15 In 2012, states that financed DSH payments with above-average levels of health care-related taxes distributed DSH payments to a proportion of hospitals in the state that was
about double the proportion of hospitals receiving DSH funding in states that financed DSH payments with lower levels of health care-related taxes. States that financed DSH payments with above-average levels of intergovernmental transfers or certified public expenditures distributed a higher share of total DSH spending to public hospitals—about double the share to public hospitals in states that financed DSH payments with lower levels of local government funding (MACPAC 2017a).
16 The national estimates of the number of uninsured individuals cited in this chapter do not match the state-level estimates of the number of uninsured cited in Appendix 3A because of different data sources used. National estimates of the number of uninsured individuals come from the Current Population Survey, a monthly survey of households by the U.S. Census Bureau for the U.S. Bureau of Labor Statistics, which is the preferred source for national analyses. State-level data come from the American Community Survey, which has a larger sample size and is the preferred source for subnational analyses (Census 2017).
17 There are a variety of ways to count the number of uninsured individuals. Estimates in this chapter reflect the number of people without health insurance for the entire calendar year.
18 In the Current Population Survey, estimates of health insurance coverage are not mutually exclusive. People can be covered by more than one type of health insurance during the year.
19 CBO broadly defines health insurance coverage as a policy that, at a minimum, covers high-cost medical events and various services, including physician and hospital services (CBO 2018a).
20 Federal law states that the applications of individuals seeking admission to the United States or seeking to change their status to lawful permanent residents must be denied if, at any time, these individuals are likely to become public charges. Public charge has historically been defined as when an individual is primarily dependent on the government for subsistence. On October 10, 2018, the U.S. Department of Homeland Security proposed changing the definition of public charge to include individuals who receive one or more public benefits, including Medicaid (USCIS 2018).

Chapter 3: Annual Analysis of Disproportionate Share Hospital Allotments to States
81Report to Congress on Medicaid and CHIP
21 DSH audit data are not due until three years after DSH payments are made and they are not published until after CMS reviews the data for completeness (42 CFR 455.304).
22 Specifically, CMS modified the definition of charity care to include uninsured discounts and changed the way that cost-to-charge ratios were applied on Medicare cost reports (CMS 2017a).
23 As a result of retroactive changes to Medicare cost reports, the adjusted amount of uncompensated care reported by hospitals for 2015 under the new definitions was $9 billion higher than had been reported under the prior definitions.
24 Bad debt expenses for insured and uninsured individuals are not reported separately on Medicare cost reports. The 2016 Medicare cost report data that we report in this chapter have not been audited, so bad debt and charity care costs may not be reported consistently for all hospitals. Beginning in the fall of 2018, CMS began to audit charity care and bad debt costs reported on Medicare cost reports (CMS 2018a).
25 The AHA annual survey also differs from DSH audit data in its definition of Medicaid shortfall. Most notably, the AHA survey includes the costs of provider taxes, which are not included on DSH audits (Nelb et al. 2016).
26 Analysis excludes New Hampshire and West Virginia, which used a different definition of Medicaid costs than other states in their SPRY 2014 DSH audits.
27 An additional 55 hospitals in Mississippi are not included on the state’s SPRY 2014 DSH audit because these hospitals did not receive DSH payments.
28 Medicaid shortfall is the difference between a hospital’s costs of providing care to Medicaid-eligible patients minus the payments that the hospital receives for those services. Because some Medicaid-eligible patients have third-party coverage (e.g., Medicare or private coverage), hospitals receive payments from both Medicaid and other payers for these patients. In 2010, CMS issued subregulatory guidance indicating that the costs of patients with third-party coverage should be included in DSH audits and the amount of third-party payments received for these patients should be subtracted when calculating Medicaid shortfall (CMS 2018b). For example, under CMS’s policy, Medicaid shortfall for
patients dually eligible for Medicare and Medicaid would be the total hospital cost of treating the patient, less the amount that Medicare and Medicaid paid for the service provided.
29 Children’s Hosp. of the King’s Daughters, Inc. v. Azar, 896 F.3d 615 (4th Cir. 2018).
30 We excluded 87 DSH hospitals that did not include payments from third-party payers when calculating Medicaid shortfall: 2 in Minnesota, all DSH hospitals in New Hampshire, 3 in Tennessee, 1 in Virginia, and all DSH hospitals in West Virginia.
31 SPRYs are based on state fiscal years. Most state fiscal years end on June 30th, but in New York, the state fiscal year ends on March 31st; in Texas, the state fiscal year ends on August 31st; and in Michigan and Mississippi, the state fiscal year ends on September 30th.
32 Change in charity care and bad debt for matching hospitals is based on data from cost reports available as of March 31, 2017, prior to CMS’s change in instructions for how uncompensated care is reported.
33 In general, Medicaid enrollment between 2013 and 2014 increased more in states that expanded Medicaid than in those that did not, but some states that did not expand Medicaid nevertheless saw increases in Medicaid enrollment in 2014 among individuals who were previously eligible for Medicaid. Although total base payments for DSH hospitals increased in Medicaid expansion states, we do not have data about how base payment rates changed.
34 The subset of hospitals used to examine three-year trends in DSH hospital uncompensated care costs in Table 3-4 is smaller than the subset used in Tables 3-2 and 3-3 to examine the change in costs between SPRY 2013 and 2014, so the numbers in these tables do not match.
35 For states to spend the same amount of DSH funding in FY 2020 as they spent in FY 2016, DSH payments to individual hospitals may not exceed those hospitals’ uncompensated care costs. Unspent DSH funds for a given year cannot be used for DSH expenditures for future years.
36 Additional analyses of potential strategic state responses to the DSH allotment reduction methodology proposed by CMS are provided in Chapter 2 of MACPAC’s 2016 DSH report (MACPAC 2016).

Chapter 3: Annual Analysis of Disproportionate Share Hospital Allotments to States
82 March 2019
37 For Medicaid DSH purposes, uncompensated care includes Medicaid shortfall, which is not included in the Medicare cost report definition of uncompensated care. As a result, the total amount of uncompensated care reported on Medicare cost reports may differ from the amount of uncompensated care costs states may be able to pay for with Medicaid DSH funds.
ReferencesAgency for Healthcare Research and Quality (AHRQ), U.S. Department of Health and Human Services. 2019. Compendium of U.S. health systems, 2016. Rockville, MD: AHRQ. https://www.ahrq.gov/chsp/compendium/index.html.
Agency for Healthcare Research and Quality (AHRQ), U.S. Department of Health and Human Services. 2018a. HCUP fast stats: Trends in inpatient stays. Healthcare Cost and Utilization Project (HCUP). Rockville, MD: AHRQ. https://www.hcup-us.ahrq.gov/faststats/NationalTrendsServlet?measure1=01&characteristic1=04& time1=10&measure2=characteristic2=01&time2=10& expansionInfoState=hide&dataTablesState=hide&definitions State=hide&exportState=hide.
Agency for Healthcare Research and Quality (AHRQ), U.S. Department of Health and Human Services. 2018b. HCUPnet. Healthcare Cost and Utilization Project (HCUP). Rockville, MD: AHRQ. https://hcupnet.ahrq.gov/#setup.
American Hospital Association (AHA). 2018. AHA annual survey data. Chicago, IL: AHA. https://ahasurvey.org/taker/asindex.do.
American Hospital Association (AHA). 2017. Underpayment by Medicare and Medicaid fact sheet. December 2017. Washington, DC: AHA. https://www.aha.org/data-insights/2018-01-03-underpayment-medicare-and-medicaid-fact-sheet-december-2017-update.
American Hospital Association (AHA). 2016. Underpayment by Medicare and Medicaid fact sheet. December 2016. Washington, DC: AHA. https://www.aha.org/system/files/2018-02/2016-dec-medicaremedicaidunderpmt.pdf.
American Hospital Association (AHA). 2015. Underpayment by Medicare and Medicaid fact sheet. Washington, DC: AHA. https://www.aha.org/2015-underpayment-medicare-medicaid/.
Artiga, S., R. Garfield, and A. Damico. 2018. Estimated impacts of the proposed public charge rule on immigrants and Medicaid. Washington, DC: Kaiser Family Foundation. https://www.kff.org/disparities-policy/issue-brief/estimated-impacts-of-the-proposed-public-charge-rule-on-immigrants-and-medicaid/.
Avalere Health. 2018. Profile of the Medicaid expansion population: Demographics, enrollment, and utilization. Washington, DC: Avalere Health. http://go.avalere.com/acton/attachment/12909/f-0517/1/-/-/-/-/Avalere%20Medicaid%20Expansion%20Analysis.pdf.
Bai, G., and G.F. Anderson. 2016. A more detailed understanding of factors associated with hospital profitability. Health Affairs 35, no. 5: 889–897. https://www.healthaffairs.org/doi/10.1377/hlthaff.2015.1193.
Berchick, E., E.R. Hood, and J.C. Barnett. 2018. Health insurance coverage in the United States: 2017. Current population reports, P60-264. Washington, DC: U.S. Government Printing Office. https://www.census.gov/content/dam/Census/library/publications/2018/demo/p60-264.pdf.
Centers for Medicare & Medicaid Services (CMS), U.S. Department of Health and Human Services. 2018a. Medicare program; hospital inpatient prospective payment systems for acute care hospitals and the long-term care hospital prospective payment system and policy changes and fiscal year 2019 rates; quality reporting requirements for specific providers; Medicare and Medicaid electronic health record (EHR) incentive programs (promoting interoperability programs) requirements for eligible hospitals, critical access hospitals, and eligible professionals; Medicare cost reporting requirements; and physician certification and recertification of claims. Final rule. Federal Register 83, no. 160 (August 17): 41144–41784. https://www.federalregister.gov/d/2018-16766.
https://www.kff.org/disparities-policy/issue-brief/estimated-impacts-of-the-proposed-public-charge-r
https://www.kff.org/disparities-policy/issue-brief/estimated-impacts-of-the-proposed-public-charge-r
https://www.kff.org/disparities-policy/issue-brief/estimated-impacts-of-the-proposed-public-charge-r
http://go.avalere.com/acton/attachment/12909/f-0517/1/-/-/-/-/Avalere%20Medicaid%20Expansion%20Analy
http://go.avalere.com/acton/attachment/12909/f-0517/1/-/-/-/-/Avalere%20Medicaid%20Expansion%20Analy

Chapter 3: Annual Analysis of Disproportionate Share Hospital Allotments to States
83Report to Congress on Medicaid and CHIP
Centers for Medicare & Medicaid Services (CMS), U.S. Department of Health and Human Services. 2018b. Additional information on DSH reporting and audit requirements. Baltimore, MD: CMS. https://www.medicaid.gov/medicaid/finance/downloads/part-1-additional-info-on-dsh-reporting-and-auditing.pdf.
Centers for Medicare and Medicaid Services (CMS), U.S. Department of Health and Human Services. 2017a. Medicare provider reimbursement manual: Part 2, provider cost reporting forms and instructions. Transmittal 11, September 29, 2017. Baltimore, MD: CMS. https://www.cms.gov/Regulations-and-Guidance/Guidance/Transmittals/2017Downloads/R11p240.pdf.
Centers for Medicare & Medicaid Services (CMS), U.S. Department of Health and Human Services. 2017b. Medicaid program: State disproportionate share hospital allotment reductions. Proposed rule. Federal Register 82, no. 144 (July 28): 33155–35171. https://www.federalregister.gov/d/2017-15962.
Congressional Budget Office (CBO). 2018a. Federal subsidies for health insurance coverage for people under age 65: 2018 to 2028. Washington, DC: CBO. https://www.cbo.gov/publication/53091.
Congressional Budget Office (CBO), 2018b. An update to the economic outlook: 2018 to 2028. Washington, DC: CBO. https://www.cbo.gov/publication/54318.
Employee Benefits Security Administration (EBSA), U.S. Department of Labor. 2018. Definition of “employer” under Section 3(5) of ERISA-association health plans. Final rule. Federal Register 83, no. 120 (June 21): 28912–28964. https://www.federalregister.gov/d/2018-12992.
Holahan, J., B.K. Bruen, and D. Liska. 1998. The decline in Medicaid spending growth in 1996: Why did it happen? Washington, DC: Urban Institute. http://webarchive.urban.org/UploadedPDF/410365.pdf.
Internal Revenue Service, U.S. Department of the Treasury; Employee Benefits Security Administration, U.S. Department of Labor; and Centers for Medicare & Medicaid Services, U.S. Department of Health and Human Services (IRS, EBSA, and CMS). 2018. Final rule. Short-term, limited-duration insurance. Federal Register 83, no. 150 (August 3): 38212–
38243. https://www.federalregister.gov/d/2018-16568.
Marks, T., K. Gifford, S. Perlin, et al. 2018. Factors affecting the development of Medicaid hospital payment policies: Findings from structured interviews in five states. Final report to the Medicaid and CHIP Payment and Access Commission. Washington, DC: Health Management Associates. https://www.macpac.gov/publication/factors-affecting-the-development-of-medicaid-hospital-payment-policies-findings-from-structured-interviews-in-five-states.
Medicaid and CHIP Payment and Access Commission (MACPAC). 2018a. Chapter 3: Annual analysis of disproportionate share hospital allotments to states. In Report to Congress on Medicaid and CHIP. March 2018. Washington, DC: MACPAC. https://www.macpac.gov/publication/annual-analysis-of-disproportionate-share-hospital-allotments-to-states/.
Medicaid and CHIP Payment and Access Commission (MACPAC). 2018b. Exhibit 10: Medicaid enrollment and total spending levels and annual growth, FYs 1966–2017. In MACStats: Medicaid and CHIP Data Book. December 2018. Washington, DC: MACPAC. https://www.macpac.gov/publication/medicaid-enrollment-and-total-spending-levels-and-annual-growth/.
Medicaid and CHIP Payment and Access Commission (MACPAC). 2017a. Chapter 3: Improving the targeting of disproportionate share hospital payments to providers. In Report to Congress on Medicaid and CHIP. March 2017. Washington, DC: MACPAC. https://www.macpac.gov/publication/improving-the-targeting-of-disproportionate-share-hospital-payments-to-providers/.
Medicaid and CHIP Payment and Access Commission (MACPAC). 2017b. Letter from Penny Thompson to Thomas E. Price regarding “CMS-2394-P Medicaid program: Disproportionate share hospital allotment reductions.” August 28, 2017. https://www.macpac.gov/publication/comments-on-proposed-dsh-reduction-rule/.
Medicaid and CHIP Payment and Access Commission (MACPAC). 2016. Report to Congress on Medicaid disproportionate share hospital payments. February 2016. Washington, DC: MACPAC. https://www.macpac.gov/publication/report-to-congress-on-medicaid-disproportionate-share-hospital-payments/.
https://www.macpac.gov/publication/factors-affecting-the-development-of-medicaid-hospital-payment-po
https://www.macpac.gov/publication/factors-affecting-the-development-of-medicaid-hospital-payment-po
https://www.macpac.gov/publication/factors-affecting-the-development-of-medicaid-hospital-payment-po
https://www.macpac.gov/publication/annual-analysis-of-disproportionate-share-hospital-allotments-to-
https://www.macpac.gov/publication/annual-analysis-of-disproportionate-share-hospital-allotments-to-
https://www.macpac.gov/publication/improving-the-targeting-of-disproportionate-share-hospital-paymen
https://www.macpac.gov/publication/improving-the-targeting-of-disproportionate-share-hospital-paymen

Chapter 3: Annual Analysis of Disproportionate Share Hospital Allotments to States
84 March 2019
Miller, G.E., J.P. Vistnes, F. Rohde, and P.S. Keenan. 2018. High-deductible health plan enrollment increased from 2006 to 2016, employer-funded accounts grew in largest firms. Health Affairs 37, no. 8: 1231–1237. https://doi.org/10.1377/hlthaff.2018.0188.
Nelb, R., J. Teisl, A. Dobson, et al. 2016. For disproportionate-share hospitals, taxes and fees curtail Medicaid payments. Health Affairs 35, no. 12: 2277–2281. https://www.healthaffairs.org/doi/10.1377/hlthaff.2016.0602.
Nikpay, S.S., M.R. Richards, and D. Penson. 2018. Hospital-physician consolidation accelerated in the past decade in cardiology, oncology. Health Affairs 37, no. 7: 1123–1127. https://www.healthaffairs.org/doi/10.1377/hlthaff.2017.1520.
Nikpay, S., T. Buchmueller, and H.G. Levy. 2016. Affordable Care Act Medicaid expansion reduced uninsured hospital stays in 2014. Health Affairs 35, no. 1: 106–110. https://www.healthaffairs.org/doi/full/10.1377/hlthaff.2015.1144.
Timbie, J.W., J.L. Liu, M. DeYoreo, et al. 2018. Evaluation of the global payment program: Midpoint report. Santa Monica, CA: RAND corporation. http://www.dhcs.ca.gov/provgovpart/Documents/GPP/GPP_MidpointRpt_July2018.pdf.
U.S. Census Bureau (Census), U.S. Department of Commerce. 2019. American Community Survey data. Suitland, MD: Census. https://www.census.gov/programs-surveys/acs/data.html.
U.S. Census Bureau (Census), U.S. Department of Commerce. 2017. Health insurance: Guidance for data users. Suitland, MD: Census. http://www.census.gov/topics/health/health-insurance/guidance.html.
U.S. Citizenship and Immigration Services (USCIS), U.S. Department of Homeland Security. 2018. Inadmissibility on public charge grounds. Notice of proposed rulemaking. Federal Register 83, no. 196 (October 10): 51114–51296. https://www.gpo.gov/fdsys/pkg/FR-2018-10-10/pdf/2018-21106.pdf.

Chapter 3: APPENDIX 3A
85Report to Congress on Medicaid and CHIP
APPENDIX 3A: State-Level DataTABLE 3A-1. State DSH Allotments, FYs 2019 and 2020 (millions)
State
FY 2019 FY 2020
Total (state and federal) Federal Total (state and federal) Federal
Total $22,281.1 $12,627.6 $15,738.0 $8,935.3Alabama 492.4 353.9 296.6 213.2Alaska 46.9 23.4 44.5 22.2Arizona 166.9 116.5 118.6 82.8Arkansas 70.4 49.7 62.0 43.7California 2,523.5 1,261.7 1,854.7 927.4Colorado 212.9 106.5 160.0 80.0Connecticut 460.4 230.2 332.0 166.0Delaware 18.1 10.4 16.8 9.7District of Columbia 100.7 70.5 67.4 47.2Florida 378.2 230.2 277.3 168.8Georgia 457.4 309.3 360.4 243.7Hawaii 20.8 11.2 19.8 10.7Idaho 26.6 18.9 25.0 17.8Illinois 491.9 247.5 398.2 200.4Indiana 373.0 246.0 264.9 174.7Iowa 75.6 45.3 70.8 42.5Kansas 83.1 47.5 57.5 32.8Kentucky 232.9 166.9 150.5 107.8Louisiana 1,214.1 789.2 895.2 581.9Maine 187.3 120.9 154.3 99.6Maryland 175.5 87.8 121.7 60.8Massachusetts 702.1 351.0 402.2 201.1Michigan 473.2 305.0 287.4 185.2Minnesota 171.9 86.0 162.3 81.2Mississippi 229.8 175.5 178.5 136.3Missouri 833.7 545.3 572.0 374.1Montana 19.9 13.1 18.1 11.9Nebraska 61.9 32.6 56.7 29.8Nevada 82.1 53.2 74.1 48.0New Hampshire 368.5 184.3 271.1 135.6New Jersey 1,481.9 740.9 1,001.0 500.5New Mexico 32.4 23.4 30.4 22.0New York 3,697.5 1,848.7 2,484.4 1,242.2North Carolina 505.6 339.5 349.2 234.5

Chapter 3: APPENDIX 3A
86 March 2019
TABLE 3A-1. (continued)
State
FY 2019 FY 2020
Total (state and federal) Federal Total (state and federal) Federal
North Dakota $22.0 $11.0 $21.5 $10.7Ohio 741.1 467.6 430.4 271.5Oklahoma 66.8 41.7 62.7 39.1Oregon 83.3 52.1 75.3 47.1Pennsylvania 1,236.3 646.0 775.4 405.2Rhode Island 142.3 74.8 77.8 40.9South Carolina 529.3 376.9 366.4 261.0South Dakota 22.4 12.7 22.1 12.5Tennessee 80.6 53.1 80.6 53.1Texas 1,891.4 1,100.6 1,497.7 871.5Utah 32.4 22.6 28.8 20.1Vermont 48.1 25.9 27.0 14.5Virginia 201.7 100.8 132.5 66.2Washington 425.9 212.9 257.5 128.8West Virginia 104.5 77.7 70.7 52.6Wisconsin 183.3 108.8 175.8 104.4Wyoming 0.5 0.3 0.5 0.2
Notes: DSH is disproportionate share hospital. FY is fiscal year. Under current law, federal DSH allotments will be reduced by $4 billion in FY 2020. DSH allotment estimates for FY 2020 are based on the DSH allotment reduction methodology that CMS proposed in July 2017; these estimates may change if CMS changes this methodology when it finalizes this DSH allotment reduction rule.
Source: MACPAC, 2019, analysis of Census 2019, CBO 2018b, 2016 Medicare cost reports, and the CMS Medicaid Budget and Expenditure System.
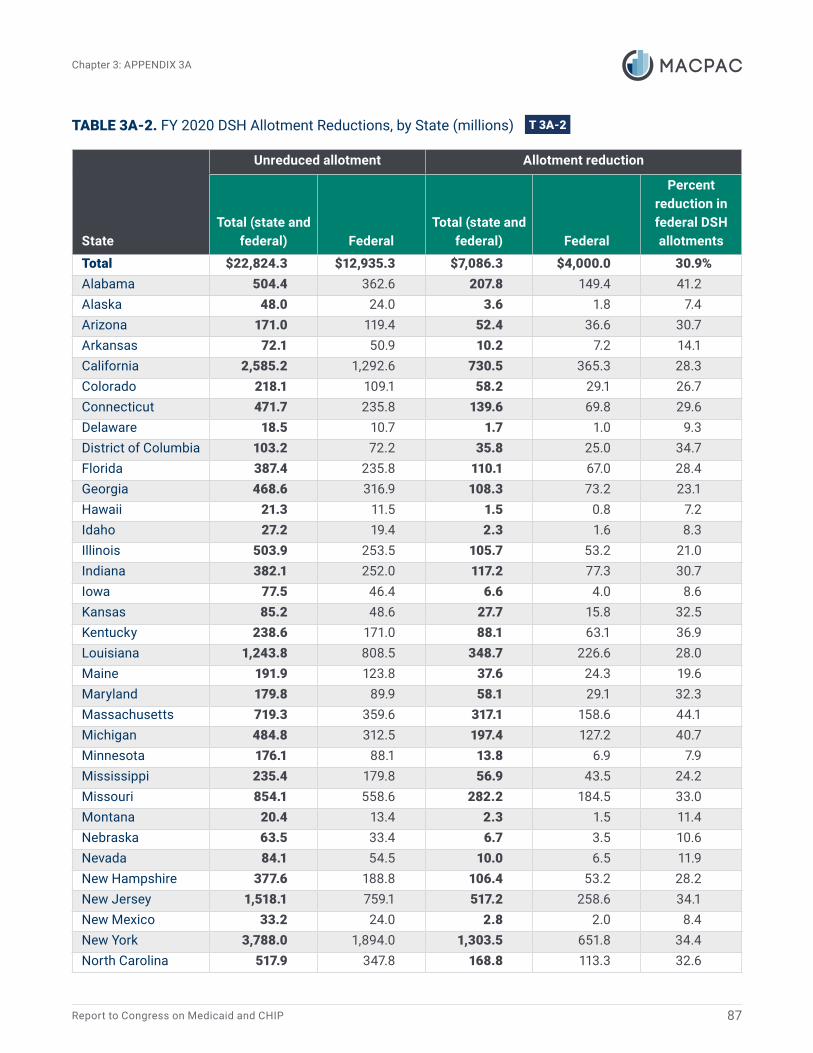
Chapter 3: APPENDIX 3A
87Report to Congress on Medicaid and CHIP
TABLE 3A-2. FY 2020 DSH Allotment Reductions, by State (millions)
State
Unreduced allotment Allotment reduction
Total (state and federal) Federal
Total (state and federal) Federal
Percent reduction in federal DSH allotments
Total $22,824.3 $12,935.3 $7,086.3 $4,000.0 30.9%Alabama 504.4 362.6 207.8 149.4 41.2Alaska 48.0 24.0 3.6 1.8 7.4Arizona 171.0 119.4 52.4 36.6 30.7Arkansas 72.1 50.9 10.2 7.2 14.1California 2,585.2 1,292.6 730.5 365.3 28.3Colorado 218.1 109.1 58.2 29.1 26.7Connecticut 471.7 235.8 139.6 69.8 29.6Delaware 18.5 10.7 1.7 1.0 9.3District of Columbia 103.2 72.2 35.8 25.0 34.7Florida 387.4 235.8 110.1 67.0 28.4Georgia 468.6 316.9 108.3 73.2 23.1Hawaii 21.3 11.5 1.5 0.8 7.2Idaho 27.2 19.4 2.3 1.6 8.3Illinois 503.9 253.5 105.7 53.2 21.0Indiana 382.1 252.0 117.2 77.3 30.7Iowa 77.5 46.4 6.6 4.0 8.6Kansas 85.2 48.6 27.7 15.8 32.5Kentucky 238.6 171.0 88.1 63.1 36.9Louisiana 1,243.8 808.5 348.7 226.6 28.0Maine 191.9 123.8 37.6 24.3 19.6Maryland 179.8 89.9 58.1 29.1 32.3Massachusetts 719.3 359.6 317.1 158.6 44.1Michigan 484.8 312.5 197.4 127.2 40.7Minnesota 176.1 88.1 13.8 6.9 7.9Mississippi 235.4 179.8 56.9 43.5 24.2Missouri 854.1 558.6 282.2 184.5 33.0Montana 20.4 13.4 2.3 1.5 11.4Nebraska 63.5 33.4 6.7 3.5 10.6Nevada 84.1 54.5 10.0 6.5 11.9New Hampshire 377.6 188.8 106.4 53.2 28.2New Jersey 1,518.1 759.1 517.2 258.6 34.1New Mexico 33.2 24.0 2.8 2.0 8.4New York 3,788.0 1,894.0 1,303.5 651.8 34.4North Carolina 517.9 347.8 168.8 113.3 32.6
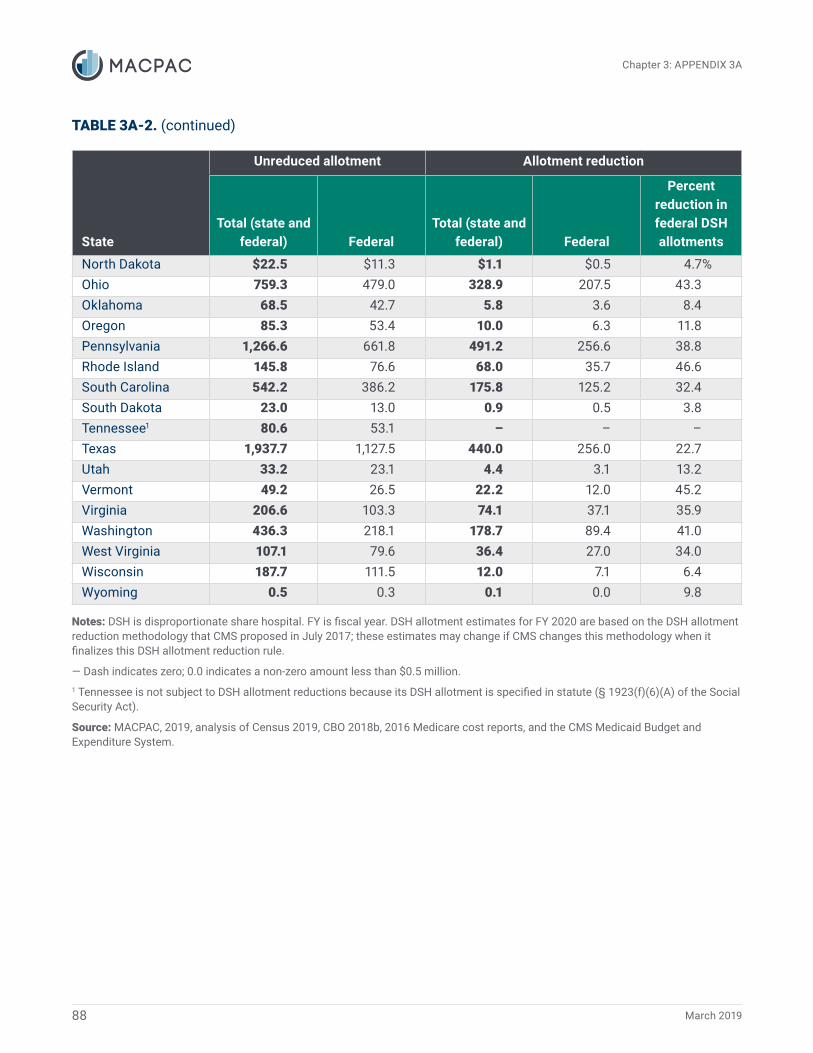
Chapter 3: APPENDIX 3A
88 March 2019
TABLE 3A-2. (continued)
State
Unreduced allotment Allotment reduction
Total (state and federal) Federal
Total (state and federal) Federal
Percent reduction in federal DSH allotments
North Dakota $22.5 $11.3 $1.1 $0.5 4.7%Ohio 759.3 479.0 328.9 207.5 43.3Oklahoma 68.5 42.7 5.8 3.6 8.4Oregon 85.3 53.4 10.0 6.3 11.8Pennsylvania 1,266.6 661.8 491.2 256.6 38.8Rhode Island 145.8 76.6 68.0 35.7 46.6South Carolina 542.2 386.2 175.8 125.2 32.4South Dakota 23.0 13.0 0.9 0.5 3.8Tennessee1 80.6 53.1 – – –Texas 1,937.7 1,127.5 440.0 256.0 22.7Utah 33.2 23.1 4.4 3.1 13.2Vermont 49.2 26.5 22.2 12.0 45.2Virginia 206.6 103.3 74.1 37.1 35.9Washington 436.3 218.1 178.7 89.4 41.0West Virginia 107.1 79.6 36.4 27.0 34.0Wisconsin 187.7 111.5 12.0 7.1 6.4Wyoming 0.5 0.3 0.1 0.0 9.8
Notes: DSH is disproportionate share hospital. FY is fiscal year. DSH allotment estimates for FY 2020 are based on the DSH allotment reduction methodology that CMS proposed in July 2017; these estimates may change if CMS changes this methodology when it finalizes this DSH allotment reduction rule.
― Dash indicates zero; 0.0 indicates a non-zero amount less than $0.5 million.1 Tennessee is not subject to DSH allotment reductions because its DSH allotment is specified in statute (§ 1923(f)(6)(A) of the Social Security Act).
Source: MACPAC, 2019, analysis of Census 2019, CBO 2018b, 2016 Medicare cost reports, and the CMS Medicaid Budget and Expenditure System.

Chapter 3: APPENDIX 3A
89Report to Congress on Medicaid and CHIP
TABLE 3A-3. Number of Uninsured Individuals and Uninsured Rate, by State, 2013–2017
State
2013 2017Difference in uninsured
(2017-2013)
Number (thousands)
Percent of state
populationNumber
(thousands)
Percent of state
populationNumber
(thousands)Percentage
point change
Total 45,181 14.5% 28,019 8.7% -17,162 -5.8%Alabama 645 13.6 449 9.4 -196 -4.2Alaska 132 18.5 98 13.7 -34 -4.8Arizona 1,118 17.1 695 10.1 -423 -7.1Arkansas 465 16.0 232 7.9 -233 -8.1California 6,500 17.2 2,797 7.2 -3,703 -10.0Colorado 729 14.1 414 7.5 -315 -6.6Connecticut 333 9.4 194 5.5 -139 -3.9Delaware 83 9.1 51 5.4 -32 -3.7District of Columbia 42 6.7 26 3.8 -16 -2.8Florida 3,853 20.0 2,676 12.9 -1,177 -7.1Georgia 1,846 18.8 1,375 13.4 -471 -5.4Hawaii 91 6.7 53 3.8 -38 -2.9Idaho 257 16.2 172 10.1 -85 -6.0Illinois 1,618 12.7 859 6.8 -759 -5.9Indiana 903 14.0 536 8.2 -367 -5.8Iowa 248 8.1 146 4.7 -102 -3.4Kansas 348 12.3 249 8.7 -99 -3.5Kentucky 616 14.3 235 5.4 -381 -8.9Louisiana 751 16.6 383 8.4 -368 -8.3Maine 147 11.2 107 8.1 -40 -3.1Maryland 593 10.2 366 6.1 -227 -4.0Massachusetts 247 3.7 190 2.8 -57 -0.9Michigan 1,072 11.0 510 5.2 -562 -5.8Minnesota 440 8.2 243 4.4 -197 -3.8Mississippi 500 17.1 352 12.0 -148 -5.0Missouri 773 13.0 548 9.1 -225 -3.9Montana 165 16.5 88 8.5 -77 -8.0Nebraska 209 11.3 157 8.3 -52 -3.0Nevada 570 20.7 333 11.2 -237 -9.4New Hampshire 140 10.7 77 5.8 -63 -4.9New Jersey 1,160 13.2 688 7.7 -472 -5.5New Mexico 382 18.6 187 9.1 -195 -9.5
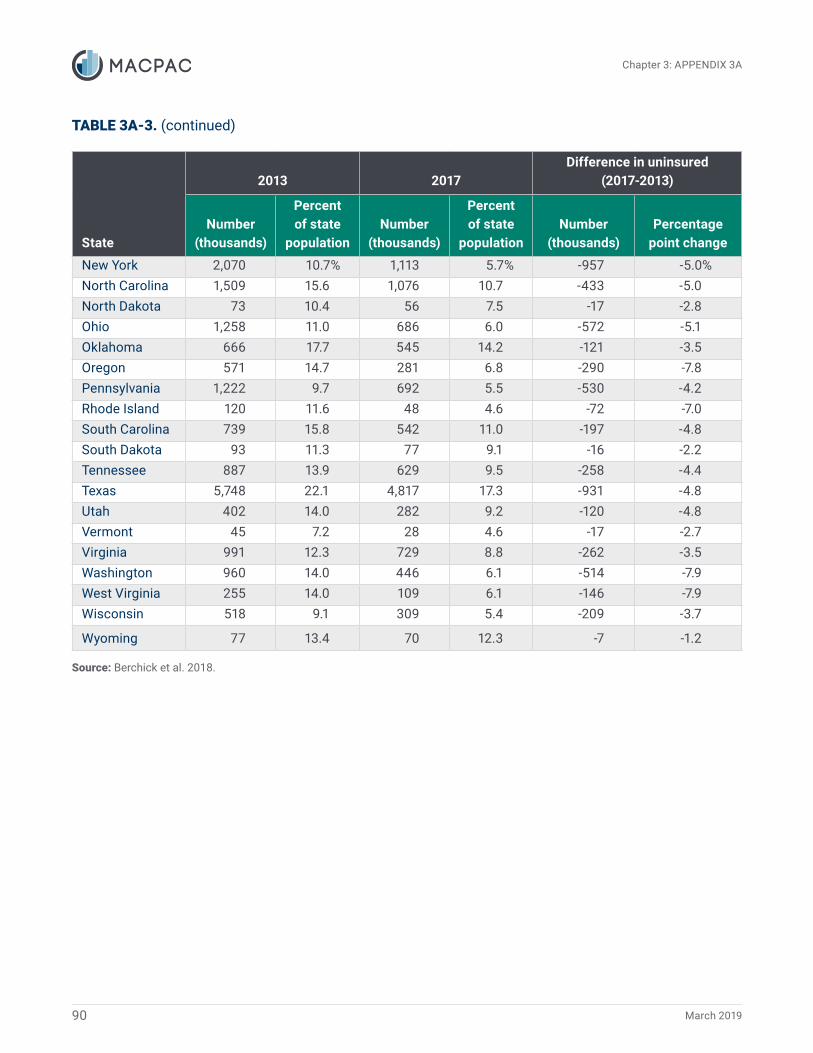
Chapter 3: APPENDIX 3A
90 March 2019
TABLE 3A-3. (continued)
State
2013 2017Difference in uninsured
(2017-2013)
Number (thousands)
Percent of state
populationNumber
(thousands)
Percent of state
populationNumber
(thousands)Percentage
point change
New York 2,070 10.7% 1,113 5.7% -957 -5.0%North Carolina 1,509 15.6 1,076 10.7 -433 -5.0North Dakota 73 10.4 56 7.5 -17 -2.8Ohio 1,258 11.0 686 6.0 -572 -5.1Oklahoma 666 17.7 545 14.2 -121 -3.5Oregon 571 14.7 281 6.8 -290 -7.8Pennsylvania 1,222 9.7 692 5.5 -530 -4.2Rhode Island 120 11.6 48 4.6 -72 -7.0South Carolina 739 15.8 542 11.0 -197 -4.8South Dakota 93 11.3 77 9.1 -16 -2.2Tennessee 887 13.9 629 9.5 -258 -4.4Texas 5,748 22.1 4,817 17.3 -931 -4.8Utah 402 14.0 282 9.2 -120 -4.8Vermont 45 7.2 28 4.6 -17 -2.7Virginia 991 12.3 729 8.8 -262 -3.5Washington 960 14.0 446 6.1 -514 -7.9West Virginia 255 14.0 109 6.1 -146 -7.9Wisconsin 518 9.1 309 5.4 -209 -3.7
Wyoming 77 13.4 70 12.3 -7 -1.2
Source: Berchick et al. 2018.

Chapter 3: A
PPEND
IX 3A
91Report to C
ongress on Medicaid and C
HIP
TABLE 3A-4. State Levels of Uncompensated Care, 2015–2016
State
Total hospital uncompensated care costs, 2015
Total hospital uncompensated care costs, 2016
Difference in total hospital uncompensated care costs (2016 less 2015)
Total (millions)Share of hospital
operating expenses Total (millions)Share of hospital
operating expenses Total (millions)Share of hospital operating expenses
(percentage point change)
Total $38,058 4.1% $35,002 3.6% -$3,056 -0.5%
Alabama 610 5.5 514 4.5 -96 -1.0
Alaska 101 3.8 105 3.6 4 -0.2
Arizona 458 2.8 307 1.9 -151 -0.9
Arkansas 250 3.6 193 2.7 -57 -0.9
California 2,141 1.9 1,810 1.5 -331 -0.4
Colorado 387 2.7 317 2.1 -69 -0.6
Connecticut 412 3.6 213 1.8 -199 -1.8
Delaware 73 2.2 71 2.1 -2 -0.2
District of Columbia 87 1.9 73 1.5 -14 -0.4
Florida 3,682 7.7 3,336 6.8 -346 -0.9
Georgia 1,788 7.4 1,865 7.4 77 0.0
Hawaii 47 1.3 51 1.3 4 0.0
Idaho 189 4.3 149 3.4 -40 -0.8
Illinois 1,444 3.8 1,458 3.6 14 -0.2
Indiana 1,073 5.1 751 3.3 -322 -1.7
Iowa 227 2.7 221 2.4 -6 -0.2
Kansas 343 4.1 283 3.2 -60 -0.9
Kentucky 310 2.3 273 1.9 -37 -0.4
Louisiana 966 7.2 587 4.2 -380 -3.0
Maine 198 3.7 189 3.3 -10 -0.4
Maryland 516 3.2 507 3.1 -9 -0.2
Massachusetts 519 1.9 552 1.9 33 0.0
Michigan 551 1.8 493 1.5 -58 -0.3
Minnesota 246 1.4 261 1.4 15 0.0
Mississippi 559 7.0 521 6.8 -38 -0.1
Missouri 1,133 5.4 1,016 4.6 -117 -0.8

Chapter 3: A
PPEND
IX 3A
92M
arch 2019
TABLE 3A-4. (continued)
State
Total hospital uncompensated care costs, 2015
Total hospital uncompensated care costs, 2016
Difference in total hospital uncompensated care costs (2016 less 2015)
Total (millions)Share of hospital
operating expenses Total (millions)Share of hospital
operating expenses Total (millions)Share of hospital operating expenses
(percentage point change)
Montana $155 3.9% $108 2.6% -$47 -1.3%
Nebraska 280 4.3 229 3.3 -51 -1.0
Nevada 218 3.7 174 2.8 -45 -0.9
New Hampshire 132 2.9 114 2.4 -18 -0.5
New Jersey 813 3.4 896 3.7 83 0.2
New Mexico 183 3.3 132 2.3 -51 -1.1
New York 2,554 3.6 2,448 3.3 -106 -0.3
North Carolina 1,594 6.3 1,782 6.6 187 0.4
North Dakota 85 2.2 89 2.2 4 0.0
Ohio 1,157 2.7 920 2.0 -237 -0.7
Oklahoma 645 6.1 565 5.2 -80 -1.0
Oregon 227 2.0 210 1.7 -17 -0.3
Pennsylvania 1,044 2.4 870 1.9 -175 -0.5
Rhode Island 75 2.1 73 2.0 -3 -0.2
South Carolina 1,008 8.2 878 6.8 -130 -1.4
South Dakota 97 2.4 103 2.4 6 0.0
Tennessee 864 5.1 825 4.7 -38 -0.4
Texas 6,188 9.2 5,713 8.1 -475 -1.1
Utah 301 4.5 323 4.5 22 0.0
Vermont 41 1.8 41 1.7 -0 -0.1
Virginia 1,116 5.8 1,375 6.7 258 1.0
Washington 349 1.7 365 1.7 16 0.0
West Virginia 165 2.7 134 2.1 -31 -0.6
Wisconsin 339 1.6 416 2.0 77 0.3
Wyoming 114 6.8 103 6.1 -11 -0.7

Chapter 3: A
PPEND
IX 3A
93Report to C
ongress on Medicaid and C
HIP
TABLE 3A-4. (continued)
Notes: Uncompensated care is calculated using Medicare cost reports, which define uncompensated care as charity care and bad debt. Because of recent changes in Medicare cost report definitions that changed uncompensated care reporting for 2015 and subsequent years, these data are not comparable with data for prior years.
0 or -0 indicates a non-zero amount between $500,000 and -$500,000 that rounds to zero.
Source: MACPAC, 2019, analysis of 2015 and 2016 Medicare cost reports.

Chapter 3: APPENDIX 3A
94 March 2019
TABLE 3A-5. Number and Share of Hospitals Receiving DSH Payments and Meeting Other Criteria, by State, 2014
StateNumber of
hospitals (all)
DSH hospitalsDeemed DSH
hospitals
Deemed DSH hospitals that provide at least one essential community service
Number Percent Number Percent Number Percent
Total 5,969 2,714 45% 832 14% 761 13%Alabama 114 63 55 4 4 4 4Alaska 25 4 16 1 4 1 4Arizona 104 39 38 39 38 31 30Arkansas 98 7 7 4 4 4 4California 401 44 11 41 10 36 9Colorado 99 71 72 16 16 16 16Connecticut 41 9 22 3 7 2 5Delaware 13 2 15 2 15 2 15District of Columbia 13 9 69 6 46 6 46Florida 251 72 29 40 16 37 15Georgia 168 126 75 33 20 22 13Hawaii1 25 – – – – – –Idaho 47 23 49 7 15 6 13Illinois 206 56 27 47 23 42 20Indiana 167 51 31 11 7 11 7Iowa 121 7 6 7 6 7 6Kansas 150 62 41 12 8 12 8Kentucky 117 97 83 34 29 31 26Louisiana 208 67 32 34 16 30 14Maine 37 1 3 1 3 1 3Maryland 60 11 18 8 13 7 12Massachusetts2 97 – – – – – –Michigan 164 119 73 20 12 18 11Minnesota 144 57 40 13 9 13 9Mississippi 109 54 50 15 14 14 13Missouri 144 113 78 27 19 25 17Montana 65 34 52 3 5 3 5Nebraska 96 27 28 14 15 12 13Nevada 52 21 40 6 12 5 10New Hampshire 30 29 97 6 20 6 20New Jersey 97 69 71 23 24 23 24New Mexico 53 7 13 3 6 3 6New York 192 172 90 36 19 35 18

Chapter 3: APPENDIX 3A
95Report to Congress on Medicaid and CHIP
TABLE 3A-5. (continued)
StateNumber of
hospitals (all)
DSH hospitalsDeemed DSH
hospitals
Deemed DSH hospitals that provide at least one essential community service
Number Percent Number Percent Number Percent
North Carolina 132 74 56% 20 15% 20 15%North Dakota 49 8 16 3 6 3 6Ohio 230 159 69 17 7 16 7Oklahoma 152 50 33 13 9 11 7Oregon 63 59 94 15 24 15 24Pennsylvania 226 201 89 41 18 39 17Rhode Island 15 14 93 3 20 2 13South Carolina 83 58 70 14 17 14 17South Dakota 62 24 39 13 21 12 19Tennessee 142 65 46 18 13 12 8Texas 589 175 30 102 17 100 17Utah 59 42 71 5 8 4 7Vermont 16 13 81 1 6 1 6Virginia 108 24 22 6 6 6 6Washington 101 60 59 14 14 13 13West Virginia 61 51 84 10 16 8 13Wisconsin 144 103 72 20 14 19 13Wyoming 29 11 38 1 3 1 3
Notes: DSH is disproportionate share hospital. Excludes 111 DSH hospitals that did not submit a 2016 Medicare cost report. Deemed DSH hospitals are statutorily required to receive DSH payments because they serve a high share of Medicaid-enrolled and low-income patients. Deemed DSH status was estimated based on available data on Medicaid inpatient and low-income utilization rates. Our working definition of essential community services includes the following services: burn services, dental services, graduate medical education, HIV/AIDS care, inpatient psychiatric services (through psychiatric subunit or stand-alone psychiatric hospital), neonatal intensive care units, obstetrics and gynecology services, primary care services, substance use disorder services, and trauma services. For further discussion of the methodology and limitations, see Appendix 3B.
― Dash indicates zero.1 Hawaii did not report DSH spending in 2014.2 Massachusetts does not make DSH payments to hospitals because its Section 1115 demonstration allows the state to use all of its DSH funding for the state’s safety-net care pool instead; for this reason, no hospitals in the state can be characterized as DSH or deemed DSH hospitals.
Source: MACPAC, 2019, analysis of state plan rate year 2014 DSH audits, 2014 and 2016 Medicare cost reports, and the 2016 American Hospital Association annual survey.

Chapter 3: A
PPEND
IX 3A
96M
arch 2019
TABLE 3A-6. Number and Share of Hospital Beds and Medicaid Days Provided by Deemed DSH Hospitals, by State, 2014
State
Number of hospital beds Number of Medicaid days (thousands)
All hospitals
DSH hospitals Deemed DSH hospitals
All hospitals
DSH hospitals Deemed DSH hospitals
Number Percent Number Percent Number Percent Number Percent
Total 664,083 386,268 58% 140,872 21% 40,729 27,612 68% 14,846 36%
Alabama 12,650 8,701 69 586 5 670 462 69 51 8
Alaska 1,217 493 41 80 7 72 42 57 2 3
Arizona 12,091 5,861 48 5,861 48 916 654 71 654 71
Arkansas 8,044 1,429 18 1,080 13 318 73 23 57 18
California 61,564 7,004 11 5,910 10 4,935 1,092 22 960 19
Colorado 8,649 6,826 79 2,152 25 578 538 93 281 49
Connecticut 7,129 2,419 34 535 8 530 220 41 86 16
Delaware 2,280 269 12 269 12 143 8 6 8 6
District of Columbia 2,480 2,056 83 936 38 252 241 95 125 50
Florida 46,642 19,302 41 11,185 24 2,742 1,699 62 1,284 47
Georgia 18,521 15,109 82 4,949 27 1,152 1,099 95 548 48
Hawaii1 2,255 – – – – 162 – – – –
Idaho 2,573 1,839 71 918 36 119 105 89 61 52
Illinois 26,786 10,642 40 8,200 31 1,801 1,047 58 792 44
Indiana 14,700 5,090 35 2,403 16 776 358 46 249 32
Iowa 6,629 1,261 19 1,261 19 332 129 39 129 39
Kansas 7,177 3,837 53 1,197 17 227 166 73 75 33
Kentucky 12,294 11,329 92 4,487 36 789 761 96 439 56
Louisiana 14,764 6,775 46 3,304 22 652 380 58 263 40
Maine 2,702 51 2 51 2 135 1 1 1 1
Maryland 10,944 2,237 20 1,720 16 768 113 15 69 9
Massachusetts2 16,770 – – – – 1,318 – – – –
Michigan 20,600 17,057 83 4,988 24 1,195 1,039 87 553 46
Minnesota 9,376 5,849 62 1,781 19 586 492 84 254 43
Mississippi 9,106 5,523 61 2,355 26 456 297 65 175 38
Missouri 15,391 12,567 82 1,839 12 906 622 69 186 21

Chapter 3: A
PPEND
IX 3A
97Report to C
ongress on Medicaid and C
HIP
TABLE 3A-6. (continued)
State
Number of hospital beds Number of Medicaid days (thousands)
All hospitals
DSH hospitals Deemed DSH hospitals
All hospitals
DSH hospitals Deemed DSH hospitals
Number Percent Number Percent Number Percent Number Percent
Montana 2,607 1,872 72% 176 7% 72 69 96% 9 13%
Nebraska 4,749 3,145 66 1,856 39 156 147 94 113 72
Nevada 5,473 3,118 57 1,580 29 407 345 85 249 61
New Hampshire 2,356 2,356 100 749 32 83 83 100 49 59
New Jersey 18,780 16,495 88 5,329 28 1,023 955 93 438 43
New Mexico 3,777 1,141 30 415 11 316 158 50 92 29
New York 38,384 37,129 97 8,526 22 3,528 3,446 98 1,272 36
North Carolina 18,657 14,708 79 4,404 24 1,114 1,007 90 356 32
North Dakota 2,282 1,064 47 583 26 84 55 66 42 50
Ohio 27,120 23,256 86 4,606 17 1,620 1,506 93 633 39
Oklahoma 10,122 5,007 49 1,367 14 496 259 52 100 20
Oregon 5,920 5,589 94 1,555 26 390 384 99 180 46
Pennsylvania 31,590 30,153 95 5,868 19 1,641 1,617 99 593 36
Rhode Island 2,564 2,482 97 805 31 143 143 100 53 37
South Carolina 10,540 9,149 87 2,922 28 561 553 99 293 52
South Dakota 2,508 1,667 66 1,008 40 89 83 93 59 66
Tennessee 15,612 11,169 72 4,100 26 876 758 86 441 50
Texas 59,617 29,897 50 18,776 31 2,988 2,321 78 1,828 61
Utah 4,651 3,731 80 525 11 225 218 97 50 22
Vermont 980 814 83 344 35 48 47 99 27 58
Virginia 14,401 5,803 40 1,285 9 698 381 55 141 20
Washington 10,290 7,899 77 1,806 18 766 606 79 122 16
West Virginia 5,595 5,177 93 1,215 22 300 297 99 124 41
Wisconsin 10,916 9,410 86 2,999 27 551 527 96 278 51
Wyoming 1,258 511 41 26 2 24 9 39 0 2

Chapter 3: A
PPEND
IX 3A
98M
arch 2019
TABLE 3A-6. (continued)
Notes: DSH is disproportionate share hospital. Excludes 111 DSH hospitals that did not submit a 2016 Medicare cost report. Deemed DSH status was estimated based on available data on Medicaid inpatient and low-income utilization rates. For further discussion of the methodology and limitations, see Appendix 3B.
― Dash indicates zero; 0 indicates non-zero amount less than 500.1 Hawaii did not report DSH spending in 2014.2 Massachusetts does not make DSH payments to hospitals because its Section 1115 demonstration allows the state to use all of its DSH funding for the state’s safety-net care pool instead; for this reason, no hospitals in the state can be characterized as DSH or deemed DSH hospitals.
Source: MACPAC, 2019, analysis of 2014 and 2016 Medicare cost reports and state plan rate year 2014 DSH audits.

Chapter 3: A
PPEND
IX 3A
99Report to C
ongress on Medicaid and C
HIP
TABLE 3A-7. FY 2019 DSH Allotment per Uninsured Individual, by State (millions)
State
FY 2019 DSH allotmentFY 2019 DSH allotment per uninsured individual
FY 2019 DSH allotment per uninsured individual and Medicaid enrollee
Total (state and federal) Federal
Total (state and federal) Federal
Total (state and federal) Federal
Total $22,281.1 $12,627.6 $795.2 $450.7 $288.6 $163.6
Alabama 492.4 353.9 1,096.6 788.2 431.1 309.9
Alaska 46.9 23.4 478.5 239.2 213.0 106.5
Arizona 166.9 116.5 240.2 167.7 88.0 61.4
Arkansas 70.4 49.7 303.5 214.0 85.4 60.2
California 2,523.5 1,261.7 902.2 451.1 232.2 116.1
Colorado 212.9 106.5 514.3 257.2 170.5 85.2
Connecticut 460.4 230.2 2,373.1 1,186.6 629.6 314.8
Delaware 18.1 10.4 355.0 204.3 103.0 59.3
District of Columbia 100.7 70.5 3,873.4 2,711.4 628.1 439.6
Florida 378.2 230.2 141.3 86.0 70.6 43.0
Georgia 457.4 309.3 332.7 225.0 172.3 116.5
Hawaii 20.8 11.2 392.5 211.6 89.8 48.4
Idaho 26.6 18.9 154.6 110.0 69.7 49.6
Illinois 491.9 247.5 572.6 288.1 171.6 86.3
Indiana 373.0 246.0 695.9 459.0 263.4 173.7
Iowa 75.6 45.3 518.0 310.5 140.5 84.2
Kansas 83.1 47.5 333.9 190.7 157.7 90.0
Kentucky 232.9 166.9 990.9 710.2 205.6 147.3
Louisiana 1,214.1 789.2 3,170.0 2,060.5 878.1 570.7
Maine 187.3 120.9 1,750.5 1,129.5 762.4 491.9
Maryland 175.5 87.8 479.6 239.8 149.3 74.7
Massachusetts 702.1 351.0 3,695.2 1,847.6 537.5 268.8
Michigan 473.2 305.0 927.9 598.1 220.8 142.3
Minnesota 171.9 86.0 707.5 353.8 172.9 86.5
Mississippi 229.8 175.5 652.8 498.6 270.2 206.4
Missouri 833.7 545.3 1,521.4 995.0 695.3 454.7

Chapter 3: A
PPEND
IX 3A
100M
arch 2019
TABLE 3A-7. (continued)
State
FY 2019 DSH allotmentFY 2019 DSH allotment per uninsured individual
FY 2019 DSH allotment per uninsured individual and Medicaid enrollee
Total (state and federal) Federal
Total (state and federal) Federal
Total (state and federal) Federal
Montana $19.9 $13.1 $226.5 $148.5 $80.2 $52.6
Nebraska 61.9 32.6 394.5 207.5 189.6 99.7
Nevada 82.1 53.2 246.4 159.9 107.5 69.8
New Hampshire 368.5 184.3 4,786.2 2,393.1 1,730.7 865.4
New Jersey 1,481.9 740.9 2,153.9 1,076.9 813.6 406.8
New Mexico 32.4 23.4 173.5 125.4 45.3 32.7
New York 3,697.5 1,848.7 3,322.1 1,661.0 760.1 380.0
North Carolina 505.6 339.5 469.9 315.6 206.1 138.4
North Dakota 22.0 11.0 392.6 196.3 196.4 98.2
Ohio 741.1 467.6 1,080.4 681.6 289.0 182.3
Oklahoma 66.8 41.7 122.6 76.5 63.1 39.4
Oregon 83.3 52.1 296.4 185.4 84.4 52.8
Pennsylvania 1,236.3 646.0 1,786.6 933.5 505.7 264.2
Rhode Island 142.3 74.8 2,964.8 1,558.6 632.1 332.3
South Carolina 529.3 376.9 976.5 695.5 427.3 304.3
South Dakota 22.4 12.7 291.1 165.1 139.2 78.9
Tennessee 80.6 53.1 128.2 84.4 50.2 33.1
Texas 1,891.4 1,100.6 392.7 228.5 223.2 129.9
Utah 32.4 22.6 114.9 80.1 63.9 44.5
Vermont 48.1 25.9 1,716.2 924.9 320.6 172.8
Virginia 201.7 100.8 276.6 138.3 141.7 70.9
Washington 425.9 212.9 954.8 477.4 265.9 133.0
West Virginia 104.5 77.7 958.8 712.8 214.7 159.6
Wisconsin 183.3 108.8 593.1 352.1 188.5 111.9
Wyoming 0.5 0.3 7.4 3.7 4.5 2.3

Chapter 3: A
PPEND
IX 3A
101Report to C
ongress on Medicaid and C
HIP
TABLE 3A-7. (continued)
Notes: FY is fiscal year. DSH is disproportionate share hospital. Excludes DSH hospitals that did not submit a Medicare cost report. Calculations of DSH allotments per uninsured individual and Medicaid enrollee are based on the 2017 American Community Survey (ACS) from the U.S. Census Bureau. Estimates of Medicaid enrollment in the ACS include CHIP and other state-funded, means-tested programs; ACS estimates of Medicaid enrollment are typically lower than what is reported in administrative data.
Source: MACPAC, 2019, analysis of state plan rate year 2014 DSH audits, 2014 and 2016 Medicare cost reports, the American Hospital Association annual survey, and Census 2019.

Chapter 3: A
PPEND
IX 3A
102M
arch 2019
TABLE 3A-8. FY 2019 Unreduced DSH Allotments as a Percentage of Hospital Uncompensated Care, by State, 2016
StateFY 2019 federal DSH allotment (millions)
FY 2019 federal DSH allotment as a percentage of hospital
uncompensated care in the state, 2016
FY 2019 DSH allotment (state and federal, millions)
FY 2019 total DSH allotment as a percentage of hospital
uncompensated care in the state, 2016
Total $12,627.6 36% $22,281.1 64%
Alabama 353.9 69 492.4 96
Alaska 23.4 22 46.9 44
Arizona 116.5 38 166.9 54
Arkansas 49.7 26 70.4 36
California 1,261.7 70 2,523.5 139
Colorado 106.5 34 212.9 67
Connecticut 230.2 108 460.4 216
Delaware 10.4 15 18.1 25
District of Columbia 70.5 97 100.7 138
Florida 230.2 7 378.2 11
Georgia 309.3 17 457.4 25
Hawaii 11.2 22 20.8 41
Idaho 18.9 13 26.6 18
Illinois 247.5 17 491.9 34
Indiana 246.0 33 373.0 50
Iowa 45.3 21 75.6 34
Kansas 47.5 17 83.1 29
Kentucky 166.9 61 232.9 85
Louisiana 789.2 135 1,214.1 207
Maine 120.9 64 187.3 99
Maryland 87.8 17 175.5 35
Massachusetts 351.0 64 702.1 127
Michigan 305.0 62 473.2 96
Minnesota 86.0 33 171.9 66
Mississippi 175.5 34 229.8 44
Missouri 545.3 54 833.7 82

Chapter 3: A
PPEND
IX 3A
103Report to C
ongress on Medicaid and C
HIP
TABLE 3A-8. (continued)
StateFY 2019 federal DSH allotment (millions)
FY 2019 federal DSH allotment as a percentage of hospital
uncompensated care in the state, 2016
FY 2019 DSH allotment (state and federal, millions)
FY 2019 total DSH allotment as a percentage of hospital
uncompensated care in the state, 2016
Montana $13.1 12% $19.9 18%
Nebraska 32.6 14 61.9 27
Nevada 53.2 31 82.1 47
New Hampshire 184.3 162 368.5 324
New Jersey 740.9 83 1,481.9 165
New Mexico 23.4 18 32.4 25
New York 1,848.7 76 3,697.5 151
North Carolina 339.5 19 505.6 28
North Dakota 11.0 12 22.0 25
Ohio 467.6 51 741.1 81
Oklahoma 41.7 7 66.8 12
Oregon 52.1 25 83.3 40
Pennsylvania 646.0 74 1,236.3 142
Rhode Island 74.8 103 142.3 195
South Carolina 376.9 43 529.3 60
South Dakota 12.7 12 22.4 22
Tennessee 53.1 6 80.6 10
Texas 1,100.6 19 1,891.4 33
Utah 22.6 7 32.4 10
Vermont 25.9 63 48.1 117
Virginia 100.8 7 201.7 15
Washington 212.9 58 425.9 117
West Virginia 77.7 58 104.5 78
Wisconsin 108.8 26 183.3 44
Wyoming 0.3 0 0.5 1

Chapter 3: A
PPEND
IX 3A
104M
arch 2019
TABLE 3A-8. (continued)
Notes: FY is fiscal year. DSH is disproportionate share hospital. Excludes DSH hospitals that did not submit a Medicare cost report. Uncompensated care is calculated using 2016 Medicare cost reports, which define uncompensated care as charity care and bad debt. Because of recent changes in Medicare cost report definitions that changed uncompensated care reporting for 2015 and subsequent years, these data are not comparable with data for prior years.
0 indicates a non-zero amount less than 0.5 percent.
Source: MACPAC, 2019, analysis of state plan rate year 2014 DSH audits, 2016 Medicare cost reports, and the American Hospital Association annual survey.

Chapter 3: A
PPEND
IX 3A
105Report to C
ongress on Medicaid and C
HIP
TABLE 3A-9. FY 2019 DSH Allotment per Deemed DSH Hospital Providing at Least One Essential Community Service, by State (millions)
State
FY 2019 DSH allotmentFY 2019 DSH allotment
per deemed DSH hospital
FY 2019 DSH allotment per deemed DSH hospital providing at least one
essential community service
Total (state and federal) Federal Total (state and federal) Federal Total (state and federal) Federal
Total $22,281.1 $12,627.6 $26.8 $15.2 $29.3 $16.6
Alabama 492.4 353.9 123.1 88.5 123.1 88.5
Alaska 46.9 23.4 46.9 23.4 46.9 23.4
Arizona 166.9 116.5 4.3 3.0 5.4 3.8
Arkansas 70.4 49.7 17.6 12.4 17.6 12.4
California 2,523.5 1,261.7 61.5 30.8 70.1 35.0
Colorado 212.9 106.5 13.3 6.7 13.3 6.7
Connecticut 460.4 230.2 153.5 76.7 230.2 115.1
Delaware 18.1 10.4 9.1 5.2 9.1 5.2
District of Columbia 100.7 70.5 16.8 11.7 16.8 11.7
Florida 378.2 230.2 9.5 5.8 10.2 6.2
Georgia 457.4 309.3 13.9 9.4 20.8 14.1
Hawaii1 20.8 11.2 – – – –
Idaho 26.6 18.9 3.8 2.7 4.4 3.2
Illinois 491.9 247.5 10.5 5.3 11.7 5.9
Indiana 373.0 246.0 33.9 22.4 33.9 22.4
Iowa 75.6 45.3 10.8 6.5 10.8 6.5
Kansas 83.1 47.5 6.9 4.0 6.9 4.0
Kentucky 232.9 166.9 6.8 4.9 7.5 5.4
Louisiana 1,214.1 789.2 35.7 23.2 40.5 26.3
Maine 187.3 120.9 187.3 120.9 187.3 120.9
Maryland 175.5 87.8 21.9 11.0 25.1 12.5
Massachusetts2 702.1 351.0 – – – –
Michigan 473.2 305.0 23.7 15.3 26.3 16.9
Minnesota 171.9 86.0 13.2 6.6 13.2 6.6
Mississippi 229.8 175.5 15.3 11.7 16.4 12.5

Chapter 3: A
PPEND
IX 3A
106M
arch 2019
TABLE 3A-9. (continued)
State
FY 2019 DSH allotmentFY 2019 DSH allotment
per deemed DSH hospital
FY 2019 DSH allotment per deemed DSH hospital providing at least one
essential community service
Total (state and federal) Federal Total (state and federal) Federal Total (state and federal) Federal
Missouri $833.7 $545.3 $30.9 $20.2 $33.3 $21.8
Montana 19.9 13.1 6.6 4.4 6.6 4.4
Nebraska 61.9 32.6 4.4 2.3 5.2 2.7
Nevada 82.1 53.2 13.7 8.9 16.4 10.6
New Hampshire 368.5 184.3 61.4 30.7 61.4 30.7
New Jersey 1,481.9 740.9 64.4 32.2 64.4 32.2
New Mexico 32.4 23.4 10.8 7.8 10.8 7.8
New York 3,697.5 1,848.7 102.7 51.4 105.6 52.8
North Carolina 505.6 339.5 25.3 17.0 25.3 17.0
North Dakota 22.0 11.0 7.3 3.7 7.3 3.7
Ohio 741.1 467.6 43.6 27.5 46.3 29.2
Oklahoma 66.8 41.7 5.1 3.2 6.1 3.8
Oregon 83.3 52.1 5.6 3.5 5.6 3.5
Pennsylvania 1,236.3 646.0 30.2 15.8 31.7 16.6
Rhode Island 142.3 74.8 47.4 24.9 71.2 37.4
South Carolina 529.3 376.9 37.8 26.9 37.8 26.9
South Dakota 22.4 12.7 1.7 1.0 1.9 1.1
Tennessee 80.6 53.1 4.5 3.0 6.7 4.4
Texas 1,891.4 1,100.6 18.5 10.8 18.9 11.0
Utah 32.4 22.6 6.5 4.5 8.1 5.6
Vermont 48.1 25.9 48.1 25.9 48.1 25.9
Virginia 201.7 100.8 33.6 16.8 33.6 16.8
Washington 425.9 212.9 30.4 15.2 32.8 16.4
West Virginia 104.5 77.7 10.5 7.8 13.1 9.7
Wisconsin 183.3 108.8 9.2 5.4 9.6 5.7
Wyoming 0.5 0.3 0.5 0.3 0.5 0.3

Chapter 3: A
PPEND
IX 3A
107Report to C
ongress on Medicaid and C
HIP
TABLE 3A-9. (continued)
Notes: FY is fiscal year. DSH is disproportionate share hospital. Excludes 111 DSH hospitals that did not submit a 2016 Medicare cost report. Deemed DSH status was estimated based on available data on Medicaid inpatient and low-income utilization rates. Our working definition of essential community services includes the following services: burn services, dental services, graduate medical education, HIV/AIDS care, inpatient psychiatric services (through psychiatric subunit or stand-alone psychiatric hospital), neonatal intensive care units, obstetrics and gynecology services, primary care services, substance use disorder services, and trauma services. For further discussion of the methodology and limitations, see Appendix 3B.
– Dash indicates that the category is not available.1 Hawaii did not report DSH spending in 2014.2 Massachusetts does not make DSH payments to hospitals because its Section 1115 demonstration allows the state to use all of its DSH funding for the state’s safety-net care pool instead; for this reason, no hospitals in the state can be categorized as DSH or deemed DSH hospitals.
Source: MACPAC, 2019, analysis of CMS Medicaid Budget and Expenditure System, state plan rate year 2014 DSH audits, 2014 and 2016 Medicare cost reports, and the 2016 American Hospital Association annual survey.

Chapter 3: A
PPEND
IX 3A
108M
arch 2019
TABLE 3A-10. Medicaid Payments to DSH Hospitals as a Share of Costs, by State, SPRY 2014
State
Share of hospitals in the state included
in analysis
Medicaid payments as a share of costs for Medicaid-enrolled patients
Medicaid payments as a share of costs for Medicaid-enrolled and uninsured patients
Base payments
Non-DSH supplemental
payments DSH paymentsTotal Medicaid
paymentsBase
payments
Non-DSH supplemental
payments DSH paymentsTotal Medicaid
payments
Total 44% 79% 12% 13% 103% 68% 10% 11% 88%
Alabama 56 73 19 33 125 55 14 25 95
Alaska 12 110 – 4 114 89 – 3 92
Arizona 39 44 27 5 75 39 24 4 67
Arkansas 6 74 18 25 116 60 14 20 95
California1 10 88 6 35 129 76 5 30 112
Colorado 72 69 30 8 107 60 26 7 93
Connecticut 15 77 3 4 84 75 3 4 82
Delaware 8 93 – 26 119 78 – 22 100
District of Columbia 23 89 0 15 104 84 0 15 99
Florida 28 91 15 4 110 75 13 3 90
Georgia 79 92 4 10 106 71 3 8 82
Idaho 53 99 2 4 104 84 1 4 89
Illinois2 26 77 28 11 116 67 24 10 101
Indiana 31 97 – 18 116 81 – 15 96
Iowa 6 84 6 10 100 78 6 10 94
Kansas 41 77 9 7 93 63 7 6 76
Kentucky 81 88 6 7 101 77 5 6 89
Louisiana 31 70 2 63 134 51 1 46 98
Maryland 13 107 – 12 119 89 – 10 99
Michigan 71 68 27 5 100 63 26 5 94
Minnesota3 35 85 6 1 92 82 6 1 89
Mississippi 53 83 19 15 117 68 16 12 97
Missouri 74 104 – 17 120 85 – 14 99
Montana 52 80 13 6 100 63 11 5 79

Chapter 3: A
PPEND
IX 3A
109Report to C
ongress on Medicaid and C
HIP
TABLE 3A-10. (continued)
State
Share of hospitals in the state included
in analysis
Medicaid payments as a share of costs for Medicaid-enrolled patients
Medicaid payments as a share of costs for Medicaid-enrolled and uninsured patients
Base payments
Non-DSH supplemental
payments DSH paymentsTotal Medicaid
paymentsBase
payments
Non-DSH supplemental
payments DSH paymentsTotal Medicaid
payments
Nebraska 23% 79% 0% 4% 83% 66% 0% 3% 69%
Nevada 42 72 11 9 91 56 8 7 71
New Jersey 65 84 5 25 114 62 4 19 85
New Mexico 13 89 13 5 107 74 11 4 89
New York 91 77 3 14 94 72 3 13 88
North Carolina 53 71 34 9 113 57 27 7 92
North Dakota2 6 117 – 2 119 105 – 2 107
Ohio 68 84 6 8 98 77 6 7 90
Oklahoma 32 76 29 4 110 64 24 3 91
Oregon 90 98 3 3 104 89 3 3 94
Pennsylvania 91 59 14 9 81 49 11 7 67
Rhode Island 80 85 1 14 100 79 1 13 93
South Carolina 72 90 3 19 112 72 2 15 89
Tennessee3 43 85 24 1 110 72 20 1 93
Texas 29 80 23 18 120 58 16 13 87
Utah 69 87 32 4 123 68 25 3 96
Vermont 81 80 – 10 90 76 – 9 86
Virginia3 22 88 11 10 108 69 8 8 85
Washington 56 82 (0) 8 89 75 -0 7 82
Wisconsin 67 75 16 1 93 68 15 1 84
Wyoming 38 78 12 1 90 54 8 0 63
Notes: DSH is disproportionate share hospital. SPRY is state plan rate year, which often coincides with state fiscal year and may not align with the federal fiscal year. This analysis includes 44 states and the District of Columbia and excludes Hawaii, Massachusetts, Maine, New Hampshire, South Dakota, and West Virginia. Institutions for mental diseases were also excluded. Base Medicaid payments include fee-for-service as well as managed care payments for services. Non-DSH supplemental payments include upper payment limit payments in fee-for-service Medicaid, graduate medical education payments, and supplemental payments authorized under Section 1115 demonstrations (except for delivery system reform incentive payments, which are not reported on DSH audits). DSH payments and non-DSH supplemental payments may also be used to offset non-Medicaid costs, such as unpaid costs of care for uninsured patients. Costs for uninsured patients are uncompensated care costs for uninsured patients, net of payments received from them. Payment levels shown do not account for provider contributions to the non-federal share; these contributions may reduce net payments. Numbers do not sum due to rounding.

Chapter 3: A
PPEND
IX 3A
110M
arch 2019
TABLE 3A-10. (continued)
― Dash indicates zero; 0 indicates a non-zero amount less than 0.5 percent.1 California public hospitals are eligible to receive DSH payments up to 175 percent of the hospital’s Medicaid uninsured costs.2 Illinois and North Dakota reported SPRY 2014 DSH payments that exceeded hospital uncompensated care costs for Medicaid and uninsured patients on their as-filed DSH audits. Because DSH payments to an individual hospital cannot exceed hospital uncompensated care costs, some of these payments may be recouped when these states’ DSH audits are finalized.3 Two DSH hospitals in Minnesota, all DSH hospitals in New Hampshire, three DSH hospitals in Tennessee, one DSH hospital in Virginia, and all DSH hospitals in West Virginia did not include payments from third-party payers when calculating Medicaid shortfall, so they are excluded from this analysis.
Source: MACPAC, 2019, analysis of SPRY 2014 as-filed Medicaid DSH audits.

Chapter 3: APPENDIX 3B
111Report to Congress on Medicaid and CHIP
APPENDIX 3B: Methodology and Data Limitations MACPAC used data from several different sources to analyze and describe Medicaid disproportionate share hospital (DSH) payments and their relationship to factors such as uninsured rates, uncompensated care, and DSH hospitals with high levels of uncompensated care that provide access to essential services. We also modeled DSH allotment reductions and simulated DSH payments under a variety of scenarios. Below we describe the data sources used in this analysis and the limitations associated with each one, and we review the modeling assumptions we made for our projections of DSH allotments and payments.
Primary Data Sources
DSH audit dataWe used state plan rate year 2014 DSH audit reports, the most recent data available, to examine historic DSH spending and the distribution of DSH spending among a variety of hospital types. These data were provided by the Centers for Medicare & Medicaid Services (CMS) on an as-filed basis and may be subject to change as CMS completes its internal review of state DSH audit reports.
Overall, 2,825 hospitals receiving DSH payments are represented in our analyses of DSH audit data. We did not include DSH audit data provided by states for hospitals that did not receive DSH payments (81 hospitals were excluded under this criterion). Some hospitals received DSH payments from multiple states; we combined the data for duplicate hospitals so that each hospital would only appear once in the dataset.
Medicare cost reportsWe used Medicare cost report data to examine uncompensated care for all hospitals in each state. A hospital that receives Medicare payments must file an annual Medicare cost report, which includes a range of financial and non-financial data about hospital performance and services provided. We excluded hospitals in U.S. territories, religious non-medical health care institutions, and hospitals participating in special Medicare demonstration projects (87 hospitals were excluded under these criteria). These facilities submit Medicare cost reports but do not receive Medicare DSH payments.
We linked DSH audit data and Medicare cost report data to create descriptive analyses of DSH hospitals and to identify deemed DSH hospitals. Hospitals were matched based on their CMS certification number. A total of 2,714 DSH hospitals were included in these analyses. We excluded 111 DSH hospitals without matching 2016 Medicare cost reports.
When using Medicare cost reports to analyze hospital uncompensated care, we excluded hospitals that reported uncompensated care costs that were greater than hospital operating expenses. One hospital was excluded under this criterion.
When using Medicare cost reports to analyze hospital operating margins, we excluded hospitals with operating margins that were more than 1.5 times the interquartile range above the highest quartiles or below the lowest quartile (445 hospitals were excluded under this criterion). Operating margins are calculated by subtracting operating expenses (OE) from net patient revenue (NPR) and dividing the result by net patient revenue: (NPR – OE) ÷ NPR. Total margins, in contrast, include additional types of hospital revenue, such as state or local subsidies and revenue from other facets of hospital operations (e.g., parking lot receipts).

Chapter 3: APPENDIX 3B
112 March 2019
Working Definition of Essential Community ServicesThe statute requires that MACPAC’s analysis include data identifying hospitals with high levels of uncompensated care that also provide access to essential community services for low-income, uninsured, and vulnerable populations, such as graduate medical education and the continuum of primary through quaternary care, including the provision of trauma care and public health services.
In this report, we use the same working definition to identify such hospitals that was used in MACPAC’s 2016 Report to Congress on Medicaid Disproportionate Share Hospital Payments. This working definition is based on a two-part test:
• Is the hospital a deemed DSH hospital?
• Does the hospital provide at least one essential service?
Deemed DSH hospital statusAccording to the Social Security Act (the Act), hospitals must meet one of two criteria to qualify as a deemed DSH hospital: (1) a Medicaid inpatient utilization rate greater than one standard deviation above the mean for hospitals in the state, or (2) a low-income utilization rate greater than 25 percent (§ 1923(b)(1) of the Act). Because deemed DSH hospitals are statutorily required to receive DSH payments, we excluded from our analysis hospitals that did not receive DSH payments in 2014.
Calculation of the Medicaid inpatient utilization rate threshold for each state requires data from all hospitals in that state, and we relied on Medicare cost reports to make those calculations and to determine which hospitals exceeded this threshold. A major limitation of this approach is that Medicaid inpatient utilization reported on Medicare cost reports does not include services
provided to Medicaid enrollees that were not paid for by Medicaid (e.g., Medicare-funded services for individuals who are dually eligible for Medicare and Medicaid). However, the Medicaid DSH definition of Medicaid inpatient utilization includes services provided to anyone who is eligible for Medicaid, even if Medicaid is not the primary payer. Thus, our identification of deemed DSH hospitals may omit some hospitals with high utilization by dually eligible beneficiaries and overstate the extent to which hospitals with low utilization by dually eligible beneficiaries (e.g., children’s hospitals) exceed the threshold.
The low-income utilization rate threshold for deemed DSH hospitals is the same for all states (25 percent), so we were able to use Medicaid DSH audit data to determine whether hospitals met this criterion. However, about one-quarter of DSH hospitals did not provide data on the rate of low-income utilization on their DSH audits, and these omissions limited our ability to identify all deemed DSH hospitals.
Provision of essential community servicesBecause the term essential community services is not otherwise defined in statute or regulation, we identified a number of services that could be considered essential community services using available data from 2016 Medicare cost reports and the 2016 American Hospital Association (AHA) annual survey (Table 3B-1). Services were selected for inclusion if they were directly mentioned in the statute requiring this report or if they were related services mentioned in the cost reports or the AHA annual survey.

Chapter 3: APPENDIX 3B
113Report to Congress on Medicaid and CHIP
TABLE 3B-1. Essential Community Services, by Data Source
Data source Service type
American Hospital Association annual survey Burn services Dental services HIV/AIDS care Neonatal intensive care units Obstetrics and gynecology services Primary care services Substance use disorder servicesTrauma services
Medicare cost reports Graduate medical education Inpatient psychiatric services (through psychiatric subunit or stand-alone psychiatric hospital)
For this report, for the sake of inclusiveness, any deemed DSH hospital providing at least one essential community service was included in our analysis. We also included certain hospital types if they were the only hospital in their geographic area to provide certain types of services. These hospital types included critical access hospitals because they are often the only hospital within a 25-mile radius.
Projections of DSH Allotments Unreduced DSH allotments for FY 2023 were calculated by increasing prior year allotments based on inflation. We used the projections of the Consumer Price Index for All Urban Consumers in
the Congressional Budget Office’s August economic baseline (CBO 2018). Unreduced allotments increase each year for all states except Tennessee, whose DSH allotment is specified in statute (§ 1923(f)(6)(A)(vi) of the Social Security Act).
We estimated DSH allotment reductions under current law using the DSH allotment reduction methodology that CMS proposed in July 2017 (CMS 2017). We used a variety of data sources to estimate the factors used in CMS’s methodology and the most recently available data (Table 3B-2). We then calculated reductions based on these factors using a model for estimating DSH allotment reductions that Dobson DaVanzo & Associates and KNG Health previously developed for MACPAC (MACPAC 2016).
TABLE 3B-2. Data Sources for Factors Used in the CMS DSH Allotment Reduction Model
DSH allotment reduction factor Data source (year)
Low DSH Specified in statute (N/A)Uninsured percentage American Community Survey (2017)High volume of Medicaid inpatients Medicare cost reports (2014) and DSH audits (2014)High level of uncompensated care DSH audits (2014)Budget neutrality CMS Financial Management Group (2014)
Notes: CMS is the Centers for Medicare & Medicaid Services. DSH is disproportionate share hospital. N/A is not applicable.


Appendix
MACPAC Authorizing Language
116 March 2019
Authorizing Language from the Social Security Act (42 USC 1396)
Medicaid and CHIP Payment and Access Commission(a) ESTABLISHMENT.—There is hereby established the Medicaid and CHIP Payment and Access
Commission (in this section referred to as ‘‘MACPAC’’).
(b) DUTIES.—
(1) REVIEW OF ACCESS POLICIES FOR ALL STATES AND ANNUAL REPORTS.—MACPAC shall—
(A) review policies of the Medicaid program established under this title (in this section referred to as ‘‘Medicaid’’) and the State Children’s Health Insurance Program established under title XXI (in this section referred to as ‘‘CHIP’’) affecting access to covered items and services, including topics described in paragraph (2);
(B) make recommendations to Congress, the Secretary, and States concerning such access policies;
(C) by not later than March 15 of each year (beginning with 2010), submit a report to Congress containing the results of such reviews and MACPAC’s recommendations concerning such policies; and
(D) by not later than June 15 of each year (beginning with 2010), submit a report to Congress containing an examination of issues affecting Medicaid and CHIP, including the implications of changes in health care delivery in the United States and in the market for health care services on such programs.
(2) SPECIFIC TOPICS TO BE REVIEWED.—Specifically, MACPAC shall review and assess the following:
(A) MEDICAID AND CHIP PAYMENT POLICIES.—Payment policies under Medicaid and CHIP, including—
(i) the factors affecting expenditures for the efficient provision of items and services in different sectors, including the process for updating payments to medical, dental, and health professionals, hospitals, residential and long-term care providers, providers of home and community based services, Federally-qualified health centers and rural health clinics, managed care entities, and providers of other covered items and services;
(ii) payment methodologies; and
(iii) the relationship of such factors and methodologies to access and quality of care for Medicaid and CHIP beneficiaries (including how such factors and methodologies enable such beneficiaries to obtain the services for which they are eligible, affect provider supply, and affect providers that serve a disproportionate share of low-income and other vulnerable populations).
(B) ELIGIBILITY POLICIES.—Medicaid and CHIP eligibility policies, including a determination of the degree to which Federal and State policies provide health care coverage to needy populations.

MACPAC Authorizing Language
117Report to Congress on Medicaid and CHIP
(C) ENROLLMENT AND RETENTION PROCESSES.—Medicaid and CHIP enrollment and retention processes, including a determination of the degree to which Federal and State policies encourage the enrollment of individuals who are eligible for such programs and screen out individuals who are ineligible, while minimizing the share of program expenses devoted to such processes.
(D) COVERAGE POLICIES.—Medicaid and CHIP benefit and coverage policies, including a determination of the degree to which Federal and State policies provide access to the services enrollees require to improve and maintain their health and functional status.
(E) QUALITY OF CARE.—Medicaid and CHIP policies as they relate to the quality of care provided under those programs, including a determination of the degree to which Federal and State policies achieve their stated goals and interact with similar goals established by other purchasers of health care services.
(F) INTERACTION OF MEDICAID AND CHIP PAYMENT POLICIES WITH HEALTH CARE DELIVERY GENERALLY.—The effect of Medicaid and CHIP payment policies on access to items and services for children and other Medicaid and CHIP populations other than under this title or title XXI and the implications of changes in health care delivery in the United States and in the general market for health care items and services on Medicaid and CHIP.
(G) INTERACTIONS WITH MEDICARE AND MEDICAID.—Consistent with paragraph (11), the interaction of policies under Medicaid and the Medicare program under title XVIII, including with respect to how such interactions affect access to services, payments, and dually eligible individuals.
(H) OTHER ACCESS POLICIES.—The effect of other Medicaid and CHIP policies on access to covered items and services, including policies relating to transportation and language barriers and preventive, acute, and long-term services and supports.
(3) RECOMMENDATIONS AND REPORTS OF STATE-SPECIFIC DATA.—MACPAC shall—
(A) review national and State-specific Medicaid and CHIP data; and
(B) submit reports and recommendations to Congress, the Secretary, and States based on such reviews.
(4) CREATION OF EARLY-WARNING SYSTEM.—MACPAC shall create an early-warning system to identify provider shortage areas, as well as other factors that adversely affect, or have the potential to adversely affect, access to care by, or the health care status of, Medicaid and CHIP beneficiaries. MACPAC shall include in the annual report required under paragraph (1)(D) a description of all such areas or problems identified with respect to the period addressed in the report.
(5) COMMENTS ON CERTAIN SECRETARIAL REPORTS AND REGULATIONS.—
(A) CERTAIN SECRETARIAL REPORTS.—If the Secretary submits to Congress (or a committee of Congress) a report that is required by law and that relates to access policies, including with respect to payment policies, under Medicaid or CHIP, the Secretary shall transmit a copy of the report to MACPAC. MACPAC shall review the report and, not later than 6 months after the date of submittal of the Secretary’s report to Congress, shall submit to the appropriate committees of

MACPAC Authorizing Language
118 March 2019
Congress and the Secretary written comments on such report. Such comments may include such recommendations as MACPAC deems appropriate.
(B) REGULATIONS.—MACPAC shall review Medicaid and CHIP regulations and may comment through submission of a report to the appropriate committees of Congress and the Secretary, on any such regulations that affect access, quality, or efficiency of health care.
(6) AGENDA AND ADDITIONAL REVIEWS.—
(A) IN GENERAL.—MACPAC shall consult periodically with the chairmen and ranking minority members of the appropriate committees of Congress regarding MACPAC’s agenda and progress towards achieving the agenda. MACPAC may conduct additional reviews, and submit additional reports to the appropriate committees of Congress, from time to time on such topics relating to the program under this title or title XXI as may be requested by such chairmen and members and as MACPAC deems appropriate.
(B) REVIEW AND REPORTS REGARDING MEDICAID DSH.—
(i) IN GENERAL.—MACPAC shall review and submit an annual report to Congress on disproportionate share hospital payments under section 1923. Each report shall include the information specified in clause (ii).
(ii) REQUIRED REPORT INFORMATION.—Each report required under this subparagraph shall include the following:
(I) Data relating to changes in the number of uninsured individuals.
(II) Data relating to the amount and sources of hospitals’ uncompensated care costs, including the amount of such costs that are the result of providing unreimbursed or under-reimbursed services, charity care, or bad debt.
(III) Data identifying hospitals with high levels of uncompensated care that also provide access to essential community services for low-income, uninsured, and vulnerable populations, such as graduate medical education, and the continuum of primary through quarternary care, including the provision of trauma care and public health services.
(IV) State-specific analyses regarding the relationship between the most recent State DSH allotment and the projected State DSH allotment for the succeeding year and the data reported under subclauses (I), (II), and (III) for the State.
(iii) DATA.—Notwithstanding any other provision of law, the Secretary regularly shall provide MACPAC with the most recent State reports and most recent independent certified audits submitted under section 1923(j), cost reports submitted under title XVIII, and such other data as MACPAC may request for purposes of conducting the reviews and preparing and submitting the annual reports required under this subparagraph.
(iv) SUBMISSION DEADLINES.—The first report required under this subparagraph shall be submitted to Congress not later than February 1, 2016. Subsequent reports shall be submitted as part of, or with, each annual report required under paragraph (1)(C) during the period of fiscal years 2017 through 2024.

MACPAC Authorizing Language
119Report to Congress on Medicaid and CHIP
(7) AVAILABILITY OF REPORTS.—MACPAC shall transmit to the Secretary a copy of each report submitted under this subsection and shall make such reports available to the public.
(8) APPROPRIATE COMMITTEE OF CONGRESS.—For purposes of this section, the term ‘‘appropriate committees of Congress’’ means the Committee on Energy and Commerce of the House of Representatives and the Committee on Finance of the Senate.
(9) VOTING AND REPORTING REQUIREMENTS.—With respect to each recommendation contained in a report submitted under paragraph (1), each member of MACPAC shall vote on the recommendation, and MACPAC shall include, by member, the results of that vote in the report containing the recommendation.
(10) EXAMINATION OF BUDGET CONSEQUENCES.—Before making any recommendations, MACPAC shall examine the budget consequences of such recommendations, directly or through consultation with appropriate expert entities, and shall submit with any recommendations, a report on the Federal and State-specific budget consequences of the recommendations.
(11) CONSULTATION AND COORDINATION WITH MEDPAC.—
(A) IN GENERAL.—MACPAC shall consult with the Medicare Payment Advisory Commission (in this paragraph referred to as ‘‘MedPAC’’) established under section 1805 in carrying out its duties under this section, as appropriate and particularly with respect to the issues specified in paragraph (2) as they relate to those Medicaid beneficiaries who are dually eligible for Medicaid and the Medicare program under title XVIII, adult Medicaid beneficiaries (who are not dually eligible for Medicare), and beneficiaries under Medicare. Responsibility for analysis of and recommendations to change Medicare policy regarding Medicare beneficiaries, including Medicare beneficiaries who are dually eligible for Medicare and Medicaid, shall rest with MedPAC.
(B) INFORMATION SHARING.—MACPAC and MedPAC shall have access to deliberations and records of the other such entity, respectively, upon the request of the other such entity.
(12) CONSULTATION WITH STATES.—MACPAC shall regularly consult with States in carrying out its duties under this section, including with respect to developing processes for carrying out such duties, and shall ensure that input from States is taken into account and represented in MACPAC’s recommendations and reports.
(13) COORDINATE AND CONSULT WITH THE FEDERAL COORDINATED HEALTH CARE OFFICE.—MACPAC shall coordinate and consult with the Federal Coordinated Health Care Office established under section 2081 of the Patient Protection and Affordable Care Act before making any recommendations regarding dually eligible individuals.
(14) PROGRAMMATIC OVERSIGHT VESTED IN THE SECRETARY.—MACPAC’s authority to make recommendations in accordance with this section shall not affect, or be considered to duplicate, the Secretary’s authority to carry out Federal responsibilities with respect to Medicaid and CHIP.
(c) MEMBERSHIP.—
(1) NUMBER AND APPOINTMENT.—MACPAC shall be composed of 17 members appointed by the Comptroller General of the United States.
(2) QUALIFICATIONS.—

MACPAC Authorizing Language
120 March 2019
(A) IN GENERAL.—The membership of MACPAC shall include individuals who have had direct experience as enrollees or parents or caregivers of enrollees in Medicaid or CHIP and individuals with national recognition for their expertise in Federal safety net health programs, health finance and economics, actuarial science, health plans and integrated delivery systems, reimbursement for health care, health information technology, and other providers of health services, public health, and other related fields, who provide a mix of different professions, broad geographic representation, and a balance between urban and rural representation.
(B) INCLUSION.—The membership of MACPAC shall include (but not be limited to) physicians, dentists, and other health professionals, employers, third-party payers, and individuals with expertise in the delivery of health services. Such membership shall also include representatives of children, pregnant women, the elderly, individuals with disabilities, caregivers, and dually eligible individuals, current or former representatives of State agencies responsible for administering Medicaid, and current or former representatives of State agencies responsible for administering CHIP.
(C) MAJORITY NONPROVIDERS.—Individuals who are directly involved in the provision, or management of the delivery, of items and services covered under Medicaid or CHIP shall not constitute a majority of the membership of MACPAC.
(D) ETHICAL DISCLOSURE.—The Comptroller General of the United States shall establish a system for public disclosure by members of MACPAC of financial and other potential conflicts of interest relating to such members. Members of MACPAC shall be treated as employees of Congress for purposes of applying title I of the Ethics in Government Act of 1978 (Public Law 95–521).
(3) TERMS.—
(A) IN GENERAL.—The terms of members of MACPAC shall be for 3 years except that the Comptroller General of the United States shall designate staggered terms for the members first appointed.
(B) VACANCIES.—Any member appointed to fill a vacancy occurring before the expiration of the term for which the member’s predecessor was appointed shall be appointed only for the remainder of that term. A member may serve after the expiration of that member’s term until a successor has taken office. A vacancy in MACPAC shall be filled in the manner in which the original appointment was made.
(4) COMPENSATION.—While serving on the business of MACPAC (including travel time), a member of MACPAC shall be entitled to compensation at the per diem equivalent of the rate provided for level IV of the Executive Schedule under section 5315 of title 5, United States Code; and while so serving away from home and the member’s regular place of business, a member may be allowed travel expenses, as authorized by the Chairman of MACPAC. Physicians serving as personnel of MACPAC may be provided a physician comparability allowance by MACPAC in the same manner as Government physicians may be provided such an allowance by an agency under section 5948 of title 5, United States Code, and for such purpose subsection (i) of such section shall apply to MACPAC in the same manner as it applies to the Tennessee Valley Authority. For purposes of pay (other than pay of members of MACPAC) and employment benefits, rights, and privileges, all personnel of MACPAC shall be treated as if they were employees of the United States Senate.
(5) CHAIRMAN; VICE CHAIRMAN.—The Comptroller General of the United States shall designate a

MACPAC Authorizing Language
121Report to Congress on Medicaid and CHIP
member of MACPAC, at the time of appointment of the member as Chairman and a member as Vice Chairman for that term of appointment, except that in the case of vacancy of the Chairmanship or Vice Chairmanship, the Comptroller General of the United States may designate another member for the remainder of that member’s term.
(6) MEETINGS.—MACPAC shall meet at the call of the Chairman.
(d) DIRECTOR AND STAFF; EXPERTS AND CONSULTANTS.—Subject to such review as the Comptroller General of the United States deems necessary to assure the efficient administration of MACPAC, MACPAC may—
(1) employ and fix the compensation of an Executive Director (subject to the approval of the Comptroller General of the United States) and such other personnel as may be necessary to carry out its duties (without regard to the provisions of title 5, United States Code, governing appointments in the competitive service);
(2) seek such assistance and support as may be required in the performance of its duties from appropriate Federal and State departments and agencies;
(3) enter into contracts or make other arrangements, as may be necessary for the conduct of the work of MACPAC (without regard to section 3709 of the Revised Statutes (41 USC 5));
(4) make advance, progress, and other payments which relate to the work of MACPAC;
(5) provide transportation and subsistence for persons serving without compensation; and
(6) prescribe such rules and regulations as it deems necessary with respect to the internal organization and operation of MACPAC.
(e) POWERS.—
(1) OBTAINING OFFICIAL DATA.—MACPAC may secure directly from any department or agency of the United States and, as a condition for receiving payments under sections 1903(a) and 2105(a), from any State agency responsible for administering Medicaid or CHIP, information necessary to enable it to carry out this section. Upon request of the Chairman, the head of that department or agency shall furnish that information to MACPAC on an agreed upon schedule.
(2) DATA COLLECTION.—In order to carry out its functions, MACPAC shall—
(A) utilize existing information, both published and unpublished, where possible, collected and assessed either by its own staff or under other arrangements made in accordance with this section;
(B) carry out, or award grants or contracts for, original research and experimentation, where existing information is inadequate; and
(C) adopt procedures allowing any interested party to submit information for MACPAC’s use in making reports and recommendations.

MACPAC Authorizing Language
122 March 2019
(3) ACCESS OF GAO TO INFORMATION.—The Comptroller General of the United States shall have unrestricted access to all deliberations, records, and nonproprietary data of MACPAC, immediately upon request.
(4) PERIODIC AUDIT.—MACPAC shall be subject to periodic audit by the Comptroller General of the United States.
(f) FUNDING.—
(1) REQUEST FOR APPROPRIATIONS.—MACPAC shall submit requests for appropriations (other than for fiscal year 2010) in the same manner as the Comptroller General of the United States submits requests for appropriations, but amounts appropriated for MACPAC shall be separate from amounts appropriated for the Comptroller General of the United States.
(2) AUTHORIZATION.—There are authorized to be appropriated such sums as may be necessary to carry out the provisions of this section.
(3) FUNDING FOR FISCAL YEAR 2010.—
(A) IN GENERAL.—Out of any funds in the Treasury not otherwise appropriated, there is appropriated to MACPAC to carry out the provisions of this section for fiscal year 2010, $9,000,000.
(B) TRANSFER OF FUNDS.—Notwithstanding section 2104(a)(13), from the amounts appropriated in such section for fiscal year 2010, $2,000,000 is hereby transferred and made available in such fiscal year to MACPAC to carry out the provisions of this section.
(4) AVAILABILITY.—Amounts made available under paragraphs (2) and (3) to MACPAC to carry out the provisions of this section shall remain available until expended.

Biographies of Commissioners
123Report to Congress on Medicaid and CHIP
Biographies of CommissionersPenny Thompson, MPA (Chair), is principal of Penny Thompson Consulting, LLC, and provides strategic advice and solutioning services in the areas of health care delivery and payment, information technology development, and program integrity. Previously, she served as deputy director of the Center for Medicaid and CHIP Services at the Centers for Medicare & Medicaid Services (CMS). Ms. Thompson previously was director of health care strategy and planning for Hewlett Packard’s health care business unit. In addition, she served as CMS’s director of program integrity and as chief of the health care branch within the Office of Inspector General at the U.S. Department of Health and Human Services. Ms. Thompson received her master of public administration from The George Washington University.
Stacey Lampkin, FSA, MAAA, MPA (Vice Chair), is an actuary and principal with Mercer Government Human Services Consulting, where she has led actuarial work for several state Medicaid programs. She previously served as an actuary and assistant deputy secretary for Medicaid finance and analytics at Florida’s Agency for Health Care Administration and as an actuary at Milliman. She has also served as a member of the Federal Health Committee of the American Academy of Actuaries (AAA), as vice chairperson of AAA’s uninsured work group, and as a member of the Society of Actuaries project oversight group for research on evaluating medical management interventions. Ms. Lampkin is a fellow in the Society of Actuaries and a member of the AAA. She received her master of public administration from Florida State University.
Melanie Bella, MBA, is chief of new business and policy at Cityblock Health, which facilitates health care delivery for low-income urban populations, particularly Medicaid beneficiaries and those dually eligible for Medicaid and Medicare. Previously, she served as the founding director of the Medicare-Medicaid Coordination Office at CMS, where she designed and launched payment and delivery system demonstrations to improve quality and
reduce costs. Ms. Bella also was the director of the Indiana Medicaid program, where she oversaw the State Children’s Health Insurance Program (CHIP) and the state’s long-term care insurance program. Ms. Bella received her master of business administration from Harvard University.
Brian Burwell is senior executive, government health and human services, at Watson Health in Cambridge, Massachusetts. Mr. Burwell conducts research and provides consulting services, policy analysis, technical assistance in financing and delivery of long-term services and supports, and data analysis related to integrated care models for dually eligible beneficiaries and managed long-term services and supports. He has been with Watson Health and its predecessor companies for 30 years. Mr. Burwell received his bachelor of arts degree from Dartmouth College.
Martha Carter, DHSc, MBA, APRN, CNM, is the former chief executive officer (CEO) of FamilyCare Health Centers, a community health center that she founded, which serves four counties in south-central West Virginia. Dr. Carter practiced as a certified nurse-midwife in Kentucky, Ohio, and West Virginia for 20 years. She is a member of the West Virginia Alliance for Creative Health Solutions, a practice-led research and advocacy network, and she serves as the chair of the Quality Leadership Committee of the West Virginia Primary Care Association. Dr. Carter was a Robert Wood Johnson Foundation Executive Nurse Fellow in 2005–2008 and received the Robert Wood Johnson Foundation Community Health Leader award in 1999. She holds a doctorate of health sciences from A.T. Still University in Mesa, Arizona, and a master of business administration from West Virginia University in Morgantown, West Virginia.
Frederick Cerise, MD, MPH, is president and CEO of Parkland Health and Hospital System, a large public safety-net health system in Dallas, Texas. Previously, he oversaw Medicaid and other programs for the state of Louisiana as secretary of the Department of Health and Hospitals. Dr. Cerise also held the position of medical director and other leadership roles at various health care

Biographies of Commissioners
124 March 2019
facilities operated by Louisiana State University. He began his career as an internal medicine physician and spent 13 years treating patients and teaching medical students in Louisiana’s public hospital system. Dr. Cerise received his degree in medicine from Louisiana State University and his master of public health from Harvard University.
Kisha Davis, MD, MPH, is a family physician at CHI Health Care in Rockville, Maryland, as well as Maryland medical director for VaxCare Corporation. Previously, Dr. Davis was program manager at CFAR in Philadelphia, Pennsylvania, where she supported projects for family physicians focused on payment reform and practice transformation to promote health system change. Dr. Davis has also served as the medical director and director of community health at CHI and was also a family physician at a federally qualified health center (FQHC) in Maryland. As a White House Fellow at the U.S. Department of Agriculture, she established relationships among leaders of FQHCs and the Women, Infants, and Children nutrition program. Dr. Davis received her degree in medicine from the University of Connecticut and her master of public health from Johns Hopkins University.
Toby Douglas, MPP, MPH, is senior vice president, national Medicaid, at Kaiser Permanente. Previously, Mr. Douglas was senior vice president for Medicaid solutions at Centene Corporation, and prior to that, a long-standing state Medicaid official, serving for 10 years as an executive in California Medicaid. He served as director of the California Department of Health Care Services and was director of California Medicaid for six years, during which time he also served as a board member of the National Association of Medicaid Directors and as a CHIP director. Earlier in his career, Mr. Douglas worked for the San Mateo County Health Department in California, as a research associate at the Urban Institute, and as a VISTA volunteer. He received his master of public policy and master of public health from the University of California, Berkeley.
Leanna George is the parent of a teenager with a disability who is covered under Medicaid and a child covered under CHIP. A resident of Benson,
North Carolina, Ms. George is the chair of the North Carolina Council on Educational Services for Exceptional Children, a special education advisory council for the State Board of Education. She also serves as the secretary of the Johnston County Consumer and Family Advisory Committee, which advises the Board of the County Mental Health Center, and on the Client Rights Committee of the Autism Society of North Carolina, a Medicaid provider agency.
Darin Gordon is president and CEO of Gordon & Associates in Nashville, Tennessee, where he provides health care-related consulting services to a wide range of public- and private-sector clients. Previously, he was director of Medicaid and CHIP in Tennessee for 10 years, where he oversaw various program improvements, including the implementation of a statewide value-based purchasing program. During this time, he served as president and vice president of the National Association of Medicaid Directors for a total of four years. Before becoming director of Medicaid and CHIP, he was the chief financial officer and director of managed care programs for Tennessee’s Medicaid program. Mr. Gordon received his bachelor of science degree from Middle Tennessee State University.
Christopher Gorton, MD, MHSA, was formerly president of public plans at Tufts Health Plan, a non-profit health plan in Massachusetts, Rhode Island, and New Hampshire, as well as CEO of a regional health plan that was acquired by the Inova Health System of Falls Church, Virginia. Other positions held include vice president for medical management and worldwide health care strategy for Hewlett Packard Enterprise Services and president and chief medical officer for APS Healthcare, a behavioral health plan and care management organization based in Silver Spring, Maryland. After beginning his career as a practicing pediatrician in FQHCs in Pennsylvania and Missouri, Dr. Gorton served as chief medical officer in the Pennsylvania Department of Public Welfare. Dr. Gorton received his degree in medicine from Columbia University’s College of Physicians and Surgeons and his master

Biographies of Commissioners
125Report to Congress on Medicaid and CHIP
of health systems administration from the College of Saint Francis in Joliet, Illinois.
Charles Milligan, JD, MPH, is CEO of UnitedHealthcare Community Plan of New Mexico, a Medicaid managed care organization with enrolled members in all Medicaid eligibility categories (including dually eligible beneficiaries and adults in Medicaid expansion programs) that provides somatic, behavioral, and managed long-term services and supports. Mr. Milligan is a former state Medicaid and CHIP director in New Mexico and Maryland. He also served as executive director of the Hilltop Institute, a health services research center at the University of Maryland at Baltimore County, and as vice president at The Lewin Group. Mr. Milligan directed the 2005–2006 Commission on Medicaid and has conducted Medicaid-related research projects in numerous states. He received his master of public health from the University of California, Berkeley, and his law degree from Harvard Law School.
Sheldon Retchin, MD, MSPH, is professor of medicine and public health at The Ohio State University in Columbus, Ohio. Dr. Retchin’s research and publications have addressed costs, quality, and outcomes of health care as well as workforce issues. From 2015 until 2017, he was executive vice president for health sciences and CEO of the Wexner Medical Center. From 2003 until 2015, he served as senior vice president for health sciences at Virginia Commonwealth University (VCU) and as CEO of the VCU Health System, in Richmond, Virginia. Dr. Retchin also led a Medicaid health maintenance organization, Virginia Premier, with approximately 200,000 covered lives. Dr. Retchin received his medical and public health degrees from The University of North Carolina at Chapel Hill, where he was also a Robert Wood Johnson Clinical Scholar.
William Scanlon, PhD, is a consultant for the West Health Institute. He began conducting health services research on the Medicaid and Medicare programs in 1975, with a focus on such issues as the provision and financing of long-term care services and provider payment policies. He
previously held positions at Georgetown University and the Urban Institute, was managing director of health care issues at the U.S. Government Accountability Office, and served on the Medicare Payment Advisory Commission (MedPAC). Dr. Scanlon received his doctorate in economics from the University of Wisconsin, Madison.
Peter Szilagyi, MD, MPH, is professor of pediatrics, executive vice chair, and vice chair for research in the Department of Pediatrics at the Mattel Children’s Hospital at the University of California, Los Angeles (UCLA). Prior to joining UCLA, he served as chief of the division of general pediatrics and professor of pediatrics at the University of Rochester and as associate director of the Center for Community Health within the University of Rochester’s Clinical Translational Research Institute. His research has addressed CHIP and child health insurance, access to care, quality of care, and health outcomes, including the delivery of primary care with a focus on immunization delivery, health care financing, and children with chronic disease. From 1986 to 2014, he served as chairman of the board of the Monroe Plan for Medical Care, a large Medicaid and CHIP managed care plan in upstate New York. He is editor-in-chief of Academic Pediatrics and has served as the president of the Academic Pediatric Association. Dr. Szilagyi received his medical and public health degrees from the University of Rochester.
Alan Weil, JD, MPP, is editor-in-chief of Health Affairs, a multidisciplinary peer-reviewed health policy journal, in Bethesda, Maryland. He is an elected member of the National Academy of Medicine and served six years on its Board on Health Care Services. He is a trustee of the Consumer Health Foundation and is the director of the Aspen Health Strategy Group. He previously served as executive director of the National Academy for State Health Policy, director of the Urban Institute’s Assessing the New Federalism Project, executive director of the Colorado Department of Health Care Policy and Financing, and assistant general counsel in the Massachusetts Department of Medical Security. He received a master’s degree from Harvard University’s John F.

Biographies of Commissioners
126 March 2019
Kennedy School of Government and a law degree from Harvard Law School.
Katherine Weno, DDS, JD, is an independent public health consultant. Previously, she held positions at the Centers for Disease Control and Prevention, including senior advisor for the National Center for Chronic Disease Prevention and Health Promotion and director of the Division of Oral Health. Dr. Weno also served as the director of the Bureau of Oral Health in the Kansas Department of Health and Environment. Previously, she was the CHIP advocacy project director at Legal Aid of Western Missouri and was an associate attorney at Brown, Winick, Graves, Gross, Baskerville, and Shoenebaum in Des Moines, Iowa. Dr. Weno started her career as a dentist in Iowa and Wisconsin. She earned degrees in dentistry and law from the University of Iowa.

Biographies of Staff
127Report to Congress on Medicaid and CHIP
Biographies of StaffAnnie Andrianasolo, MBA, is the executive administrator. She previously held the position of special assistant for global health at the Public Health Institute and was a program assistant for the World Bank. Ms. Andrianasolo has a bachelor of science in economics and a master of business administration from Johns Hopkins Carey Business School.
Kirstin Blom, MIPA, is a principal analyst. Before joining MACPAC, Ms. Blom was an analyst in health care financing at the Congressional Research Service. Before that, Ms. Blom worked as a principal analyst at the Congressional Budget Office, where she estimated the cost of proposed legislation on the Medicaid program. Ms. Blom has also been an analyst for the Medicaid program in Wisconsin and for the U.S. Government Accountability Office (GAO). She holds a master of international public affairs from the University of Wisconsin, Madison.
James Boissonnault, MA, is the chief information officer. Prior to joining MACPAC, he was the information technology (IT) director and security officer for OnPoint Consulting. At OnPoint, he worked on several federal government projects, including projects for the Missile Defense Agency, the U.S. Department of the Treasury, and the U.S. Department of Agriculture. He has nearly two decades of IT and communications experience. Mr. Boissonnault holds a master of arts in Slavic languages and literatures from The University of North Carolina and a bachelor of arts in Russian from the University of Massachusetts.
Madeline Britvec is an analyst. Prior to joining MACPAC, she held internships at the U.S. Chamber of Commerce, International Bridges to Justice, and CBS Detroit. Ms. Britvec holds a bachelor of arts in economics and applied statistics from Smith College.
Kacey Buderi, MPA, is the senior analyst. Prior to joining MACPAC, she worked in the Center for Congressional and Presidential Studies at American University and completed internships in the office of U.S. Senator Ed Markey and at the U.S. Department
of Health and Human Services (HHS). Ms. Buderi holds a master of public administration and a bachelor of arts in political science, both from American University.
Kathryn Ceja is the director of communications. Previously, she served as lead spokesperson for Medicare issues in the Centers for Medicare & Medicaid Services (CMS) press office. Prior to her tenure in the press office, Ms. Ceja was a speechwriter for the Secretary of HHS as well as the speechwriter for a series of CMS administrators. Ms. Ceja holds a bachelor of arts in international studies from American University.
Ilham Dehry is a research assistant. She is pursuing a master of public policy in health and social policy analysis at The George Washington University. Prior to joining MACPAC, she was a graduate assistant at the Trachtenberg School of Public Policy and Public Administration, an administrative assistant and representative payee at the Housing First branch of the Colorado Coalition for the Homeless, and a research assistant at the University of Colorado Denver. She holds a bachelor of arts in public health from the University of Colorado, Denver.
Kohl Fallin, MPS, is the communications specialist. Prior to joining MACPAC, she worked as a contractor for the National Cancer Institute’s Center for Biomedical Informatics and Information Technology, focusing on strategic communications and social media management. She also worked for the Baltimore City Department of Transportation and served as a staff assistant for a congressional office. Ms. Fallin holds a master of public service from the University of Arkansas Clinton School of Public Service and a bachelor’s degree in public relations from Hampton University.
Moira Forbes, MBA, is a policy director focused on payment policy and the design, implementation, and effectiveness of program integrity activities in Medicaid and the State Children’s Health Insurance Program (CHIP). Previously, she served as director of the division of health and social service programs in the Office of Executive Program Information

Biographies of Staff
128 March 2019
at HHS and as a vice president in the Medicaid practice at The Lewin Group. At Lewin, Ms. Forbes worked with every state on issues relating to program integrity and eligibility quality control in Medicaid and CHIP. She has extensive experience with federal and state policy analysis, Medicaid program operations, and delivery system design. Ms. Forbes has a master of business administration from The George Washington University and a bachelor’s degree in Russian and political science from Bryn Mawr College.
Martha Heberlein, MA, is a principal analyst. Prior to joining MACPAC, she was the research manager at the Georgetown University Center for Children and Families, where she oversaw a national survey on Medicaid and CHIP eligibility, enrollment, and renewal procedures. Ms. Heberlein holds a master of arts in public policy with a concentration in philosophy and social policy from The George Washington University and a bachelor of science in psychology from James Madison University.
Kayla Holgash, MPH, is an analyst focusing on payment policy. Prior to joining MACPAC, Ms. Holgash worked as a senior research assistant in the Department of Health Policy and Management at The George Washington University and as a health policy legislative intern for U.S. Senator Charles Grassley. Before that, she served as the executive manager of the Health and Wellness Network for the Homewood Children’s Village, a non-profit organization in Pittsburgh, Pennsylvania. Ms. Holgash holds a master of public health from The George Washington University and a bachelor of science in public and community health from the University of Maryland.
Joanne Jee, MPH, is the congressional liaison and a principal analyst focusing on CHIP and children’s coverage. Prior to joining MACPAC, she was a program director at the National Academy for State Health Policy, where she focused on children’s coverage issues. Ms. Jee also has been a senior analyst at GAO, a program manager at The Lewin Group, and a legislative analyst in the HHS Office of Legislation. Ms. Jee has a master of public health
from the University of California, Los Angeles, and a bachelor of science in human development from the University of California, Davis.
Allissa Jones is the administrative assistant. Prior to joining MACPAC, she worked as an intern for Kaiser Permanente, where she helped coordinate health and wellness events in the Washington, DC, area. Ms. Jones holds a bachelor of science with a concentration in health management from Howard University and is working toward her master of tourism administration degree from The George Washington University.
Kate Kirchgraber, MA, is a policy director. Prior to joining MACPAC, she led the private health insurance and Medicaid and CHIP teams at the CMS Office of Legislation. She has held health policy and budget analysis positions on the federal and state levels, including with the U.S. Senate Committee on Finance, Office of Management and Budget, and the New York State Assembly Ways and Means Committee. She also has worked as a private consultant on Medicaid, health coverage, and financing issues. Ms. Kirchgraber has a master of arts in teaching from the State University of New York at Albany and a bachelor of arts in economics and history from Fordham University.
Nisha Kurani, MPP, is an analyst. Prior to joining MACPAC, Ms. Kurani was a policy associate at the Henry J. Kaiser Family Foundation. She also has held research and policy analysis positions at the University of California’s Berkeley School of Public Health, the Public Policy Institute of California, and Housing and Economic Rights Advocates. Ms. Kurani holds a master of public policy from the University of California, Berkeley, and a bachelor of science in physiology and neuroscience from the University of California, San Diego.
Erin McMullen, MPP, is a principal analyst. Prior to joining MACPAC, she served as the chief of staff in the Office of Health Care Financing at the Maryland Department of Health. Ms. McMullen also has been a senior policy advisor in the Office of Behavioral Health and Disabilities at the Maryland Department of Health, and a legislative policy analyst for the

Biographies of Staff
129Report to Congress on Medicaid and CHIP
Maryland General Assembly’s Department of Legislative Services. Ms. McMullen holds a master of public policy from American University and a bachelor’s degree in economics and social sciences from Towson University.
Jessica Morris, MPA, is the contracting officer and a principal analyst focusing on Medicaid data and program integrity. Previously, she was a senior analyst at GAO with a focus on Medicaid data systems. She also was a management analyst at the U.S. Department of Veterans Affairs (VA), a presidential management fellow at the Pittsburgh VA Medical Center, and a legislative correspondent in the U.S. Senate. Ms. Morris has a master of public administration from The George Washington University and a bachelor of arts in political science and communications from the State University of New York at Cortland.
Robert Nelb, MPH, is a principal analyst focusing on issues related to Medicaid payment and delivery system reform. Prior to joining MACPAC, he served as a health insurance specialist at CMS, leading projects related to CHIP and Medicaid Section 1115 demonstrations. Mr. Nelb has a master of public health and a bachelor’s degree in ethics, politics, and economics from Yale University.
Kevin Ochieng is MACPAC’s IT specialist. Before joining MACPAC, Mr. Ochieng was a systems analyst and desk-side support specialist at American Institutes for Research, and prior to that, an IT consultant at Robert Half Technology, where he focused on IT system administration, user support, network support, and PC deployment. Previously, he served as an academic program specialist at the University of Maryland University College. Mr. Ochieng has a bachelor of science in computer science and mathematics from Washington Adventist University.
Chris Park, MS, is a principal analyst. He focuses on issues related to managed care payment and Medicaid drug policy and has lead responsibility for
MACStats. Prior to joining MACPAC, he was a senior consultant at The Lewin Group, where he provided quantitative analysis and technical assistance on Medicaid policy issues, including managed care capitation rate setting, pharmacy reimbursement, and cost-containment initiatives. Mr. Park holds a master of science in health policy and management from the Harvard School of Public Health and a bachelor of science in chemistry from the University of Virginia.
Ken Pezzella, CGFM, is the chief financial officer. He has more than 15 years of federal financial management and accounting experience in both the public and private sectors. Mr. Pezzella also has broad operations and business experience, and is a proud veteran of the U.S. Coast Guard. He holds a bachelor of science in accounting from Strayer University and is a certified government financial manager.
Brian Robinson is the financial analyst. Prior to joining MACPAC, he worked as a business intern at the Joint Global Climate Change Research Institute, a partnership between the University of Maryland and Pacific Northwest National Laboratory. Mr. Robinson holds a bachelor of science in accounting from the University of Maryland.
Anne L. Schwartz, PhD, is the executive director. She previously served as deputy editor at Health Affairs; vice president at Grantmakers In Health, a national organization providing strategic advice and educational programs for foundations and corporate giving programs working on health issues; and special assistant to the executive director and senior analyst at the Physician Payment Review Commission, a precursor to the Medicare Payment Advisory Commission. Earlier, she held positions on committee and personal staff for the U.S. House of Representatives. Dr. Schwartz earned a doctorate in health policy from the School of Hygiene and Public Health at Johns Hopkins University.

Biographies of Staff
130 March 2019
Kristal Vardaman, MSPH, is a principal analyst focused on long-term services and supports and on high-cost, high-need populations. Previously, she was a senior analyst at GAO and a consultant at Avalere Health. Ms. Vardaman holds a master of science in public health from The University of North Carolina at Chapel Hill and a bachelor of science from the University of Michigan. She currently is pursuing a doctorate in public policy from The George Washington University.
Ricardo Villeta, MBA, is the deputy director of operations, finance, and management with overall responsibility for operations related to financial management and budget, procurement, human resources, and IT. Previously, he was the senior vice president and chief management officer for the Academy for Educational Development, a private non-profit educational organization that provided training, education, and technical assistance throughout the United States and in more than 50 countries. Mr. Villeta holds a master of business administration from The George Washington University and a bachelor of science from Georgetown University.
John Wedeles, DrPH, is a principal analyst. Prior to joining MACPAC, Dr. Wedeles served as associate director of the division of analytics and policy research for the District of Columbia Department of Health Care Finance, where he directed research activities to support policy and budget development for the District of Columbia’s Medicaid agency. Previously, Dr. Wedeles served as a researcher for Westat and as program manager for the Manhattan Tobacco Cessation Program at New York University. Dr. Wedeles holds a doctor of public health in health behavior from the Milken Institute School of Public Health at The George Washington University and a master of public health in health policy from the Mailman School of Public Health at Columbia University.
Eileen Wilkie is the administrative officer and is responsible for coordinating human resources, office maintenance, travel, and Commission meetings. Previously, she held similar roles at National Public Radio and the National Endowment for Democracy. Ms. Wilkie has a bachelor’s degree in political science from the University of Notre Dame.


Advising Congress on Medicaid and CHIP Policy
1800 M Street NWSuite 650 South Washington, DC 20036
www.macpac.gov 202-350-2000202-273-2452