Report Schmoker
13
UNITED STATES DEPARTMENT OF THE INTERIOR GEOLOGICAL SURVEY DEFINING ORGANIC-RICH FACIES IN THE DEVONIAN SHALE IN THE WESTERN PART OF THE APPALACHIAN BASIN by James W. Schmoker Open-File Report 80-707 1980 This report is preliminary and has not been edited or reviewed for conformity with U.S. Geological Survey standards.
-
Upload
juan-pablo-martinez -
Category
Documents
-
view
3 -
download
1
description
Schmoker report about no conventional oil volumes in place.
Transcript of Report Schmoker
UNITED STATES DEPARTMENT OF THE INTERIOR
GEOLOGICAL SURVEY
DEFINING ORGANIC-RICH FACIES IN THE DEVONIAN
SHALE IN THE WESTERN PART OF THE APPALACHIAN BASIN
by
James W. Schmoker
Open-File Report 80-707
1980
This report is preliminary and has not been edited or reviewed for conformity with U.S. Geological Survey standards.

INTRODUCTION
The Devonian shale section is often divided into organic-rich ("black")
and organic-poor ("gray") subdivisions. In some instances, coarser grained
"gray" shale may act as a reservoir and produce gas, but in the western part
of the Appalachian basin the organic-rich shale facies are believed to contain
the bulk of the producible gas resource. Therefore, Devonian-shale studies
usually emphasize the organic-rich facies.
If drill cuttings are available for the Devonian shale sequence, the
boundary between organic-rich and organic-poor facies is commonly based on the
color of the shale. Other boundary definitions are based on gamma-ray wire-
line logs, with the assumption that natural gamma radiation and organic
content correlate. A gamma-ray intensity of 20 API units above the gray-shale
baseline has been used to define the boundary between organic-rich and
organic-poor facies (20-API method); a gamma-ray intensity of 230 API units
has been used as the threshold value for shale of high gas content and could
thus be regarded as another definition of the organic-rich, organic-poor
boundary (230-API method). An organic-matter content of 2 percent by volume
(0.8 percent by weight) is favored by the author as the best definition of the
organic-rich, organic-poor boundary (2-percent method).
ORGANIC-FACIES BOUNDARY BASED ON SHALE COLOR
Figure 1 relates shale color to volume-percent organic content for dry
samples from 46 wells located throughout the. Appalachian basin. An organic-
rich, organic-poor boundary of 2 percent organic-matter content by volume is
equivalent to a relatively light color value between N5.5 and N6. The facies
boundary picked by subsurface geologists would typically be represented by
cuttings with a color value corresponding to 5 percent or more organic matter

by volume. It follows that a map of organic-rich-facies thickness defined by
color, such as that of de Witt and others (1975), would show less organic-rich
shale than a map based on the boundary of 2 percent organic matter by volume.
Figures 2 and 3 confirm this observation. The thickness of organic-rich
Devonian-shale facies defined by the 2-percent method is shown in Figure 2.
Data are from the well locations plotted in Figure 4, with organic content
determined from wire-line density logs using the method described by Schmoker
(1979). The thickness of organic-rich Devonian-shale facies defined by de
Witt and others (1975) on the basis of the color of well cuttings is shown in
Figure 3. De Witt's map is based on more data points than Figure 2 and thus
shows greater detail.
Because the organic content of the shale along the western edge of the
mapped area is high, there is little difference in this region in the
thickness of organic-rich facies defined by the two methods. To the east,
however, the thickness of organic-rich facies based on the 2-percent method
(Figure 2) reaches maximums of 900-1,000 ft (274-305 m), compared to maximums
of 500-600 ft (152-183 m) based on shale color (Figure 3). Although the
general trends of the two maps are similar, differences in facies thickness
and locations of anomalies reflect the inclusion in Figure 2 of shale with
relatively light color values.
Some Devonian-shale resource-appraisal methods use as an input the volume
of organic-rich ("black") sediments. It is apparent from Figures 2 and 3 that
differences in the definition of the organic-rich, organic-poor boundary might
lead to substantial differences in the appraisal of the natural-gas resource.

ORGANIC-FACIES BOUNDARIES BASED ON GAMMA-RAY INTENSITY
Gamma-ray methods for defining organic-rich facies are less subjective
than that of color. Given a particular methodology, results should be
consistent if the gamma-ray logs are corrected to uniform wellbore
conditions. However, gamma-ray methods are adversely affected by two regional
characteristics of the Devonian shale:
1) The shale baseline - the gamma-ray intensity if no organic matter is
present - varies regionally throughout the basin.
2) The change in gamma-ray intensity per unit change in organic content
varies regionally throughout the basin.
Therefore, the organic content corresponding to 20 API units above the shale
baseline or to a gamma-ray intensity of 230 API units changes with location.
The organic content of Devonian shale with a gamma-ray intensity 20 API
units above the baseline is plotted in Figure 5. This figure shows the
minimum organic content of organic-rich facies defined by the 20-API method as
a function of location in the western half of the Appalachian basin. Figure 5
(and Figure 6) are based on wire-line data from the well locations shown in
Figure 4, with organic content determined using the relation between density
and organic content given by Schmoker (1979).
The average organic content of shale at the organic-rich, organic-poor
boundary defined by the 20-API method is about 1.8 percent by volume, but it
varies along a regional trend roughly paralleling the basin axis from a low of
about 1.0 percent in central Kentucky to a high of 2.6 percent in western
Pennsylvania. Within the area shown, the 20-API method places more shale in
the organic-rich facies than the sample-color method.
The organic content of Devonian shale with a gamma-ray intensity of 230
API units is plotted in Figure 6. This figure shows the minimum organic

content of organic-rich facies defined by the 230-API method as a function of
location in the western half of the Appalachian basin.
The average' organic content of shale at the organic-rich, organic-poor
boundary defined by the 230-API method is about 6 percent by volume, but it
varies locally from 4 to 10 percent. Within the area shown, the 230-API
method is roughly comparable to that based on shale color and places
significantly less shale in the organic-rich facies than either the 20-API or
2-percent methods.
Gamma-ray methods for defining organic-rich facies depend upon a
covariance between gamma-ray intensity and organic content. This covariance
weakens or disappears east of the limit of applicability shown in Figures 2
through 6 (Schmoker, 1979). East of this limit, gamma-ray methods for
defining organic-rich facies are unreliable.
ORGANIC-FACIES BOUNDARY BASED ON ORGANIC CONTENT
The organic-rich, organic-poor boundary favored by the author is defined
in terms of the organic content of the shale (2 percent by volume). The
boundary value of 2 percent organic content is somewhat arbitrary, but is
chosen for two reasons:
1) The minimum organic content required for significant generation of
hydrocarbons in shale is about 0.5 weight-percent carbon (Tissot and
Welte, 1978, p. 430), or about 1.7 volume-percent organic matter.
The 2-percent boundary thus corresponds to a commonly accepted
division between hydrocarbon-source and nonsource rocks.
2) Laboratory analyses of canned Devonian-shale core samples usually
show a change in the relation between movable-gas content and organic
content at about 2 to 3 percent organic content by volume. Movable-

gas content decreases disproportionately in rocks with less than 2
percent organic matter. The 2-percent boundary thus corresponds to a
change in the resource potential of the shale.
The boundary of 2 percent organic content by volume is both quantitative
and regionally invariant, and is an improvement over definitions discussed in
preceding sections, provided sufficient data on organic content can be
obtained. Laboratory measurements of organic content at closely spaced
vertical intervals and adequate areal density are not available at present.
The use of wire-line logs to calculate the organic content of Devonian shales
(Schmoker, 1979) appears to be the best way to obtain adequate organic-content
data in the western part of the Appalachian basin.
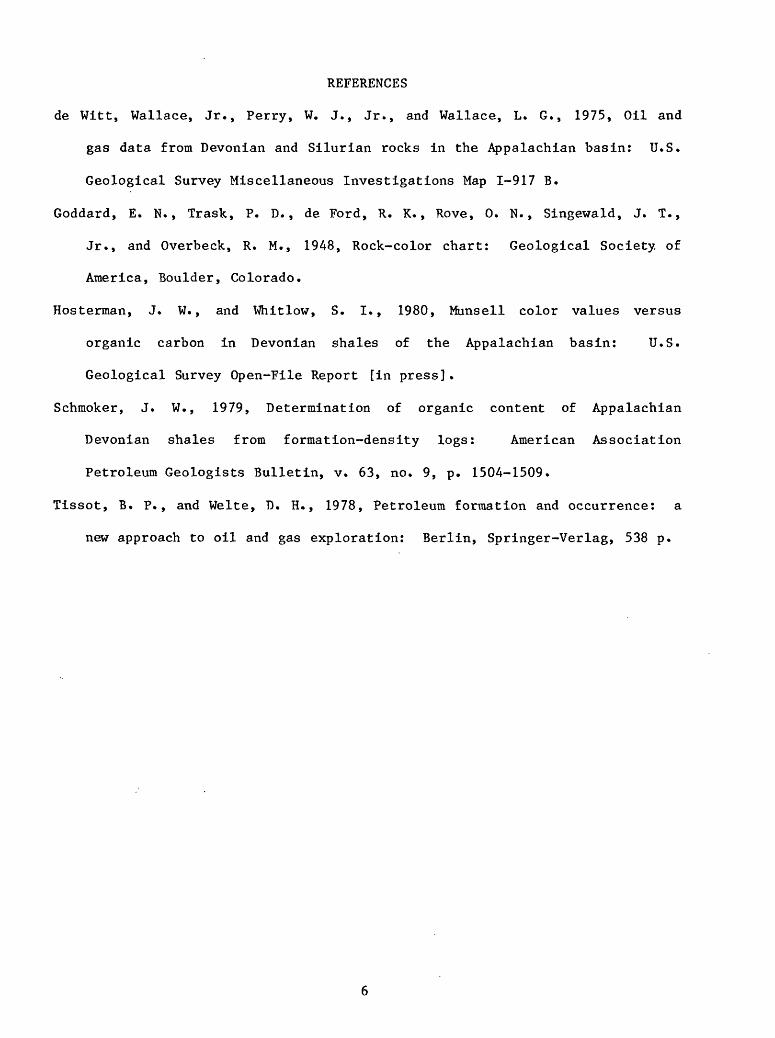
REFERENCES
de Witt, Wallace, Jr., Perry, W. J., Jr., and Wallace, L. G., 1975, Oil and
gas data from Devonian and Silurian rocks in the Appalachian basin: U.S.
Geological Survey Miscellaneous Investigations Map 1-917 B.
Goddard, E. N., Trask, P. D., de Ford, R. K., Rove, 0. N., Singewald, J. T.,
Jr., and Overbeck, R. M., 1948, Rock-color chart: Geological Society of
America, Boulder, Colorado.
Hosterman, J. W., and Whitlow, S. I., 1980, Munsell color values versus
organic carbon in Devonian shales of the Appalachian basin: U.S.
Geological Survey Open-File Report [in press].
Schmoker, J. W., 1979, Determination of organic content of Appalachian
Devonian shales from formation-density logs: American Association
Petroleum Geologists Bulletin, v. 63, no. 9, p. 1504-1509.
Tissot, B. P., and Welte, D. H., 1978, Petroleum formation and occurrence: a
new approach to oil and gas exploration: Berlin, Springer-Verlag, 538 p.

£
zD
)Hi O
§0>
LL
J S
.J DC O
_j O
O
Q o JS
zCQ
,\ I
SH
AL
E C
ON
TA
ININ
G N
O C
ALC
ITE
SH
AL
E C
ON
TA
ININ
G C
AL
CIT
E
810
1214
1618
20
OR
GA
NIC
CO
NT
EN
T (
VO
L.
%)
Fig
ure
1.
Dev
on
ian
-sh
ale
co
lor
bas
ed
on th
e M
un
sell
sy
stem
(G
odda
rd
and
oth
ers
, 1948)
ver
sus
vo
lum
e-p
erce
nt
org
anic
co
nte
nt
for
46 w
ell
s in
th
e A
ppal
achia
n basi
n (a
fter
Hos
terr
nan
and
Whit
low
, 1980).

DATA LIMITED BY THINNING OF /
EASTERN LIMIT / OF METHOD'S /APPLICABILITY
\ APPROXIMATE ^BOUNDARIES OF
DEVONIAN SHALE
I I 1OO 15O KILOMETERS
Figure 2. Thickness (ft) of organic-rich Devonian-shale facies with organic-
rich defined as an organic content of 2 percent or more by volume.
1 ft = 0.3048 m. Contour interval = 100 ft.

DATA LIMITED BY THINNING OF /
EASTERN LIMIT /OF METHOD'S /APPLICABILITY /
APPROXIMATE BOUNDARIES OF DEVONIAN SHALE
i i1OO 15O KILOMETERS
Figure 3. Thickness (ft) of organic-rich Devonian-shale facies with organic-
rich defined by de Witt and others (1975) on the basis of the color
of well cuttings. 1 ft = 0.3048 m. Contour interval = 100 ft.

vr_.-^. rrryr^X
DATA LIMITED BY -L .THINNING OF /SECTION '
EASTERN LIMIT / OF METHOD'S /
APPROXIMATE BOUNDARIES OF DEVONIAN SHALE
1OO MILES
1OO 15O KILOMETERS
Figure A. Locations of wells where wire-line data were obtained. The eastern
limit of applicability marks the boundary of the region where gamma-
ray intensity and organic content are proportional (Schmoker, 1979).

DATA LIMITED BY -/, ±_ THINNING OF /
EASTERN LIMIT / OF METHOD'S /APPLICABILITY
APPROXIMATE BOUNDARIES OF DEVONIAN SHALE
5O 1OO 15O KILOMETERS
Figure 5. Organic content (volume percent) of shale with a gamma-ray intensity
20 API units above the shale baseline. Air-filled wells and a base
line corresponding to shale containing no organic matter are assumed,
Contour interval = 0.2 %.

/
DATA LIMITED BY THINNING OF / SECTION '
/
/
£'£ /<;o /\iv
EASTERN LIMIT / OF METHOD'S /
/
APPLICABILITY
/
/
/
/ /
/
\ APPROXIMATE ^BOUNDARIES OF
DEVONIAN SHALE
1OO MILES
50 1OO 15O KILOMETERS
Figure 6, Organic content (volume percent) of shale with a gamma-ray intensity
of 230 API units. Air-filled wells and a baseline corresponding to
shale containing no organic matter are assumed. Contour interval = 2.0 %