Report on the Ontario Principals’ Council Leadership Study · Consortium for Research on...
58
Consortium for Research on Emotional Intelligence in Organizations ( www.eiconsortium.org ) Report on the Ontario Principals’ Council Leadership Study (February 2005) Howard Stone 1 , James D. A. Parker 2 , and Laura M. Wood 2 1 Learning Ways Inc., Ontario 2 Department of Psychology, Trent University, Ontario Correspondence related to this article can be sent to : Howard Stone: [email protected] James Parker: [email protected] OPC Contact: Joanne Robinson, [email protected]
Transcript of Report on the Ontario Principals’ Council Leadership Study · Consortium for Research on...

Consortium for Research on Emotional Intelligence in Organizations ( www.eiconsortium.org )
Report on the Ontario Principals’ Council Leadership Study
(February 2005)
Howard Stone 1, James D. A. Parker 2, and Laura M. Wood 2
1 Learning Ways Inc., Ontario
2 Department of Psychology, Trent University, Ontario
Correspondence related to this article can be sent to : Howard Stone: [email protected] James Parker: [email protected] OPC Contact: Joanne Robinson, [email protected]

Consortium for Research on Emotional Intelligence in Organizations ( www.eiconsortium.org )
1
Acknowledgements
The Leadership Study was conducted on behalf of the Ontario Principals' Council and funded by the Ministry of Education and Training in the province of Ontario, Canada.

Consortium for Research on Emotional Intelligence in Organizations ( www.eiconsortium.org )
2
Table of Contents
Acknowledgements 1 Table of Contents 2
1. Executive Summary 3 1.1 Present Study 4 1.2 Central Findings 6 1.3 Conclusions and Recommendations 7 2. Introduction 9 2.1 Background and Context 9 2.2 Present Study 12 3. Methodology 12 3.1 Participants 12 3.2 Measures 13 3.3 Procedure 15 4. Central Findings 16 4.1 Comparisons of Demographic Variables 16 4.2 Relationships among Leadership Ratings 16 4.3 Relationships among EQ-i and Leadership Abilities 17 4.4 Predicting the Good Leader 19 5. Conclusions and Recommendations 31 5.1 Conclusions 31 5.2 Recommendations 34 Tables 36 6. References 39 7. Appendices 7.1 EQ-i Profiles 50 7.2 Leadership Questionnaires 55

Consortium for Research on Emotional Intelligence in Organizations ( www.eiconsortium.org )
3
1. Executive Summary
The purpose of the Ontario Principals’ Council (OPC) leadership study (funded by the
Ministry of Education and Training) was to explore the relationship between emotional
intelligence and school leadership. Specifically, this project sought to identify key emotional and
social competencies required by school administrators (principals and vice-principals) to
successfully meet the demands and responsibilities of their positions. It is hoped that this
information can be used to guide the focus of professional development activities for future and
current principals and vice-principals.
The construct of emotional intelligence was defined originally by Salovey and Mayer
(1989/90) as the ability to monitor one’s own feelings and emotions, the ability to monitor the
feelings and emotions of others, and to use this information to guide future thinking and action.
Since that time several related models have been proposed. Bar-On (1997, 2000), for example,
who has worked extensively on developing a comprehensive inventory for assessing relevant
abilities since the 1980s, employs a slightly broader definition of emotional intelligence. He has
developed a model that consists of several related dimensions: intrapersonal abilities (comprised of
several related skills like recognizing and understanding one's feelings), interpersonal abilities
(comprised of several related skills like reading the emotions or non-verbal communication of
others), adaptability (consisting of abilities like being able to adjust one's emotions and behaviours
to changing situations and conditions), and stress management abilities (consisting of skills like
resisting or delaying an impulse).
There is growing empirical evidence that the type of competencies most closely linked
with emotional intelligence are strongly linked with an individual's ability to cope with
environmental demands and uncertainties (Mayer, Caruso & Salovey, 1999). Thus, emotional

Consortium for Research on Emotional Intelligence in Organizations ( www.eiconsortium.org )
4
intelligence has come to be viewed as an important factor in the quality of one’s general emotional
well-being (Taylor, Parker & Bagby, 1999), as well as an important predictor of one’s ability to
succeed in the classroom and on the job (Parker, Summerfeldt, Hogan & Majeski, 2004; Zeidner,
Matthews & Roberts, 2004). Regardless of the emotional intelligence model, most theorists
assume that the relevant emotional and social competencies or abilities are quite malleable
(Mayer et al., 1999; Bar-On, 2000); that is, it is assumed that emotional and social competencies
can be developed and enhanced via appropriate interventions (Bar-On & Parker, 2000b).
1.1 Present Study
1.1.1 Participants
The sample included 464 principals or vice-principals (187 men and 277 women) from
nine school boards in Ontario. Two-hundred and twenty six participants were elementary school
principals, 84 were elementary school vice-principals, 43 were secondary school principals and
57 were secondary school vice-principals (54 did not indicate their current position). The mean
age of the participants was 47.3 years, the mean length of time participants had been in the
education field was 22.4 years, the mean length of time as principal was 5.4 years, and the mean
length of time as vice-principal was 3.0 years.
1.1.2 Procedure
Participating principals and vice-principals provided information about their emotional
intelligence by completing the Emotional Quotient Inventory (EQ-i; BarOn, 1997) online
following instructions distributed in an information package. The EQ-i is a 125-item self-report
instrument designed to measure the core features of emotional intelligence. The EQ-i generates 4
main scales, which make up total emotional intelligence: intrapersonal (consisting of self-regard,
emotional self-awareness, assertiveness, independence, and self-actualization), interpersonal

Consortium for Research on Emotional Intelligence in Organizations ( www.eiconsortium.org )
5
(consisting of empathy, social responsibility, and interpersonal relationship), adaptability
(consisting of reality testing, flexibility, and problem solving), and stress management
(consisting of stress tolerance, and impulse control). The EQ-i also includes a general mood scale
(consisting of optimism and happiness). Participants also completed a consent form which was
returned to the researchers.
Participants were requested to ask their immediate supervisor (superintendent if principal
and principal if vice-principal) to complete a supervisor-rated leadership questionnaire and return
to the researchers. Participants also asked three staff members to be raters and complete a staff-
rated leadership questionnaire which were returned directly to the researchers by the staff
members. The mean of all completed staff rater forms for each participant was calculated.
Leadership skills were rated by participants’ immediate supervisor, as well as several staff
members using a questionnaire that included 21 items related to leadership abilities. The factor
structure of the leadership questionnaire was examined and analyses revealed two broad
leadership dimensions: a task-oriented leadership dimension (e.g., “comes well prepared for
meetings”) and a relationship-oriented leadership dimension (e.g., “seeks consensus among staff
members”).
Four hundred and sixty-four participants completed the EQ-i; of these individuals, 395
had supervisor-rated leadership ratings and 434 had at least one staff-rated leadership ratings.
Those individuals with complete data (EQ-i and all leadership ratings) did not differ on any of
the EQ-i scales from those individuals with incomplete data (missing supervisor ratings and/or
staff ratings).

Consortium for Research on Emotional Intelligence in Organizations ( www.eiconsortium.org )
6
1.2 Central Findings
Consistent with previous research using the EQ-i, women were found to score higher than
men on the interpersonal dimension. However, no differences in EQ-i scales were found between
individuals working in an elementary school versus a secondary school; the same was true when
EQ-i scales were compared for principals and vice-principals.
Men and women were also compared on each of the leadership ratings (task-oriented
leadership, relationship-oriented leadership, and total leadership). Men and women did not differ
on any of the leadership ratings (regardless of whether supervisor or staff ratings were used). In
addition, individuals employed by an elementary school did not differ from those employed at a
secondary school on any of the leadership ratings. Principals, however, were rated higher than
vice-principals by their supervisors on task-oriented leadership, relationship-oriented leadership,
and total leadership. Vice-principals, on the other hand, were rated higher by their staff on
relationship-oriented leadership.
Although there was a positive relationship between the leadership ratings from
supervisors and staff, the association was weak and revealed considerable disagreement between
raters. Therefore, in order to identify individuals who were perceived by others as demonstrating
“above average” or “below average” leadership, a total leadership score was calculated for each
individual based on a combination of both supervisor and staff ratings. A below average
leadership ability group was created by identifying individuals rated at the 20th percentile (or
less) on leadership ability according to both the supervisor and staff ratings; an above average
leadership ability group was also created by identifying individuals rated at the 80th percentile (or
higher) on leadership ability according to both the supervisor and staff ratings. The above
average leadership group scored higher than the below average leadership group on total EI and

Consortium for Research on Emotional Intelligence in Organizations ( www.eiconsortium.org )
7
all four broad dimensions (intrapersonal, interpersonal, adaptability, and stress management).
However, the two groups did not differ on the general mood scale of the EQ-i.
The subscales of the dimensions that the leadership groups differed on were also
investigated. With regards to intrapersonal abilities, the above average leadership group scored
higher than the below average leadership group on the emotional self-awareness and self-
actualization subscales. The above average leadership group scored higher than the below
average leadership group on the empathy and interpersonal relationship subscales of the
interpersonal dimension but not on the social responsibility subscale. In investigating
adaptability skills it was revealed that the above average leadership group scored higher than the
below average leadership group on the flexibility and problem solving subscales. Finally, of the
two stress management subscales (stress tolerance and impulse control) the above average
leadership group only scored higher than the below average leadership group on the impulse
control subscale.
1.3 Conclusions and Recommendations
Several key emotional and social competencies have been identified that differentiate
between school administrators identified by both supervisors and staff as either above average or
below average in leadership abilities. This pattern of results was consistent regardless of gender,
as well as whether the individual worked in an elementary or secondary school, or was employed
as a principal or vice-principal. Boards are advised to consider the use of assessment tools for EI
in professional development programs, as part of the recruitment process for new school
administrators, and in the process of succession planning.

Consortium for Research on Emotional Intelligence in Organizations ( www.eiconsortium.org )
8
Although total emotional intelligence was a significant predictor of successful school
administration, some dimensions of emotional intelligence were better predictors than others.
Specifically, the results of the present study suggest that professional development programs
would be wise to focus on promoting or developing the following abilities: emotional self-
awareness (the ability to recognize and understand one’s feelings and emotions); self-
actualization (ability to tap potential capacities and skills in order to improve oneself); empathy
(ability to be attentive to, understand, and appreciate the feelings of others); interpersonal
relationships (ability to establish and maintain mutually satisfying relationships); flexibility
(ability to adjust one’s emotions, thoughts, and behavior to changing situations and conditions);
problem solving (ability to identify and define problems as well as to generate potentially
effective solutions); and impulse control (ability to resist or delay an emotional behaviors).
Since there were no differences on these EI dimensions principals or vice-principals were
compared, or when supervisors were working in an elementary school were compared to
individuals working in a secondary school, professional development programs that developed
these abilities would benefit a broad range of school administrator.
Consortium for Research on Emotional Intelligence in Organizations ( www.eiconsortium.org )
9
2. Introduction
2.1 Background and Context
The publication of Goleman’s book on “emotional intelligence” in 1995 generated
substantial popular interest in the construct. One of the ideas that quickly emerged from the
“media fallout” around this book was the notion that EI was associated with success in various
educational and work contexts. A plethora of “new” intervention programs quickly appeared for
developing or improving various EI-related abilities (for a review, see Bar-On & Parker, 2000b).
One of the problems with the early literature on EI was the often vague definitions for the
concept. EI was consistently treated as a multi-dimensional construct, but it was often unclear in
the early literature what dimensions should be included and which dimensions actually predicted
success in different aspects of life. Equally problematic in the early literature was the fact that
there was a lack of reliable and valid measurement tools for the various EI models that were
being proposed (for a longer review of the early EI literature, see Zeidner, Matthews, & Roberts
2001).
Initial models for EI often included a long list of attributes or abilities that appeared
drawn from a number of aspects of personality psychology. More recent work, however, has
focused on a more limited set of emotional and social competencies. Although theorists often
quibble over the labels given to specific dimensions, the more influential recent work has
focused on four key EI dimensions (for a review of this literature see Bar-On & Parker, 2000b).
The first dimension is the ability to perceive, appraise and express emotion. Emotional perception
may involve paying attention to various non-verbal cues (like facial expressions, tone of voice,
posture) in self and others. Research has consistently found that the ability to understand emotional
behaviour in self is linked with one’s ability to understand it in others (Taylor, Bagby, & Parker,

Consortium for Research on Emotional Intelligence in Organizations ( www.eiconsortium.org )
10
1997). The second dimension is the ability to use emotions to facilitate thinking and behaviour. This
dimension focuses on how emotions influence our cognitive system. This ability can be very
beneficial, such as when we use intuition or our “gut-feelings” to help make decisions or be
creative. The third dimension is the ability to understand and utilize emotional knowledge. As noted
by Mayer, Salovey, and Caruso (2002), understanding about what has led to the experience of a
particular emotion is a critical component of EI: “knowledge of how emotions combine and change
over time is important in one’s dealings with other people and in enhancing one’s self-
understanding” (p. 19). The fourth dimension is the ability to manage and regulate emotions.
Individuals who are high on this dimension are generally calm and work well under pressure; they
are rarely impulsive and can usually respond to a stressful event without an emotional outburst
(Parker, 2000).
Perhaps one of the most important developments in the EI area in recent years has been
work trying to develop psychometrically sound measures for assessing relevant abilities. Since
the late 1990s several new measures have appeared that have sought to assess EI dimensions
related to the four dimensions described above. Mayer and colleagues (2002) have developed a
performance-based measure in which respondents are asked to solve emotion-related problems
(such as recognizing facial expressions). This measure produces a separate score for each of the
four dimensions, as well as a total EI score. Proponents of performance-based measures contend
that they are relatively objective and tap an individual’s ability to perform an emotion-related
problem.
Bar-On (1997) used an EI model similar to the one described earlier to develop a self-
report measure for EI. The 133-item Emotional Quotient Inventory (EQ-i) is now the most widely
used self-report measure for EI. Along with a total EI score, the instrument has four broad scales:

Consortium for Research on Emotional Intelligence in Organizations ( www.eiconsortium.org )
11
intrapersonal (comprised of several related subscales like recognizing and understanding one's
feelings), interpersonal (comprised of several related subscales like empathy), adaptability
(consisting of related subscales like being able to adjust one's emotions and behaviours to changing
situations and conditions), and stress management (consisting of subscales like resisting or delaying
an impulse). Recently, the EQ-i has been adapted for use with children and adolescents (Bar-On &
Parker, 2000a).
It is interesting to note that human resource specialists were some of the first groups of
professionals to take notice of the new EI measures that were appearing at the end of the 1990s.
In particular, there was a strong interest in examining the relationship between EI and leadership
in various workplace environments. Leadership concerns the interaction of leaders with other
individuals, and once social interactions are involved, emotional awareness and emotional
regulation become important factors affecting the quality of these interactions. Although mass-
media discussions of EI and the workplace (e.g., Goleman) often focus on the top of the
corporate structure (e.g., what makes a good CEO, etc), the growing empirical literature is
suggesting that EI abilities are linked with leadership managing behaviours at various levels
within an institution (George, 2000).
If we look for patterns in the recent literature on successful leadership ability, we can see
several basic ways that EI appears to contribute to positive management behaviour. People with
above average levels of EI tend to have above average communication skills (often at both verbal
and non-verbal levels). This is an essential skill when a manager needs to communicate goals
and objectives to subordinates. People with above average levels of EI are usually above average
in their ability to cope with stress. This is an ability that is very important for generating and
maintaining enthusiasm, confidence, and cooperation in the workplace. Stress is an inevitable

Consortium for Research on Emotional Intelligence in Organizations ( www.eiconsortium.org )
12
part of the workplace, but over the long term, people are more optimistic and trusting if they
work around or for individuals who know how to cope under pressure (George, 2000).
2.2 Present Study
The purpose of the Ontario Principals’ Council (OPC) leadership study (funded by the
Ministry of Education and Training) was to explore the relationship between emotional
intelligence and school leadership. Specifically, this project sought to identify key emotional and
social competencies required by school administrators (principals and vice-principals) to
successfully meet the demands and responsibilities of their positions. It is hoped that this
information can be used to guide the focus of professional development activities for future and
current principals and vice-principals.
3. Methodology
3.1 Participants
The sample included 464 principals or vice-principals (187 men and 277 women) from
nine different public school boards in Ontario. The boards were from geographically diverse
parts of the province. Two-hundred and twenty six participants were elementary school
principals, 84 were elementary school vice-principals, 43 were secondary school principals and
57 were secondary school vice-principals (54 did not indicate their current position). The mean
age of the participants was 47.3 years (SD = 6.62), the mean length of time participants had been
in the education field was 22.4 years (SD = 7.55), the mean length of time as principal was 5.4
years (SD = 4.16), and the mean length of time as vice-principal was 3.0 years (SD = 2.98).

Consortium for Research on Emotional Intelligence in Organizations ( www.eiconsortium.org )
13
3.2 Measures
3.2.1 Emotional Intelligence
Participating principals and vice-principals provided information about their emotional
intelligence by completing the on-line version of the Emotional Quotient Inventory (EQ-i;
BarOn, 1997). The EQ-i is a 125-item self-report instrument designed to measure the core
features of emotional intelligence using 5-point Likert scales for each item (ranging from “1”
being “very seldom true of me” to “5” being “very often true of me”). The EQ-i generates 4 main
scales, which make up total emotional intelligence: intrapersonal (consisting of 5 subscales: self-
regard, emotional self-awareness, assertiveness, independence, and self-actualization),
interpersonal (consisting of 3 subscales: empathy, social responsibility, and interpersonal
relationship), adaptability (consisting of 3 subscales: reality testing, flexibility, and problem
solving), and stress management (consisting of 2 subscales: stress tolerance, and impulse
control). The EQ-i also includes a general mood scale (consisting of 2 subscales: optimism and
happiness). High scores on these scales can be interpreted as follows:
Individuals who score high on the intrapersonal scale tend to understand their emotions
and are able to express and communicate their feeling and needs.
Those scoring high on the interpersonal scale are likely to have satisfying interpersonal
relationships, are good listeners and are able to understand and appreciate the feelings of
others.
Individuals with high adaptability scores are flexible, realistic, and effective in managing
change; good at finding positive ways of dealing with everyday problems.

Consortium for Research on Emotional Intelligence in Organizations ( www.eiconsortium.org )
14
Those with high scores on the stress management scale are generally calm and work well
under pressure; they are rarely impulsive and can usually respond to a stressful event
without an emotional outburst.
Individuals who score high on the general mood scale feel satisfied with their lives and
maintain a positive outlook.
3.2.2 Leadership
Principals and vice-principals also completed a 21-item self-report questionnaire,
especially developed for the present study, which assessed various leadership abilities. The items
on this instrument were selected from a review of various skills and abilities used in performance
evaluations of school administrators from several different boards (Appendix 6.3 presents the list
of items as well as instructions for this instrument). Leadership skills were also rated by
participants’ immediate supervisor, as well as several staff members using a parallel set of 21-
items (see Appendix 6.3 for a list of the items and rater instructions). Each of the leadership
questionnaires also included a 10-point rating of overall leadership ability with 0 meaning “No
leadership ability” and 9 meaning “Highest level possible”.
The factor structure of each questionnaire was examined using exploratory factor
analysis. These analyses revealed a very interpretable two-factor structure for the data from the
self-report ratings, as well as from the data from the supervisor ratings and staff ratings. Factor 1
includes 8 items related to “task-oriented leadership” abilities (e.g., “Comes well prepared for
meetings”), while factor 2 includes 6 items related to “relationship-oriented leadership” abilities
(e.g., “Seeks consensus among staff members”). Internal reliability coefficients for the two
factors in the present sample are 0.83 and 0.75 for the self-report questionnaire, 0.89 and 0.87 for

Consortium for Research on Emotional Intelligence in Organizations ( www.eiconsortium.org )
15
the supervisor-rated questionnaire, and 0.89 and 0.87 for the staff-rated questionnaire. The items
on the two factors added together provide a total leadership score.
3.3 Procedure
Participants completed the EQ-i online following instructions distributed in an
information package. Participants also completed the self-report leadership questionnaire and
consent form which were returned to the researchers by mail. Participants asked their immediate
supervisor (superintendent if they were a principal and the principal of the school if they were a
vice-principal) to complete the supervisor-rated leadership questionnaire and return the form to
the researchers by mail. Participants were also instructed to ask three staff members to complete
the staff-rated leadership questionnaire and return the forms to the researchers by mail.
Five hundred and seventy-seven packages were distributed to potential participants. All
completed questionnaires were entered into a database and matched with participants EQ-i
assessment results. Four hundred and sixty-four participants completed the EQ-i. Of those
individuals who completed the EQ-i, 416 participants also provided a self-report leadership
questionnaire. A supervisor-rated leadership questionnaire was available for 395 participants,
and 434 participants had at least one staff-rated leadership questionnaire. Participants with
complete data-sets (EQ-i and all leadership questionnaires) did not differ (p > .05) on any of the
EQ-i measures from individuals with incomplete data-sets.

Consortium for Research on Emotional Intelligence in Organizations ( www.eiconsortium.org )
16
4. Central Findings
4.1 Comparisons of Demographic Variables
Several gender by level (elementary vs. secondary) by position (principal vs. vice
principal) ANOVAs were performed with each of the EQ-i scales (intrapersonal, interpersonal,
adaptability, stress management, and general mood) as dependent variables. Women were found
to score higher than men on the interpersonal scale of the EQ-i only [F (1, 402) = 18.63, p <
.001]. Individuals employed by an elementary school did not significantly differ (p > .05) from
those employed at a secondary school on any of the EQ-i scales. Principals and vice principals
also did not differ (p > .05) on any of the EQ-i scales.
Several gender by level (elementary vs. secondary) by position (principal vs. vice
principal) ANOVAs were also performed with mean scores from each of the leadership ratings
(self-, supervisor- and staff-rated) as the dependent variables. Men and women did not differ (p >
.05) on any of the leadership ratings. Individuals employed at an elementary school did not
significantly differ (p > .05) from those employed at a secondary school on any of the leadership
ratings. Principals, however, were rated significantly higher than vice principals on all leadership
ratings by their supervisors: task-oriented leadership [F (1, 361) = 9.62, p < .01], relationship-
oriented leadership [F (1, 361) = 7.21, p < .01], total leadership [F (1, 361) = 9.73, p < .01], and
overall leadership ability [F (1, 357) = 10.91, p < .01]. Vice-principals, on the other hand, were
rated significantly higher than principals by their staff on relationship-oriented leadership [F (1,
395) = 5.17, p < .05]. No other comparisons were significant.

Consortium for Research on Emotional Intelligence in Organizations ( www.eiconsortium.org )
17
4.2 Relationships among Leadership Ratings
Inter-correlations between self-reported leadership abilities, supervisor-rated leadership
abilities and staff-rated leadership abilities were all examined. As shown in Table 1, correlations
between self-reported and supervisor-rated leadership abilities were low or non-significant (p >
.05). The correlations between self-reported and staff-rated leadership abilities, presented in
Table 2, were also low or non-significant (p > .05). The correlations between supervisor-rated
and staff-rated leadership abilities, presented in Table 3, were all significant (p < .05) and
slightly higher than the coefficients presented in the other two tables.
4.3 Relationships among EQ-i and Leadership Abilities
Table 4 presents correlations between EQ-i scores (scales and subscales) and self-
reported leadership abilities (task-oriented leadership, relationship-oriented leadership, total
leadership, and overall leadership rating). The majority of the correlations were moderate in
magnitude and significant (p < .001). Table 5 presents the correlations between EQ-i scores and
supervisor-rated leadership abilities. The majority of correlations were low or non-significant (p
> .05). Table 6 presents the correlations between EQ-i scores and staff-rated leadership abilities.
Again, the majority of correlations were low or non-significant (p > .05).
Several multiple regression analyses were also performed using gender, intrapersonal
abilities, interpersonal abilities, adaptability skills, stress management skills, general mood,
position, level, and years on job as predictors of leadership ability: task-oriented leadership,
relationship-oriented leadership, and total leadership. Table 7 presents the results from the
analyses with the self-report leadership data (only results for significant predictors are
presented). Collectively, the independent variables were moderate predictors of self-reported
leadership ability: R2 was 0.297 for task-oriented leadership, 0.253 for relationship-oriented

Consortium for Research on Emotional Intelligence in Organizations ( www.eiconsortium.org )
18
leadership, and 0.316 for total leadership ability. Gender, intrapersonal abilities, interpersonal
abilities, and adaptability skills contributed to 1, 3, 1, and 2%, respectively, of the variability in
self-reported task-oriented leadership. Gender, interpersonal abilities, adaptability skills, and
general mood contributed to 3, 7, 2 and 1%, respectively, of the variability in self-reported
relationship-oriented leadership, while gender, intrapersonal abilities, interpersonal abilities, and
adaptability skills contributed to 2, 1, 4, and 2%, respectively, of the variability in total self-
reported leadership ability.
Table 8 presents the results from the analyses with the supervisor-rated leadership data
(only results for significant predictors are presented). Collectively, the independent variables
were poor predictors of self-reported leadership ability: R2 was 0.072 for task-oriented
leadership, 0.044 for relationship-oriented leadership, and 0.057 for total leadership ability.
Position contributed to 3% of the variability in supervisor-rated task-oriented leadership.
Interpersonal abilities, stress management abilities and position contributed to 2, 1, and 1%,
respectively, of the variability in supervisor-rated relationship-oriented leadership. Interpersonal
abilities and position each accounted for 2%, respectively, of the variability in supervisor-rated
total leadership ability.
Table 9 presents the results from the analyses with the staff-rated leadership data (only
results for significant predictors are presented). Collectively, the independent variables were
poor predictors of self-reported leadership ability: R2 was 0.048 for task-oriented leadership,
0.053 for relationship-oriented leadership, and 0.042 for total leadership ability. Interpersonal
abilities contributed to 1% of the variability in staff-rated task-oriented leadership. Interpersonal
abilities, along with intrapersonal abilities and position, also contributed 2, 1, and 2%,

Consortium for Research on Emotional Intelligence in Organizations ( www.eiconsortium.org )
19
respectively, of the variability in staff-rated relationship-oriented leadership and interpersonal
abilities accounted for 2% of the variability in staff-rated total leadership ability.
4.4 Predicting the Good Leader 4.4.1 Self-Reported Leadership
The total self-reported leadership score was used to separate the participants into two
groups: an above average leadership ability group (top 20% based on self-report ratings) and a
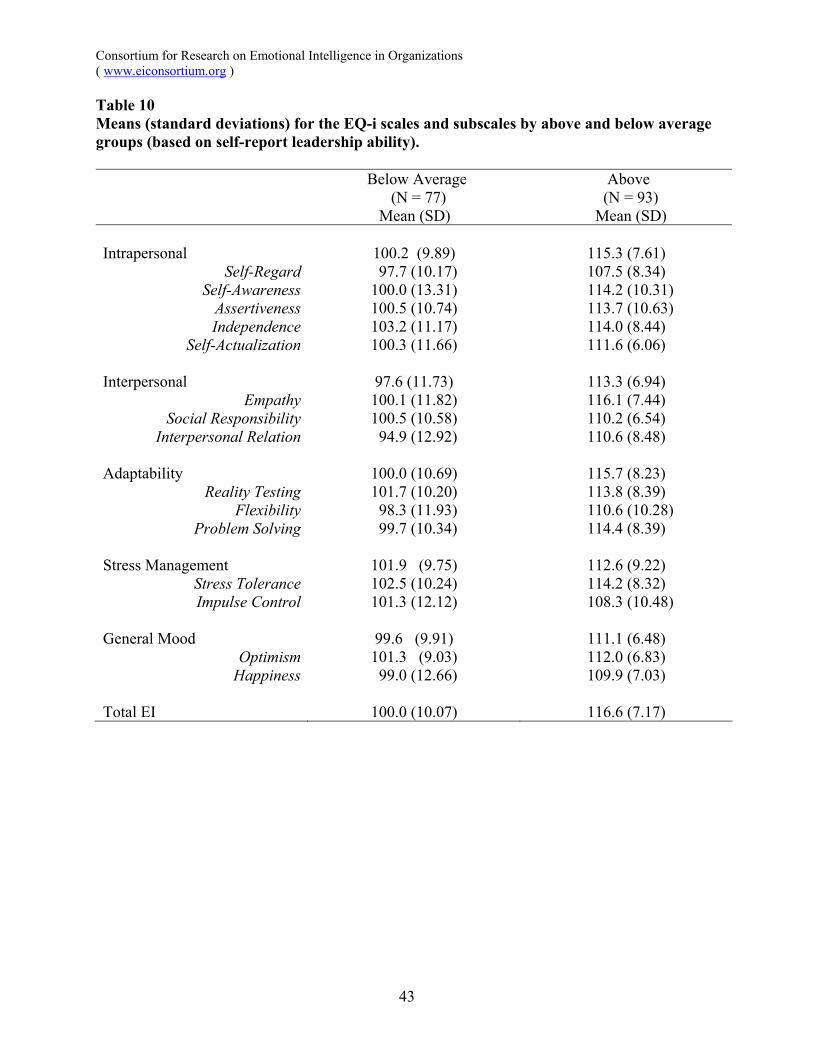
below leadership ability group (bottom 20%). Table 10 presents means and standard deviations
for EQ-i scores by leadership group. A leadership group (above vs. below average) by gender by
type of EI (intrapersonal, interpersonal, adaptability, stress management and general mood)
ANOVA was conducted with level of EI as the dependent variable. The main effect for gender
was significant [F (1, 166) = 5.60, p < .05], with women scoring higher than men. To understand
the main effect for gender, separate univariate F tests were conducted for each EQ-i scale.
Women were found to score higher than men on the interpersonal [F (1, 166) = 8.74, p < .01]
and adaptability [F (1, 166) = 7.81, p < .01] scales. The main effect for leadership group was also
significant [F (1, 166) = 153.94, p < .001], with the above average leadership group scoring
higher than the below average group on overall level of EI.
The leadership group by type of EI interaction was also significant [F (4, 664) = 6.23, p <
.001]. To understand the main effect for group and the group by type interaction, separate
univariate F-tests were conducted for each of the EQ-i scales. The above average leadership
group scored significantly higher than the below average group on the intrapersonal [F (1, 166) =
120.01, p < .001], interpersonal [F (1, 166) = 116.82, p < .001], adaptability [F (1, 166) =
131.51, p < .001], stress management [F (1, 166) = 48.13, p < .001] and general mood [F (1,
166) = 76.99, p < .001] scales of the EQ-i. The main effect for type of EI was also significant [F

Consortium for Research on Emotional Intelligence in Organizations ( www.eiconsortium.org )
20
(4, 664) = 6.60, p < .001]. A Student-Newman Keuls post-hoc test revealed that participants
scored lower on the interpersonal and general mood scales than on the intrapersonal, stress
management and adaptability scales.
Intrapersonal ability. To better understand the relationship between leadership ability
and the various facets that make up intrapersonal ability, a leadership group (above average vs.
below) by gender by type of intrapersonal ability (emotional self-awareness, assertiveness, self-
regard, self-actualization, and independence) ANOVA was conducted with level of ability as the
dependent variable. The main effect for gender was not significant (p > .05). The main effect for
leadership group was significant [F (1, 166) = 120.28, p < .001], with the above average
leadership group scoring higher than the below average group on overall intrapersonal ability.
The group by type of EI interaction was also significant [F (4, 664) = 2.65, p < .05]. To
understand the main effect for group and the interaction between group and type, separate
univariate F-tests were conducted for each of the intrapersonal ability subscales. The above
average leadership group scored significantly higher than the below average leadership group on
the self regard [F (1, 166) = 44.17, p < .001], emotional self-awareness [F (1, 166) = 64.53, p <
.001], assertiveness [F (1, 166) = 65.65, p < .001], independence [F (1, 166) = 45.46, p < .001]
and self-actualization [F (1, 166) = 61.71, p < .001] subscales. The main effect for type of
intrapersonal ability was also significant [F (4, 664) = 10.39, p < .001]. A Student-Newman
Keuls post-hoc test revealed that participants scored lower on the self-regard subscale than the
other intrapersonal subscales and lower on the self-actualization subscale than on the
independence subscale. The type of intrapersonal ability by gender interaction was also
significant [F (4, 664) = 6.43, p < .001]. None of the other interactions were significant.

Consortium for Research on Emotional Intelligence in Organizations ( www.eiconsortium.org )
21
Interpersonal ability. To better understand the relationship between leadership ability
and the various facets that make up interpersonal ability, a leadership group (above average vs.
below) by gender by type of interpersonal ability (interpersonal relationship, social
responsibility, and empathy) ANOVA was conducted with level of ability as the dependent
variable. The main effect for gender was significant [F (1, 166) = 12.43, p < .001], with women
scoring higher than men. Separate univariate F tests were conducted for each of the interpersonal
subscales. Women were found to score higher than men on the empathy [F (1, 166) = 13.71, p <
.001], social responsibility [F (1, 166) = 9.37, p < .01] and interpersonal relationships [F (1, 166)
= 4.35, p < .05] subscales. The main effect for leadership group was also significant [F (1, 166) =
126.62, p < .001], with the above average leadership group scoring higher than the below
average leadership group on overall interpersonal ability. The group by type of interpersonal
ability was also significant [F (2, 332) = 23.73, p < .001]. To understand the main effect for
group and the group by type of interpersonal ability interaction, separate univariate F-tests were
conducted for each of the interpersonal ability subscales. The above average leadership group
scored significantly higher than the below average group on the empathy [F (1, 166) = 119.18, p
< .001], social responsibility [F (1, 166) = 56.65, p < .001] and interpersonal relationship [F (1,
166) = 84.81, p < .001] subscales. The main effect for type of interpersonal ability was also
significant [F (2, 332) = 23.73, p < .001]. A Student-Newman Keuls post-hoc test revealed that
participants scored higher on the empathy subscale than the other interpersonal subscales, and
higher on the social responsibility subscale than the interpersonal relationship subscale. None of
the other interactions were significant.
Adaptability. To better understand the relationship between leadership ability and the
various facets that comprise adaptability, a leadership group (above average vs. below) by

Consortium for Research on Emotional Intelligence in Organizations ( www.eiconsortium.org )
22
gender by type of adaptability skills (problem solving, reality testing, and flexibility) ANOVA
was conducted with level of adaptability as the dependent variable. The main effect for gender
was significant [F (1, 166) = 7.52, p < .01], with women scoring higher than men. Separate
univariate F tests were conducted for each of the adaptability subscales. Women were found to
score higher than men on the reality testing [F (1, 166) = 5.68, p < .05] and problem solving [F
(1, 166) = 8.79, p < .01] subscales. The main effect for leadership group was also significant [F
(1, 166) = 130.66, p < .001], with the above average leadership group scoring higher than the
below average leadership group on overall adaptability. To understand the main effect for group,
separate univariate F-tests were conducted for each of the adaptability subscales. The above
average leadership group scored significantly higher than the below average group on the reality
testing [F (1, 166) = 73.95, p < .001], flexibility [F (1, 166) = 49.19, p < .001], and problem
solving [F (1, 166) = 108.32, p < .001] subscales. The main effect for type of adaptability was
also significant [F (2, 332) = 6.75, p < .01]. A Student-Newman Keuls post-hoc test revealed that
participants scored lower on the flexibility subscale than the other adaptability subscales. None
of the interactions were significant.
Stress management ability. To better understand the relationship between leadership
ability and the various facets that comprise stress management ability, a leadership group (above
average vs. below) by gender by type of stress management ability (stress tolerance and impulse
control) ANOVA was conducted with level of ability as the dependent variable. The main effect
for gender was not significant (p > .05). The main effect for leadership group was significant [F
(1, 166) = 49.33, p < .001], with the above average leadership group scoring higher than the
below average group on overall stress management. The group by type of stress management
interaction was also significant [F (1, 166) = 6.12, p < .05]. To understand the main effect for

Consortium for Research on Emotional Intelligence in Organizations ( www.eiconsortium.org )
23
group and the group by type interaction, separate univariate F-tests were conducted for each of
the stress management subscales. The above average leadership group scored significantly higher
than the below average group on the stress tolerance [F (1, 166) = 63.78, p < .001] and impulse
control [F (1, 166) = 17.40, p < .001] subscales. The main effect for type of stress management
was significant [F (1, 166) = 21.20, p < .001]. Participants scored higher on the stress tolerance
subscale than on the impulse control subscale. The gender by type of stress management
interaction was also significant [F (1, 166) = 5.93, p < .001]. No other interactions were
significant.
General mood. To better understand the relationship between leadership ability and the
facets that comprise general mood, a leadership group (above average vs. below) by gender by
type of general mood (optimism and happiness) ANOVA was conducted with level of mood as
the dependent variable. The main effect for gender and the interactions were not significant (p >
.05). The main effect for leadership group was significant [F (1, 166) = 86.05, p < .001], with the
above average group having higher general mood scores than the below average group. To
understand the main effect for group, separate univariate F tests were performed with each of the
general mood subscales. The above average leadership group was found to score higher than the
below average group on the optimism [F (1, 166) = 72.20, p < .001] and happiness [F (1, 166) =
46.79, p < .001] subscales. The main effect for type of general mood was also significant [F (1,
166) = 5.91, p < .05], with participants scoring higher on the optimism subscale than on the
happiness subscale.
4.4.2 Supervisor Rated Leadership
The total supervisor-rated leadership score was used to separate the participants into two
groups: an above average leadership ability group (top 20% based on supervisor ratings) and a

Consortium for Research on Emotional Intelligence in Organizations ( www.eiconsortium.org )
24
below leadership ability group (bottom 20%). Table 11 presents means and standard deviations
for EQ-i scores by leadership group (based on supervisor ratings). A leadership group (above
average vs. below) by gender by type of EI (intrapersonal, interpersonal, adaptability, stress
management and general mood) ANOVA was conducted with level of EI as the dependent
variable. The main effect for type of EI was significant [F (4, 604) = 4.27, p < .01], with
participants scoring lower on the general mood scale than on the intrapersonal, stress
management and adaptability scales. Also, participants were found to score lower on the
interpersonal scale than on the adaptability scale. The main effect for gender and leadership
group was not significant (p > .05), although the interaction of gender and type was significant
[F (4, 604) = 3.65, p < .01]. No other interactions were significant. Since the main effect for
leadership group was not significant no separate analyses were conducted at the subscale for the
EQ-i.
4.4.3 Staff Rated Leadership
The total staff-rated leadership score was used to separate the participants into two
groups: an above average leadership ability group (top 20% based on staff ratings) and a below
leadership ability group (bottom 20%). Table 12 presents means and standard deviations for EQ-i
scores by leadership group (based on staff-ratings). A leadership group (above average vs.
below) by gender by type of EI (intrapersonal, interpersonal, adaptability, stress management
and general mood) ANOVA was conducted with level of EI as the dependent variable. The main
effect for gender was not significant (p > .05). The main effect for leadership group, however,
was significant [F (1, 165) = 4.79, p < .05], with the above average leadership group scoring
higher than the below average group. To understand the main effect for group, separate
univariate F-tests were conducted for each of the EQ-i scales. The above average leadership

Consortium for Research on Emotional Intelligence in Organizations ( www.eiconsortium.org )
25
group scored significantly higher than the below average group on the interpersonal [F (1, 165) =
11.23, p < .001] and adaptability [F (1, 165) = 4.55, p < .05] scales of the EQ-i. The main effect
for type of EI was also significant [F (4, 660) = 7.90, p < .001] with participants scoring higher
on the adaptability scale than on the intrapersonal and interpersonal scale, and higher on the
stress management scale than on the interpersonal and general mood scales. There was also a
significant interaction between type of EI and gender [F (4, 660) = 3.72, p < .01]. No other
interactions were significant (p > .05).
Interpersonal ability. To better understand the significant relationship that was found
between leadership ability and interpersonal ability, a leadership group (above average vs.
below) by gender by type of interpersonal ability (interpersonal relationship, social
responsibility, and empathy) ANOVA was conducted with level of ability as the dependent
variable. The main effect for gender was significant [F (1, 165) = 12.59, p < .001], with women
scoring higher than men. To understand the main effect for gender, separate univariate F tests
were performed. Women were found to score higher than males on the empathy [F (1, 165) =
9.80, p < .01], social responsibility [F (1, 165) = 4.08, p < .05], and interpersonal relationships [F
(1, 165) = 12.77, p < .001] subscales. The main effect for leadership group was also significant
[F (1, 165) = 13.95, p < .001], with the above average leadership group scoring higher than the
below average group on overall interpersonal ability. To understand this main effect, separate
univariate F-tests were also conducted for each of the interpersonal ability subscales. The above
average leadership group scored significantly higher than the below average group on the
empathy [F (1, 165) = 17.28, p < .001], social responsibility [F (1, 165) = 8.12, p < .01] and
interpersonal relationship [F (1, 165) = 5.80, p < .05] subscales. The main effect for type of
interpersonal ability was also significant [F (2, 330) = 31.41, p < .001]. A Student-Newman

Consortium for Research on Emotional Intelligence in Organizations ( www.eiconsortium.org )
26
Keuls post-hoc test revealed that participants scored higher on the empathy subscale than the
other interpersonal subscales, and higher on the social responsibility subscale than the
interpersonal relationship subscale. None of the interactions were significant.
Adaptability. To better understand the significant relationship that was found between
leadership ability and adaptability, a leadership group (above average vs. below) by gender by
type of adaptability dimension (problem solving, reality testing, and flexibility) ANOVA was
conducted with level of ability as the dependent variable. The main effect for gender and all
interactions were not significant (p > .05). The main effect for leadership group was significant
[F (1, 165) = 4.39, p < .05], with the above average leadership group scoring higher than the
below average group on overall adaptability. To understand the main effect for group, separate
univariate F-tests were conducted for each of the adaptability subscales. The above average
leadership group scored significantly higher than the below average group on the reality testing
subscale [F (1, 165) = 4.03, p < .05]. The main effect for type of adaptability was also significant
[F (2, 330) = 8.63, p < .001]. A Student-Newman Keuls post-hoc test revealed that participants
scored lower on the flexibility subscale than the other adaptability subscales.
4.4.4 Leadership Ability (Based on Combined Supervisor and Staff Ratings)
A total leadership score was calculated by adding the supervisor ratings with the mean of
the staff ratings. This composite score was used to create two new groups: an above average
leadership group (top 20% based) and a below average leadership group (bottom 20%). Table 13
presents means and standard deviations for EQ-i scores by leadership group (based on the
combined supervisor and staff ratings). A leadership group (above average vs. below) by gender
by type of EI (intrapersonal, interpersonal, adaptability, stress management and general mood)
ANOVA was conducted with level of EI as the dependent variable. The main effect for gender

Consortium for Research on Emotional Intelligence in Organizations ( www.eiconsortium.org )
27
and all of the interactions were not significant (p > .05). The main effect for leadership group
was significant [F (1, 151) = 8.99, p < .01], with the above average leadership group scoring
higher than the below average group on overall level of EI. To understand the main effect for
group, separate univariate F-tests were conducted for each EQ-i scale. The above average
leadership group scored significantly higher than the below average group on the intrapersonal
[F (1, 151) = 4.52, p < .05], interpersonal [F (1, 151) = 7.95, p < .01], adaptability [F (1, 151) =
6.16, p < .05] and stress management [F (1, 151) = 6.50, p < .01] scales of the EQ-i. There was
no significant difference on the general mood scale (p > .05). The main effect for type of EI was
also significant [F (4, 604) = 5.44, p < .001]. A Student-Newman Keuls post-hoc test revealed
that participants scored lower on the interpersonal scale than on the stress management and
adaptability scales. Participants also scored lower on the general mood scale than on the
adaptability scale.
Intrapersonal ability. To better understand the significant relationship that was found
between leadership ability and intrapersonal ability, a leadership group (above average vs.
below) by gender by type of intrapersonal ability (emotional self-awareness, assertiveness, self-
regard, self-actualization, and independence) ANOVA was conducted with level of ability as the
dependent variable. The main effect for gender was not significant (p > .05). The main effect for
leadership group was significant [F (1, 151) = 4.39, p < .05], with the above average leadership
group scoring higher than the below average group on overall intrapersonal ability. Separate
univariate F-tests found that the above average leadership group scored significantly higher than
the below leadership group on the emotional self-awareness [F (1, 151) = 4.30, p < .05], and
self-actualization [F (1, 151) = 4.38, p < .05] subscales. The main effect for type of intrapersonal
ability was also significant [F (4, 604) = 5.48, p < .001]. A Student-Newman Keuls post-hoc test

Consortium for Research on Emotional Intelligence in Organizations ( www.eiconsortium.org )
28
revealed that participants scored lower on the self-regard subscale than the other intrapersonal
subscales. The type of intrapersonal ability by gender interaction was also significant [F (4, 604)
= 9.25, p < .001]. None of the other interactions were significant.
Interpersonal ability. To better understand the significant relationship that was found
between leadership ability and interpersonal ability, a leadership group (above average vs.
below) by gender by type of interpersonal ability (interpersonal relationship, social
responsibility, and empathy) ANOVA was conducted with level of ability as the dependent
variable. The main effect for gender was not significant (p > .05). The main effect for leadership
group was significant [F (1, 151) = 8.85, p < .01], with the above average leadership group
scoring higher than the below average group on overall interpersonal ability. Separate univariate
F-tests found that the above average leadership group scored significantly higher than the below
average group on the empathy [F (1, 151) = 10.12, p < .01] and interpersonal relationship [F (1,
151) = 6.15, p < .05] subscales. The main effect for type of interpersonal ability was also
significant [F (2, 302) = 22.02, p < .001]. A Student-Newman Keuls post-hoc test revealed that
participants scored higher on the empathy subscale than the other interpersonal subscales, and
higher on the social responsibility subscale than the interpersonal relationship subscale. The type
of interpersonal ability by gender interaction was also significant [F (2, 302) = 3.87, p < .05]. A
post-hoc analysis revealed that women scored higher on the interpersonal relationship subscale
than men. It also revealed that women scored higher on empathy than on other subscales; men
scored lower on interpersonal relationship than other subscales. None of the other interactions
were significant.
Adaptability. To better understand the significant relationship that was found between
leadership ability and adaptability, a leadership group (above average vs. below) by gender by

Consortium for Research on Emotional Intelligence in Organizations ( www.eiconsortium.org )
29
type of adaptability dimension (problem solving, reality testing, and flexibility) ANOVA was
conducted with level of ability as the dependent variable. The main effect for gender and all the
interactions were not significant (p > .05). The main effect for leadership group was significant
[F (1, 151) = 6.44, p < .01], with the above average leadership group scoring higher than the
below average group on overall adaptability. Separate univariate F-tests found that the above
average leadership group scored significantly higher than the below average group on the
flexibility [F (1, 151) = 4.31, p < .05] and problem solving [F (1, 151) = 5.59, p < .05] subscales.
The main effect for type of adaptability was also significant [F (2, 302) = 5.86, p < .01]. A
Student-Newman Keuls post-hoc test revealed that participants scored lower on the flexibility
subscale than the other adaptability subscales.
Stress management ability. To better understand the significant relationship that was
found between leadership ability and stress management ability, a leadership group (above
average vs. below) by gender by type of stress management ability (stress tolerance and impulse
control) ANOVA was conducted with level of ability as the dependent variable. The main effects
for gender, type of stress management ability, and all interactions were not significant (p > .05).
The main effect for leadership group was significant [F (1, 151) = 6.70, p < .01], with the above
average leadership group scoring higher than the below average group on overall stress
management. Separate univariate F-tests found that the above average leadership group scored
significantly higher than the below average group on the impulse control [F (1, 151) = 4.27, p <
.05] subscale.
4.4.5 Creation of Leadership Profiles

Consortium for Research on Emotional Intelligence in Organizations ( www.eiconsortium.org )
30
To further explore the predictive validity of the EQ-i, several related discriminant
function analyses were performed using the 13 EQ-i subscales as predictors of membership in
various leadership groups (depending on which leadership ratings were used). Figure 1
graphically presents mean EQ-i scores for the above average and below average leadership
groups (based on self-report leadership ratings). Classification rates for self-reported leadership
groups are presented in Table 14. The disciminant function analysis revealed that the EQ-i scales
were significant predictors of above average leadership ability [F (13, 156) = 16.33, p < .001].
The overall correct classification rate from the analysis was 87% (90% for above average
leadership and 83% for below average leadership).
Figure 2 graphically presents mean EQ-i scores for the above average and below average
leadership groups (based on supervisor ratings). Classification rates for supervisor-rated
leadership groups are presented in Table 15. The disciminant function analysis revealed that the
EQ-i scales were not significant predictors of above average leadership ability [F (13, 141) =
1.21, p > .05]; the overall correct classification rate of 61% (61% for above average leadership
and 61% for below average leadership).
Figure 3 graphically presents mean EQ-i scores for the above average and below average
leadership groups (based on staff-rated leadership ratings). Classification rates for staff-rated
leadership groups are presented in Table 16. The disciminant function analysis revealed that the
EQ-i scales were significant predictors of above average leadership ability [F (13, 155) = 2.34, p
< .01]. The overall correct classification rate from the analysis was 70% (68% for above average
leadership and 73% for below average leadership).
Figure 4 graphically presents mean EQ-i scores for the above average and below average
leadership groups (based on combined supervisor and staff ratings of leadership ability).

Consortium for Research on Emotional Intelligence in Organizations ( www.eiconsortium.org )
31
Classification rates for supervisor- and staff-rated leadership groups are presented in Table 17.
The discriminant function analysis revealed that the EQ-i scales were significant predictors of
above average leadership ability [F (13, 141) = 1.80, p < .05]. The overall correct classification
rate from the analysis was 65% (66% for above average leadership and 64% for below average
leadership).
5. Conclusions and Recommendations
5.1 Conclusions
Consistent with previous research using the EQ-i (Bar-On, 1997; 2000), women were
found to score higher than men on the interpersonal dimension. It is worth noting, however, that
no differences were found on any of the EQ-i scales when individuals working in an elementary
school were compared with those supervisors working in a secondary school. The same lack of
difference was found when the EQ-i measures for principals and vice-principals were compared.
Thus, the overall results of study with respect to the relationship between EI and leadership
ability generalize to principals and vice-principals working in both an elementary and secondary
environment.
The factor analysis of the leadership ratings produced a similar two-dimensional model
in all three sets of ratings (self-report, supervisor, and staff). These analyses revealed that raters
distinguish between two types of leadership abilities: task-oriented skills and relationship-
oriented skills. The former dimension relates to skills like managing resources, delegating tasks,
and planning for the future; while the latter dimension relates to skills like motivating others,
communicating one on one, as well as in small groups. This two-dimensional model of
leadership is similar to one identified by Humphrey (2002).

Consortium for Research on Emotional Intelligence in Organizations ( www.eiconsortium.org )
32
Although a positive relationship was found between the leadership ratings from
supervisors and staff, the association was weak and revealed considerable disagreement among
raters. There was also little agreement in leadership ability when the self-report leadership
ratings were correlated with supervisor and staff ratings. This pattern is consist with reports from
other researchers (Humphrey, 2002), and is further evidence for the common recommendation in
the leadership literature about the need to get leadership ratings from multiple individuals (e.g.,
supervisors as well as staff members).
Men and women were also compared on each of the leadership ratings (task-oriented
leadership, relationship-oriented leadership, and total leadership). Men and women did not differ
on any of the leadership ratings, regardless of whether supervisor, staff, or self-report ratings
were used. Individuals working in an elementary school also did not differ from those employed
at a secondary school on any of the leadership ratings. Principals, however, were rated higher
than vice-principals by their supervisors on task-oriented leadership, relationship-oriented
leadership, and total leadership. Vice-principals, on the other hand, were rated higher by their
staff on relationship-oriented leadership. These results are not surprising, since vice-principals
are often involved in more inter-personal activities with staff than principals.
The above average leadership group scored higher than the below average leadership
group on total EI and all four broad dimensions (intrapersonal, interpersonal, adaptability, and
stress management). However, the two groups did not differ on the general mood scale of the
EQ-i. This pattern of results was consistent regardless of gender, as well as whether the
individual worked in an elementary or secondary school, or was a principal or vice-principal.
The subscales of the dimensions that the leadership groups differed on were also
investigated. With regards to intrapersonal abilities, the above average leadership group scored

Consortium for Research on Emotional Intelligence in Organizations ( www.eiconsortium.org )
33
higher than the below average leadership group on the emotional self-awareness and self-
actualization subscales. The above average leadership group scored higher than the below
average leadership group on the empathy and interpersonal relationship subscales of the
interpersonal dimension but not on the social responsibility subscale. In investigating
adaptability skills it was revealed that the above average leadership group scored higher than the
below average leadership group on the flexibility and problem solving subscales. Finally, of the
two stress management subscales (stress tolerance and impulse control) the above average
leadership group only scored higher than the below average leadership group on the impulse
control subscale.
The EI and leadership findings are in line with past research on effective leadership. The
most effective leaders have a combination of both task-oriented leadership skills and
relationship-oriented leadership skills (Humphrey, 2002). Behaviours related to emotional self-
awareness, self-actualization and impulse control have been found to be important for task-
oriented leadership (Humphrey, 2002). Although empathy is likely key for relationship-oriented
leadership, it has also been shown to contribute to cognitive skills necessary in task-oriented
leadership (Humphrey, 2002; Wolff, Rescosolido, & Druskat, 2002). Another competency
necessary to facilitate relationship-oriented leadership is the ability to establish mutually
satisfying interpersonal relationships (George, 2000). Leadership positions often entail changing
demands, effective leaders are likely flexible in the way they behave and use their emotions to
approach problems and new situations (George, 2000). Skills related to flexibility and problem
solving have been indicated as important for both task- and relationship-oriented leadership
(George, 2000).

Consortium for Research on Emotional Intelligence in Organizations ( www.eiconsortium.org )
34
5.2 Recommendations
When evaluating leadership abilities multiple perspectives should be employed (e.g.
supervisor and staff ratings), since different raters may offer quite different points-of-view.
Although total emotional intelligence was a significant predictor of successful school
administration, some dimensions of emotional intelligence were better predictors than others.
Specifically, the results of the present study suggest that professional development programs
would be wise to focus on promoting or developing the following abilities:
° emotional self-awareness (the ability to recognize and understand one’s feelings and
emotions);
° self-actualization (the ability to tap potential capacities and skills in order to improve
oneself);
° empathy (the ability to be attentive to, understand, and appreciate the feelings of
others);
° interpersonal relationships (the ability to establish and maintain mutually satisfying
relationships);
° flexibility (the ability to adjust one’s emotions, thoughts, and behaviors to changing
situations and conditions);
° problem solving (the ability to identify and define problems as well as to generate
potentially effective solutions);
° impulse control (to the ability to resist or delay emotional behaviors);
There were no differences on the critical EI dimensions when principals and vice-
principals were compared, as well as when supervisors working in an elementary school were

Consortium for Research on Emotional Intelligence in Organizations ( www.eiconsortium.org )
35
compared to individuals working in a secondary school. Therefore, professional development
programs that promote and develop these abilities can be used with a broad range of school
administrator (e.g., principals as well as vice-principals).
Boards are advised to consider the use of assessment tools for EI in professional
development programs, as part of the recruitment process for new school administrators, and in
the process of succession planning.

Consortium for Research on Emotional Intelligence in Organizations ( www.eiconsortium.org )
36
Table 1 Intercorrelations between self-reported and supervisor-rated leadership abilities. Self-Reported Supervisor-Rated
Task-Oriented
Relationship-Oriented
Total
Overall
Task-Oriented
.16**
.12*
.16**
.07
Relationship-Oriented .07 .16** .13* .03 Total .12* .16** .16** .06 Overall .16** .13* .16** .13*
Note: * p < .05; ** p < .01; N = 358 Table 2 Intercorrelations between self-reported and staff-rated leadership abilities. Self-Reported Staff-Rated
Task-Oriented
Relationship-Oriented
Total
Overall
Task-Oriented
.12*
.10
.12*
.10*
Relationship-Oriented .04 .13** .09 .06 Total .08 .13** .12* .09 Overall .07 .09 .09 .12*
Note: * p < .05; ** p < .01; N = 399 Table 3 Intercorrelations between staff-rated and supervisor-rated leadership abilities. Staff Rated Supervisor Rated
Task-Oriented
Relationship-Oriented
Total
Overall
Task-Oriented
.21***
.11*
.17**
.19***
Relationship-Oriented .15** .20*** .20*** .15** Total .20*** .18** .20*** .19*** Overall .23*** .23*** .25*** .26***
Note: * p < .05; ** p < .01; *** p < .001; N = 371.

Consortium for Research on Emotional Intelligence in Organizations ( www.eiconsortium.org )
37
Table 4 Intercorrelations for the EQ-i and self-reported leadership abilities. Self-Reported Leadership EQ-i scales
Task-Oriented
Relationship-Oriented
Total
Overall
Intrapersonal
.49
.32
.45
.37
Self-Regard .34 .22 .31 .27 Self-Awareness .33 .29 .34 .25
Assertiveness .41 .23 .37 .35 Independence .43 .22 .37 .37
Self-Actualization .37 .25 .35 .22 Interpersonal .39 .40 .44 .26
Empathy .34 .44 .44 .22 Social Responsibility .27 .35 .34 .14**
Interpersonal Relation .37 .31 .38 .27 Adaptability .46 .40 .48 .32
Reality Testing .38 .31 .39 .23 Flexibility .32 .25 .32 .28
Problem Solving .41 .41 .45 .26 Stress Management .28 .33 .34 .24
Stress Tolerance .36 .31 .37 .31 Impulse Control .12* .24 .20 .10*
General Mood .38 .25 .36 .29 Optimism .41 .25 .37 .32
Happiness .30 .22 .29 .21 Total EI .50 .41 .51 .37
Note: * p < .05; ** p < .01; All other correlations are significant at p < .001; N = 412

Consortium for Research on Emotional Intelligence in Organizations ( www.eiconsortium.org )
38
Table 5 Intercorrelations for the EQ-i and supervisor-rated leadership abilities. Supervisor-Rated Leadership EQ-i scales
Task-Oriented
Relationship- Oriented
Total
Overall
Intrapersonal
.13*
.01
.07
.14**
Self-Regard .02 -.00 .01 .06 Self-Awareness .18*** .07 .13* .20***
Assertiveness .10* -.03 .04 .08 Independence .06 -.05 .00 .06
Self-Actualization .11* .04 .08 .13* Interpersonal .15** .11* .14** .18**
Empathy .14** .12* .14** .13** Social Responsibility .15** .08 .12* .11*
Interpersonal Relation .13* .08 .11* .18*** Adaptability .11* .04 .08 .08
Reality Testing .07 .02 .05 .03 Flexibility .07 .01 .04 .07
Problem Solving .13* .07 .11* .08 Stress Management .11* .12* .12* .10*
Stress Tolerance .10* .06 .09 .11* Impulse Control .08 .13* .12* .05
General Mood .08 .03 .06 .12* Optimism .08 .00 .04 .09
Happiness .07 .04 .06 .12* Total EI .14** .06 .11* .14**
Note: * p < .05, ** p < .01, *** p < .001; N = 383

Consortium for Research on Emotional Intelligence in Organizations ( www.eiconsortium.org )
39
Table 6 Intercorrelations for the EQ-i and staff-rated leadership abilities. Staff-Rated Leadership EQ-i scales
Task-Oriented
Relationship-Oriented
Total
Overall
Intrapersonal
.18***
.05
.12*
.15**
Self-Regard .07 .03 .05 .09 Self-Awareness .19*** .07 .14** .17***
Assertiveness .17*** -.01 .08 .12* Independence .14** .02 .08 .09
Self-Actualization .12* .05 .09 .09 Interpersonal .21*** .15** .20*** .20***
Empathy .23*** .20*** .23*** .21*** Social Responsibility .18*** .14** .17*** .12*
Interpersonal Relation .18*** .09 .15** .18*** Adaptability .14** .10* .13** .12*
Reality Testing .12* .12* .13** .12* Flexibility .06 .04 .05 .07
Problem Solving .16** .09 .13** .10* Stress Management .09 .09 .10* .08
Stress Tolerance .12* .05 .09 .11* Impulse Control .04 .11* .09 .03
General Mood .15** .09 .13** .15** Optimism .14** .05 .10* .12*
Happiness .13** .11* .13** .14** Total EI .19*** .11* .16** .17***
Note: * p < .05, ** p < .01, *** p < .001; N = 434

Consortium for Research on Emotional Intelligence in Organizations ( www.eiconsortium.org )
40
Table 7 Significant predictors of self-reported leadership abilities. Criterion
Predictors
SE
β
sr
t
p
Task-Oriented
Gender .045 .105 .098 2.34 < .05 Intrapersonal .076 .308 .170 4.05 .000 Interpersonal .062 .139 .094 2.23 < .05 Adaptability .075 .257 .144 3.43 .001
F (9, 398) = 18.71, p < .000, R2 = .297, adj. R2 = .281 Relationship-Oriented
Gender .046 .175 .163 3.76 .000 Interpersonal .064 .394 .266 6.13 .000 Adaptability .077 .247 .139 3.20 < .01 Mood .070 .175 .108 2.50 < .05
F (9, 398) = 14.94, p < .000, R2 = .253, adj. R2 = .236
Total
Gender .044 .155 .144 3.48 .001 Intrapersonal .075 .168 .093 2.24 < .05 Interpersonal .061 .291 .196 4.74 .000 Adaptability .074 .282 .158 3.82 .000
F (9, 398) = 0.45, p < .000, R2 = .316, adj. R2 = .301

Consortium for Research on Emotional Intelligence in Organizations ( www.eiconsortium.org )
41
Table 8 Significant predictors of supervisor-rated leadership abilities. Criterion
Predictors
SE
β
sr
t
p
Task-Oriented
Position .056 .188 .1701 3.35 .001
F (9, 358) = 3.10, p < .001, R2 = .072, adj. R2 = .049 Relationship-Oriented
Interpersonal .077 .205 .137 2.66 < .01 Stress Man. .073 .148 .105 2.03 < .05 Position .057 .125 .114 2.20 < .05
F (9, 358) = 1.82, p = .06, R2 = .044, adj. R2 = .020
Total
Interpersonal .077 .191 .128 2.50 < .05 Position .057 .169 .153 2.98 < .01
F (9, 358) = 2.39, p < .01, R2 = .057, adj. R2 = .033

Consortium for Research on Emotional Intelligence in Organizations ( www.eiconsortium.org )
42
Table 9 Significant predictors of staff-rated leadership abilities. Criterion
Predictors
SE
β
sr
t
p
Task-Oriented
Interpersonal .072 .157 .107 2.17 < .05
F (9, 391) = 2.20, p < .05, R2 = .048, adj. R2 = .026 Relationship-Oriented
Intrapersonal .088 .203 .114 2.31 < .05 Interpersonal .072 .187 .128 2.60 < .01 Position .054 .140 .127 2.59 < .01
F (9, 391) = 2.42, p < .01, R2 = .053, adj. R2 = .031
Total
Interpersonal .072 .194 .135 2.67 < .01
F (9, 391) = 1.91, p < .05, R2 = .042, adj. R2 = .020
Consortium for Research on Emotional Intelligence in Organizations ( www.eiconsortium.org )
43
Table 10 Means (standard deviations) for the EQ-i scales and subscales by above and below average groups (based on self-report leadership ability). Below Average
(N = 77) Mean (SD)
Above (N = 93) Mean (SD)
Intrapersonal
100.2 (9.89)
115.3 (7.61)
Self-Regard 97.7 (10.17) 107.5 (8.34) Self-Awareness 100.0 (13.31) 114.2 (10.31)
Assertiveness 100.5 (10.74) 113.7 (10.63) Independence 103.2 (11.17) 114.0 (8.44)
Self-Actualization 100.3 (11.66) 111.6 (6.06) Interpersonal
97.6 (11.73)
113.3 (6.94)
Empathy 100.1 (11.82) 116.1 (7.44) Social Responsibility 100.5 (10.58) 110.2 (6.54)
Interpersonal Relation 94.9 (12.92) 110.6 (8.48) Adaptability
100.0 (10.69)
115.7 (8.23)
Reality Testing 101.7 (10.20) 113.8 (8.39) Flexibility 98.3 (11.93) 110.6 (10.28)
Problem Solving 99.7 (10.34) 114.4 (8.39) Stress Management
101.9 (9.75)
112.6 (9.22)
Stress Tolerance 102.5 (10.24) 114.2 (8.32) Impulse Control 101.3 (12.12) 108.3 (10.48)
General Mood
99.6 (9.91)
111.1 (6.48)
Optimism 101.3 (9.03) 112.0 (6.83) Happiness 99.0 (12.66) 109.9 (7.03)
Total EI
100.0 (10.07)
116.6 (7.17)

Consortium for Research on Emotional Intelligence in Organizations ( www.eiconsortium.org )
44
Table 11 Means (standard deviations) for the EQ-i scales and subscales by above and below average groups (based on supervisor rated leadership ability). Below Average
(N = 78) Mean (SD)
Above (N = 77)
Mean (SD) Intrapersonal
105.9 (10.00)
106.1 (11.69)
Self-Regard 102.1 (10.82) 100.9 (11.38) Self-Awareness 105.2 (13.51) 108.6 (13.45)
Assertiveness 105.5 (10.98) 104.1 (11.28) Independence 106.6 (9.15) 105.7 (10.88)
Self-Actualization 104.4 (9.82) 105.2 (11.63) Interpersonal
102.9 (11.49)
106.6 (11.40)
Empathy 105.6 (11.29) 109.2 (11.38) Social Responsibility 103.4 (9.97) 105.9 (10.00)
Interpersonal Relation 100.5 (13.17) 104.2 (12.57) Adaptability
106.4 (10.81)
107.2 (10.84)
Reality Testing 107.5 (10.42) 107.3 (10.26) Flexibility 102.9 (13.66) 103.1 (12.88)
Problem Solving 105.1 (11.88) 107.4 (9.72) Stress Management
105.0 (9.29)
107.2 (10.87)
Stress Tolerance 106.1 (9.65) 106.8 (11.72) Impulse Control 103.1 (10.78) 106.3 (11.60)
General Mood
104.1 (5.54)
104.0 (10.96)
Optimism 105.6 (9.79) 104.9 (9.66) Happiness 103.1 (10.76) 103.6 (12.38)
Total EI
106.1 (9.83)
107.4 (11.43)
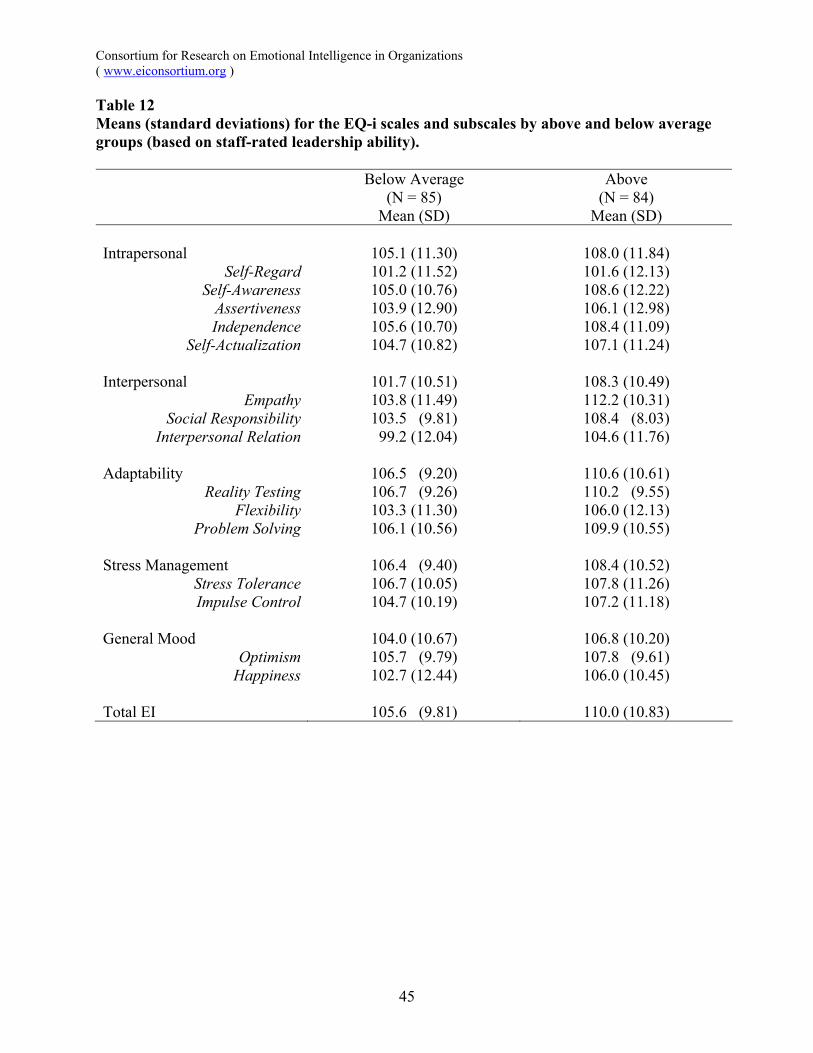
Consortium for Research on Emotional Intelligence in Organizations ( www.eiconsortium.org )
45
Table 12 Means (standard deviations) for the EQ-i scales and subscales by above and below average groups (based on staff-rated leadership ability).
Below Average (N = 85)
Mean (SD)
Above (N = 84)
Mean (SD) Intrapersonal
105.1 (11.30)
108.0 (11.84)
Self-Regard 101.2 (11.52) 101.6 (12.13) Self-Awareness 105.0 (10.76) 108.6 (12.22)
Assertiveness 103.9 (12.90) 106.1 (12.98) Independence 105.6 (10.70) 108.4 (11.09)
Self-Actualization 104.7 (10.82) 107.1 (11.24) Interpersonal
101.7 (10.51)
108.3 (10.49)
Empathy 103.8 (11.49) 112.2 (10.31) Social Responsibility 103.5 (9.81) 108.4 (8.03)
Interpersonal Relation 99.2 (12.04) 104.6 (11.76) Adaptability
106.5 (9.20)
110.6 (10.61)
Reality Testing 106.7 (9.26) 110.2 (9.55) Flexibility 103.3 (11.30) 106.0 (12.13)
Problem Solving 106.1 (10.56) 109.9 (10.55) Stress Management
106.4 (9.40)
108.4 (10.52)
Stress Tolerance 106.7 (10.05) 107.8 (11.26) Impulse Control 104.7 (10.19) 107.2 (11.18)
General Mood
104.0 (10.67)
106.8 (10.20)
Optimism 105.7 (9.79) 107.8 (9.61) Happiness 102.7 (12.44) 106.0 (10.45)
Total EI
105.6 (9.81)
110.0 (10.83)

Consortium for Research on Emotional Intelligence in Organizations ( www.eiconsortium.org )
46
Table 13 Means (standard deviations) for the EQ-i scales and subscales by above and below average groups (based on staff-rated leadership ability). Below Average
(N = 77) Mean (SD)
Above (N = 78)
Mean (SD) Intrapersonal
105.0 (10.97)
108.6 (10.67)
Self-Regard 101.5 (11.82) 103.2 (10.17) Self-Awareness 104.4 (13.52) 109.9 (13.11)
Assertiveness 104.4 (11.62) 105.9 (11.56) Independence 105.8 (9.68) 107.7 (10.44)
Self-Actualization 103.9 (9.95) 107.3 (10.49) Interpersonal
102.5 (11.32)
107.9 (10.17)
Empathy 105.0 (11.56) 111.1 (10.15) Social Responsibility 104.0 (9.80) 106.7 (8.99)
Interpersonal Relation 99.7 (12.70) 105.3 (12.01) Adaptability
105.7 (10.13)
109.5 (9.50)
Reality Testing 106.9 (9.98) 108.9 (9.65) Flexibility 102.5 (12.71) 106.0 (11.30)
Problem Solving 104.5 (11.45) 108.5 (9.28) Stress Management
105.6 (9.28)
109.8 (9.42)
Stress Tolerance 105.9 (10.11) 109.3 (11.00) Impulse Control 104.2 (10.33) 108.2 (10.86)
General Mood
104.5 (9.25)
107.2 (8.83)
Optimism 105.7 (9.13) 107.1 (8.94) Happiness 103.6 (9.90) 107.2 (8.83)
Total EI
105.6 (9.99)
110.2 (10.03)

Consortium for Research on Emotional Intelligence in Organizations ( www.eiconsortium.org )
47
Table 14 Classification results from a discriminant function analysis of above average vs. below average leadership groups (self-report ratings) using EQ-i subscales. Actual Status
N
Predicted Status
% Correct
Below Above Below Average
77
64
13
83.12
Above 93 9 84 90.32 Total
170
73
97
87.06
Table 15 Classification results from a discriminant function analysis of above average vs. below average leadership groups (supervisor ratings) using EQ-i subscales. Actual Status
N
Predicted Status
% Correct
Below Above Below Average
78
48
30
61.54
Above 77 30 47 61.04 Total
155
78
77
61.29

Consortium for Research on Emotional Intelligence in Organizations ( www.eiconsortium.org )
48
Table 16 Classification results from a discriminant function analysis of above average vs. below average leadership groups (staff ratings) using EQ-i subscales. Actual Status
N
Predicted Status
% Correct
Below Above Below Average
85
58
27
68.24
Above 84 23 61 72.62 Total
169
81
88
70.41
Table 17 Classification results from a discriminant function analysis of above average vs. below average leadership groups (combined supervisor and staff ratings) using EQ-i subscales. Actual Status
N
Predicted Status
% Correct
Below Above Below Average
77
51
26
66.23
Above 78 28 50 64.10 Total
155
79
76
65.16
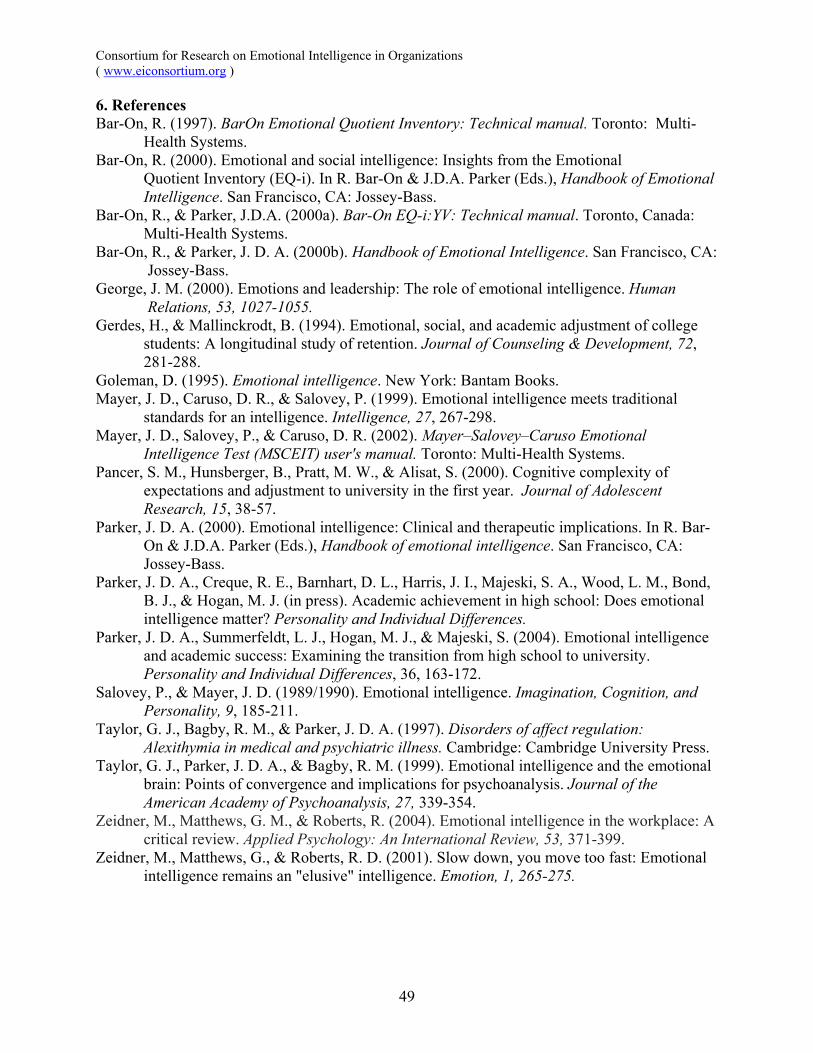
Consortium for Research on Emotional Intelligence in Organizations ( www.eiconsortium.org )
49
6. References Bar-On, R. (1997). BarOn Emotional Quotient Inventory: Technical manual. Toronto: Multi- Health Systems. Bar-On, R. (2000). Emotional and social intelligence: Insights from the Emotional
Quotient Inventory (EQ-i). In R. Bar-On & J.D.A. Parker (Eds.), Handbook of Emotional Intelligence. San Francisco, CA: Jossey-Bass.
Bar-On, R., & Parker, J.D.A. (2000a). Bar-On EQ-i:YV: Technical manual. Toronto, Canada: Multi-Health Systems. Bar-On, R., & Parker, J. D. A. (2000b). Handbook of Emotional Intelligence. San Francisco, CA:
Jossey-Bass. George, J. M. (2000). Emotions and leadership: The role of emotional intelligence. Human
Relations, 53, 1027-1055. Gerdes, H., & Mallinckrodt, B. (1994). Emotional, social, and academic adjustment of college
students: A longitudinal study of retention. Journal of Counseling & Development, 72, 281-288.
Goleman, D. (1995). Emotional intelligence. New York: Bantam Books. Mayer, J. D., Caruso, D. R., & Salovey, P. (1999). Emotional intelligence meets traditional
standards for an intelligence. Intelligence, 27, 267-298. Mayer, J. D., Salovey, P., & Caruso, D. R. (2002). Mayer–Salovey–Caruso Emotional Intelligence Test (MSCEIT) user's manual. Toronto: Multi-Health Systems. Pancer, S. M., Hunsberger, B., Pratt, M. W., & Alisat, S. (2000). Cognitive complexity of
expectations and adjustment to university in the first year. Journal of Adolescent Research, 15, 38-57.
Parker, J. D. A. (2000). Emotional intelligence: Clinical and therapeutic implications. In R. Bar- On & J.D.A. Parker (Eds.), Handbook of emotional intelligence. San Francisco, CA: Jossey-Bass.
Parker, J. D. A., Creque, R. E., Barnhart, D. L., Harris, J. I., Majeski, S. A., Wood, L. M., Bond, B. J., & Hogan, M. J. (in press). Academic achievement in high school: Does emotional intelligence matter? Personality and Individual Differences. Parker, J. D. A., Summerfeldt, L. J., Hogan, M. J., & Majeski, S. (2004). Emotional intelligence
and academic success: Examining the transition from high school to university. Personality and Individual Differences, 36, 163-172.
Salovey, P., & Mayer, J. D. (1989/1990). Emotional intelligence. Imagination, Cognition, and Personality, 9, 185-211.
Taylor, G. J., Bagby, R. M., & Parker, J. D. A. (1997). Disorders of affect regulation: Alexithymia in medical and psychiatric illness. Cambridge: Cambridge University Press.
Taylor, G. J., Parker, J. D. A., & Bagby, R. M. (1999). Emotional intelligence and the emotional brain: Points of convergence and implications for psychoanalysis. Journal of the American Academy of Psychoanalysis, 27, 339-354.
Zeidner, M., Matthews, G. M., & Roberts, R. (2004). Emotional intelligence in the workplace: A critical review. Applied Psychology: An International Review, 53, 371-399.
Zeidner, M., Matthews, G., & Roberts, R. D. (2001). Slow down, you move too fast: Emotional intelligence remains an "elusive" intelligence. Emotion, 1, 265-275.

Consortium for Research on Emotional Intelligence in Organizations ( www.eiconsortium.org )
50
Appendix 7.1
EQ-i Profiles

Consortium for Research on Emotional Intelligence in Organizations ( www.eiconsortium.org )
51
Figure 1 EQ-i profile for self-reported above average and average leadership groups (* p < .05).
949698
100102104106108110112114116118
*Self
-Reg
ard
*Self
-Aware
ness
*Asse
rtiven
ess
*Inde
pend
ence
*Self
-Actu
alizat
ion*E
mpathy
*Resp
onsib
ility
*Rela
tions
hip
*Real
ity Test
ing*F
lexibi
lity
*Prob
lem Solv
ing
*Stre
ss Tole
rance
*Impu
lse Con
trol
*Opti
mism*H
appin
ess
EQ-i Subscales
Above Average(n = 93)Below Average (n = 77)

Consortium for Research on Emotional Intelligence in Organizations ( www.eiconsortium.org )
52
Figure 2 EQ-i profile for supervisor rated above average and average leadership groups.
94
96
98
100
102
104
106
108
110
112
114
Self-R
egard
Self-A
warene
ssAsse
rtiven
essInd
epen
denc
e
Self-A
ctuali
zation
Empathy
Respon
sibilit
yRela
tions
hipReal
ity Test
ingFlex
ibility
Problem
Solving
Stress
Toleran
ceIm
pulse
Contro
lOpti
mismHap
piness
EQ-i Subscales
Above Average(n = 77)Below Average (n = 78)
Figure 3

Consortium for Research on Emotional Intelligence in Organizations ( www.eiconsortium.org )
53
EQ-i profile for staff rated above average and average leadership groups (* p < .05).
94
96
98
100
102
104
106
108
110
112
114
Self-R
egard
Self-A
warene
ssAsse
rtiven
essInd
epen
denc
e
Self-A
ctuali
zation
*Empa
thy*R
espon
sibilit
y*R
elatio
nship
*Real
ity Test
ingFlex
ibility
Problem
Solving
Stress
Toleran
ceIm
pulse
Contro
lOpti
mismHap
piness
EQ-i Subscales
Above Average(n = 84)Below Average (n = 85)
Figure 4 EQ-i profile for above average and average leadership groups based on supervisor and staff ratings (* p < .05).
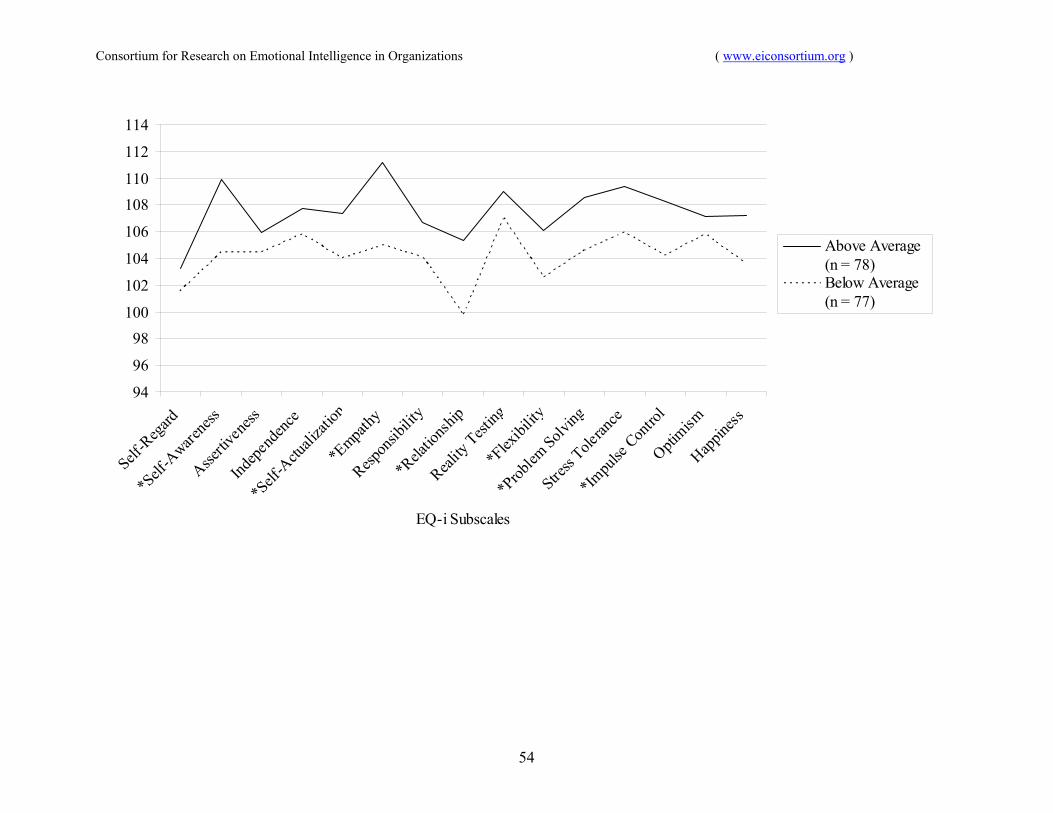
Consortium for Research on Emotional Intelligence in Organizations ( www.eiconsortium.org )
54
94
96
98100
102
104
106
108110
112
114
Self-R
egard
*Self
-Aware
ness
Assertiv
eness
Indep
ende
nce
*Self
-Actu
alizat
ion*E
mpathy
Respon
sibilit
y*R
elatio
nship
Reality
Testing
*Flex
ibility
*Prob
lem Solv
ing
Stress
Toleran
ce
*Impu
lse Con
trol
Optimism
Happin
ess
EQ-i Subscales
Above Average(n = 78)Below Average (n = 77)

Consortium for Research on Emotional Intelligence in Organizations ( www.eiconsortium.org )
55
Appendix 7.2
Leadership Questionnaires

Consortium for Research on Emotional Intelligence in Organizations ( www.eiconsortium.org )
56
7.2.1 Self-Report Questionnaire
Participants were asked to provide information about their current school and school
board, as well as their current and past positions (principal or vice-principal; elementary or
secondary). Participants were also asked to rate themselves on a 10-point scale from no
leadership ability to highest possible level of leadership ability. Finally, participants were asked
to rate themselves from 1 (very seldom true of me) to 5 (very often true of me) on the following
21 items:
1. I convey a clear vision for the school. 2. I encourage innovation in the workplace. 3. I clearly articulate performance expectations to staff. 4. I encourage ideas from staff members when solving problems. 5. I assist the staff in maintaining the direction needed to complete a task. 6. I seek consensus among staff members. 7. I am sensitive to the needs of people from different backgrounds. 8. I voice disagreement without creating unnecessary conflict. 9. I respond to others in a timely manner. 10. I avoid reaching quick conclusions and making snap decisions. 11. I communicate a clear rationale for my decisions. 12. I consider the long-term implications of a decision before taking action. 13. I come well prepared for meetings. 14. I monitor delegated responsibilities. 15. I present my thoughts and ideas clearly in one-to-one, small group, and formal presentations. 16. I generate enthusiasm in the workplace. 17. I express my ideas and thoughts clearly in writing. 18. I successfully manage resources to improve student and staff learning. 19. I motivate others to change behaviours that inhibit professional and organizational growth. 20. I respond to technological change in a positive manner. 21. I keep abreast of new developments in my profession.
7.2.2 Supervisor Rater and Staff Rater Questionnaires
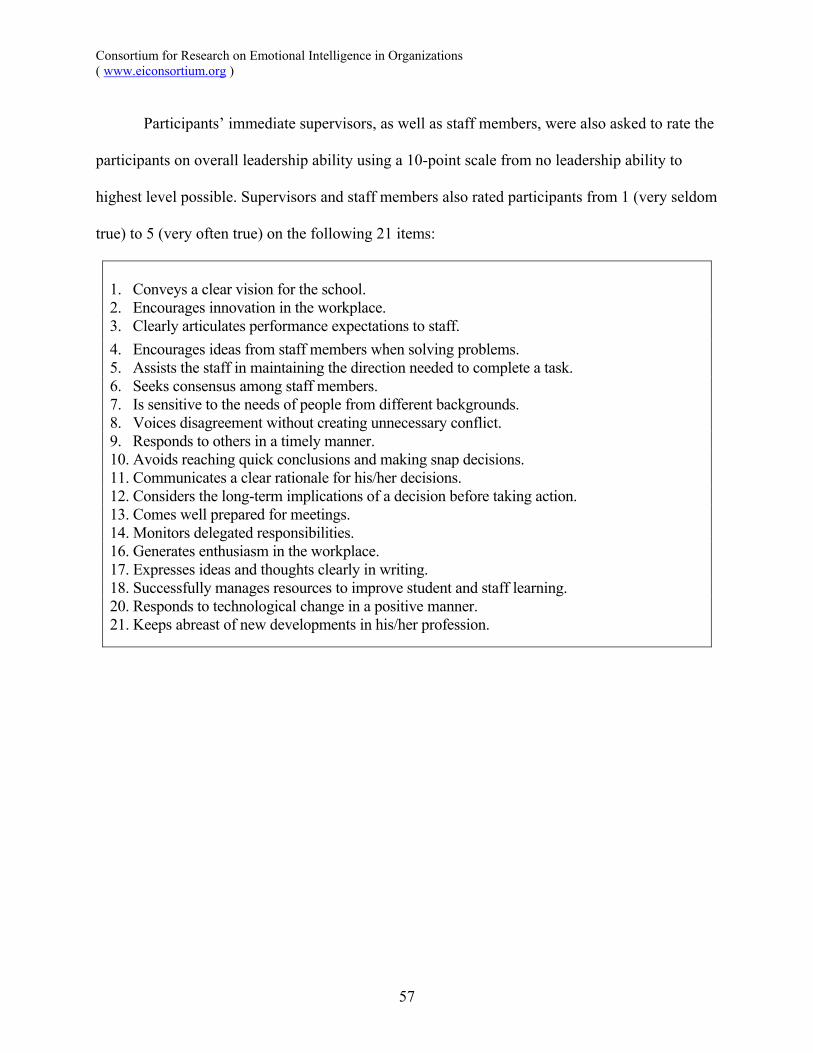
Consortium for Research on Emotional Intelligence in Organizations ( www.eiconsortium.org )
57
Participants’ immediate supervisors, as well as staff members, were also asked to rate the
participants on overall leadership ability using a 10-point scale from no leadership ability to
highest level possible. Supervisors and staff members also rated participants from 1 (very seldom
true) to 5 (very often true) on the following 21 items:
1. Conveys a clear vision for the school. 2. Encourages innovation in the workplace. 3. Clearly articulates performance expectations to staff. 4. Encourages ideas from staff members when solving problems. 5. Assists the staff in maintaining the direction needed to complete a task. 6. Seeks consensus among staff members. 7. Is sensitive to the needs of people from different backgrounds. 8. Voices disagreement without creating unnecessary conflict. 9. Responds to others in a timely manner. 10. Avoids reaching quick conclusions and making snap decisions. 11. Communicates a clear rationale for his/her decisions. 12. Considers the long-term implications of a decision before taking action. 13. Comes well prepared for meetings. 14. Monitors delegated responsibilities. 16. Generates enthusiasm in the workplace. 17. Expresses ideas and thoughts clearly in writing. 18. Successfully manages resources to improve student and staff learning. 20. Responds to technological change in a positive manner. 21. Keeps abreast of new developments in his/her profession.