Report on the mapping of biomass value chains for improved ...
95
Project co-funded by the European Regional Development Fund Project of the Interreg Baltic Sea Region Programme 2014–2020 “Unlocking the Potential of Bio-based Value Chains in the Baltic Sea Region” Project Acronym: BalticBiomass4Value Project Number: #R095 Report on the mapping of biomass value chains for improved sustainable energy use in the Baltic Sea Region countries Mariusz Jerzy Stolarski, Kazimierz Warmiński, Michał Krzyżaniak, Ewelina Olba- Zięty, Marta Akincza September, 2020
Transcript of Report on the mapping of biomass value chains for improved ...
Project co-funded by the European Regional Development Fund
Project of the Interreg Baltic Sea Region Programme 2014–2020
“Unlocking the Potential of Bio-based Value Chains in the Baltic Sea Region”
Project Acronym: BalticBiomass4Value
Project Number: #R095
Report on the mapping of biomass value chains for
improved sustainable energy use in the Baltic Sea
Region countries
Mariusz Jerzy Stolarski, Kazimierz Warmiński, Michał Krzyżaniak, Ewelina Olba-
Zięty, Marta Akincza
September, 2020

Project co-funded by the European Regional Development Fund
Preface
This report is an output of the implementation of Work Package 2, Group of Activities 2.2 “Mapping of
biomass value chains for improved sustainable energy use in the BSR countries” as specified in the latest
approved version of the Application Form of the BalticBiomass4Value project.
For the implementation of the BalticBiomass4Value project, grant is awarded from the European
Regional Development Fund under the Interreg Baltic Sea Region Programme 2014–2020.
The sole responsibility for the content of this publication lies with the authors. The European Regional
Development Fund is not responsible for any use that may be made of the information contained therein.
Information about the authors and other contributors:
Authors: Prof. dr. hab inż. Mariusz Jerzy Stolarski, University of Warmia and Mazury in Olsztyn,
Centre for Bioeconomy and Renewable Energies, Poland
Dr inż. Kazimierz Warmiński, University of Warmia and Mazury in Olsztyn, Centre for
Bioeconomy and Renewable Energies, Poland
Dr hab. inż. Michał Krzyżaniak, University of Warmia and Mazury in Olsztyn, Centre
for Bioeconomy and Renewable Energies, Poland
Dr Ewelina Olba-Zięty, University of Warmia and Mazury in Olsztyn, Centre for
Bioeconomy and Renewable Energies, Poland
Dr Marta Akincza, University of Warmia and Mazury in Olsztyn, Centre for
Bioeconomy and Renewable Energies, Poland
National
data
providers
and
reviewers:
LITHUANIA
• Vilija Aleknevičienė, Vytautas Magnus University
• Kęstutis Navickas, Vytautas Magnus University
• Virginija Kargytė, Vytautas Magnus University
LATVIA
• Arnis Lēnerts, Latvia University of Life Sciences and Technologies
ESTONIA
• Sandra Salom, Ministry of Rural Affairs of the Republic of Estonia
• Argo Peepson, Ministry of Rural Affairs of the Republic of Estonia
GERMANY
• Jannik Faustmann, State Agency for Agriculture, Environment and Rural Areas of
the German Federal State Schleswig-Holstein
POLAND
• Jakub Zięty, University of Warmia and Mazury in Olsztyn, Centre for Bioeconomy
and Renewable Energies
• Michał Krzykowski, University of Warmia and Mazury in Olsztyn, Centre for
Bioeconomy and Renewable Energies
• Stanisław Czachorowski, University of Warmia and Mazury in Olsztyn, Centre for
Bioeconomy and Renewable Energies
Project co-funded by the European Regional Development Fund
SWEDEN:
• Henrik Barth, Halmstad University
NORWAY
• Lampros Lamprinakis, Norwegian Institute of Bioeconomy Research
• Birger Vennesland, Norwegian Institute of Bioeconomy Research
• Asbjørn Veidal, Norwegian Institute of Bioeconomy Research
Citation:
Stolarski M.J., Warmiński K., Krzyżaniak M., Olba–Zięty E., Akincza M. 2020. Bioenergy technologies
and biomass potential vary in northern European countries. Renewable and Sustainable Energy
Reviews, 133, 110238, https://doi.org/10.1016/j.rser.2020.110238
The general objective of this study was to map biomass resources and most commonly used bioenergy
technologies in Baltic Sea Region countries and to exchange information on best practices and
technologies between countries not only on bioenergy uses but also on additional value chains based on
biological resources. More specific aims were:
• to asses biomass potential and biomass logistics from different sources (agriculture, food and
feed industry, forestry, wood industry, municipal waste and sewage sludge, fishery),
• to asses biomass conversion technologies, including thermo-chemical, physico-chemical and
biological conversion used in BSR countries,
• to provide information about technological solutions (including pilot plants under
implementation experience) from different BSR countries and comparable/neighbouring
regions,
• to identify different technological solutions, technology readiness level and the best bioenergy
practices in bioenergy in BSR countries.
Project co-funded by the European Regional Development Fund
Contents
1. List of partners involved in a task implementation 5
2. List of figures 6
3. Assessment of biomass potential in selected sectors 8
3.1. General data on the use of areas in individual BSR countries 8
3.2. Characteristics of forest biomass area and potential 9
3.3. Characteristics of agricultural areas 10
3.4. Yields of the main groups of crops 10
3.4.1. Theoretical and technical potential of cereal and rapeseed straw 15
3.4.2. Biomass potential from dedicated perennial crops plantations 17
3.5. Population of main livestock and production potential of manure and slurry 19
3.6. Potential characteristics of municipal waste and sewage sludge 23
3.7. Fishery characteristics 25
3.8. Biomass potential from different sources in the BSR countries
based on results from BioBoost project 27
4. Documented good practice solutions for improved biomass value chains
in the BSR countries 28
4.1. General data on bioenergy 28
4.2. Pellets 30
4.3. Residential heat production 32
4.4. Heat and cool 35
4.5. Bioelectricity 38
4.6. Liquid biofuels 40
4.7. Biogas 43
4.8. Incineration plants 46
5. Catalogue of selected enabling technologies, covering energy and directly
connected other uses of biomass in BSR countries 47
5.1. Pros and cons of the biomass potential and technology of its use for energy 47
5.2. Integrated biorefineries as modern installations for cascade use of biomass 49
6. Conclusions 55
7. References 56 Appendix 1 59
Appendix 2 89

Project co-funded by the European Regional Development Fund 5
1 List of partners involved in a task implementation
Project coordinator:
• Vytautas Magnus University (Lithuania)
Project partners:
• Ministry of Energy of the Republic of Lithuania (Lithuania)
• Forest and Land Owners Association of Lithuania (Lithuania)
• Lithuanian Biotechnology Association (Lithuania)
• Vidzeme Planning Region (Latvia)
• Latvia University of Life Sciences and Technologies (Latvia)
• Ministry of Rural Affairs of the Republic of Estonia (Estonia)
• Estonian Chamber of Agriculture and Commerce (Estonia)
• Estonian University of Life Sciences (Estonia)
• Agency for Renewable Resources (FNR) (Germany)
• 3N Lower Saxony Network for Renewable Resources and Bioeconomy (Germany)
• State Agency for Agriculture, Environment and Rural Areas of Schleswig-Holstein (Germany)
• University of Warmia and Mazury in Olsztyn (Poland)
• Halmstad University (Sweden)
• Norwegian Institute of Bioeconomy Research (Norway)
• Norwegian University of Life Sciences (Norway)
• Municipal enterprise of the city of Pskov “Gorvodokanal” (Russian Federation)
For more information, please visit the project’s website: www.balticbiomass4value.eu
Project co-funded by the European Regional Development Fund 6
2 List of figures
Fig. 1. Characterisation of land use and populations in the Baltic Sea Region countries in 2017
Fig. 2. Forest area, forests available for wood supply and % of private forest ownership in 2017
Fig. 3. Fuel and industrial wood removals from forests and fuel wood import and export (including
wood for charcoal) in BSR countries in 2017
Fig. 4. Area cultivation of major agricultural crops in the BSR countries in 2017 (1000 ha)
Fig. 5. Major crop production in the BSR countries in 2017 (1000 Mg)
Fig. 6. Plants harvested green from arable land in the BSR countries in 2017 (1000 Mg)
Fig. 7. Cereals and oil seeds for the production of seed in the BSR countries in 2017 (1000 Mg)
Fig. 8. Root crops production in BSR countries in 2017 (1000 Mg)
Fig. 9. Vegetable production in the BSR countries in 2017 (1000 Mg)
Fig. 10. Fruit production in the BSR countries in 2017 (1000 Mg)
Fig. 11. Theoretical straw potential from cereals and oil seeds production in the BSR countries in
2017 (1000 Mg/year)
Fig. 12. Technical straw potential for energy purposes from cereals and oil seeds in the BSR
countries in 2017 (1000 Mg/year)
Fig. 13. Area cropped with perennial energy crops in the BSR countries in 2017 (ha)
Fig. 14. Theoretical potential of biomass from perennial energy crops in the BSR countries in 2017
(1000 Mg/year)
Fig. 15. Animals in the BSR countries in 2017 (1000 heads)
Fig. 16. Theoretical manure potential in the BSR countries in 2017 (1000 Mg/year)
Fig. 17. Theoretical slurry potential in the BSR countries in 2017 (1000 m3/year at 8-10% DM)
Fig. 18. Municipal waste by waste operation in the BSR countries in 2017 (1000 Mg/year)
Fig. 19. Sludge disposal from wastewater treatment plants in the BSR countries in 2015 (1000
Mg/year DM)
Fig. 20. Catches - major fishing areas and production from aquaculture excluding hatcheries and
nurseries in 2017 (Mg live weight) *data for 2016 (Mg)
Fig. 21. Estimated amount of processing waste (tonnes) and estimated potential of biogas
generation (ktoe/year) from aquatic biomass resources (imported fish & seafood, capture
fisheries and aquaculture)
Fig. 22. Technical biomass potential from different sources in the BSR countries based on the
results of project BioBoost (1000 Mg)
Fig. 23. Share of renewable energy in gross final energy consumption in BSR countries in 2017
and target for 2020 (%)
Fig. 24. Share of different types of renewable energy sources in gross inland consumption of total
renewable energy sources in BSR countries in 2017 (%)
Fig. 25. Pellet capacity, production and number of pellet manufacturing plants in the BSR countries
in 2017
Fig. 26. Pellet consumption in the BSR countries in 2017
Fig. 27. Pellet production and consumption in the BSR countries in 2017
Fig. 28. Pellet market map of the BSR countries in 2017
Fig. 29. Pellet market map of Poland
Fig. 30. Distribution of population by degree of urbanisation in the BSR countries in 2017
Project co-funded by the European Regional Development Fund 7
Fig. 31. Distribution of population by degree of urbanisation in the BSR countries in 2017
Fig. 32. Distribution of population by dwelling types in the BSR countries in 2017
Fig. 33. Residential Heat Production by Fuel in the BSR countries in 2017 (ktoe)
Fig. 34. Structure of residential heat production by fuel in the BSR countries in 2017 (%)
Fig. 35. Heating and cooling consumption compared with total final energy consumption in the
BSR countries in 2017
Fig. 36. Gross production of derived heat by type of fuels in the BSR countries in 2017
Fig. 37. Share of solid biomass, biogas, renewable waste and liquid biofuels in gross production
of derived bioheat in the BSR countries in 2017 (%)
Fig. 38. Derived bioheat in the BSR countries in 2017
Fig. 39. Gross electricity production in the BSR countries in 2017
Fig. 40. Bioelectricity in the BSR countries in 2017
Fig. 41. Share of solid biomass, biogas, renewable municipal waste and liquid biofuels in gross
electricity generation from biomass oraz udział bioelectricity in total gross electricity generation
in the BSR countries in 2017
Fig. 42. Biofuels Capacity in the BSR countries in 2017
Fig. 43. Liquid biofuels map in the BSR countries in 2017
Fig. 44. Primary bioethanol production and final energy consumption in the transport sector in
the BSR countries in 2017
Fig. 45. Primary biodiesel production and final energy consumption in the transport sector in the
BSR countries in 2017
Fig. 46. Biogas map in the BSR countries in 2017
Fig. 47. Feedstock use for biogas production (excluding landfill - expressed as a mass percentage)
in the BSR countries in 2017
Fig. 48. Primary energy production of biogas by biogas plant type in the BSR countries in 2017
Fig. 49. Gross final energy consumption from biogas by end-use in the BSR countries in 2017
Fig. 50. Incineration plants and renewable municipal waste for energy recovery and gross energy
consumption of renewable municipal waste in the BSR countries in 2017
Fig. 51. Biorefineries in the BSR in 2017
The detailed data presented on figures are shown in Appendix 1.
8
3 Assessment of biomass potential and logistics in selected sectors
3.1. General data on the use of areas in individual BSR countries
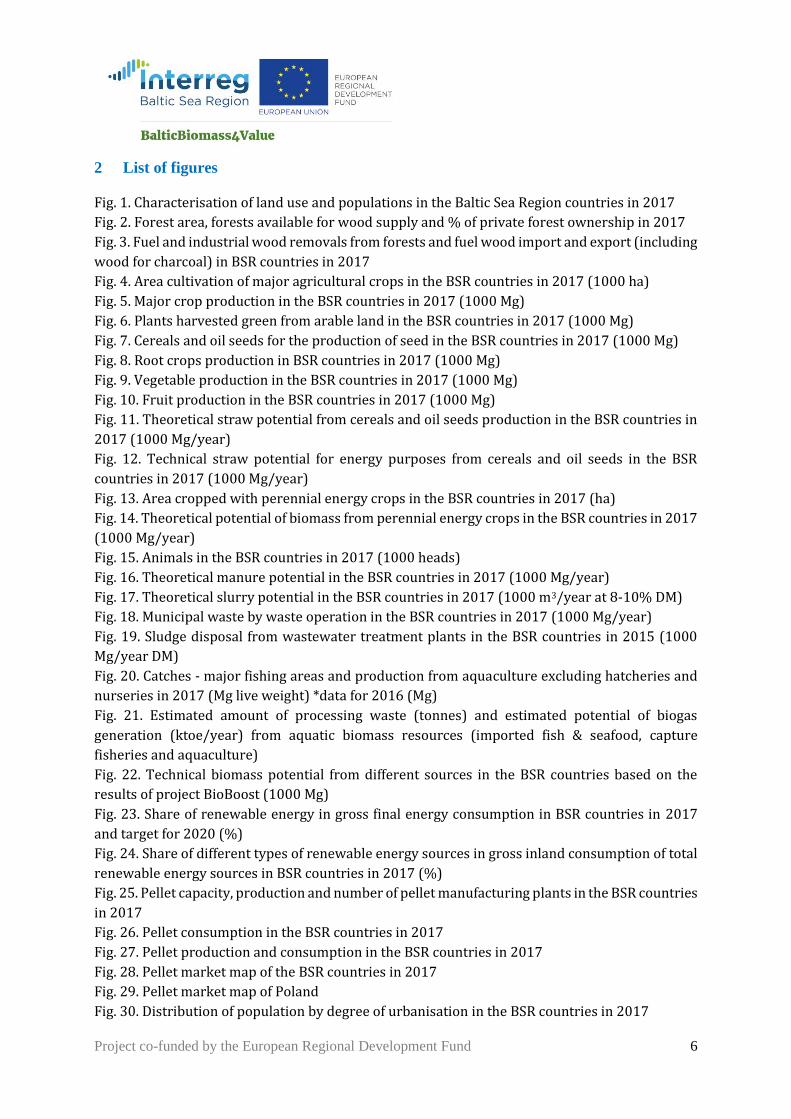
Analyses were made for 9 Baltic Sea Region (BSR) countries, including 8 which belong to the EU-
28: Denmark (DK), Germany (DE), Estonia (EE), Finland (FI), Latvia (LV), Lithuania (LT), Poland
(PL), Sweden (SE), and additionally Norway (NO), which does not belong to the EU-28. Based on
Eurostat data, it was concluded that these states are considerably varied in terms of the size,
structure of land use or population (Fig. 1). The largest of these states, covering nearly 45 million
ha, is Sweden, while Denmark is the smallest, having around 4.3 million ha. Generally, five BSR
countries (Germany, Finland, Poland, Sweden, Norway) are several-fold larger in size (over 30
million ha) than the other four states (Denmark, Estonia, Latvia, Lithuania). The largest population
(nearly 83 million people) lives in Germany. The second most populous country is Poland, with ca
38 million inhabitants, and Sweden comes in the third place, having a population of ca 10 million.
The population in the remaining six countries each does not exceed 6 million, and Estonia has the
smallest population, of just 1.3 million. The structure of land use in Estonia, Finland, Latvia and
Sweden shows the biggest share (over 50%) of woodlands. In Denmark, Germany, Lithuania and
Poland, the total area of cropland and grassland make up over 50%. In Norway, this corresponded
to 41% while in Sweden and Finland cropland and grassland corresponded to ca 10% of the total
area.
Fig. 1. Characterisation of land use and populations in the Baltic Sea Region countries in 2017 Source: Eurostat, 2019.
9
3.2. Characteristics of forest biomass area and potential
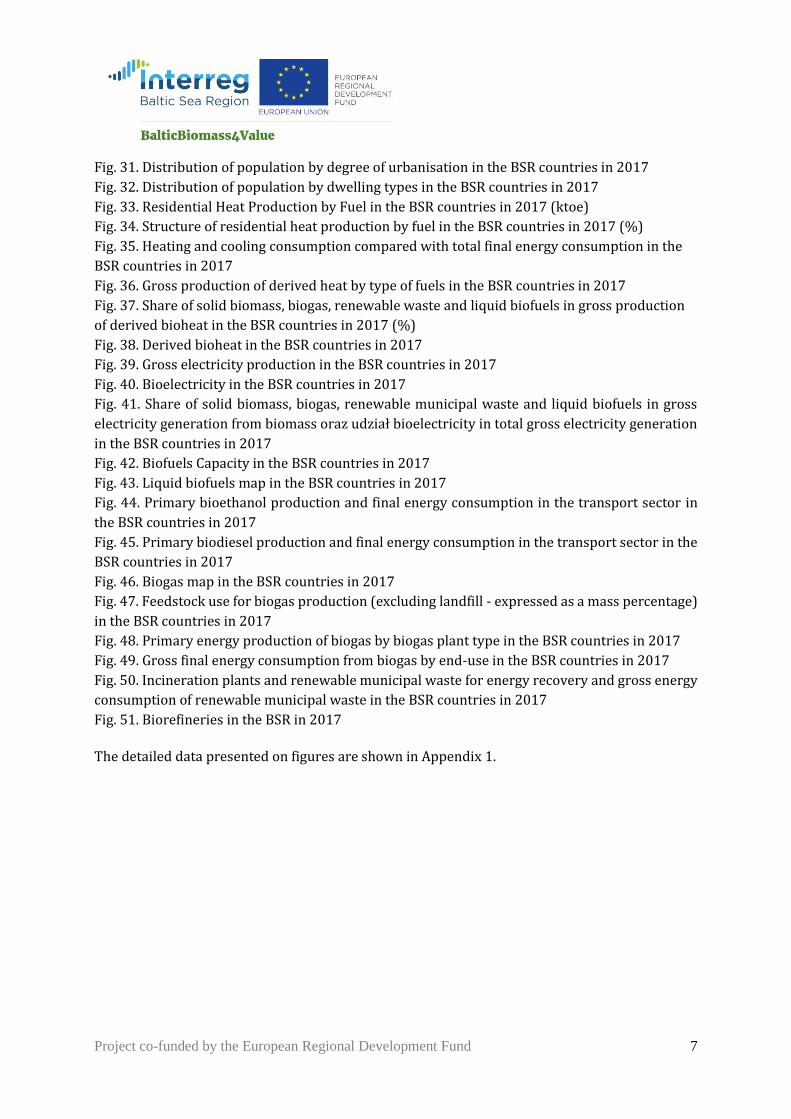
Description of the forest biomass production area and potential production was based on Eurostat
data, including such information as: area of forests, timber supply as well as timber export and
import [Eurostat, 2019]. Among the BSR countries, Sweden has the largest area covered with
forests, namely 28 million hectares (Fig. 2). In turn, the area of forests available for wood supply
in Sweden and Finland was over 19 million ha. The total area of forests in the BSR countries and
forests available for wood supply corresponded to 56.9% and 55.5% of respective values for the
entire EU-28. It needs to be emphasized that privately owned forests in Denmark, Sweden and
Finland represent at least 70% of the total woodland area. In Poland, just 18% are private forests,
while the remaining afforested area belongs to the state.
Fig. 2. Forest area, forests available for wood supply and % of private forest ownership in 2017
Source: Eurostat, 2019.
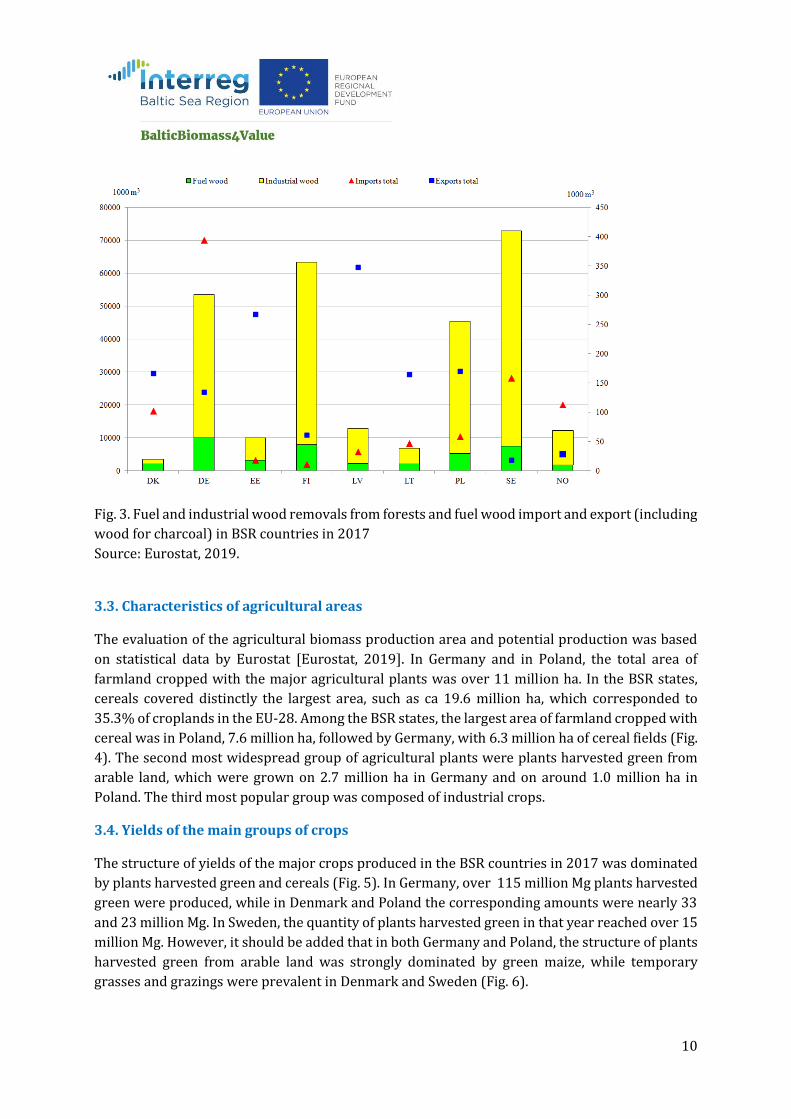
Among the BSR states, most roundwood (72.9 million m3/year) was harvested in Sweden,
followed by Finland, Germany and Poland: 63.3, 53.5 and 45.3 million m3, respectively (Fig. 3).
The amounts of harvested fuel wood were within 2 to nearly 10 million m3/year, in Lithuania and
Denmark, respectively. In total, the roundwood, fuel and industrial wood produced in the BSR
states corresponded to 59.6%, 38.4% and 66.0% of such types of wood produced in the EU-28,
respectively. It is justifiable to claim that the BSR states are the major source of wood in the EU-
28. The highest wood import, i.e. 394,000 m3 year–1, was noted in Germany (Fig. 3). The highest
export was found in Latvia, followed by Estonia.
10
Fig. 3. Fuel and industrial wood removals from forests and fuel wood import and export (including
wood for charcoal) in BSR countries in 2017
Source: Eurostat, 2019.
3.3. Characteristics of agricultural areas
The evaluation of the agricultural biomass production area and potential production was based
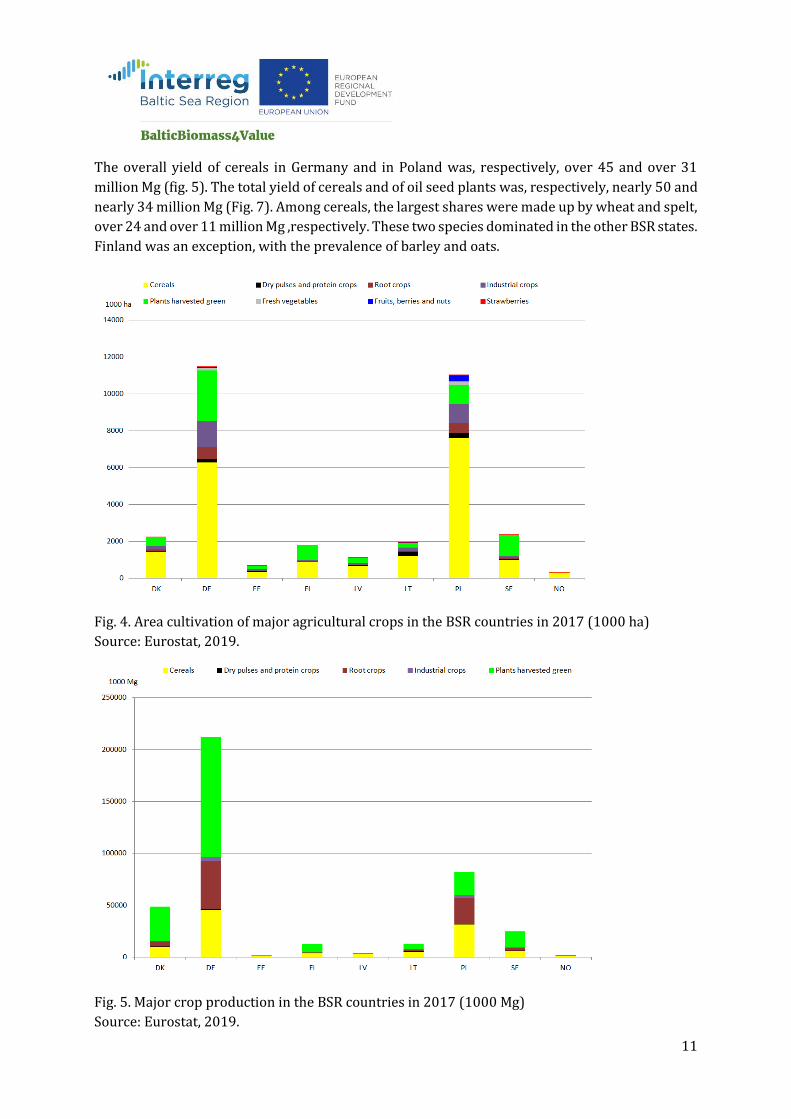
on statistical data by Eurostat [Eurostat, 2019]. In Germany and in Poland, the total area of
farmland cropped with the major agricultural plants was over 11 million ha. In the BSR states,
cereals covered distinctly the largest area, such as ca 19.6 million ha, which corresponded to
35.3% of croplands in the EU-28. Among the BSR states, the largest area of farmland cropped with
cereal was in Poland, 7.6 million ha, followed by Germany, with 6.3 million ha of cereal fields (Fig.
4). The second most widespread group of agricultural plants were plants harvested green from
arable land, which were grown on 2.7 million ha in Germany and on around 1.0 million ha in
Poland. The third most popular group was composed of industrial crops.
3.4. Yields of the main groups of crops
The structure of yields of the major crops produced in the BSR countries in 2017 was dominated
by plants harvested green and cereals (Fig. 5). In Germany, over 115 million Mg plants harvested
green were produced, while in Denmark and Poland the corresponding amounts were nearly 33
and 23 million Mg. In Sweden, the quantity of plants harvested green in that year reached over 15
million Mg. However, it should be added that in both Germany and Poland, the structure of plants
harvested green from arable land was strongly dominated by green maize, while temporary
grasses and grazings were prevalent in Denmark and Sweden (Fig. 6).
11
The overall yield of cereals in Germany and in Poland was, respectively, over 45 and over 31
million Mg (fig. 5). The total yield of cereals and of oil seed plants was, respectively, nearly 50 and
nearly 34 million Mg (Fig. 7). Among cereals, the largest shares were made up by wheat and spelt,
over 24 and over 11 million Mg ,respectively. These two species dominated in the other BSR states.
Finland was an exception, with the prevalence of barley and oats.
Fig. 4. Area cultivation of major agricultural crops in the BSR countries in 2017 (1000 ha)
Source: Eurostat, 2019.
Fig. 5. Major crop production in the BSR countries in 2017 (1000 Mg)
Source: Eurostat, 2019.

12
Fig. 6. Plants harvested green from arable land in the BSR countries in 2017 (1000 Mg)
Source: Eurostat, 2019.
Fig. 7. Cereals and oil seeds for the production of seed in the BSR countries in 2017 (1000 Mg)
Source: Eurostat, 2019.
13
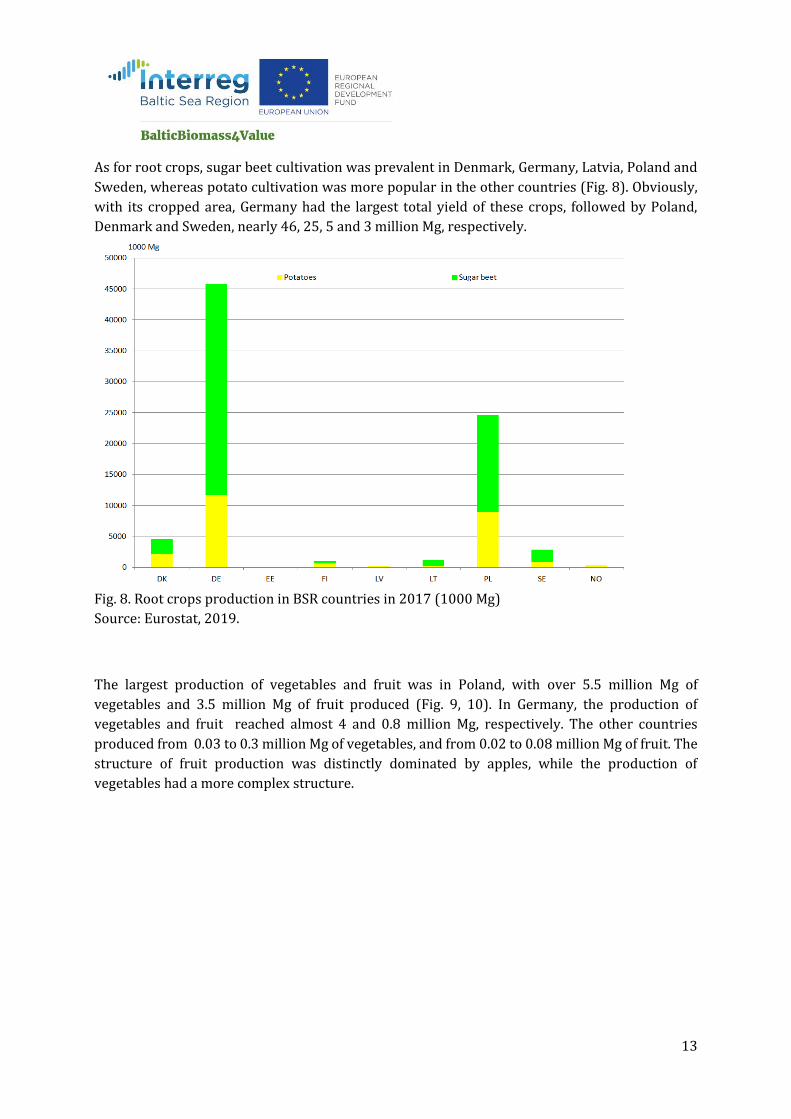
As for root crops, sugar beet cultivation was prevalent in Denmark, Germany, Latvia, Poland and
Sweden, whereas potato cultivation was more popular in the other countries (Fig. 8). Obviously,
with its cropped area, Germany had the largest total yield of these crops, followed by Poland,
Denmark and Sweden, nearly 46, 25, 5 and 3 million Mg, respectively.
Fig. 8. Root crops production in BSR countries in 2017 (1000 Mg)
Source: Eurostat, 2019.
The largest production of vegetables and fruit was in Poland, with over 5.5 million Mg of
vegetables and 3.5 million Mg of fruit produced (Fig. 9, 10). In Germany, the production of
vegetables and fruit reached almost 4 and 0.8 million Mg, respectively. The other countries
produced from 0.03 to 0.3 million Mg of vegetables, and from 0.02 to 0.08 million Mg of fruit. The
structure of fruit production was distinctly dominated by apples, while the production of
vegetables had a more complex structure.

14
Fig. 9. Vegetable production in the BSR countries in 2017 (1000 Mg)
Source: Eurostat, 2019.
Fig. 10. Fruit production in the BSR countries in 2017 (1000 Mg)
Source: Eurostat, 2019.

15
3.4.1. Theoretical and technical potential of cereal and rapeseed straw
The analyses included the area cropped with the following plant species as well as yields of grain
and seeds: wheat and spelt, rye and winter cereal mixtures, barley, oats, spring cereal mixtures,
grain maize and corn-cob-mix, triticale, other cereals and oilseeds - mainly rape seed. The
literature data demonstrate that the straw to grain ratio may vary highly, depending on the
species, cultivar, cultivation technology, climate and soil conditions, applied agronomic practice,
harvest technology, etc., and is comprised within the range of 0.5 to 1.5 [Pudełko et al., 2013;
Scarlet et al., 2010]. Thus, in order to determine the theoretical yield of straw in the BSR
countries, we assumed one averaged value of the straw to grain ratio, at 0.9. Next, the theoretical
straw potential was calculated from the product of cropped area, yield of grain of particular
species and the straw to grain ratio (0.9)
As a result of the above, the theoretical potential of cereal and oil plant straw was highly varied in
the BSR states. Theoretically, most straw from cultivation of cereals and oilseed plants was in
Germany and in Poland, approximately 45 and 30 million Mg/year, respectively (Fig. 11). In the
remaining BSR countries, this amount was dozen-fold or even several dozen-fold lower, which
was a direct consequence of the factors mentioned above. Considering the share of straw from
particular plant species, it was found that wheat straw dominated in seven of the BSR countries,
contributing from 34% to 71% of total straw yield, respectively in Poland and Latvia. In the other
BSR states the potential share of wheat straw was also quite large. However, in Germany and
Poland straw from triticale, maize and oil seeds made up a considerable share.
Fig. 11. Theoretical straw potential from cereals and oil seeds production in the BSR countries in
2017 (1000 Mg/year)
Source: own calculations.
16
When harvesting cereal or oil seed plants, it is impossible to collect all straw, for example because
of land relief or the set cutting height of a combine. There are also straw losses during harvest and
transport. Moreover, studies run in facilities equipped with straw-fired boilers have shown that
when straw potential is calculated on the basis of the straw to grain ratio the resulting potentially
available quantities of straw are overrated. Therefore, in our analysis we took into consideration
technical, practical possibilities of obtaining straw from production of cereals and oil seed plants,
which were assessed to be at a level of 60% (the 0.6 coefficient), to determine the technical
potential amount of straw that could be used for energy purposes. This meant that the average
technical yield of straw collected in the form of bales from a field corresponded to 60% of the mass
of collected grain [Gradziuk and Stolarski, 2009]. Moreover, straw is used as raw material in
animal production (both as feed and litter), and in mushroom production (as litter). It should also
be ploughed in and be returned to the soil in order to maintain its balance of organic matter, which
explains why not all straw is available for energy production. Hence, in our analysis it was
assumed that 25% of annual yield of straw can be dedicated to energy purposes so as avoid
detrimental effects on animal production, to maintain the soil organic matter balance and to
supply straw for other alternative uses.
In view of the above, the technical potential of straw available for energy purposes was calculated
from the product of the area cropped with the analysed plants, grain yields from individual plant
species, the straw to grain ratio (0.6) and the quantity of straw dedicated to energy purposes.
Thus, having considered the above factors, the technical potential of straw was six-fold lower than
the theoretical potential. It was comprised within a very broad range, from around 0.125 to nearly
7.5 million Mg/year, respectively in Norway and in Germany (Fig. 12). In Germany, nearly half of
straw was wheat straw. The technical potential of straw in Poland was high and equalled ca 5.1
million Mg/year, and in Denmark it reached about 1.6 million Mg/year, and the share of wheat
straw was 34 and 45%, respectively. In the other BSR states, the technical potential of all types of
straw was less than 1 million Mg/year. It needs to be added that the technical potential of straw
in all BSR countries analysed composed ca 34% of the potential in the whole EU-28.

17
Fig. 12. Technical straw potential for energy purposes from cereals and oil seeds in the BSR
countries in 2017 (1000 Mg/year)
Source: own calculations.
3.4.2. Biomass potential from dedicated perennial crops plantations
Dedicated perennial energy crops is another source of agricultural biomass. This group comprises
Short Rotation Coppice (SRC), grasses and herbaceous crops [Stolarski et. al., 2018]. The biomass
yield of dedicated perennial energy crops depends on several factors, such as: selection of an
appropriate species and variety, soil conditions, type and level of plant fertilising rates, climate
conditions, agritechnical treatments, planting density, frequency of plant harvest, and harvest
technology [Stolarski et al., 2019b, 2019c; Vanbeveren et al., 2017; Stolarski et al., 2015; Aronsson
et al., 2014; Larsen et al., 2014; Sevel et al., 2014; Serapiglia et al., 2013]. The above literature
references suggest that the potential of SRC yields can vary widely, and is in a range from a few to
a few dozens of Mg/ha/year DM (dry matter). However, technical yields obtained from
commercial plantations are always lower, and therefore in our analyses we assumed that an
average SCR yield was 7 Mg/ha/year DM [Stolarski et al., 2019a; Mola-Yudego et al., 2015]. Yields
of grasses can be highly varied as well, depending on the aforementioned factors [Stolarski et al.,
2018; Rancane et al., 2017; Iqbal et al., 2015; Monti et al., 2015; Pocienė et al., 2013, 2016].
Because of the geographical and climate conditions typical of the BSR countries (mostly in
18
northern Europe), average yields of grasses were assumed to be on the same level as those of SRC,
i.e. 7 Mg/ha/year DM. Thus, the technical potential of lignocellulose biomass from dedicated
perennial energy crops was calculated from the product of the area cropped with dedicated
perennial energy crops [Bioenergy Europe, 2018] and the average biomass yield of SRC and
grasses.
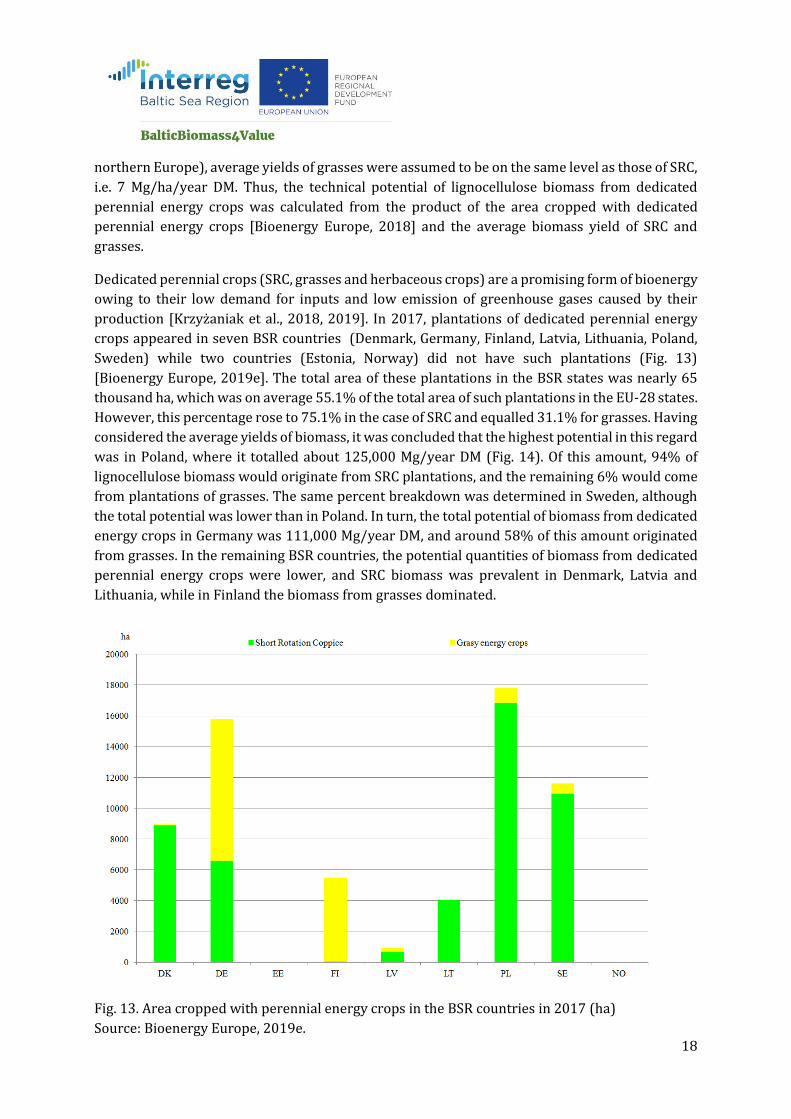
Dedicated perennial crops (SRC, grasses and herbaceous crops) are a promising form of bioenergy
owing to their low demand for inputs and low emission of greenhouse gases caused by their
production [Krzyżaniak et al., 2018, 2019]. In 2017, plantations of dedicated perennial energy
crops appeared in seven BSR countries (Denmark, Germany, Finland, Latvia, Lithuania, Poland,
Sweden) while two countries (Estonia, Norway) did not have such plantations (Fig. 13)
[Bioenergy Europe, 2019e]. The total area of these plantations in the BSR states was nearly 65
thousand ha, which was on average 55.1% of the total area of such plantations in the EU-28 states.
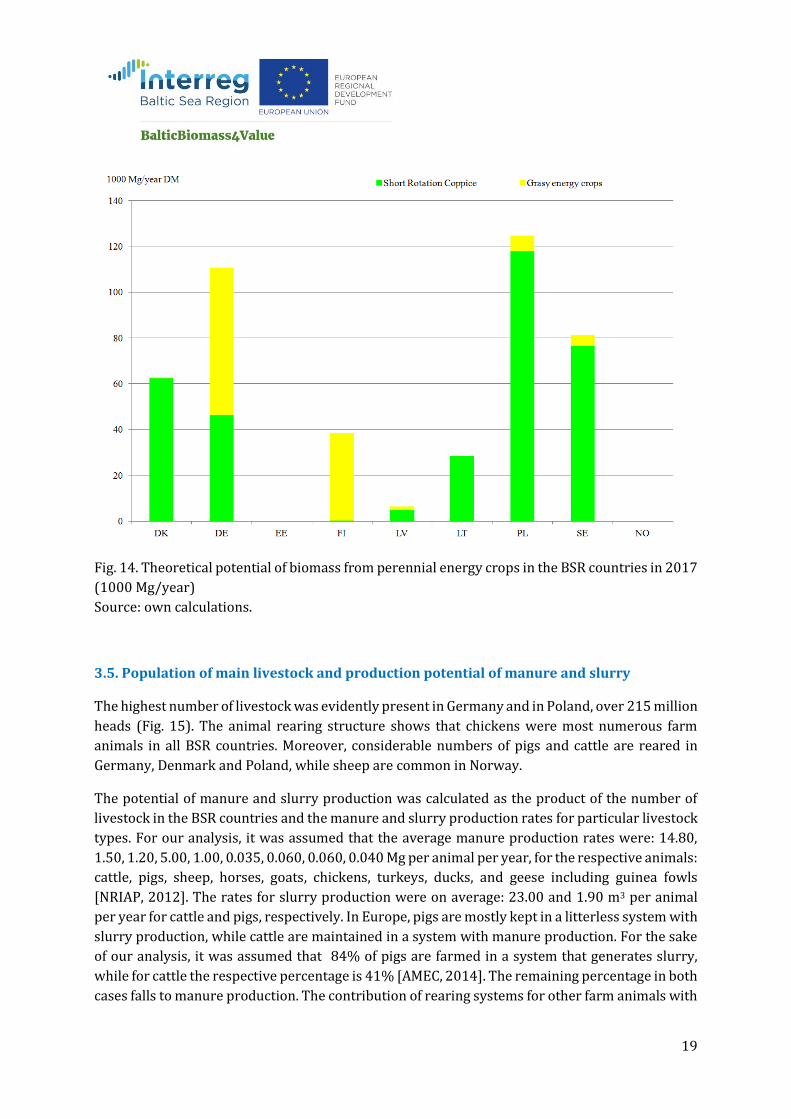
However, this percentage rose to 75.1% in the case of SRC and equalled 31.1% for grasses. Having
considered the average yields of biomass, it was concluded that the highest potential in this regard
was in Poland, where it totalled about 125,000 Mg/year DM (Fig. 14). Of this amount, 94% of
lignocellulose biomass would originate from SRC plantations, and the remaining 6% would come
from plantations of grasses. The same percent breakdown was determined in Sweden, although
the total potential was lower than in Poland. In turn, the total potential of biomass from dedicated
energy crops in Germany was 111,000 Mg/year DM, and around 58% of this amount originated
from grasses. In the remaining BSR countries, the potential quantities of biomass from dedicated
perennial energy crops were lower, and SRC biomass was prevalent in Denmark, Latvia and
Lithuania, while in Finland the biomass from grasses dominated.
Fig. 13. Area cropped with perennial energy crops in the BSR countries in 2017 (ha)
Source: Bioenergy Europe, 2019e.
19
Fig. 14. Theoretical potential of biomass from perennial energy crops in the BSR countries in 2017
(1000 Mg/year)
Source: own calculations.
3.5. Population of main livestock and production potential of manure and slurry
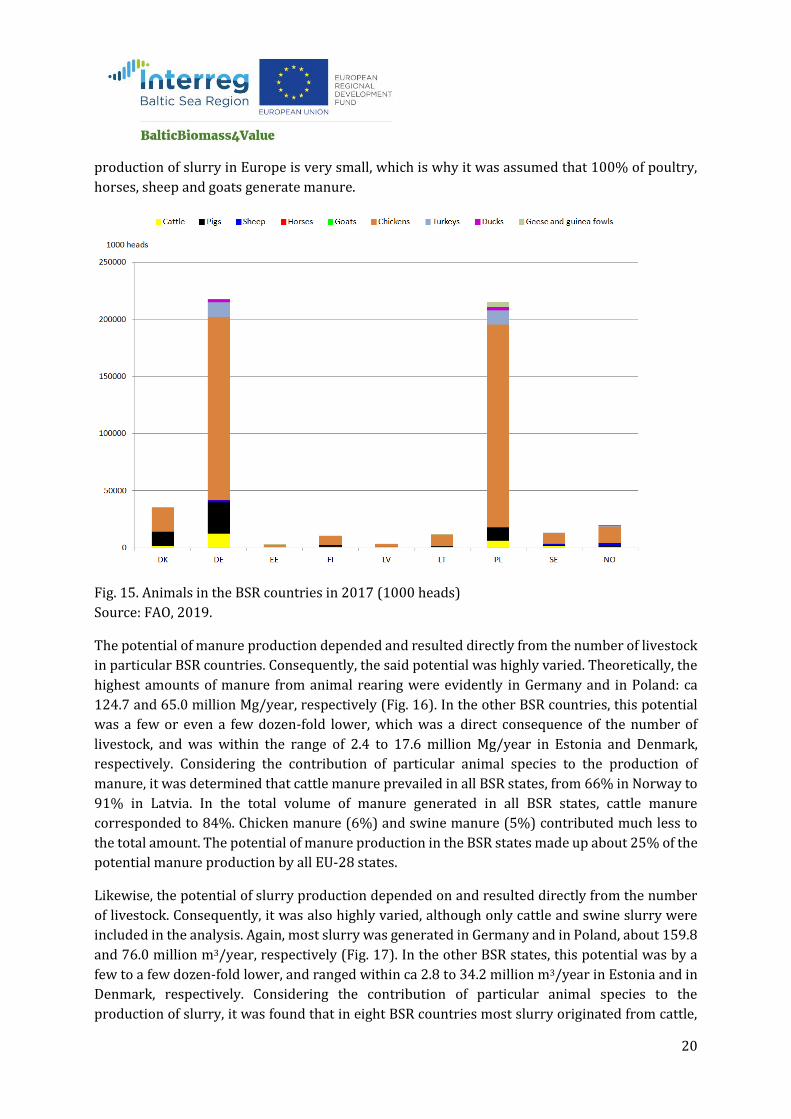
The highest number of livestock was evidently present in Germany and in Poland, over 215 million
heads (Fig. 15). The animal rearing structure shows that chickens were most numerous farm
animals in all BSR countries. Moreover, considerable numbers of pigs and cattle are reared in
Germany, Denmark and Poland, while sheep are common in Norway.
The potential of manure and slurry production was calculated as the product of the number of
livestock in the BSR countries and the manure and slurry production rates for particular livestock
types. For our analysis, it was assumed that the average manure production rates were: 14.80,
1.50, 1.20, 5.00, 1.00, 0.035, 0.060, 0.060, 0.040 Mg per animal per year, for the respective animals:
cattle, pigs, sheep, horses, goats, chickens, turkeys, ducks, and geese including guinea fowls
[NRIAP, 2012]. The rates for slurry production were on average: 23.00 and 1.90 m3 per animal
per year for cattle and pigs, respectively. In Europe, pigs are mostly kept in a litterless system with
slurry production, while cattle are maintained in a system with manure production. For the sake
of our analysis, it was assumed that 84% of pigs are farmed in a system that generates slurry,
while for cattle the respective percentage is 41% [AMEC, 2014]. The remaining percentage in both
cases falls to manure production. The contribution of rearing systems for other farm animals with
20
production of slurry in Europe is very small, which is why it was assumed that 100% of poultry,
horses, sheep and goats generate manure.
Fig. 15. Animals in the BSR countries in 2017 (1000 heads)
Source: FAO, 2019.
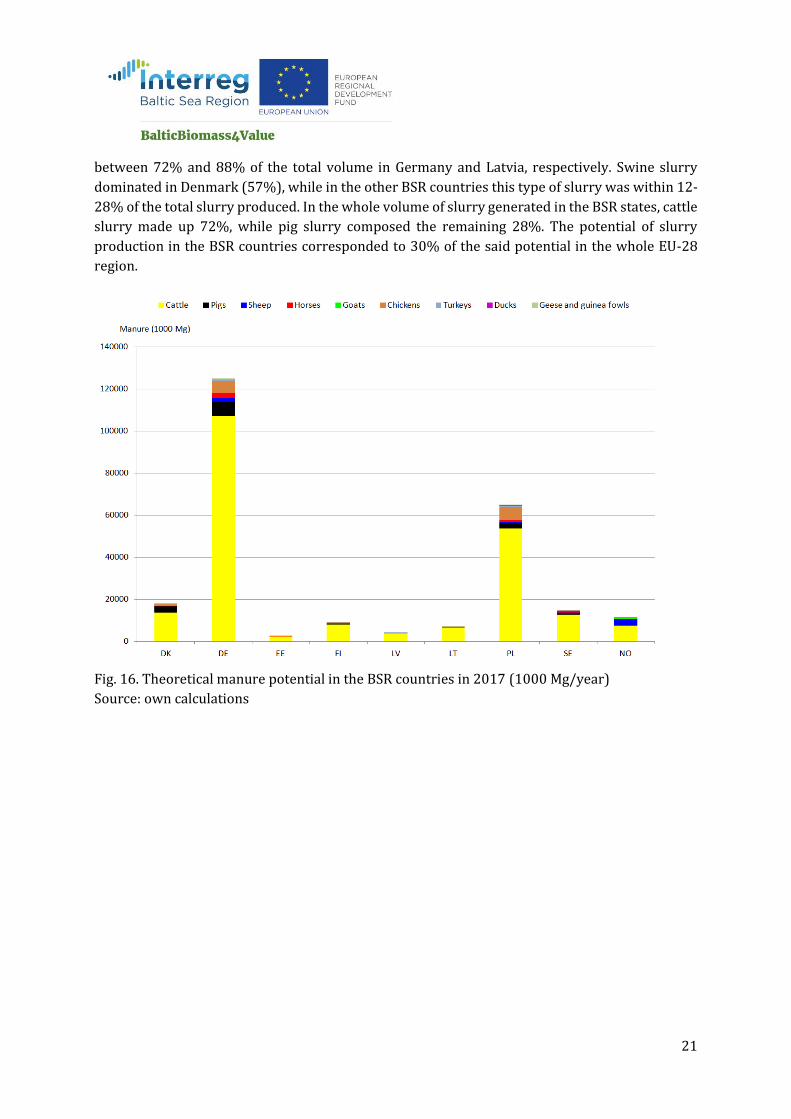
The potential of manure production depended and resulted directly from the number of livestock
in particular BSR countries. Consequently, the said potential was highly varied. Theoretically, the
highest amounts of manure from animal rearing were evidently in Germany and in Poland: ca
124.7 and 65.0 million Mg/year, respectively (Fig. 16). In the other BSR countries, this potential
was a few or even a few dozen-fold lower, which was a direct consequence of the number of
livestock, and was within the range of 2.4 to 17.6 million Mg/year in Estonia and Denmark,
respectively. Considering the contribution of particular animal species to the production of
manure, it was determined that cattle manure prevailed in all BSR states, from 66% in Norway to
91% in Latvia. In the total volume of manure generated in all BSR states, cattle manure
corresponded to 84%. Chicken manure (6%) and swine manure (5%) contributed much less to
the total amount. The potential of manure production in the BSR states made up about 25% of the
potential manure production by all EU-28 states.
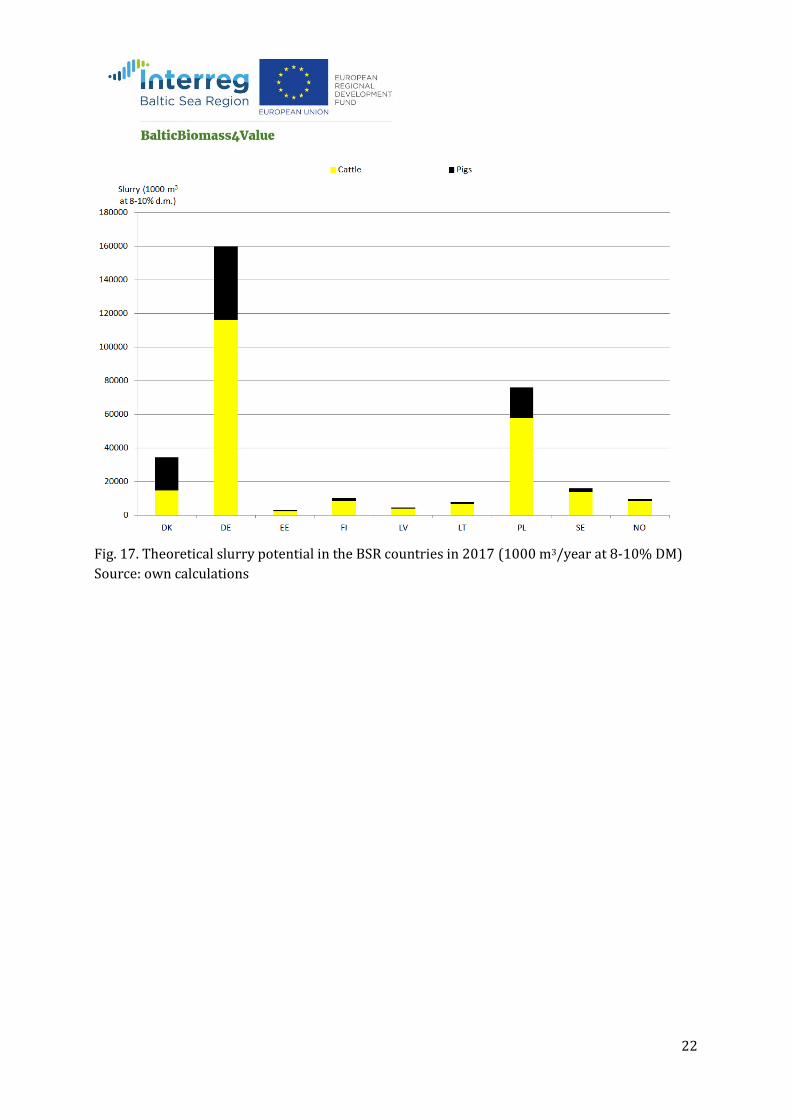
Likewise, the potential of slurry production depended on and resulted directly from the number
of livestock. Consequently, it was also highly varied, although only cattle and swine slurry were
included in the analysis. Again, most slurry was generated in Germany and in Poland, about 159.8
and 76.0 million m3/year, respectively (Fig. 17). In the other BSR states, this potential was by a
few to a few dozen-fold lower, and ranged within ca 2.8 to 34.2 million m3/year in Estonia and in
Denmark, respectively. Considering the contribution of particular animal species to the
production of slurry, it was found that in eight BSR countries most slurry originated from cattle,
21
between 72% and 88% of the total volume in Germany and Latvia, respectively. Swine slurry
dominated in Denmark (57%), while in the other BSR countries this type of slurry was within 12-
28% of the total slurry produced. In the whole volume of slurry generated in the BSR states, cattle
slurry made up 72%, while pig slurry composed the remaining 28%. The potential of slurry
production in the BSR countries corresponded to 30% of the said potential in the whole EU-28
region.
Fig. 16. Theoretical manure potential in the BSR countries in 2017 (1000 Mg/year)
Source: own calculations
22
Fig. 17. Theoretical slurry potential in the BSR countries in 2017 (1000 m3/year at 8-10% DM)
Source: own calculations
23
3.6. Potential characteristics of municipal waste and sewage sludge
The potential of municipal waste and sewage sludge was determined on the basis of Eurostat data
[Eurostat, 2019].
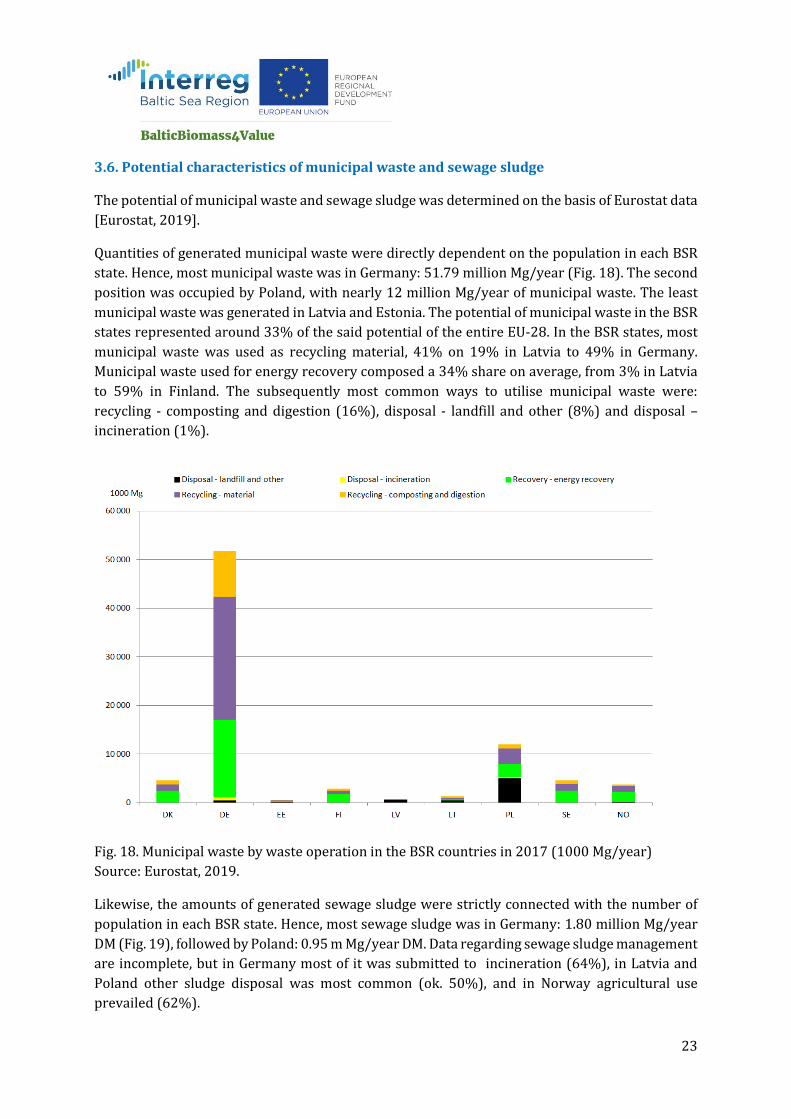
Quantities of generated municipal waste were directly dependent on the population in each BSR
state. Hence, most municipal waste was in Germany: 51.79 million Mg/year (Fig. 18). The second
position was occupied by Poland, with nearly 12 million Mg/year of municipal waste. The least
municipal waste was generated in Latvia and Estonia. The potential of municipal waste in the BSR
states represented around 33% of the said potential of the entire EU-28. In the BSR states, most
municipal waste was used as recycling material, 41% on 19% in Latvia to 49% in Germany.
Municipal waste used for energy recovery composed a 34% share on average, from 3% in Latvia
to 59% in Finland. The subsequently most common ways to utilise municipal waste were:
recycling - composting and digestion (16%), disposal - landfill and other (8%) and disposal –
incineration (1%).
Fig. 18. Municipal waste by waste operation in the BSR countries in 2017 (1000 Mg/year)
Source: Eurostat, 2019.
Likewise, the amounts of generated sewage sludge were strictly connected with the number of
population in each BSR state. Hence, most sewage sludge was in Germany: 1.80 million Mg/year
DM (Fig. 19), followed by Poland: 0.95 m Mg/year DM. Data regarding sewage sludge management
are incomplete, but in Germany most of it was submitted to incineration (64%), in Latvia and
Poland other sludge disposal was most common (ok. 50%), and in Norway agricultural use
prevailed (62%).

24
Fig. 19. Sludge disposal from wastewater treatment plants in the BSR countries in 2015 (1000
Mg/year DM)
Source: Eurostat, 2019.
25
3.7. Fishery characteristics
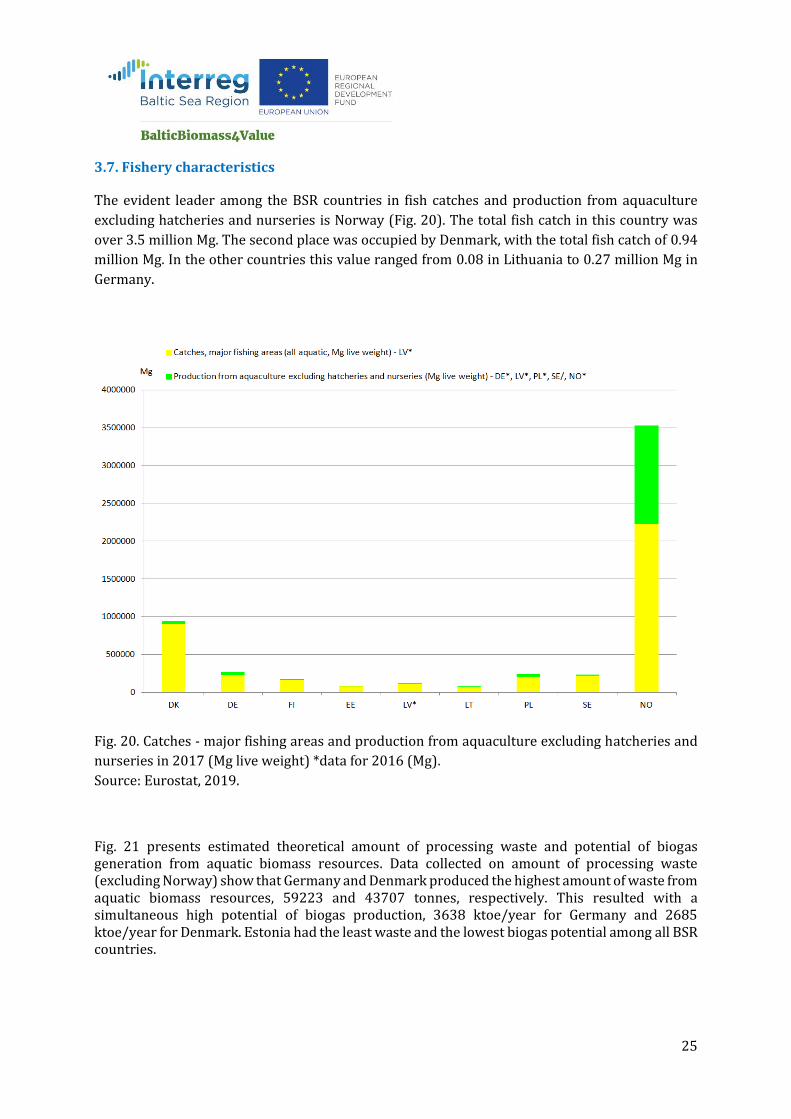
The evident leader among the BSR countries in fish catches and production from aquaculture
excluding hatcheries and nurseries is Norway (Fig. 20). The total fish catch in this country was
over 3.5 million Mg. The second place was occupied by Denmark, with the total fish catch of 0.94
million Mg. In the other countries this value ranged from 0.08 in Lithuania to 0.27 million Mg in
Germany.
Fig. 20. Catches - major fishing areas and production from aquaculture excluding hatcheries and
nurseries in 2017 (Mg live weight) *data for 2016 (Mg).
Source: Eurostat, 2019.
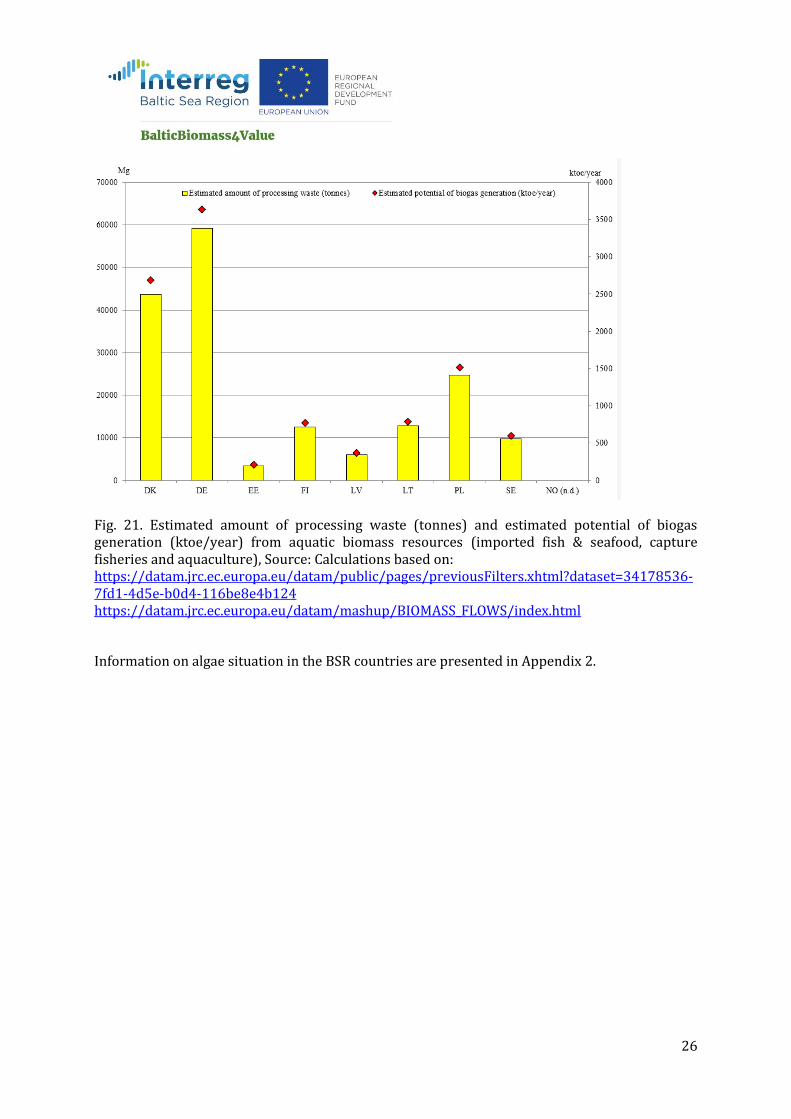
Fig. 21 presents estimated theoretical amount of processing waste and potential of biogas generation from aquatic biomass resources. Data collected on amount of processing waste (excluding Norway) show that Germany and Denmark produced the highest amount of waste from aquatic biomass resources, 59223 and 43707 tonnes, respectively. This resulted with a simultaneous high potential of biogas production, 3638 ktoe/year for Germany and 2685 ktoe/year for Denmark. Estonia had the least waste and the lowest biogas potential among all BSR countries.
26
Fig. 21. Estimated amount of processing waste (tonnes) and estimated potential of biogas generation (ktoe/year) from aquatic biomass resources (imported fish & seafood, capture fisheries and aquaculture), Source: Calculations based on: https://datam.jrc.ec.europa.eu/datam/public/pages/previousFilters.xhtml?dataset=34178536-7fd1-4d5e-b0d4-116be8e4b124 https://datam.jrc.ec.europa.eu/datam/mashup/BIOMASS_FLOWS/index.html
Information on algae situation in the BSR countries are presented in Appendix 2.
27
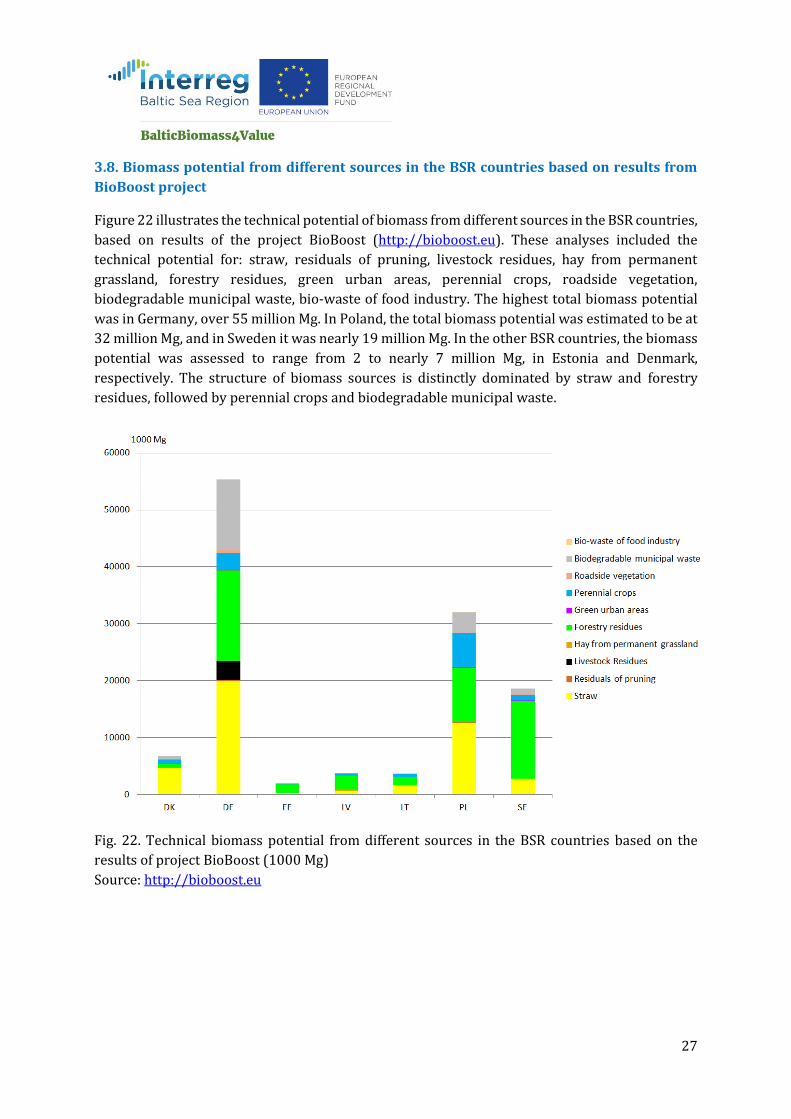
3.8. Biomass potential from different sources in the BSR countries based on results from
BioBoost project
Figure 22 illustrates the technical potential of biomass from different sources in the BSR countries,
based on results of the project BioBoost (http://bioboost.eu). These analyses included the
technical potential for: straw, residuals of pruning, livestock residues, hay from permanent
grassland, forestry residues, green urban areas, perennial crops, roadside vegetation,
biodegradable municipal waste, bio-waste of food industry. The highest total biomass potential
was in Germany, over 55 million Mg. In Poland, the total biomass potential was estimated to be at
32 million Mg, and in Sweden it was nearly 19 million Mg. In the other BSR countries, the biomass
potential was assessed to range from 2 to nearly 7 million Mg, in Estonia and Denmark,
respectively. The structure of biomass sources is distinctly dominated by straw and forestry
residues, followed by perennial crops and biodegradable municipal waste.
Fig. 22. Technical biomass potential from different sources in the BSR countries based on the
results of project BioBoost (1000 Mg)
Source: http://bioboost.eu

28
4. Documented good practice solutions for improved biomass value chains in the BSR
countries
4.1. General data on bioenergy
In 2017, renewable energy sources (RES) in the final energy consumption in the EU-28 countries
represented 17.5%, and this share is expected to reach 20% on average by the end of the year
2020. The highest contribution of RES among the BSR countries was noted in Norway (71.2%).
Moreover, in most BSR states, e.g. in Denmark, Estonia, Finland, Latvia, Lithuania and Sweden, this
contribution of RES was distinctly higher, at 25.8-54.5%. However, it was much lower in Poland
and Germany, at 10.9 and 15.8%, respectively (Fig. 23). It needs to be added that five of the BSR
states (DK, EE, FI, LT, SE) reached the RES share targeted for the year 2020.
Fig. 23. Share of renewable energy in gross final energy consumption in BSR countries in 2017
and target for 2020 (%)
Source: Eurostat, 2019.
Bioenergy plays a very important role in supply of renewable energy in most of the BSR countries
(Fig. 24). All bioenergy (all sectors: solid biomass, biogas, renewable municipal waste and liquid
biofuels) constituted 70% on average of all RES, although there were differences between the
countries, especially large with respect to Norway, which obtain most of energy from hydropower
plants. The highest share of all bioenergy in the RES structure was in Estonia (93.9%), followed
by Lithuania (88.8%), Poland (81.5%) and Finland (81.0%). In the other countries, this share was
within the range of 58.4 to 79.8% in Sweden and Latvia, respectively, while being as low as 11.5%
in Norway [Eurostat, 2019]. Among the different bioenergy sectors, the highest share was
contributed by solid biofuels, equal as much as 58.5% on average for all BSR countries. In the

29
particular countries, it ranged from 6.4 to 92.6% in Norway and Estonia, respectively (Fig. 24).
The second most important product in the bioenergy sector was biogas, contributing 4.3% on
average, with its smallest share in Norway (0.2% and the highest one in Germany (18.4%). In turn,
the share of liquid biofuels for transport, equal 4.1% on average in the RES structure, varied from
0.1% in Estonia to 7.9% in Sweden. The smallest contribution (3.2%) to the whole RES structure
in the BSR countries was achieved by renewable municipal waste. A relatively high share of the
utilisation of this waste for energy was found in Denmark and in Germany, 8.7 and 7.5%,
respectively.
Fig. 24. Share of different types of renewable energy sources in gross inland consumption of total
renewable energy sources in BSR countries in 2017 (%)
Source: Eurostat, 2019.
30
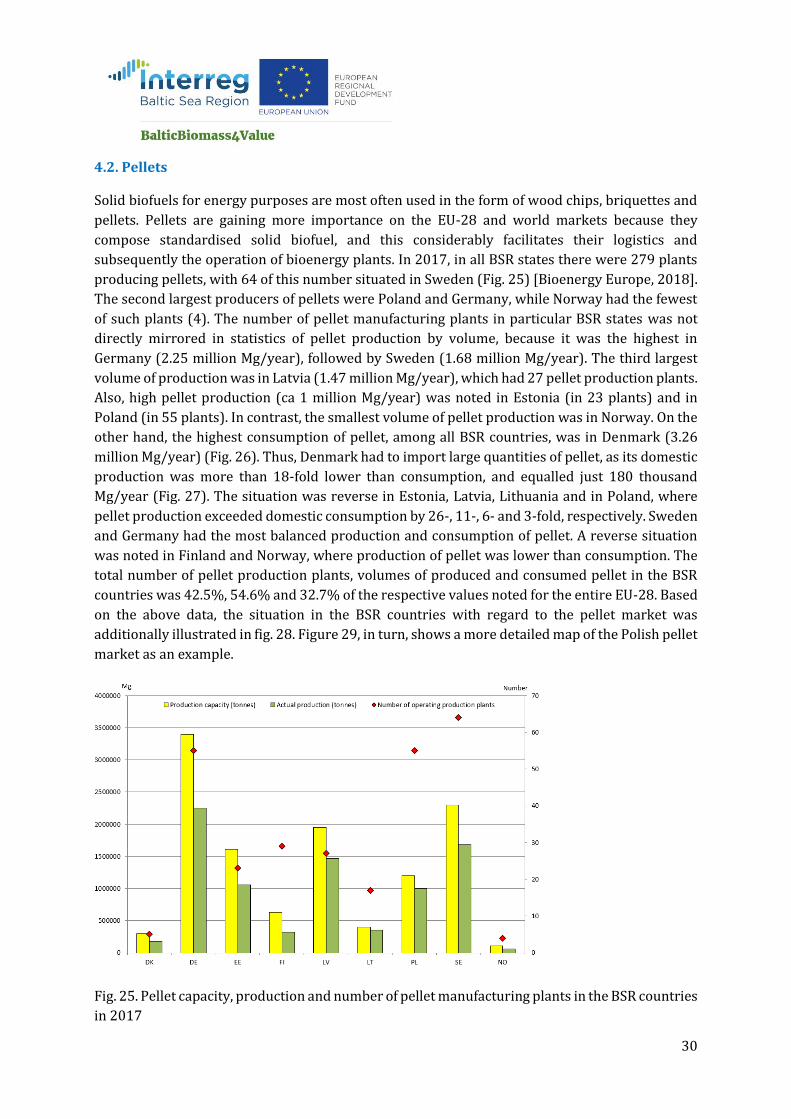
4.2. Pellets
Solid biofuels for energy purposes are most often used in the form of wood chips, briquettes and
pellets. Pellets are gaining more importance on the EU-28 and world markets because they
compose standardised solid biofuel, and this considerably facilitates their logistics and
subsequently the operation of bioenergy plants. In 2017, in all BSR states there were 279 plants
producing pellets, with 64 of this number situated in Sweden (Fig. 25) [Bioenergy Europe, 2018].
The second largest producers of pellets were Poland and Germany, while Norway had the fewest
of such plants (4). The number of pellet manufacturing plants in particular BSR states was not
directly mirrored in statistics of pellet production by volume, because it was the highest in
Germany (2.25 million Mg/year), followed by Sweden (1.68 million Mg/year). The third largest
volume of production was in Latvia (1.47 million Mg/year), which had 27 pellet production plants.
Also, high pellet production (ca 1 million Mg/year) was noted in Estonia (in 23 plants) and in
Poland (in 55 plants). In contrast, the smallest volume of pellet production was in Norway. On the
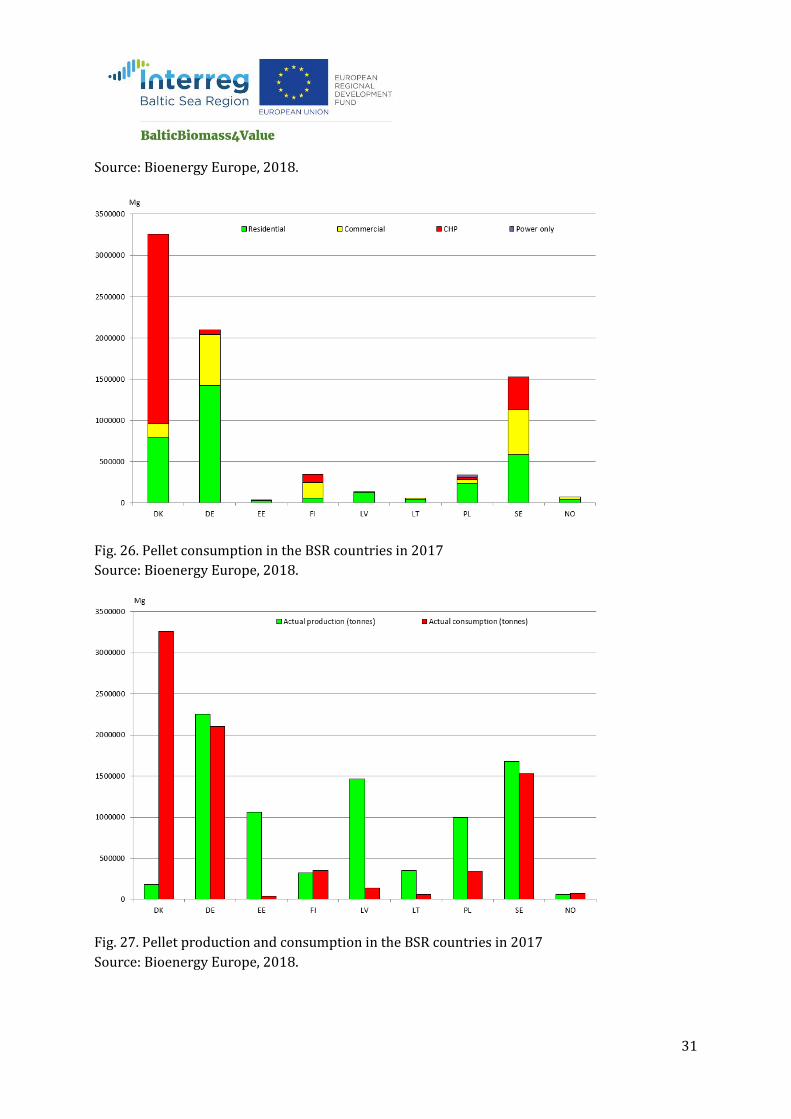
other hand, the highest consumption of pellet, among all BSR countries, was in Denmark (3.26
million Mg/year) (Fig. 26). Thus, Denmark had to import large quantities of pellet, as its domestic
production was more than 18-fold lower than consumption, and equalled just 180 thousand
Mg/year (Fig. 27). The situation was reverse in Estonia, Latvia, Lithuania and in Poland, where
pellet production exceeded domestic consumption by 26-, 11-, 6- and 3-fold, respectively. Sweden
and Germany had the most balanced production and consumption of pellet. A reverse situation
was noted in Finland and Norway, where production of pellet was lower than consumption. The
total number of pellet production plants, volumes of produced and consumed pellet in the BSR
countries was 42.5%, 54.6% and 32.7% of the respective values noted for the entire EU-28. Based
on the above data, the situation in the BSR countries with regard to the pellet market was
additionally illustrated in fig. 28. Figure 29, in turn, shows a more detailed map of the Polish pellet
market as an example.
Fig. 25. Pellet capacity, production and number of pellet manufacturing plants in the BSR countries
in 2017
31
Source: Bioenergy Europe, 2018.
Fig. 26. Pellet consumption in the BSR countries in 2017
Source: Bioenergy Europe, 2018.
Fig. 27. Pellet production and consumption in the BSR countries in 2017
Source: Bioenergy Europe, 2018.

32
Fig. 28. Pellet market map of the BSR countries in 2017
Fig. 29. Pellet market map of Poland
Source: https://magazynbiomasa.pl/gdzie-kupic-dobry-pellet-mapa-producentow-pelletu/
4.3. Residential heat production
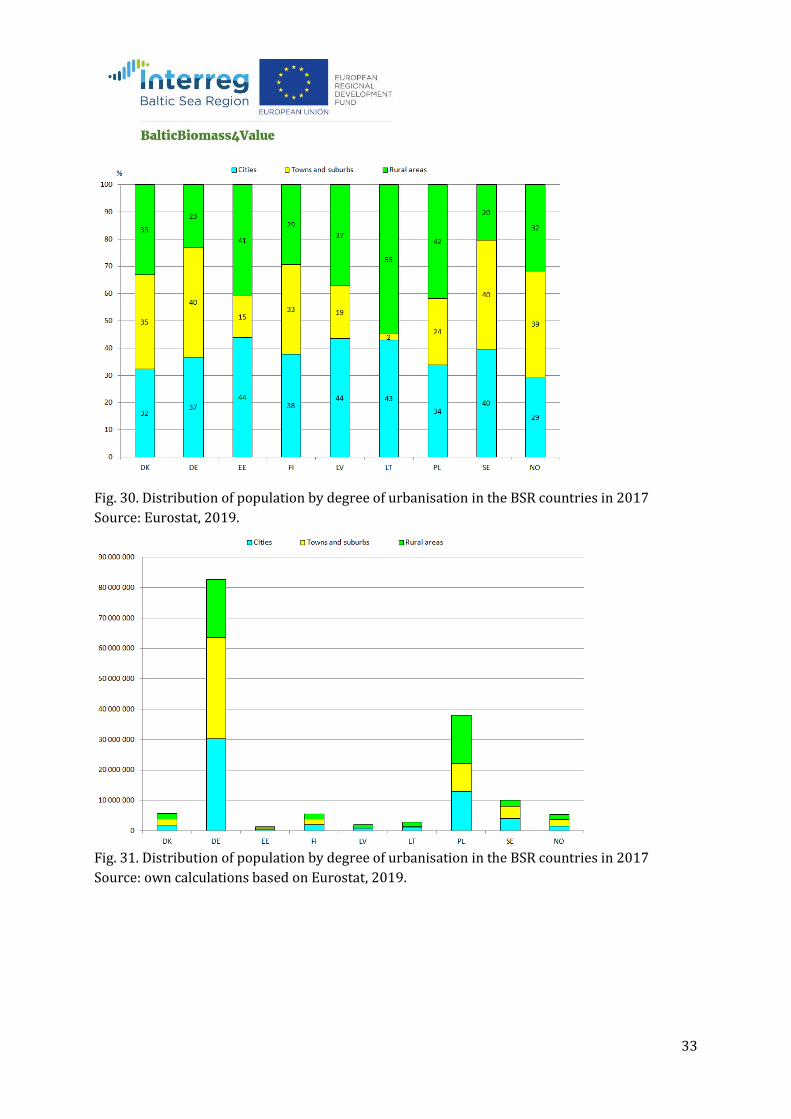
The distribution of populations by the degree of urbanisation in the BSR states is shown in Fig. 30.
Most of the residents in the BSR countries live in towns and suburbs (2-40%) or in rural areas
(20-55%) [Eurostat, 2019]. The percentage of population inhabiting cities ranges within 29-44%.
The most uniform distribution appears in Denmark. As for the total of population in the BSR states,
it was found that 55.5 million of people live in cities, 53.2 million in towns and suburbs, and 44.9
million in rural areas (Fig. 31). With respect to the total population distribution by dwelling type
in BSR countries, it was determined that around 56.4 million people live in detached houses, 19.2
million in semi-detached houses, 76.6 million in flats and 1.2 million people dwell in other types
of housing (Fig. 32). It is therefore right to conclude that half the population of the BSR states live
in flats, while the other half live in houses.
33
Fig. 30. Distribution of population by degree of urbanisation in the BSR countries in 2017
Source: Eurostat, 2019.
Fig. 31. Distribution of population by degree of urbanisation in the BSR countries in 2017
Source: own calculations based on Eurostat, 2019.

34
Fig. 32. Distribution of population by dwelling types in the BSR countries in 2017
Source: Eurostat, 2019.
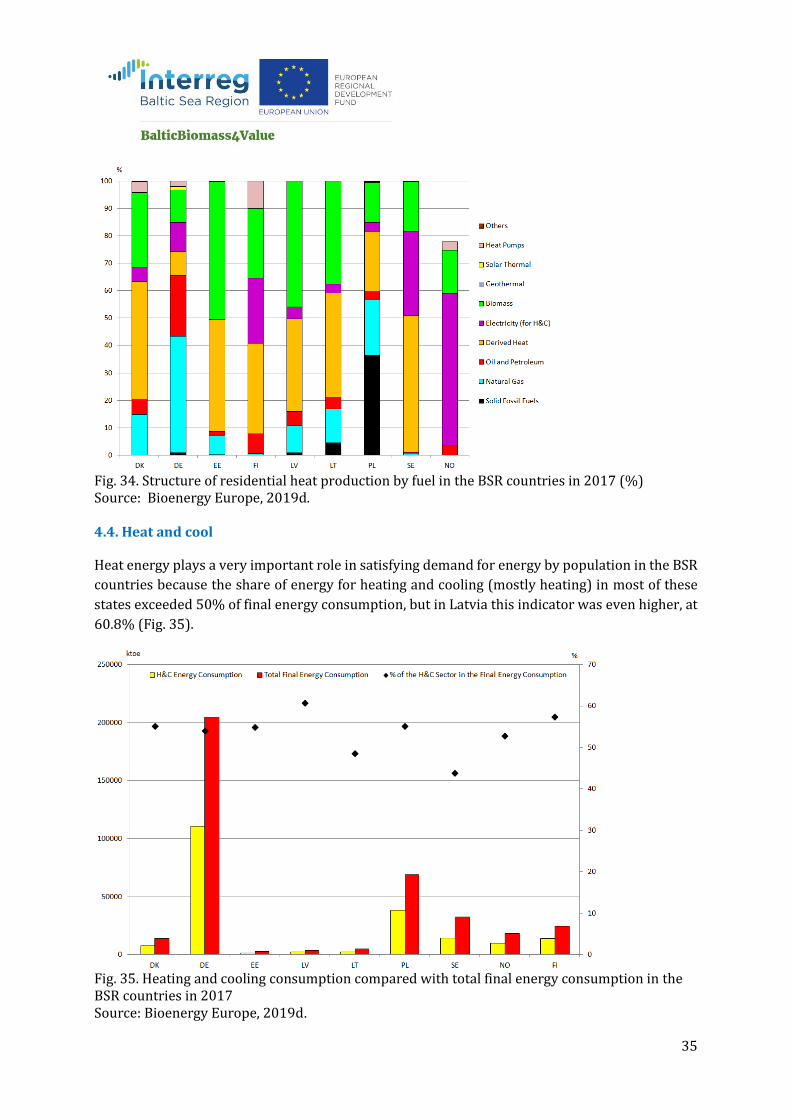
The highest residential heat production (over 50,000 ktoe) was in Germany, and natural gas dominated among the fuels (Fig. 33). In Poland, however, there was a large share of coal. Thus, the BSR countries in total consumed around 76% solid fossil fuels in comparison to the whole EU-28. In turn, biomass in structure of residential heat production by fuel in the BSR states ranged from 12 to 50%, in Germany and in Estonia, respectively (Fig. 34) [Bioenergy Europe, 2019d].
Fig. 33. Residential heat production by fuel in the BSR countries in 2017 (ktoe) Source: Bioenergy Europe, 2019d
35
Fig. 34. Structure of residential heat production by fuel in the BSR countries in 2017 (%) Source: Bioenergy Europe, 2019d.
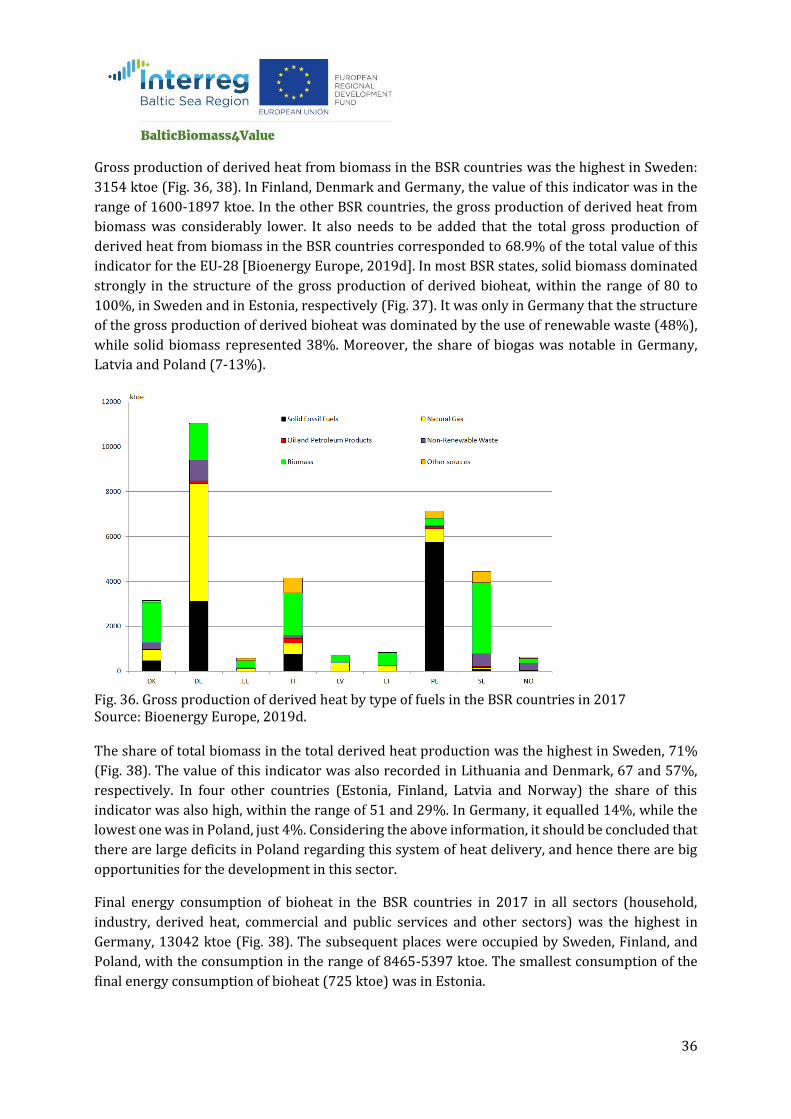
4.4. Heat and cool
Heat energy plays a very important role in satisfying demand for energy by population in the BSR
countries because the share of energy for heating and cooling (mostly heating) in most of these
states exceeded 50% of final energy consumption, but in Latvia this indicator was even higher, at
60.8% (Fig. 35).
Fig. 35. Heating and cooling consumption compared with total final energy consumption in the BSR countries in 2017 Source: Bioenergy Europe, 2019d.
36
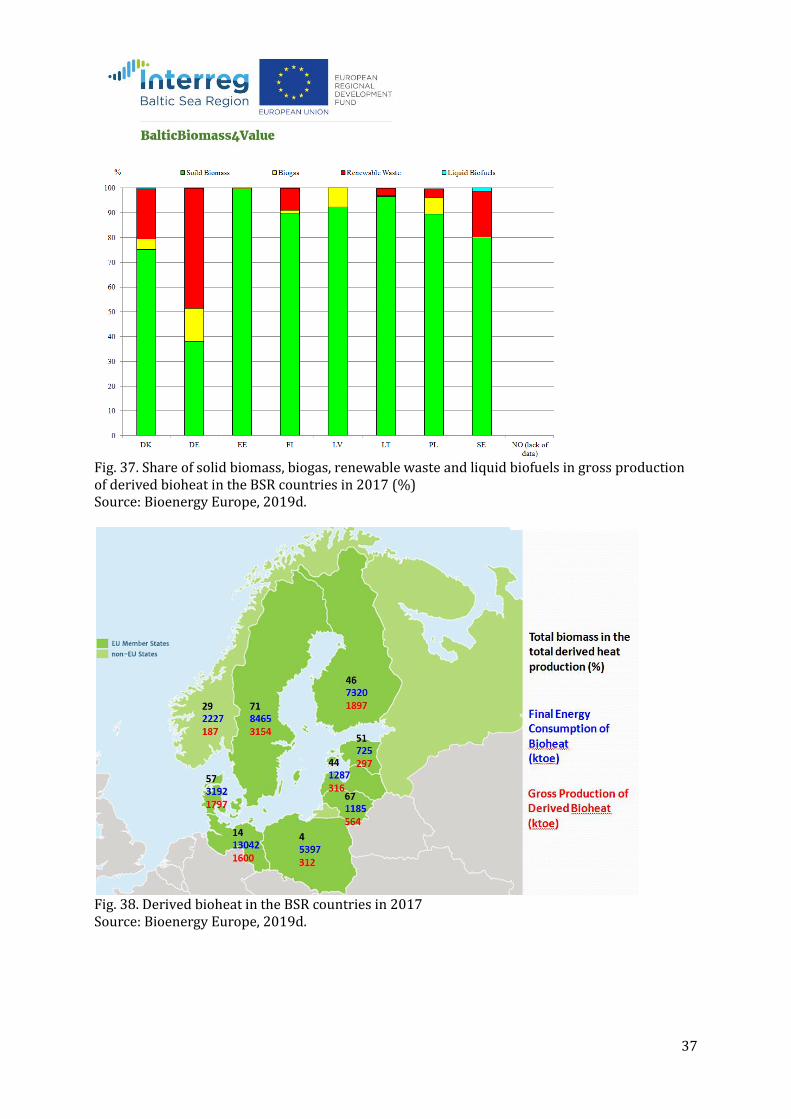
Gross production of derived heat from biomass in the BSR countries was the highest in Sweden:
3154 ktoe (Fig. 36, 38). In Finland, Denmark and Germany, the value of this indicator was in the
range of 1600-1897 ktoe. In the other BSR countries, the gross production of derived heat from
biomass was considerably lower. It also needs to be added that the total gross production of
derived heat from biomass in the BSR countries corresponded to 68.9% of the total value of this
indicator for the EU-28 [Bioenergy Europe, 2019d]. In most BSR states, solid biomass dominated
strongly in the structure of the gross production of derived bioheat, within the range of 80 to
100%, in Sweden and in Estonia, respectively (Fig. 37). It was only in Germany that the structure
of the gross production of derived bioheat was dominated by the use of renewable waste (48%),
while solid biomass represented 38%. Moreover, the share of biogas was notable in Germany,
Latvia and Poland (7-13%).
Fig. 36. Gross production of derived heat by type of fuels in the BSR countries in 2017 Source: Bioenergy Europe, 2019d.
The share of total biomass in the total derived heat production was the highest in Sweden, 71%
(Fig. 38). The value of this indicator was also recorded in Lithuania and Denmark, 67 and 57%,
respectively. In four other countries (Estonia, Finland, Latvia and Norway) the share of this
indicator was also high, within the range of 51 and 29%. In Germany, it equalled 14%, while the
lowest one was in Poland, just 4%. Considering the above information, it should be concluded that
there are large deficits in Poland regarding this system of heat delivery, and hence there are big
opportunities for the development in this sector.
Final energy consumption of bioheat in the BSR countries in 2017 in all sectors (household,
industry, derived heat, commercial and public services and other sectors) was the highest in
Germany, 13042 ktoe (Fig. 38). The subsequent places were occupied by Sweden, Finland, and
Poland, with the consumption in the range of 8465-5397 ktoe. The smallest consumption of the
final energy consumption of bioheat (725 ktoe) was in Estonia.
37
Fig. 37. Share of solid biomass, biogas, renewable waste and liquid biofuels in gross production of derived bioheat in the BSR countries in 2017 (%) Source: Bioenergy Europe, 2019d.
Fig. 38. Derived bioheat in the BSR countries in 2017 Source: Bioenergy Europe, 2019d.

38
4.5. Bioelectricity
Gross electricity production in the BSR countries in 2017 is shown in Fig. 39. The total electrical
capacity from all biomass plants (solid biomass, biogas, renewable waste and liquid biofuels) in
all the BSR countries was 21,123 MW, which corresponded to 52% of the value for the EU-28.
Among the BSR states, evidently the highest total electrical capacity from all biomass was in
Germany (10,007 MW), and in Sweden (5,389 MW), which corresponded to 47 and 26% among
the BSR countries (Fig. 40). Denmark and Finland were in the third and fourth place in terms of
this indicator, with its value of around 9% each of the total value for all BSR countries. In the other
BSR states, the electrical biomass capacity was much lower, with the lowest one in Lithuania: 87
MW [Bioenergy Europe, 2019a].
Fuels inputs for bioelectricity generation and gross electricity generation from biomass were
reflected in values of electrical capacity. Hence, the largest fuels inputs and gross electricity
generation from biomass were in Germany, where they corresponded to 49 and 56%, respectively,
of the total values for the BSR countries (Fig. 40). Sweden and Finland were in the second and
third place in terms of the gross electricity generation from biomass, generating over 1000 ktoe
each. In Poland and in Denmark, the statistics showed more than 500 ktoe, and in the other BSR
countries the value of this indicator was much lower than 90 ktoe.
Fig. 39. Gross electricity production in the BSR countries in 2017
Source: Eurostat, 2019.
39
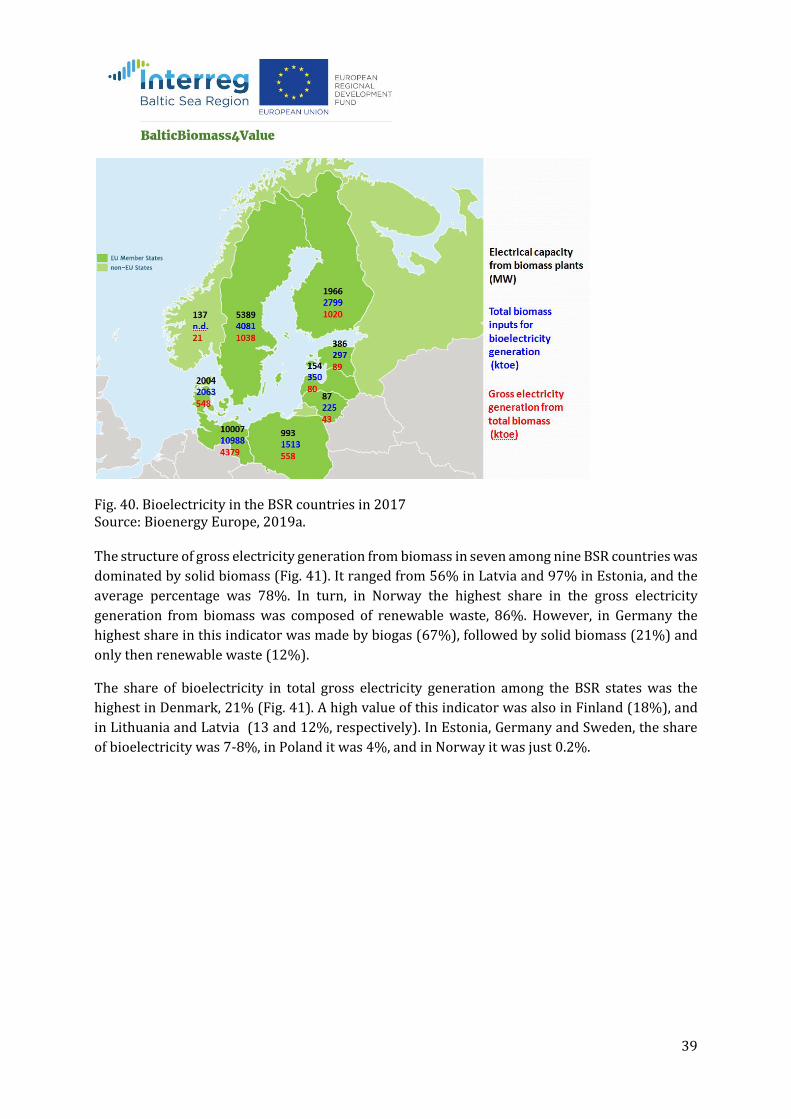
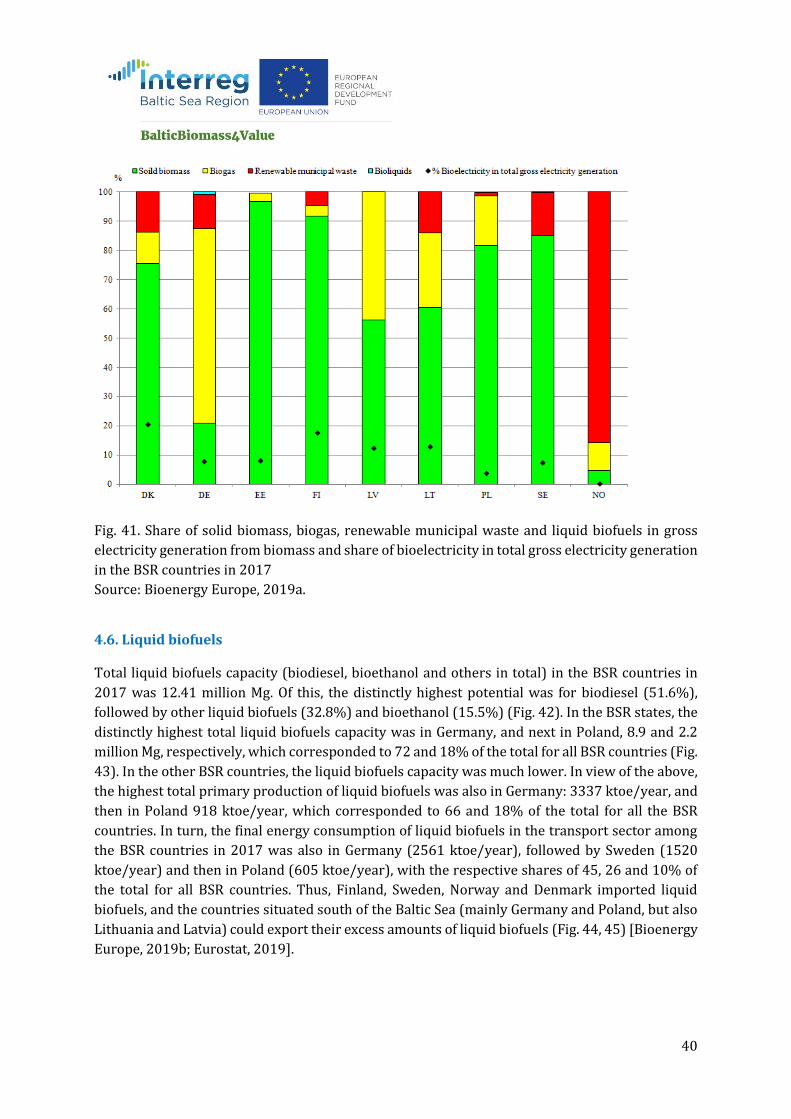
Fig. 40. Bioelectricity in the BSR countries in 2017 Source: Bioenergy Europe, 2019a. The structure of gross electricity generation from biomass in seven among nine BSR countries was
dominated by solid biomass (Fig. 41). It ranged from 56% in Latvia and 97% in Estonia, and the
average percentage was 78%. In turn, in Norway the highest share in the gross electricity
generation from biomass was composed of renewable waste, 86%. However, in Germany the
highest share in this indicator was made by biogas (67%), followed by solid biomass (21%) and
only then renewable waste (12%).
The share of bioelectricity in total gross electricity generation among the BSR states was the
highest in Denmark, 21% (Fig. 41). A high value of this indicator was also in Finland (18%), and
in Lithuania and Latvia (13 and 12%, respectively). In Estonia, Germany and Sweden, the share
of bioelectricity was 7-8%, in Poland it was 4%, and in Norway it was just 0.2%.
40
Fig. 41. Share of solid biomass, biogas, renewable municipal waste and liquid biofuels in gross
electricity generation from biomass and share of bioelectricity in total gross electricity generation
in the BSR countries in 2017
Source: Bioenergy Europe, 2019a.
4.6. Liquid biofuels
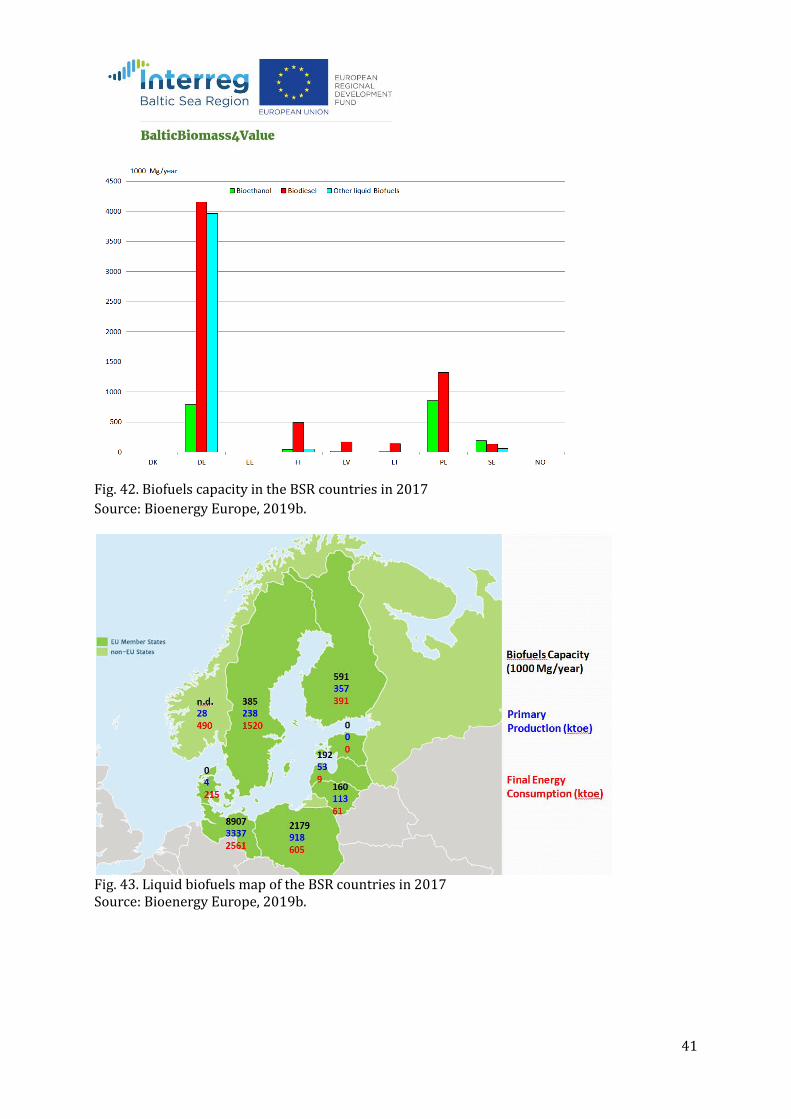
Total liquid biofuels capacity (biodiesel, bioethanol and others in total) in the BSR countries in
2017 was 12.41 million Mg. Of this, the distinctly highest potential was for biodiesel (51.6%),
followed by other liquid biofuels (32.8%) and bioethanol (15.5%) (Fig. 42). In the BSR states, the
distinctly highest total liquid biofuels capacity was in Germany, and next in Poland, 8.9 and 2.2
million Mg, respectively, which corresponded to 72 and 18% of the total for all BSR countries (Fig.
43). In the other BSR countries, the liquid biofuels capacity was much lower. In view of the above,
the highest total primary production of liquid biofuels was also in Germany: 3337 ktoe/year, and
then in Poland 918 ktoe/year, which corresponded to 66 and 18% of the total for all the BSR
countries. In turn, the final energy consumption of liquid biofuels in the transport sector among
the BSR countries in 2017 was also in Germany (2561 ktoe/year), followed by Sweden (1520
ktoe/year) and then in Poland (605 ktoe/year), with the respective shares of 45, 26 and 10% of
the total for all BSR countries. Thus, Finland, Sweden, Norway and Denmark imported liquid
biofuels, and the countries situated south of the Baltic Sea (mainly Germany and Poland, but also
Lithuania and Latvia) could export their excess amounts of liquid biofuels (Fig. 44, 45) [Bioenergy
Europe, 2019b; Eurostat, 2019].
41
Fig. 42. Biofuels capacity in the BSR countries in 2017
Source: Bioenergy Europe, 2019b.
Fig. 43. Liquid biofuels map of the BSR countries in 2017 Source: Bioenergy Europe, 2019b.
42
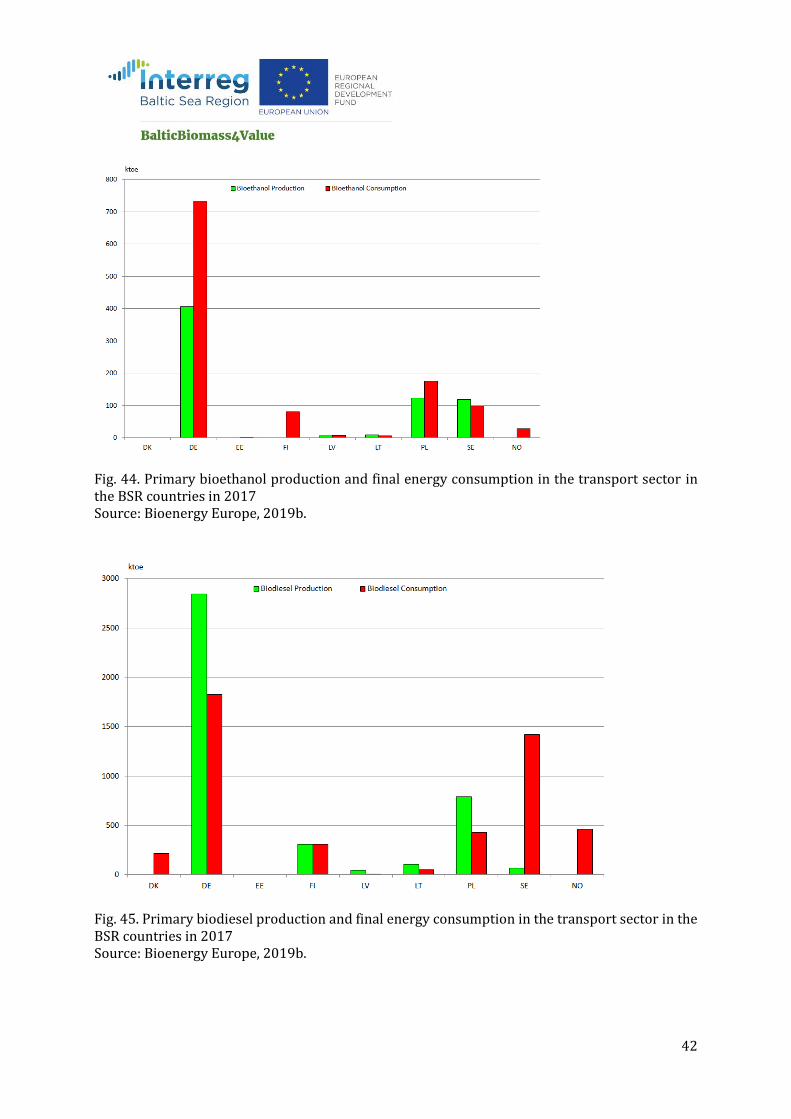
Fig. 44. Primary bioethanol production and final energy consumption in the transport sector in the BSR countries in 2017 Source: Bioenergy Europe, 2019b.
Fig. 45. Primary biodiesel production and final energy consumption in the transport sector in the BSR countries in 2017 Source: Bioenergy Europe, 2019b.
43
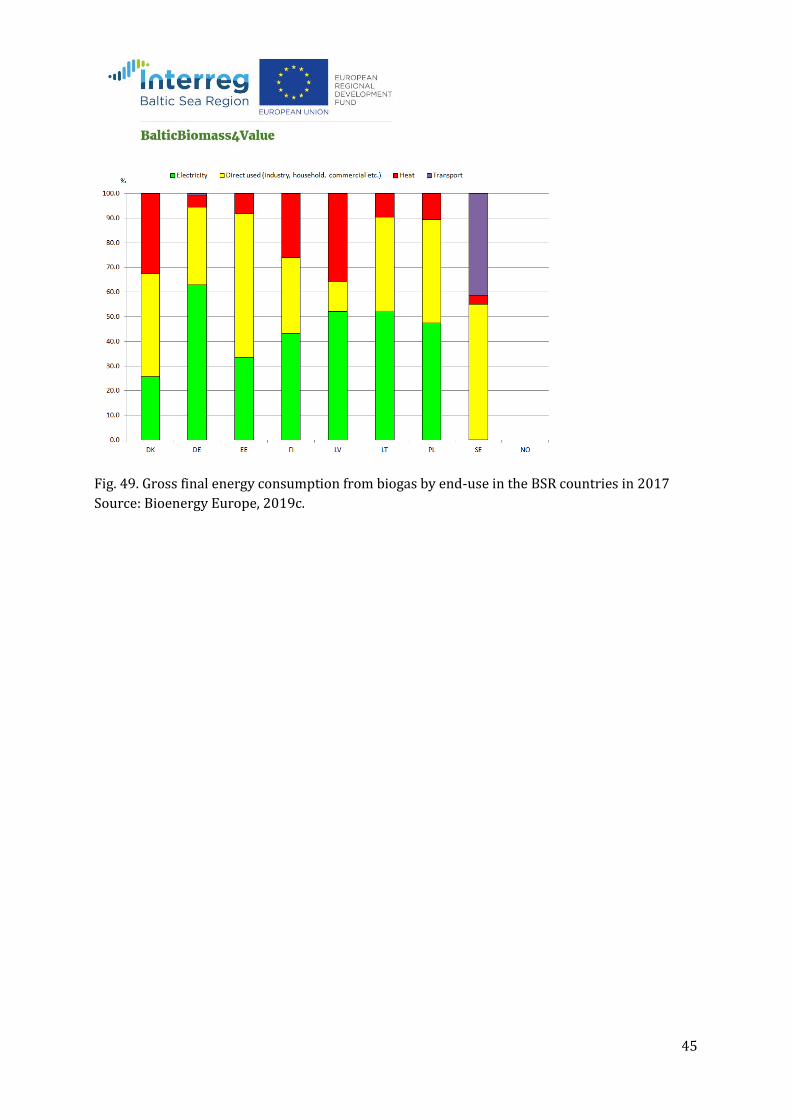
4.7. Biogas
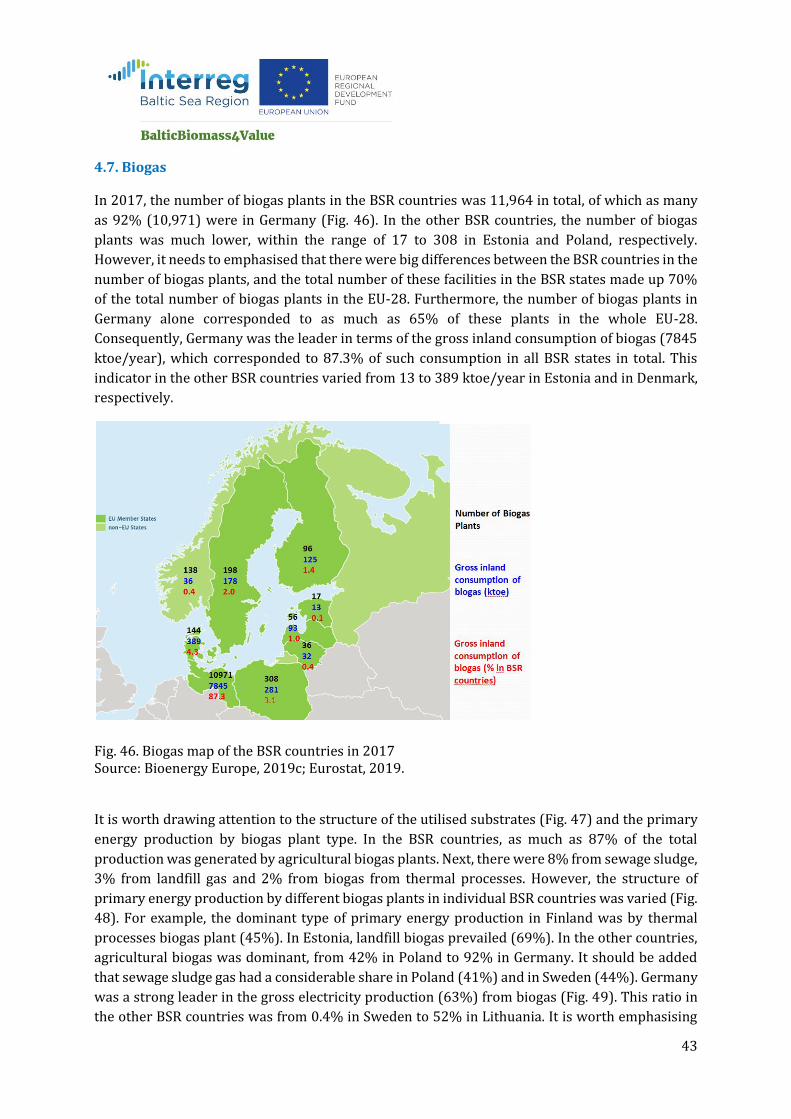
In 2017, the number of biogas plants in the BSR countries was 11,964 in total, of which as many
as 92% (10,971) were in Germany (Fig. 46). In the other BSR countries, the number of biogas
plants was much lower, within the range of 17 to 308 in Estonia and Poland, respectively.
However, it needs to emphasised that there were big differences between the BSR countries in the
number of biogas plants, and the total number of these facilities in the BSR states made up 70%
of the total number of biogas plants in the EU-28. Furthermore, the number of biogas plants in
Germany alone corresponded to as much as 65% of these plants in the whole EU-28.
Consequently, Germany was the leader in terms of the gross inland consumption of biogas (7845
ktoe/year), which corresponded to 87.3% of such consumption in all BSR states in total. This
indicator in the other BSR countries varied from 13 to 389 ktoe/year in Estonia and in Denmark,
respectively.
Fig. 46. Biogas map of the BSR countries in 2017 Source: Bioenergy Europe, 2019c; Eurostat, 2019.
It is worth drawing attention to the structure of the utilised substrates (Fig. 47) and the primary
energy production by biogas plant type. In the BSR countries, as much as 87% of the total
production was generated by agricultural biogas plants. Next, there were 8% from sewage sludge,
3% from landfill gas and 2% from biogas from thermal processes. However, the structure of
primary energy production by different biogas plants in individual BSR countries was varied (Fig.
48). For example, the dominant type of primary energy production in Finland was by thermal
processes biogas plant (45%). In Estonia, landfill biogas prevailed (69%). In the other countries,
agricultural biogas was dominant, from 42% in Poland to 92% in Germany. It should be added
that sewage sludge gas had a considerable share in Poland (41%) and in Sweden (44%). Germany
was a strong leader in the gross electricity production (63%) from biogas (Fig. 49). This ratio in
the other BSR countries was from 0.4% in Sweden to 52% in Lithuania. It is worth emphasising

44
that in Sweden much more energy was dedicated to direct use (industry, household, commercial
etc.) and transport rather than to electricity production.
Fig. 47. Feedstock use for biogas production (excluding landfill - expressed as a mass percentage) in the BSR countries in 2017 Source: Bioenergy Europe, 2019c.
Fig. 48. Primary energy production of biogas by biogas plant type in the BSR countries in 2017
Source: Bioenergy Europe, 2019c.
45
Fig. 49. Gross final energy consumption from biogas by end-use in the BSR countries in 2017
Source: Bioenergy Europe, 2019c.
46
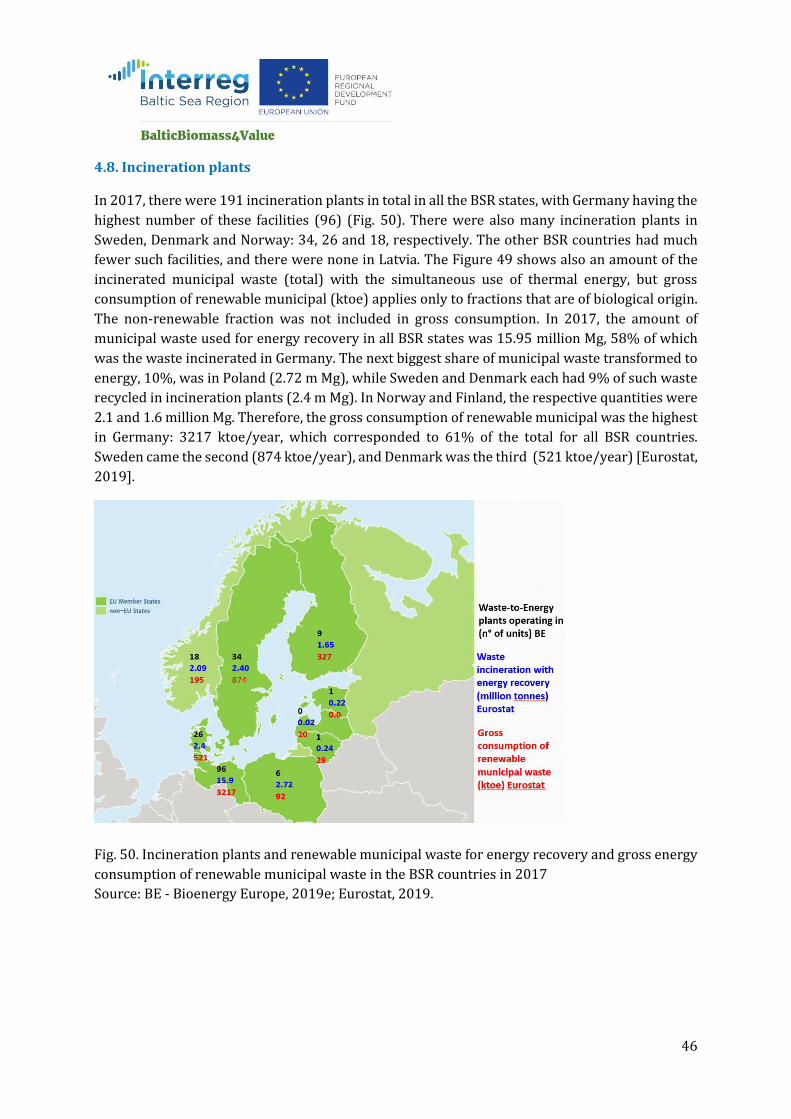
4.8. Incineration plants
In 2017, there were 191 incineration plants in total in all the BSR states, with Germany having the
highest number of these facilities (96) (Fig. 50). There were also many incineration plants in
Sweden, Denmark and Norway: 34, 26 and 18, respectively. The other BSR countries had much
fewer such facilities, and there were none in Latvia. The Figure 49 shows also an amount of the
incinerated municipal waste (total) with the simultaneous use of thermal energy, but gross
consumption of renewable municipal (ktoe) applies only to fractions that are of biological origin.
The non-renewable fraction was not included in gross consumption. In 2017, the amount of
municipal waste used for energy recovery in all BSR states was 15.95 million Mg, 58% of which
was the waste incinerated in Germany. The next biggest share of municipal waste transformed to
energy, 10%, was in Poland (2.72 m Mg), while Sweden and Denmark each had 9% of such waste
recycled in incineration plants (2.4 m Mg). In Norway and Finland, the respective quantities were
2.1 and 1.6 million Mg. Therefore, the gross consumption of renewable municipal was the highest
in Germany: 3217 ktoe/year, which corresponded to 61% of the total for all BSR countries.
Sweden came the second (874 ktoe/year), and Denmark was the third (521 ktoe/year) [Eurostat,
2019].
Fig. 50. Incineration plants and renewable municipal waste for energy recovery and gross energy
consumption of renewable municipal waste in the BSR countries in 2017
Source: BE - Bioenergy Europe, 2019e; Eurostat, 2019.
47
5. Catalogue of selected enabling technologies, covering energy and directly connected
other uses of biomass
5.1. Pros and cons of the biomass potential and technology of its use for energy in BSR
countries
Denmark: The country with the smallest surface area and second most densely populated one. It
possesses the fifth largest total biomass energy potential. It consumes the distinctly biggest
amount of pellet to generate energy among all BSR states, although most of this fuel (over 90%)
is imported. It has a well-developed biogas sector, as it is in the second place in terms of the gross
inland consumption of biogas. It is also the third country among the BSR states in terms of the
number of incineration plants and gross consumption of renewable municipal waste. It does not
employ a liquid biofuel generation technology and the consumption of this fuel relies on import.
The share of total bioenergy in the total energy consumption is on a high level (24%), which gave
Denmark the fourth position among the nine BSR states.
Germany: The country with the highest population density rate and the biggest population, as
well as the second one in surface area. It has the biggest biomass energy potential. It is the leading
country among the BSR states in terms of the volume of generated bioenergy in every sector, i.e.
solid biomass, biogas, renewable municipal waste and liquid biofuels, in addition to which it has
the distinctly highest number of biogas plants and experience in this sector. However, the
percentage of total bioenergy as shares of gross total energy consumption was not too high
(8.2%), which put Germany on the seventh place among the nine BSR countries.
Estonia: This country is the eighth and sixth in terms of the area and population density rate,
respectively, and it has the smallest population among the BSR states. It has the smallest (ninth)
potential of energy from biomass. However, this country has a large potential of pellet production
and occupies the fourth place in this regard. Moreover, this country’s share in the total EU-28
pellet exports was high, at 16%. Estonia had the biggest (50%) share of biomass in the total of
residential heat production. It does not possess implemented technology for generating liquid
biofuels and it has the fewest biogas plants among the BSR states. It is distinguished by a high
percentage of the whole population employed in bioenergy markets (0.68%). The share of total
bioenergy as shares of gross total energy is moderate (17.3%), which gives Estonia the sixth
position among the nine BSR countries. In terms of the GHG emissions, it comes the fifth.
Finland: This country is on the third and eighth place in terms of the surface area and population
density rate, respectively. It has the fourth largest total biomass energy potential. The country is
on the third position among the BSR states with regard to residential bioheat production, final
energy consumption of bioheat, gross electricity generation from biomass and biofuel installed
capacity, and on the fourth one in terms of the gross consumption of renewable municipal waste.
The percentage of total bioenergy as shares of gross total energy consumption is high (28.1%),
securing this country the second place among the nine BSR states. As for the GHG emission rate, it
comes the fourth.
Latvia: This country is on the seventh and fifth place in terms of the area and population density
rate, respectively. It has the sixth total biomass energy potential with respect to its size. The

48
country also has a large potential in pellet production, which gives it the third place. Moreover,
the contribution of Latvia to the total EU-28 pellet exports was high, at 20%. This is the country
with the highest share of heating and cooling (61%) in final energy consumption. It occupies the
second place in terms of the share of biomass in the total of residential heat production (46%). It
lacks incineration plants and has the smallest volume of renewable municipal waste used for
energy recovery. It shows the highest percentage of the whole population employed in bioenergy
markets (1.32%) and the share of total bioenergy as shares of gross total energy consumption is
on an average level (33.9%) among the nine BSR states. The low total GHG emission secured this
country the eighth position among the BSR countries.
Lithuania: This country comes the sixth and fourth in terms of the surface area and population
density rate. It has the seventh biggest total biomass energy potential. The country is on the
second place with respect to total biomass in the total of derived heat production (67%) and on
the third place regarding the share of biomass in the total of residential heat production (38%). It
has a small number of incineration plants and biogas plants. The contribution of total bioenergy
as shares of gross total energy consumption is moderate (18.8%), which gave this country the fifth
place among the nine BSR states. Concerning the GHG emission index, Lithuania was on the sixth
place.
Poland: This country is on the fifth, second and third place in terms of the area, population and
population density rate, respectively. It has the second largest biomass energy potential. The
country is on the second place with respect to the number of biogas plants, biofuel installed
capacity and primary production as well as the number pellet plants, but it is only the fifth largest
pellet producer. Poland has the lowest percentage of the total biomass in the total derived heat
production (just 4%) and is on the penultimate place in terms of the total of residential heat
production (15%) among the BSR countries. It has a low share of total bioenergy as shares of gross
total energy consumption (6.9%), which gives it the penultimate, eighth place among the nine BSR
states. With respect to the GHG emission rate, it came the second.
Sweden: This is the country with the largest area and on the seventh place in terms of the
population and population density rate. It has the third largest biomass energy potential in size.
Sweden has the biggest number of pellet plants and is the second biggest pellet producer. It is also
the second country in terms of the number of incineration plants and gross consumption of
renewable municipal waste. It is on the third place in terms of the number of biogas plants and
has the highest share of biogas used for transport. Sweden has the highest percentage of total
biomass in the total derived heat production (71%). This country is the third in turnover in the
bioenergy sector. The percentage of the total bioenergy as shares of gross total energy
consumption is 24.2%, which gives Sweden the third place among the nine BSR states. Moreover,
Sweden has the lowest GHG emission rate.
Norway: This is the fourth country in terms of the surface, with the lowest population density
rate. It has the eighth largest total biomass energy potential. It is on the fourth place with respect
to the number of incineration plants, and on the fifth place regarding the number of biogas plants.
Norway has the largest percentage of renewable waste in the structure of gross electricity
generation from biomass (86%). The smallest number of pellet plants is accompanied by the
49
lowest pellet production. The percentage of total bioenergy as shares of gross total energy
consumption was the lowest (5.4%), which gave the country the last place among the nine BSR
states. However, it was the fifth with respect to the GHG emission rate.
5.2. Integrated biorefineries as modern installations for cascade use of biomass
Development factors
Biorefinery processing offers an opportunity to increase the value and improve the effective use
of biomass and to produce new, high quality bioproducts (food, fodder, materials, chemicals) and
bioenergy (fuels, electric and/or heating power). It also enables manufacture of raw materials and
biopolymers for production of plastics, which are in high demand (1,709,700 Mg/year; an
estimate for the year 2015) (de Jong et al., 2012). The market demand for bio-based products,
efficient technologies, large-scale implementation of technologies, integrated production and
proper selection of local feedstocks ensure the feasibility and economic viability of these systems.
The overall costs of production can be lowered by 5-27%, which should lead to a decrease in the
costs of biofuel production to 42–119 EUR/MWh (12–33 EUR/GJ) for fuels derived from biomass
raw materials, and to 29–79 EUR/MWh (8–22 EUR/GJ) for biowaste-based fuels (Brown et al.,
2020).
The challenge of climate change and depletion of fossil resources is increasingly serious. The
calculations reported by the IEA Bioenergy show that a wood bioethanol biorefinery system
releases 48 kt CO2 eq./year, while the lowest emission of greenhouse gases from fossil fuels in an
analogous system releases 408 kt CO2 eq./year, which translates into a reduction in GHG emission
by around 88% (de Jong et al., 2012).
Classification of biorefineries
The whole spectrum of various biorefinery processes is currently the subject of research which
shows that some are already competitive on the market while others are at the stage of
development. The standard classification of various existing and emerging biorefinery systems
has not been completely developed yet, although the International Energy Agency (IEA) Bioenergy
has made an attempt to classify all systems (Task 42; „Biorefining is the sustainable processing of
biomass to a spectrum of market products and energy”). The IEA Bioenergy has classified
biorefinery plants by taking into consideration four parameters: platforms, products, feedstocks,
and processes (Cherubini et al., 2009).
A biorefinery system has been described as a pathway for conversion of raw material to final
product using platforms and processes. Platforms are semi-products from which final products
are derived, and these are the most important characteristics to define the type of a biorefinery
plant.
Platforms
50
Platforms are considered to be the main ‘pillars’ supporting the classification of biorefineries,
because they can be obtained through a variety of different conversion processes, applied to
different feedstocks. The most important planforms are:
- biogas (a mixture of mainly CH4 and CO2) from anaerobic digestion,
- synthetic gas (a mixture of CO and H2) from gasification,
- hydrogen (H2) from the reaction of carbon monoxide with water vapour, steam reforming,
electrolysis of water and digestion,
- C6 sugars (e.g. glucose, fructose. galactose: C6H12O6) from the hydrolysis of sucrose, starch,
cellulose and hemicellulose,
- C5 sugars (e.g. xylose, arabinose: C5H10O5), from the hydrolysis of hemicellulose and food and
fodder side streams,
- lignin (phenylpropane-based materials for building industry: C9H10O2 (OCH3)n), from conversion
of lignocellulose biomass,
- pyrolytic liquid (a multi-component mixture of molecules of different size), from pyrolysis,
- oil (triglycerides: RCOO-CH2CH (-OOCR ’) CH2-OOCR”) from oil-seed plants, algae and residues
of oil-based substances,
- organic juice (from different chemicals), which is the liquid phase extracted after cold-pressing
of wet biomass (e.g. grass),
- electric and heating energy, which can be used internally to satisfy the biorefinery plant’s
demand for energy or can be sold to a power grid.
Products
Biorefinery plants produce products which can be divided into two classes:
1. Energy generating biorefinery systems, where biomass is used mainly to produce secondary
energy carriers (biofuels for transport, electricity or heat); products in the form of feeds are
also made and sold (the current situation) but as side products, to optimise the economic
and ecological outputs of the entire chain of biomass supplies.
2. Biorefinery systems based on materials which generate mainly biotechnology-based
products (biomaterials, greases, chemicals, food, feeds, etc.) and process residues, which can
be further processed or used to make energy (for internal use or to be sold).
In this approach, biorefinery products are divided into energy products and material products.
Some products, such as bio-hydrogen and bioethanol, can be used for both energy purposes or as
a marketable product. The category to which a given biorefinery is classified depends on the fact
whether its product is intended for the energy or for the chemical market.
Energy products comprise electricity and heat as well as promising transport biofuels, i.e.
bioethanol, biodiesel, synthetic biofuels (fuels from the Fisher-Tropsch synthesis and others) and
biomethane.
Products based on materials encompass small chemicals (such as amino acids, organic acids and
extracts) used in the food processing, chemical or pharmaceutical industries, as well as animal
51
feeds and textile products. Some sub-groups of material products are: fertilisers, bio-hydrogen,
glycerine (from triglyceride transesterification), chemicals and building materials (e.g. small
chemicals, flavours, amino acids, xylitol, polyols, succinic, lactic, levulinic and itaconic acids,
phenols, furanodicarboxylic acid, furfural, etc.), polymers and resins (produced through the
(bio)chemical conversion of biomass with monomeric intermediate compounds (e.g. PHA, resins,
PLA), food, animal feeds, biomaterials (fibre products, polysaccarides, pulp and paper), panels.
Raw materials
The raw material is composed of biomass. Biomass feedstocks can be divided into the primary,
secondary and tertiary materials. Currently, substrates are delivered to a biorefinery plant from
four different sectors:
˗ Agriculture (dedicated plantations and harvest residues),
˗ Forestry (wood and logging residues),
˗ Industry (processing residues and waste) and household (organic waste),
˗ Aquaculture (algae, seaweeds).
Another division is based on the origin of raw materials, that is ones that come from dedicated
plantations, produced on farmland or woodland or in water systems, versus these which are waste
materials from agriculture, forestry or industries. Biomass raw materials are also different in
terms of their basic composition (cellulose, hemicellulose, lignin, starch, triglycerides and protein)
and three chemical elements: carbon, oxygen and hydrogen (and S, N and ash). Other important
characteristics are: the content of water, calorific value and specific density. In this approach, the
following sub-groups of raw materials can be distinguished:
1. Dedicated raw materials: sugar crops (e.g. sugar beet, sugar cane), starch crops (e.g. wheat,
maize, sorghum), lignocellulose crops (e.g. willow, poplar, grasses, e.g. miscanthus), oilseed
crops (e.g. oilseed rape, soybean, palm oil, jatropha curcas), grasses (e.g. green plant
materials, grass silage, unripe cereals and plant shoots), marine biomass (e.g. micro- and
macroalgae, seaweeds).
2. Residues: oil-based residues (animal fat from the food processing industry, used cooking oil
from restaurants, households, and others), lignocellulose residues (harvest residues, by-
products from sawmills, etc.), organic waste and others (e.g. municipal organic waste,
manure, wild fruit, cultivated plants).
Processes
Biorefining systems employ different conversion processes. Depending on the final products (e.g.
fuels, chemicals, materials, food, feeds), biorefinery plants can be divided into the systems in
which operations such as fractionating/dividing into polymer products (food, feeds, biomaterials)
are the main processes and systems of biofuels and biochemicals, in which depolymerisation and
chemical, thermochemical and/ore biochemical conversion are the principal processes. The aim
of biofuel processes is both depolymerisation and deoxidation of biomass. Deoxidation is
particularly important, especially when producing transport biofuels because the presence of
oxygen can decrease the energy value in molecules and typically endows them with greater
52
polarity, thus restraining their capacity to mix with the existing fossil fuels. On the other hand, the
presence of oxygen in chemical products (e.g. polyols and organic acids) often provides the
compounds with valuable physical and chemical properties. There are several technological
processes that can be employed in biorefining systems to convert biomass substrates into market
products. This approach to classification of biorefinery plants distinguishes four major sub-
groups of processes:
˗ Mechanical/physical processes, which do not change the chemical structure of biomass
components, but only change the size of particles or separate elements of a substrate (e.g.
pressing, pretreatment, milling, separation, distillation).
˗ Thermochemical processes, in which raw material is submitted to extreme conditions
(high temperature and/or pressure, with or without catalytic agents) (e.g. pyrolysis,
gasification, hydrothermal upgrading, incineration).
˗ Chemical processes, in which chemical conversion of a substrate occurs (e.g. hydrolysis,
transesterification, hydrogenation, oxidation, digestion).
˗ Biochemical processes, which proceed under mild conditions (lower temperature and
pressure), with the use of microorganisms or enzymes (e.g. anaerobic decomposition,
aerobic and anaerobic fermentation, enzymatic conversion).
All processes require additional energy inputs and additional materials. Considering the above
classification, it is possible to distinguish the following biorefinery plant models:
˗ 2-platform biorefinery plant (electricity and heat, synthetic gas) using wood chips to
produce FT biofuels, electricity, heat and waxes.
˗ 3-platform biorefinery plant (C6 and C5 sugars, electricity and heat, lignin) using wood
chips to produce bioethanol, electric power, heat and phenols.
˗ 4-platform biorefinery plant (biogas, fibre and juice, electric power and heat) biorefinery
plant using grass silage and food waste to produce bioplastics, insullation material,
fertilisers, electric power.
Biorefinery plants in the BSR
The inventory of biorefinery plants (Fig. 51) in the BSR has been made on the basis of data
collected by the BIO-based Industries Consortium and Nova (Biorefineries in Europe 2017). The
presence of biorefineries in the BSR countries is highly diverse. Most biorefinery plants operate
in Germany, and these are mostly oil/fat-based biorefineries producing biodiesel (ca 50%) and
oleochemistry products (30%). Apart from these, there are also biorefineries in Germany
producing ethanol and other chemicals from sugar/starch-based substrates. There are also a few
biowaste-based biorefineries. The second BSR country in terms of the number of biorefineries is
Finland, where most biorefineries are wood-based ones, although there are three bio-waste based
biorefineries, four oil/fat based biorefineries (two producing biodiesel and two producing
oleochemicals) as well as two sugar/starch-based biorefineries making bioethanol and other
chemicals. The third country with the highest number of biorefineries is Sweden, where the most
numerous biorefineries are also wood-based ones, but there are four oil/fat biorefinery plants
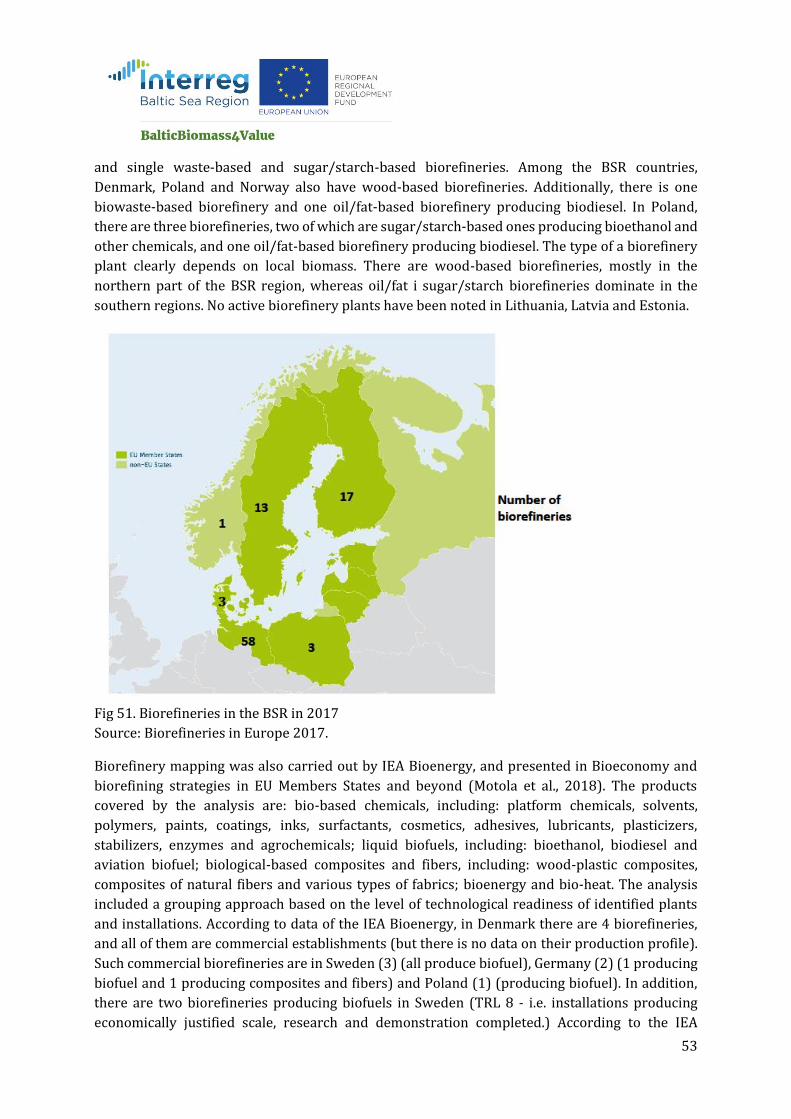
53
and single waste-based and sugar/starch-based biorefineries. Among the BSR countries,
Denmark, Poland and Norway also have wood-based biorefineries. Additionally, there is one
biowaste-based biorefinery and one oil/fat-based biorefinery producing biodiesel. In Poland,
there are three biorefineries, two of which are sugar/starch-based ones producing bioethanol and
other chemicals, and one oil/fat-based biorefinery producing biodiesel. The type of a biorefinery
plant clearly depends on local biomass. There are wood-based biorefineries, mostly in the
northern part of the BSR region, whereas oil/fat i sugar/starch biorefineries dominate in the
southern regions. No active biorefinery plants have been noted in Lithuania, Latvia and Estonia.
Fig 51. Biorefineries in the BSR in 2017
Source: Biorefineries in Europe 2017.
Biorefinery mapping was also carried out by IEA Bioenergy, and presented in Bioeconomy and
biorefining strategies in EU Members States and beyond (Motola et al., 2018). The products
covered by the analysis are: bio-based chemicals, including: platform chemicals, solvents,
polymers, paints, coatings, inks, surfactants, cosmetics, adhesives, lubricants, plasticizers,
stabilizers, enzymes and agrochemicals; liquid biofuels, including: bioethanol, biodiesel and
aviation biofuel; biological-based composites and fibers, including: wood-plastic composites,
composites of natural fibers and various types of fabrics; bioenergy and bio-heat. The analysis
included a grouping approach based on the level of technological readiness of identified plants
and installations. According to data of the IEA Bioenergy, in Denmark there are 4 biorefineries,
and all of them are commercial establishments (but there is no data on their production profile).
Such commercial biorefineries are in Sweden (3) (all produce biofuel), Germany (2) (1 producing
biofuel and 1 producing composites and fibers) and Poland (1) (producing biofuel). In addition,
there are two biorefineries producing biofuels in Sweden (TRL 8 - i.e. installations producing
economically justified scale, research and demonstration completed.) According to the IEA
54
Bioenergy there are several biorefineries in the demo-plant stage (TRL 5) at the moment: 3 in
Denmark (1 producing biofuels and 2 for which there is no product data), 4 in Germany (2
producing biofuels and 2 producing chemicals), 3 in Poland (1 producing biofuels, 1 comopsites
and fibers and 1 for which has data on products), and 2 in Sweden (for producing biofuels) (Motola
et al., 2018).
55
6. Conclusions
The analysed Baltic Sea region countries were characterised by a high share of woodlands and
agricultural land. They have high wood production and large areas of cropped farmland,
particularly Germany and Poland. Because of the large area of forests and the timber industry in
the BSR countries, they produced most pellet among all the EU states. The technical potential of
straw in the BSR countries corresponded to around 34% of the potential owned by the entire EU-
28, and the area used for growing dedicated perennial crops reached almost 65 thousand ha (55%
of the total area of these crops in the EU-28). The potential of obtaining manure and slurry was
also high, making up 25% and 30% of the potential of the whole European Union, respectively.
The above conditions allow the use of biomass for various purposes and in many bioenergy
technologies, i.e. direct combustion, biofuels or biogas production. There are large reasons for this
presented below. The share of heating and cooling (but mainly heating) corresponded to over half
of the final energy consumption in the BSR countries. The analysed countries were also
distinguished by a high share of gross electricity production, which corresponded to half the value
of the whole EU-28. Thus, the high level of development of bioenergy technologies and national
bioenergy resources justifies the recommendation to propose a strategy for the development of
bioenergy and to share the best technologies and the best practices in order to increase the
contribution of bioenergy in the BSR countries.
The global increase in human population, decreasing resources of fossil fuels and the progressing
climate change are the challenges that economy must face. Search for solutions is associated with
the development of smart solutions in line with resource-efficient and sustainable economy. The
concept of a biorefinery seems to be a solution to the current problems. A biorefinery understood
as a component of bio-based economy that is a promising technology for the management of
biomass, efficient conversion ways and pathways towards the use of biomass for production of
energy and materials, is a crucial element in the concept of cascade-like use of biomass.
56
7. References
AMEC Environment & Infrastructure UK Limited. Collection and Analysis of Data for the Control
of Emissions from the Spreading of Manure. Report for European Commission (DG
Environment), 2014; pp. 223.
Aronsson P, Rosenqvist H, Dimitriou I. Impact of Nitrogen Fertilization to Short-Rotation Willow
Coppice Plantations Grown in Sweden on Yield and Economy. Bioenerg Res 2014;7(3):
993-01.
Bioenergy Europe. Statistical Report 2018 edition, pp.201.
Bioenergy Europe. Statistical Report, Bioelectricity 2019a; pp.32.
Bioenergy Europe. Statistical Report, Biofuels for transport 2019b; pp.25.
Bioenergy Europe. Statistical Report, Biogas 2019c; pp.19.
Bioenergy Europe. Statistical Report, Biomass for heat 2019d; pp.34.
Bioenergy Europe. Statistical Report, Biomass supply 2019e; pp.35.
Biorefineries in Europe 2017 [www Document]. Bio-Based Ind. Consortium, Nov. Inst. URL
https://biconsortium.eu/downloads/biorefineries-europe-2017 (accessed 2.22.20).
Brown A, Wsidheim L, Landälv I, Saddler J, Ebadian M, McMillan JD, Bonomi A, Klein B. Advanced
Biofuels – Potential for Cost Reduction | Bioenergy, Published by IEA Bioenergy. 2020.
Cherubini F, Jungmeier G, Wellisch M, Willke T, Skiadas I, van Ree R, de Jong E. Toward a
common classification approach for biorefinery systems. Biofuels, Bioprod. Biorefining
2009;3, 534–546.
de Jong E, Higson A, Walsh P, Wellisch M. Bio-based Chemical Value Added Products from
Bioferineries. 2012.
Eurostat. Database https://ec.europa.eu/eurostat/data/database 2019 [accessed 27th December
2019].
FAO (The Food and Agriculture Organization of the United Nations). FAOSTAT. Live animals.
http://www.fao.org/faostat/en/?#data/QA 2019 [accessed 28th December 2019].
Gradziuk P, Stolarski M. The environment and the use of energy from renewable sources. In
monograph Śledź D, Waldziński D. Analysis of the current situation, development trends
and forecast of socio-economic changes in the Lubelskie Voivodeship. ed. AGRAF
2009:139–158 [in Polish].
Iqbal Y, Gauder M, Claupein W, Graeff–H€onninger S, Lewandowski I. Yield and quality
development comparison between miscanthus and switchgrass over a period of 10 years.
Energy 2015;89:268–76.
Krzyżaniak M, Stolarski MJ, Warmiński K. Life cycle assessment of poplar production:
Environmental impact of different soil enrichment methods. J Clean Prod 2019; 206:785–
96.
57
Krzyżaniak M, Stolarski MJ, Warmiński K. Life cycle assessment of Virginia mallow production
with different fertilisation options. J Clean Prod 2018;177:824–36.
Larsen SU, Jørgensen U, Lærke PE. Willow yield is highly dependent on clone and site. Bioenerg
Res 2014;7:1280–92.
Mola-Yudego B, Díaz-Yáñez O, Dimitriou I. How Much Yield Should We Expect from Fast-
Growing Plantations for Energy? Divergences Between Experiments and Commercial
Willow Plantations Bioenerg Res 2015;8(4):1769–77.
Monti A, Zanetti F, Scordia D, Testa G, Cosentino SL What to harvest when? Autumn, winter, annual
and biennial harvesting of giant reed, miscanthus and switchgrass in northern and southern
Mediterranean area. Ind Crops Prod 2015;75:129–34.
Motola V, De Bari I, Pierro N, Giocoli A. Bioeconomy and biorefining strategies in the EU Member
States and beyond | Bioenergy. 2018.
NRIAP (National Research Institute of Animal Production). Oszacowanie wielkości produkcji oraz
jednostkowej zawartości azotu nawozów naturalnych powstałych w różnych systemach
utrzymania zwierząt gospodarskich w Polsce. 2012; pp. 17 [in Polish].
Pocienė L, Kadžiulienė Ž. Biomass yield and fibre components in reed canary grass and tall fescue
grown as feedstock for combustion. Zemdirbyste-Agriculture 2016;103(3): 297–304.
Pocienė L, Šarūnaitė L. Tilvikienė V, Šlepetys J, Kadžiulienė Ž. The yield and composition of reed
canary grass biomass as raw material for combustion. Biologija 2013;59(2):195–200.
Pudelko R, Borzecka-Walker M, Faber A. The feedstock potential assessment for EU-27 +
Switzerland in NUTS-3.
http://bioboost.eu/uploads/files/bioboost_d1.2_iung_feedstock_potential_vers1_0-
final.pdf 2013. [accessed 27th December 2019].
Rancane S, Karklins A, Lazdina D, Berzins P, Bardule A, Butlers A, Lazdins A. Biomass yield and
chemical composition of Phalaris arundinacea L. using different rates of fermentation
residue as fertilizer. Agronomy Res 2017;15(2):521–29.
Scarlat N, Martinov M, Dallemand JF. Assessment of the availability of agricultural crop residues
in the European Union: Potential and limitations for bioenergy use. Waste Manage
2010;30:1889–97.
Serapiglia MJ, Cameron KD, Stipanovic AJ, Abrahamson LP, Volk TA, Smart LB. Yield and woody
biomass traits of novel shrub willow hybrids at two contrasting sites. Bioenerg Res
2013;6:533–46.
Sevel L, Nord-Larsen T, Ingerslev M, Jørgensen U, Raulund-Rasmussen K. Fertilization of SRC
Willow, I: Biomass Production Response. Bioenerg Res 2014;7(1):319–28.
Stolarski MJ, Krzyżaniak M, Szczukowski S, Tworkowski J, Grygutis J. Changes of the quality of
willow biomass as renewable energy feedstock harvested with biobaler. J Elem
2015;20(3):717–30.
58
Stolarski MJ, Niksa D, Krzyżaniak M, Tworkowski J, Szczukowski S. Willow productivity from
small- and large-scale experimental plantations in Poland from 2000 to 2017. Renew Sust
Energ Rev 2019a;101:461–75.
Stolarski MJ, Szczukowski S, Tworkowski J, Krzyżaniak M, Załuski D. Willow production during
12 consecutive years—The effects of harvest rotation, planting density and cultivar on
biomass yield. GCB Bioenergy 2019b;11: 635–56.
Stolarski MJ, Szczukowski S, Tworkowski J, Krzyżaniak M. Extensive willow biomass production
on marginal land. Polish J Environ Studies 2019c;28(6):1–9.
Stolarski MJ, Śnieg M, Krzyżaniak M, Tworkowski J, Szczukowski S. Short rotation coppices,
grasses and other herbaceous crops: Productivity and yield energy value versus 26
genotypes. Biomass Bioenergy 2018;119: 109–20.
Vanbeveren SPP, Spinelli R, Eisenbies M, Schweier J, Mola-Yudego B, Magagnotti N, Acuna M,
Dimitriou I, Ceulemans R. Mechanised harvesting of short-rotation coppices. Renew Sust
Energ Rev 2017;76:90–104.

59
Appendix 1
In Appendix 1. we provide data in tables from the figures of this study. Empty cells means that
the data were no available.
Total BSR means the total value for 9 Baltic Sea Region Countries.
% of the EU-28 means the share the total value for 9 Baltic Sea Region Countries in the relation
to the total value for the whole 28 European Union countries.
Table 1. Data shown in Fig. 1. Characterisation of land use (1000 ha) and populations (mln
people) in the Baltic Sea Region countries in 2017. Source: Eurostat. 2019.
Table 2. Data shown in Fig. 2. Forest area, forests available for wood supply (1000 ha) and % of
private forest ownership in 2017. Source: Eurostat. 2019.
Table 3. Data shown in Fig. 3. Fuel and industrial wood removals from forests and fuel wood
import and export (including wood for charcoal) (1000 m3) in BSR countries in 2017. Source:
Eurostat. 2019.
Table 4. Data shown in Fig. 4. Area cultivation of major agricultural crops in the BSR countries in
2017 (1000 ha). Source: Eurostat. 2019.
Table 5. Data shown in Fig. 5. Major crop production in the BSR countries in 2017 (1000 Mg).
Source: Eurostat. 2019.
Table 6. Data shown in Fig. 6. Plants harvested green from arable land in the BSR countries in
2017 (1000 Mg). Source: Eurostat. 2019.
Table 7. Data shown in Fig. 7. Cereals and oil seeds for the production of seed in the BSR
countries in 2017 (1000 Mg). Source: Eurostat. 2019.
Table 8. Data shown in Fig. 8. Root crops production in BSR countries in 2017 (1000 Mg).
Source: Eurostat. 2019.
Table 9. Data shown in Fig. 9. Vegetable production in the BSR countries in 2017 (1000 Mg).
Source: Eurostat. 2019.
Table 10. Data shown in Fig. 10. Fruit production in the BSR countries in 2017 (1000 Mg).
Source: Eurostat. 2019.
Table 11. Data shown in Fig. 11. Theoretical straw potential from cereals and oil seeds
production in the BSR countries in 2017 (1000 Mg/year). Source: own calculations.
Table 12. Data shown in Fig. 12. Technical straw potential for energy purposes from cereals and
oil seeds in the BSR countries in 2017 (1000 Mg/year). Source: own calculations.
Table 13. Data shown in Fig. 13. Area cropped with perennial energy crops in the BSR countries
in 2017 (ha). Source: Bioenergy Europe. 2019e.
Table 14. Data shown in Fig. 14. Theoretical potential of biomass from perennial energy crops in
the BSR countries in 2017 (1000 Mg/year). Source: own calculations.
Table 15. Data shown in Fig. 15. Animals in the BSR countries in 2017 (1000 heads). Source:
FAO. 2019.
60
Table 16. Data shown in Fig. 16. Theoretical manure potential in the BSR countries in 2017
(1000 Mg/year). Source: own calculations
Table 17. Data shown in Fig. 17. Theoretical slurry potential in the BSR countries in 2017 (1000
m3/year at 8-10% DM). Source: own calculations.
Table 18. Data shown in Fig. 18. Municipal waste by waste operation in the BSR countries in
2017 (1000 Mg/year). Source: Eurostat. 2019.
Table 19. Data shown in Fig. 19. Sludge disposal from wastewater treatment plants in the BSR
countries in 2015 (1000 Mg/year DM). Source: Eurostat. 2019.
Table 20. Data shown in Fig. 20. Catches - major fishing areas and production from aquaculture
excluding hatcheries and nurseries in 2017 (Mg live weight) *data for 2016 (Mg). Source:
Eurostat. 2019.
Table 21. Data shown in Fig. 21. Estimated amount of processing waste (tonnes) and estimated
potential of biogas generation (ktoe/year) from aquatic biomass resources (imported fish &
seafood, capture fisheries and aquaculture). Source: Calculations based on:
https://datam.jrc.ec.europa.eu/datam/public/pages/previousFilters.xhtml?dataset=34178536-
7fd1-4d5e-b0d4-116be8e4b124
https://datam.jrc.ec.europa.eu/datam/mashup/BIOMASS_FLOWS/index.html
Table 22. Data shown in Fig. 22. Technical biomass potential from different sources in the BSR
countries based on the results of project BioBoost (1000 Mg). Source: http://bioboost.eu
Table 23. Data shown in Fig. 23. Share of renewable energy in gross final energy consumption in
BSR countries in 2017 and target for 2020 (%). Source: Eurostat. 2019.
Table 24. Data shown in Fig. 24. Share of different types of renewable energy sources in gross
inland consumption of total renewable energy sources in BSR countries in 2017 (%). Source:
Eurostat. 2019.
Table 25. Data shown in Fig. 25. Pellet capacity. production (Mg) and number of pellet
manufacturing plants in the BSR countries in 2017. Source: Bioenergy Europe. 2018.
Table 26. Data shown in Fig. 26. Pellet consumption (Mg) in the BSR countries in 2017. Source:
Bioenergy Europe. 2018.
Table 27. Data shown in Fig. 27. Pellet production and consumption (Mg) in the BSR countries in
2017. Source: Bioenergy Europe. 2018.
Table 28. Data shown in Fig. 28. Distribution of population by degree of urbanisation in the BSR
countries in 2017 (%). Source: Eurostat. 2019.
Table 29. Data shown in Fig. 31. Distribution of population by degree of urbanisation in the BSR
countries in 2017. Source: own calculations based on Eurostat. 2019.
Table 30. Data shown in Fig. 32 Distribution of population by dwelling types in the BSR countries
in 2017. Source: Eurostat. 2019.
Table 31. Data shown in Fig. 33. Residential heat production by fuel in the BSR countries in 2017
(ktoe). Source: Bioenergy Europe. 2019d.

61
Table 32. Data shown in Fig. 34. Structure of residential heat production by fuel in the BSR
countries in 2017 (%). Source: Bioenergy Europe. 2019d.
Table 33. Data shown in Fig. 35. Heating and cooling consumption (ktoe) compared with total
final energy consumption (%) in the BSR countries in 2017. Source: Bioenergy Europe. 2019d.
Table 34. Data shown in Fig. 36. Gross production of derived heat (ktoe) by type of fuels in the
BSR countries in 2017. Source: Bioenergy Europe. 2019d.
Table 35. Data shown in Fig. 37. Share of solid biomass. biogas. renewable waste and liquid
biofuels in gross production of derived bioheat in the BSR countries in 2017 (%). Source:
Bioenergy Europe. 2019d.
Table 36. Data shown in Fig. 39. Gross electricity production (ktoe) in the BSR countries in 2017.
Source: Eurostat. 2019.
Table 37. Data shown in Fig. 41. Share of solid biomass. biogas. renewable municipal waste and
liquid biofuels in gross electricity generation from biomass and share of bioelectricity in total
gross electricity generation in the BSR countries in 2017 (%). Source: Bioenergy Europe. 2019a.
Table 38. Data shown in Fig. 42. Biofuels capacity in the BSR countries in 2017 (1000 Mg/year).
Source: Bioenergy Europe. 2019b.
Table 39. Data shown in Fig. 44. Primary bioethanol production and final energy consumption in
the transport sector in the BSR countries in 2017 (ktoe). Source: Bioenergy Europe. 2019b.
Table 40. Data shown in Fig. 45. Primary biodiesel production and final energy consumption in
the transport sector in the BSR countries in 2017 (ktoe). Source: Bioenergy Europe. 2019b.
Table 41. Data shown in Fig. 47. Feedstock use for biogas production (excluding landfill -
expressed as a mass percentage) in the BSR countries in 2017. Source: Bioenergy Europe. 2019c.
Table 42. Data shown in Fig. 48. Primary energy production of biogas by biogas plant type in the
BSR countries in 2017 (%). Source: Bioenergy Europe. 2019c.
Table 43. Data shown in Fig. 49. Gross final energy consumption from biogas by end-use in the
BSR countries in 2017 (%). Source: Bioenergy Europe. 2019c.
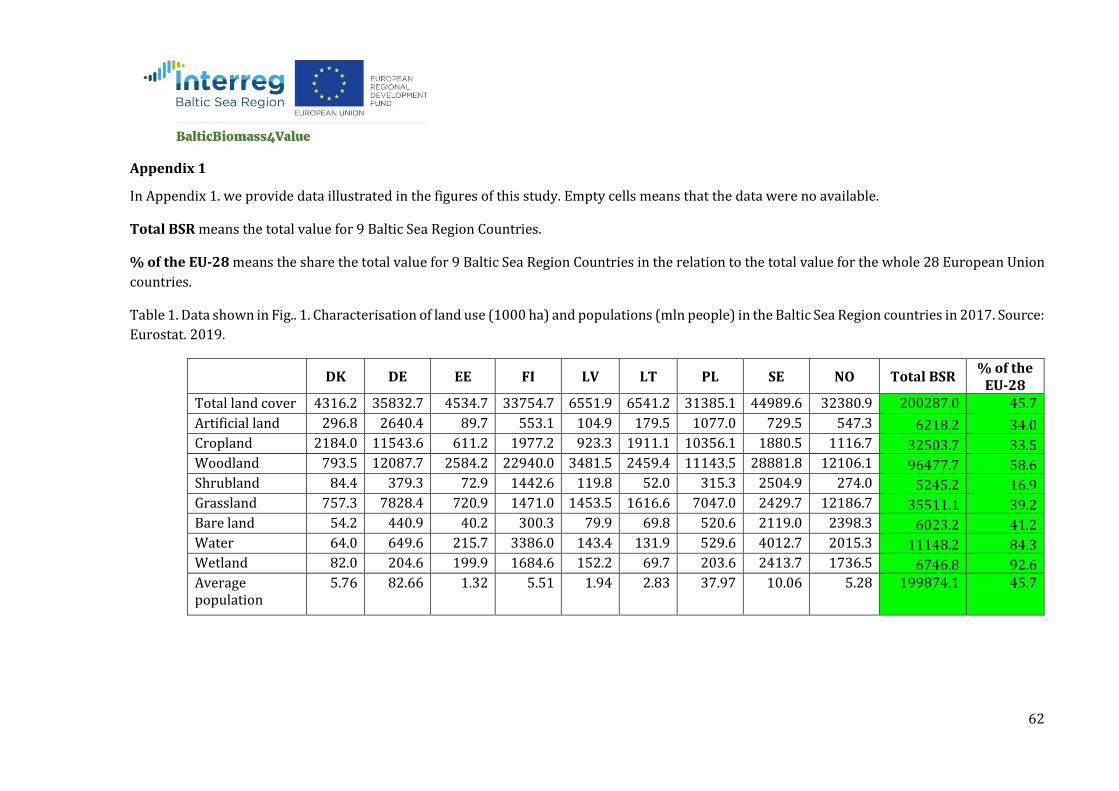
62
Appendix 1
In Appendix 1. we provide data illustrated in the figures of this study. Empty cells means that the data were no available.
Total BSR means the total value for 9 Baltic Sea Region Countries.
% of the EU-28 means the share the total value for 9 Baltic Sea Region Countries in the relation to the total value for the whole 28 European Union
countries.
Table 1. Data shown in Fig.. 1. Characterisation of land use (1000 ha) and populations (mln people) in the Baltic Sea Region countries in 2017. Source:
Eurostat. 2019.
DK DE EE FI LV LT PL SE NO Total BSR % of the
EU-28 Total land cover 4316.2 35832.7 4534.7 33754.7 6551.9 6541.2 31385.1 44989.6 32380.9 200287.0 45.7
Artificial land 296.8 2640.4 89.7 553.1 104.9 179.5 1077.0 729.5 547.3 6218.2 34.0 Cropland 2184.0 11543.6 611.2 1977.2 923.3 1911.1 10356.1 1880.5 1116.7 32503.7 33.5 Woodland 793.5 12087.7 2584.2 22940.0 3481.5 2459.4 11143.5 28881.8 12106.1 96477.7 58.6 Shrubland 84.4 379.3 72.9 1442.6 119.8 52.0 315.3 2504.9 274.0 5245.2 16.9 Grassland 757.3 7828.4 720.9 1471.0 1453.5 1616.6 7047.0 2429.7 12186.7 35511.1 39.2 Bare land 54.2 440.9 40.2 300.3 79.9 69.8 520.6 2119.0 2398.3 6023.2 41.2 Water 64.0 649.6 215.7 3386.0 143.4 131.9 529.6 4012.7 2015.3 11148.2 84.3 Wetland 82.0 204.6 199.9 1684.6 152.2 69.7 203.6 2413.7 1736.5 6746.8 92.6 Average population
5.76 82.66 1.32 5.51 1.94 2.83 37.97 10.06 5.28 199874.1 45.7
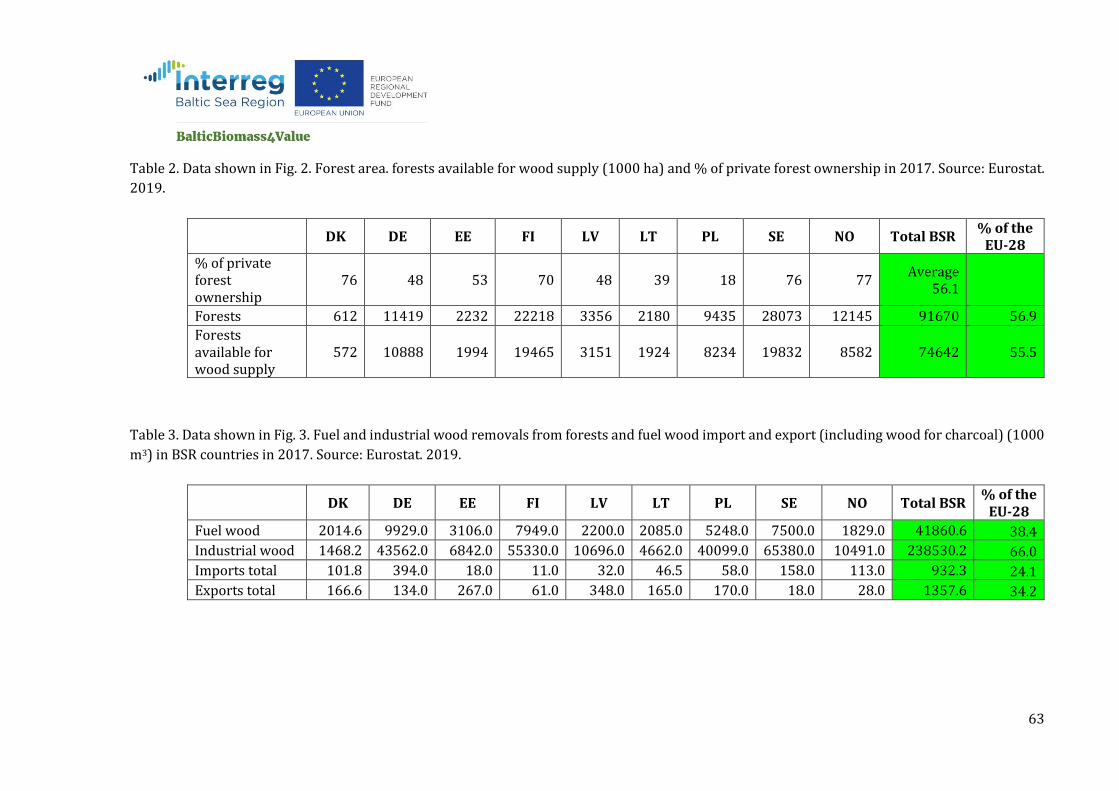
63
Table 2. Data shown in Fig. 2. Forest area. forests available for wood supply (1000 ha) and % of private forest ownership in 2017. Source: Eurostat.
2019.
DK DE EE FI LV LT PL SE NO Total BSR % of the
EU-28 % of private forest ownership
76 48 53 70 48 39 18 76 77 Average
56.1
Forests 612 11419 2232 22218 3356 2180 9435 28073 12145 91670 56.9
Forests available for wood supply
572 10888 1994 19465 3151 1924 8234 19832 8582 74642 55.5
Table 3. Data shown in Fig. 3. Fuel and industrial wood removals from forests and fuel wood import and export (including wood for charcoal) (1000
m3) in BSR countries in 2017. Source: Eurostat. 2019.
DK DE EE FI LV LT PL SE NO Total BSR % of the
EU-28
Fuel wood 2014.6 9929.0 3106.0 7949.0 2200.0 2085.0 5248.0 7500.0 1829.0 41860.6 38.4
Industrial wood 1468.2 43562.0 6842.0 55330.0 10696.0 4662.0 40099.0 65380.0 10491.0 238530.2 66.0
Imports total 101.8 394.0 18.0 11.0 32.0 46.5 58.0 158.0 113.0 932.3 24.1
Exports total 166.6 134.0 267.0 61.0 348.0 165.0 170.0 18.0 28.0 1357.6 34.2
64
Table 4. Data shown in Fig. 4. Area cultivation of major agricultural crops in the BSR countries in 2017 (1000 ha). Source: Eurostat. 2019.
DK DE EE FI LV LT PL SE NO Total BSR % of the
EU-28
Cereals 1442.7 6276.2 330.7 864.5 633.4 1199.5 7602.0 993.1 285.9 19628.0 35.3 Dry pulses and protein crops 20.6 178.1 65.6 20.3 48.2 236.2 272.4 55.1 0.0 896.5 34.7
Root crops 88.5 662.5 3.5 33.0 21.7 37.0 560.8 55.6 11.7 1462.6 40.3
Industrial crops 177.6 1398.7 85.5 76.4 115.4 195.2 1003.2 118.8 0.0 3170.8 Plants harvested green 492.1 2753.8 170.8 780.9 294.0 228.9 1037.7 1119.2 0.0 6877.3 33.0 Fresh vegetables 11.3 125.0 2.4 12.3 2.4 10.1 192.0 10.8 0.0 366.2 17.3 Fruits. berries and nuts 3.2 59.0 1.9 3.2 5.5 21.6 323.5 2.0 0.0 419.8
Strawberries 1.2 14.2 0.5 6.9 0.5 0.8 49.8 2.0 1.5 77.4 71.4
Total 2237.1 11467.4 660.8 1797.5 1121.1 1929.4 11041.4 2356.5 299.1 32910.4

65
Table 5. Data shown in Fig. 5. Major crop production in the BSR countries in 2017 (1000 Mg). Source: Eurostat. 2019.
DK DE EE FI LV LT PL SE NO Total BSR
% of the EU-28
Cereals 9883.0 45593.2 1311.9 3462.1 2692.5 5074.2 31331.0 5958.4 1205.8 106512.1 34.4 Dry pulses and protein crops 88.1 571.0 75.3 42.7 170.7 707.4 598.0 190.5 0.0 2443.6 39.4
Root crops 4920.1 46231.6 63.9 1042.3 214.2 1202.2 25041.8 2816.0 314.5 81532.1
Industrial crops 742.3 4398.5 168.9 92.3 328.2 553.7 2657.8 385.1 0.0 9326.6 Plants harvested green 32751.2 115147.1 0.0 7877.5 0.0 5440.8 22626.4 15244.3 0.0 199087.3
Table 6. Data shown in Fig. 6. Plants harvested green from arable land in the BSR countries in 2017 (1000 Mg). Source: Eurostat. 2019.
DK DE EE FI LV LT PL SE NO Total BSR
% of the EU-28
Temporary grasses and grazings 20417.9 5989.1 0.0 6794.7 0.0 3920.8 3019.4 13890.0 0.0 54031.9 Leguminous plants harvested green 192.3 6569.1 0.0 13.3 0.0 711.6 2374.9 0.0 0.0 9861.3
Green maize 10141.8 99473.4 208.7 0.0 689.3 643.7 16582.8 537.7 0.0 128277.4 48.7 Other cereals harvested green 2126.7 2825.0 88.1 1034.6 30.8 80.4 522.6 494.3 0.0 7202.5 64.6 Other plants harvested green 0.0 0.0 0.0 0.0 0.0 6.9 126.7 322.3 0.0 455.9
66
Table 7. Data shown in Fig. 7. Cereals and oil seeds for the production of seed in the BSR countries in 2017 (1000 Mg). Source: Eurostat. 2019.
DK DE EE FI LV LT PL SE NO Total BSR
% of the EU-28
Wheat and spelt 4777.9 24481.6 713.3 812.2 2138.8 3917.4 11448.7 3298.6 0.0 51588.4 34.0 Rye and winter cereal mixtures 714.8 2737.4 52.4 115.2 129.4 63.1 2869.4 141.8 42.5 6866.0 89.7
Barley 3945.9 10853.4 425.7 1477.1 240.9 519.7 3722.5 1635.2 527.8 23348.1 39.8
Oats 318.4 576.5 89.4 1028.1 134.0 195.9 1437.4 676.4 260.9 4717.0 57.6 Spring cereal mixtures 27.7 43.3 1.4 28.6 6.3 20.3 2548.9 41.1 0.0 2717.6 88.9 Grain maize and corn-cob-mix 38.5 4547.6 0.0 0.0 0.0 57.0 3946.8 8.8 0.0 8598.6 13.3
Triticale 59.8 2317.0 26.5 0.0 26.0 247.5 5213.2 156.5 0.0 8046.5 69.4 Other cereals (buckwheat. millet...) 0.0 0.0 3.4 0.0 17.1 53.3 144.2 0.0 0.0 218.0 30.6
Oilseeds 742.3 4398.5 165.3 92.3 327.9 553.5 2648.2 385.1 0.0 9312.9
67
Table 8. Data shown in Fig. 8. Root crops production in BSR countries in 2017 (1000 Mg). Source: Eurostat. 2019.
DK DE EE FI LV LT PL SE NO Total BSR
% of the EU-28
Potatoes 2171.0 11720.0 63.2 611.9 209.3 231.7 8956.0 852.5 314.5 25130.2 40.5
Sugar beet 2454.6 34059.9 0.0 430.3 0.0 957.0 15733.0 1963.5 0.0 55598.2 38.8
Table 9. Data shown in Fig. 9. Vegetable production in the BSR countries in 2017 (1000 Mg). Source: Eurostat. 2019.
DK DE EE FI LV LT PL SE NO Total BSR
% of the EU-28
Brassicas 53.7 922.8 10.1 32.1 20.5 47.6 1400.6 30.9 0.0 2518.4 35.4 Leafy and stalked vegetables (excluding brassicas) 32.7 693.9 0.0 19.5 0.7 3.1 263.3 37.0 0.0 1050.1 14.3 Vegetables cultivated for fruit (including melons) 28.5 525.7 6.8 92.9 13.2 33.2 1705.1 58.4 28.3 2492.0 8.0 Root. tuber and bulb vegetables 198.7 1660.6 12.4 115.6 25.8 91.3 2156.3 202.4 70.2 4533.4 28.6
Fresh pulses 15.4 87.1 0.7 7.2 0.0 0.7 128.3 12.4 0.0 251.6 11.0
68
Table 10. Data shown in Fig. 10. Fruit production in the BSR countries in 2017 (1000 Mg). Source: Eurostat. 2019.
DK DE EE FI LV LT PL SE NO Total BSR
% of the EU-28
Apples 20.5 596.7 1.0 6.8 7.5 73.4 2441.4 22.1 12.7 3181.9 31.7
Pears 4.5 23.4 0.0 0.2 0.4 2.0 55.1 2.1 0.3 87.9 3.6
Plums 0.4 26.6 0.0 0.0 0.1 0.3 58.4 0.3 1.2 87.2 6.7
Cherries 4.2 24.8 0.0 0.0 0.1 0.5 91.3 0.1 0.6 121.5 16.4
Currants 3.3 12.5 0.2 1.9 0.4 3.8 128.8 0.4 0.0 151.2 79.6
Raspberries 0.1 6.4 0.1 1.1 0.2 1.7 104.5 0.4 3.0 117.5 54.6
Blueberries 0.1 13.8 0.0 0.1 0.3 0.1 16.3 0.1 0.0 30.9 35.7
Strawberries 6.7 135.3 1.1 12.0 1.4 2.1 189.1 15.7 8.5 371.9 29.4
Grapes 0.0 0.0 0.0 0.0 0.0 0.0 2.8 0.1 0.0 2.8 0.0
Nuts 0.0 0.0 0.0 0.0 0.0 0.1 8.4 0.0 0.0 8.4 0.9

69
Table 11. Data shown in Fig. 11. Theoretical straw potential from cereals and oil seeds production in the BSR countries in 2017 (1000 Mg/year).
Source: own calculations.
DK DE EE FI LV LT PL SE NO Total BSR
% of the EU-
28
Wheat and spelt 4300.1 22033.4 641.9 731.0 1924.9 3525.6 10303.8 2968.7 0.0 46429.6 34.0 Rye and winter cereal mixtures 643.3 2463.7 47.1 103.7 116.5 56.8 2582.5 127.6 38.3 6179.4 89.7
Barley 3551.3 9768.1 383.1 1329.4 216.8 467.8 3350.2 1471.7 475.0 21013.3 39.8
Oats 286.6 518.9 80.5 925.2 120.6 176.3 1293.6 608.8 234.8 4245.3 57.6 Spring cereal mixtures 25.0 39.0 1.2 25.7 5.7 18.3 2294.0 37.0 0.0 2445.8 88.9 Grain maize and corn-cob-mix 34.6 4092.8 0.0 0.0 0.0 51.3 3552.1 7.9 0.0 7738.7 13.3
Triticale 53.8 2085.3 23.8 0.0 23.4 222.8 4691.9 140.9 0.0 7241.8 69.4 Other cereals (buckwheat. millet...) 0.0 0.0 3.1 0.0 15.4 48.0 129.8 0.0 0.0 196.2 30.6
Oilseeds 668.0 3958.7 148.7 83.0 295.1 498.1 2383.3 346.6 0.0 8381.6 Total 9562.7 44959.8 1329.4 3198.1 2718.4 5064.9 30581.2 5709.2 748.1 103871.7

70
Table 12. Data shown in Fig. 12. Technical straw potential for energy purposes from cereals and oil seeds in the BSR countries in 2017 (1000
Mg/year). Source: own calculations.
DK DE EE FI LV LT PL SE NO Total BSR
% of the EU-28
Wheat and spelt 716.7 3672.2 107.0 121.8 320.8 587.6 1717.3 494.8 0.0 7738.3 34.0 Rye and winter cereal mixtures 107.2 410.6 7.9 17.3 19.4 9.5 430.4 21.3 6.4 1029.9 89.7
Barley 591.9 1628.0 63.9 221.6 36.1 78.0 558.4 245.3 79.2 3502.2 39.8
Oats 47.8 86.5 13.4 154.2 20.1 29.4 215.6 101.5 39.1 707.5 57.6 Spring cereal mixtures 4.2 6.5 0.2 4.3 0.9 3.0 382.3 6.2 0.0 407.6 88.9 Grain maize and corn-cob-mix 5.8 682.1 0.0 0.0 0.0 8.5 592.0 1.3 0.0 1289.8 13.3
Triticale 9.0 347.6 4.0 0.0 3.9 37.1 782.0 23.5 0.0 1207.0 69.4 Other cereals (buckwheat. millet...) 0.0 0.0 0.5 0.0 2.6 8.0 21.6 0.0 0.0 32.7 30.6
Oilseeds 111.3 659.8 24.8 13.8 49.2 83.0 397.2 57.8 0.0 1396.9 Total 1593.8 7493.3 221.6 533.0 453.1 844.1 5096.9 951.5 124.7 17312.0
71
Table 13. Data shown in Fig. 13. Area cropped with perennial energy crops in the BSR countries in 2017 (ha). Source: Bioenergy Europe. 2019e.
DK DE EE FI LV LT PL SE NO Total BSR
% of the EU-28
Short Rotation Coppice 8896 6600 26 666 4063 16832 10932 48015 75.1 Grasy energy crops 66 9200 5452 253 992 691 16654 31.1
Total 8962 15800 5478 919 4063 17824 11623 64669 55.1
Table 14. Data shown in Fig. 14. Theoretical potential of biomass from perennial energy crops in the BSR countries in 2017 (1000 Mg/year). Source:
own calculations.
DK DE EE FI LV LT PL SE NO Total BSR
% of the EU-28
Short Rotation Coppice 62.3 46.2 0.0 0.2 4.7 28.4 117.8 76.5 0.0 336.1 Grasy energy crops 0.5 64.4 0.0 38.2 1.8 0.0 6.9 4.8 0.0 116.6
Total 62.7 110.6 0.0 38.3 6.4 28.4 124.8 81.4 0.0 452.7
72
Table 15. Data shown in Fig. 15. Animals in the BSR countries in 2017 (1000 heads). Source: FAO. 2019.
DK DE EE FI LV LT PL SE NO Total BSR
% of the EU-
28
Cattle 1545 12281 248 893 412 695 6143 1449 861 24528 27.3
Pigs 12308 27578 266 1136 336 664 11353 1382 811 55833 37.8
Sheep 154 1580 86 156 107 164 261 606 2393 5506 5.5
Horses 52 448 6 74 9 16 185 103 34 928 27.5
Goats 0 140 5 5 13 13 44 0 62 284 1.9
Chickens 20733 160000 2054 8047 2171 9917 177640 9075 14480 404117 29.0
Turkeys 304 12875 10 292 18 146 12228 100 638 26611 29.5
Ducks 174 2417 9 0 0 16 3181 0 121 5918 13.7 Geese and guinea fowls 4 301 8 0 0 13 4173 0 0 4499 40.1
Total 35274 217620 2692 10603 3067 11644 215209 12714 19401
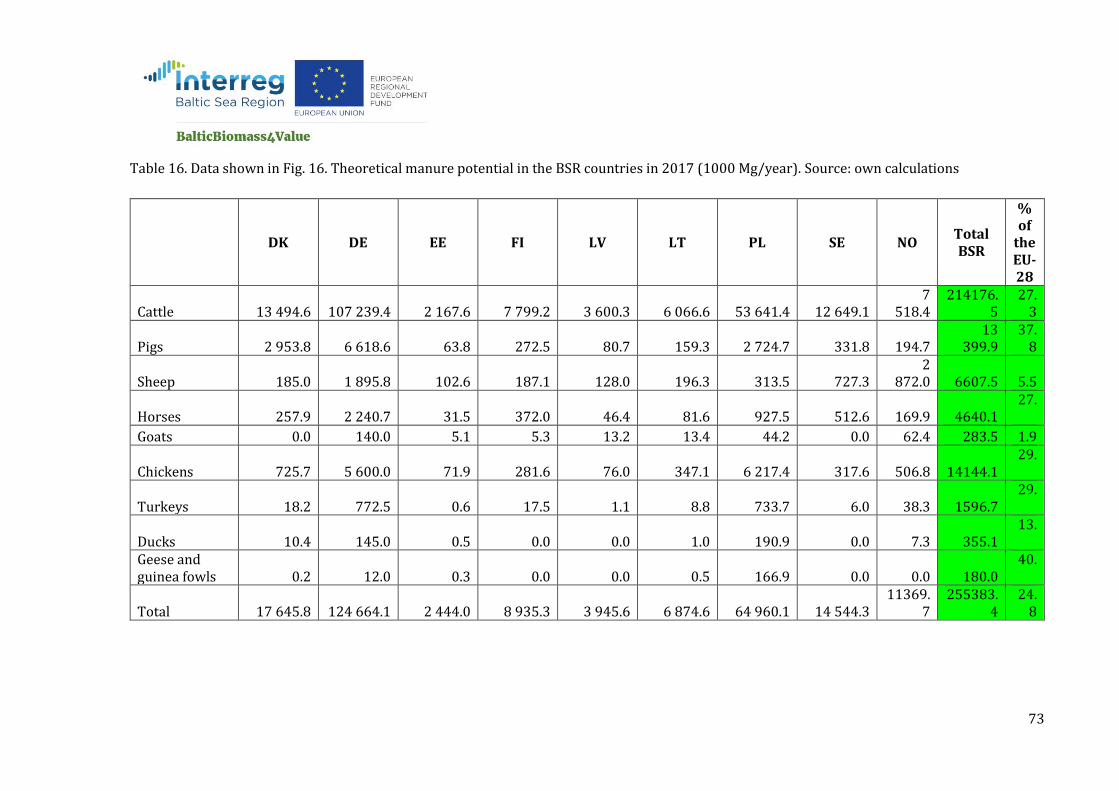
73
Table 16. Data shown in Fig. 16. Theoretical manure potential in the BSR countries in 2017 (1000 Mg/year). Source: own calculations
DK DE EE FI LV LT PL SE NO Total BSR
% of
the EU-28
Cattle 13 494.6 107 239.4 2 167.6 7 799.2 3 600.3 6 066.6 53 641.4 12 649.1 7
518.4 214176.
5 27.
3
Pigs 2 953.8 6 618.6 63.8 272.5 80.7 159.3 2 724.7 331.8 194.7 13
399.9 37.
8
Sheep 185.0 1 895.8 102.6 187.1 128.0 196.3 313.5 727.3 2
872.0 6607.5 5.5
Horses 257.9 2 240.7 31.5 372.0 46.4 81.6 927.5 512.6 169.9 4640.1 27.
5
Goats 0.0 140.0 5.1 5.3 13.2 13.4 44.2 0.0 62.4 283.5 1.9
Chickens 725.7 5 600.0 71.9 281.6 76.0 347.1 6 217.4 317.6 506.8 14144.1 29.
0
Turkeys 18.2 772.5 0.6 17.5 1.1 8.8 733.7 6.0 38.3 1596.7 29.
5
Ducks 10.4 145.0 0.5 0.0 0.0 1.0 190.9 0.0 7.3 355.1 13.
7 Geese and guinea fowls 0.2 12.0 0.3 0.0 0.0 0.5 166.9 0.0 0.0 180.0
40.1
Total 17 645.8 124 664.1 2 444.0 8 935.3 3 945.6 6 874.6 64 960.1 14 544.3 11369.
7 255383.
4 24.
8

74
Table 17. Data shown in Fig. 17. Theoretical slurry potential in the BSR countries in 2017 (1000 m3/year at 8-10% DM). Source: own calculations.
DK DE EE FI LV LT PL SE NO Total BSR
% of the EU-28
Cattle 14573.3 115811.7 2340.9 8422.7 3888.1 6551.5 57929.3 13660.2 8119.3 231296.9 27.3
Pigs 19643.0 44013.8 424.4 1812.4 536.9 1059.6 18118.9 2206.2 1294.4 89109.6 37.8
Total 34216.3 159825.5 2765.3 10235.1 4425.0 7611.1 76048.2 15866.4 9413.8 320406.6 29.6
75
Table 18. Data shown in Fig. 18. Municipal waste by waste operation in the BSR countries in 2017 (1000 Mg/year). Source: Eurostat. 2019.
DK DE EE FI LV LT PL SE NO Total BSR
% of the EU-28
Disposal - landfill and other 38.0 451.0 98.0 26.0 518.0 421.0 5000.0 20.0 137.0
6709.0 11.5
Disposal - incineration 0.0 612.0 0.0 0.0 0.0 0.0 198.0 0.0 0.0 810.0 35.7 Recovery - energy recovery 2355.0 15946.0 217.0 1646.0 21.0 236.0 2724.0 2400.0 2088.0
27633.0 40.3
Recycling - material 1282.0 25355.0 127.0 771.0 141.0 311.0 3199.0 1426.0 1138.0 33750.0 45.7 Recycling - composting and digestion 834.0 9429.0 19.0 369.0 57.0 308.0 848.0 704.0 395.0
12963.0 31.3
Total 4509.0 51790.0 492.0 2812.0 737.0 1275.0 11969.0 4551.0 3949.0 82084.0 33.4
Table 19. Data shown in Fig. 19. Sludge disposal from wastewater treatment plants in the BSR countries in 2015 (1000 Mg/year DM). Source:
Eurostat. 2019.
DK DE EE FI LV LT PL SE NO
Agricultural use 427.7 0.3 4.706 11.218 126.6 59.5 70.9
Compost and other applications 223.674 16.44 6.074 15.565 48.2 0 20.5
Landfill 0 2.4 0.396 0 131.5 0 19.6
Incineration 1148.679 0 0 0 165.4 0 0
Other 2.998 14.43 11.618 0 479.8 0 3.3
Total 1803.1 33.6 22.8 26.8 951.5 59.5 114.4
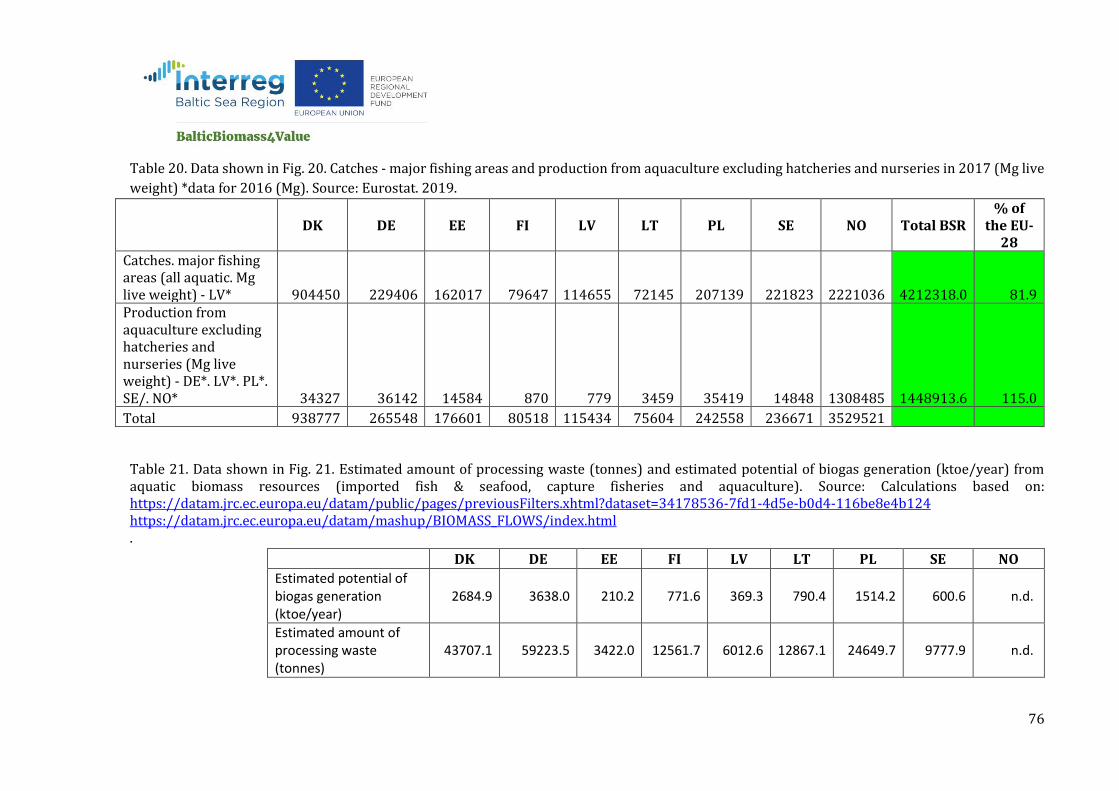
76
Table 20. Data shown in Fig. 20. Catches - major fishing areas and production from aquaculture excluding hatcheries and nurseries in 2017 (Mg live
weight) *data for 2016 (Mg). Source: Eurostat. 2019.
DK DE EE FI LV LT PL SE NO Total BSR % of
the EU-28
Catches. major fishing areas (all aquatic. Mg live weight) - LV* 904450 229406 162017 79647 114655 72145 207139 221823 2221036 4212318.0 81.9 Production from aquaculture excluding hatcheries and nurseries (Mg live weight) - DE*. LV*. PL*. SE/. NO* 34327 36142 14584 870 779 3459 35419 14848 1308485 1448913.6 115.0
Total 938777 265548 176601 80518 115434 75604 242558 236671 3529521
Table 21. Data shown in Fig. 21. Estimated amount of processing waste (tonnes) and estimated potential of biogas generation (ktoe/year) from aquatic biomass resources (imported fish & seafood, capture fisheries and aquaculture). Source: Calculations based on: https://datam.jrc.ec.europa.eu/datam/public/pages/previousFilters.xhtml?dataset=34178536-7fd1-4d5e-b0d4-116be8e4b124 https://datam.jrc.ec.europa.eu/datam/mashup/BIOMASS_FLOWS/index.html .
DK DE EE FI LV LT PL SE NO
Estimated potential of biogas generation (ktoe/year)
2684.9 3638.0 210.2 771.6 369.3 790.4 1514.2 600.6 n.d.
Estimated amount of processing waste (tonnes)
43707.1 59223.5 3422.0 12561.7 6012.6 12867.1 24649.7 9777.9 n.d.
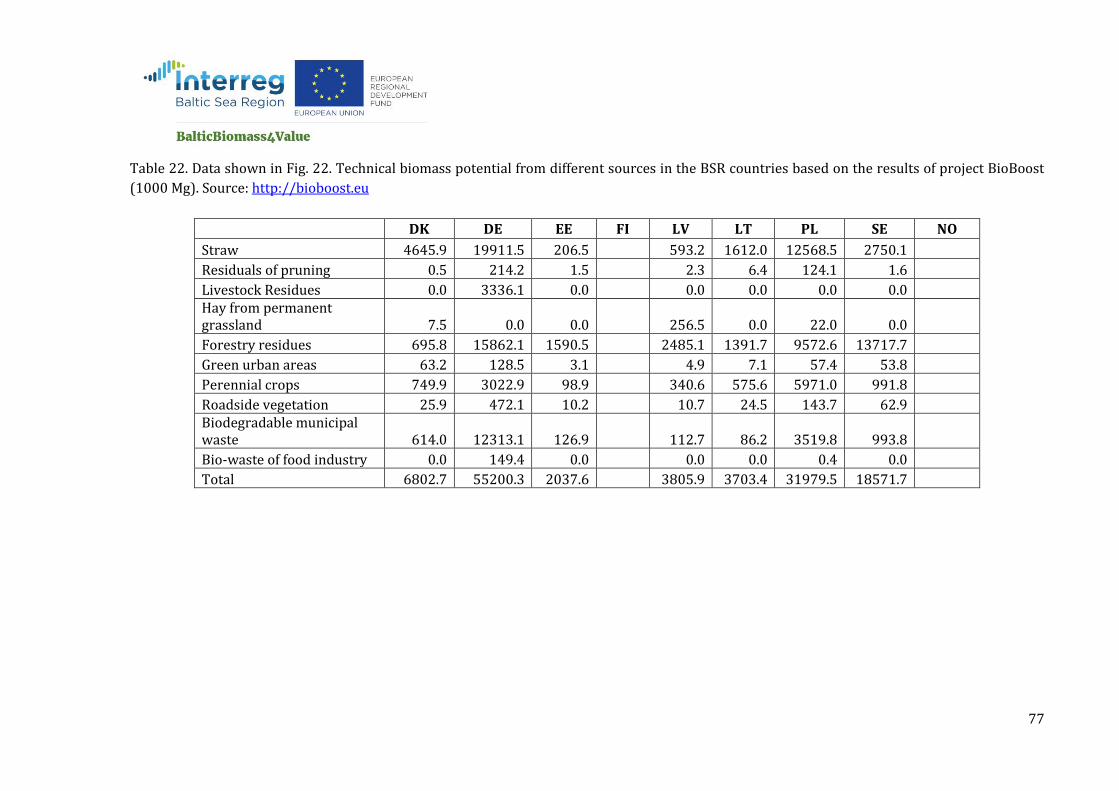
77
Table 22. Data shown in Fig. 22. Technical biomass potential from different sources in the BSR countries based on the results of project BioBoost
(1000 Mg). Source: http://bioboost.eu
DK DE EE FI LV LT PL SE NO
Straw 4645.9 19911.5 206.5 593.2 1612.0 12568.5 2750.1
Residuals of pruning 0.5 214.2 1.5 2.3 6.4 124.1 1.6
Livestock Residues 0.0 3336.1 0.0 0.0 0.0 0.0 0.0
Hay from permanent grassland 7.5 0.0 0.0
256.5 0.0 22.0 0.0
Forestry residues 695.8 15862.1 1590.5 2485.1 1391.7 9572.6 13717.7
Green urban areas 63.2 128.5 3.1 4.9 7.1 57.4 53.8
Perennial crops 749.9 3022.9 98.9 340.6 575.6 5971.0 991.8
Roadside vegetation 25.9 472.1 10.2 10.7 24.5 143.7 62.9
Biodegradable municipal waste 614.0 12313.1 126.9
112.7 86.2 3519.8 993.8
Bio-waste of food industry 0.0 149.4 0.0 0.0 0.0 0.4 0.0
Total 6802.7 55200.3 2037.6 3805.9 3703.4 31979.5 18571.7
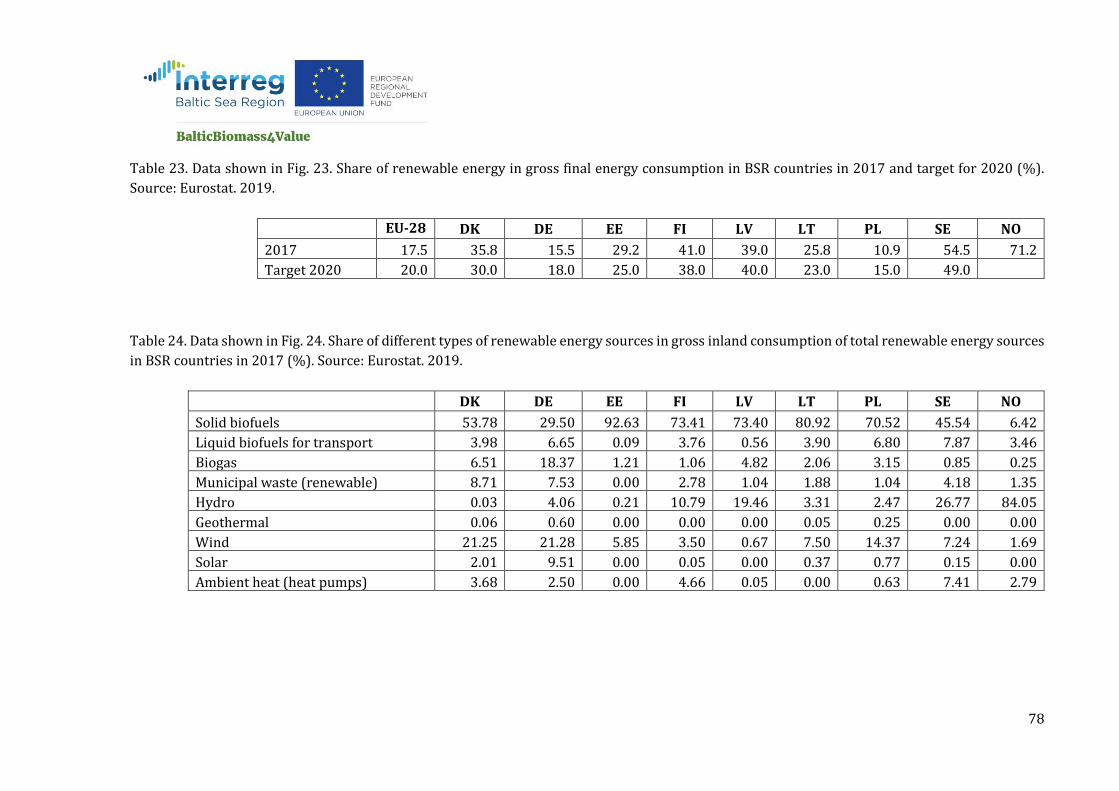
78
Table 23. Data shown in Fig. 23. Share of renewable energy in gross final energy consumption in BSR countries in 2017 and target for 2020 (%).
Source: Eurostat. 2019.
EU-28 DK DE EE FI LV LT PL SE NO
2017 17.5 35.8 15.5 29.2 41.0 39.0 25.8 10.9 54.5 71.2
Target 2020 20.0 30.0 18.0 25.0 38.0 40.0 23.0 15.0 49.0
Table 24. Data shown in Fig. 24. Share of different types of renewable energy sources in gross inland consumption of total renewable energy sources
in BSR countries in 2017 (%). Source: Eurostat. 2019.
DK DE EE FI LV LT PL SE NO
Solid biofuels 53.78 29.50 92.63 73.41 73.40 80.92 70.52 45.54 6.42
Liquid biofuels for transport 3.98 6.65 0.09 3.76 0.56 3.90 6.80 7.87 3.46
Biogas 6.51 18.37 1.21 1.06 4.82 2.06 3.15 0.85 0.25
Municipal waste (renewable) 8.71 7.53 0.00 2.78 1.04 1.88 1.04 4.18 1.35
Hydro 0.03 4.06 0.21 10.79 19.46 3.31 2.47 26.77 84.05
Geothermal 0.06 0.60 0.00 0.00 0.00 0.05 0.25 0.00 0.00
Wind 21.25 21.28 5.85 3.50 0.67 7.50 14.37 7.24 1.69
Solar 2.01 9.51 0.00 0.05 0.00 0.37 0.77 0.15 0.00
Ambient heat (heat pumps) 3.68 2.50 0.00 4.66 0.05 0.00 0.63 7.41 2.79
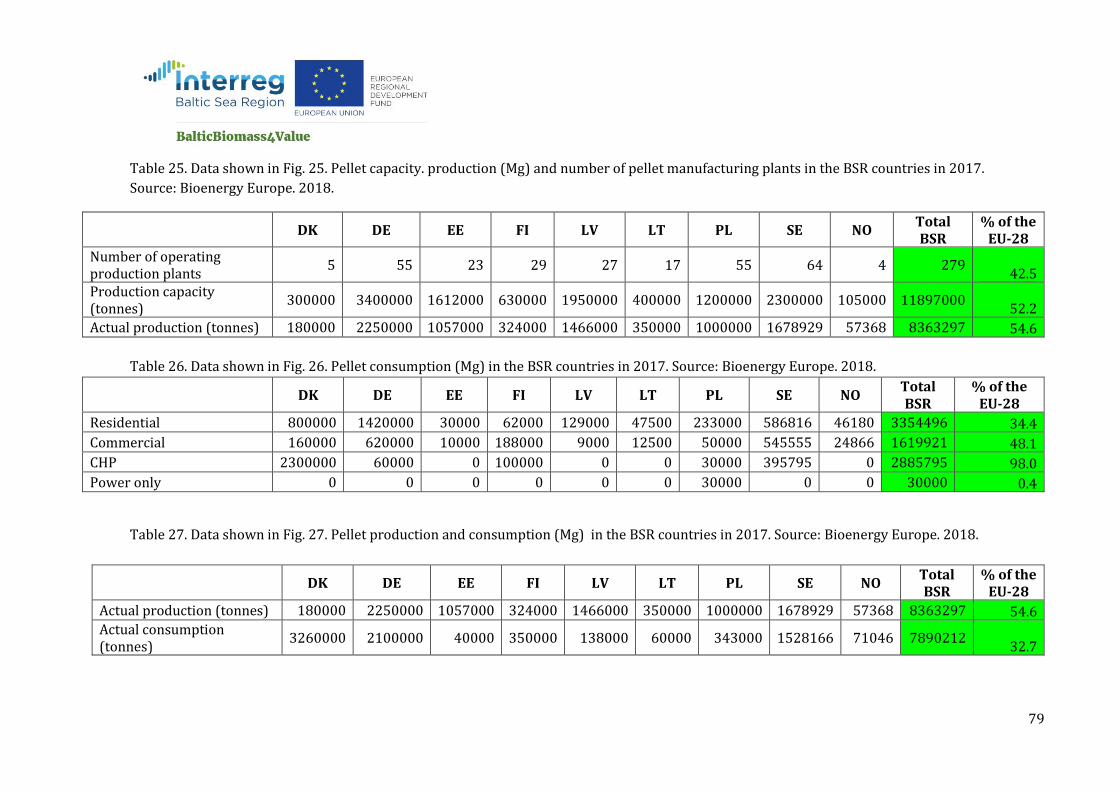
79
Table 25. Data shown in Fig. 25. Pellet capacity. production (Mg) and number of pellet manufacturing plants in the BSR countries in 2017.
Source: Bioenergy Europe. 2018.
DK DE EE FI LV LT PL SE NO Total BSR
% of the EU-28
Number of operating production plants
5 55 23 29 27 17 55 64 4 279 42.5
Production capacity (tonnes)
300000 3400000 1612000 630000 1950000 400000 1200000 2300000 105000 11897000 52.2
Actual production (tonnes) 180000 2250000 1057000 324000 1466000 350000 1000000 1678929 57368 8363297 54.6
Table 26. Data shown in Fig. 26. Pellet consumption (Mg) in the BSR countries in 2017. Source: Bioenergy Europe. 2018.
DK DE EE FI LV LT PL SE NO Total BSR
% of the EU-28
Residential 800000 1420000 30000 62000 129000 47500 233000 586816 46180 3354496 34.4
Commercial 160000 620000 10000 188000 9000 12500 50000 545555 24866 1619921 48.1
CHP 2300000 60000 0 100000 0 0 30000 395795 0 2885795 98.0
Power only 0 0 0 0 0 0 30000 0 0 30000 0.4
Table 27. Data shown in Fig. 27. Pellet production and consumption (Mg) in the BSR countries in 2017. Source: Bioenergy Europe. 2018.
DK DE EE FI LV LT PL SE NO Total BSR
% of the EU-28
Actual production (tonnes) 180000 2250000 1057000 324000 1466000 350000 1000000 1678929 57368 8363297 54.6 Actual consumption (tonnes)
3260000 2100000 40000 350000 138000 60000 343000 1528166 71046 7890212 32.7
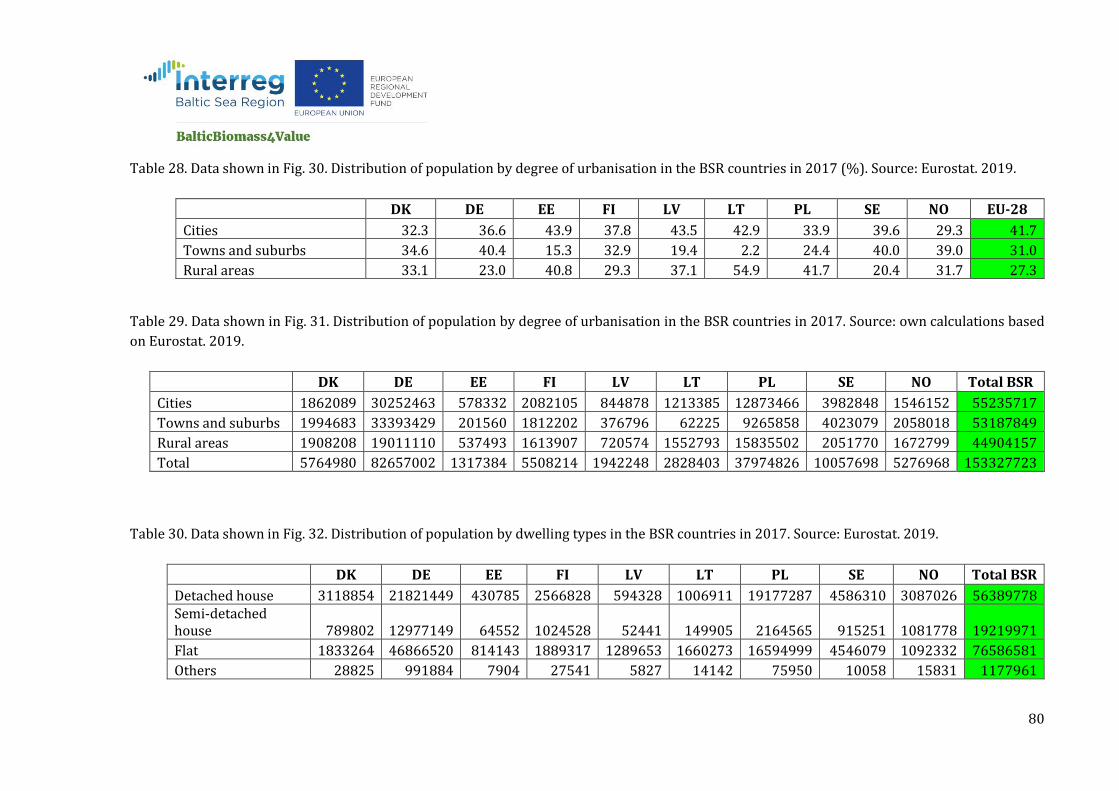
80
Table 28. Data shown in Fig. 30. Distribution of population by degree of urbanisation in the BSR countries in 2017 (%). Source: Eurostat. 2019.
DK DE EE FI LV LT PL SE NO EU-28
Cities 32.3 36.6 43.9 37.8 43.5 42.9 33.9 39.6 29.3 41.7
Towns and suburbs 34.6 40.4 15.3 32.9 19.4 2.2 24.4 40.0 39.0 31.0
Rural areas 33.1 23.0 40.8 29.3 37.1 54.9 41.7 20.4 31.7 27.3
Table 29. Data shown in Fig. 31. Distribution of population by degree of urbanisation in the BSR countries in 2017. Source: own calculations based
on Eurostat. 2019.
DK DE EE FI LV LT PL SE NO Total BSR
Cities 1862089 30252463 578332 2082105 844878 1213385 12873466 3982848 1546152 55235717
Towns and suburbs 1994683 33393429 201560 1812202 376796 62225 9265858 4023079 2058018 53187849
Rural areas 1908208 19011110 537493 1613907 720574 1552793 15835502 2051770 1672799 44904157
Total 5764980 82657002 1317384 5508214 1942248 2828403 37974826 10057698 5276968 153327723
Table 30. Data shown in Fig. 32. Distribution of population by dwelling types in the BSR countries in 2017. Source: Eurostat. 2019.
DK DE EE FI LV LT PL SE NO Total BSR
Detached house 3118854 21821449 430785 2566828 594328 1006911 19177287 4586310 3087026 56389778 Semi-detached house 789802 12977149 64552 1024528 52441 149905 2164565 915251 1081778 19219971
Flat 1833264 46866520 814143 1889317 1289653 1660273 16594999 4546079 1092332 76586581
Others 28825 991884 7904 27541 5827 14142 75950 10058 15831 1177961
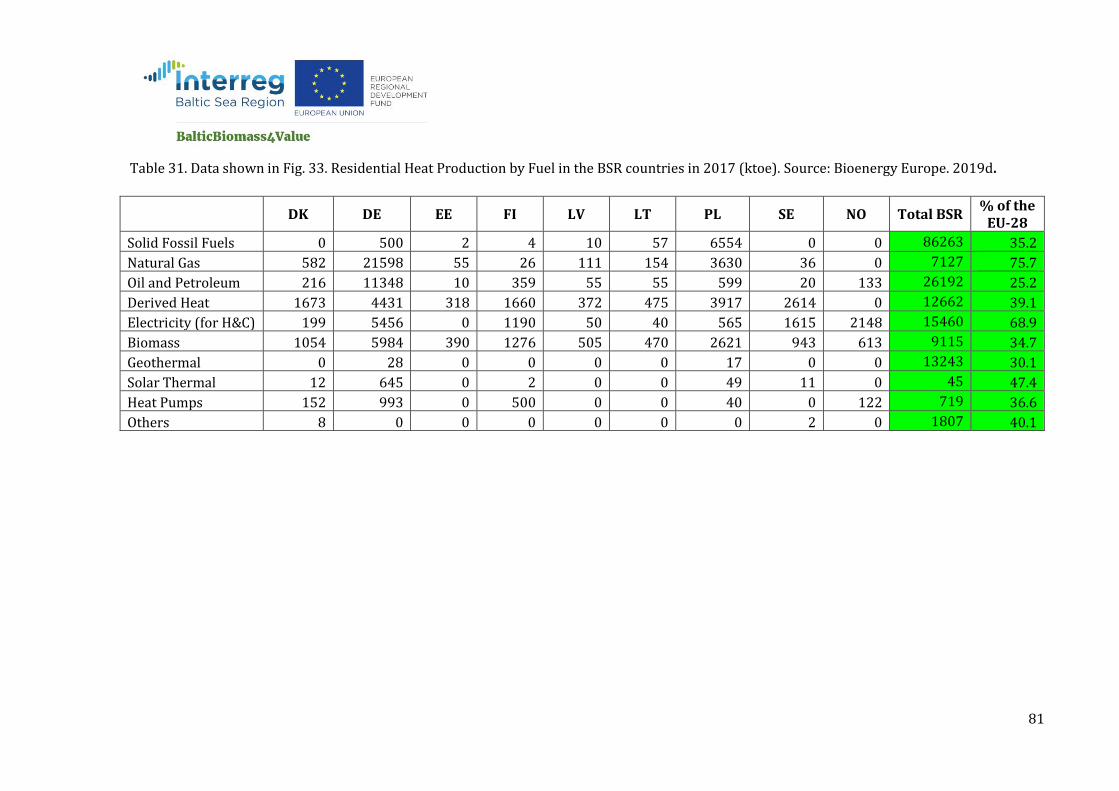
81
Table 31. Data shown in Fig. 33. Residential Heat Production by Fuel in the BSR countries in 2017 (ktoe). Source: Bioenergy Europe. 2019d.
DK DE EE FI LV LT PL SE NO Total BSR % of the
EU-28
Solid Fossil Fuels 0 500 2 4 10 57 6554 0 0 86263 35.2
Natural Gas 582 21598 55 26 111 154 3630 36 0 7127 75.7
Oil and Petroleum 216 11348 10 359 55 55 599 20 133 26192 25.2
Derived Heat 1673 4431 318 1660 372 475 3917 2614 0 12662 39.1
Electricity (for H&C) 199 5456 0 1190 50 40 565 1615 2148 15460 68.9
Biomass 1054 5984 390 1276 505 470 2621 943 613 9115 34.7
Geothermal 0 28 0 0 0 0 17 0 0 13243 30.1
Solar Thermal 12 645 0 2 0 0 49 11 0 45 47.4
Heat Pumps 152 993 0 500 0 0 40 0 122 719 36.6
Others 8 0 0 0 0 0 0 2 0 1807 40.1
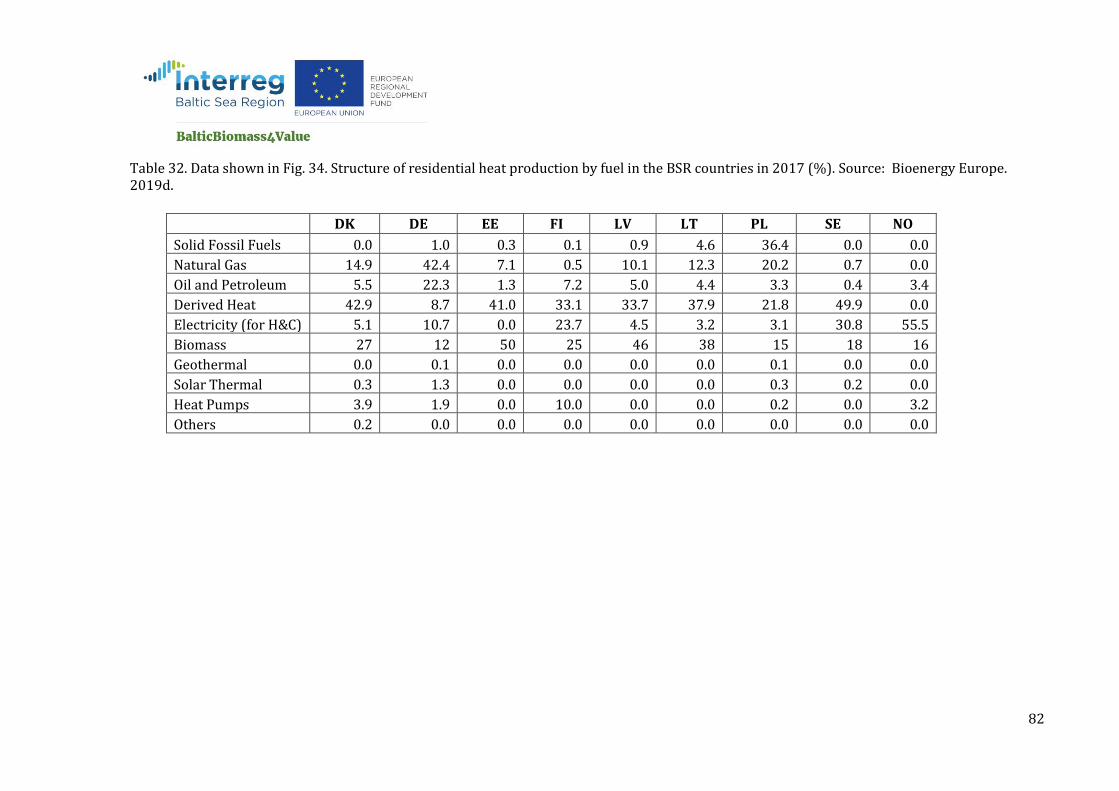
82
Table 32. Data shown in Fig. 34. Structure of residential heat production by fuel in the BSR countries in 2017 (%). Source: Bioenergy Europe. 2019d.
DK DE EE FI LV LT PL SE NO
Solid Fossil Fuels 0.0 1.0 0.3 0.1 0.9 4.6 36.4 0.0 0.0
Natural Gas 14.9 42.4 7.1 0.5 10.1 12.3 20.2 0.7 0.0
Oil and Petroleum 5.5 22.3 1.3 7.2 5.0 4.4 3.3 0.4 3.4
Derived Heat 42.9 8.7 41.0 33.1 33.7 37.9 21.8 49.9 0.0
Electricity (for H&C) 5.1 10.7 0.0 23.7 4.5 3.2 3.1 30.8 55.5
Biomass 27 12 50 25 46 38 15 18 16
Geothermal 0.0 0.1 0.0 0.0 0.0 0.0 0.1 0.0 0.0
Solar Thermal 0.3 1.3 0.0 0.0 0.0 0.0 0.3 0.2 0.0
Heat Pumps 3.9 1.9 0.0 10.0 0.0 0.0 0.2 0.0 3.2
Others 0.2 0.0 0.0 0.0 0.0 0.0 0.0 0.0 0.0
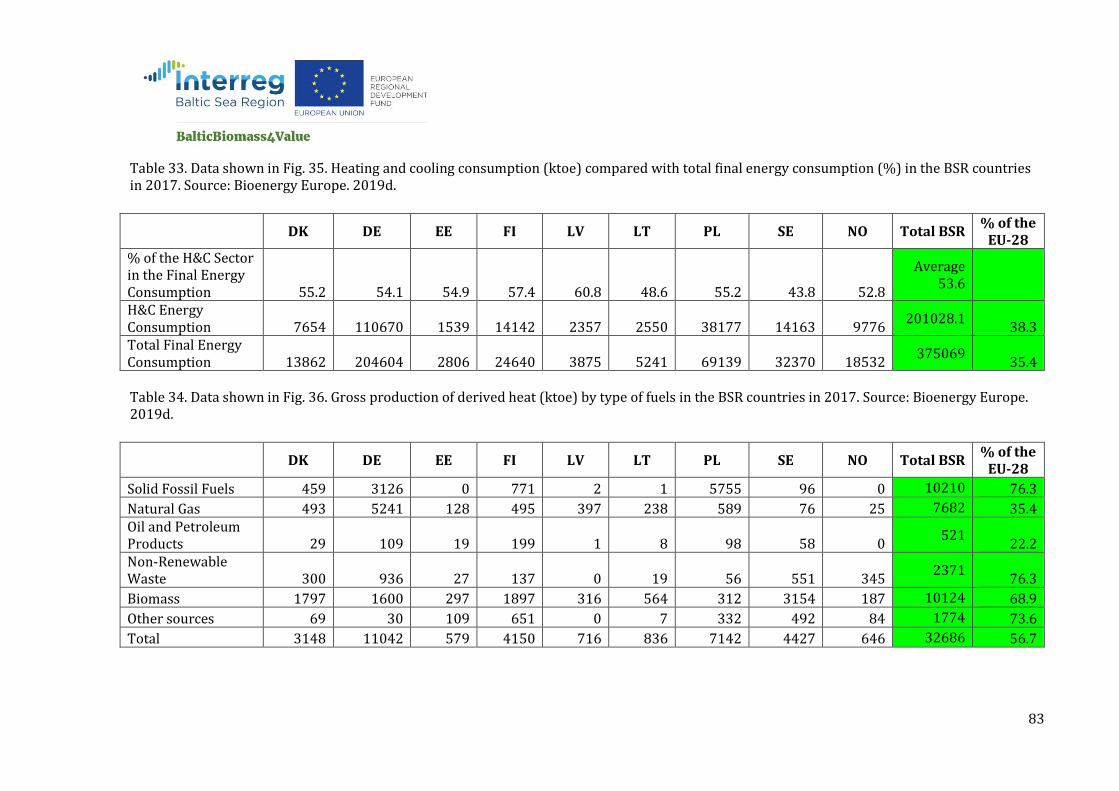
83
Table 33. Data shown in Fig. 35. Heating and cooling consumption (ktoe) compared with total final energy consumption (%) in the BSR countries in 2017. Source: Bioenergy Europe. 2019d.
DK DE EE FI LV LT PL SE NO Total BSR % of the
EU-28 % of the H&C Sector in the Final Energy Consumption 55.2 54.1 54.9 57.4 60.8 48.6 55.2 43.8 52.8
Average 53.6
H&C Energy Consumption 7654 110670 1539 14142 2357 2550 38177 14163 9776
201028.1 38.3
Total Final Energy Consumption 13862 204604 2806 24640 3875 5241 69139 32370 18532
375069 35.4
Table 34. Data shown in Fig. 36. Gross production of derived heat (ktoe) by type of fuels in the BSR countries in 2017. Source: Bioenergy Europe. 2019d.
DK DE EE FI LV LT PL SE NO Total BSR % of the
EU-28
Solid Fossil Fuels 459 3126 0 771 2 1 5755 96 0 10210 76.3
Natural Gas 493 5241 128 495 397 238 589 76 25 7682 35.4 Oil and Petroleum Products 29 109 19 199 1 8 98 58 0
521 22.2
Non-Renewable Waste 300 936 27 137 0 19 56 551 345
2371 76.3
Biomass 1797 1600 297 1897 316 564 312 3154 187 10124 68.9
Other sources 69 30 109 651 0 7 332 492 84 1774 73.6
Total 3148 11042 579 4150 716 836 7142 4427 646 32686 56.7

84
Table 35. Data shown in Fig. 37. Share of solid biomass. biogas. renewable waste and liquid biofuels in gross production of derived bioheat in the BSR countries in 2017 (%). Source: Bioenergy Europe. 2019d.
DK DE EE FI LV LT PL SE NO
Soild Biomass 75 38 100 90 92 97 89 80 0
Biogas 4 13 0 1 8 0 7 0 0
Renewable Waste 20 48 0 9 0 3 4 19 0
Liquid Biofuels 0 0 0 0 0 0 0 1 0
Table 36. Data shown in Fig. 39. Gross electricity production (ktoe) in the BSR countries in 2017. Source: Eurostat. 2019.
DK DE EE FI LV LT PL SE NO Total BSR % of the
EU-28
Solid Fossil Fuels 534 20802 11 742 0 0 11278 45 0 33415 58.3
Petroleum Products 24 479 863 16 0 12 174 25 2 1595 26.3
Gas 164 8476 70 334 178 51 1059 84 229 10647 17.8
Nuclear 0 6563 0 1933 0 0 0 5649 0 14144 19.8 Non-renewable waste 62 627 12 41 0 7 27 145 22
943 43.2
Renewables (excl. biomass) 1337 14739 64 1686 390 225 1557 7137 12540
39675 56.2
Total biomass 547 4379 89 1020 80 43 558 1038 21 7776 48.8
Total 2668.9 56065.00 1109.46 5771.58 647.566 338.53 14652.07 14122.96 12818.40 108194.46 38.2
85
Table 37. Data shown in Fig. 41. Share of solid biomass. biogas. renewable municipal waste and liquid biofuels in gross electricity generation from
biomass and share of bioelectricity in total gross electricity generation in the BSR countries in 2017 (%). Source: Bioenergy Europe. 2019a.
DK DE EE FI LV LT PL SE NO
Soild biomass 75 21 97 92 56 60 82 85 5
Biogas 11 67 3 3 44 26 17 0 10
Renewable municipal waste 14 12 0 5 0 14 1 15 86
Bioliquids 0 1 0 0 0 0 0 0 0 % Bioelectricity in total gross electricity generation 21 8 8 18 12 13 4 7 0.2
Table 38. Data shown in Fig. 42. Biofuels Capacity in the BSR countries in 2017 (1000 Mg/year). Source: Bioenergy Europe. 2019b.
DK DE EE FI LV LT PL SE NO Total BSR % of the
EU-28
Bioethanol 0 792 0 50 19 20 858 190 0 1929 27.3
Biodiesel 0 4153 0 490 173 140 1321 132 0 6409 29.2 Other liquid Biofuels 0 3962 0 51 0 0 0 63 0
4076 83.5
Total 0 8907 0 591 192 160 2179 385 0 12414 36.6
86
Table 39. Data shown in Fig. 44. Primary bioethanol production and final energy consumption in the transport sector in the BSR countries in 2017 (ktoe). Source: Bioenergy Europe. 2019b.
DK DE EE FI LV LT PL SE NO Total BSR % of the
EU-28 Bioethanol Production 0 406 0 0 6 9 123 119 0
663 27.4
Bioethanol Consumption 0 733 1 81 8 7 176 99 28
1133 40.8
Table 40. Data shown in Fig. 45. Primary biodiesel production and final energy consumption in the transport sector in the BSR countries in 2017 (ktoe). Source: Bioenergy Europe. 2019b.
DK DE EE FI LV LT PL SE NO Total BSR % of the
EU-28 Biodiesel Production 0 2841 0 310 47 104 793 66 0
4161 34.0
Biodiesel Consumption 215 1827 0 310 1 54 429 1421 462
4719 39.5

87
Table 41. Data shown in Fig. 47. Feedstock use for biogas production (excluding landfill - expressed as a mass percentage) in the BSR countries in 2017. Source: Bioenergy Europe. 2019c.
DK DE EE FI LV LT PL SE NO
Energy crops 2 49 0 77 12 0
Agricultural residues 51 45 6 5 53 7
Biowaste. municipal waste 1 4 89 12 0 0
Industrial (food and beverage) 26 2 0 4 35 2
Sewage 16 6 2 0 90
Other waste fraction 4 0 0 0 1
Table 42. Data shown in Fig. 48. Primary energy production of biogas by biogas plant type in the BSR countries in 2017 (%). Source: Bioenergy
Europe. 2019c.
DK DE EE FI LV LT PL SE NO
Landfill 1.3 1.7 69.2 16.8 8.6 15.6 17.1 2.8
Sewage sludge 6.7 5.9 30.8 13.6 2.2 21.9 40.9 44.1
Agriculture 60.4 92.4 0.0 24.8 89.2 62.5 42.0 53.1
Biogas from thermal processes
31.6 0.0 0.0 44.8 0.0 0.0 0.0
88
Table 43. Data shown in Fig. 49. Gross final energy consumption from biogas by end-use in the BSR countries in 2017 (%). Source: Bioenergy Europe.
2019c.
DK DE EE FI LV LT PL SE NO
Electricity 25.7 62.9 33.3 43.2 52.2 52.4 47.5 0.4
Direct used (industry. household. commercial etc.)
41.7 31.6 58.3 30.9 11.9 38.1 41.9 54.6
Heat 32.6 4.6 8.3 25.9 35.8 9.5 10.6 3.7
Transport 0.1 0.8 0.0 0.4 0.0 0.0 0.0 41.3
89
Appendix 2
Information on algae situation in the BSR countries
Country Industrial algae cultivation Usage of algae biomass for energy purposes Usage of algae biomass for other bio-
based products Estonia In Estonia there is only one
extensive cultivated large algae species - the unattached form of the red alga Furcellaria lumbricalis (agaric). Its natural assemblage in the Kassari bay has been used since the 1960s. The most promising seaweed species in Estonia are aquaculture species Fucus vesiculosus, Furcellaria lumbricalis, Ulva intestinalis and Cladophora glomerata1.
- *Est-Agar AS is the only producer of the unique texturant – furcellaran from the red seaweed Furcellaria lumbricalis in the world. Est-Agar AS main business areas are: – Production and sale of gelling agent furcellaran; – Trawling, gathering, buying up, processing and sale of red seaweed Furcellaria lumbricalis2. *Estonian company Numami prepares crispbread, pesto and freeze-dried algae flakes from different algae (Dulse, Wakame and Kombu). Algae is grown in cooperation with a Norwegian research farm, but the company hopes to get some part of raw material from Estonia in the future3.
Germany Micro- and macroalgae are grown industrially in Germany.
There is no such practice Vegan Food products from macroalgae (e.g. Algae-Pasta; Algae-sauces, Algae-mustard, Algae-herb, Algae-sausages,
1Vesiviljeluse piirkondlike kavade koostamine võimaliku keskkonnasurve ohjamiseks. Lõpparuanne, Tartu Ülikool (2019) (in Estonian): https://www.envir.ee/sites/default/files/2019_11_01_lopparuanne_pikk_versioon.pdf 2 http://estagar.ee/ 3 In Estonian: https://maaelu.postimees.ee/6539216/vetikatootja-numami-polluks-on-meri; https://numami.ee/meist/
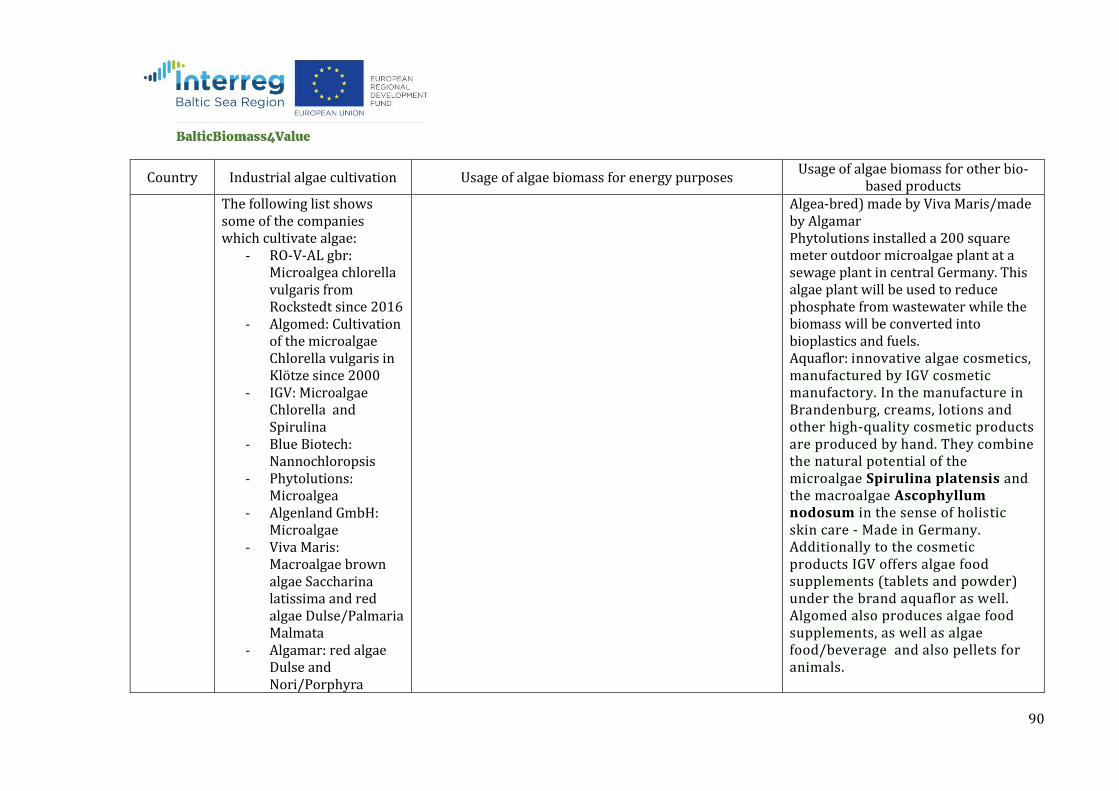
90
Country Industrial algae cultivation Usage of algae biomass for energy purposes Usage of algae biomass for other bio-
based products The following list shows some of the companies which cultivate algae:
- RO-V-AL gbr: Microalgea chlorella vulgaris from Rockstedt since 2016
- Algomed: Cultivation of the microalgae Chlorella vulgaris in Klötze since 2000
- IGV: Microalgae Chlorella and Spirulina
- Blue Biotech: Nannochloropsis
- Phytolutions: Microalgea
- Algenland GmbH: Microalgae
- Viva Maris: Macroalgae brown algae Saccharina latissima and red algae Dulse/Palmaria Malmata
- Algamar: red algae Dulse and Nori/Porphyra
Algea-bred) made by Viva Maris/made by Algamar Phytolutions installed a 200 square meter outdoor microalgae plant at a sewage plant in central Germany. This algae plant will be used to reduce phosphate from wastewater while the biomass will be converted into bioplastics and fuels. Aquaflor: innovative algae cosmetics, manufactured by IGV cosmetic manufactory. In the manufacture in Brandenburg, creams, lotions and other high-quality cosmetic products are produced by hand. They combine the natural potential of the microalgae Spirulina platensis and the macroalgae Ascophyllum nodosum in the sense of holistic skin care - Made in Germany. Additionally to the cosmetic products IGV offers algae food supplements (tablets and powder) under the brand aquaflor as well. Algomed also produces algae food supplements, as well as algae food/beverage and also pellets for animals.
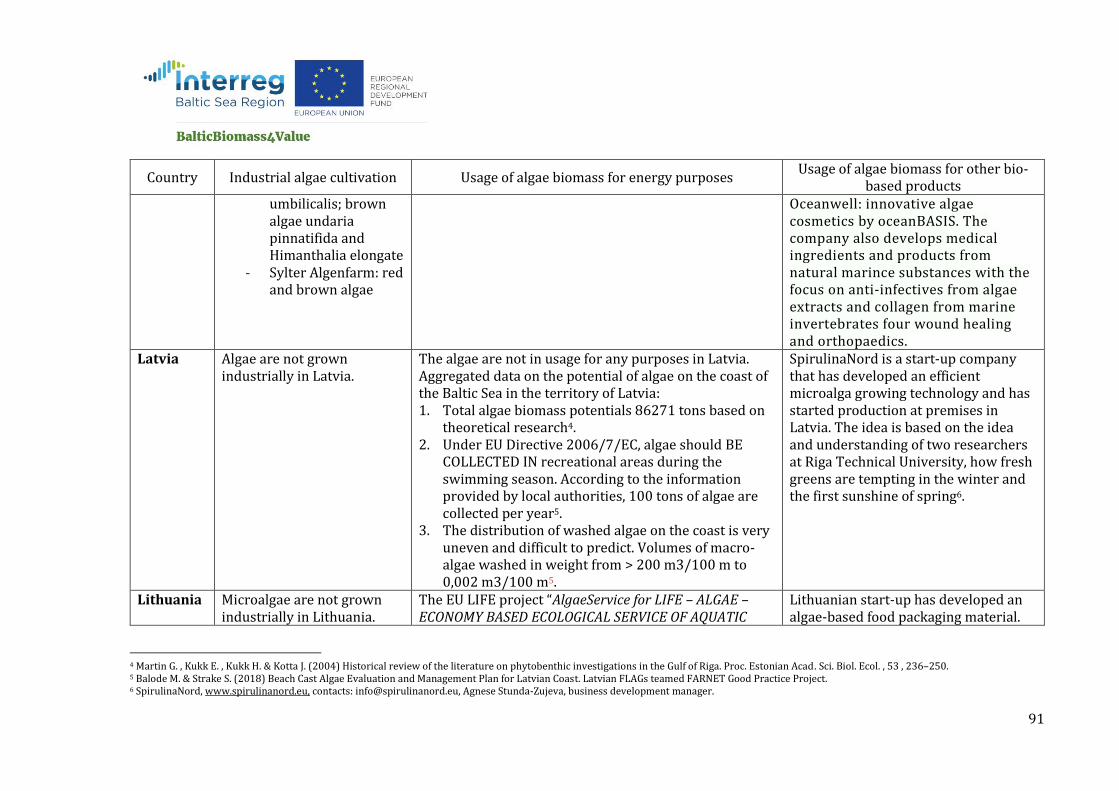
91
Country Industrial algae cultivation Usage of algae biomass for energy purposes Usage of algae biomass for other bio-
based products umbilicalis; brown algae undaria pinnatifida and Himanthalia elongate
- Sylter Algenfarm: red and brown algae
Oceanwell: innovative algae cosmetics by oceanBASIS. The company also develops medical ingredients and products from natural marince substances with the focus on anti-infectives from algae extracts and collagen from marine invertebrates four wound healing and orthopaedics.
Latvia Algae are not grown industrially in Latvia.
The algae are not in usage for any purposes in Latvia. Aggregated data on the potential of algae on the coast of the Baltic Sea in the territory of Latvia: 1. Total algae biomass potentials 86271 tons based on
theoretical research4. 2. Under EU Directive 2006/7/EC, algae should BE
COLLECTED IN recreational areas during the swimming season. According to the information provided by local authorities, 100 tons of algae are collected per year5.
3. The distribution of washed algae on the coast is very uneven and difficult to predict. Volumes of macro-algae washed in weight from > 200 m3/100 m to 0,002 m3/100 m5.
SpirulinaNord is a start-up company that has developed an efficient microalga growing technology and has started production at premises in Latvia. The idea is based on the idea and understanding of two researchers at Riga Technical University, how fresh greens are tempting in the winter and the first sunshine of spring6.
Lithuania Microalgae are not grown industrially in Lithuania.
The EU LIFE project “AlgaeService for LIFE – ALGAE – ECONOMY BASED ECOLOGICAL SERVICE OF AQUATIC
Lithuanian start-up has developed an algae-based food packaging material.
4 Martin G. , Kukk E. , Kukk H. & Kotta J. (2004) Historical review of the literature on phytobenthic investigations in the Gulf of Riga. Proc. Estonian Acad. Sci. Biol. Ecol. , 53 , 236–250. 5 Balode M. & Strake S. (2018) Beach Cast Algae Evaluation and Management Plan for Latvian Coast. Latvian FLAGs teamed FARNET Good Practice Project. 6 SpirulinaNord, www.spirulinanord.eu, contacts: [email protected], Agnese Stunda-Zujeva, business development manager.
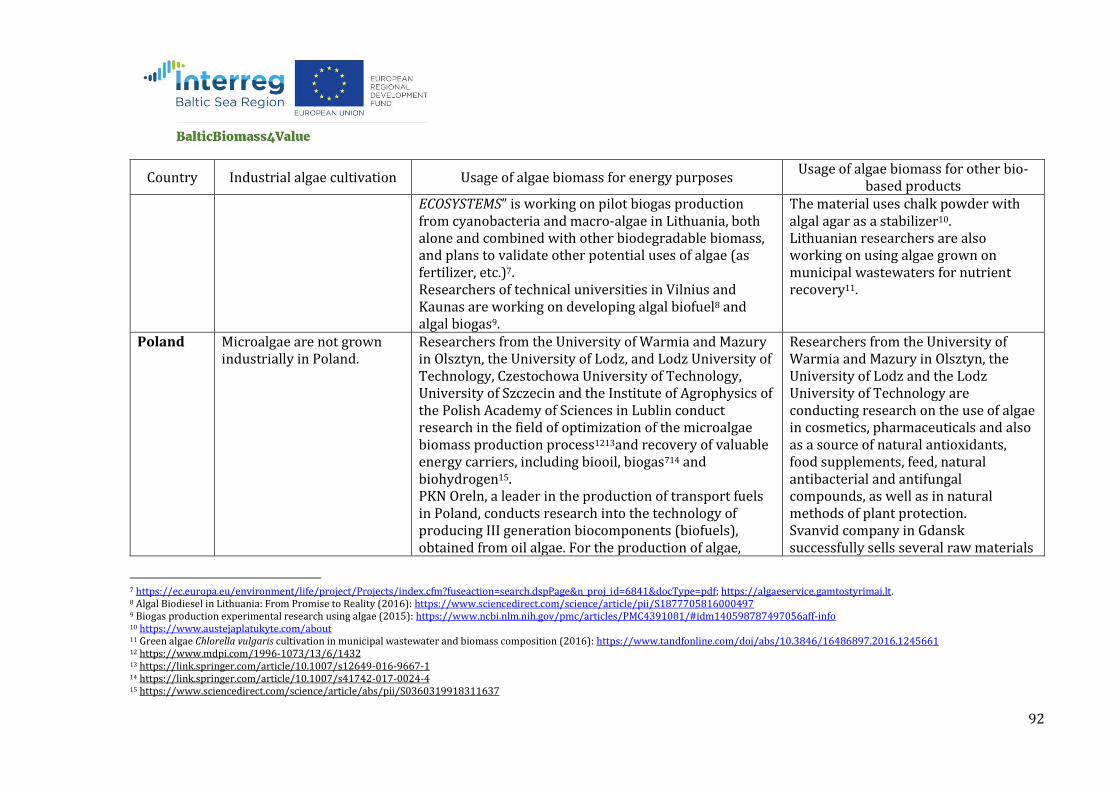
92
Country Industrial algae cultivation Usage of algae biomass for energy purposes Usage of algae biomass for other bio-
based products ECOSYSTEMS” is working on pilot biogas production from cyanobacteria and macro-algae in Lithuania, both alone and combined with other biodegradable biomass, and plans to validate other potential uses of algae (as fertilizer, etc.)7. Researchers of technical universities in Vilnius and Kaunas are working on developing algal biofuel8 and algal biogas9.
The material uses chalk powder with algal agar as a stabilizer10. Lithuanian researchers are also working on using algae grown on municipal wastewaters for nutrient recovery11.
Poland Microalgae are not grown industrially in Poland.
Researchers from the University of Warmia and Mazury in Olsztyn, the University of Lodz, and Lodz University of Technology, Czestochowa University of Technology, University of Szczecin and the Institute of Agrophysics of the Polish Academy of Sciences in Lublin conduct research in the field of optimization of the microalgae biomass production process1213and recovery of valuable energy carriers, including biooil, biogas714 and biohydrogen15. PKN Oreln, a leader in the production of transport fuels in Poland, conducts research into the technology of producing III generation biocomponents (biofuels), obtained from oil algae. For the production of algae,
Researchers from the University of Warmia and Mazury in Olsztyn, the University of Lodz and the Lodz University of Technology are conducting research on the use of algae in cosmetics, pharmaceuticals and also as a source of natural antioxidants, food supplements, feed, natural antibacterial and antifungal compounds, as well as in natural methods of plant protection. Svanvid company in Gdansk successfully sells several raw materials
7 https://ec.europa.eu/environment/life/project/Projects/index.cfm?fuseaction=search.dspPage&n_proj_id=6841&docType=pdf; https://algaeservice.gamtostyrimai.lt. 8 Algal Biodiesel in Lithuania: From Promise to Reality (2016): https://www.sciencedirect.com/science/article/pii/S1877705816000497 9 Biogas production experimental research using algae (2015): https://www.ncbi.nlm.nih.gov/pmc/articles/PMC4391081/#idm140598787497056aff-info 10 https://www.austejaplatukyte.com/about 11 Green algae Chlorella vulgaris cultivation in municipal wastewater and biomass composition (2016): https://www.tandfonline.com/doi/abs/10.3846/16486897.2016.1245661 12 https://www.mdpi.com/1996-1073/13/6/1432 13 https://link.springer.com/article/10.1007/s12649-016-9667-1 14 https://link.springer.com/article/10.1007/s41742-017-0024-4 15 https://www.sciencedirect.com/science/article/abs/pii/S0360319918311637
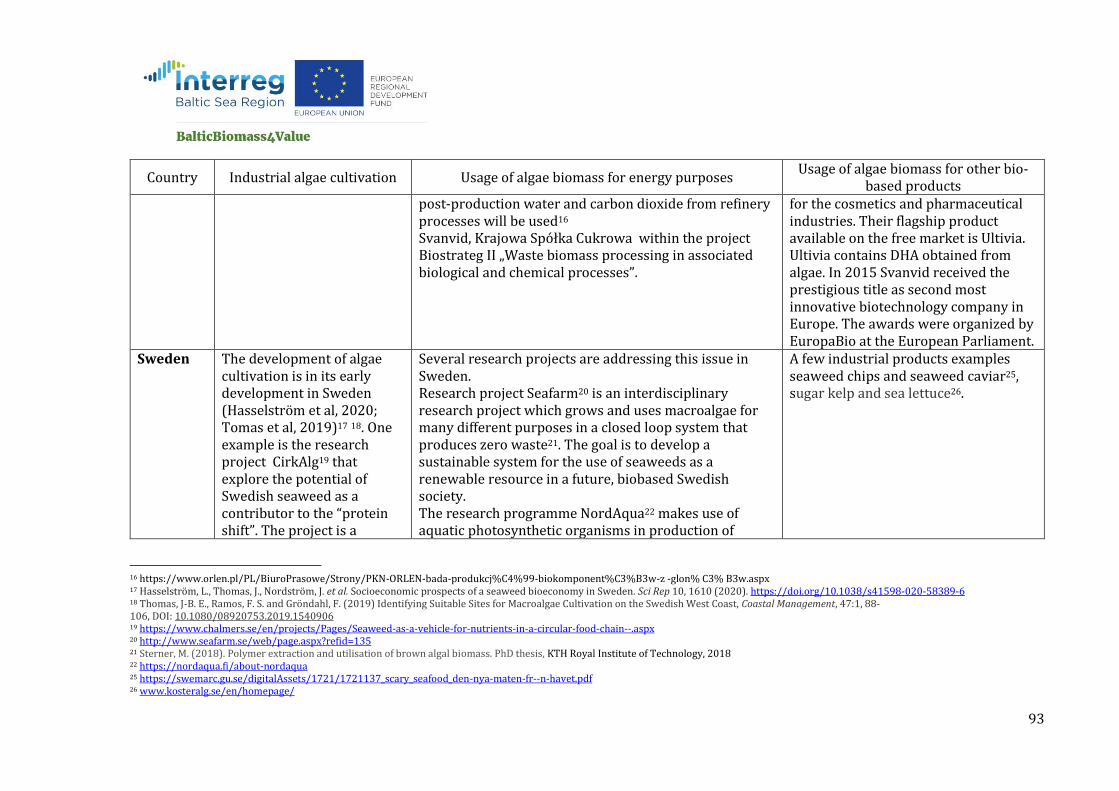
93
Country Industrial algae cultivation Usage of algae biomass for energy purposes Usage of algae biomass for other bio-
based products post-production water and carbon dioxide from refinery processes will be used16 Svanvid, Krajowa Spółka Cukrowa within the project Biostrateg II „Waste biomass processing in associated biological and chemical processes”.
for the cosmetics and pharmaceutical industries. Their flagship product available on the free market is Ultivia. Ultivia contains DHA obtained from algae. In 2015 Svanvid received the prestigious title as second most innovative biotechnology company in Europe. The awards were organized by EuropaBio at the European Parliament.
Sweden The development of algae cultivation is in its early development in Sweden (Hasselström et al, 2020; Tomas et al, 2019)17 18. One example is the research project CirkAlg19 that explore the potential of Swedish seaweed as a contributor to the “protein shift”. The project is a
Several research projects are addressing this issue in Sweden. Research project Seafarm20 is an interdisciplinary research project which grows and uses macroalgae for many different purposes in a closed loop system that produces zero waste21. The goal is to develop a sustainable system for the use of seaweeds as a renewable resource in a future, biobased Swedish society. The research programme NordAqua22 makes use of aquatic photosynthetic organisms in production of
A few industrial products examples seaweed chips and seaweed caviar25, sugar kelp and sea lettuce26.
16 https://www.orlen.pl/PL/BiuroPrasowe/Strony/PKN-ORLEN-bada-produkcj%C4%99-biokomponent%C3%B3w-z -glon% C3% B3w.aspx 17 Hasselström, L., Thomas, J., Nordström, J. et al. Socioeconomic prospects of a seaweed bioeconomy in Sweden. Sci Rep 10, 1610 (2020). https://doi.org/10.1038/s41598-020-58389-6 18 Thomas, J-B. E., Ramos, F. S. and Gröndahl, F. (2019) Identifying Suitable Sites for Macroalgae Cultivation on the Swedish West Coast, Coastal Management, 47:1, 88-106, DOI: 10.1080/08920753.2019.1540906 19 https://www.chalmers.se/en/projects/Pages/Seaweed-as-a-vehicle-for-nutrients-in-a-circular-food-chain--.aspx 20 http://www.seafarm.se/web/page.aspx?refid=135 21 Sterner, M. (2018). Polymer extraction and utilisation of brown algal biomass. PhD thesis, KTH Royal Institute of Technology, 2018 22 https://nordaqua.fi/about-nordaqua 25 https://swemarc.gu.se/digitalAssets/1721/1721137_scary_seafood_den-nya-maten-fr--n-havet.pdf 26 www.kosteralg.se/en/homepage/

94
Country Industrial algae cultivation Usage of algae biomass for energy purposes Usage of algae biomass for other bio-
based products collaboration between several Universities, companies and a government agency with the aim to develop techniques to increase the protein amount in seaweed in two steps and in ingredients made from these. In a first step the seaweed is cultivated in nutrient rich media and in a second step scalable processes will be developed to concentrate the protein from the cultivated seaweed. Other central objectives of the project include analysis of tastiness, nutrition value and food safety of the developed protein ingredients and in products containing these.
biobased chemicals, pharmaceuticals, biofuels, food and feed, as well as in the process of wastewater purification. Algae plantations can reduce greenhouse gas emissions from the metal industry. This is shown by the results of a research project in which RISE and Boliden23 have realistically tested carbon dioxide capture from industrial flue gases using algae. The algae are carbon dioxide and metals from the gas and water emissions that occur in the metal industry. Swedish microalgae can produce biofuels while purifying water24
Norway Norway supplies more than half (65%) of the total European macroalgal biomass production (2015).
The Norwegian Seaweed Technology Center from
SINTEF, works on algae development and deployment
for, among other things, bioenergy27.
From SINTEF’s Norwegian Seaweed Technology Center: "Norwegian Seaweed Technology Center is a knowledge platform for technology development within
23 https://www.ri.se/sv/press/algodlingar-vid-metallindustrier-kan-minska-vaxthuseffekten 24 Ferro, L (2019). Wastewater treatment and biomass generation by Nordic microalgae. Growth in subarctic climate and microbial interactions. PhD thesis, Umeå Universty, Sweden. 27 https://www.sintef.no/en/ocean/initiatives/norwegian-seaweed-technology-center/#Aboutthecentre

95
Country Industrial algae cultivation Usage of algae biomass for energy purposes Usage of algae biomass for other bio-
based products Source: JRC Science for policy report 2018: Biomass production, supply, uses and flows in the European Union.
There is also a NIBIO project: Algae to Future (A2F)
From Fundamental Algae Research to Applied Industrial
Practices; but it mostly focuses on food and feed28.
industrial cultivation, harvesting, processing and application of seaweed in Norway. “ and “Norway has the opportunity to develop the macroalgae cultivation to a new, large industry. Industrial cultivation of macroalgae gives opportunities for production of biomass that can be used as basis for many different products and that can contribute to make Norway more self-sufficient on food, feed ingredients and bioenergy. Norway has vast areas along the coast that are suitable for seaweed cultivation. Seaweeds are primary producers and can be cultivated in the sea without the use of arable land, fertilizers, fresh water, pesticides or antibiotics. " From NIBIO’s A2F: “A2F's vision is to lay the foundation for industrial microalgae production in Norway, utilizing natural resources and waste streams from existing production lines within agriculture, aquaculture and process industry."
28 https://www.nibio.no/en/projects/algae-to-future-a2f