report on the Least Developed Countries-2015 -...
190
UNITED NATIONS CONFERENCE ON TRADE AND DEVELOPMENT Transforming Rural Economies THE LEAST DEVELOPED COUNTRIES REPORT 2015 EMBARGO The contents of this Report must not be quoted or summarized in the print, broadcast or electronic media before 25 November 2015, 17:00 hours GMT
Transcript of report on the Least Developed Countries-2015 -...
U n i t e d n at i o n s C o n f e r e n C e o n t r a d e a n d d e v e l o p m e n t
THE LEA
ST D
EVELO
PED
CO
UN
TRIES
REP
OR
T 20
15
UNCTA
DUNITED NATIONS
Printed at United Nations, GenevaGE.15-00000–October 2015–5,188
UNCTAD/LDC/2015
United Nations publicationSales No E.15.II.D.7e-ISBN 978-92-1-057413-6 ISSN 0257-7550
USD 50ISBN 978-92-1-112893-2
Phot
o cr
edits
: ©IL
O: K
. Cas
sidy
, M. C
roze
t, E.
Gia
notti
, Y.R
. Per
era
– Fo
tolia
.com
: DN6
, Yul
iaB
Transforming Rural Economies
THE LEAST DEVELOPED COUNTRIES REPORT 2015
EMBARGOThe contents of this Report must not be quoted or summarized in the print, broadcast or electronic media before25 November 2015, 17:00 hours GMT
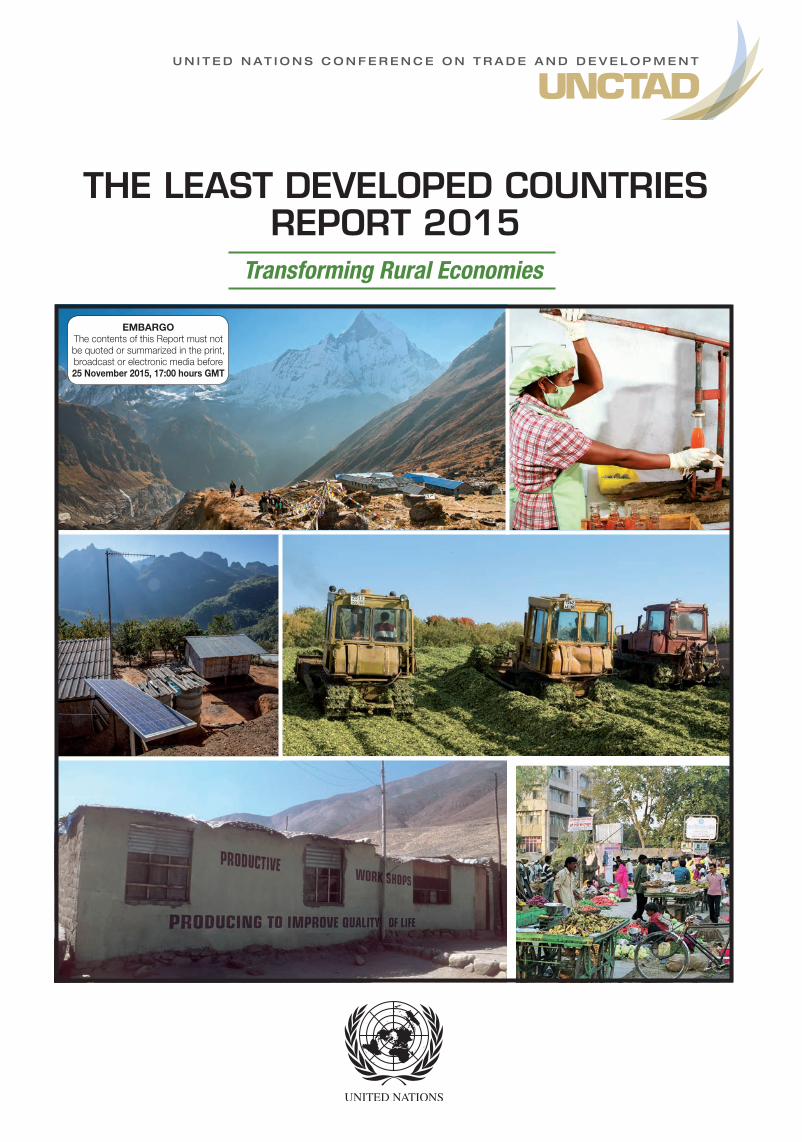
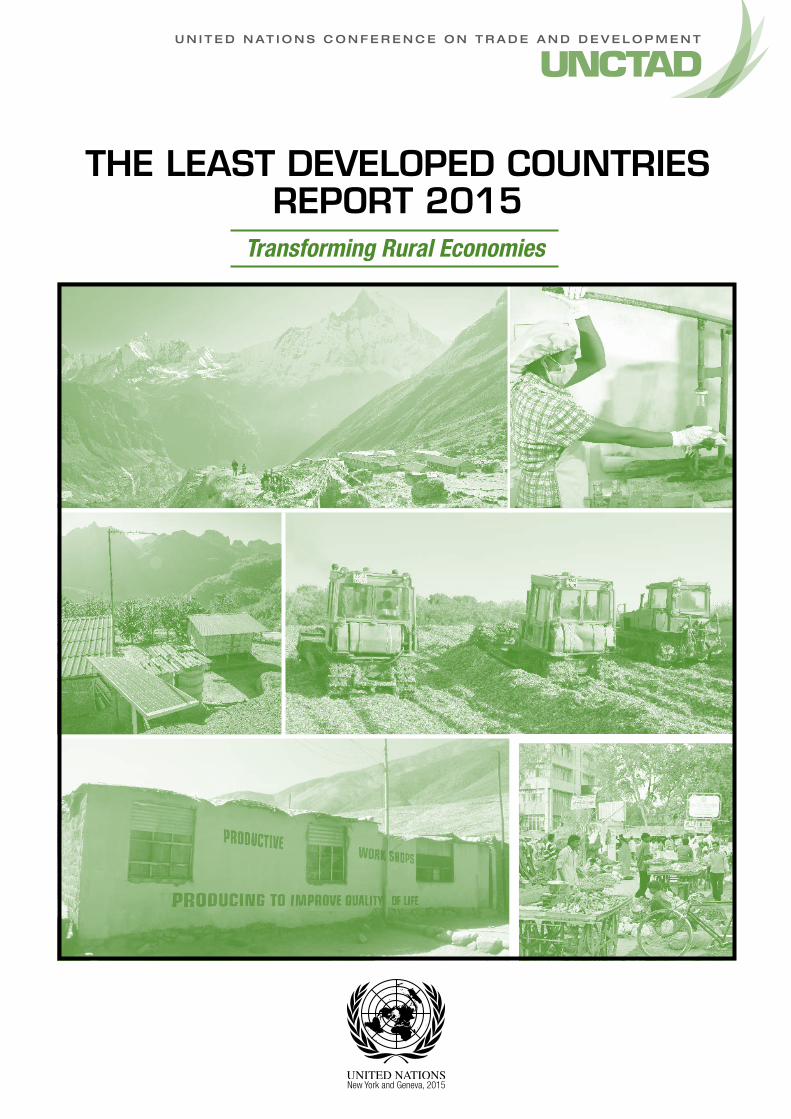
Front cover The pictures on the top and bottom represent a range of key activities that can contribute to rural economic transformation in least developed countries: eco- and adventure tourism, agroprocessing, small-scale industry and sales of high-value agricultural produce in urban areas. The centre-left picture illustrates rural electrification, a major driver of development of non-farm activities. Eventually, a successful process of rural economic transformation might culminate in more capital-intensive and mechanized agriculture.
The headline of the newly adopted 2030 Agenda for Sustainable Development and Sustainable Development Goals (SDGs) is a global commitment to eradicate poverty by 2030. Nearly half the population of the 48 least developed countries (LDCs) – some 400 million people – remain in extreme poverty, compared with less than a quarter in any other developing country. The LDCs are thus the battleground on which the 2030 Agenda will be won or lost. This is where shortfalls from the SDG targets are greatest, where improvement has been slowest, and where the barriers to further progress are highest.
Rural development will be central to the quantum leap in the rate of progress required for LDCs to achieve the SDGs. More than two thirds of people in LDCs live in rural areas, where poverty is also most widespread and deepest, and infrastructure and social provision most lacking. Rural development is essential, not only to poverty eradication, employment generation and economic development, but also to sustainable urbanization.
UNCTAD’s Least Developed Countries Report 2015 therefore focuses on the transformation of rural economies. Assessing LDCs’ progress in agricultural productivity, the extent and nature of their rural economic diversification, and gender issues in rural transformation, it shows that: • Agricultural productivity began to increase in LDCs in 2000, following decades of stagnation or decline, but has risen
strongly only in Asian LDCs.• Rural economic diversification varies widely between LDCs, but only a few have passed beyond the stage in which
non-farm activities are centred on agriculture and urban linkages are limited.• Women comprise half the rural workforce in LDCs, but face serious constraints on realizing their productive potential,
slowing rural transformation.
The 2030 Agenda both highlights the need and provides the opportunity for a new approach to rural development centred on poverty-oriented structural transformation (POST), to generate higher incomes backed by higher productivity. In rural areas, this means upgrading agriculture, developing viable non-farm activities, and fully exploiting the synergies between the two, through appropriately designed and sequenced efforts to achieve the SDGs.
The Report argues that:• Differentiation is needed between peri-urban, intermediate, remote and isolated rural areas.• A key priority is to overcome the contradiction between need and opportunity, by which more remote areas and poorer
households have the greatest need but also the most limited opportunities for income diversification.• A POST process can be promoted by labour-based methods and local procurement in infrastructure investment to
stimulate demand, coupled with parallel measures to strengthen local supply response. • Supply response can be improved by appropriate sequencing of infrastructure investment and interventions, and
provision of information about prospective changes in demand and market conditions.• Gender-specific measures are needed to overcome disadvantages arising directly from gender norms, and more
inclusive gender-sensitive approaches to address their poverty-related consequences.• Access to appropriate technologies, inputs, skills and affordable finance needs to be fostered.• Effective policy coordination is required nationally, while producers’ associations, cooperatives and women’s networks
can play a key role locally.• Innovative approaches to trade and cross-border investment could make a substantial contribution.
Finally, the Report highlights the importance of adequate support from the international community to achieve structural transformation and fulfil the SDGs, based on the principle that “to will the end is to will the means”. It calls for donors to meet their commitments on the quantity and quality of official development assistance (ODA), and for an increase in the target for ODA to LDCs to 0.35 per cent of donors’ gross national income (GNI). This would be commensurate with LDCs’ share of global shortfalls from SDG targets in the context of the 0.7 per cent of donor GNI target for overall ODA.
New York and Geneva, 2015
U N I T E D N AT I O N S C O N F E R E N C E O N T R A D E A N D D E V E L O P M E N T
Transforming Rural Economies
THE LEAST DEVELOPED COUNTRIES REPORT 2015

Note
Symbols of United Nations documents are composed of capital letters with figures. Mention of such a symbol indicates a reference to a United Nations document.
The designations employed and the presentation of the material in this publication do not imply the expression of any opinion whatsoever on the part of the Secretariat of the United Nations concerning the legal status of any country, territory, city or area, or of its authorities, or concerning the delimitation of its frontiers or boundaries.
Material in this publication may be freely quoted or reprinted, but full acknowledgement is requested. A copy of the publication containing the quotation or reprint should be sent to the UNCTAD secretariat at: Palais des Nations, CH-1211 Geneva 10, Switzerland.
The overview of this report can also be found on the Internet, in all six official languages of the United Nations, at www.unctad.org/ldcr
UNITED NATIONS PUBLICATION
Sales No. E.15.II.D.7
ISBN 978-92-1-112893-2
eISBN 978-92-1-057413-6
ISSN 0257-7550
UNCTAD/LDC/2015
Copyright © United Nations, 2015All rights reserved
What are the least developed countries?
Forty-eight countries are currently designated by the United Nations as “least developed countries” (LDCs). These are: Afghanistan, Angola, Bangladesh, Benin, Bhutan, Burkina Faso, Burundi, Cambodia, Central African Republic, Chad, Comoros, Democratic Republic of the Congo, Djibouti, Equatorial Guinea, Eritrea, Ethiopia, Gambia, Guinea, Guinea-Bissau, Haiti, Kiribati, Lao People’s Democratic Republic, Lesotho, Liberia, Madagascar, Malawi, Mali, Mauritania, Mozambique, Myanmar, Nepal, Niger, Rwanda, Sao Tome and Principe, Senegal, Sierra Leone, Solomon Islands, Somalia, South Sudan, Sudan, Timor-Leste, Togo, Tuvalu, Uganda, United Republic of Tanzania, Vanuatu, Yemen and Zambia.
The list of LDCs is reviewed every three years by the Committee for Development Policy (CDP), a group of independent experts reporting to the United Nations Economic and Social Council (ECOSOC). The Committee, in its report to the Council, may recommend cases of addition to the list, or graduation from LDC status. The following three criteria were used by the Committee in the latest review of the list, in March 2015:
(a) A per capita income criterion, based on a three-year average estimate of the gross national income (GNI) per capita, with a threshold of $1,035 for possible cases of addition to the list, and a threshold of $1,242 for cases of graduation from LDC status.
(b) A human assets criterion, involving a composite index (the Human Assets Index) based on indicators of: (i) nutrition (percentage of undernourished population); (ii) health (child mortality ratio); (iii) school enrolment (gross secondary school enrolment ratio); and (iv) literacy (adult literacy ratio).
(c) An economic vulnerability criterion, involving a composite index (the Economic Vulnerability Index) based on indicators of: (i) natural shocks (index of instability of agricultural production; share of victims of natural disasters); (ii) trade-related shocks (index of instability of exports of goods and services); (iii) physical exposure to shocks (share of population living in low-lying areas); (iv) economic exposure to shocks (share of agriculture, forestry and fisheries in the gross domestic product (GDP); index of merchandise export concentration); (v) smallness (population in logarithm); and (vi) remoteness (index of remoteness).
For all three criteria, different thresholds are used for identifying cases of addition to the list of LDCs, and cases of graduation from LDC status. A country will qualify to be added to the list if it meets the admission thresholds on all three criteria and does not have a population greater than 75 million. Qualification for addition to the list will effectively lead to LDC status only if the Government of the relevant country accepts this status. A country will normally qualify for graduation from LDC status if it has met graduation thresholds under at least two of the three criteria in at least two consecutive triennial reviews of the list. However, if the three-year average per capita GNI of an LDC has risen to a level at least double the graduation threshold and if this performance is considered sustainable, the country will be deemed eligible for graduation regardless of its score under the other two criteria. This rule is commonly referred to as the “income-only” graduation rule.
Four countries have so far graduated from LDC status: Botswana in December 1994, Cape Verde in December 2007, Maldives in January 2011 and Samoa in January 2014. In March 2009, the Committee recommended the graduation of Equatorial Guinea. This recommendation was accepted by the Council in July 2009, and endorsed by the General Assembly through a resolution adopted in December 2013. The same resolution also stated the Assembly’s endorsement of the Committee’s 2012 recommendation to graduate Vanuatu from LDC status. Equatorial Guinea and Vanuatu are scheduled to be taken off the list in June 2017 and December 2017, respectively. In the March 2015 review of the list of LDCs, the Committee recommended the graduation of Angola, by virtue of the “income-only” graduation rule. In March 2012, the Committee recommended Tuvalu’s graduation from LDC status. In the absence of endorsement by the Council, this recommendation has remained without effect.
After a recommendation to graduate a country has been endorsed by the Council and the Assembly, the graduating country benefits from a grace period (normally three years) before graduation effectively takes place. This period, during which the country remains an LDC, is designed to enable the graduating State and its development and trading partners to agree on a “smooth transition” strategy, so that the loss of LDC status at the time of graduation does not disrupt the socioeconomic progress of the country. A “smooth transition” measure generally implies extending to the graduated country, for a number of years after graduation, a concession to which it had been entitled by virtue of its LDC status.

Acknowledgements
The Least Developed Countries Report 2015 was prepared by UNCTAD. Contributors to this Report are: Rolf Traeger (team leader), Maria Bovey, Agnès Collardeau-Angleys, Piergiuseppe Fortunato, Christian Kingombe, Mariangela Linoci, Irene Musselli, Mauricio Pinzon Latorre, Daniel Poon, Madasamyraja Rajalingam, Kasper Vrolijk, David Woodward and Simonetta Zarrilli (the LDC Report team). The work was carried out under the overall guidance and supervision of Taffere Tesfachew, Director, Division for Africa, Least Developed Countries and Special Programmes, who also made significant inputs to the structure and contents of the Report.
An ad hoc expert group meeting on “Transforming rural economies” was held in Geneva on 22–23 July 2015 to peer-review the Report and its specific inputs. It brought together specialists in the fields of structural transformation, agricultural productivity, rural economic diversification, the 2030 Agenda for Sustainable Development, domestic/regional production chains, gender issues in the development process and policies to accelerate rural development. The participants were: Uma Rani Amara (International Labour Organization – ILO), Elvis Beytullayev (ILO), Tadele Ferede (University of Addis Ababa), Faouzi Gsouma (African Union – AU), Carla Henry (ILO), Susan Isiko (AU), Claude Kana (AU), Alfredo Lazarte-Hoyle (ILO), Georges Namekong (AU), Moazam Mahmood (ILO), as well as the members of the LDC Report team and the following UNCTAD colleagues: Bineswaree Bolaki, Lisa Borgatti, Junior Roy Davis, Mussie Delelegn, Pierre Encontre, Jan Hoffmann, Stefano Inama, Benjamin McCarthy, Erica Meltzer, Shin Ohinata, Tansug Ok, Patrick Nwokedi Osakwe, Daniel Owoko, Henrique Pacini, Laura Páez, Bruno Rogério, Amelia Santos-Paulino, Antipas Touatam and Anida Yupari.
Participants at a distance who provided written comments or elicited them from colleagues were: Mark McGuire (Food and Agriculture Organization of the United Nations – FAO), Rob Vos (FAO) and Frank van Rompaey (United Nations Industrial Development Organization – UNIDO).
Thomas Reardon (Michigan State University) prepared a background paper for the Report.
Ratnarkar Adhikari (Enhanced Integrated Framework – EIF – Secretariat), Anders Aeroe (International Trade Centre – ITC), Federica Alfani (FAO), Monica Castillo (ILO), Panagiotis Karfakis (FAO), David Kucera (ILO), Justine Namara (EIF), Chandan Sapkota (Asian Development Bank), Constanze Bianca Schultz (EIF), Marie-Claire Sodergren (ILO), Terje Tessem (ILO) and Mito Tsukamoto (ILO) met with the LDC Report team, shared material or data, or provided written contributions.
Erica Meltzer edited the text. Sophie Combette designed the cover. Stefanie West and Maria Bovey provided secretarial support.
Madasamyraja Rajalingam did the overall layout, graphics and desktop publishing.
Contents
What are the least developed countries ............................................................................................................... iii
Explanatory notes ................................................................................................................................................ x
Abbreviations ......................................................................................................................................................xi
Classifications used in this Report...................................................................................................................... xiii
Overview ......................................................................................................................................................... I-XII
INTRODUCTION: Recent Economic Trends and Outlook for the LDCs ....................................................................... 1
A. Introduction ...................................................................................................................................................2
B. The real sector ..............................................................................................................................................2
C. Current account and international trade .......................................................................................................2
1. Current account balance ...........................................................................................................................2
2. Trade in goods and services .......................................................................................................................4
D. Resource mobilization ..................................................................................................................................6
1. Domestic resource mobilization ..................................................................................................................6
2. Official capital flows ....................................................................................................................................8
3. Foreign direct investment ...........................................................................................................................8
4. Migrants’ remittances ................................................................................................................................9
E. The economic outlook for LDCs ...................................................................................................................9
Notes ................................................................................................................................................................10
References ......................................................................................................................................................10
CHAPTER 1: The 2030 Agenda for Sustainable Development and the Rural Development Imperative .. 11
A. The significance and implications of the 2030 Agenda for Sustainable Development for LDCs ................12
B. The importance of rural development and agriculture in LDCs ...................................................................14
C. Rural economies, urban economies and proximity .....................................................................................20
D. The gender dimension .................................................................................................................................24
E. The SDGs and the rural development imperative ........................................................................................25
F. Sustainable poverty eradication and poverty-oriented structural transformation ......................................30
G. The SDGs and opportunities for rural development ....................................................................................32
H. Agriculture and non-agriculture: harnessing the synergies .........................................................................33
I. Summary and conclusions ..........................................................................................................................35
Notes ................................................................................................................................................................36
References .......................................................................................................................................................36
CHAPTER 2: Agricultural Productivity: Developments, Determinants and Impacts.......................................... 39
A. Introduction ..................................................................................................................................................40
B. The crucial importance of agricultural productivity .....................................................................................40
C. Trends in LDC agricultural productivity .......................................................................................................42
1. Measuring agricultural productivity ............................................................................................................42
The Least Developed Countries Report 2015vi
2. Partial productivity measures ....................................................................................................................43
3. Total factor productivity.............................................................................................................................51
D. Determinants of agricultural productivity level and growth .........................................................................54
1. Quantity of conventional inputs .................................................................................................................54
2. Technology, input quality and human capital .............................................................................................57
3. Public investment and policies ..................................................................................................................61
4. Agroecological conditions and climate change .........................................................................................63
5. Rural diversification ...................................................................................................................................65
E. Summary ......................................................................................................................................................66
Notes ................................................................................................................................................................67
References .......................................................................................................................................................68
CHAPTER 3: Economic Diversification, Non-Farm Activities and Rural Transformation ................................. 77
A. Introduction ..................................................................................................................................................78
B. Patterns of rural economic diversification ...................................................................................................79
1. Household motivations for engagement in non-farm activities ...................................................................79
2. Non-farm income sources ........................................................................................................................80
3. Household specializations and routes out of poverty ................................................................................81
4. The spatial dimension ...............................................................................................................................82
5. The several dimensions of diversification, and implications for data interpretation .....................................83
6. Rural economic diversification: the contradiction between need and opportunity ......................................84
C. Rural economic diversification in LDCs: a snapshot ...................................................................................85
1. Existing data on the importance of non-farm activities in LDCs .................................................................85
2. New data on non-farm activities in nine LDCs ...........................................................................................87
3. Structural transformation of rural economies in LDCs ...............................................................................91
D. Key drivers of rural structural transformation ..............................................................................................92
1. Rural non-farm activities as a driver of agricultural upgrading ....................................................................92
2. Demand ...................................................................................................................................................93
3. Hard and soft infrastructure ......................................................................................................................96
F. Urban proximity and sectoral priorities for rural economic transformation ..................................................99
1. Peri-urban areas .....................................................................................................................................101
2. Intermediate rural areas ..........................................................................................................................101
3. Remote and isolated areas .....................................................................................................................103
G. Summary ...................................................................................................................................................104
Notes ..............................................................................................................................................................105
References .....................................................................................................................................................106
CHAPTER 4: Gender-based Patterns and Constraints in Rural Development .................................................. 113
A. Introduction ................................................................................................................................................114
B. Gender divisions of labour and employment patterns ..............................................................................115
1. Women’s roles in the home and on the farm ...........................................................................................115
viiCONTENTS
2. Non-farm activities and employment.......................................................................................................118
C. Obstacles to women’s greater contribution to rural development ............................................................120
1. Gender differences in assets: land and livestock .....................................................................................120
2. Human capital: education and literacy ....................................................................................................121
3. Access to inputs and markets ................................................................................................................123
4. The rural productivity gap .......................................................................................................................124
D. Differentiating causes and symptoms of gender inequality .......................................................................125
E. Summary and conclusions .........................................................................................................................126
Notes ..............................................................................................................................................................127
References .....................................................................................................................................................127
CHAPTER 5: Transforming Rural Economies in the Post-2015 Era: A Policy Agenda .................................. 131
A. New goals, new context, new strategies ...................................................................................................132
B. Priorities for rural transformation in the post-2015 era ..............................................................................132
1. Agricultural upgrading.............................................................................................................................132
2. Developing the rural non-farm economy .................................................................................................134
3. Maximizing agriculture-RNFE synergies ..................................................................................................135
4. The gender dimension: empowering rural women ..................................................................................136
5. Kick-starting rural economic transformation ............................................................................................138
6. Sequencing investments and interventions .............................................................................................139
C. Key policy areas for rural transformation ...................................................................................................140
1. Financing productive investment.............................................................................................................140
2. Harnessing technologies for agricultural transformation ..........................................................................142
3. Human resources ...................................................................................................................................144
4. Fostering enterprise and innovation ........................................................................................................146
5. Institutions ..............................................................................................................................................148
D. International dimensions ............................................................................................................................149
1. Mobilization of external resources ...........................................................................................................150
2. Trade ......................................................................................................................................................154
F. Conclusion ..................................................................................................................................................157
Notes ..............................................................................................................................................................160
References .....................................................................................................................................................160
Boxes
I.1. Recent trends in international commodity prices ........................................................................................6
1.1. The Sustainable Development Goals .......................................................................................................12
1.2. Defining “rural” and “urban” .....................................................................................................................21
1.3. Labour productivity and economically sustainable poverty eradication ..................................................31
2.1. The effects of agricultural technological innovation on poverty ...............................................................41
2.2. Caveats to the use of data on LDC agricultural inputs and outputs ........................................................43
2.3. Total factor productivity, embodiment and the measurement of technological progress in agriculture ..52
The Least Developed Countries Report 2015viii
3.1. Organic agriculture in LDCs ...................................................................................................................102
4.1. The Gambian fisheries sector ................................................................................................................118
4.2. Women’s access to land in Malawi, Rwanda and Lesotho ....................................................................121
4.3. Livestock farming and sale in Cambodia, Lao People’s Democratic Republic and United Republic of Tanzania ..................................................................................................................122
5.1. Agro-industries and global value chains ................................................................................................137
5.2. Barefoot solar engineers: South-South cooperation for renewable energy ...........................................145
5.3. Better rural data for better rural policies ................................................................................................152
Charts
I.1. Current account balance of LDCs, 2000–2014 ............................................................................................3
I.2. Composition of merchandise trade of LDCs ................................................................................................5
I.3. Private capital inflows to LDCs, 2000–2013.................................................................................................7
I.4. Official capital inflows to LDCs, 2000–2013 .................................................................................................8
1.1. Estimated global consumption floor, 1981–2011, and 2030 target ............................................................13
1.2. Poverty headcount ratio, 1990 and 2011 ...................................................................................................14
1.3. Poverty gap and infrastructure gap relative to GDP, LDCs and ODCs ......................................................15
1.4. Projected developing-country rural population (2030) and rural population growth (2013–2030) ..................................................................................................16
1.5. Share of agriculture in total employment in LDCs, 1991–1993 and 2010–2012 ........................................16
1.6. Share of agriculture in gross value added in LDCs, 1991–1993 and 2010–2012 ......................................17
1.7. Agriculture share in total exports of LDCs, 1995–1997 and 2011–2013 ....................................................18
1.8. Agriculture share in total imports of LDCs, 1995–1997 and 2011–2013 ....................................................18
1.9. Agricultural trade balances of LDCs, 1995–1997 and 2011–2013 .............................................................19
1.10. LDCs: Urban and rural shortfalls from selected SDG targets ....................................................................26
1.11. Projected increase in rural working-age population (age 15–59) in LDCs, 2013–2030 .............................28
1.12. Annual net increase in access to electricity, water and sanitation, LDCs, 1990–2012 (historical) and 2015–2030 (SDG-compatible) ........................................................................29
1.13. Complementarity of agricultural upgrading and rural economic diversification ........................................33
2.1. The vicious circle of low productivity and rural poverty .............................................................................41
2.2. Sectoral labour productivity levels: LDCs as a share of other country groups, 2011–2013 .....................44
2.3. Agricultural labour productivity level: LDCs as a share of other country groups, 1980–2012 ...................45
2.4. Labour productivity in LDC agriculture, by country groups, 1980–2013 ...................................................46
2.5. Agricultural land productivity in LDCs, 1980–2012 ....................................................................................48
2.6. Land/labour ratio, by country groups, 1980–2012 .....................................................................................49
2.7. Partial productivity ratios for LDCs and other country groups, 1980-2012, selected periods ...................50
2.8. Growth of agricultural total factor productivity in LDCs and other country groups,1960–2011 ................53
2.9. Indicators of input intensity in agriculture in LDCs and other country groups, 2010–2011 .......................56
2.10. Public agricultural R&D expenditure by country income level, 1981–2008, selected years ......................58
2.11. Road density by country groups, 2001–2011 ...........................................................................................62
2.12. Estimated loss in agricultural output by the 2080s, selected LDCs...........................................................64
2.13. Agricultural productivity, land/labour ratios and rural diversification in selected LDCs .............................65
ixCONTENTS
4.1. Gender wage gap in agriculture in selected LDCs ...................................................................................119
4.2. Male and female agricultural holders in selected LDCs ............................................................................120
4.3. Gender gap in land productivity, selected African LDCs ...........................................................................125
Box charts
I.1. Commodity prices, 2000–2015 .....................................................................................................................6
Map
1.1. Travel time to nearest city: Mali, Madagascar and Senegal .......................................................................23
Tables
I.1. Real GDP growth rates in LDCs, other developing countries and developed countries, 2002–2015 ............3
I.2. LDC exports and imports of goods and services, 2005–2014, selected years ..............................................4
I.3. Gross fixed capital formation, gross domestic savings and external resource gap in LDCs .........................7
I.4. FDI inflows to LDCs, 2004–2014, selected years ...........................................................................................9
I.5. Remittance inflows to LDCs, 2004–2014, selected years ..............................................................................9
1.1. LDC agricultural trade indicators ..................................................................................................................19
1.2. Urban proximity and stages of RNFE growth ...............................................................................................22
1.3. Female share of the agricultural labour force ...............................................................................................24
1.4. Employment to population ratio, aged 15+, in LDCs, 2000 and 2014 .........................................................25
1.5. Share of employment by sector and sex, in LDCs, 2000 and 2014 .............................................................25
3.1. Rural non-farm income: case study evidence for LDCs ...............................................................................86
3.2. Income and labour in rural activities in selected LDCs .................................................................................88
3.3. Income and labour by farm and non-farm activities in selected LDCs.........................................................89
3.4. Workers contributing to income by activities, gender and age in selected LDCs .......................................90
3.5. Level of education of workers contributing to income by activities in selected LDCs ................................90
3.6. Rural development priorities by rural proximity ..........................................................................................100
4.1. Time allocation by country, sex and activity in selected LDCs ...................................................................115
4.2. Status in total employment in LDCs, by sex, 2014 .....................................................................................116
4.3. Crops grown by sex of primary owner/manager ........................................................................................117
4.4. Share of female workers in selected high-value agro-industries in selected LDCs ...................................119
5.1. Summary of policies for poverty-oriented structural transformation (POST) of rural economies in the post-2015 era....................................................................................................................................158
Box table
3.1. Organic agricultural production in LDCs, 2013 .........................................................................................102
Annex tables
2.1. Total economically active population in agriculture in LDCs and other country groups, 1980–2012, selected years ..........................................................................................................................71
2.2. Agricultural labour productivity in LDCs and other country groups, 1980–2013, selected years ................72
2.3. Agricultural land productivity in LDCs and other country groups , 1980-2012, selected years ..................73
The Least Developed Countries Report 2015x
2.4. Land/labour ratio in LDCs and other country groups, 1980–2012, selected years ......................................74
2.5. Growth rate of agricultural total factor productivity, 1960–2011 ..................................................................75
3.1. Proportion of rural households deriving incomes from different sources, selected LDCs .........................111
3.2. Proportion of rural household income by source, selected LDCs .............................................................111
4.1. Labour force, agricultural labour force and female share in LDCs, 1980–2014, selected years ................129
4.2. Share of male and female employment in LDCs, by sector, 2000 and 2014 .............................................130
EXPLANATORY NOTES
The term “dollars” ($) refers to United States dollars unless otherwise stated. The term “billion” signifies 1,000 million.
Annual rates of growth and changes refer to compound rates. Exports are valued f.o.b. (free on board) and imports c.i.f. (cost, insurance, freight) unless otherwise specified.
Use of a dash (–) between dates representing years, e.g. 1981–1990, signifies the full period involved, including the initial and final years. An oblique stroke (/) between two years, e.g. 1991/92, signifies a fiscal or crop year.
The term “least developed country” (LDC) refers, throughout this report, to a country included in the United Nations list of least developed countries.
In the tables:
Two dots (..) indicate that the data are not available, or are not separately reported.
One dot (.) indicates that the data are not applicable.
A hyphen (-) indicates that the amount is nil or negligible.
Details and percentages do not necessarily add up to totals, because of rounding.
xiCONTENTS
Abbreviations
AfDB African Development Bank
AGOA African Growth and Opportunities Act
CAADP Comprehensive Africa Agriculture Development Programme
CGIAR Consultative Group on International Agricultural Research
CSAE Centre for the Study of African Economies
DAC Development Assistance Committee
DFID Department for International Development
DHS demographic and health survey
ECDPM European Centre for Development Policy Management
EICV3 Integrated Household Living Conditions Survey 3
EIF Enhanced Integrated Framework for Trade-Related Technical Assistance to Least Developed Countries
EU European Union
FAO Food and Agriculture Organization of the United Nations
FDI foreign direct investment
IFOAM International Federation of Organic Agriculture Movements
FiBL Research Institute of Organic Agriculture
GVC global value chain
GSP Generalized System of Preferences
GDP gross domestic product
GFCF gross fixed capital formation
GRUMP Global Rural-Urban Mapping Project
HYV high-yielding variety
ICT information and communication technology
ICTSD International Centre for Trade and Sustainable Development
IFAD International Fund for Agricultural Development
IFOAM International Federation of Organic Agriculture Movements
IFPRI International Food Policy Research Institute
ILO International Labour Organization
IMF International Monetary Fund
ISIC International Standard Industrial Classification of All Economic Activities
ISO International Organization for Standardization
IWMI International Water Management Institute
LDC least developed country
LDCR Least Developed Countries Report
LFS labour force survey
LTR land tenure regularization
MDG Millennium Development Goal
MFN most favoured nation
M-money mobile money
NASA National Aeronautics and Space Administration
NEPAD New Partnership for Africa’s Development
NGO non-governmental organization
ODA official development assistance
OHCHR Office of the United Nations High Commissioner for Human Rights
ODC other developing country
OECD Organisation for Economic Co-operation and Development

The Least Developed Countries Report 2015xii
POST poverty-oriented structural transformation
PPP purchasing power parity
R&D research and development
RIGA Rural Income Generating Activities
RIMISP Latin American Center for Rural Development
RNF rural non-farm
RNFE rural non-farm economy
SDG Sustainable Development Goal
SIDA Swedish International Development Cooperation Agency
SITC Standard International Trade Classification
SME small and medium-sized enterprise
SPS sanitary and phytosanitary
TFP total factor productivity
TNC transnational corporation
UNCTAD United Nations Conference on Trade and Development
UNDP United Nations Development Programme
UNECA United Nations Economic Commission for Africa
UNECE United Nations Economic Commission for Europe
UN/DESA United Nations Department of Economic and Social Affairs
UNICEF United Nations Children’s Fund
UNIDO United Nations Industrial Development Organization
USAID United States Agency for International Development
WESO World Employment and Social Outlook
WTO World Trade Organization
xiiiCONTENTS
Classifications used in this Report
Least developed countries
Geographical/structural classification
Unless otherwise specified, in this Report the least developed countries (LDCs) are classified according to a combination of geographical and structural criteria. The small island LDCs which are geographically in Africa or Asia are thus grouped with the Pacific islands, due to their structural similarities. Haiti and Madagascar, which are regarded as large island States, are grouped with the African LDCs. South Sudan declared its independence on 9 July 2011, and became both an independent State and a United Nations Member State on 14 July 2011. Accordingly, starting with 2011, data for South Sudan and Sudan (officially the Republic of the Sudan), where available, are shown under the respective country name. For periods prior to the independence of South Sudan, data for Sudan (former) include those for South Sudan unless otherwise indicated. The resulting groups are as follows:
African LDCs and Haiti: Angola, Benin, Burkina Faso, Burundi, Central African Republic, Chad, Democratic Republic of the Congo, Djibouti, Equatorial Guinea, Eritrea, Ethiopia, Gambia, Guinea, Guinea-Bissau, Haiti, Lesotho, Liberia, Madagascar, Malawi, Mali, Mauritania, Mozambique, Niger, Rwanda, Senegal, Sierra Leone, Somalia, Sudan (former) or South Sudan and Sudan, Togo, Uganda, United Republic of Tanzania, Zambia.
Asian LDCs: Afghanistan, Bangladesh, Bhutan, Cambodia, Lao People’s Democratic Republic, Myanmar, Nepal, Yemen.
Island LDCs: Comoros, Kiribati, Sao Tome and Principe, Solomon Islands, Timor-Leste, Tuvalu, Vanuatu.
Export specialization
UNCTAD has classified the LDCs under six export specialization categories, according to which type of export accounted for at least 45 per cent of total exports of goods and services in 2010–2012. The group composition is as follows:
Food and agricultural exporters: Guinea-Bissau, Malawi, Solomon Islands, Somalia.
Fuel exporters: Angola, Chad, Equatorial Guinea, South Sudan, Sudan, Yemen.
Manufactures exporters: Bangladesh, Bhutan, Cambodia, Haiti, Lesotho.
Mineral exporters: Democratic Republic of the Congo, Eritrea, Guinea, Mali, Mauritania, Mozambique, Zambia.
Mixed exporters: Benin, Burkina Faso, Central African Republic, Kiribati, Lao People’s Democratic Republic, Myanmar, Niger, Senegal, Sierra Leone, Togo, United Republic of Tanzania.
Services exporters: Afghanistan, Burundi, Comoros, Djibouti, Ethiopia, Gambia, Liberia, Madagascar, Nepal, Rwanda, Sao Tome and Principe, Timor-Leste, Tuvalu, Vanuatu, Uganda.
Other groups of countries and territories
Developed countries: Andorra, Australia, Austria, Belgium, Bermuda, Bulgaria, Canada, Croatia, Cyprus, Czech Republic, Denmark, Estonia, Faeroe Islands, Finland, France, Germany, Gibraltar, Greece, Greenland, Holy See, Hungary, Iceland, Ireland, Italy, Israel, Japan, Latvia, Lithuania, Luxembourg, Malta, Netherlands, New Zealand, Norway, Poland, Portugal, Romania, Saint Pierre and Miquelon, San Marino, Slovakia, Slovenia, Spain, Sweden, Switzerland, United Kingdom, United States.
Other developing countries (ODCs): All developing countries (as classified by the United Nations) which are not LDCs.
The Least Developed Countries Report 2015xiv
Product classification
Goods: The figures provided below are the codes of the Standard International Trade Classification (SITC), revision 3.
Primary commodities: sections 0, 1, 2, 3, 4, division 68 and groups 667 and 971.
Agriculture and food: sections 0, 1, 2, and 4, excluding divisions 27 and 28.
Minerals: divisions 27, 28, 68, and groups 667 and 971.
Fuels: section 3.
Manufactures: sections 5, 6 (excluding division 68 and group 667), 7 and 8.
Labour-intensive and resource-intensive manufactures: divisions 61, 63, 64, 65, 82, 83, 84, 85, 66 (excluding group 667).
Low-skill and technology-intensive manufactures: divisions 67, 69 and groups 785, 786, 791, 793, 895, 899
Medium-skill and technology-intensive manufactures: divisions 62, 71, 72, 73, 74, 77 (excluding group 776), 81, and groups 781 to 784, 893, 894.
High-skill and technology-intensive manufactures: section 5, divisions 75, 76, 87, 88 and groups 776, 792, 891, 892, 896, 897.
Section 9 (Commodities and transactions not classified elsewhere in the SITC) has been included only in the total of exports of goods and services, but not in the goods classification above, except for group 971 (Gold, non-monetary (excluding gold ores and concentrates)), which has been included in Minerals.
Services: Total services cover the following main categories: transport, travel, communications, construction, insurance, financial services, computer and information services, royalties and licence fees, other business services, personal, cultural, recreational and government services.

OVERVIEW
The Least Developed Countries Report 2015II
Recent trends and outlook for LDCs
Economic growth in the least developed countries (LDCs) has slowed since 2012, when impressive performance by fuel-exporting countries took the growth rate of their real gross domestic product (GDP) to a post-financial crisis peak of 7.2 per cent. In 2014, less favourable external conditions (compounded by the impact of the Ebola outbreak in Guinea, Liberia and Sierra Leone) contributed to a further deterioration in their economic performance. The average growth rate of LDCs as a group was 5.5 per cent in 2014, with very similar average rates across all geographical subgroups. This was a reduction from 6.1 per cent in 2013 and well below the 2002–2008 average of 7.4 per cent, but significantly stronger than the 4.4 per cent growth recorded by other developing countries (ODCs).
The LDCs’ collective current account deficit increased to a record level of $49.4 billion in 2014, 40 per cent higher than in 2013 and 87 per cent higher than in 2012, the increase originating primarily in the African LDCs and Haiti. The merchandise trade deficit nearly tripled to $33.6 billion in 2014, as imports rose by $20 billion and exports fell by $1.9 billion.
Across LDCs as a whole, gross fixed capital formation (GFCF) increased to 26.3 per cent of GDP in 2013. This is not only higher than the 2012 level and the 2002–2008 average, but also, more importantly, slightly above the 25-per-cent level deemed necessary to sustain long-term growth. In island LDCs, however, GFCF recovered only partly from its slight decline in 2012, and stayed well below that threshold level (though also well above the 2002–2008 average), at 20.3 per cent. Savings rates remained stable overall at 19 per cent of GDP, a decline in the African LDCs and Haiti being offset by increases in the Asian and island LDCs. The shortfall relative to the investment rate resulted in a resource gap of 7.2 per cent of GDP, signifying continuing dependence on external resources.
The external resource gap was financed from a combination of official sources (mostly official development assistance (ODA)) and private sources (mostly migrants’ remittances and foreign direct investment (FDI)). ODA inflows rose by 2 per cent to $44.2 billion in 2013, accounting for 93 per cent of total official capital flows, but bilateral ODA flows are estimated to have fallen by 16 per cent in real terms in 2014. Remittance flows grew by 7.1 per cent to $35.8 billion in 2014, with increases in all three geographical subgroups. FDI flows rose by 4.1 per cent to $23.2 billion. While FDI flows to the African LDCs and Haiti increased by $1 billion, recovering half the reduction experienced in 2013, those to Asian LDCs fell marginally, and those to island LDCs fell by a further 31 per cent to less than one fifth of their 2010 level.
The slowdown in developing economies is expected to continue in 2015, partly reflecting further falls in commodity prices, while economic performance in developed economies is expected to improve. Against this background, growth in LDCs as a group is projected at 5.2 per cent in 2015, continuing the gradual slowdown experienced since 2012 but remaining above the projected rate for developing countries as a whole (4.4 per cent).
The 2030 Agenda for Sustainable Development and the rural development imperative
The 2030 Agenda for Sustainable Development represents a paradigm shift in the development agenda, establishing, for the first time, a collectively agreed set of universal goals for an inclusive and sustainable global development process. It also represents a step change in ambition, which implies a new and different approach to development and development policies, especially in the LDCs.
The present human rights framework places responsibility for the “progressive realization” of economic and social rights on national Governments — which are supposed to act within the means available to them — alongside the international dimension. The Sustainable Development Goals (SDGs), by contrast, represent two fundamental changes as compared with the existing framework. They constitute an acceptance by the global community as a whole of collective responsibility for the achievement of economic and social rights by the world population as a whole. They also set a date for the realization of these rights (2030). These two shifts are mutually interdependent: Collective responsibility provides the means of overcoming national resource constraints within the given time frame.
The absolute nature of the SDGs — eradicating human development shortfalls rather than merely reducing them — has critically important implications. First, it requires an enormous acceleration in the rate of progress:
IIIOVERVIEW
Recent estimates suggest that the “global consumption floor” (in principle, the consumption per capita of the poorest household in the world) has stagnated for 20–30 years, but must double in the next 15 years if poverty is to be eradicated. Second, it implies a fundamental shift in focus, towards areas of greatest need. This, in effect, means the least developed countries, because this is where poverty is systematically highest, where it is falling most slowly and where the obstacles are greatest. The LDCs are, quite simply, the battleground on which the 2030 Agenda for Sustainable Development will be won or lost.
Since the majority of the LDCs’ population live and work in rural areas, rural development is the main driver of poverty reduction and will be essential to achieving the SDGs in these countries; but this does not mean that urban development can be ignored. Sustainable development and poverty eradication clearly require both; and, even for rural economies, the relationship with urban areas is a key consideration. Many rural households depend on urban markets or remittances from urban migrants. Equally, rural-urban migration is an important for urban economies, at best providing an urban workforce for industrial development, but at worst — when it results from failing rural economies — fuelling unsustainable urbanization, increasing urban poverty and exacerbating strains on social infrastructure.
But there is a limit to the potential of urban areas to drive growth. There is a limit to how quickly cities can grow sustainably; the peak level of manufacturing employment (i.e. the maximum contribution of manufacturing to total employment along the process of structural transformation) has been declining, even in the most successful developing countries. Moreover, extractive industries create little employment. National economies depend more than ever on a balanced process of rural and urban development, allowing an upward convergence of minimum income levels in rural and urban areas, and a rural-urban migration process driven by choice rather than necessity.
Rural areas vary very widely across LDCs. A key dimension of this variation is proximity to urban areas (and the size, nature and connectedness of the nearest town or city), which is a major determinant of the opportunities and potential for rural development. While peri-urban areas have good access to urban markets, and intermediate areas have some access, this is more limited for remote and isolated areas — particularly in LDCs with limited transport infrastructure. As infrastructure improves — which it must do if the SDGs are to be fulfilled — this will result in a progressive economic opening of the more remote rural areas; and ensuring that their economies are ready to withstand the shock and to exploit the opportunities that come with such opening will be crucial to successful rural development.
Rural development is of particular importance in LDCs. First, more than two thirds of their total population lives in rural areas, and in only six LDCs is the proportion below 50 per cent. This pattern is not expected to change substantially by 2030: Rural population growth will remain much faster, and the rural share of the population will remain much higher, than in ODCs throughout the SDG period (2015–2030).
Second, agriculture plays a crucial role in all LDC economies, accounting for 60 per cent of total employment and 25 per cent of value added. It also represents a major source of export revenues, except for LDCs specialized in exporting fuels and manufactures and some LDCs specialized in mineral exports. Food accounts for 18 per cent of imports, and the trade deficit in food products of LDCs as a whole has widened dramatically from $2 billion in 1995–1997 to $21.8 billion in 2011–2013, largely as a result of increasing deficits in fuel and manufactures exporters.
Third, shortfalls in human development are much greater in rural than in urban areas. The proportion of people below the national poverty line in rural areas is generally around double that in urban areas, and the average income shortfall relative to the poverty line is around 20 per cent greater. The challenge of eliminating rural poverty will be further heightened by rapid growth of the rural workforce in most LDCs over the next 15 years. Agriculture has a particularly important role, both as the primary driver of poverty reduction at the national level, and as a source of staple and non-staple foods.
Typically, rural people in LDCs are 50 per cent more likely than their urban counterparts not to have access to sanitation or to attend secondary school, twice as likely not to have access to electricity or to attend primary school, and more than four times as likely not to have access to clean water. Achieving the SDGs would mean 45 per cent more rural children attending primary school and four times as many attending secondary school. It would also mean 70 per cent more rural people having access to an improved water source, 250 per cent more to sanitation, and 10 times as many to electricity. This would require a quantum leap in infrastructure investment in rural areas of LDCs: Access to water needs to increase more than twice as fast as in 2011–2012, access to electricity four times as fast and sanitation six times as fast.
The Least Developed Countries Report 2015IV
Structural transformation will be central to rural poverty eradication: While income transfers will be needed to reach the last few poor households, the sheer scale of poverty in most LDCs and the logistical challenges mean that such transfers cannot be the main driver of poverty reduction. Incomes from economic activity will need to be increased; and, to be economically sustainable, higher incomes must be matched by higher productivity. This will require both increasing productivity within sectors and a shift of productive resources between sectors and activities, from those with lower productivity to those with higher productivity.
Sustainable poverty eradication in LDCs requires a particular kind of poverty-oriented structural transformation (POST). It must simultaneously:
• Increase the overall level of labour productivity, as a basis for a sustained development process;
• Provide productive economic opportunities for the entire workforce;
• Increase the lowest levels of labour productivity to a level sufficient to generate an income above the poverty line, even for those households with the highest dependency ratios; and
• Ensure that such increases in productivity are fully translated into higher household incomes.
Ideally, it should also ensure a sufficient increase in the tax base to allow public revenues to meet the recurrent costs of the social provision needed to achieve the SDGs and the costs of effective governance and economic and social policy, without the tax burden pushing the poorest households below the poverty line.
As well as changing the goals of development strategies, the SDGs — assuming they are matched at least in part by appropriate actions nationally and internationally — signal a major change in the context in which they will operate, especially in rural areas. The considerable increase in infrastructure investment implied by the SDGs will have important implications for the availability of infrastructure and production factors essential to production. If this investment is based on labour-based construction and maintenance methods and local procurement of the inputs required by public works, it can also be expected to give rise to a substantial increase in the demand for labour and locally produced input goods (e.g. construction materials) and services. And accelerated poverty reduction will accelerate demand growth for those goods purchased by poor households as their incomes rise, notably staple and higher-value foods (vegetables, vegetable oils, fruit, meat and fish), and basic household goods and services.
Achieving rural economic transformation, and hence sustainable poverty eradication, requires development strategies to exploit to the fullest the opportunities offered by such a “post-2015 world”.
The key to this is harnessing the synergies between agricultural upgrading and rural economic diversification through development of the rural non-farm economy (RNFE). Agricultural growth generates demand for goods and services from the non-farm sector; and the income generated by development of the non-farm sector generates demand for more and higher-value foods. This gives rise to a multiplier effect within the local economy (typically of the order of 1.6–1.8 in Asia and 1.3–1.5 in sub-Saharan Africa). Equally, increasing income in each sector provides resources for investment — essential in a context where credit is unavailable or unaffordable — and the non-farm economy can generate income opportunities for rural workers as labour is shed due to increasing agricultural productivity. The development of agricultural processing can also increase agricultural incomes by making produce more tradable, as well as generating non-farm income.
What is required is a shift from a process driven by “push” factors — the critical need to maintain a minimally adequate level of consumption — to one driven by the “pull” of new and economically attractive non-farm opportunities. “Push” factors result in a proliferation of suppliers in activities with very low entry barriers (minimal need for capital, education, skills, etc.), which are generally also characterized by low incomes and productivity; and the resulting oversupply depresses incomes still further. Successful rural development simultaneously reduces “push” pressures, by raising agricultural incomes, while generating more productive non-farm income opportunities through the creation of viable non-farm enterprises.
VOVERVIEW
Agricultural productivity: Developments, determinants and impacts
Agricultural productivity is critical both to the well-being of the population in LDCs and to the structural transformation of their economies, playing an essential role in rural economic transformation and development and strengthening the RNFE. Increasing agricultural productivity tends to lower food prices, thereby increasing real wages in both rural and urban areas; prevents the terms of trade from turning against urban activities (a potential obstacle to structural transformation); and improves food security by increasing and stabilizing food supplies.
In the archetypal structural transformation process, increasing agricultural productivity releases labour and capital to be employed in other (in principle more productive) sectors, while generating agricultural surpluses that provide a source of domestic demand for industrial goods and services, spurring growth in their supply. It thus increases productivity in other sectors, accelerating the development process.
Agricultural labour productivity in LDCs is much lower than in ODCs and in developed countries, and has grown more slowly, resulting in a widening international labour productivity gap. Agricultural value added per worker has grown by 2.2 per cent annually since 1991 in LDCs, compared with 4.2 per cent in ODCs and 3.9 per cent in developed countries. In 2011–2013, LDC agricultural labour productivity was 19 per cent of that in ODCs and 1.8 per cent of that in developed countries, a much wider gap than in industry or services. Given the concentration of the labour force in agriculture in LDCs, this wider productivity gap is the major cause of income divergence between LDCs and these other country groups.
In African LDCs and Haiti, agricultural labour productivity declined in the 1980s and 1990s, and has grown relatively slowly since 2000 (slightly above 1 per cent annually). This is largely a consequence of the decline and subsequent stagnation of spending on agricultural research and development (R&D), and of policies (e.g. exchange rate and trade policies) that discriminate against agriculture. In the Asian LDCs, by contrast, productivity growth picked up earlier, in the 1990s, and has risen robustly (by 3.5 per cent annually) since 2000, faster than the averages for all ODCs. The positive performance has been driven by greater investment in R&D and more favourable policies. Over the past decade, agricultural labour productivity in Asian LDCs has overtaken that of both the African and island LDCs.
Output per worker can be broken down into land productivity (yield) and the land/labour ratio. Yields have increased more strongly than labour productivity in LDCs, but have lagged behind the robust growth in ODCs since the 1980s, reaching 38 per cent of the ODC average in 2010–2012. Among LDCs, yields have grown most vigorously in Asia, more than doubling since 1980, to reach a present level 17 per cent higher than that of ODCs. In African LDCs and Haiti, performance was weaker and more varied across countries. It was especially sluggish during the 1990s, but has picked up somewhat since the turn of the century.
Increased agricultural production in LDCs since the early 1980s has come partly from extension of the cultivated area, particularly in African LDCs and Haiti and in island LDCs, with a more limited extension in Asian LDCs, similar to that in Asian ODCs. Land/labour ratios are generally lowest in Asian LDCs, but are declining most strongly in African LDCs and Haiti.
These developments have had an adverse impact on the well-being of the population and have limited the pace of poverty reduction.
Total factor productivity (TFP) growth in LDCs as a group has also historically lagged far behind that of other country groups, stagnating from the 1960s to the 1980s, but rising in the 1990s and accelerating somewhat since 2000. Asian LDCs have outperformed all other major country groups since 2000. In African LDCs and Haiti, by contrast, agricultural TFP was largely stagnant from the 1960s to 2000, and has been slower than in other country groups since then. In island LDCs, TFP has grown very slowly since the 1960s.
Agricultural labour productivity and yields have risen most strongly in manufactures exporters and mixed exporters, indicating that greater structural transformation and economic diversification are generally associated with greater improvements in agricultural productivity. This confirms the link between agricultural progress and overall economic development, and the mutual reinforcement of development in agriculture and other productive sectors.

The Least Developed Countries Report 2015VI
The main factors driving (or constraining) productivity growth in agriculture in LDCs are the quantity of inputs; technology, human capital and input quality; public investment and policies; agroecological conditions and climate change; and rural diversification.
The quantity of inputs (land, labour, material inputs and physical capital) used is especially important in countries at earlier stages of agricultural development. LDC agriculture is generally characterized by very intensive employment of labour; extensive use of land; and very limited use of other inputs, reflecting low incomes, inadequate water supply and foreign exchange shortage. Overall use of synthetic fertilizers per hectare in LDCs is only 10 per cent of that in ODCs and 15 per cent of that in developed countries. Mechanization is similarly limited, as is irrigation, except in Asian LDCs, where use of fertilizers and machinery is also greater.
Technology affects the adaptation of plant and animal varieties to local agroecological conditions, the quality of inputs, the choice of cultivation and rearing techniques, and so forth, as well as variety yields. While public investment in agricultural R&D generates high rates of return, commitment has generally been low in LDCs, resulting in limited and volatile public spending. In African LDCs, the much greater variety of farming systems than in Asian LDCs is a further challenge to R&D appropriate to particular agroecological conditions.
Since the diffusion of innovations among producers is neither automatic nor rapid, agricultural extension services are an essential link between the generation of innovations by R&D and their adoption at the farm level. Poverty represents a further obstacle to the adoption of new agricultural technologies, especially in LDCs.
Human capital plays a major role in technology adoption, affecting the use and combination of inputs by farmers. Education contributes to the acquisition and assimilation of information, and to the learning, mastery and implementation of technologies.
There is increasing recognition of the importance of public policies to agricultural productivity, through spending on R&D, extension services and education, investment in “hard” (physical) infrastructure, “soft” (institutional) infrastructure and sectoral measures. Public investment in hard and soft infrastructure is a precondition for private investment in agriculture, while constraints on financial market development can be a substantial obstacle.
Over the long term, land productivity is weakened by underinvestment in land improvement as a result of low incomes and limited financial market development, leading to a progressive deterioration in land quality. Climate change is expected to exacerbate this process, resulting in a projected 18-per-cent reduction in cereal yields in low-income countries between 2000 and 2050. The resulting changes in total agricultural output in LDCs range from +5 per cent to -40 per cent, with much stronger effects in African than in Asian LDCs. This is likely to reduce labour productivity.
Rural diversification is also a key driver and facilitator of productivity growth and upgrading in agriculture. Rising off-farm incomes provide additional financing for agricultural investment and technological upgrading and boost demand growth for agricultural produce; and the development of off-farm activities increases the supply of key inputs and services for agriculture. Improved vertical coordination is critical to achieving a timely flow of productivity-enhancing inputs to farmers and of quality agricultural raw materials to agro-industry.
Rural structural transformation for sustainable poverty eradication
While the principal income source of rural households is farming, most of them engage in a range of economic activities. Motivations vary widely between households. Better-resourced households are often “entrepreneurs by choice”, pursuing opportunities to increase their incomes. Poorer households are generally “entrepreneurs by necessity”, driven to seek additional incomes by the need to sustain a minimum level of consumption, or else seeking to diversify their incomes as a means of self-insurance against high levels of risk in agriculture.
Agricultural demand for wage labour is typically limited to seasonal and casual work, and farm wages are low, reflecting an excess supply of labour due to “push” pressures. Income from rural non-farm (RNF) activities thus generally exceeds income from agricultural wage employment. Non-farm income also generally exceeds migrant remittances (with a few exceptions, such as Lesotho), contrary to conventional wisdom. With these limitations on
VIIOVERVIEW
other income sources, non-farm activities are a critical element of household income diversification strategies. Within the non-farm sector, wage income can be as important as self-employment income in African LDCs, and more so in some Asian LDCs.
Given the limitations of subsistence production and agricultural wage employment, the main route out of poverty is through some combination of market-oriented smallholder farming, non-farm activities and emigration from rural areas.
Distance from urban areas plays a key role in opportunities for non-farm activities, so that RNFE development has tended to be concentrated around towns and cities. Non-farm employment opportunities and wages are higher in peri-urban areas, while producers in more distant rural areas are disadvantaged in urban markets by the need to compete with peri-urban producers who have advantages in delivery times and costs, as well as generally greater access to services and infrastructure.
There is thus a fundamental contradiction between need and opportunity, both at an economy-wide level and among households. It is the most disadvantaged areas and households that have the greatest need for economic diversification (since they have the least access to agricultural markets, the lowest incomes and the highest risks); but they also have the least opportunities and face the greatest obstacles to taking such opportunities (due to limited financial and human resources, infrastructure, access to inputs and ability to bear risk). Overcoming this contradiction, and ensuring that those with the greatest need for economic diversification have the means to achieve it, will be critical to rural structural transformation and sustainable poverty eradication.
Since data on non-farm activity in LDCs (and also in ODCs) are very limited, this Report provides new estimates based on raw data for nine LDCs — five in Africa and four in Asia. This confirms the general trends described above, while highlighting the variation of rural diversification and RNFE development across LDCs. Among these nine countries, RNFE development is most advanced in Bangladesh and Nepal (47–49 per cent of rural employment), and least advanced in Ethiopia and United Republic of Tanzania (11–12 per cent). However, these new data contradict the widespread view of a simple Africa/Asia dichotomy: The importance of the RNFE in rural incomes and employment is very similar across the five other countries, which span both regions (Malawi, Rwanda, Zambia, Myanmar and Yemen, with 20–28 per cent of rural employment in the RNFE).
A more detailed assessment of Bangladesh, Malawi and Nepal highlights differences in the sectoral composition of non-farm activities, the largest subsectors being manufacturing, services and construction, respectively. However, manufacturing and services are important in all three cases, each accounting for 22–42 per cent of total RNFE income in every country. There are also considerable differences between these countries in the roles of women and young people in the rural economy. While those engaged in non-farm activities have consistently higher levels of education than those in agriculture, the highest level of education is in the country with the lowest level of non-farm activity (Malawi). This suggests that education alone is insufficient to drive rural economic diversification.
The great majority of LDCs in all categories remain in the first stage of rural economic transformation, in which RNF activities are focused mainly on agriculture (though often fairly evenly divided among commerce, manufacturing and other services), and mainly informal. However, using the categorization of agriculture-based and transforming countries presented by the World Bank’s World Development Report 2008 as a proxy suggests that a small group of African and Asian LDCs — Angola, Bangladesh, Senegal and Uganda — are in the second stage of RNF sector transformation. In this stage, rural-urban links are more important, and non-farm activities are more varied, also encompassing such activities as tourism, mining and services as well as agribusiness in commercial farming areas. Small-scale labour-intensive production in rural areas often coexists with relatively capital-intensive enterprises producing similar products in intermediate cities.
Farmers in areas of good agricultural potential and with access to markets have relatively greater opportunities to upgrade by increasing production of higher-value products, for domestic, regional and wider export markets. Product standards and non-tariff barriers can be a serious obstacle to exports: Quality management is increasingly important, but capacity for implementation and policing in LDCs is often limited. In African LDCs, however, the low level of intraregional trade points to particular potential for regional exports.
Non-farm activities can act as a driver of agricultural upgrading by providing investable resources and upstream and downstream services for agriculture, particularly in higher-value crops. RNFE income is generally the main source of cash for investment, especially in African LDCs, and is sometimes used as a substitute for collateral.
The Least Developed Countries Report 2015VIII
RNFE activities in the production of agricultural inputs can affect choices of crops and technologies by increasing access to input supplies and adapting them to the needs of local farmers; others, such as agroprocessing, may provide additional and/or more favourable market outlets, and increase profitability, including through contract-farming arrangements and integration in value chains. Transportation services and commerce contribute to both. However, just as RNFE activities can contribute substantially to agricultural upgrading, so underdevelopment or inappropriate development of the off-farm sector can act as a constraint on agricultural development.
While governments and donors pay a great deal of attention to the supply-side needs of RNFE development, the equally important demand side is often neglected. Major sources of demand for RNFE are nearby urban markets (for peri-urban areas), local rural markets, and exports (primarily for agroprocessing and in some areas tourism). Domestic demand plays a critical role, both in agricultural upgrading and in RNFE development. Growth engines such as urban markets, market-oriented agriculture, and entrepôts and transport corridors can thus provide a substantial boost, as can “implanted” natural resource-based projects such as mines and forestry (although these often operate as enclaves, with limited linkages to the local economy).
Beyond the geographical reach of such engines, migrant remittances can also act as a growth engine, although they are often concentrated among a few households, limiting their impact. In relatively closed local economies, local demand within the rural economy can act as a (somewhat weaker) engine, as the additional demand for agricultural produce and RNF activities associated with increasing incomes gives rise to multiplier effects, estimated in various LDCs at 1.3–2.0.
The key to rural structural transformation is to enable rural producers to respond effectively to demand changes as development progresses and incomes rise. This means moving beyond a focus on increasing agricultural productivity to paying more attention to rural non-farm activities and increasing production of higher-value agricultural products.
Increases in income translate into disproportionate increases in spending on non-food items and higher-value and more processed foods, generating opportunities for both agricultural upgrading and the development of agroprocessing. Recent evidence from LDCs in southern and eastern Africa and South Asia points to substantial demand for non-food products and non-staple and processed foods, indicating considerable potential for growth in local demand to drive agricultural upgrading and RNFE development.
Density and quality of infrastructure are crucial — to access markets for output and inputs, to reduce production and transaction costs, and hence to ensure effective supply response — and are associated with greater farm and non-farm investments and higher RNF incomes, especially in more favourable agroclimatic zones. This includes both soft infrastructure (e.g. marketplaces, communications networks, education and health services, financial and payments systems and market information systems) and hard infrastructure (e.g. electricity and water supply, storage facilities and roads). Infrastructure is extremely limited in most rural areas in LDCs, especially beyond peri-urban areas.
Electrification is a critical element of rural infrastructure investment, with a potentially transformative effect; and renewable energy technologies now have the potential to overcome some of the key constraints on rural electrification. Better access to, and improved quality of, education can also have a substantial impact on RNF development over the longer term.
Transport infrastructure plays a pivotal role as well, and increased connectedness will be indispensable to poverty eradication in rural areas. However, this is not a linear process, and the opening associated with strengthening transport connections is a two-edged sword, exposing local producers to competition from urban products and imports which they are ill-placed to withstand, as well as increasing access to inputs and markets. Key challenges in the post-2015 context will be to enable rural producers to compete effectively in an increasingly open local market; to identify and move successfully into new and remunerative activities; and to harness the economies of scale and develop the marketing skills needed to compete in markets elsewhere.
Construction of rural infrastructure can also play a very important secondary role in rural development, by creating employment through labour-based construction and maintenance methods and RNFE opportunities through local procurement. As well as potentially reducing costs, this could contribute substantially (albeit temporarily) to reducing the deficit in demand that constrains RNFE development.
The key role of urban proximity in the development of rural areas, and of their opening to wider markets through improved transport infrastructure, highlights the importance of a differentiated approach to peri-urban, intermediate
IXOVERVIEW
and remote and isolated areas, according to their respective comparative advantages. The comparative advantage of peri-urban areas lies primarily in servicing urban markets, notably for higher-value and processed foods, as well as, for example, leisure activities and transport services.
In intermediate areas, export production is often more important, providing opportunities for upgrading and processing activities, as well as increasing export value through product differentiation (e.g. organic certification). Diversification of agricultural production into higher-value crops and agroprocessing to increase tradability of agricultural produce may also provide useful opportunities, as may biofuel production and biofuel crop cultivation. Other options include commercialization of craft production, construction materials (especially in the post-2015 context) and, where local conditions are conducive, mining, tourism, forestry, fisheries and so forth.
Remote and isolated areas are generally oriented primarily towards subsistence production, making increased production of staple foods a precondition for structural transformation. Limited connection with wider markets makes local demand the primary driver of development, suggesting a focus on progressively increasing production of higher-value foods, livestock and artisanal agroprocessing. While demand for “Z goods” (non-food goods, typically of relatively low quality, produced on a small scale using traditional labour-intensive methods) is also likely to increase over time, the long-term viability of such production is limited. High transport costs and the potential for substantial local demand arising from post-2015 infrastructure investments point to a potential market for construction materials where these are available locally.
Gender-based constraints on rural economic transformation
Women make up half of the agricultural labour force in LDCs, and this proportion has increased progressively over time in all three geographical subgroups. However, rural women in LDCs continue to face multiple constraints on their productive potential. The double burden of productive activities and care work gives rise to greater time constraints for women than for men, and also limits their mobility and the time they can devote to upgrading their skills. This is compounded by a disproportionate burden of unpaid agricultural work: While food crops are traditionally viewed as “female” and cash crops as “male”, the distinction arises primarily in control over the proceeds, as women generally provide as much of the labour as men in cash crop production. There are, however, gender differences in the distribution of agricultural tasks and in livestock: While men generally predominate in cattle herding, women tend to raise poultry and other small livestock and dairy animals.
There are also significant gender differences in non-farm activities, women often predominating in petty and retail trade, and men in transport and construction. Artisanal agroprocessing is often a traditionally female occupation, and employment in agro-industrial processing of high-value products also tends to be predominantly female. However, even when they are in wage employment, women are more likely than men to be segregated in part-time, seasonal and/or low-wage work. While new forms of organization can provide new opportunities for rural women, they thus also pose new challenges.
Women face particular constraints on access to productive resources. There is a consistent pattern of inequality in access to land across LDCs. However, this arises primarily from sociocultural practices enshrined in customary law and practices rather than from civil law, which creates major challenges in turning legal enactments into de facto rights. Rural women, and particularly female heads of household, also tend to have lower literacy rates and significantly fewer years of education than their male counterparts.
These disadvantages contribute to limited access to credit, where it is available, as women are less likely to have land to use as collateral, and are less able to complete application formalities. Partly for this reason, they are less likely to use inputs such as fertilizers and improved seeds; and the benefits of input subsidy schemes are often limited by lack of gender sensitivity in their design. When women farmers do use purchased inputs, the effect on their productivity can also be more limited, possibly reflecting gender biases in agricultural extension services. Female-headed households are also often disadvantaged by limited male family labour and cultural constraints on their ability to hire non-family labour.
These factors contribute to significant differences between male- and female-managed plots in terms of yields, harvested areas and crop losses. These gender-based obstacles compound and interact with other market imperfections in rural areas to diminish women’s productivity and entrepreneurial potential, reducing the dynamic
The Least Developed Countries Report 2015X
potential of rural economies and slowing their transformation. Unless such constraints are addressed, the supply response to incentives aimed at increasing production and marketed surpluses will remain sluggish, as half of the labour force will remain unable to respond effectively. Globally, the Food and Agricultural Organization of the United Nations (FAO) estimates that providing women with the same access to productive resources as men could increase yields on their farms by 20–30 per cent, raising total agricultural output by 2.5–4 per cent.
However, there is an important distinction between gender inequalities that arise directly from gender norms, and what might be called contingent inequalities — those which arise indirectly from the interaction of the resulting disadvantages with those arising from poverty. The double burden of care and productive work, discriminatory practices in land ownership and inheritance, differences in access to education and gender segregation in labour markets, for example, arise directly from gendered social structures and norms; and addressing them effectively requires direct, gender-specific action to correct or compensate for structural gender biases.
However, the consequences of these disadvantages — low incomes, limited savings and assets, lack of access to inputs, markets and/or credit, etc. — are shared by many men, whose productivity is similarly impaired as a result. These indirect disadvantages are more appropriately addressed through more inclusive but gender-sensitive approaches, directed both at women and at equally disadvantaged men. Directing support to women while arbitrarily excluding similarly disadvantaged men, particularly in a context of strongly patriarchal traditional cultures, could result in alienation, potentially undermining longer-term efforts to tackle the underlying causes of gender inequality.
Domestic policies for rural economic transformation
In principle, poverty eradication ultimately requires: (1) decent work for all; (2) a minimum wage at a level sufficient to provide households at least with an income that is above the poverty line; and (3) social safety nets. However, this is better seen as a destination than as a route. To be feasible and economically sustainable, poverty eradication requires poverty-oriented structural transformation (POST), to ensure that productivity is sufficient to support wages at this wage level and that dips in income below the poverty line are limited and temporary. Structural transformation of rural economies, encompassing agricultural upgrading and diversification into non-farm activities, is a key part of this process.
Agricultural needs vary widely between locations, but key elements include:
• Agricultural right-sizing. Rather than seeking to promote either small- or large-scale agriculture, policies should be based on optimal plot sizes in each location, given the agroecological and other conditions as well as the potential crops, taking account of economic, social and environmental considerations.
• Increasing use of locally appropriate inputs to increase agricultural productivity and yields, while maintaining labour intensity and increasing environmental sustainability. This can be achieved through extension services and measures to boost the local supply of these inputs.
• Promoting early adoption of innovations and new technologies, especially by women and other disadvantaged producers, e.g. through input subsidy schemes encompassing packages of inputs for different agroecological and farm systems, and measures to tackle scale issues in input supply.
• Increased support to R&D and extension. This should also include measures to ensure that R&D and extension meet the needs of small and women farmers and local conditions, by integrating gender considerations into extension services, establishing a two-way communication process between producers and R&D agencies through extension services, and identifying and supporting local farm advisers.
• Market differentiation, through organic, fair trade and sustainability certification, as a means of increasing the value of agricultural exports. Capacity-building for producers and government facilitation of certification processes can help to prevent such schemes from becoming de facto non-tariff barriers.
Agricultural upgrading can reduce push pressures for “survivalist” income diversification. Together with support to “entrepreneurs by choice” (and increased opportunities through rural electrification), this can help to create a more dynamic non-farm sector. While microenterprise creation is likely to be needed in remote and isolated areas, enterprise expansion can create more employment in peri-urban areas. Non-farm activities are particularly important in generating productive employment in seasons of low agricultural labour demand.
Increased staple production is an early priority, particularly in remote and isolated areas, to provide small farmers with the confidence in future food availability that is essential to investment in other activities. Local food stocks
XIOVERVIEW
can also help in this regard. Agroprocessing provides an important synergy between agriculture and non-farm activities, as agricultural upgrading and diversification create new opportunities, while processing increases product life and tradability. It is particularly beneficial in generating employment and business opportunities for women. With appropriate incentives, export crops can create opportunities for increased agricultural incomes and agroprocessing through integration into global and regional value chains.
Gender-specific measures are required to tackle the causes of disadvantages faced by rural women, particularly land and inheritance rights and time poverty. Gender sensitivity is essential in resolving land rights issues, to avoid further marginalization of women. Gender inequality in access to finance can generally be addressed most satisfactorily by mainstreaming gender into core programmes and policies, although gender-specific interventions may be needed in specific contexts.
The unrealized potential for a virtuous circle of agricultural upgrading and rural diversification highlights the need for demand- and supply-side mechanisms to kick-start the process of rural economic transformation. On the demand side, the need for a major increase in infrastructure investment can provide such a mechanism through the use of labour-based construction and maintenance methods and local procurement of materials and other inputs. Rural electrification can provide a similar boost on the supply side, but needs to be supported by appropriate policies and interventions in finance, access to technology and enterprise support.
Sequencing infrastructure investments and interventions is critical. This Report envisages three phases of rural economic transformation. In the first phase, the primary focus is on investments and interventions that promote effective supply response (enterprise promotion, training, finance and access to inputs), paving the way for the second phase, in which the emphasis is on demand-creating infrastructure investment, local connections within rural economies and increasing supply capacity. The combined effect should create the capacity for local producers to exploit economies of scale and withstand competition from urban producers in the third phase, where rural-urban connections are improved.
The demand created by agricultural upgrading and rising rural incomes is a critical driver of rural transformation, but requires an effective supply response. This calls for appropriate policies and interventions in finance, human resources and enterprise support.
The limitations of microfinance in the context of rural economic transformation and poverty eradication suggest a need for selectivity (focusing on dynamic “entrepreneurs by choice” and small and medium-sized enterprises, while avoiding its use in non-commercialized areas) as well as for modifications and alternatives. Conditional interest subsidies of microcredit (with ceilings on interest rates to borrowers) may provide a useful mechanism, while annual in-kind microgrants of productive inputs (phased out over an extended period) may be necessary to provide access to finance, productive technologies and associated inputs in remote and isolated areas.
While increasing schooling of children has major long-term benefits, adult education is critical to rural economic transformation in the shorter term. Male biases in education make adult education for women especially important. Particular priorities are basic literacy and numeracy, vocational skills, financial literacy and business skills. Financial literacy and business skills are critical where productive investment is financed by credit and in areas where production is predominantly subsistence-oriented; but basic numeracy and literacy will be a precondition in many contexts. Progressively higher levels of business skills will be needed as the transformation process advances.
Vocational training should reflect the priority sectors in each local context, and construction-related skills (and electricians and mechanics) will be a particular priority in the initial phase of rural transformation. By employing local workers in skilled positions and providing follow-up training on the application of the skills acquired in longer-term activities, infrastructure investment can provide an additional human-resource legacy. The benefits of vocational training can be enhanced by encouraging or requiring beneficiaries to take on apprentices; and migrants may provide a useful means of urban-rural skills transfer.
Long lead times in investment in agriculture, in new non-farm activities, and in areas where access to inputs is limited make information about anticipated changes in demand essential to an effective supply response. This is particularly important, since the risk aversion inherently associated with poverty makes a high level of confidence a prerequisite for diversion of efforts or resources to new activities. In principle, household expenditure surveys can provide a basis for estimating local demand changes as incomes rise; and providing such information (and information on other prospective market changes, e.g. those arising from transport infrastructure improvements) as a public good could substantially improve supply response and business viability.

The Least Developed Countries Report 2015XII
Where cell phone coverage exists, it can provide an invaluable means of targeted information provision; but issues of limited coverage, access, literacy and affordability mean that older technologies such as radio still have an important role as a means of wider communication.
Rural economic transformation requires effective policy coordination; but responsibility is generally spread across multiple ministries and agencies. An effective interministerial coordinating mechanism, chaired by the head of Government or someone at the highest level of government, could contribute substantially to this goal.
Decentralization is also critical, but often constrained by financial and human resources; and areas remote from markets are also remote from public institutions, limiting policy effectiveness and the potential for effective action at the local level. In this context, cooperatives, producers’ associations and women’s networks can play a key role, including in access to finance, inputs, equipment, new technologies, training, information, markets, etc., as well as strengthening small producers’ bargaining power and economies of scale. They could also provide an organized constituency for rural development. Streamlining procedures for the establishment of such organizations and networks, facilitating their development, and channelling interventions through them (with appropriate support) can thus make a major contribution to rural transformation.
The international dimension
Rural economic transformation on a scale sufficient to eradicate poverty in LDCs by 2030 is an immensely ambitious undertaking, which will require changes at the international level. In particular, given the severe financial constraints of most LDCs, it will necessitate a considerable increase in official development assistance (ODA). However, in adopting the SDGs, the international community has effectively committed itself to delivering the means necessary to their achievement: It is a long-established philosophical principle that “to will the end is to will the means”.
In the context of the SDGs, there is a strong case for increasing the target level of ODA from 0.15–0.20 per cent of donor gross national income to 0.35 per cent — half of the overall ODA target of 0.7 per cent to which donors are committed under SDG 17 (“Strengthen the means of implementation and revitalize the global partnership for sustainable development”). This would be commensurate with the LDCs’ share in the human development deficits addressed by the SDGs, and with the increase in the rate of extension of access to rural infrastructure required to achieve them. It would lead to an increase in ODA to LDCs from $30 billion in 2013 to around $250 billion by 2030, while also allowing a major rise in ODA to ODCs, provided the 0.7-per-cent commitment was fulfilled. Realizing the SDG undertaking to fulfil existing commitments on aid quality is also important, particularly with respect to recipient country ownership and policy space. This means ensuring that ODA conditionalities provide the policy flexibility needed to enable recipient countries to pursue nationally appropriate strategies and opportunities for learning and experimentation. It is equally important that productive sectors are given appropriate priority in allocation of additional ODA, especially in rural areas. The ultimate objective of ODA should be to support the development of productive capacities in LDCs and of their capacity for domestic resource mobilization, progressively reducing their need for ODA.
Since the benefits to LDCs of further multilateral tariff reductions are offset by the resulting erosion of existing preferences, fulfilling commitments on duty-free, quota-free market access and improving the terms of preferential agreements (particularly regarding rules of origin) are a primary consideration. Developmental regionalism could also provide a means of strengthening regional industrial bases, particularly among African LDCs, where limited intraregional trade in agricultural produce signals significant unrealized potential.
Beyond the trading system itself, developing a “sustainable development” brand linked to the SDGs that builds on existing fair trade and sustainability labelling initiatives, could provide substantial benefits in terms of marketing and product differentiation. Innovative approaches to cross-border investment could also offer a means of financing rural transformation and infrastructure, for example through the development of proactively ethical investment instruments and mechanisms for diaspora direct investment. These two mechanisms could be linked to harness their synergies.
Dr. Mukhisa Kituyi
Secretary-General of UNCTAD

INTRODUCTION
Recent economic tRends and outlook foR the ldcs
The Least Developed Countries Report 20152
A. Introduction
Economic growth in the least developed countries (LDCs) has slowed since 2012, when impressive performance by fuel-exporting countries took the growth rate of their real gross domestic product (GDP) to a post-financial crisis peak of 7.2 per cent. In 2014, less favourable external conditions (compounded by the impact of the Ebola outbreak in Guinea, Liberia and Sierra Leone) contributed to a further deterioration in their economic performance.
The merchandise trade deficit of LDCs as a whole nearly tripled to $33.6 billion in 2014, bringing their current account deficit to a historical high of $49.4 billion, which reflected continued import growth as exports stagnated. LDCs also remained heavily dependent on foreign resources, the largest source of which was official development assistance (ODA), followed by migrants’ remittances.
This chapter summarizes LDCs’ recent performance in terms of economic growth (section B), foreign trade and current account balances (section C), and domestic and external financing (section D). Section E concludes with a brief review of the outlook for LDCs. Country-level data are presented in an accompanying online statistical publication.1
B. The real sector
The average growth rate of LDCs as a group was 5.5 per cent in 2014. This represented a decline from 6.1 per cent in 2013 and was well below the 2002–2008 average of 7.4 per cent (table I.1), but significantly stronger than the 4.4-per-cent growth recorded by other developing countries (ODCs).
Economic growth in 2014 was very similar across LDC geographical and structural groupings,2 and in all cases above the ODC average: 5.5 per cent in African LDCs and Haiti, 5.4 per cent in Asian LDCs and 5.2 per cent in island LDCs. However, only Asian LDCs achieved faster growth than ODCs in per capita terms, suggesting a more moderate improvement in living standards in African LDCs and Haiti and in island LDCs.
LDCs’ relatively steady growth performance in 2014 is indicative of stronger GDP growth in mineral exporters (6.8 per cent) and mixed exporters (6.5 per cent),3 while the slowest growth rates were the 3.3 per cent recorded by fuel exporters — previously the main drivers of LDC growth — and the 4.8 per cent for exporters of food and agricultural products. The favourable performance of mineral exporters reflects a remarkable 9.1-per-cent growth in the Democratic Republic of the Congo (as a result of strong growth in copper output) and 7.4 per cent in Mozambique (due to a robust expansion of natural gas and coal production). Conversely, fuel exporters (Angola, Chad, Equatorial Guinea, Sudan and Yemen) were adversely affected by a sharp fall in oil prices in the second half of 2014. Worst affected were Equatorial Guinea and Yemen, where production also fell, leading to contractions of 3.1 per cent and 0.2 per cent, respectively.
C. Current account and international trade
1. Current aCCount balanCe
The LDCs’ collective current account deficit increased to a record level of $49.4 billion in 2014 (chart I.1), 40 per cent higher than in 2013 and 87 per
The average growth rate of LDCs in 2014 was significantly stronger than that of other developing countries
(ODCs)...
... but only Asian LDCs achieved faster growth than ODCs in
per capita terms.
GDP growth was strongest in mineral exporters and mixed
exporters, while the slowest growth rates were the 3.3 per cent recorded
by fuel exporters.
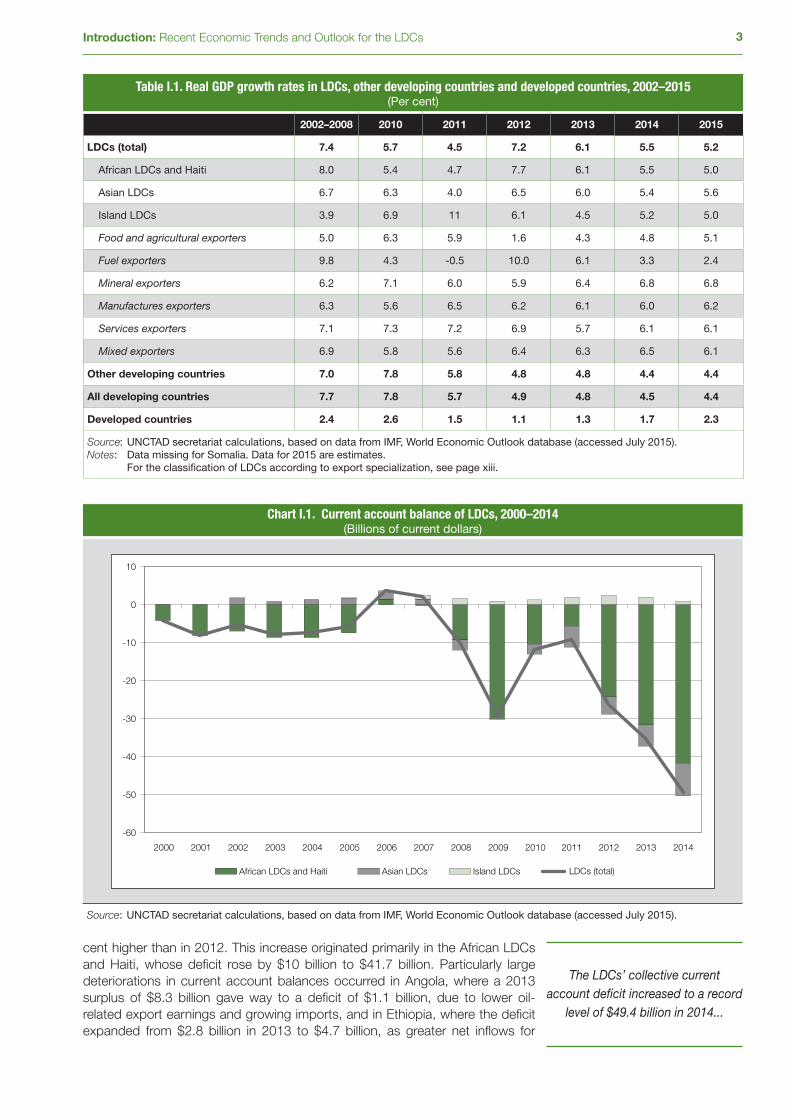
3Introduction: Recent Economic Trends and Outlook for the LDCs
Table I.1. Real GDP growth rates in LDCs, other developing countries and developed countries, 2002–2015(Per cent)
2002–2008 2010 2011 2012 2013 2014 2015
LDCs (total) 7.4 5.7 4.5 7.2 6.1 5.5 5.2
African LDCs and Haiti 8.0 5.4 4.7 7.7 6.1 5.5 5.0
Asian LDCs 6.7 6.3 4.0 6.5 6.0 5.4 5.6
Island LDCs 3.9 6.9 11 6.1 4.5 5.2 5.0
Food and agricultural exporters 5.0 6.3 5.9 1.6 4.3 4.8 5.1
Fuel exporters 9.8 4.3 -0.5 10.0 6.1 3.3 2.4
Mineral exporters 6.2 7.1 6.0 5.9 6.4 6.8 6.8
Manufactures exporters 6.3 5.6 6.5 6.2 6.1 6.0 6.2
Services exporters 7.1 7.3 7.2 6.9 5.7 6.1 6.1
Mixed exporters 6.9 5.8 5.6 6.4 6.3 6.5 6.1
Other developing countries 7.0 7.8 5.8 4.8 4.8 4.4 4.4
All developing countries 7.7 7.8 5.7 4.9 4.8 4.5 4.4
Developed countries 2.4 2.6 1.5 1.1 1.3 1.7 2.3
Source: UNCTAD secretariat calculations, based on data from IMF, World Economic Outlook database (accessed July 2015).Notes: Data missing for Somalia. Data for 2015 are estimates. For the classification of LDCs according to export specialization, see page xiii.
Chart I.1. Current account balance of LDCs, 2000–2014(Billions of current dollars)
-60
-50
-40
-30
-20
-10
0
10
2000 2001 2002 2003 2004 2005 2006 2007 2008 2009 2010 2011 2012 2013 2014
African LDCs and Haiti Asian LDCs Island LDCs LDCs (total)
Source: UNCTAD secretariat calculations, based on data from IMF, World Economic Outlook database (accessed July 2015).
cent higher than in 2012. This increase originated primarily in the African LDCs and Haiti, whose deficit rose by $10 billion to $41.7 billion. Particularly large deteriorations in current account balances occurred in Angola, where a 2013 surplus of $8.3 billion gave way to a deficit of $1.1 billion, due to lower oil-related export earnings and growing imports, and in Ethiopia, where the deficit expanded from $2.8 billion in 2013 to $4.7 billion, as greater net inflows for
The LDCs’ collective current account deficit increased to a record
level of $49.4 billion in 2014...
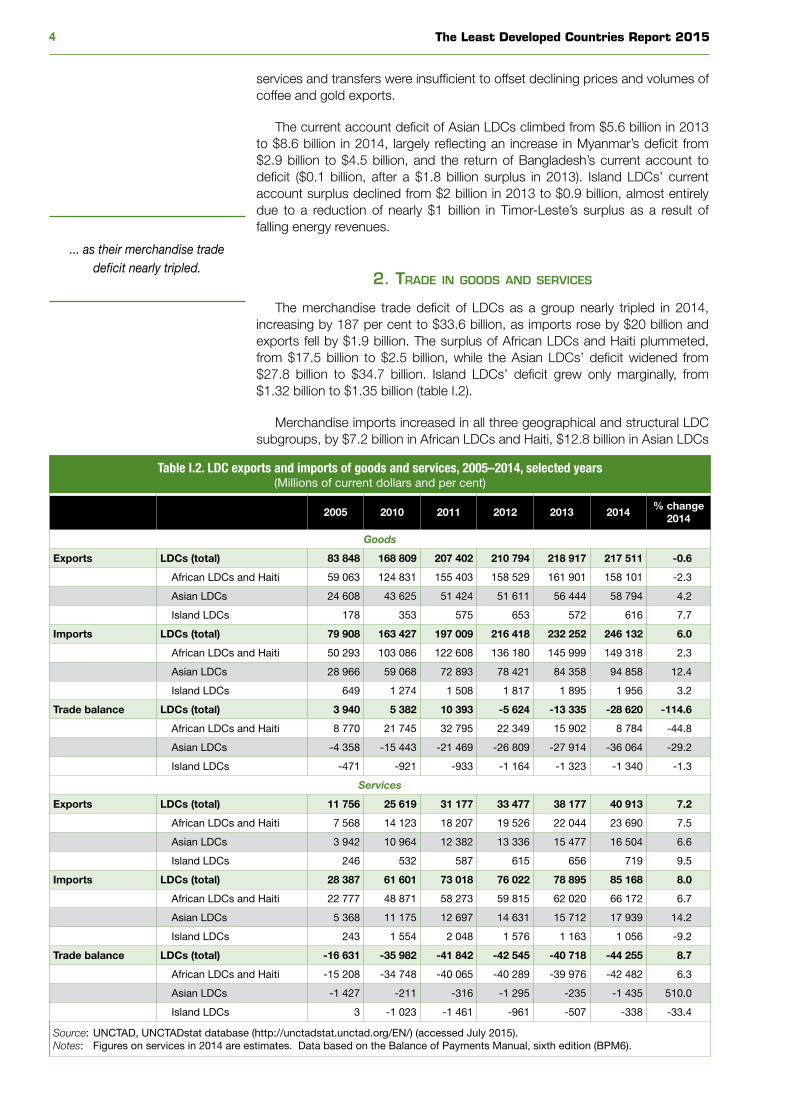
The Least Developed Countries Report 20154
services and transfers were insufficient to offset declining prices and volumes of coffee and gold exports.
The current account deficit of Asian LDCs climbed from $5.6 billion in 2013 to $8.6 billion in 2014, largely reflecting an increase in Myanmar’s deficit from $2.9 billion to $4.5 billion, and the return of Bangladesh’s current account to deficit ($0.1 billion, after a $1.8 billion surplus in 2013). Island LDCs’ current account surplus declined from $2 billion in 2013 to $0.9 billion, almost entirely due to a reduction of nearly $1 billion in Timor-Leste’s surplus as a result of falling energy revenues.
2. trade in goods and serviCes
The merchandise trade deficit of LDCs as a group nearly tripled in 2014, increasing by 187 per cent to $33.6 billion, as imports rose by $20 billion and exports fell by $1.9 billion. The surplus of African LDCs and Haiti plummeted, from $17.5 billion to $2.5 billion, while the Asian LDCs’ deficit widened from $27.8 billion to $34.7 billion. Island LDCs’ deficit grew only marginally, from $1.32 billion to $1.35 billion (table I.2).
Merchandise imports increased in all three geographical and structural LDC subgroups, by $7.2 billion in African LDCs and Haiti, $12.8 billion in Asian LDCs
Table I.2. LDC exports and imports of goods and services, 2005–2014, selected years(Millions of current dollars and per cent)
2005 2010 2011 2012 2013 2014% change
2014
Goods
Exports LDCs (total) 83 848 168 809 207 402 210 794 218 917 217 511 -0.6
African LDCs and Haiti 59 063 124 831 155 403 158 529 161 901 158 101 -2.3
Asian LDCs 24 608 43 625 51 424 51 611 56 444 58 794 4.2
Island LDCs 178 353 575 653 572 616 7.7
Imports LDCs (total) 79 908 163 427 197 009 216 418 232 252 246 132 6.0
African LDCs and Haiti 50 293 103 086 122 608 136 180 145 999 149 318 2.3
Asian LDCs 28 966 59 068 72 893 78 421 84 358 94 858 12.4
Island LDCs 649 1 274 1 508 1 817 1 895 1 956 3.2
Trade balance LDCs (total) 3 940 5 382 10 393 -5 624 -13 335 -28 620 -114.6
African LDCs and Haiti 8 770 21 745 32 795 22 349 15 902 8 784 -44.8
Asian LDCs -4 358 -15 443 -21 469 -26 809 -27 914 -36 064 -29.2
Island LDCs -471 -921 -933 -1 164 -1 323 -1 340 -1.3
Services
Exports LDCs (total) 11 756 25 619 31 177 33 477 38 177 40 913 7.2
African LDCs and Haiti 7 568 14 123 18 207 19 526 22 044 23 690 7.5
Asian LDCs 3 942 10 964 12 382 13 336 15 477 16 504 6.6
Island LDCs 246 532 587 615 656 719 9.5
Imports LDCs (total) 28 387 61 601 73 018 76 022 78 895 85 168 8.0
African LDCs and Haiti 22 777 48 871 58 273 59 815 62 020 66 172 6.7
Asian LDCs 5 368 11 175 12 697 14 631 15 712 17 939 14.2
Island LDCs 243 1 554 2 048 1 576 1 163 1 056 -9.2
Trade balance LDCs (total) -16 631 -35 982 -41 842 -42 545 -40 718 -44 255 8.7
African LDCs and Haiti -15 208 -34 748 -40 065 -40 289 -39 976 -42 482 6.3
Asian LDCs -1 427 -211 -316 -1 295 -235 -1 435 510.0
Island LDCs 3 -1 023 -1 461 -961 -507 -338 -33.4
Source: UNCTAD, UNCTADstat database (http://unctadstat.unctad.org/EN/) (accessed July 2015).Notes: Figures on services in 2014 are estimates. Data based on the Balance of Payments Manual, sixth edition (BPM6).
... as their merchandise trade deficit nearly tripled.
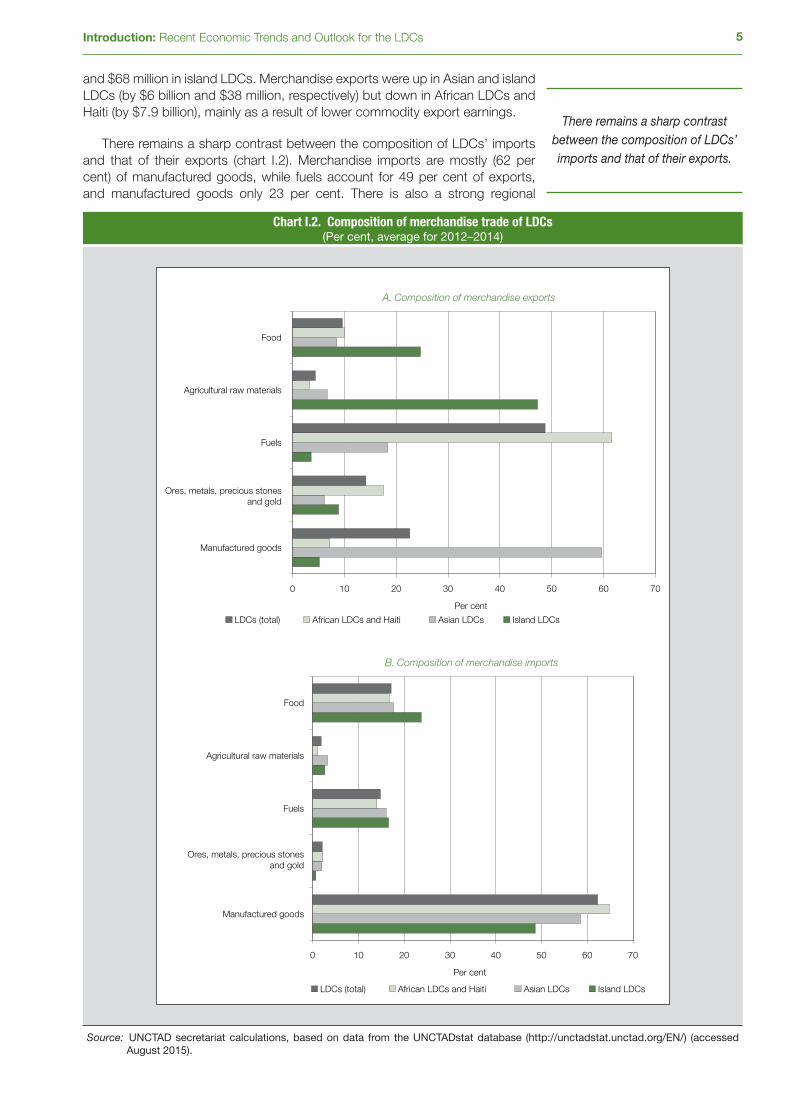
5Introduction: Recent Economic Trends and Outlook for the LDCs
and $68 million in island LDCs. Merchandise exports were up in Asian and island LDCs (by $6 billion and $38 million, respectively) but down in African LDCs and Haiti (by $7.9 billion), mainly as a result of lower commodity export earnings.
There remains a sharp contrast between the composition of LDCs’ imports and that of their exports (chart I.2). Merchandise imports are mostly (62 per cent) of manufactured goods, while fuels account for 49 per cent of exports, and manufactured goods only 23 per cent. There is also a strong regional
Chart I.2. Composition of merchandise trade of LDCs(Per cent, average for 2012–2014)
Composition of merchandise exports
0 10 20 30 40 50 60 70
Manufactured goods
Ores, metals, precious stonesand gold
Fuels
Agricultural raw materials
Food
Per cent
LDCs (total) African LDCs and Haiti Asian LDCs Island LDCs
Composition of merchandise imports
0 10 20 30 40 50 60 70
Manufactured goods
Ores, metals, precious stonesand gold
Fuels
Agricultural raw materials
Food
Per cent
LDCs (total) African LDCs and Haiti Asian LDCs Island LDCs
A.
B.
Source: UNCTAD secretariat calculations, based on data from the UNCTADstat database (http://unctadstat.unctad.org/EN/) (accessed August 2015).
There remains a sharp contrast between the composition of LDCs’ imports and that of their exports.

The Least Developed Countries Report 20156
pattern. In African LDCs and Haiti, fuels represent 62 per cent of merchandise exports; in Asian LDCs a similar share (60 per cent) is of manufactured goods. Among island LDCs, the largest category of merchandise exports is agricultural raw materials, which make up 48 per cent of the total. The heavy dependence of most LDCs on primary commodity exports renders them very vulnerable to fluctuations in commodity prices (box I.1).
Box I.1. Recent trends in international commodity prices
LDCs' dependence on commodity exports is a central factor in their slower economic growth in 2014, and weighs heavily on their economic outlook: The recent dynamics of international commodity prices have had a major impact on their export earnings. All commodity price indices declined from January 2012 to May 2015, to levels similar to those of the 2009 crisis year (box chart I.1), as a result of weakening demand, increasing supplies (following overinvestment during the period of high prices), a stronger dollar and unusually large harvests (World Bank, 2015). Downward pressure on oil prices was accentuated by a decrease in imports by the United States, coupled with increasing supply and major producers' decision not to curb their production.
Between January 2012 and May 2015, crude petroleum prices fell by 46 per cent, agricultural raw materials and mineral ores and metals by 26 per cent, and food products by 24 per cent. Among major LDC commodity exports, cotton prices dropped by 19 per cent, iron ore by 56 per cent, and gold, copper and aluminium by 28 per cent, 22 per cent and 10 per cent, respectively. Prices of food products such as sugar, rice and wheat declined by between a quarter and a third.
Box chart I.1. Commodity prices, 2000–2015(Indices, 2000 = 100)
0
50
100
150
200
250
300
350
400
450
2000 2001 2002 2003 2004 2005 2006 2007 2008 2009 2010 2011 2012 2013 2014 2015*
All food Agricultural raw material Mineral ores and metals Crude petroleum
Source: UNCTAD, Commodity Price Bulletin. Crude petroleum: average of United Kingdom Brent (light) / Dubai (medium) / Texas (heavy), equally weighted (dollar/barrel).
Note: *January–August.
D. Resource mobilization
1. Domestic resource mobilization
Across LDCs as a whole, gross fixed capital formation (GFCF) increased to 26.3 per cent of GDP in 2013 (table I.3). This is not only higher than both the 2012 level and the 2002–2008 average, but also, more importantly, above the 25-per-cent level deemed necessary to sustain long-term growth. This threshold was exceeded by both African LDCs and Haiti (25.5 per cent) and Asian LDCs
The heavy dependence of most LDCs on primary commodity exports
renders them very vulnerable to fluctuations in commodity prices.
Across LDCs as a whole, gross fixed capital formation (GFCF) increased
to a level higher than the level deemed necessary to sustain
long-term growth.
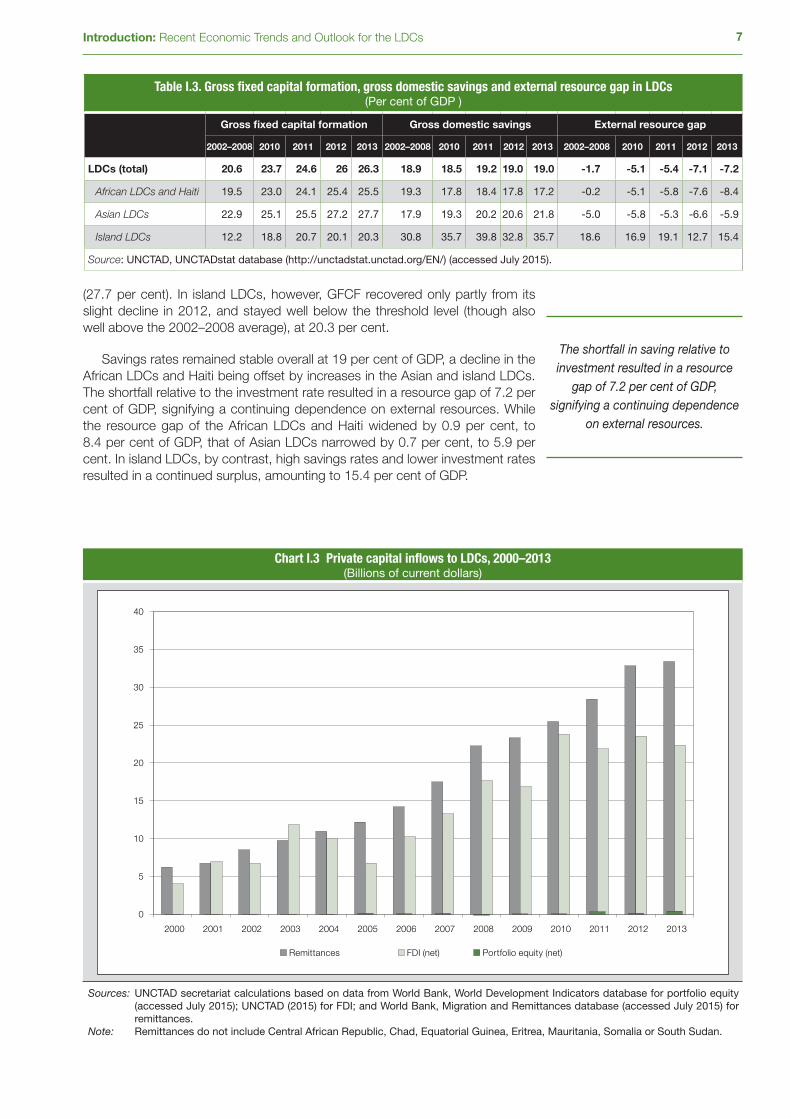
7Introduction: Recent Economic Trends and Outlook for the LDCs
(27.7 per cent). In island LDCs, however, GFCF recovered only partly from its slight decline in 2012, and stayed well below the threshold level (though also well above the 2002–2008 average), at 20.3 per cent.
Savings rates remained stable overall at 19 per cent of GDP, a decline in the African LDCs and Haiti being offset by increases in the Asian and island LDCs. The shortfall relative to the investment rate resulted in a resource gap of 7.2 per cent of GDP, signifying a continuing dependence on external resources. While the resource gap of the African LDCs and Haiti widened by 0.9 per cent, to 8.4 per cent of GDP, that of Asian LDCs narrowed by 0.7 per cent, to 5.9 per cent. In island LDCs, by contrast, high savings rates and lower investment rates resulted in a continued surplus, amounting to 15.4 per cent of GDP.
Table I.3. Gross fixed capital formation, gross domestic savings and external resource gap in LDCs(Per cent of GDP )
Gross fixed capital formation Gross domestic savings External resource gap
2002–2008 2010 2011 2012 2013 2002–2008 2010 2011 2012 2013 2002–2008 2010 2011 2012 2013
LDCs (total) 20.6 23.7 24.6 26 26.3 18.9 18.5 19.2 19.0 19.0 -1.7 -5.1 -5.4 -7.1 -7.2
African LDCs and Haiti 19.5 23.0 24.1 25.4 25.5 19.3 17.8 18.4 17.8 17.2 -0.2 -5.1 -5.8 -7.6 -8.4
Asian LDCs 22.9 25.1 25.5 27.2 27.7 17.9 19.3 20.2 20.6 21.8 -5.0 -5.8 -5.3 -6.6 -5.9
Island LDCs 12.2 18.8 20.7 20.1 20.3 30.8 35.7 39.8 32.8 35.7 18.6 16.9 19.1 12.7 15.4
Source: UNCTAD, UNCTADstat database (http://unctadstat.unctad.org/EN/) (accessed July 2015).
Chart I.3 Private capital inflows to LDCs, 2000–2013(Billions of current dollars)
0
5
10
15
20
25
30
35
40
2000 2001 2002 2003 2004 2005 2006 2007 2008 2009 2010 2011 2012 2013
Remittances FDI (net) Portfolio equity (net)
Sources: UNCTAD secretariat calculations based on data from World Bank, World Development Indicators database for portfolio equity (accessed July 2015); UNCTAD (2015) for FDI; and World Bank, Migration and Remittances database (accessed July 2015) for remittances.
Note: Remittances do not include Central African Republic, Chad, Equatorial Guinea, Eritrea, Mauritania, Somalia or South Sudan.
The shortfall in saving relative to investment resulted in a resource
gap of 7.2 per cent of GDP, signifying a continuing dependence
on external resources.
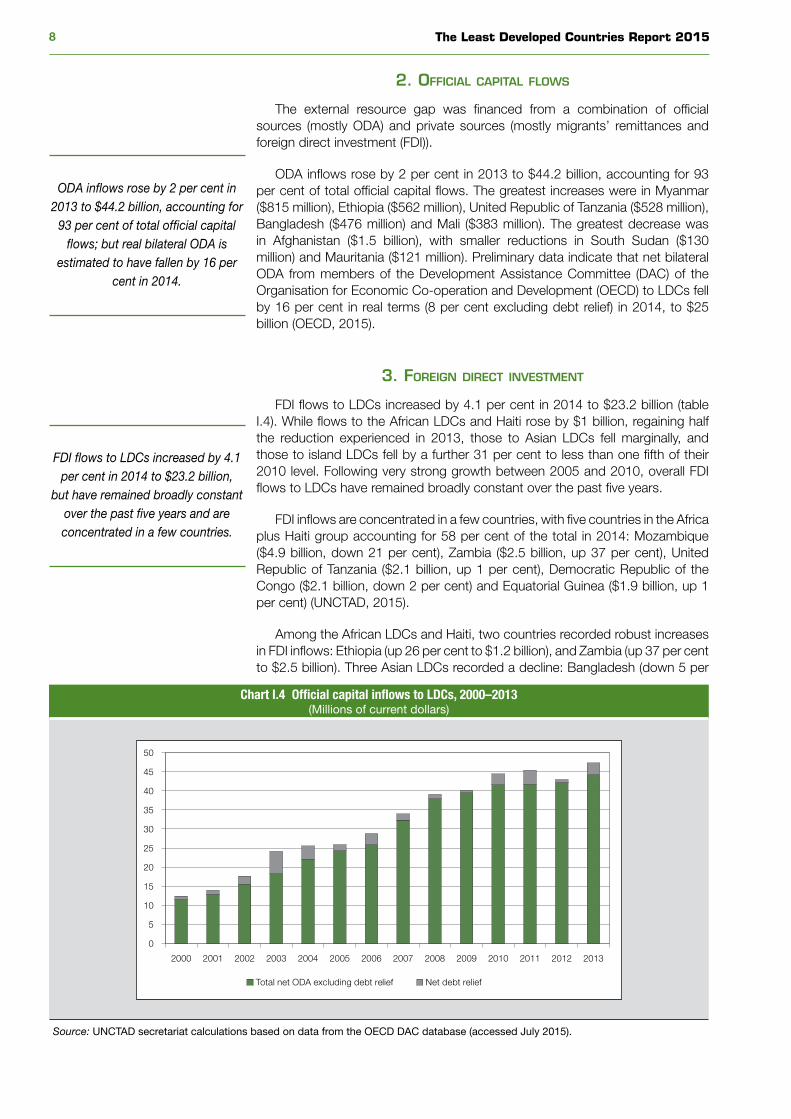
The Least Developed Countries Report 20158
2. offiCial Capital flows
The external resource gap was financed from a combination of official sources (mostly ODA) and private sources (mostly migrants’ remittances and foreign direct investment (FDI)).
ODA inflows rose by 2 per cent in 2013 to $44.2 billion, accounting for 93 per cent of total official capital flows. The greatest increases were in Myanmar ($815 million), Ethiopia ($562 million), United Republic of Tanzania ($528 million), Bangladesh ($476 million) and Mali ($383 million). The greatest decrease was in Afghanistan ($1.5 billion), with smaller reductions in South Sudan ($130 million) and Mauritania ($121 million). Preliminary data indicate that net bilateral ODA from members of the Development Assistance Committee (DAC) of the Organisation for Economic Co-operation and Development (OECD) to LDCs fell by 16 per cent in real terms (8 per cent excluding debt relief) in 2014, to $25 billion (OECD, 2015).
3. foreign direCt investment
FDI flows to LDCs increased by 4.1 per cent in 2014 to $23.2 billion (table I.4). While flows to the African LDCs and Haiti rose by $1 billion, regaining half the reduction experienced in 2013, those to Asian LDCs fell marginally, and those to island LDCs fell by a further 31 per cent to less than one fifth of their 2010 level. Following very strong growth between 2005 and 2010, overall FDI flows to LDCs have remained broadly constant over the past five years.
FDI inflows are concentrated in a few countries, with five countries in the Africa plus Haiti group accounting for 58 per cent of the total in 2014: Mozambique ($4.9 billion, down 21 per cent), Zambia ($2.5 billion, up 37 per cent), United Republic of Tanzania ($2.1 billion, up 1 per cent), Democratic Republic of the Congo ($2.1 billion, down 2 per cent) and Equatorial Guinea ($1.9 billion, up 1 per cent) (UNCTAD, 2015).
Among the African LDCs and Haiti, two countries recorded robust increases in FDI inflows: Ethiopia (up 26 per cent to $1.2 billion), and Zambia (up 37 per cent to $2.5 billion). Three Asian LDCs recorded a decline: Bangladesh (down 5 per
Chart I.4 Official capital inflows to LDCs, 2000–2013(Millions of current dollars)
0
5
10
15
20
25
30
35
40
45
50
2000 2001 2002 2003 2004 2005 2006 2007 2008 2009 2010 2011 2012 2013
Net debt relief
Source: UNCTAD secretariat calculations based on data from the OECD DAC database (accessed July 2015).
ODA inflows rose by 2 per cent in 2013 to $44.2 billion, accounting for
93 per cent of total official capital flows; but real bilateral ODA is
estimated to have fallen by 16 per cent in 2014.
FDI flows to LDCs increased by 4.1 per cent in 2014 to $23.2 billion,
but have remained broadly constant over the past five years and are concentrated in a few countries.
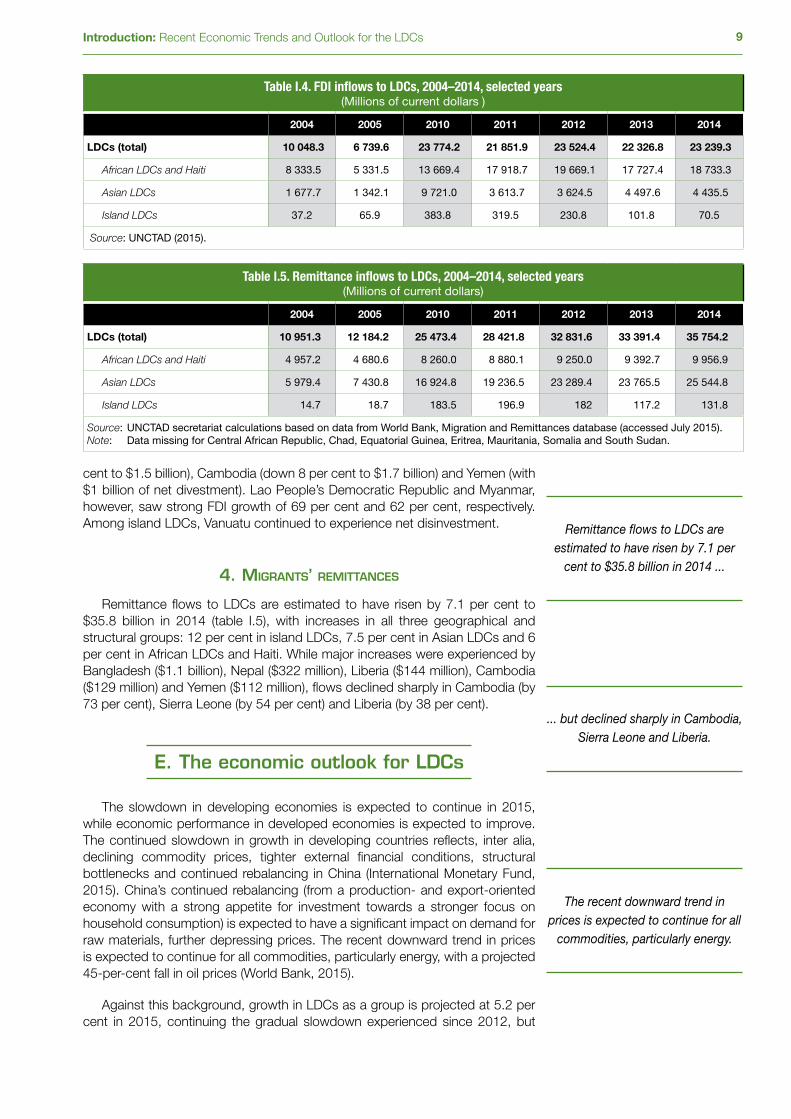
9Introduction: Recent Economic Trends and Outlook for the LDCs
cent to $1.5 billion), Cambodia (down 8 per cent to $1.7 billion) and Yemen (with $1 billion of net divestment). Lao People’s Democratic Republic and Myanmar, however, saw strong FDI growth of 69 per cent and 62 per cent, respectively. Among island LDCs, Vanuatu continued to experience net disinvestment.
4. migrants’ remittanCes
Remittance flows to LDCs are estimated to have risen by 7.1 per cent to $35.8 billion in 2014 (table I.5), with increases in all three geographical and structural groups: 12 per cent in island LDCs, 7.5 per cent in Asian LDCs and 6 per cent in African LDCs and Haiti. While major increases were experienced by Bangladesh ($1.1 billion), Nepal ($322 million), Liberia ($144 million), Cambodia ($129 million) and Yemen ($112 million), flows declined sharply in Cambodia (by 73 per cent), Sierra Leone (by 54 per cent) and Liberia (by 38 per cent).
E. The economic outlook for LDCs
The slowdown in developing economies is expected to continue in 2015, while economic performance in developed economies is expected to improve. The continued slowdown in growth in developing countries reflects, inter alia, declining commodity prices, tighter external financial conditions, structural bottlenecks and continued rebalancing in China (International Monetary Fund, 2015). China’s continued rebalancing (from a production- and export-oriented economy with a strong appetite for investment towards a stronger focus on household consumption) is expected to have a significant impact on demand for raw materials, further depressing prices. The recent downward trend in prices is expected to continue for all commodities, particularly energy, with a projected 45-per-cent fall in oil prices (World Bank, 2015).
Against this background, growth in LDCs as a group is projected at 5.2 per cent in 2015, continuing the gradual slowdown experienced since 2012, but
Table I.4. FDI inflows to LDCs, 2004–2014, selected years(Millions of current dollars )
2004 2005 2010 2011 2012 2013 2014
LDCs (total) 10 048.3 6 739.6 23 774.2 21 851.9 23 524.4 22 326.8 23 239.3
African LDCs and Haiti 8 333.5 5 331.5 13 669.4 17 918.7 19 669.1 17 727.4 18 733.3
Asian LDCs 1 677.7 1 342.1 9 721.0 3 613.7 3 624.5 4 497.6 4 435.5
Island LDCs 37.2 65.9 383.8 319.5 230.8 101.8 70.5
Source: UNCTAD (2015).
Table I.5. Remittance inflows to LDCs, 2004–2014, selected years(Millions of current dollars)
2004 2005 2010 2011 2012 2013 2014
LDCs (total) 10 951.3 12 184.2 25 473.4 28 421.8 32 831.6 33 391.4 35 754.2
African LDCs and Haiti 4 957.2 4 680.6 8 260.0 8 880.1 9 250.0 9 392.7 9 956.9
Asian LDCs 5 979.4 7 430.8 16 924.8 19 236.5 23 289.4 23 765.5 25 544.8
Island LDCs 14.7 18.7 183.5 196.9 182 117.2 131.8
Source: UNCTAD secretariat calculations based on data from World Bank, Migration and Remittances database (accessed July 2015).Note: Data missing for Central African Republic, Chad, Equatorial Guinea, Eritrea, Mauritania, Somalia and South Sudan.
Remittance flows to LDCs are estimated to have risen by 7.1 per
cent to $35.8 billion in 2014 ...
... but declined sharply in Cambodia, Sierra Leone and Liberia.
The recent downward trend in prices is expected to continue for all
commodities, particularly energy.
The Least Developed Countries Report 201510
remaining above the projected rate for developing countries as a whole (4.4 per cent). Despite lower commodity prices, however, extractive industries in LDCs are expected to continue to attract foreign investment, with continued investment also in manufacturing and services. The expected 15-year extension of the African Growth and Opportunity Act (AGOA) may contribute to a diversification of the FDI flows in Africa, though not in the short term. Among Asian LDCs, announced greenfield investments in various sectors led by a Myanmar-Japanese joint venture are expected to contribute to a further increase in FDI flows to Myanmar (UNCTAD, 2015).
Notes
1 Available at: unctad.org/LDCs/statistics.2 The classification according to geographical/structural criteria is presented on p. xiii.3 The classification of LDCs according to export specialization is presented on p. xiii.
References
International Monetary Fund (2015). World Economic Outlook Update (July). Washington, D.C. OECD (2015). Development aid stable in 2014 but flows to poorest countries still falling.
Paris, 8 April (accessed 28 July 2015). Available from http://www.oecd.org/dac/stats/development-aid-stable-in-2014-but-flows-to-poorest-countries-still-falling.htm.
UNCTAD (2015). World Investment Report 2015: Reforming International Investment Governance. United Nations publication. Sales No. E.15.II.D.5. New York and Geneva.
World Bank (2015). Commodity Markets Outlook (April). Washington, D.C.
Extractive industries in LDCs are expected to continue to attract
foreign investment.

1CHAPTER
the 2030 agenda foR sustainable development
and the RuRal development impeRative

The Least Developed Countries Report 201512
A. The significance and implications of the 2030 Agenda for Sustainable
Development for LDCs
The year 2015 marks the transition from the Millennium Development Goals (MDGs) to the much broader 2030 Agenda for Sustainable Development1 and the much more ambitious Sustainable Development Goals (SDGs) (box 1.1). This represents a paradigm shift in the development agenda. The SDGs, for the first time, establish a collectively agreed set of universal goals for an inclusive and sustainable global development process. They also represent a step change in ambition, seeking not merely to reduce poverty in all its dimensions, but to eradicate it within just 15 years. Achieving this will require a new and different approach to development, and nowhere more so than in the least developed countries (LDCs).
Clearly, the SDGs are not the only reason for concern about poverty and human development. Poverty eradication, better health, education and access to basic services are of intrinsic importance. Indeed, they are the motivation for economic development. However, the SDGs reflect two fundamental changes:
• They represent an acceptance of collective responsibility for fulfilment of social and economic rights among the world population by the global community as a whole.
• They specify exact parameters for what constitutes fulfilment of economic and social rights, and a date (2030) by which this should be done.
The absolute nature of the SDGs also has critical implications for global and national approaches to development. First, it requires an enormous acceleration in the rate of progress. For example, poverty eradication means increasing the
Box 1.1. The Sustainable Development Goals
Goal 1 End poverty in all its forms everywhere
Goal 2 End hunger, achieve food security and improved nutrition and promote sustainable agriculture
Goal 3 Ensure healthy lives and promote well-being for all at all ages
Goal 4 Ensure inclusive and equitable quality education and promote lifelong learning opportunities for all
Goal 5 Achieve gender equality and empower all women and girls
Goal 6 Ensure availability and sustainable management of water and sanitation for all
Goal 7 Ensure access to affordable, reliable, sustainable and modern energy for all
Goal 8 Promote sustained, inclusive and sustainable economic growth, full and productive employment and decent work for all
Goal 9 Build resilient infrastructure, promote inclusive and sustainable industrialization and foster innovation
Goal 10 Reduce inequality within and among countries
Goal 11 Make cities and human settlements inclusive, safe, resilient and sustainable
Goal 12 Ensure sustainable consumption and production patterns
Goal 13 Take urgent action to combat climate change and its impacts
Goal 14 Conserve and sustainably use the oceans, seas and marine resources for sustainable development
Goal 15 Protect, restore and promote sustainable use of terrestrial ecosystems, sustainably manage forests, combat desertification, and halt and reverse land degradation and halt biodiversity loss
Goal 16 Promote peaceful and inclusive societies for sustainable development, provide access to justice for all and build effective, accountable and inclusive institutions at all levels
Goal 17 Strengthen the means of implementation and revitalize the global partnership for sustainable development
The 2030 Agenda for Sustainable Development represents a paradigm
shift in the development agenda.
The SDGs represent an acceptance by the global community of
collective responsibility for fulfilment of social and economic rights.
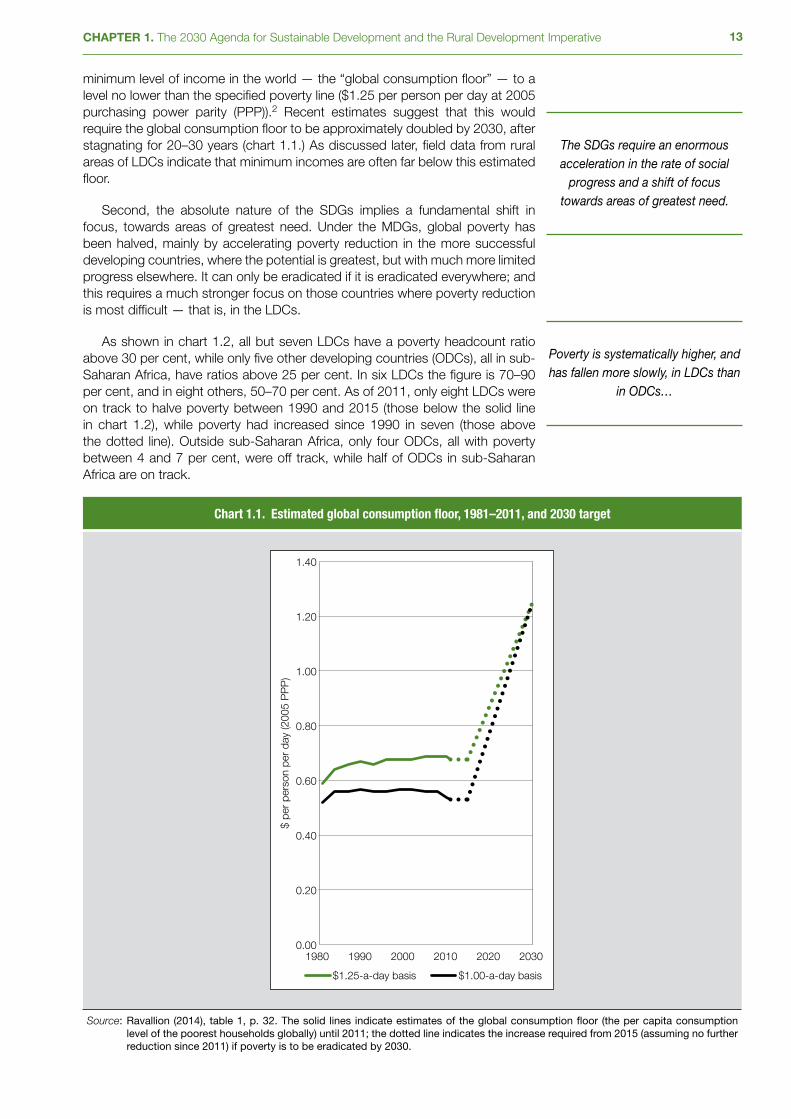
13CHAPTER 1. The 2030 Agenda for Sustainable Development and the Rural Development Imperative
minimum level of income in the world — the “global consumption floor” — to a level no lower than the specified poverty line ($1.25 per person per day at 2005 purchasing power parity (PPP)).2 Recent estimates suggest that this would require the global consumption floor to be approximately doubled by 2030, after stagnating for 20–30 years (chart 1.1.) As discussed later, field data from rural areas of LDCs indicate that minimum incomes are often far below this estimated floor.
Second, the absolute nature of the SDGs implies a fundamental shift in focus, towards areas of greatest need. Under the MDGs, global poverty has been halved, mainly by accelerating poverty reduction in the more successful developing countries, where the potential is greatest, but with much more limited progress elsewhere. It can only be eradicated if it is eradicated everywhere; and this requires a much stronger focus on those countries where poverty reduction is most difficult — that is, in the LDCs.
As shown in chart 1.2, all but seven LDCs have a poverty headcount ratio above 30 per cent, while only five other developing countries (ODCs), all in sub-Saharan Africa, have ratios above 25 per cent. In six LDCs the figure is 70–90 per cent, and in eight others, 50–70 per cent. As of 2011, only eight LDCs were on track to halve poverty between 1990 and 2015 (those below the solid line in chart 1.2), while poverty had increased since 1990 in seven (those above the dotted line). Outside sub-Saharan Africa, only four ODCs, all with poverty between 4 and 7 per cent, were off track, while half of ODCs in sub-Saharan Africa are on track.
Chart 1.1. Estimated global consumption floor, 1981–2011, and 2030 target
0.00
0.20
0.40
0.60
0.80
1.00
1.20
1.40
1980 1990 2000 2010 2020 2030
$ pe
r pe
rson
per
day
(200
5 P
PP
)
$1.25-a-day basis $1.00-a-day basis
Source: Ravallion (2014), table 1, p. 32. The solid lines indicate estimates of the global consumption floor (the per capita consumption level of the poorest households globally) until 2011; the dotted line indicates the increase required from 2015 (assuming no further reduction since 2011) if poverty is to be eradicated by 2030.
The SDGs require an enormous acceleration in the rate of social
progress and a shift of focus towards areas of greatest need.
Poverty is systematically higher, and has fallen more slowly, in LDCs than
in ODCs…

The Least Developed Countries Report 201514
Not only is poverty systematically higher in LDCs, and falling more slowly, but the means available to them are also much more limited. As shown in chart 1.3, both the poverty gap3 and infrastructure shortfalls in almost all LDCs are much higher than in nearly all ODCs relative to gross domestic product (GDP). In only seven of 54 ODCs for which data are available (all but one in sub-Saharan Africa) is the poverty gap greater than 1 per cent of GDP or is there more than one person per $1,000 GDP without access to water, electricity or sanitation; in two thirds, both indicators are less than one fifth of this level. Among LDCs, only Bhutan and Djibouti fall within this range. At the other end of the scale, four LDCs have both a poverty gap greater than 20 per cent of GDP and more than four people per $1,000 GDP without access to water, electricity or sanitation. In many LDCs, limited administrative capacity, transport logistics, geographical challenges and/or conflict represent additional serious obstacles.
Thus the LDCs are, quite simply, the battleground on which the 2030 Agenda will be won or lost: Their performance will very largely determine whether the SDGs are met or missed. It is here that poverty is highest and falling most slowly, and where the obstacles to its eradication are greatest. Within LDCs, by the same logic, the key battleground will be the rural economy.
B. The importance of rural development and agriculture in LDCs
Rural development is of particular importance in LDCs, in part because of their predominantly rural populations. Two thirds of the total population of LDCs live in rural areas, and in only six (Djibouti, Gambia, Haiti, Mauritania, Sao Tome and Principe, and Tuvalu) is the proportion below 50 per cent. Even with continued rapid urbanization, and projected rural population growth slowing from 1.6 per cent per annum in 2010–2015 to 0.5 per cent per annum in 2045–2050 (UN/DESA, 2014), this pattern is unlikely to change substantially by 2030.
Chart 1.2. Poverty headcount ratio, 1990 and 2011(Per cent)
0
20
40
60
80
100
0 20 40 60 80 100
Pov
erty
hea
dcou
nt r
atio
, 201
1
Poverty headcount ratio, 1990
ODCs (SSA) ODCs (Other) African LDCs & Haiti Asian LDCs Island LDCs
Typical rangeof ODCs
Typical rangeof LDCs
Source: PovcalNet: the online tool for poverty measurement developed by the Development Research Group of the World Bank (http://iresearch.worldbank.org/PovcalNet/index.htm, accessed July 2015).
…and shortfalls from SDG standards are much greater relative to GDP.
Rural development is of particular importance in LDCs, partly because their populations are predominantly
rural…
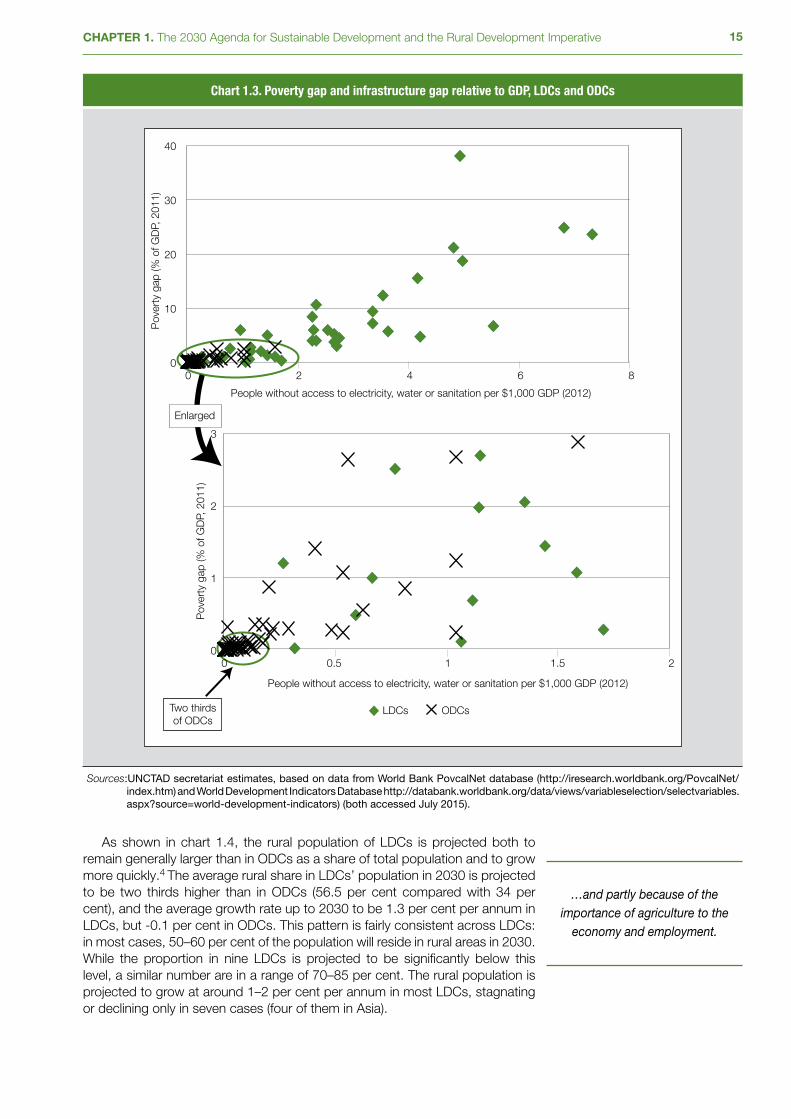
15CHAPTER 1. The 2030 Agenda for Sustainable Development and the Rural Development Imperative
As shown in chart 1.4, the rural population of LDCs is projected both to remain generally larger than in ODCs as a share of total population and to grow more quickly.4 The average rural share in LDCs’ population in 2030 is projected to be two thirds higher than in ODCs (56.5 per cent compared with 34 per cent), and the average growth rate up to 2030 to be 1.3 per cent per annum in LDCs, but -0.1 per cent in ODCs. This pattern is fairly consistent across LDCs: in most cases, 50–60 per cent of the population will reside in rural areas in 2030. While the proportion in nine LDCs is projected to be significantly below this level, a similar number are in a range of 70–85 per cent. The rural population is projected to grow at around 1–2 per cent per annum in most LDCs, stagnating or declining only in seven cases (four of them in Asia).
Chart 1.3. Poverty gap and infrastructure gap relative to GDP, LDCs and ODCs
0
10
20
30
40
0 2 4 6 8
Pov
erty
gap
(% o
f GD
P, 2
011)
People without access to electricity, water or sanitation per $1,000 GDP (2012)
Two thirdsof ODCs
People without access to electricity, water or sanitation per $1,000 GDP (2012)
0
1
2
3
0 0.5 1 1.5 2
Pov
erty
gap
(% o
f GD
P, 2
011)
LDCs ODCs
Enlarged
Sources: UNCTAD secretariat estimates, based on data from World Bank PovcalNet database (http://iresearch.worldbank.org/PovcalNet/index.htm) and World Development Indicators Database http://databank.worldbank.org/data/views/variableselection/selectvariables.aspx?source=world-development-indicators) (both accessed July 2015).
…and partly because of the importance of agriculture to the
economy and employment.
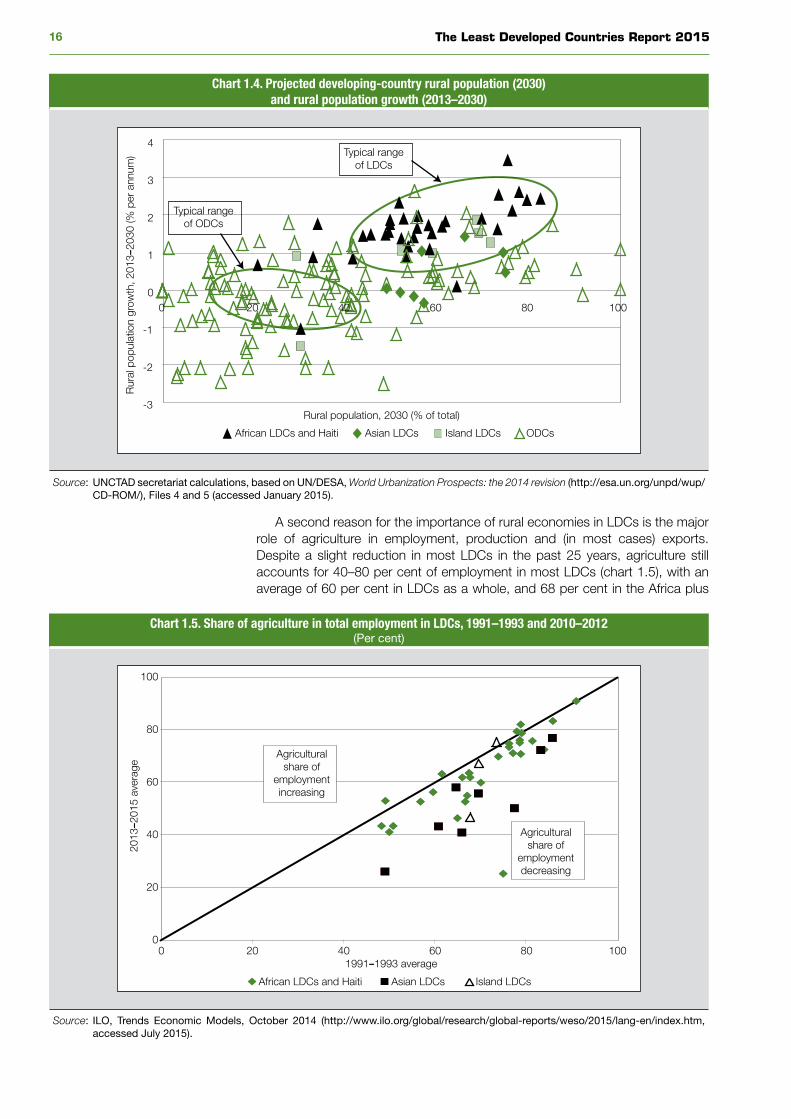
The Least Developed Countries Report 201516
A second reason for the importance of rural economies in LDCs is the major role of agriculture in employment, production and (in most cases) exports. Despite a slight reduction in most LDCs in the past 25 years, agriculture still accounts for 40–80 per cent of employment in most LDCs (chart 1.5), with an average of 60 per cent in LDCs as a whole, and 68 per cent in the Africa plus
Chart 1.4. Projected developing-country rural population (2030) and rural population growth (2013–2030)
Typical rangeof LDCs
Typical rangeof ODCs
-3
-2
-1
0
1
2
3
4
0 20 40 60 80 100
Rur
al p
opul
atio
n gr
owth
, 201
3‒20
30 (%
per
ann
um)
Rural population, 2030 (% of total)
Asian LDCs Island LDCs African LDCs and Haiti ODCs
Source: UNCTAD secretariat calculations, based on UN/DESA, World Urbanization Prospects: the 2014 revision (http://esa.un.org/unpd/wup/CD-ROM/), Files 4 and 5 (accessed January 2015).
Chart 1.5. Share of agriculture in total employment in LDCs, 1991–1993 and 2010–2012(Per cent)
0
20
40
60
80
100
0 20 40 60 80 100
2013
‒201
5 av
erag
e
1991‒1993 average
African LDCs and Haiti Asian LDCs Island LDCs
Agriculturalshare of
employmentincreasing
Agriculturalshare of
employmentdecreasing
Source: ILO, Trends Economic Models, October 2014 (http://www.ilo.org/global/research/global-reports/weso/2015/lang-en/index.htm, accessed July 2015).
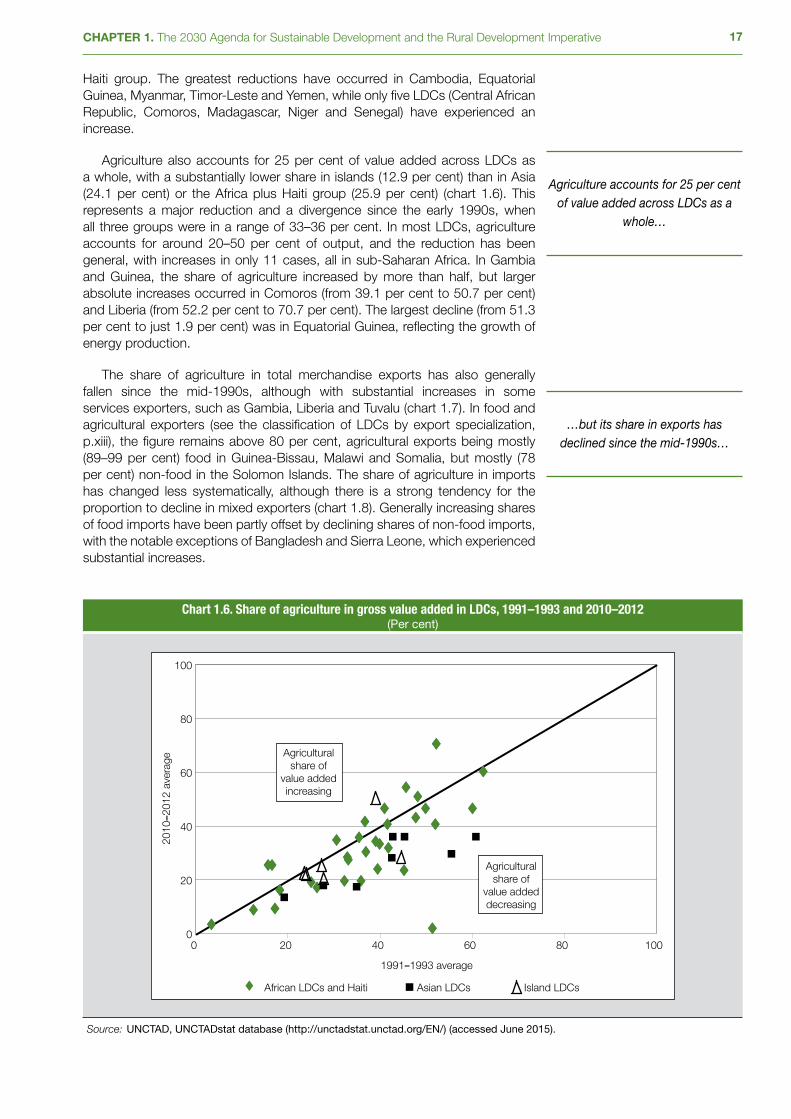
17CHAPTER 1. The 2030 Agenda for Sustainable Development and the Rural Development Imperative
Haiti group. The greatest reductions have occurred in Cambodia, Equatorial Guinea, Myanmar, Timor-Leste and Yemen, while only five LDCs (Central African Republic, Comoros, Madagascar, Niger and Senegal) have experienced an increase.
Agriculture also accounts for 25 per cent of value added across LDCs as a whole, with a substantially lower share in islands (12.9 per cent) than in Asia (24.1 per cent) or the Africa plus Haiti group (25.9 per cent) (chart 1.6). This represents a major reduction and a divergence since the early 1990s, when all three groups were in a range of 33–36 per cent. In most LDCs, agriculture accounts for around 20–50 per cent of output, and the reduction has been general, with increases in only 11 cases, all in sub-Saharan Africa. In Gambia and Guinea, the share of agriculture increased by more than half, but larger absolute increases occurred in Comoros (from 39.1 per cent to 50.7 per cent) and Liberia (from 52.2 per cent to 70.7 per cent). The largest decline (from 51.3 per cent to just 1.9 per cent) was in Equatorial Guinea, reflecting the growth of energy production.
The share of agriculture in total merchandise exports has also generally fallen since the mid-1990s, although with substantial increases in some services exporters, such as Gambia, Liberia and Tuvalu (chart 1.7). In food and agricultural exporters (see the classification of LDCs by export specialization, p.xiii), the figure remains above 80 per cent, agricultural exports being mostly (89–99 per cent) food in Guinea-Bissau, Malawi and Somalia, but mostly (78 per cent) non-food in the Solomon Islands. The share of agriculture in imports has changed less systematically, although there is a strong tendency for the proportion to decline in mixed exporters (chart 1.8). Generally increasing shares of food imports have been partly offset by declining shares of non-food imports, with the notable exceptions of Bangladesh and Sierra Leone, which experienced substantial increases.
Chart 1.6. Share of agriculture in gross value added in LDCs, 1991–1993 and 2010–2012(Per cent)
0
20
40
60
80
100
0 20 40 60 80 100
2010
‒201
2 av
erag
e
1991‒1993 average
African LDCs and Haiti Asian LDCs Island LDCs
Agriculturalshare of
value addedincreasing
Agriculturalshare of
value addeddecreasing
Source: UNCTAD, UNCTADstat database (http://unctadstat.unctad.org/EN/) (accessed June 2015).
Agriculture accounts for 25 per cent of value added across LDCs as a
whole…
…but its share in exports has declined since the mid-1990s…
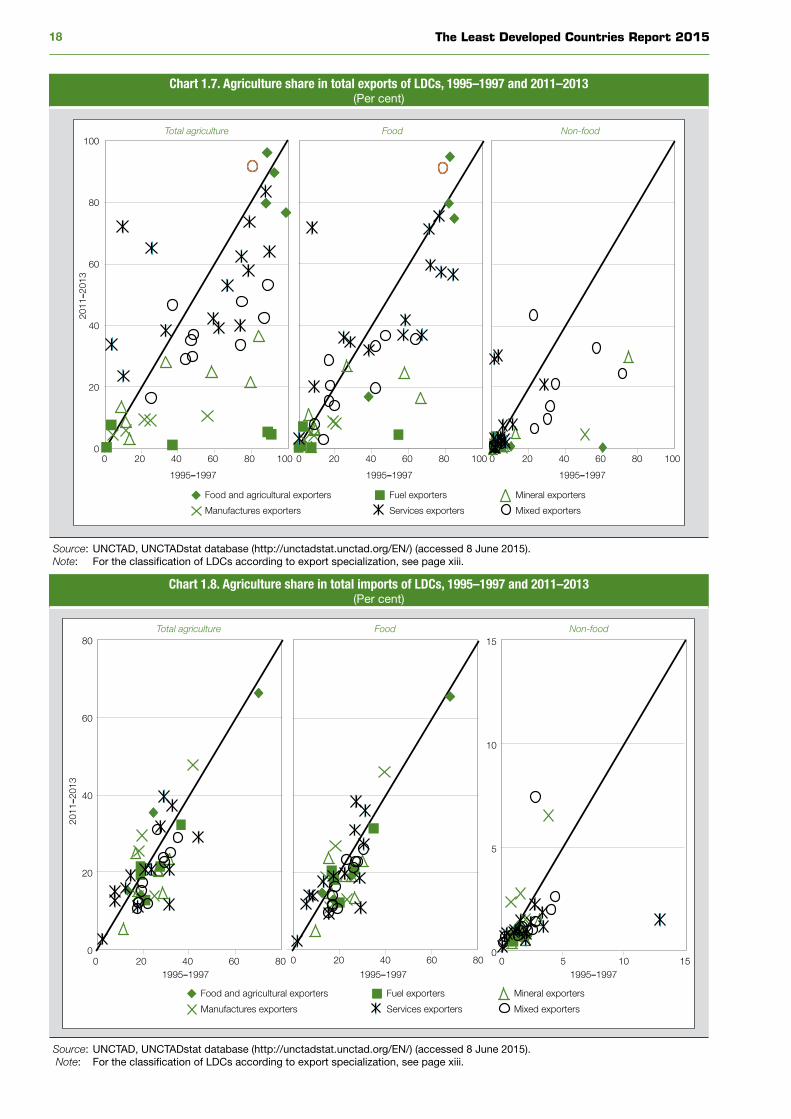
The Least Developed Countries Report 201518
Chart 1.7. Agriculture share in total exports of LDCs, 1995–1997 and 2011–2013(Per cent)
0
20
40
60
80
100
0 20 40 60 80 100 0 20 40 60 80 100 0 20 40 60 80 100
2011
‒201
3
1995‒1997
Total agriculture
Food and agricultural exporters Fuel exporters Mineral exporters
Manufactures exporters Services exporters Mixed exporters
1995‒1997
Food
1995‒1997
Non-food
Source: UNCTAD, UNCTADstat database (http://unctadstat.unctad.org/EN/) (accessed 8 June 2015).Note: For the classification of LDCs according to export specialization, see page xiii.
Chart 1.8. Agriculture share in total imports of LDCs, 1995–1997 and 2011–2013(Per cent)
2011
‒201
3
Food and agricultural exporters Fuel exporters Mineral exporters
Manufactures exporters Services exporters Mixed exporters
1995‒1997 1995‒1997 1995‒1997
Total agriculture Food Non-food
0
20
40
60
80
0 20 40 60 80 0 20 40 60 800
5
10
15
0 5 10 15
Source: UNCTAD, UNCTADstat database (http://unctadstat.unctad.org/EN/) (accessed 8 June 2015). Note: For the classification of LDCs according to export specialization, see page xiii.
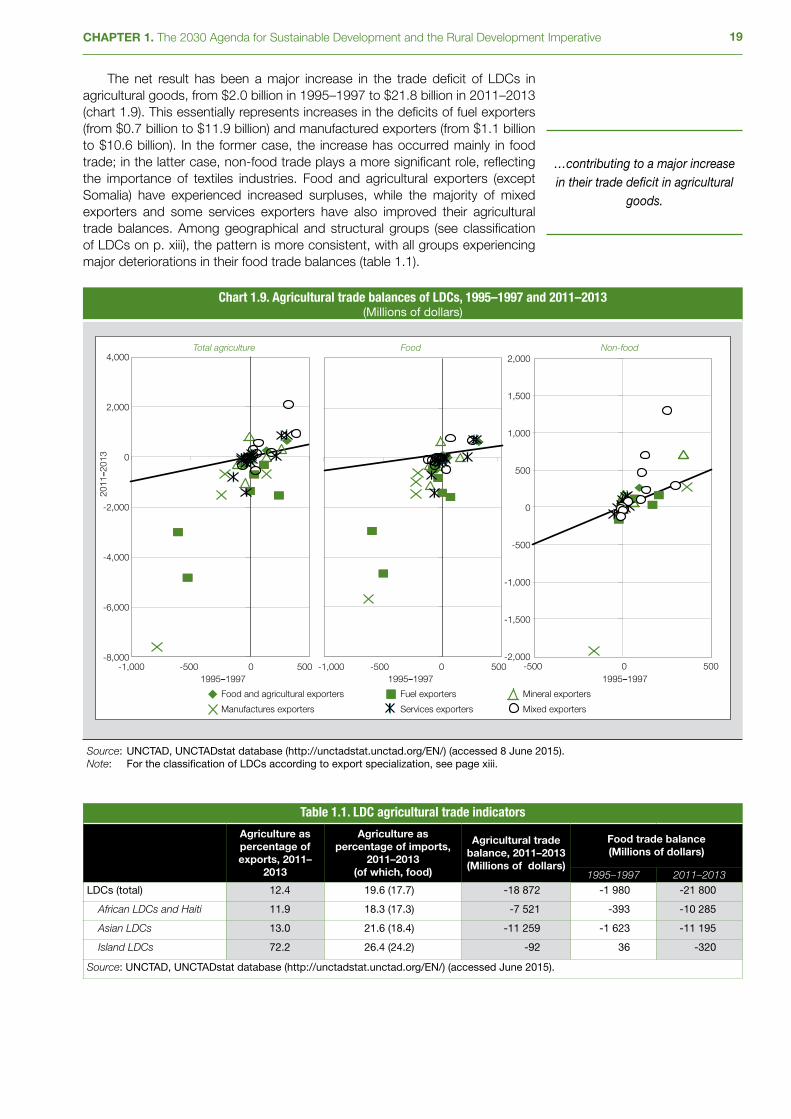
19CHAPTER 1. The 2030 Agenda for Sustainable Development and the Rural Development Imperative
The net result has been a major increase in the trade deficit of LDCs in agricultural goods, from $2.0 billion in 1995–1997 to $21.8 billion in 2011–2013 (chart 1.9). This essentially represents increases in the deficits of fuel exporters (from $0.7 billion to $11.9 billion) and manufactured exporters (from $1.1 billion to $10.6 billion). In the former case, the increase has occurred mainly in food trade; in the latter case, non-food trade plays a more significant role, reflecting the importance of textiles industries. Food and agricultural exporters (except Somalia) have experienced increased surpluses, while the majority of mixed exporters and some services exporters have also improved their agricultural trade balances. Among geographical and structural groups (see classification of LDCs on p. xiii), the pattern is more consistent, with all groups experiencing major deteriorations in their food trade balances (table 1.1).
Chart 1.9. Agricultural trade balances of LDCs, 1995–1997 and 2011–2013(Millions of dollars)
2011
‒201
3
Food and agricultural exporters Fuel exporters Mineral exporters
Manufactures exporters Services exporters Mixed exporters
1995‒1997 1995‒1997 1995‒1997
-8,000
-6,000
-4,000
-2,000
0
2,000
4,000
-1,000 -500 0 500 -1,000 -500 0 500-2,000
-1,500
-1,000
-500
0
500
1,000
1,500
2,000
-500 0 500
1995‒1997
Total agriculture Food Non-food
Source: UNCTAD, UNCTADstat database (http://unctadstat.unctad.org/EN/) (accessed 8 June 2015).Note: For the classification of LDCs according to export specialization, see page xiii.
Table 1.1. LDC agricultural trade indicators
Agriculture as percentage of exports, 2011–
2013
Agriculture as percentage of imports,
2011–2013 (of which, food)
Agricultural trade balance, 2011–2013 (Millions of dollars)
Food trade balance (Millions of dollars)
1995–1997 2011–2013LDCs (total) 12.4 19.6 (17.7) -18 872 -1 980 -21 800
African LDCs and Haiti 11.9 18.3 (17.3) -7 521 -393 -10 285
Asian LDCs 13.0 21.6 (18.4) -11 259 -1 623 -11 195
Island LDCs 72.2 26.4 (24.2) -92 36 -320
Source: UNCTAD, UNCTADstat database (http://unctadstat.unctad.org/EN/) (accessed June 2015).
…contributing to a major increase in their trade deficit in agricultural
goods.
The Least Developed Countries Report 201520
C. Rural economies, urban economies and proximity
Focusing on rural development clearly does not imply that urban development should or can be neglected: The idea of rural development as an alternative to urban development represents a false choice. Sustainable development and poverty eradication clearly require both; and even for rural economies, the relationship with urban areas is a key consideration.
Proximity to towns provides both a market for labour and outputs and access to productive inputs and services; and rural-urban migration provides both an exit mechanism for surplus labour and a source of income for some rural households through remittances. Rural-urban migration is also an important consideration for urban economies. Successful development has typically been driven by increasing agricultural productivity, simultaneously providing an urban workforce for industrial development via rural-urban migration and surplus agricultural production with which to feed them. This interaction is critical to the development process, particularly in its earliest stages.
However, such developmental benefits of rural-urban migration are far from universal or automatic. It is the possibility of formal-sector employment rather than the actual securing of a formal-sector job that attracts migrants to urban areas; and most are either unemployed or engaged in low-income, low-productivity informal activities while seeking formal employment (Harris and Todaro, 1970; Fields, 1972). This can give rise to the “Todaro paradox” of urban job creation increasing urban poverty (Todaro, 1976).
Adverse effects on urban poverty are more likely where, as in many African LDCs, rural-urban migration is driven more by “push” factors — particularly the lack of economic opportunities in rural areas — than by the “pull” of urban job creation. Where rural-urban migration exceeds urban job creation, this adds to the chronic oversupply of labour in the urban informal sector, increasing urban poverty and exacerbating strains on social infrastructure (housing, water, sanitation, schools, health facilities, etc.).
While the manufacturing sector can provide valuable opportunities for employment creation, there are growing indications that this alone will be insufficient to eradicate poverty. Historically, manufacturing employment peaked at around 30 per cent, and countries achieving high-income status have consistently achieved a peak of at least 18–20 per cent; but it now peaks at just 13–15 per cent (Rodrik, 2014; Felipe, Mehta and Rhee, 2014). Even if all LDCs could simultaneously expand their manufacturing sectors to this peak level in the next 15 years, it would fall far short of the employment needed for poverty eradication. Equally, while extractive industries have played a central role in economic growth in many LDCs, their direct contribution to employment creation is limited, giving rise to a process of jobless growth (Ancharaz, 2011; UNCTAD, 2013) unless the rents are harnessed for inclusive development.
Hence, rural development in the broader sense will be critical to poverty eradication and improved living standards, not only in rural areas, but also in towns and cities, by limiting “push” pressures for rural-urban migration. Research has confirmed that rural growth reduces poverty more than urban growth (Wodon, 1999), as does movement of labour from agriculture to rural non-farm employment and to smaller towns rather than to large cities (Christiaensen and Todo, 2014).
Sustainable development and poverty eradication require both rural and urban development…
Rural development is critical to poverty eradication and improved living standards in urban as well as
rural areas.
Manufacturing alone will be insufficient to eradicate poverty.
…and rural-urban interactions are critical to the development process,
particularly in its earliest stages.

21CHAPTER 1. The 2030 Agenda for Sustainable Development and the Rural Development Imperative
The ideal is therefore a balanced process of urban and rural development, allowing an upward convergence of the lowest incomes in rural and urban areas. By creating the conditions for a rural-urban migration process driven primarily by choice rather than necessity, this would benefit people in both rural and urban areas, and not least those who move between them.
It is also important, particularly in LDCs, to move beyond the convention of a simple urban-rural dichotomy. Aside from the often blurred distinction between rural and urban areas (see box 1.2), there are very considerable differences between rural areas themselves. Since linkages with urban markets play a key role in rural development opportunities, a critical dimension is distance from, and transport connections with, towns and cities. Four broad categories of rural economies can be distinguished:
• Peri-urban areas, within daily commuting distance of a town or city;
• Intermediate rural areas, beyond commuting distance but with regular trade links to urban areas;
• Remote areas, with only occasional links; and
• Isolated areas, where connections with urban areas are minimal.
Box 1.2. Defining “rural” and “urban”
The distinction between rural and urban areas is less obvious than it might appear. The only (nearly) standardized definition is that of OECD, which defines a rural area as one with population density of less than 150 per km2. Even here, however, a much higher threshold (500 per km2) is used for Japan, and individual member countries use different definitions (including other criteria, such as size of population, commuting intensity and the share of agriculture in production). The European Union’s (EU) EUROSTAT has proposed, but not adopted, a higher population density threshold of 200 per km2.
OECD’s different threshold for Japan highlights the problem of a standardized definition. In a developed country, an area with a population density of 300 per km2 might well be a prosperous suburb of a major city, with large houses set in their own grounds. In an LDC, it is more likely to be composed of farmsteads of two hectares, each housing a family of six, 20 km from the nearest town. It would clearly be as inappropriate to classify the former as rural as it would to classify the latter as urban. In some LDCs, the average reported rural population density (approximated as rural population divided by total land area) is far above the 200-per-km2 threshold (800 in Bangladesh, 360 in Burundi, 353 in Rwanda and 290 in Comoros).
The Global Rural-Urban Mapping Project (GRUMP) of the United States National Aeronautics and Space Administration (NASA), hosted by Columbia University, takes a different approach, seeking to create internationally comparable measures of rurality by merging satellite images showing population agglomerations with census data. However, its reliability in some LDCs may be limited by its reliance in part on observations of light at night.
In view of these factors, the United Nations Department of Economic and Social Affairs (UN/DESA), responsible for the United Nations work on population and demographics, uses national criteria to demarcate urban and rural areas. In general, these define rural areas as everywhere except urban areas, the latter being defined on the basis of size; as designated administrative centres; or as civil divisions meeting specified criteria (e.g. type of local government, number of inhabitants and/or proportion of population engaged in agriculture).
This inevitably gives rise to significant variations in definitions between countries. Among LDCs, the most inclusive definitions of urban areas are those used by Equatorial Guinea (district centres and localities with 300 dwellings and/or 1,500 inhabitants), Ethiopia and Liberia (localities with at least 2,000 inhabitants). Cambodia also has a threshold size of 2,000, but with additional criteria of population density and agricultural employment. Sudan and Zambia have a threshold of 5,000 inhabitants, and Senegal of 10,000. Most other LDCs for which information is available rely on legal or administrative definitions, the most restrictive being Burundi, which includes only the commune of Bujumbura, the capital (UN/DESA, 2013, table 6, technical notes).
These variations in definitions should be borne in mind when interpreting rural and urban data provided in this Report (and elsewhere). Beyond issues of consistency between countries, they suggest that some smaller and newer urban settlements are likely to be incorrectly defined (from an economic standpoint) as rural. This means on the one hand that rural population figures will be somewhat overstated, and on the other hand that rural-urban differences will be somewhat understated.
Source: UNECE et al. (2007); UN/DESA (2013); Global Rural-Urban Mapping Project (GRUMP), Version 1, http://sedac.ciesin.columbia.edu/data/collection/grump-v1.
The ideal is a balanced process of urban and rural development, allowing an upward convergence
of incomes.
A critical dimension of differences among rural areas is distance from
towns and cities.
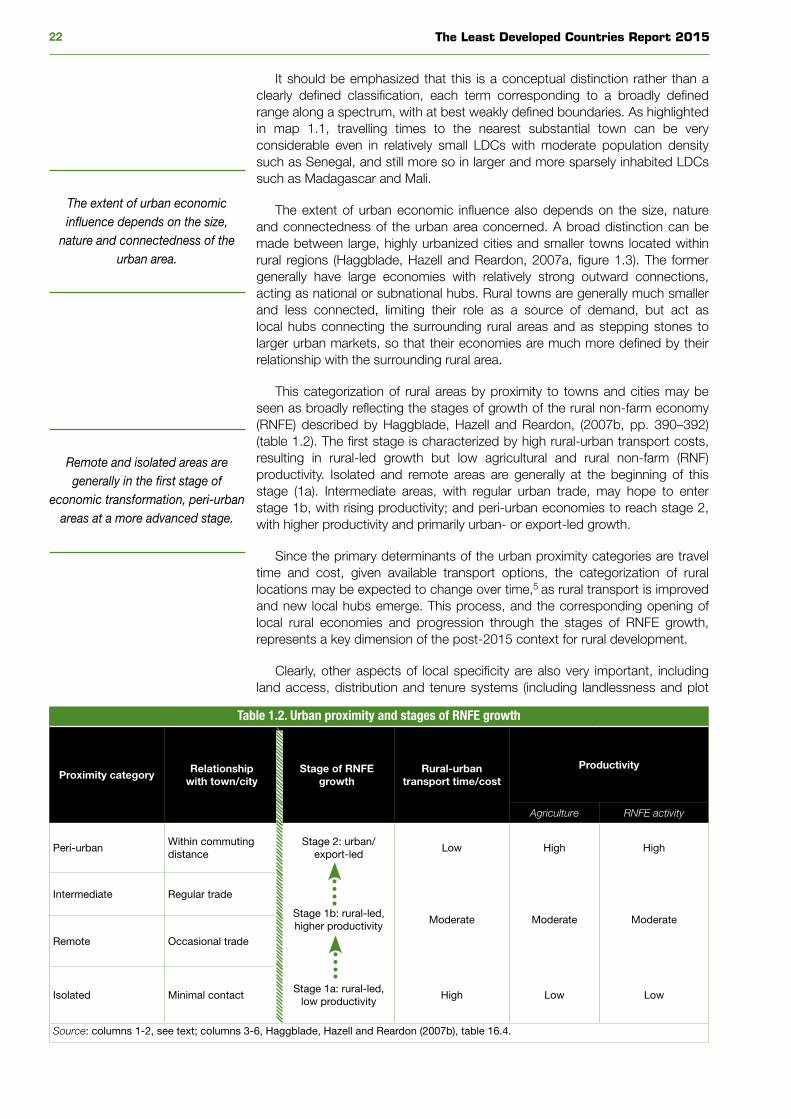
The Least Developed Countries Report 201522
It should be emphasized that this is a conceptual distinction rather than a clearly defined classification, each term corresponding to a broadly defined range along a spectrum, with at best weakly defined boundaries. As highlighted in map 1.1, travelling times to the nearest substantial town can be very considerable even in relatively small LDCs with moderate population density such as Senegal, and still more so in larger and more sparsely inhabited LDCs such as Madagascar and Mali.
The extent of urban economic influence also depends on the size, nature and connectedness of the urban area concerned. A broad distinction can be made between large, highly urbanized cities and smaller towns located within rural regions (Haggblade, Hazell and Reardon, 2007a, figure 1.3). The former generally have large economies with relatively strong outward connections, acting as national or subnational hubs. Rural towns are generally much smaller and less connected, limiting their role as a source of demand, but act as local hubs connecting the surrounding rural areas and as stepping stones to larger urban markets, so that their economies are much more defined by their relationship with the surrounding rural area.
This categorization of rural areas by proximity to towns and cities may be seen as broadly reflecting the stages of growth of the rural non-farm economy (RNFE) described by Haggblade, Hazell and Reardon, (2007b, pp. 390–392) (table 1.2). The first stage is characterized by high rural-urban transport costs, resulting in rural-led growth but low agricultural and rural non-farm (RNF) productivity. Isolated and remote areas are generally at the beginning of this stage (1a). Intermediate areas, with regular urban trade, may hope to enter stage 1b, with rising productivity; and peri-urban economies to reach stage 2, with higher productivity and primarily urban- or export-led growth.
Since the primary determinants of the urban proximity categories are travel time and cost, given available transport options, the categorization of rural locations may be expected to change over time,5 as rural transport is improved and new local hubs emerge. This process, and the corresponding opening of local rural economies and progression through the stages of RNFE growth, represents a key dimension of the post-2015 context for rural development.
Clearly, other aspects of local specificity are also very important, including land access, distribution and tenure systems (including landlessness and plot
The extent of urban economic influence depends on the size,
nature and connectedness of the urban area.
Remote and isolated areas are generally in the first stage of
economic transformation, peri-urban areas at a more advanced stage.
Table 1.2. Urban proximity and stages of RNFE growth
Proximity categoryRelationship
with town/cityStage of RNFE
growthRural-urban
transport time/cost
Productivity
Agriculture RNFE activity
Peri-urbanWithin commuting distance
Stage 2: urban/export-led
Low High High
Intermediate Regular trade
Stage 1b: rural-led, higher productivity
Moderate Moderate Moderate
Remote Occasional trade
Isolated Minimal contactStage 1a: rural-led,
low productivityHigh Low Low
Source: columns 1-2, see text; columns 3-6, Haggblade, Hazell and Reardon (2007b), table 16.4.

23CHAPTER 1. The 2030 Agenda for Sustainable Development and the Rural Development Imperative
Map 1.1. Travel time to nearest city: Mali, Madagascar and Senegal
CITIES > 50.000 PEOPLE
NATIONAL CAPITAL
TRAVEL TIME TO THE NEAREST CITY > 50.000 (in hours)
<2 2−4 4−8 8−16 >16
Toamasina
Antsiranana
Mahajanga
Toliara
Fianarantsoa
Antsirabe
Ambovombe
ANTANANARIVO
Mayotte (Fr.)
COMOROS
Toamasina
Antsiranana
Mahajanga
Toliara
Fianarantsoa
Antsirabe
Ambovombe
ANTANANARIVO
Mayotte (Fr.)
COMOROS
I N D I A N
O C E A N
Mo z a m
b i q u e C h a n n e l
0 40 80 120 160
0 120 Miles8040
200 Kilometers
Koulikoro
Sikasso
Niono
Koutiala
Ségou
Mopti
Gao
Kayes
BAMAKO
M A U R I T A N I A
A L G E R I A
BURKINA FASO
N I G E R
NIGE
RIA
GHANA B E N I N
TO
GO
CÔ TE D ’ I VO IRE
GU INEA
SENE
GAL
S IERRALEONE
TOMINIAN
KOUTIALA
Koulikoro
Sikasso
Niono
Koutiala
Ségou
Mopti
Gao
Kayes
BAMAKO
M A U R I T A N I A
A L G E R I A
BURKINA FASO
N I G E R
NIGE
RIA
GHANA B E N I N
TO
GO
CÔ TE D ’ I VO IRE
GU INEA
SENE
GAL
S IERRALEONE
0 100 200
0 50 100 150 300 Miles
300 Kilometers
DiourbelMbakéThiès
Louga
Richard-Toll
Kaolack
Tambacounda
Kolda
Ziguinchor
Mbour
Saint-Louis
DAKAR
M A U R I T A N I A
M A L I
THE GAMBIA
G U I N E A - B I S S A U G U I N E A
DiourbelMbakéThiès
Louga
Richard-Toll
Kaolack
Tambacounda
Kolda
Ziguinchor
Mbour
Saint-Louis
DAKAR
M A U R I T A N I A
M A L I
THE GAMBIA
G U I N E A - B I S S A U G U I N E A
MEKHE
NIORO
CASAMANCE
BAS DELTAHAUT DELTA
ATLANTIC
OCEAN
0 25 50 75
0 25 50 75 Miles
100 Kilometers
A. Mali B. Madagascar
C. Senegal
Source: Losch, Fréguin-Gresh and White (2012).
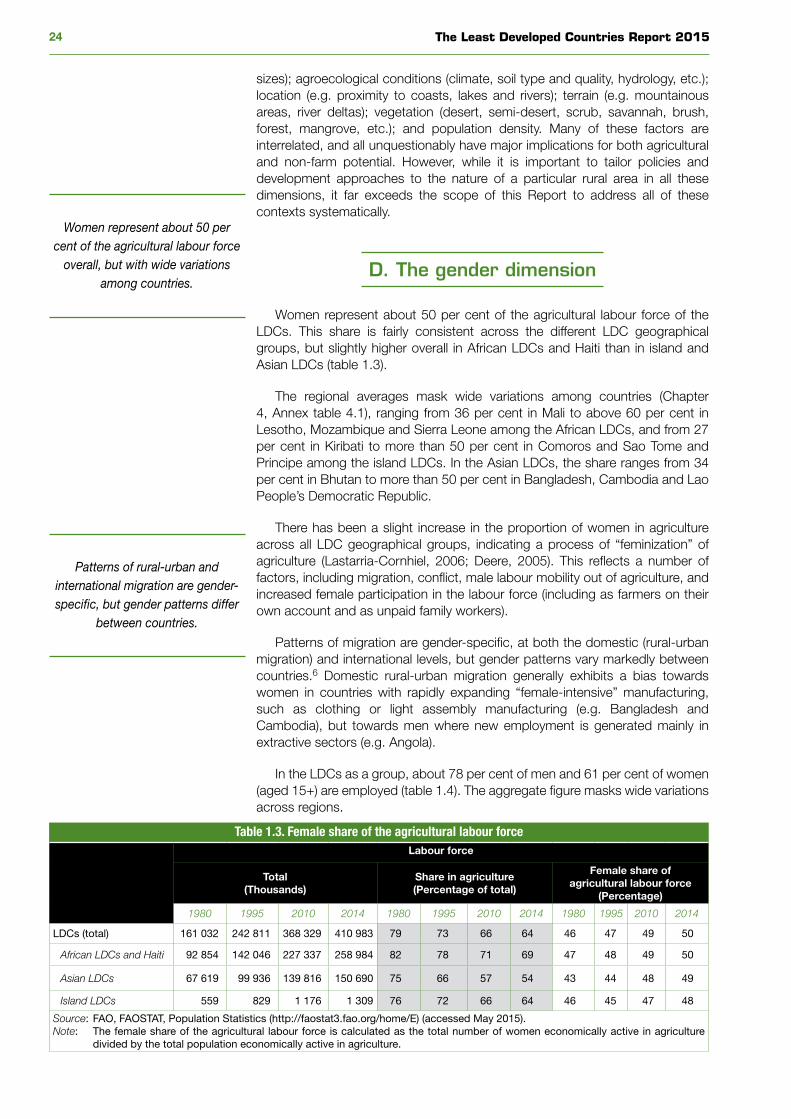
The Least Developed Countries Report 201524
sizes); agroecological conditions (climate, soil type and quality, hydrology, etc.); location (e.g. proximity to coasts, lakes and rivers); terrain (e.g. mountainous areas, river deltas); vegetation (desert, semi-desert, scrub, savannah, brush, forest, mangrove, etc.); and population density. Many of these factors are interrelated, and all unquestionably have major implications for both agricultural and non-farm potential. However, while it is important to tailor policies and development approaches to the nature of a particular rural area in all these dimensions, it far exceeds the scope of this Report to address all of these contexts systematically.
D. The gender dimension
Women represent about 50 per cent of the agricultural labour force of the LDCs. This share is fairly consistent across the different LDC geographical groups, but slightly higher overall in African LDCs and Haiti than in island and Asian LDCs (table 1.3).
The regional averages mask wide variations among countries (Chapter 4, Annex table 4.1), ranging from 36 per cent in Mali to above 60 per cent in Lesotho, Mozambique and Sierra Leone among the African LDCs, and from 27 per cent in Kiribati to more than 50 per cent in Comoros and Sao Tome and Principe among the island LDCs. In the Asian LDCs, the share ranges from 34 per cent in Bhutan to more than 50 per cent in Bangladesh, Cambodia and Lao People’s Democratic Republic.
There has been a slight increase in the proportion of women in agriculture across all LDC geographical groups, indicating a process of “feminization” of agriculture (Lastarria-Cornhiel, 2006; Deere, 2005). This reflects a number of factors, including migration, conflict, male labour mobility out of agriculture, and increased female participation in the labour force (including as farmers on their own account and as unpaid family workers).
Patterns of migration are gender-specific, at both the domestic (rural-urban migration) and international levels, but gender patterns vary markedly between countries.6 Domestic rural-urban migration generally exhibits a bias towards women in countries with rapidly expanding “female-intensive” manufacturing, such as clothing or light assembly manufacturing (e.g. Bangladesh and Cambodia), but towards men where new employment is generated mainly in extractive sectors (e.g. Angola).
In the LDCs as a group, about 78 per cent of men and 61 per cent of women (aged 15+) are employed (table 1.4). The aggregate figure masks wide variations across regions.
Table 1.3. Female share of the agricultural labour forceLabour force
Total(Thousands)
Share in agriculture(Percentage of total)
Female share of agricultural labour force
(Percentage)
1980 1995 2010 2014 1980 1995 2010 2014 1980 1995 2010 2014
LDCs (total) 161 032 242 811 368 329 410 983 79 73 66 64 46 47 49 50
African LDCs and Haiti 92 854 142 046 227 337 258 984 82 78 71 69 47 48 49 50
Asian LDCs 67 619 99 936 139 816 150 690 75 66 57 54 43 44 48 49
Island LDCs 559 829 1 176 1 309 76 72 66 64 46 45 47 48
Source: FAO, FAOSTAT, Population Statistics (http://faostat3.fao.org/home/E) (accessed May 2015).Note: The female share of the agricultural labour force is calculated as the total number of women economically active in agriculture
divided by the total population economically active in agriculture.
Women represent about 50 per cent of the agricultural labour force
overall, but with wide variations among countries.
Patterns of rural-urban and international migration are gender-specific, but gender patterns differ
between countries.
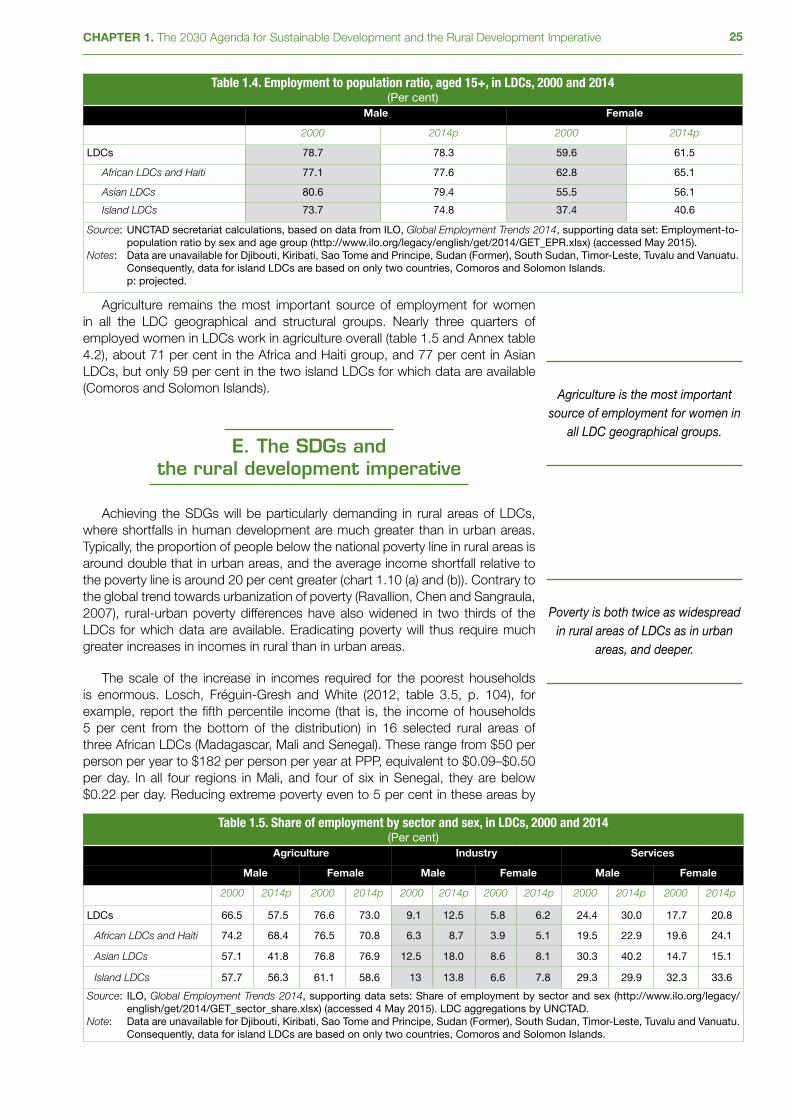
25CHAPTER 1. The 2030 Agenda for Sustainable Development and the Rural Development Imperative
Agriculture remains the most important source of employment for women in all the LDC geographical and structural groups. Nearly three quarters of employed women in LDCs work in agriculture overall (table 1.5 and Annex table 4.2), about 71 per cent in the Africa and Haiti group, and 77 per cent in Asian LDCs, but only 59 per cent in the two island LDCs for which data are available (Comoros and Solomon Islands).
E. The SDGs and the rural development imperative
Achieving the SDGs will be particularly demanding in rural areas of LDCs, where shortfalls in human development are much greater than in urban areas. Typically, the proportion of people below the national poverty line in rural areas is around double that in urban areas, and the average income shortfall relative to the poverty line is around 20 per cent greater (chart 1.10 (a) and (b)). Contrary to the global trend towards urbanization of poverty (Ravallion, Chen and Sangraula, 2007), rural-urban poverty differences have also widened in two thirds of the LDCs for which data are available. Eradicating poverty will thus require much greater increases in incomes in rural than in urban areas.
The scale of the increase in incomes required for the poorest households is enormous. Losch, Fréguin-Gresh and White (2012, table 3.5, p. 104), for example, report the fifth percentile income (that is, the income of households 5 per cent from the bottom of the distribution) in 16 selected rural areas of three African LDCs (Madagascar, Mali and Senegal). These range from $50 per person per year to $182 per person per year at PPP, equivalent to $0.09–$0.50 per day. In all four regions in Mali, and four of six in Senegal, they are below $0.22 per day. Reducing extreme poverty even to 5 per cent in these areas by
Table 1.4. Employment to population ratio, aged 15+, in LDCs, 2000 and 2014(Per cent)
Male Female
2000 2014p 2000 2014p
LDCs 78.7 78.3 59.6 61.5
African LDCs and Haiti 77.1 77.6 62.8 65.1
Asian LDCs 80.6 79.4 55.5 56.1
Island LDCs 73.7 74.8 37.4 40.6
Source: UNCTAD secretariat calculations, based on data from ILO, Global Employment Trends 2014, supporting data set: Employment-to-population ratio by sex and age group (http://www.ilo.org/legacy/english/get/2014/GET_EPR.xlsx) (accessed May 2015).
Notes: Data are unavailable for Djibouti, Kiribati, Sao Tome and Principe, Sudan (Former), South Sudan, Timor-Leste, Tuvalu and Vanuatu. Consequently, data for island LDCs are based on only two countries, Comoros and Solomon Islands.
p: projected.
Table 1.5. Share of employment by sector and sex, in LDCs, 2000 and 2014(Per cent)
Agriculture Industry Services
Male Female Male Female Male Female
2000 2014p 2000 2014p 2000 2014p 2000 2014p 2000 2014p 2000 2014p
LDCs 66.5 57.5 76.6 73.0 9.1 12.5 5.8 6.2 24.4 30.0 17.7 20.8
African LDCs and Haiti 74.2 68.4 76.5 70.8 6.3 8.7 3.9 5.1 19.5 22.9 19.6 24.1
Asian LDCs 57.1 41.8 76.8 76.9 12.5 18.0 8.6 8.1 30.3 40.2 14.7 15.1
Island LDCs 57.7 56.3 61.1 58.6 13 13.8 6.6 7.8 29.3 29.9 32.3 33.6
Source: ILO, Global Employment Trends 2014, supporting data sets: Share of employment by sector and sex (http://www.ilo.org/legacy/english/get/2014/GET_sector_share.xlsx) (accessed 4 May 2015). LDC aggregations by UNCTAD.
Note: Data are unavailable for Djibouti, Kiribati, Sao Tome and Principe, Sudan (Former), South Sudan, Timor-Leste, Tuvalu and Vanuatu. Consequently, data for island LDCs are based on only two countries, Comoros and Solomon Islands.
Agriculture is the most important source of employment for women in
all LDC geographical groups.
Poverty is both twice as widespread in rural areas of LDCs as in urban
areas, and deeper.

The Least Developed Countries Report 201526
Chart 1.10. LDCs: Urban and rural shortfalls from selected SDG targets(Per cent of population)
100 80 60 40 20 0 20 40 60 80 100Yemen (2005)
Nepal (2010)
Lao PDR (2012)
Bhutan (2012)
Bangladesh (2010)
Afghanistan (2011)
Timor-Leste (2007)
Sao Tome and Principe (2009)
Comoros (2004)
Zambia (2010)
Uganda (2009)
Togo (2011)
Tanzania, U.R. (2012)
Sudan (2009)
South Sudan (2009)
Sierra Leone (2011)
Senegal (2011)
Niger (2008)
Mozambique (2009)
Mauritania (2008)
Mali (2010)
Malawi (2010)
Madagascar (2010)
Liberia (2007)
Lesotho (2010)
Guinea-Bissau (2002)
Guinea (2012)
Ethiopia (2011)
Congo, Dem. Rep. (2005)
Chad (2011)
Central African Republic (2008)
Burundi (2006)
Burkina Faso (2009)
Benin (2011)
Angola (2008)
(a) Poverty headcount ratio(National poverty line; percentage, latest)
UrbanMedian: 27.6
RuralMedian: 56.9
UrbanMedian: 27.8
RuralMedian: 35.1
UrbanMedian: 9.9
RuralMedian: 41.5
UrbanMedian: 51.6
RuralMedian: 77.8
80 60 40 20 0 20 40 60 80Yemen (2005)
Nepal (2010)
Lao PDR (2012)
Bhutan (2012)
Bangladesh (2010)
Afghanistan (2011)
Timor-Leste (2007)
Sao Tome and Principe (2009)
Comoros (2004)
Zambia (2010)
Uganda (2009)
Togo (2011)
Tanzania, U.R. (2012)
Sudan (2009)
South Sudan (2009)
Sierra Leone (2011)
Senegal (2011)
Niger (2008)
Mozambique (2009)
Mauritania (2008)
Mali (2010)
Malawi (2010)
Madagascar (2010)
Liberia (2007)
Lesotho (2010)
Guinea-Bissau (2002)
Guinea (2012)
Ethiopia (2011)
Congo, Dem. Rep. (2005)
Chad (2011)
Central African Republic (2008)
Burundi (2006)
Burkina Faso (2009)
Benin (2011)
Angola (2008)
(b) Average income shortfal(National poverty line; percentage, latest)l
100 80 60 40 20 0 20 40 60 80 100YemenNepalMyanmarLao PDRCambodiaBhutanBangladeshAfghanistanVanuatuTuvaluTimor-LesteSolomon IslandsSao Tome and PrincipeKiribatiComoros (2010)ZambiaUgandaTogoTanzania, U.R.SudanSouth SudanSomalia (2011)Sierra LeoneSenegalRwandaNigerMozambiqueMauritaniaMaliMalawiMadagascarLiberiaLesothoHaitiGuinea-BissauGuineaGambiaEthiopiaEritrea (2008)Equatorial Guinea (2006)DjiboutiCongo, Dem. Rep.ChadCentral African RepublicBurundiBurkina FasoBeninAngola
(c) Population without access to water (Percentage, 2012)
100 80 60 40 20 0 20 40 60 80 100YemenNepalMyanmarLao PDRCambodiaBhutanBangladeshAfghanistanVanuatuTuvaluTimor-LesteSolomon IslandsSao Tome and PrincipeKiribatiComorosZambiaUgandaTogoTanzania, U.R.SudanSouth SudanSomaliaSierra LeoneSenegalRwandaNigerMozambiqueMauritaniaMaliMalawiMadagascarLiberiaLesothoHaitiGuinea-BissauGuineaGambiaEthiopiaEritreaEquatorial GuineaDjiboutiCongo, Dem. Rep.ChadCentral African RepublicBurundiBurkina FasoBeninAngola
(d) Population without access to sanitation (Percentage, 2012)
27CHAPTER 1. The 2030 Agenda for Sustainable Development and the Rural Development Imperative
Chart 1.10 (contd.)
Yemen (2006)Nepal (2011)Lao PDR (2011)Cambodia (2010)Bhutan (2010)Bangladesh (2011)Afghanistan (2010)Vanuatu (2007)Timor-Leste (2010)Sao Tome and Principe (2009)Comoros (2012)Zambia (2007)Uganda (2011)Togo (2010)Tanzania, U.R. (2010)Somalia (2006)Sierra Leone (2010)Senegal (2010)Rwanda (2010)Niger (2012)Mozambique (2011)Mauritania (2007)Mali (2013)Malawi (2010)Madagascar (2009)Liberia (2009)Lesotho (2009)Haiti (2012)Guinea-Bissau (2010)Guinea (2005)Gambia (2013)Ethiopia (2011)Djibouti (2006)Congo, Dem. Rep. (2010)Chad (2004)Central African Republic (2010)Burundi (2010) Burkina Faso (2010)Benin (2006)
UrbanMedian: 45.9
RuralMedian: 90.7
UrbanMedian: 255
RuralMedian: 531
UrbanMedian: 16.2
RuralMedian: 30.6
UrbanMedian: 54.9
RuralMedian: 79.7
100 80 60 40 20 0 20 40 60 80 100
YemenNepalMyanmarLao PDRCambodiaBhutanBangladeshAfghanistanVanuatuTuvaluTimor-LesteSolomon IslandsSao Tome and PrincipeKiribatiComorosZambiaUgandaTogoTanzania, U.R.SudanSouth SudanSomaliaSierra LeoneSenegalRwandaNigerMozambiqueMauritaniaMaliMalawiMadagascarLiberiaLesothoHaitiGuinea-BissauGuineaGambiaEthiopiaEritreaEquatorial GuineaDjiboutiCongo, Dem. Rep.ChadCentral African RepublicBurundiBurkina FasoBeninAngola
(e) Population without access to electricity(Percentage, 2010)
1500 1000 500 0 500 1000 1500
(f) Maternal mortality ratio(per 100,000 live births, latest)
100 80 60 40 20 0 20 40 60 80 100Yemen (2006)Nepal (2011)Myanmar (2009-10)Lao PDR (2011-12)Cambodia (2012)Bhutan (2012)Bangladesh (2011)Afghanistan (2011-12)Vanuatu (2013)Tuvalu (2007)Timor-Leste (2009-10)Solomon Islands (2007)Sao Tome and Principe (2008-09)Comoros (2000)Zambia (2010)Uganda (2011)Togo (2010)Tanzania, U.R. (2010)Sudan (2010)South Sudan (2010)Somalia (2006)Sierra Leone (2010)Senegal (2010-11)Rwanda (2010-11)Niger (2012)Mozambique (2011)Mauritania (2011)Mali (2010)Malawi (2010)Madagascar (2012-13)Liberia (2007)Lesotho (2009)Haiti (2012)Guinea-Bissau (2010)Guinea (2012)Gambia (2010)Ethiopia (2011)Eritrea (2010)Congo, Dem. Rep. (2010)Chad (2010)Central African Republic (2010)Burundi (2010)Burkina Faso (2010)Benin (2011-12)Angola (2008-09)
(g) Non-attendance of primary school(Percentage, latest)
100 80 60 40 20 0 20 40 60 80 100Yemen (2006)Nepal (2011)Myanmar (2009-10)Lao PDR (2011-12)Cambodia (2010)Bhutan (2010)Afghanistan (2011-12)Vanuatu (2013)Timor-Leste (2009-10)Solomon Islands (2007)Sao Tome and Principe (2008-09)Zambia (2010)Uganda (2011)Togo (2010)Tanzania, U.R. (2010)Sudan (2010)South Sudan (2010)Somalia (2006)Sierra Leone (2010)Senegal (2010-11)Rwanda (2010-11)Niger (2012)Mozambique (2011)Mauritania (2011)Mali (2010)Malawi (2010)Madagascar (2008-09)Liberia (2007)Lesotho (2009)Haiti (2012)Guinea-Bissau (2010)Guinea (2012)Gambia (2010)Congo, Dem. Rep. (2010)Djibouti (2006)Chad (2010)Central African Republic (2010)Burundi (2010)Burkina Faso (2010)Benin (2011-12)Angola (2008-09)
(h) Non-attendance of secondary school(Percentage, latest)
Chad, 1 882
Somalia, 2 276
Sources: (a)-(e): World Bank, World Development Indicators database (http://databank.worldbank.org/data/views/variableselection/select-variables.aspx?source=world-development-indicators), accessed January 2015.
(f): Scheil-Adlung (2015), Statistical Annex, pp 45-51. The dotted lines represent the SDG target level (70). (g)-(h): UNICEF, Survey Data on Primary Net Attendance Rate (http://www.data.unicef.org/education/primary) and Survey Data on
Secondary Net Attendance Rate (http://www.data.unicef.org/education/secondary).
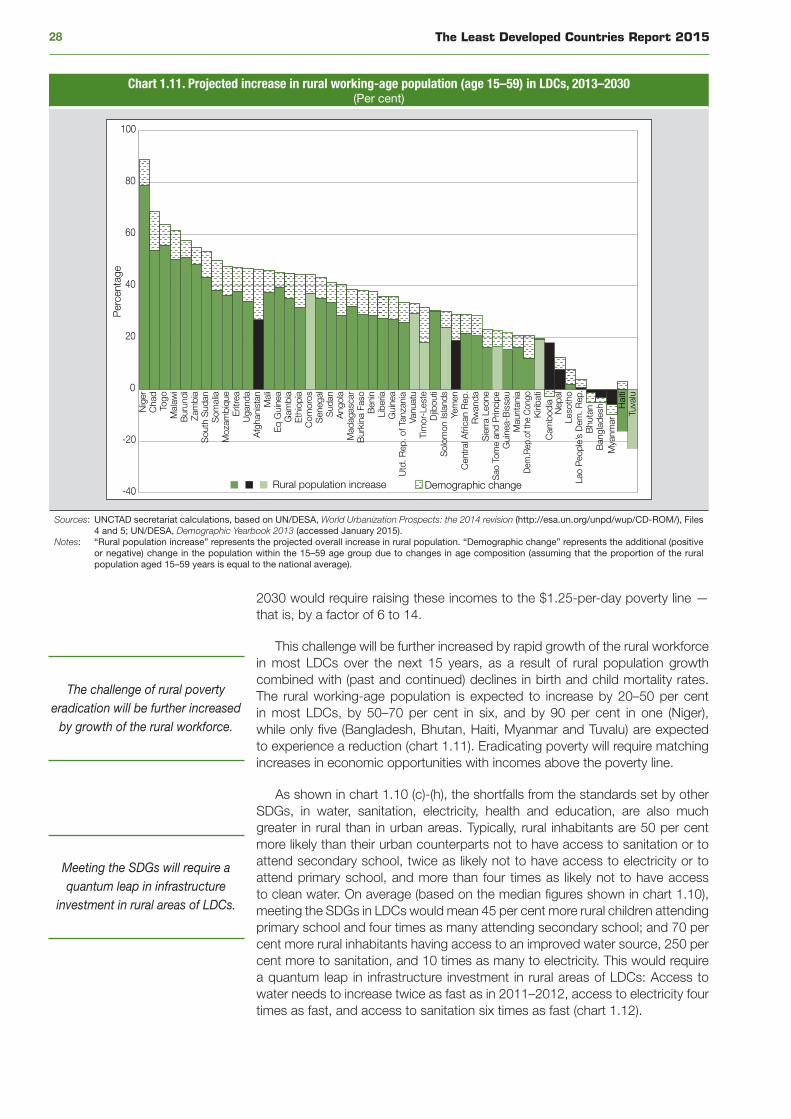
The Least Developed Countries Report 201528
Chart 1.11. Projected increase in rural working-age population (age 15–59) in LDCs, 2013–2030(Per cent)
-40
-20
0
20
40
60
80
100N
iger
Cha
dTo
goM
alaw
iB
urun
diZa
mbi
aS
outh
Sud
anS
omal
iaM
ozam
biqu
eE
ritre
aU
gand
aA
fgha
nist
anM
ali
Eq
Gui
nea
Gam
bia
Eth
iopi
aC
omor
osS
eneg
alS
udan
Ang
ola
Mad
agas
car
Bur
kina
Fas
oB
enin
Libe
riaG
uine
aU
td. R
ep. o
f Tan
zani
aVa
nuat
uTi
mor
-Les
teD
jibou
tiS
olom
on Is
land
sYe
men
Cen
tral
Afri
can
Rep
.R
wan
daS
ierr
a Le
one
Sao
Tom
e an
d P
rinci
peG
uine
a-B
issa
uM
aurit
ania
Dem
.Rep
.of t
he C
ongo
Kiri
bati
Cam
bodi
aN
epal
Leso
tho
Lao
Peo
ple’
s D
em. R
ep.
Bhu
tan
Ban
glad
esh
Mya
nmar
Hai
tiTu
valu
Rural population increase Demographic change
Per
cent
age
Sources: UNCTAD secretariat calculations, based on UN/DESA, World Urbanization Prospects: the 2014 revision (http://esa.un.org/unpd/wup/CD-ROM/), Files 4 and 5; UN/DESA, Demographic Yearbook 2013 (accessed January 2015).
Notes: “Rural population increase” represents the projected overall increase in rural population. “Demographic change” represents the additional (positive or negative) change in the population within the 15–59 age group due to changes in age composition (assuming that the proportion of the rural population aged 15–59 years is equal to the national average).
2030 would require raising these incomes to the $1.25-per-day poverty line — that is, by a factor of 6 to 14.
This challenge will be further increased by rapid growth of the rural workforce in most LDCs over the next 15 years, as a result of rural population growth combined with (past and continued) declines in birth and child mortality rates. The rural working-age population is expected to increase by 20–50 per cent in most LDCs, by 50–70 per cent in six, and by 90 per cent in one (Niger), while only five (Bangladesh, Bhutan, Haiti, Myanmar and Tuvalu) are expected to experience a reduction (chart 1.11). Eradicating poverty will require matching increases in economic opportunities with incomes above the poverty line.
As shown in chart 1.10 (c)-(h), the shortfalls from the standards set by other SDGs, in water, sanitation, electricity, health and education, are also much greater in rural than in urban areas. Typically, rural inhabitants are 50 per cent more likely than their urban counterparts not to have access to sanitation or to attend secondary school, twice as likely not to have access to electricity or to attend primary school, and more than four times as likely not to have access to clean water. On average (based on the median figures shown in chart 1.10), meeting the SDGs in LDCs would mean 45 per cent more rural children attending primary school and four times as many attending secondary school; and 70 per cent more rural inhabitants having access to an improved water source, 250 per cent more to sanitation, and 10 times as many to electricity. This would require a quantum leap in infrastructure investment in rural areas of LDCs: Access to water needs to increase twice as fast as in 2011–2012, access to electricity four times as fast, and access to sanitation six times as fast (chart 1.12).
The challenge of rural poverty eradication will be further increased
by growth of the rural workforce.
Meeting the SDGs will require a quantum leap in infrastructure
investment in rural areas of LDCs.
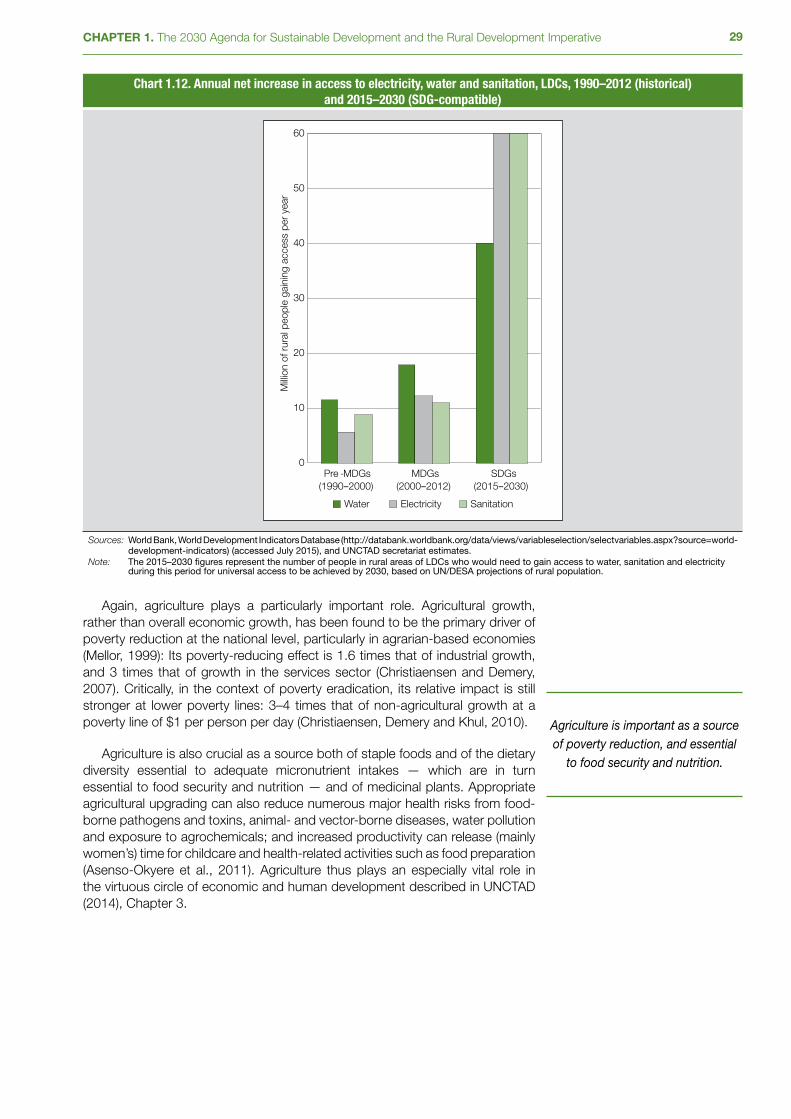
29CHAPTER 1. The 2030 Agenda for Sustainable Development and the Rural Development Imperative
Chart 1.12. Annual net increase in access to electricity, water and sanitation, LDCs, 1990–2012 (historical) and 2015–2030 (SDG-compatible)
0
10
20
30
40
50
60
Pre -MDGs (1990‒2000)
MDGs (2000‒2012)
SDGs (2015‒2030)
Milli
on o
f rur
al p
eopl
e ga
inin
g ac
cess
per
yea
r
Water Electricity Sanitation
Sources: World Bank, World Development Indicators Database (http://databank.worldbank.org/data/views/variableselection/selectvariables.aspx?source=world-development-indicators) (accessed July 2015), and UNCTAD secretariat estimates.
Note: The 2015–2030 figures represent the number of people in rural areas of LDCs who would need to gain access to water, sanitation and electricity during this period for universal access to be achieved by 2030, based on UN/DESA projections of rural population.
Again, agriculture plays a particularly important role. Agricultural growth, rather than overall economic growth, has been found to be the primary driver of poverty reduction at the national level, particularly in agrarian-based economies (Mellor, 1999): Its poverty-reducing effect is 1.6 times that of industrial growth, and 3 times that of growth in the services sector (Christiaensen and Demery, 2007). Critically, in the context of poverty eradication, its relative impact is still stronger at lower poverty lines: 3–4 times that of non-agricultural growth at a poverty line of $1 per person per day (Christiaensen, Demery and Khul, 2010).
Agriculture is also crucial as a source both of staple foods and of the dietary diversity essential to adequate micronutrient intakes — which are in turn essential to food security and nutrition — and of medicinal plants. Appropriate agricultural upgrading can also reduce numerous major health risks from food-borne pathogens and toxins, animal- and vector-borne diseases, water pollution and exposure to agrochemicals; and increased productivity can release (mainly women’s) time for childcare and health-related activities such as food preparation (Asenso-Okyere et al., 2011). Agriculture thus plays an especially vital role in the virtuous circle of economic and human development described in UNCTAD (2014), Chapter 3.
Agriculture is important as a source of poverty reduction, and essential
to food security and nutrition.
The Least Developed Countries Report 201530
F. Sustainable poverty eradication and poverty-oriented structural transformation
The massive acceleration in rural development needed to achieve the SDGs signals a need for a major shift in the goals of development strategies. Under the current economic growth model, poverty reduction has been limited in most LDCs, as shown in chart 1.2; as noted above, poverty has in most cases declined even more slowly in rural than in urban areas; and infrastructure investment has been a fraction of that needed to achieve the SDGs.
At the centre of development strategies for economically sustainable poverty eradication is structural transformation, combining increased productivity within sectors with a shift of productive resources between sectors and activities, from those with lower productivity to those with higher productivity. Its absence has been a key factor in the inability of most LDCs to meet most MDG targets (UNCTAD, 2014, Chapter 4).
While it is unlikely that poverty can be eradicated entirely without the use of income transfers to the last few poor households in order to raise them above the poverty line (in the manner of benefits systems in developed countries), the sheer scale of poverty in most LDCs means that such transfers cannot be the main driver of poverty reduction. Besides the issues of economic and financial sustainability, the logistical problems and costs would be formidable: Financial transfers on an adequate scale to eradicate poverty would require countries with very limited public resources and administrative infrastructure to make payments, regularly and consistently, to hundreds of millions of people, many of them in the most remote, inaccessible and in some cases conflict-affected areas. The logistical challenges of such transfers should be progressively eased in the coming years through mobile phone payment (“M-money”) systems, as access to mobile phones becomes wider, but those in greatest need are likely to be reached the last. Even then, it would be essential to reduce poverty sufficiently to limit the scale of the transfers required to a feasible level.
Hence, the main driver of poverty eradication will need to be increases in primary incomes, from employment or other economic activity. To be economically sustainable, these incomes must be matched by higher productivity, which will require structural transformation on a considerable scale.
Sustainable poverty eradication, however, requires a particular kind of poverty-oriented structural transformation (POST). It must simultaneously:
• Increase the overall level of labour productivity, as a basis for a sustained development process;
• Provide productive employment and economic opportunities for the entire economically active population;
• Increase the lowest levels of labour productivity to a level sufficient to generate an income above the poverty line, even for those households with the highest dependency ratios; and
• Ensure that such increases in productivity are fully translated into higher household incomes.
This requires the minimum level of labour productivity to be sufficient to generate an income level above the poverty line even for those households with the highest proportion of dependents, taking account of the share of value added accruing to capital (for those in employment) and taxation. For a poverty
At the centre of development strategies for economically
sustainable poverty eradication is structural transformation.
Economically sustainable poverty eradication requires poverty-
oriented structural transformation, to generate incomes above the poverty
line, matched by productivity…
The sheer scale of poverty in most LDCs means that income transfers
cannot be the main driver of poverty eradication.
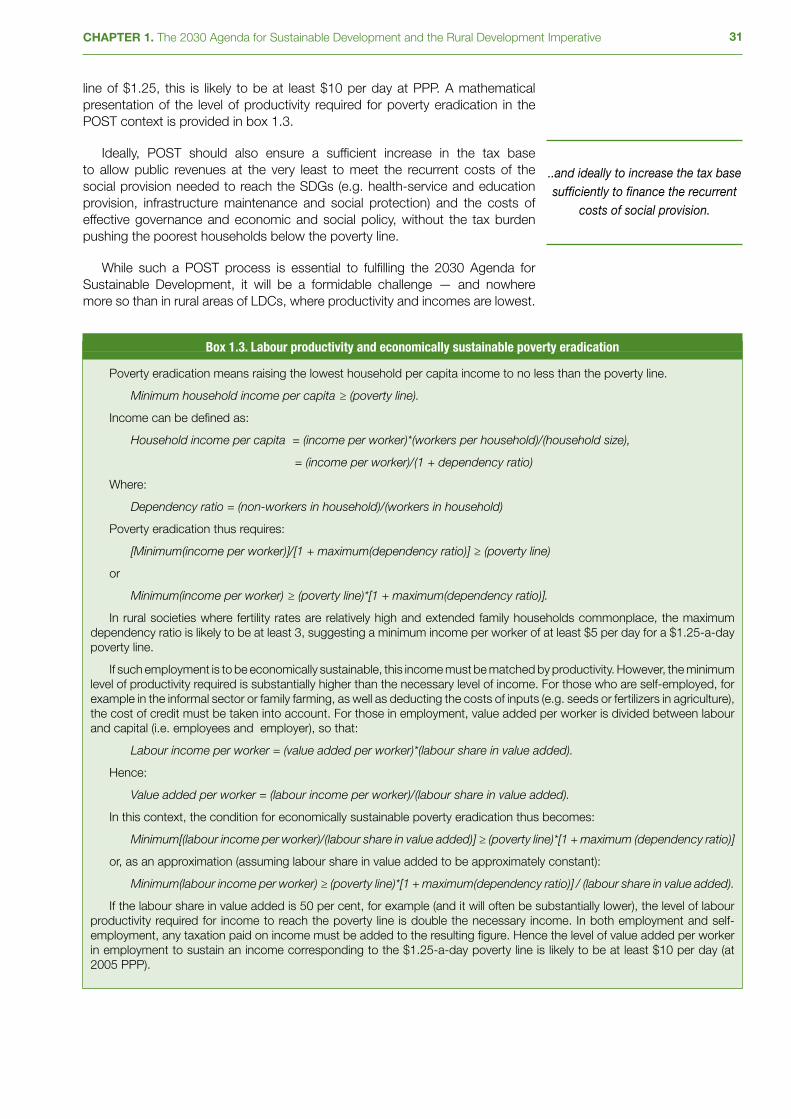
31CHAPTER 1. The 2030 Agenda for Sustainable Development and the Rural Development Imperative
line of $1.25, this is likely to be at least $10 per day at PPP. A mathematical presentation of the level of productivity required for poverty eradication in the POST context is provided in box 1.3.
Ideally, POST should also ensure a sufficient increase in the tax base to allow public revenues at the very least to meet the recurrent costs of the social provision needed to reach the SDGs (e.g. health-service and education provision, infrastructure maintenance and social protection) and the costs of effective governance and economic and social policy, without the tax burden pushing the poorest households below the poverty line.
While such a POST process is essential to fulfilling the 2030 Agenda for Sustainable Development, it will be a formidable challenge — and nowhere more so than in rural areas of LDCs, where productivity and incomes are lowest.
Box 1.3. Labour productivity and economically sustainable poverty eradication
Poverty eradication means raising the lowest household per capita income to no less than the poverty line.
Minimum household income per capita ≥ (poverty line).
Income can be defined as:
Household income per capita = (income per worker)*(workers per household)/(household size),
= (income per worker)/(1 + dependency ratio)
Where:
Dependency ratio = (non-workers in household)/(workers in household)
Poverty eradication thus requires:
[Minimum(income per worker)]/[1 + maximum(dependency ratio)] ≥ (poverty line)
or
Minimum(income per worker) ≥ (poverty line)*[1 + maximum(dependency ratio)].
In rural societies where fertility rates are relatively high and extended family households commonplace, the maximum dependency ratio is likely to be at least 3, suggesting a minimum income per worker of at least $5 per day for a $1.25-a-day poverty line.
If such employment is to be economically sustainable, this income must be matched by productivity. However, the minimum level of productivity required is substantially higher than the necessary level of income. For those who are self-employed, for example in the informal sector or family farming, as well as deducting the costs of inputs (e.g. seeds or fertilizers in agriculture), the cost of credit must be taken into account. For those in employment, value added per worker is divided between labour and capital (i.e. employees and employer), so that:
Labour income per worker = (value added per worker)*(labour share in value added).
Hence:
Value added per worker = (labour income per worker)/(labour share in value added).
In this context, the condition for economically sustainable poverty eradication thus becomes:
Minimum[(labour income per worker)/(labour share in value added)] ≥ (poverty line)*[1 + maximum (dependency ratio)]
or, as an approximation (assuming labour share in value added to be approximately constant):
Minimum(labour income per worker) ≥ (poverty line)*[1 + maximum(dependency ratio)] / (labour share in value added).
If the labour share in value added is 50 per cent, for example (and it will often be substantially lower), the level of labour productivity required for income to reach the poverty line is double the necessary income. In both employment and self-employment, any taxation paid on income must be added to the resulting figure. Hence the level of value added per worker in employment to sustain an income corresponding to the $1.25-a-day poverty line is likely to be at least $10 per day (at 2005 PPP).
..and ideally to increase the tax base sufficiently to finance the recurrent
costs of social provision.
The Least Developed Countries Report 201532
G. The SDGs and opportunities for rural development
As well as changing the goals of development strategies, the SDGs signal a major change in the context in which they will operate, especially in rural areas. As discussed in UNCTAD (2014, pp. 116–117), a coherent approach to the SDGs must take account of the implications of a “post-2015 world” — that is, of the changes in national policies and donor priorities entailed by a proactive pursuit of the SDGs. This change in context implies the opportunity as well as the need for a different model of development.
There are three main aspects to this contextual change. First, the considerable increase in infrastructure investment called for by the SDGs will have major implications for the availability of infrastructure and production factors essential to production, most notably electricity (UNCTAD, 2014, box 5, p. 133), but also water and (in the longer term) human capital. Coupled with increased potential labour productivity over time as a result of improved nutrition and health, improved transport infrastructure, increased investment in agricultural infrastructure and increased access to information and communication technologies (ICTs), this has the potential to transform the rural economic environment for both agricultural and non-agricultural production.
Second, if the additional infrastructure investment is based on labour-intensive construction methods and local procurement, it can also be expected to generate a substantial increase in the demand for labour and locally produced inputs (e.g. construction materials) and services. Economic infrastructure not explicitly included in the SDGs but necessary to poverty eradication would add to this effect; and increasing access to education and health services is more likely in rural areas than in towns to entail the construction of new facilities rather than the scaling-up of existing facilities. This would provide a considerable boost to non-agricultural income opportunities over several years.
Third, the widespread and severe poverty in rural areas in most LDCs, as shown in chart 1.10 (a) and (b), means that poverty eradication would require major increases in incomes up to the $1.25-a-day level. This has important implications for both the rate and the pattern of demand growth, in particular accelerating demand growth for those goods purchased by poor households as their incomes rise. Such goods typically include staple foods among the poorest households; higher-value foods (vegetables, vegetable oils, fruit, meat and fish), as households upgrade and diversify their diets; and basic household goods and services.
Thus, assuming that the SDGs are matched at least in part by appropriate actions nationally and internationally, this would give rise to a considerable, and very favourable, change in the context of rural economic development. Achieving rural economic transformation, and hence sustainable poverty eradication, requires development strategies to exploit to the fullest the opportunities offered by such a “post-2015 world”. Equally, existing evidence and past experiences need to be interpreted carefully in the light of this changed context and the new goals of the post-2015 period.
The SDGs also signal a major change in the context for development strategies.
Accelerated poverty reduction should increase demand for staple and higher-value foods and basic household goods and services.
…and can also generate a substantial increase in demand for labour and locally produced inputs
and services.
Increased infrastructure investment will increase the availability of infrastructure and essential
services…
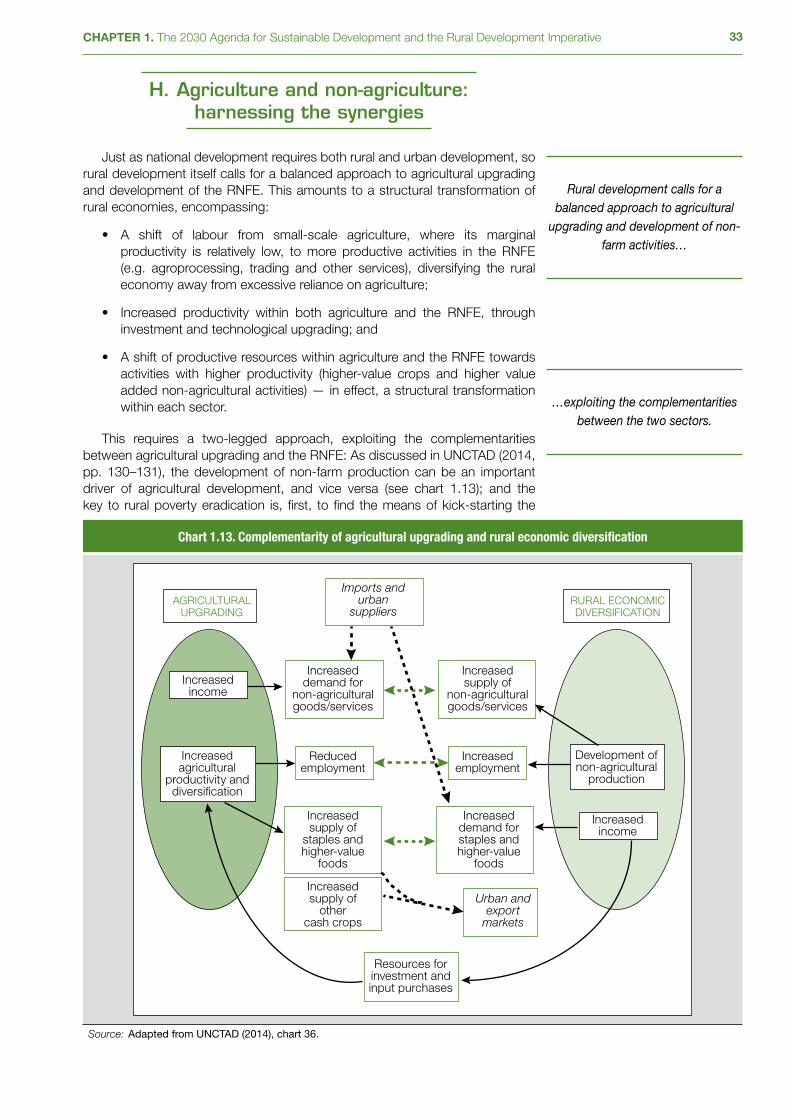
33CHAPTER 1. The 2030 Agenda for Sustainable Development and the Rural Development Imperative
H. Agriculture and non-agriculture: harnessing the synergies
Just as national development requires both rural and urban development, so rural development itself calls for a balanced approach to agricultural upgrading and development of the RNFE. This amounts to a structural transformation of rural economies, encompassing:
• A shift of labour from small-scale agriculture, where its marginal productivity is relatively low, to more productive activities in the RNFE (e.g. agroprocessing, trading and other services), diversifying the rural economy away from excessive reliance on agriculture;
• Increased productivity within both agriculture and the RNFE, through investment and technological upgrading; and
• A shift of productive resources within agriculture and the RNFE towards activities with higher productivity (higher-value crops and higher value added non-agricultural activities) — in effect, a structural transformation within each sector.
This requires a two-legged approach, exploiting the complementarities between agricultural upgrading and the RNFE: As discussed in UNCTAD (2014, pp. 130–131), the development of non-farm production can be an important driver of agricultural development, and vice versa (see chart 1.13); and the key to rural poverty eradication is, first, to find the means of kick-starting the
Chart 1.13. Complementarity of agricultural upgrading and rural economic diversification
AGRICULTURALUPGRADING
RURAL ECONOMICDIVERSIFICATION
Increasedincome
Increasedincome
Reducedemployment
Increasedagricultural
productivity anddiversi�cation
Development ofnon-agricultural
production
Resources forinvestment andinput purchases
Increaseddemand for
non-agriculturalgoods/services
Imports andurban
suppliers
Urban andexport
markets
Increasedsupply of
staples andhigher-value
foods
Increasedsupply of
othercash crops
Increasedemployment
Increasedsupply of
non-agriculturalgoods/services
Increaseddemand forstaples andhigher-value
foods
Source: Adapted from UNCTAD (2014), chart 36.
Rural development calls for a balanced approach to agricultural
upgrading and development of non-farm activities…
…exploiting the complementarities between the two sectors.
The Least Developed Countries Report 201534
process, and second, to harness the synergies between agriculture and the RNFE to maximum effect (issues addressed in Chapter 5).
Increasing non-agricultural income is important to generate growing demand as agricultural output rises, particularly where links to urban markets are limited. Since the demand for agricultural produce is generally price inelastic, an increase in production results in a greater reduction in prices, so that the benefits accrue to consumers rather than producers (Evenson and Gollin, 2003; Minten and Barrett, 2008). Increasing income through the development of non-farm production can limit this effect by generating a matching increase in demand, including for higher-value crops, as households upgrade and diversify their diets. The development of agricultural processing and packaging can also facilitate access to urban markets by making agricultural produce more readily transportable.
Equally, agricultural upgrading can support the development of non-farm production in rural areas both by increasing demand (for agricultural inputs and consumer goods) and by stimulating downstream activities, such as processing and packaging of agricultural produce (de Janvry and Sadoulet, 2009; Lanjouw and Lanjouw, 1995; 2001). Demand linkages are of particular importance in generating additional non-agricultural employment (Mellor, 1999; Thirtle, Lin and Piesse, 2003; Tiffin and Irz, 2006). This circular relationship between agricultural and the RNFE, each generating demand for the other’s outputs, gives rise to a multiplier effect, typically on the order of 1.6–1.8 in Asia and 1.3–1.5 in sub-Saharan Africa (Haggblade, Hazell and Dorosh, 2007). This is potentially a vital tool for rural poverty eradication.
Another key linkage is investment. In the absence of functioning credit markets in most rural areas in LDCs, investment — whether in agriculture or the RNFE — is dependent primarily on surplus income. This provides an additional link between agricultural upgrading and non-agricultural activities: Farm households with surplus labour but limited financial resources can earn additional income from off-farm activities to invest in purchased inputs, and non-farm activities provide investment opportunities for farm households with surplus income.
Complementarities in employment are equally important. Agricultural labour demand is highly seasonal, so that there may be surplus labour for much of the year even where agricultural production is constrained by labour shortages at peak (harvest and planting) seasons. Non-farm activities can thus provide additional incomes in seasons of lower labour demand without pushing up wages, as well as absorbing surplus labour shed by small farms as productivity is increased. At the same time, given the time lags in developing a viable non-farm sector, small farms provide a means of subsistence for household members until they are able to move into non-agricultural activities or during the start-up phase of non-farm enterprises (Hazell et al., 2007).
As in the context of rural-urban migration, the key to successful RNFE development is to shift from a process driven by “push” factors — primarily, the necessity of supplementing inadequate farm incomes — to one driven by the “pull” of new and economically attractive non-farm opportunities. “Push” factors result in a proliferation of suppliers in activities with very low entry barriers (minimal need for capital, education, skills, etc.), which are generally also characterized by low incomes and productivity; and the resulting oversupply depresses incomes still further. Successful rural development simultaneously reduces “push” pressures, by raising agricultural incomes, while generating more productive non-farm income opportunities through the creation of viable non-farm enterprises.
Increasing non-farm income generates demand for agricultural
produce, as does increasing agricultural income for non-farm
goods and services.
The key to successful development of non-farm activities is to shift from a process driven by "push" factors
to one driven by "pull" factors.
Non-farm activities can provide additional incomes in seasons of low agricultural labour demand,
without worsening seasonal labour shortages.
Each sector can also provide surplus income for investment in the other.
35CHAPTER 1. The 2030 Agenda for Sustainable Development and the Rural Development Imperative
Within the agricultural sector, two types of crop are of particular significance to farm/non-farm synergies in the post-2015 context:
• Maintaining a reliable supply of staple food crops is essential both to increasing production of higher-value crops and to promoting RNFE activities: Households will be deterred from shifting their own production to crops for sale or non-agricultural goods and services unless they are confident that there will be a reliable supply of staple foods. This means both maintaining an adequate supply and ensuring functioning markets.
• In the context of global efforts to tackle climate change, there may be considerable potential for the development of biofuel crops, providing opportunities both for higher-value agricultural production and for local processing, as well as limiting carbon emissions and reducing the need for imported fossil fuels.
I. Summary and conclusions
In summary:
• The LDCs are the battleground on which the 2030 Agenda will be won or lost: This is where shortfalls from the SDGs are greatest and improving most slowly, and where the barriers to further progress are highest.
• Rural development is the key: Most people in most LDCs live in rural areas, and shortfalls from the SDG targets are much greater than in urban areas.
• Achieving the SDGs in rural areas of LDCs will require a quantum leap in the rate of progress compared with the MDG period (2000–2015).
• The 2030 Agenda entails both new goals and a new context, providing an opportunity as well as a need for a new approach to rural development.
• Economically sustainable poverty eradication requires a process of poverty-oriented structural transformation, ensuring equal productive opportunities for all, with incomes above the poverty line and productivity to match.
• In rural areas, such a process requires exploiting to the fullest the synergies between agriculture and rural non-farm economies.
The remainder of the Report investigates these issues further. Chapter 2 focuses on increasing agricultural productivity, Chapter 3 on rural economic diversification and RNFE development, and Chapter 4 on the gender dimension of rural development. Chapter 5 draws on these chapters to set out policy proposals for rural development in LDCs in the context of the 2030 Agenda.
Reliable supplies of staple foods are essential, and there may be considerable potential for the development of biofuel crops.
The Least Developed Countries Report 201536
Notes1 At a late stage in the preparation of this Report, what had previously been termed the
“post-2015 development agenda” was adopted under the title the 2030 Agenda for Sustainable Development.
2 As this Report was being finalized for printing, the poverty line of $1.25 per person per day at 2005 PPP was updated to $1.90 per person per day at 2011 PPP.
3 The poverty gap combines the extent and the depth of poverty. It can most easily be defined as the proportion of people below the poverty line multiplied by their average income shortfall relative to the poverty line.
4 These projections predate the 2030 Agenda for Sustainable Development, and will be influenced by progress towards the SDGs. Reduced infant, child and maternal mortality, and increased access to reproductive health services, will have direct effects on population growth; and increased access to water, sanitation, health services and education and improved nutrition will have indirect effects, through health, mortality and fertility behaviour. However, since these effects will reduce both fertility and mortality, the net effect is ambiguous. Faster development and infrastructure provision in rural areas relative to urban areas would more clearly imply a slowdown in the rate of urbanization.
5 Travel times and costs for some localities may well vary seasonally, for example where travel is dependent on unpaved roads or water transport, which are subject to seasonal variations.
6 While female migration has increased in recent years (Ghosh, 2009), fewer women than men migrate internationally from LDCs on average, due to the persistence of gender roles that assign primary responsibility for childcare and household tasks to women (UNCTAD, 2012). Migration flows from Africa, South Asia and the Middle East tend to be more male-dominated, while flows from East Asia and the Pacific, Europe and Central Asia, and Latin America and the Caribbean tend to be more female-dominated. The intensity and stability of those flows, however, vary both between destination countries and over time (Guzmán, 2006).
References
Ancharaz V (2011). Trade, Jobs and Growth in Africa: An Empirical Investigation of the Export-led Jobless Growth Hypothesis. 3rd ICITE Regional Conference on Trade, Jobs and Inclusive Development in Africa. Gammarth, Tunisia. 22 September.
Asenso-Okyere K et al. (2011). Understanding the Interaction between Farm Labor Productivity, and Health and Nutrition: a Survey of the Evidence. Journal of Development and Agricultural Economics. 3(3):80–90. March.
Christiaensen L and L Demery (2007). Down to Earth: Agriculture and Poverty Reduction in Africa. World Bank. Washington, D.C.
Christiaensen L, L Demery and J Kuhl (2010). The (Evolving) Role of Agriculture in Poverty Reduction: an Empirical Perspective. Working Paper 2010/36. World Institute for Development Economics Research, Helsinki.
Christiaensen L and Y Todo (2014). Poverty Reduction during the Rural–Urban Transformation — The Role of the Missing Middle. World Development 63:42–58. November.
Deere CD (2005). The Feminization of Agriculture? Economic Restructuring in Rural Latin America. United Nations Research Institute for Social Development. Geneva.
de Janvry A and E Sadoulet (2009). Agricultural Growth and Poverty Reduction: Additional Evidence. The World Bank Research Observer. 25:1–20.
Evenson R and D Gollin (2003). Crop Variety Improvement and its Effect on Productivity: the Impact of International Agricultural Research. Centre for Agriculture and Biosciences International. Wallingford, UK.
Felipe J, A Mehta and C Rhee (2014). Manufacturing Matters... but it’s the Jobs that Count. ADB Economics Working Paper Series 420. Asian Development Bank. Manila. November.
Fields GS (1972). Rural-Urban Migration, Urban Unemployment and Underemployment, and Job Search Activity in LDCs. US Agency for International Development. Washington, D.C. December. Available from http://digitalcommons.ilr.cornell.edu/cgi/viewcontent.cgi?article=1054&context=reports.
Ghosh J (2009). Migration and Gender Empowerment: Recent Trends and Emerging Issues. Human Development Research Paper 2009/04. United Nations Development Programme.
Guzmán J (2006). Trends in International Migration: is there a Feminization of Migration Flows? Unpublished study. PREM Gender and Development Group (PRMGE). World Bank, Washington D.C.
37CHAPTER 1. The 2030 Agenda for Sustainable Development and the Rural Development Imperative
Haggblade S, P Hazell and P Dorosh (2007). Sectoral Growth Linkages between Agriculture and the Rural Nonfarm Economy. In: Haggblade S et al., eds. Transforming the Rural Nonfarm Economy: Opportunities and Threats in the Developing World. Johns Hopkins University Press. Baltimore: 141–182.
Haggblade S, P Hazell and T Reardon (2007a). Introduction. In: Haggblade S et al., eds. Transforming the Rural Nonfarm Economy: Opportunities and Threats in the Developing World. Johns Hopkins University Press. Baltimore: 3–24.
Haggblade S, P Hazell and T Reardon (2007b). Research Perspectives and Prospectives on the Rural Nonfarm Economy. In: Haggblade S et al., eds. Transforming the Rural Nonfarm Economy: Opportunities and Threats in the Developing World. Johns Hopkins University Press. Baltimore: 381–395.
Harris J and M Todaro (1970). Migration, Unemployment and Development: A Two-Sector Analysis. The American Economic Review. 60(1):126–142.
Hazell P, C Poulton, S Wiggins and A Dorward (2007). The Future of Small Farms for Poverty Reduction and Growth. 2020 Discussion Paper 42, Washington, DC: International Food Policy Research Institute.
Lanjouw J and P Lanjouw (1995). Rural Nonfarm Employment: a Survey. Policy Research Working Paper 1463. World Bank. Washington, D.C.
Lanjouw J and P Lanjouw (2001). The Rural Non-Farm Sector: Issues and Evidence from Developing Countries. Agricultural Economics. 26:1–23.
Lastarria-Cornhiel S (2006). Feminization of Agriculture: Trends and Driving Forces. Background paper for the World Development Report 2008.
Losch B, S Fréguin-Gresh and E White (2012). Structural Transformation and Rural Change Revisited: Challenges for Late Developing Countries in a Globalizing World. African Development Forum series. World Bank. Washington, D.C.
Mellor J (1999). Faster, More Equitable Growth: the Relation between Growth in Agriculture and Poverty Reduction. Agricultural Policy Development Project Research Report 4. Abt Associates Inc. Cambridge, MA. October.
Minten B and C Barrett (2008). Agricultural Technology, Productivity and Poverty Reduction in Madagascar. World Development. 36:797–822.
Ravallion M (2014). Are the World’s Poorest Being Left Behind? NBER Working Paper 20791. National Bureau of Economic Research. Cambridge, MA. December. Available from http://www.nber.org/papers/w20791.pdf.
Ravallion M, S Chen and P Sangraula (2007). New Evidence on the Urbanization of Global Poverty. Population and Development Review. 33(4):667–701.
Rodrik D (2014). An African Economic Miracle? NBER Working Paper 20188. National Bureau of Economic Research. Cambridge, MA. June. Available from http://www.nber.org/papers/w20188.pdf.
Scheil-Adlung X (2015). Global Evidence on Inequities in Rural Health Protection: New Data on Rural Deficits in Health Coverage for 174 Countries. ESS Document 47. Extension of Social Security. International Labour Organization. Geneva.
Thirtle C, L Lin and J Piesse (2003). The Impact of Research-Led Agricultural Productivity Growth on Poverty Reduction in Africa, Asia and Latin America. World Development. 31:1959–1975.
Tiffin R and X Irz (2006). Is Agriculture the Engine of Growth? Agricultural Economics. 35:79–89.
Todaro M (1976). Urban Job Expansion, Induced Migration and Rising Unemployment: A Formulation and Simplified Empirical Test for LDCs. Journal of Development Economics. 3(3):211–225.
UNCTAD (2012). The Least Developed Countries Report 2012: Harnessing Remittances and Diaspora Knowledge to Build Productive Capacities. United Nations publication. Sales No. E.12.II.D.18. New York and Geneva.
UNCTAD (2013). The Least Developed Countries Report 2013: Growth with Employment for Inclusive and Sustainable Development. United Nations publication. Sales No. E.13.II.D.1. New York and Geneva.
UNCTAD (2014). The Least Developed Countries Report 2014: Growth with Structural Transformation: A Post-2015 Development Agenda. United Nations publication. Sales No. E.14.II.D.7. New York and Geneva.
UN/DESA (2013). Demographic Yearbook 2013. United Nations Department for Economic and Social Affairs. New York. Available from http://unstats.un.org/unsd/demographic/products/dyb/dyb2013.htm.
UN/DESA (2014). World Urbanization Prospects: the 2014 revision. Available from http://esa.un.org/unpd/wup/CD-ROM/.
UNECE, Eurostat, FAO, OECD, World Bank (2007) Rural Households’ Livelihood and Well-being: Statistics on Rural Development and Agricultural Household Income. United Nations. New York.
Wodon Q (1999). Growth, Poverty and Inequality: a Regional Panel for Bangladesh. Policy Research Working Paper 2072. World Bank. Washington, D.C.


2CHAPTER
agRicultuRal pRoductivity: developments, deteRminants
and impacts

The Least Developed Countries Report 201540
A. Introduction
The level and growth of agricultural productivity are critical both to the well-being of the population of the least developed countries (LDCs) and to the structural transformation of their economies.1 They are major determinants of poverty and of the income gap that separates them from other developing countries (ODCs) and developed countries, and play an essential role in the processes of rural structural transformation and development and in strengthening the rural non-farm economy (RNFE).
This chapter analyses the dynamics of agricultural productivity in LDCs and its determinants. It is organized as follows: Section B explains the multiple channels through which agricultural productivity affects well-being, poverty, structural transformation, and economic and social development; Section C presents recent trends in the level and growth of different aspects of agricultural productivity in LDCs; Section D examines the key determinants of these levels and trends; and Section E summarizes the chapter.
B. The crucial importance of agricultural productivity
The level and dynamics of agricultural productivity affect well-being, structural transformation and development in LDCs (Gollin, 2010; Johnston and Mellor, 1961).
Poverty and well-being. Since agriculture is the dominant (and in some countries increasingly dominant) source of employment in LDCs (Chapter 1 of this Report), agricultural productivity is in most cases the main determinant of the incomes of the majority of the workforce. Low productivity in agriculture is thus a major reason for the prevalence and persistence of poverty in most LDCs, keeping much of the rural population trapped in a vicious circle of poverty, in which poverty results in undernutrition, poor health, poor cognitive development and limited adoption of new technologies, which in turn lead to low productivity and low earnings (chart 2.1). Agricultural productivity growth is therefore an essential precondition for poverty reduction in the short and medium term, contributing through several channels (box 2.1).
Food prices. Rising agricultural productivity helps to lower food prices, effectively raising real rural and urban wages, since food is a major component of wage goods, and benefiting landless and other rural food-deficit households (Block, 2010; Sahn, Dorosh and Younger, 1999). By limiting increases in agricultural prices, this also prevents rural-urban terms of trade from turning against urban activities, which might otherwise stall the process of structural transformation (Lewis, 1954).
Food security and hunger. “Food security exists when all people, at all times, have physical and economic access to sufficient, safe and nutritious food to meet their dietary needs and food preferences for an active and healthy life” (World Food Summit, 1996). According to the Food and Agriculture Organization of the United Nations (FAO), this definition covers four dimensions of food security: physical availability of food, economic and physical access to food, meeting nutritional requirements, and stability of these three aspects over time (Stamoulis and Zezza, 2003). These four dimensions are directly or indirectly influenced by the level of agricultural productivity. As well as reducing poverty and food prices, rising agricultural productivity helps to increase and stabilize
The level and growth of agricultural productivity are critical to the well-
being of the population of the LDCs.
Agricultural productivity is the major determinant of the income gap that separates LDCs from other
developing countries and developed countries.
Low productivity in agriculture is a major reason for the prevalence and persistence of poverty in most
LDCs.
Rising agricultural productivity helps to raise real rural and urban wages.
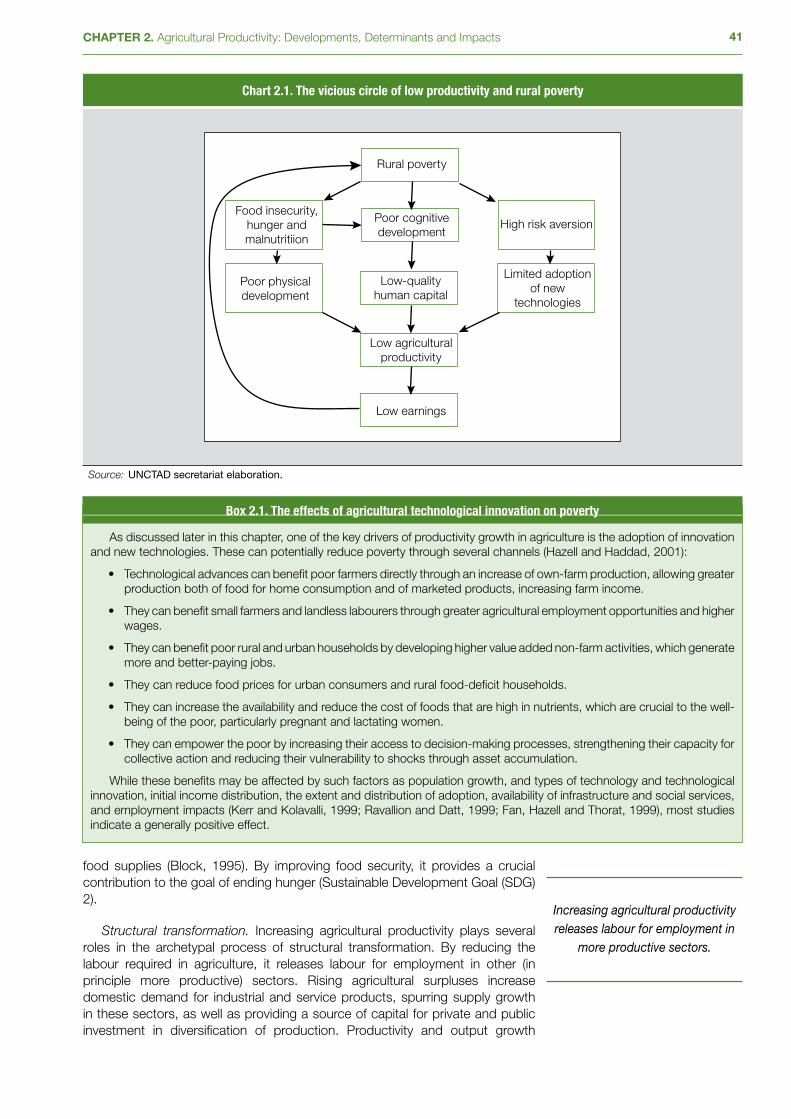
41CHAPTER 2. Agricultural Productivity: Developments, Determinants and Impacts
Chart 2.1. The vicious circle of low productivity and rural poverty
Rural poverty
Poor cognitivedevelopment
Poor physicaldevelopment
Food insecurity,hunger andmalnutritiion
Limited adoptionof new
technologies
Low-quality human capital
Low agriculturalproductivity
Low earnings
High risk aversion
Source: UNCTAD secretariat elaboration.
Box 2.1. The effects of agricultural technological innovation on poverty
As discussed later in this chapter, one of the key drivers of productivity growth in agriculture is the adoption of innovation and new technologies. These can potentially reduce poverty through several channels (Hazell and Haddad, 2001):
• Technological advances can benefit poor farmers directly through an increase of own-farm production, allowing greater production both of food for home consumption and of marketed products, increasing farm income.
• They can benefit small farmers and landless labourers through greater agricultural employment opportunities and higher wages.
• They can benefit poor rural and urban households by developing higher value added non-farm activities, which generate more and better-paying jobs.
• They can reduce food prices for urban consumers and rural food-deficit households.
• They can increase the availability and reduce the cost of foods that are high in nutrients, which are crucial to the well-being of the poor, particularly pregnant and lactating women.
• They can empower the poor by increasing their access to decision-making processes, strengthening their capacity for collective action and reducing their vulnerability to shocks through asset accumulation.
While these benefits may be affected by such factors as population growth, and types of technology and technological innovation, initial income distribution, the extent and distribution of adoption, availability of infrastructure and social services, and employment impacts (Kerr and Kolavalli, 1999; Ravallion and Datt, 1999; Fan, Hazell and Thorat, 1999), most studies indicate a generally positive effect.
food supplies (Block, 1995). By improving food security, it provides a crucial contribution to the goal of ending hunger (Sustainable Development Goal (SDG) 2).
Structural transformation. Increasing agricultural productivity plays several roles in the archetypal process of structural transformation. By reducing the labour required in agriculture, it releases labour for employment in other (in principle more productive) sectors. Rising agricultural surpluses increase domestic demand for industrial and service products, spurring supply growth in these sectors, as well as providing a source of capital for private and public investment in diversification of production. Productivity and output growth
Increasing agricultural productivity releases labour for employment in
more productive sectors.
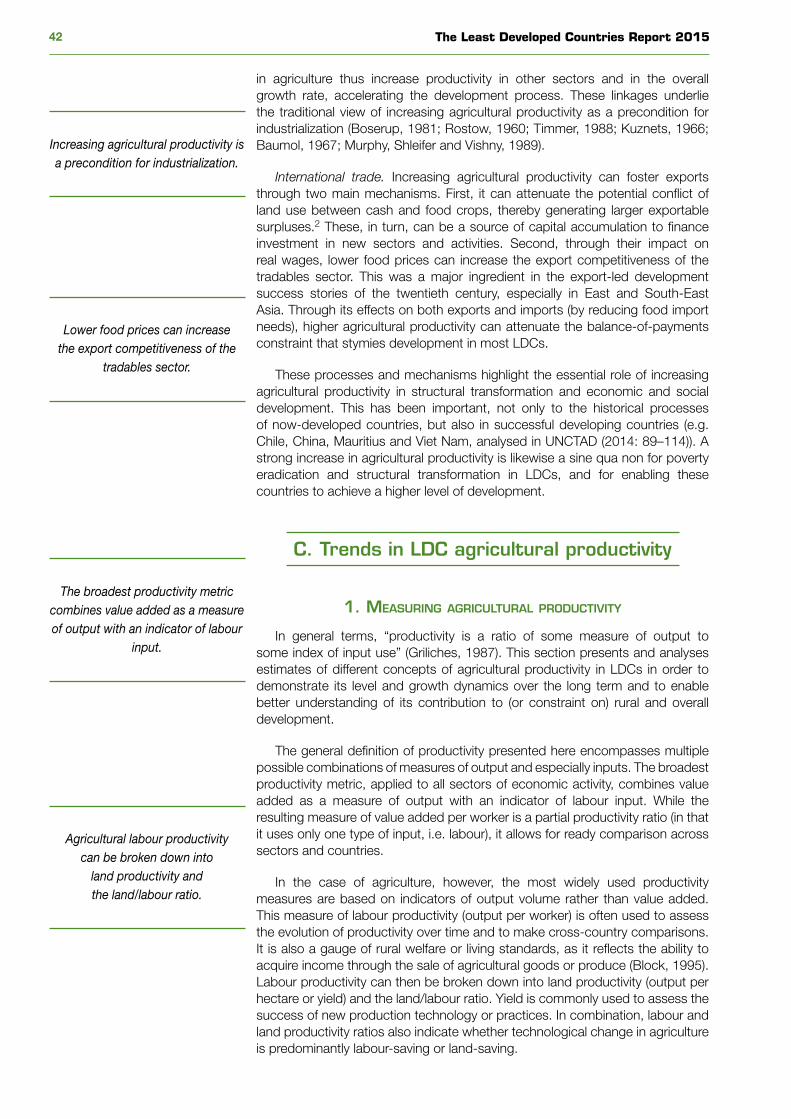
The Least Developed Countries Report 201542
in agriculture thus increase productivity in other sectors and in the overall growth rate, accelerating the development process. These linkages underlie the traditional view of increasing agricultural productivity as a precondition for industrialization (Boserup, 1981; Rostow, 1960; Timmer, 1988; Kuznets, 1966; Baumol, 1967; Murphy, Shleifer and Vishny, 1989).
International trade. Increasing agricultural productivity can foster exports through two main mechanisms. First, it can attenuate the potential conflict of land use between cash and food crops, thereby generating larger exportable surpluses.2 These, in turn, can be a source of capital accumulation to finance investment in new sectors and activities. Second, through their impact on real wages, lower food prices can increase the export competitiveness of the tradables sector. This was a major ingredient in the export-led development success stories of the twentieth century, especially in East and South-East Asia. Through its effects on both exports and imports (by reducing food import needs), higher agricultural productivity can attenuate the balance-of-payments constraint that stymies development in most LDCs.
These processes and mechanisms highlight the essential role of increasing agricultural productivity in structural transformation and economic and social development. This has been important, not only to the historical processes of now-developed countries, but also in successful developing countries (e.g. Chile, China, Mauritius and Viet Nam, analysed in UNCTAD (2014: 89–114)). A strong increase in agricultural productivity is likewise a sine qua non for poverty eradication and structural transformation in LDCs, and for enabling these countries to achieve a higher level of development.
C. Trends in LDC agricultural productivity
1. measuring agriCultural produCtivity
In general terms, “productivity is a ratio of some measure of output to some index of input use” (Griliches, 1987). This section presents and analyses estimates of different concepts of agricultural productivity in LDCs in order to demonstrate its level and growth dynamics over the long term and to enable better understanding of its contribution to (or constraint on) rural and overall development.
The general definition of productivity presented here encompasses multiple possible combinations of measures of output and especially inputs. The broadest productivity metric, applied to all sectors of economic activity, combines value added as a measure of output with an indicator of labour input. While the resulting measure of value added per worker is a partial productivity ratio (in that it uses only one type of input, i.e. labour), it allows for ready comparison across sectors and countries.
In the case of agriculture, however, the most widely used productivity measures are based on indicators of output volume rather than value added. This measure of labour productivity (output per worker) is often used to assess the evolution of productivity over time and to make cross-country comparisons. It is also a gauge of rural welfare or living standards, as it reflects the ability to acquire income through the sale of agricultural goods or produce (Block, 1995). Labour productivity can then be broken down into land productivity (output per hectare or yield) and the land/labour ratio. Yield is commonly used to assess the success of new production technology or practices. In combination, labour and land productivity ratios also indicate whether technological change in agriculture is predominantly labour-saving or land-saving.
Increasing agricultural productivity is a precondition for industrialization.
Lower food prices can increase the export competitiveness of the
tradables sector.
The broadest productivity metric combines value added as a measure of output with an indicator of labour
input.
Agricultural labour productivity can be broken down into
land productivity and the land/labour ratio.
43CHAPTER 2. Agricultural Productivity: Developments, Determinants and Impacts
The productivity estimate using the broadest aggregate of inputs is total factor productivity (TFP), which gauges the productivity of all productive inputs when used jointly. In the case of agriculture, this typically takes account of land, labour, physical capital and material inputs (especially fertilizers) employed in farm production, and compares them with the total quantity of agricultural output.
The precision of any productivity estimate inevitably depends on the quality of the statistics on which computations are based, which is a major source of concern, particularly in LDCs and in cross-country comparisons (box 2.2).
2. partial produCtivity measures
The Least Developed Countries Report 2014 provided an extensive analysis of developments in productivity in the three main sectors of economic activity (agriculture, industry and services) in LDCs, LDC subgroups and ODCs, based on value added per worker (UNCTAD, 2014: 59–88). The following analysis builds on this by updating and expanded the main findings on agricultural productivity.
• Agricultural labour productivity in LDCs is much lower than in ODCs and developed countries. While productivity in LDCs has grown by 2.2 per cent annually since 1991, this is substantially slower than in ODCs (4.2 per cent annually) and developed countries (3.9 per cent annually), so that the productivity gap has been widening over the long term. In 2011–2013, average LDC agricultural labour productivity was 18.7 per cent of that of ODCs and just 1.8 per cent that of developed countries (chart 2.2).
• The labour productivity gap between LDCs and ODCs or developed countries in agriculture is wider than that in industry and services (chart
Box 2.2. Caveats to the use of data on LDC agricultural inputs and outputs
The empirical measurement of agricultural production and agricultural input use, and hence the calculation of the sector’s productivity in LDCs, is beset by a series of difficulties, starting with the compilation of quantitative data. First, agricultural output encompasses production of multiple crops and of livestock, which are commonly measured by weight or volume. This raises the key question of how best to aggregate different agricultural products. While aggregation is sometimes based on a common unit, such as wheat equivalent (Hayami and Ruttan, 1985; Block, 1995), it more commonly uses monetary units for determining the total value of crop and livestock production at relative prices in a given base period. (Here, the Report follows FAO in using 2004–2006 as the base period.) This is referred to as “final output”, and represents the amount of agricultural output available to the rest of the economy.*
A second complication is that some part of agricultural produce is generally consumed by farming households themselves (or bartered for other products), and therefore does not enter money-based markets and is not included in market-based statistics. Third, while labour input should ideally be measured by person-hours worked, data based on measures of this nature are not generally available for LDCs, except for occasional household or agricultural surveys. Labour input is therefore measured by data on total employment in agriculture, generally based on primary occupations. Where individuals or households diversify their incomes by engaging in non-farm activities (Chapter 3 of this Report), the time they devote to agriculture is reduced; but all their working time is effectively included as agricultural employment if this remains their main occupation. Since most available statistics do not reflect time allocation, calculations based on them are likely to underestimate labour productivity.
Fourth, output and input measures draw on different databases with different geographical and time coverage, each constructed according to its own methodology, raising potential problems of consistency. Fifth, like other economic statistics from LDCs, the reliability of data on agricultural input and output data may be adversely affected by the limited capacity and resources available to the statistical institutes, ministries and departments responsible for their compilation.
Finally, statistics on both inputs and output are simple quantitative indicators, and generally do not reflect qualitative differences – for example in education or health in the case of labour input data, land fertility and soil enrichment or degradation in the case of land data, and types of machinery in measures of physical capital inputs. Failure to account for land quality, for example, may lead researchers to misattribute the associated differences in production to differences in the use of other inputs (Fulginiti and Perrin, 1997).
These limitations need to be borne in mind when analysing trends and interpreting analyses of agricultural productivity, especially in LDCs.
* In the case of LDCs and their subgroups, this measure is highly correlated with the physical production of different crops, measured in tons and simply aggregated.
The productivity estimate using the broadest aggregate of inputs is total
factor productivity.
In 2011–2013, LDC agricultural labour productivity was 18.7 per
cent of that of ODCs and just 1.8 per cent that of developed countries.
The Least Developed Countries Report 201544
Chart 2.2. Sectoral labour productivity levels: LDCs as a share of other country groups, 2011–2013 (Per cent)
18.7
1.8
28.6
4.5
24.6
2.8
0
5
10
15
20
25
30
35
ODCs Developed countries
Agriculture Industry Services
Sources: UNCTAD secretariat calculations, based on data from UNCTAD, UNCTADstat database (http://unctadstat.unctad.org/EN/), and ILO, WESO 2015 database (http://www.ilo.org/global/research/global-reports/weso/2015/lang--en/index.htm) (both accessed August 2015).
Note: Sectoral production measured by value added.
2.2). Given the strong concentration of the LDC labour force in agriculture, this wider productivity gap is the major cause of income divergence between LDCs and these other country groups.
• Among LDC subgroups, agricultural labour productivity has historically been lower in Asian LDCs than in African LDCs and Haiti,3 but has grown faster (by 3.6 per cent annually), resulting in an 88-per-cent increase between 1991–1993 and 2011–2013 in Asian LDCs, compared with a 32-per-cent increase in African LDCs and Haiti. Consequently, agricultural productivity in Asian LDCs has surpassed that of African LDCs and Haiti since 2006.4
• While agricultural labour productivity in island LDCs has historically been higher than in the other two LDC subgroups, it has been declining slowly, falling by 5 per cent between 1991–1993 and 2011–2013.
Trends in agricultural labour productivity based on output measures (rather than value added) are similar: substantially lower historically in LDCs than in ODCs, and a fraction of that in developed countries, both gaps widening continuously over the past 35 years. Labour productivity growth in ODCs has doubled to more than 3 per cent annually since the 1990s. Developed countries have experienced a similar or higher rate of growth since the 1980s. In the LDCs as a group, however, it declined during the 1980s and grew only marginally in the 1990s, so that it was only by the turn of the century that it had recovered to the level of the early 1980s. It did not start to rise more robustly (at or above 2 per cent per annum) until after 2000. LDCs’ agricultural productivity has thus diverged from that of the other two country groups since the early 1980s. In 2010–2012 it was 39.3 per cent that of ODCs and just 1.6 per cent that of developed countries (chart 2.3).
LDC aggregate figures mask sharp contrasts among the main subgroups. In African LDCs and Haiti, labour productivity shrank in the last two decades of
The labour productivity gap between LDCs and ODCs or developed
countries in agriculture is wider than that in industry and services.
Agricultural productivity in Asian LDCs has surpassed that of African
LDCs and Haiti since 2006.
LDC agricultural productivity did not start to rise more robustly until
after 2000.

45CHAPTER 2. Agricultural Productivity: Developments, Determinants and Impacts
the last century and has grown since 2000, but slowly (just above 1 per cent annually). Considering the period since the early 1990s, only three countries in the group (Benin, Central African Republic and Mali) have managed to double labour productivity. At the same time, in 11 other countries in the group (Angola, Burkina Faso, Democratic Republic of the Congo, Djibouti, Eritrea, Ethiopia, Malawi, Mozambique, Sudan, Togo and United Republic of Tanzania), productivity actually declined over the same period. Major factors impeding significant improvements in agricultural labour productivity have been the low level of rural human capital, the slow accumulation thereof in many of these countries and the low level of conventional inputs (apart from land and labour) to agricultural production. Low levels of education and literacy, and poor health, also limit technical efficiency. Island LDCs have traditionally had a higher level of labour productivity (largely explained by their small population size), but the level has declined gradually over the past 35 years (chart 2.4A).
The opposite development has taken place in Asian LDCs. After stagnating in the 1980s, agricultural labour productivity growth picked up as early as the following decade. Since 2000 it has risen at a strong pace (3.5 per cent annually), which is higher than in all ODCs and Asian ODCs (in both country groups it has grown at approximately 3 per cent per year since 2000). Asian LDCs overtook the productivity level first of the African and then of the island LDCs (Chart 2.4A). Among Asian LDCs, productivity growth since the early 1990s has been strongest in Bangladesh, Lao People’s Democratic Republic, Myanmar and Nepal, all of which succeeded in doubling (or almost doubling) labour productivity over the past quarter-century.
According to export specialization, the LDC subgroup with the highest agricultural labour productivity levels has traditionally been the fuel exporters, especially Angola, Sudan and Yemen.5 However, the strongest gains over the past 35 years have been recorded by manufactures exporters (most of which are in Asia) and mixed exporters (especially Benin, Kiribati, Lao People’s Democratic Republic, Myanmar and Sierra Leone). By contrast, the exporter groups where
Chart 2.3. Agricultural labour productivity level: LDCs as a share of other country groups, 1980–2012(Per cent)
63.3
57.6
50.3
44.542.5
40.3 39.3
3.6 3.1 2.5 2.1 1.8 1.7 1.60
10
20
30
40
50
60
70
1980–1984 1985–1989 1990–1994 1995–1999 2000–2004 2005–2009 2010–2012
Other developing countries Developed countries
Sources: UNCTAD secretariat calculations, based on data from FAO, FAOSTAT database (http://faostat.fao.org/) (accessed August 2015).Note: Production measured by final output value.
Major factors impeding significant improvements in agricultural labour
productivity have been the low level of rural human capital and the low level of conventional inputs to
agricultural production.
The strongest gains in productivity over the past 35 years have been
recorded by manufactures exporters and mixed exporters.

The Least Developed Countries Report 201546
agricultural productivity is lower and has been rising at the most sluggish pace have been services and minerals exporters (chart 2.4B).
The analysis of agricultural labour productivity can be deepened by introducing the variable of cultivated area. Output per worker can be broken down in the following way, as proposed by Hayami and Ruttan (1985):
(1)
where Y is output, A is area and L is labour.
The welfare of agricultural workers ultimately depends on increasing output per worker (Y/L), which relies on land productivity (or yield: Y/A) and the land/labour ratio (A/L). The equation above illustrates the challenge to that process in an environment characterized by rapid population growth and where the
Chart 2.4. Labour productivity in LDC agriculture, by country groups, 1980–2013
300
350
400
450
500
550
600
650
700
750
1980 1982 1984 1986 1988 1990 1992 1994 1996 1998 2000 2002 2004 2006 2008 2010 2012
African LDCs and Haiti Asian LDCs Island LDCs
A. Labour productivity level(2006-2006 international dollars / worker)
2.2
1.61.5
0.8
0.0
-0.3-0.5
0.0
0.5
1.0
1.5
2.0
2.5
Manufactures Mixed Fuels Food andagriculture
Minerals Services
B. Growth rate of labour productivity, by export specialization, 1980–2013(Annual averages, per cent)
Source: UNCTAD secretariat calculations, based on data from FAO, FAOSTAT database (http://faostat.fao.org/) (accessed August 2015).Note: Production measured by final output value.
The welfare of agricultural workers ultimately depends on increasing output per worker, which relies
on land productivity and the land/labour ratio.
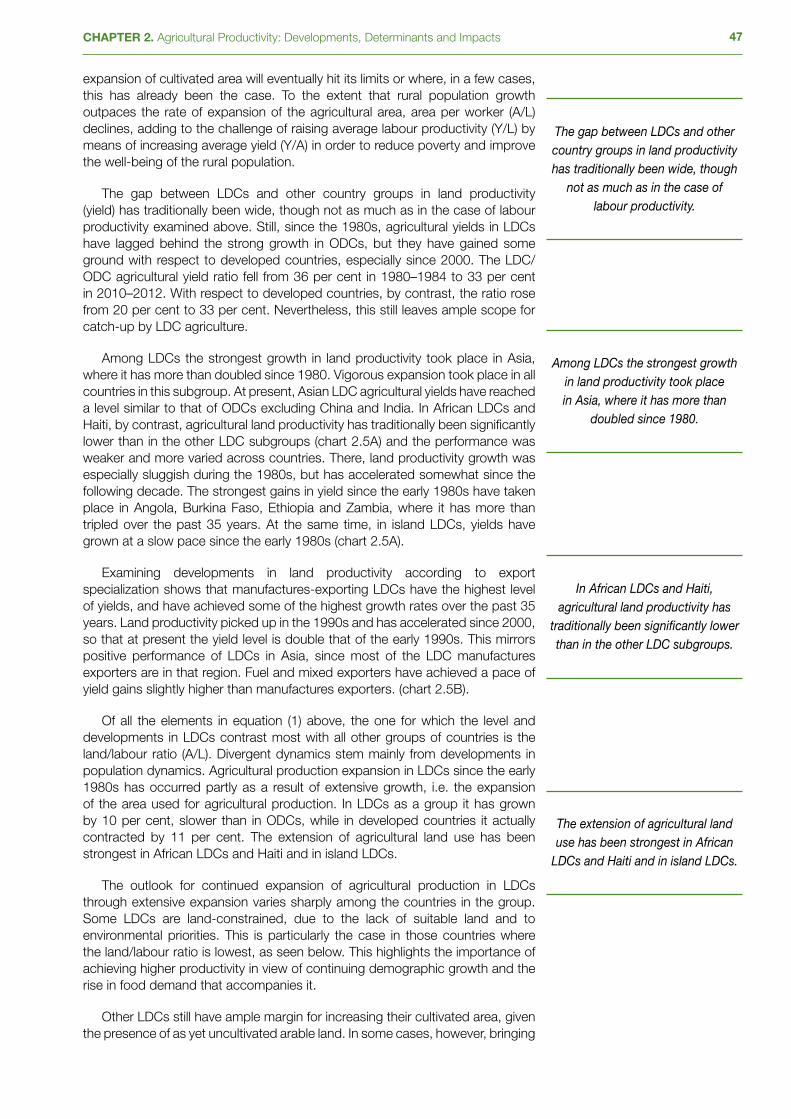
47CHAPTER 2. Agricultural Productivity: Developments, Determinants and Impacts
expansion of cultivated area will eventually hit its limits or where, in a few cases, this has already been the case. To the extent that rural population growth outpaces the rate of expansion of the agricultural area, area per worker (A/L) declines, adding to the challenge of raising average labour productivity (Y/L) by means of increasing average yield (Y/A) in order to reduce poverty and improve the well-being of the rural population.
The gap between LDCs and other country groups in land productivity (yield) has traditionally been wide, though not as much as in the case of labour productivity examined above. Still, since the 1980s, agricultural yields in LDCs have lagged behind the strong growth in ODCs, but they have gained some ground with respect to developed countries, especially since 2000. The LDC/ODC agricultural yield ratio fell from 36 per cent in 1980–1984 to 33 per cent in 2010–2012. With respect to developed countries, by contrast, the ratio rose from 20 per cent to 33 per cent. Nevertheless, this still leaves ample scope for catch-up by LDC agriculture.
Among LDCs the strongest growth in land productivity took place in Asia, where it has more than doubled since 1980. Vigorous expansion took place in all countries in this subgroup. At present, Asian LDC agricultural yields have reached a level similar to that of ODCs excluding China and India. In African LDCs and Haiti, by contrast, agricultural land productivity has traditionally been significantly lower than in the other LDC subgroups (chart 2.5A) and the performance was weaker and more varied across countries. There, land productivity growth was especially sluggish during the 1980s, but has accelerated somewhat since the following decade. The strongest gains in yield since the early 1980s have taken place in Angola, Burkina Faso, Ethiopia and Zambia, where it has more than tripled over the past 35 years. At the same time, in island LDCs, yields have grown at a slow pace since the early 1980s (chart 2.5A).
Examining developments in land productivity according to export specialization shows that manufactures-exporting LDCs have the highest level of yields, and have achieved some of the highest growth rates over the past 35 years. Land productivity picked up in the 1990s and has accelerated since 2000, so that at present the yield level is double that of the early 1990s. This mirrors positive performance of LDCs in Asia, since most of the LDC manufactures exporters are in that region. Fuel and mixed exporters have achieved a pace of yield gains slightly higher than manufactures exporters. (chart 2.5B).
Of all the elements in equation (1) above, the one for which the level and developments in LDCs contrast most with all other groups of countries is the land/labour ratio (A/L). Divergent dynamics stem mainly from developments in population dynamics. Agricultural production expansion in LDCs since the early 1980s has occurred partly as a result of extensive growth, i.e. the expansion of the area used for agricultural production. In LDCs as a group it has grown by 10 per cent, slower than in ODCs, while in developed countries it actually contracted by 11 per cent. The extension of agricultural land use has been strongest in African LDCs and Haiti and in island LDCs.
The outlook for continued expansion of agricultural production in LDCs through extensive expansion varies sharply among the countries in the group. Some LDCs are land-constrained, due to the lack of suitable land and to environmental priorities. This is particularly the case in those countries where the land/labour ratio is lowest, as seen below. This highlights the importance of achieving higher productivity in view of continuing demographic growth and the rise in food demand that accompanies it.
Other LDCs still have ample margin for increasing their cultivated area, given the presence of as yet uncultivated arable land. In some cases, however, bringing
The gap between LDCs and other country groups in land productivity has traditionally been wide, though
not as much as in the case of labour productivity.
Among LDCs the strongest growth in land productivity took place in Asia, where it has more than
doubled since 1980.
In African LDCs and Haiti, agricultural land productivity has
traditionally been significantly lower than in the other LDC subgroups.
The extension of agricultural land use has been strongest in African
LDCs and Haiti and in island LDCs.
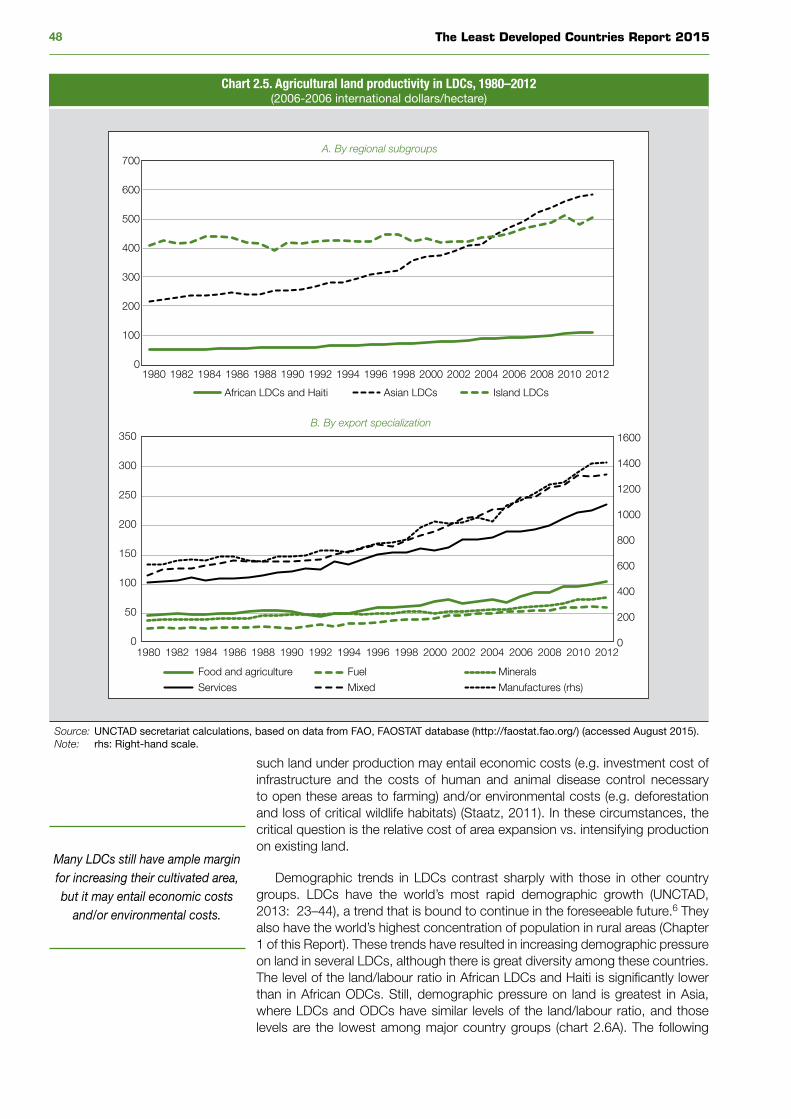
The Least Developed Countries Report 201548
Chart 2.5. Agricultural land productivity in LDCs, 1980–2012(2006-2006 international dollars/hectare)
0
100
200
300
400
500
600
700
1980 1982 1984 1986 1988 1990 1992 1994 1996 1998 2000 2002 2004 2006 2008 2010 2012
A. By regional subgroups
African LDCs and Haiti Asian LDCs Island LDCs
0
200
400
600
800
1000
1200
1400
1600
0
50
100
150
200
250
300
350
1980 1982 1984 1986 1988 1990 1992 1994 1996 1998 2000 2002 2004 2006 2008 2010 2012
B. By export specialization
Food and agriculture Fuel Minerals
Services Mixed Manufactures (rhs)
Source: UNCTAD secretariat calculations, based on data from FAO, FAOSTAT database (http://faostat.fao.org/) (accessed August 2015).Note: rhs: Right-hand scale.
such land under production may entail economic costs (e.g. investment cost of infrastructure and the costs of human and animal disease control necessary to open these areas to farming) and/or environmental costs (e.g. deforestation and loss of critical wildlife habitats) (Staatz, 2011). In these circumstances, the critical question is the relative cost of area expansion vs. intensifying production on existing land.
Demographic trends in LDCs contrast sharply with those in other country groups. LDCs have the world’s most rapid demographic growth (UNCTAD, 2013: 23–44), a trend that is bound to continue in the foreseeable future.6 They also have the world’s highest concentration of population in rural areas (Chapter 1 of this Report). These trends have resulted in increasing demographic pressure on land in several LDCs, although there is great diversity among these countries. The level of the land/labour ratio in African LDCs and Haiti is significantly lower than in African ODCs. Still, demographic pressure on land is greatest in Asia, where LDCs and ODCs have similar levels of the land/labour ratio, and those levels are the lowest among major country groups (chart 2.6A). The following
Many LDCs still have ample margin for increasing their cultivated area, but it may entail economic costs
and/or environmental costs.
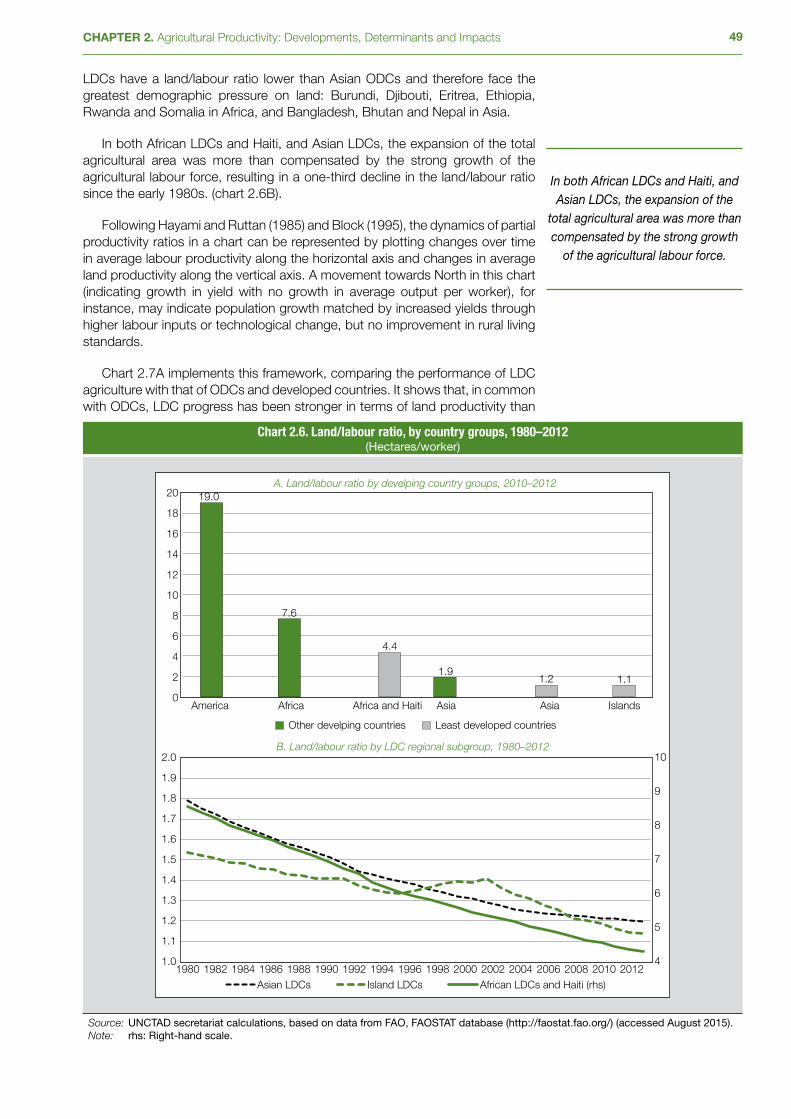
49CHAPTER 2. Agricultural Productivity: Developments, Determinants and Impacts
LDCs have a land/labour ratio lower than Asian ODCs and therefore face the greatest demographic pressure on land: Burundi, Djibouti, Eritrea, Ethiopia, Rwanda and Somalia in Africa, and Bangladesh, Bhutan and Nepal in Asia.
In both African LDCs and Haiti, and Asian LDCs, the expansion of the total agricultural area was more than compensated by the strong growth of the agricultural labour force, resulting in a one-third decline in the land/labour ratio since the early 1980s. (chart 2.6B).
Following Hayami and Ruttan (1985) and Block (1995), the dynamics of partial productivity ratios in a chart can be represented by plotting changes over time in average labour productivity along the horizontal axis and changes in average land productivity along the vertical axis. A movement towards North in this chart (indicating growth in yield with no growth in average output per worker), for instance, may indicate population growth matched by increased yields through higher labour inputs or technological change, but no improvement in rural living standards.
Chart 2.7A implements this framework, comparing the performance of LDC agriculture with that of ODCs and developed countries. It shows that, in common with ODCs, LDC progress has been stronger in terms of land productivity than
Chart 2.6. Land/labour ratio, by country groups, 1980–2012(Hectares/worker)
1980 1982 1984 1986 1988 1990 1992 1994 1996 1998 2000 2002 2004 2006 2008 2010 2012
19.0
7.6
1.9
4.4
1.2 1.1
0
2
4
6
8
10
12
14
16
18
20
America Africa Africa and Haiti Asia Asia Islands
A. Land/labour ratio by develping country groups, 2010–2012
Other develping countries Least developed countries
4
5
6
7
8
9
10
1.0
1.1
1.2
1.3
1.4
1.5
1.6
1.7
1.8
1.9
2.0B. Land/labour ratio by LDC regional subgroup, 1980–2012
Asian LDCs Island LDCs African LDCs and Haiti (rhs)
Source: UNCTAD secretariat calculations, based on data from FAO, FAOSTAT database (http://faostat.fao.org/) (accessed August 2015).Note: rhs: Right-hand scale.
In both African LDCs and Haiti, and Asian LDCs, the expansion of the
total agricultural area was more than compensated by the strong growth
of the agricultural labour force.
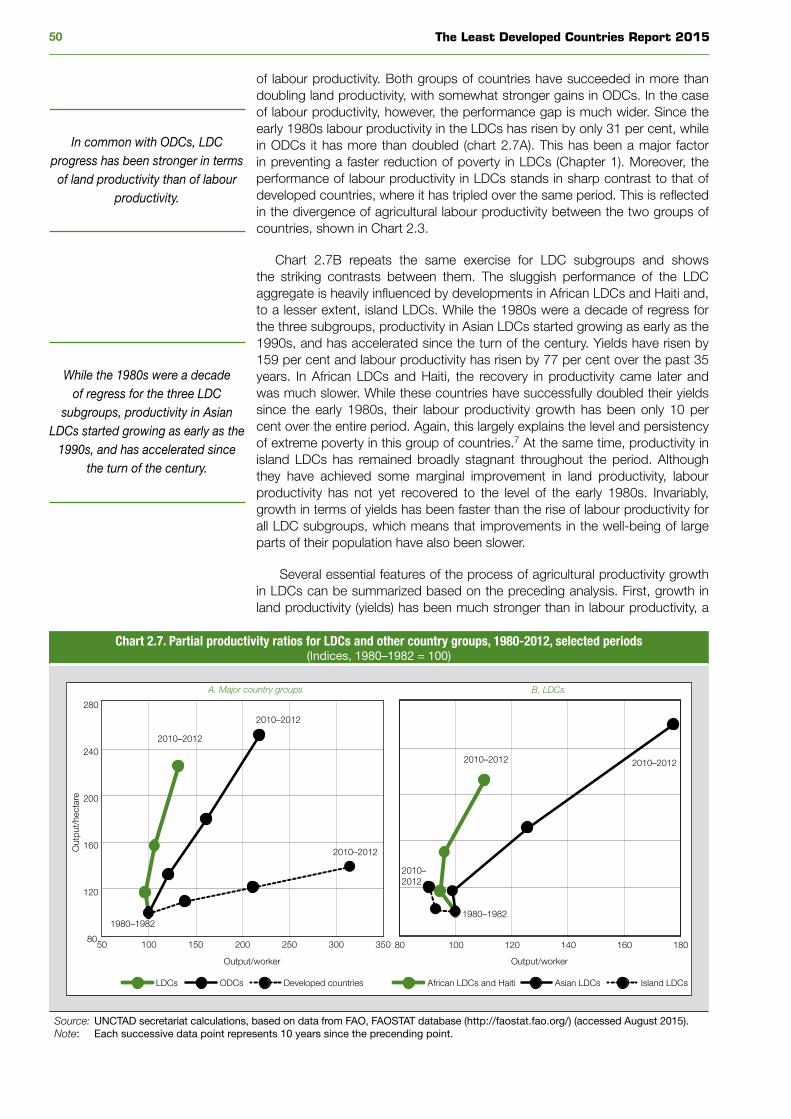
The Least Developed Countries Report 201550
of labour productivity. Both groups of countries have succeeded in more than doubling land productivity, with somewhat stronger gains in ODCs. In the case of labour productivity, however, the performance gap is much wider. Since the early 1980s labour productivity in the LDCs has risen by only 31 per cent, while in ODCs it has more than doubled (chart 2.7A). This has been a major factor in preventing a faster reduction of poverty in LDCs (Chapter 1). Moreover, the performance of labour productivity in LDCs stands in sharp contrast to that of developed countries, where it has tripled over the same period. This is reflected in the divergence of agricultural labour productivity between the two groups of countries, shown in Chart 2.3.
Chart 2.7B repeats the same exercise for LDC subgroups and shows the striking contrasts between them. The sluggish performance of the LDC aggregate is heavily influenced by developments in African LDCs and Haiti and, to a lesser extent, island LDCs. While the 1980s were a decade of regress for the three subgroups, productivity in Asian LDCs started growing as early as the 1990s, and has accelerated since the turn of the century. Yields have risen by 159 per cent and labour productivity has risen by 77 per cent over the past 35 years. In African LDCs and Haiti, the recovery in productivity came later and was much slower. While these countries have successfully doubled their yields since the early 1980s, their labour productivity growth has been only 10 per cent over the entire period. Again, this largely explains the level and persistency of extreme poverty in this group of countries.7 At the same time, productivity in island LDCs has remained broadly stagnant throughout the period. Although they have achieved some marginal improvement in land productivity, labour productivity has not yet recovered to the level of the early 1980s. Invariably, growth in terms of yields has been faster than the rise of labour productivity for all LDC subgroups, which means that improvements in the well-being of large parts of their population have also been slower.
Several essential features of the process of agricultural productivity growth in LDCs can be summarized based on the preceding analysis. First, growth in land productivity (yields) has been much stronger than in labour productivity, a
Chart 2.7. Partial productivity ratios for LDCs and other country groups, 1980-2012, selected periods(Indices, 1980–1982 = 100)
80
120
160
200
240
280
50 100 150 200 250 300 350
Out
put/
hect
are
Output/worker Output/worker
A. Major country groups
LDCs ODCs Developed countries
1980–19821980–1982
2010–2012
2010–2012 2010–2012
2010–2012
2010–2012
80 100 120 140 160 180
B. LDCs
African LDCs and Haiti Asian LDCs Island LDCs
2010–2012
Source: UNCTAD secretariat calculations, based on data from FAO, FAOSTAT database (http://faostat.fao.org/) (accessed August 2015).Note: Each successive data point represents 10 years since the precending point.
In common with ODCs, LDC progress has been stronger in terms of land productivity than of labour
productivity.
While the 1980s were a decade of regress for the three LDC
subgroups, productivity in Asian LDCs started growing as early as the
1990s, and has accelerated since the turn of the century.

51CHAPTER 2. Agricultural Productivity: Developments, Determinants and Impacts
pattern that repeats itself for most individual countries. Twenty-six LDCs have achieved a doubling or more of their land productivity during the past 35 years, while only four have obtained similar results for labour productivity. Conversely, cases of long-term decline in agricultural productivity have been more prevalent in labour productivity (21 LDCs, or 45 per cent of the LDCs for which data are available) than in land productivity (just two cases). These developments have obviously had an adverse impact on the well-being of the population and have prevented a more rapid pace of poverty reduction. Still, there is a positive correlation between yield growth and labour productivity in LDCs (0.56), which is stronger than in ODCs (0.32).
Second, the groups that have generally been most successful along both dimensions of productivity since the early 1980s have been manufactures exporters and mixed exporters. Bangladesh and Nepal stand out among the former because they have doubled productivity of both land and labour. In the case of mixed exporters, Benin has achieved a similar outcome. These developments show that generally speaking, the countries that have advanced the most in terms of the structural transformation and diversification of their economy have been those which succeeded in raising their agricultural productivity. These developments confirm the link between agricultural progress and overall economic development, in which progress in agriculture and other productive sectors is mutually reinforcing. Agricultural productivity growth supports the process of structural transformation and productive diversification, as has long been highlighted in the economic development literature. Countries that have most successfully engaged in structural transformation and diversification are by the same token those which achieve greater advances in improving the well-being of their population and reducing poverty.
Third, the other LDC subgroup that has achieved somewhat stronger growth in agricultural productivity is the fuel exporters, although here the fastest progress has been concentrated in the first decade of this century, which coincided with a long period of high oil prices. The best performers have been Angola and Yemen. Productivity gains in Angola, similarly to Mozambique and Sierra Leone, are related to post-conflict reconstruction. Under these circumstances agricultural production is carried out under better security and institutional conditions, access to input and output markets becomes easier, and in some cases governments adopt measures and programmes that support the sector (e.g. increased budget allocations).
Fourth, mineral and food and agricultural exporters experienced a much more moderate progression in both dimensions of productivity, and only since the turn of the century. At the same time, services exporters achieved a doubling of yields, coupled however with long-term decline in labour productivity.
3. total faCtor produCtivity
Available estimates of total factor productivity (TFP) enable the analysis of dynamics and trends of agricultural productivity over time, as well as their comparison across countries, but provide no indication of the (relative) level of productivity. In principle they provide a measure of the changes in production that are not accounted for in the variation in so-called conventional inputs (land, labour, material inputs, physical capital), which can thus be attributed to technology or other general factors (policies, etc.). There are some caveats to the computation and interpretation of TFP (box 2.3), but nevertheless it provides good indications of agricultural productivity trends.
The rhythm of growth of TFP in LDCs as a group has traditionally lagged considerably behind the performance of other country groups. More specifically,
Cases of long-term decline in agricultural productivity have been
more prevalent in labour productivity than in land productivity.
The countries that have advanced the most in terms of the structural transformation and diversification of their economy have been those which succeeded in raising their
agricultural productivity.
Productivity gains in several LDCs are related to post-conflict
reconstruction.
The Least Developed Countries Report 201552
it was largely stagnant in LDCs from the 1960s to the 1980s. Growth turned positive in the 1990s and has accelerated significantly since the turn of the century (chart 2.8A). There is a marked contrast in the performance of LDC subgroups, similar to what has taken place with the partial productivity measures examined above. TFP growth turned positive in Asian LDCs in the 1990s and has accelerated since the turn of the century; since then it has outperformed all other major country groups (including ODCs and developed countries). In African LDCs and Haiti, by contrast, agricultural TFP was largely stagnant in the last four decades of the twentieth century, turning from near-stagnation in the 1960s to sluggish growth until the end of the century. Since then, however, TFP growth has turned positive, although it has been slower than in other country groups. In the island LDC subgroup, TFP has grown very slowly since the 1960s. It has alternated between periods of positive and negative growth, with a performance similar to that of partial productivity measures examined above.
The examination of TFP growth in LDCs according to export specialization yields some findings that confirm those resulting from partial productivity analysis, but also different ones. The former include the relatively positive agricultural productivity performance of mixed exporters and manufactures exporters, as well as fuel exporters (chart 2.8B). The manufactures exporters were led by Cambodia and Bangladesh, with average annual TFP rises of 3.3 per cent and 2.3 per cent, respectively, between 1990 and 2011. Among mixed exporters the strongest gains in productivity took place in Myanmar (with a 4.4-per-cent average annual growth rate), and Benin, Lao People’s Democratic Republic and Sierra Leone, where TFP growth was approximately 2.5 per cent per annum. In the case of fuel exporters, TFP growth has been led by the performance of the agriculture of Angola and Yemen, where it rose on average by 4.5 per cent and 3 per cent annually, respectively, during the same period. The major new finding yielded by TFP analysis is the positive outcome of TFP growth in the exporters of food and agricultural products since the 1990s. Given that this is a very small group, the aggregate is driven by Malawi’s TFP growth, which increased by 3 per cent annually during the same period.
Having examined the level and dynamics of agricultural productivity in LDCs according to different partial and total metrics, the question arises as to the drivers of these developments. They are analysed in the following section.
Box 2.3. Total factor productivity, embodiment and the measurement of technological progress in agriculture
Gauging and quantifying technology and its impacts is a challenge in the case of agriculture, similar to what happens in other sectors of economic activity. A conventional measure of the impact of technology is total factor productivity (TFP). Most cross-country estimates of agricultural TFP are based on quantitative variations of inputs, but do not (adequately) take into account qualitative differences among them. TFP estimates rely on some assumptions, including that technology is disembodied and therefore its effects are captured by the magnitude of TFP growth (Block, 1995). While the assumption of disembodiment may hold for cultivation and water management techniques as well as other agricultural practices, a significant part of the results of agriculture-related research and development (R&D) is embodied in better-performing inputs, especially higher-yield varieties, better-quality fertilizers or superior agricultural machinery. Still, the effects of superior inputs will be reflected in TFP growth. Although fertilizers and machinery – and especially the latter – are still relatively less important for LDCs (due to the low input-intensity and capital-intensity of their agriculture), the use of higher-yield varieties or superior species of cattle has been a major source of productivity growth in their agriculture.
Concerning human capital input to agricultural production, all TFP estimates are based on some gauge of quantitative variations in labour input (subject to the caveats mentioned in Box 2.2). They do not, however, take account of qualitative differences in human capital, except for when some allowance is made for years of schooling. However, this is often not the case, due to the paucity of data specific to rural areas.
Agricultural TFP was largely stagnant in LDCs from the 1960s
to the 1980s.
LDC TFP growth turned positive in the 1990s and has accelerated significantly since the turn of the
century.
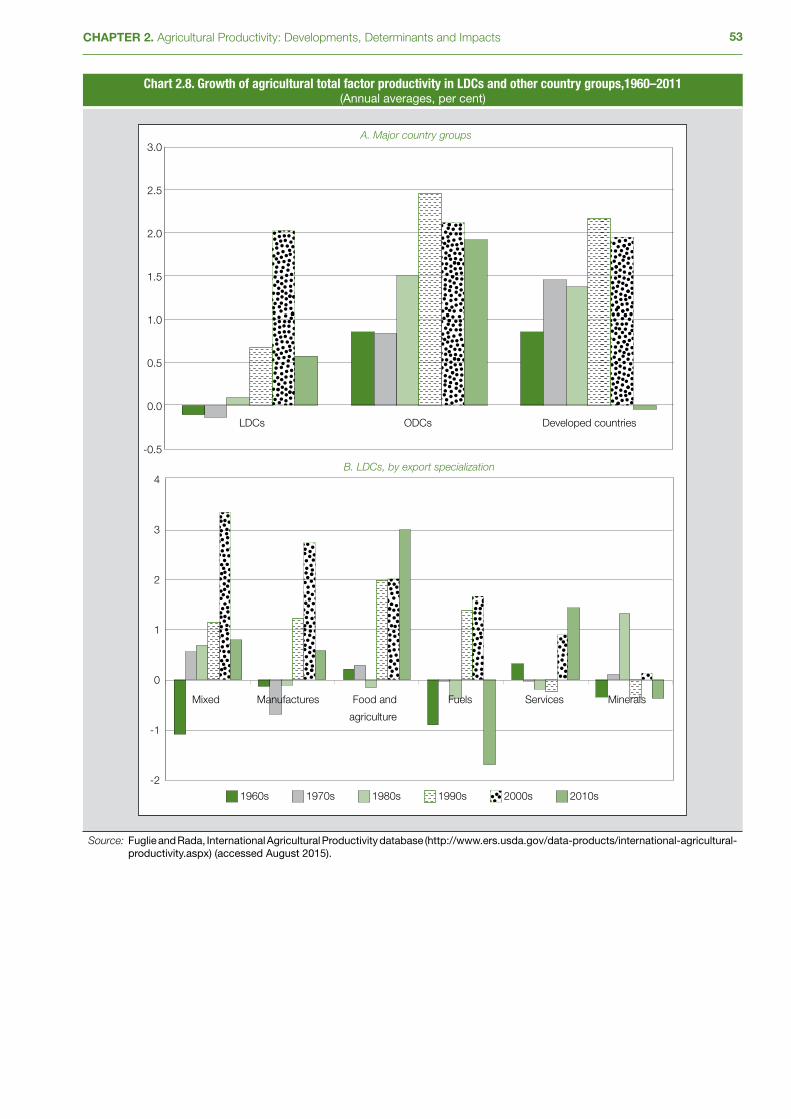
53CHAPTER 2. Agricultural Productivity: Developments, Determinants and Impacts
Chart 2.8. Growth of agricultural total factor productivity in LDCs and other country groups,1960–2011(Annual averages, per cent)
-0.5
0.0
0.5
1.0
1.5
2.0
2.5
3.0
LDCs ODCs Developed countries
A. Major country groups
1960s 1970s 1980s 1990s 2000s 2010s
-2
-1
0
1
2
3
4
Mixed Manufactures Food and
agriculture
Fuels Services Minerals
B. LDCs, by export specialization
Source: Fuglie and Rada, International Agricultural Productivity database (http://www.ers.usda.gov/data-products/international-agricultural-productivity.aspx) (accessed August 2015).
The Least Developed Countries Report 201554
D. Determinants of agricultural productivity level and growth
The following main factors have been identified in the literature as the key drivers of partial and/or total productivity in agriculture (Fuglie and Rada, 2013; Dias Avila and Evenson, 2010; Zepeda, 2001):
• Quantity of conventional inputs;
• Technology, input quality and human capital;
• Public investment and policies;
• Agroecological conditions and climate change;
• Rural diversification.
Moreover, there are important interactions between these factors in determining productivity. The possibility of fertilizer use, for instance, depends on physical access to supply markets and hence on the availability of transport infrastructure and services (among other factors), while its efficiency is partly determined by the quality of the fertilizers themselves, the availability of water and the labour skills with which they are used. In another example of interaction, the contribution of transport access to agricultural productivity is enhanced in the presence of higher levels of farmer education.
An understanding of the determinants of agricultural productivity and hence of potential sources of productivity growth is important for formulating appropriate policies to raise productivity in LDCs, so as to accelerate their economies’ structural transformation and boost their standard of living.
1. Quantity of Conventional inputs
The quantity of agricultural output is most directly determined by the quantity of conventional inputs (land, labour, material inputs and physical capital inputs), especially in countries whose agriculture is at the lower stages of development. Therefore, partial productivity measures are also strongly influenced by the quantities of conventional inputs.
The trends in their use in LDCs are analysed below. The picture that emerges is that of an agriculture which: (1) employs labour very intensively; (2) relies on the extensive use of land; and (3) makes little use of other conventional inputs. The first two features have already been analysed in the preceding sections of this chapter. The third feature — the intensity of use of conventional inputs other than labour and land — is examined below.
The intensity of manufactured input use varies widely across LDCs as a function of population density, inherent soil fertility and incidence of large-scale farming. Nonetheless, on average the use of fertilizers, plant health protection products and insecticides in LDC agriculture is extremely low. LDC consumption of synthetic fertilizers per area is just 10 per cent of the level in ODCs and 15 per cent that of developed countries. There are, however, significant differences among LDC groups. The use of fertilizers is lowest in island LDCs and African LDCs and Haiti. By contrast, Asian LDC farmers use fertilizers much more intensively than those of other LDCs (chart 2.9A). Their intensity corresponds to approximately half of the level of fertilizer use in developed countries.
The key drivers of partial and/or total productivity in agriculture are:
quantity of conventional inputs; technology, input quality and human
capital; ...
... as well as public investment and policies; agroecological conditions
and climate change; and rural diversification.
LDC agriculture employs labour very intensively; relies on the extensive use of land; and makes little use of
other conventional inputs.
Fertilizer use in many LDCs is constrained by poverty and low income, the lack of adequate
water supply and foreign exchange shortage.
55CHAPTER 2. Agricultural Productivity: Developments, Determinants and Impacts
Fertilizer use in many LDCs is constrained by poverty and low income (which render fertilizers unaffordable to many farmers), the lack of adequate water supply (which is required if fertilizers are to work efficiently) and foreign exchange shortage (which restricts the possibilities of importing fertilizers). Over the long term, however, increasing the use of inputs like fertilizer will be critical to increasing farm-level productivity, incomes and competitiveness. For this reason, many African LDCs have resorted to fertilizer subsidies, aiming to boost fertilizer use by farmers (Druilhe and Barreiro-Hurlé, 2012).
The degree to which water is used as an input for agricultural production in LDCs varies greatly from one region to another. It is low in African LDCs and Haiti, where just 3.4 per cent of arable land is equipped for irrigation and where access to water remains a major concern for agricultural development.8 In island LDCs, the corresponding share (6.5 per cent) is somewhere between the level of African LDCs and Haiti and that of ODCs. This low level of irrigation results in not only lower, but also more unstable, yield levels.
In Asian LDCs, by contrast, the practice of irrigation is much more widespread, and has historically been so. The share of agricultural land that is irrigated (34.6 per cent) is more than double the proportion in ODCs and developed countries (chart 2.9B). It is, however, more in line with the regional average. The proportion of agricultural land that is equipped for irrigation in the non-LDC developing countries of Asia is 40.3 per cent, which is also the highest rate among the regional subgroups of ODCs.
Both farming and agro-industries are typically heavy users of water. The availability, quality and cost of water will be a progressively more important factor in the location and profitability of agribusiness activities. Climate change, increasing population pressures, and rising energy costs are all making water increasingly expensive; changes in the cost of water across different regions will affect the choice of where large international agribusinesses source their products, giving water-abundant areas in LDCs a potential advantage (Roepstoff et al., 2011).
The agriculture practised in LDCs is extremely labour-intensive and employs little physical capital. It therefore has a very low degree of mechanization. Still, the contrast between Asian and other LDCs again arises with respect to this type of input. The intensity of use of agricultural machinery is very low in island LDCs and in African LDCs and Haiti, where less than one machine is used per hectare on average. In Asian LDCs, the degree of mechanization is much higher. On average, 4.5 machines are used per hectare in these countries, an intensity that is about half of the level of ODCs (chart 2.9C).9
In some cases a wide range of technological options may exist, e.g. in land preparation, where animal-traction equipment, hand tractors and large-scale tractors are all options. The choice depends on such factors as the heaviness of the soil to be ploughed, the rapidity with which the operation needs to take place (for example, in order to accommodate multiple cropping within a single year), the availability of maintenance services and spare parts, and the relative prices of labour and capital. For both agricultural machinery and agroprocessing equipment, a range of simpler, more labour-intensive but more economically efficient technologies is often available. The widespread importation into sub-Saharan Africa of simple grain mills, pumps and other agricultural technologies from India shows that African farmers and processors often opt for such “appropriate” technologies (Staatz, 2011).
While in general terms LDC agriculture is not intensive in conventional inputs other than land and labour — especially fertilizers, machinery and water — Asian
In African LDCs and Haiti, and in island LDCs, the low level of
irrigation results in not only lower, but also more unstable, yield levels.
The agriculture practised in LDCs is extremely labour-intensive and
employs little physical capital.
LDC agriculture is not intensive in conventional inputs other than land and labour — especially fertilizers, machinery and water — but Asian LDCs use these inputs much more
intensively than other LDCs.
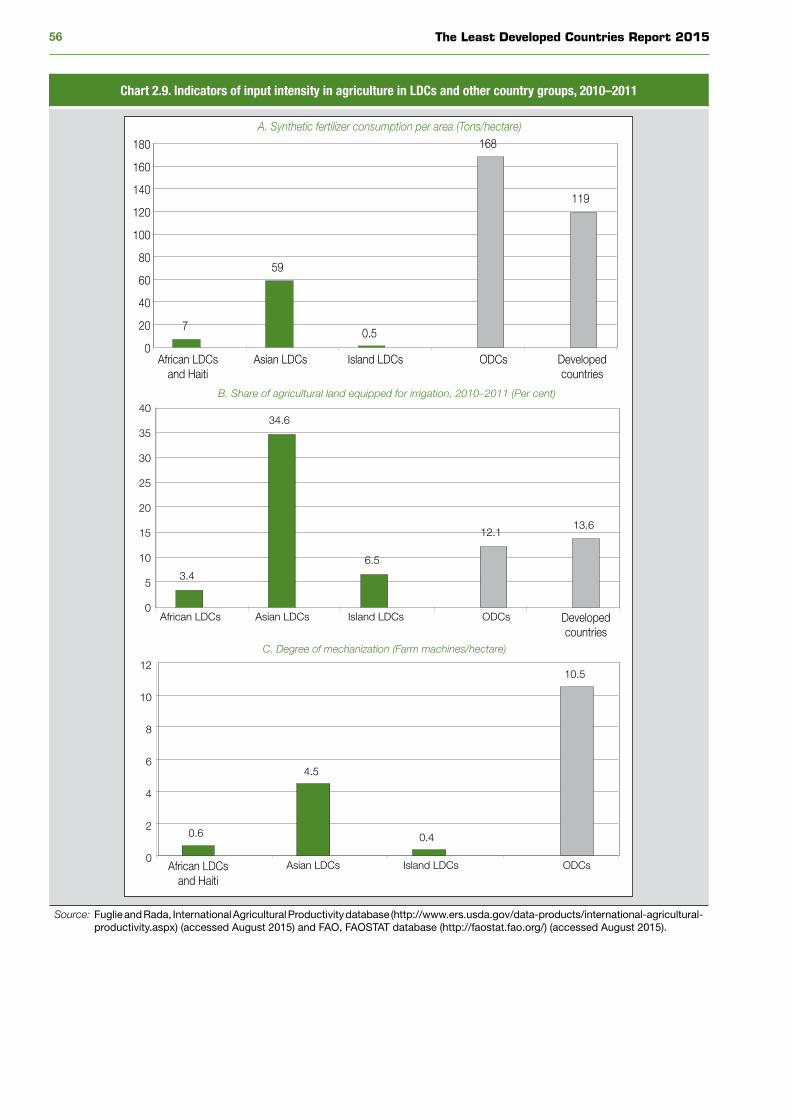
The Least Developed Countries Report 201556
Chart 2.9. Indicators of input intensity in agriculture in LDCs and other country groups, 2010–2011
7
59
0.5
168
119
0
20
40
60
80
100
120
140
160
180
African LDCsand Haiti
Asian LDCs Island LDCs ODCs Developedcountries
A. Synthetic fertilizer consumption per area (Tons/hectare)
3.4
34.6
6.5
12.113.6
0
5
10
15
20
25
30
35
40
Developedcountries
African LDCs Asian LDCs Island LDCs ODCs
B. Share of agricultural land equipped for irrigation, 2010–2011 (Per cent)
0.6
4.5
0.4
10.5
0
2
4
6
8
10
12
African LDCsand Haiti
Asian LDCs Island LDCs ODCs
C. Degree of mechanization (Farm machines/hectare)
Source: Fuglie and Rada, International Agricultural Productivity database (http://www.ers.usda.gov/data-products/international-agricultural-productivity.aspx) (accessed August 2015) and FAO, FAOSTAT database (http://faostat.fao.org/) (accessed August 2015).
57CHAPTER 2. Agricultural Productivity: Developments, Determinants and Impacts
LDCs use these inputs much more intensively than other LDCs, and more in line with the practices of Asian ODCs. This explains to some extent why the partial indicators of productivity are much higher in Asian LDCs than in other LDCs.
At the same time, it points to an area for policy action to help reverse the low productivity in African LDCs. A survey was conducted with more than 100 agriculture experts working in Africa, asking them to identify the most important factors in advancing agriculture on the continent. Some 21 per cent of respondents identified such activities as enhancement of soil fertility, improved water management techniques and policy reform as the primary drivers of African agriculture, which were especially successful in southern Africa (Gabre-Madin and Haggblade, 2004).
2. teChnology, input Quality and human Capital
Technology plays a crucial role in determining agricultural productivity, as evidenced for instance by its effects on crop variety yields. The fact that the bulk of productivity enhancements achieved in LDCs have come from increased yields (rather than from labour productivity) points to the importance of technology embodied in higher-yielding varieties or in superior species of cattle, which can improve the well-being of farmers. Technology directly influences not only variety yields, but also the adaptation of plant and animal varieties to local agroecological conditions, the quality of inputs (seeds, fertilizers, machinery), the choice of cultivation and rearing techniques, etc. Producers’ capacity to learn and adapt to new technologies and circumstances is partly determined by the quality of their human capital.
a. Technology and input quality
Agricultural innovations derive largely from agricultural research and development (R&D), which expands the set of technologies available to farmers. The importance of agricultural R&D is highlighted by the fact that the modest recovery in productivity gains in sub-Saharan Africa in the 1990s has been attributed to increased spending on agricultural R&D and extension services, as well as improved price incentives (Fuglie and Rada, 2013; Block, 1995). Successes tied to specific commodities (especially maize and cassava breeding) were cited as the key factors in advancing agriculture in Africa by the majority (62 per cent) of agriculture experts in the above-mentioned survey (Gabre-Madin and Haggblade, 2004). The case of maize deserves particular attention. As a staple food crop, it has received special policy attention in several countries. Between 1966 and 1990, more than 300 improved varieties and hybrids were released by national maize research programmes. This was especially successful in southern and eastern Africa (Byerlee and Jewell, 1997). The survey also pointed to the particular success of maize breeding programmes in eastern and southern Africa, where by the turn of the century 58 per cent of maize area was planted with improved hybrids, producing yields gains of about 40 per cent more than local varieties. In western and central Africa, by contrast, only some 20 per cent of total maize area was planted with improved varieties. Those regions were more dominated by improved open-pollinating varieties, with output gains of 15–45 per cent more than local varieties. Other major sources of success cited in the survey include the results of R&D activity, such as breeding to combat mosaic virus in cassava, and improved breeding of bananas in central Africa (Gabre-Madin and Haggblade, 2004).
Agricultural R&D is undertaken both by international and national institutions and by research centres. The former can be either global — such as the Consultative Group on International Agricultural Research (CGIAR) — or regional. There is strong complementarity between international and domestic research institutions.
The fact that the bulk of productivity enhancements achieved in LDCs have come from increased yields
points to the importance of technology embodied in higher-yielding varieties or in superior
species of cattle.
Successes tied to specific commodities (especially maize and cassava breeding) were key factors in advancing agriculture in Africa.
There is strong complementarity between international and domestic
research institutions.
There are high rates of return to public investment in developing and extending agricultural technologies.

The Least Developed Countries Report 201558
Recent research documents the existence of high rates of return to public investment in developing and extending agricultural technologies. In a survey of studies on Asia, the rates of return to national research investment were estimated to range from 19 to 218 per cent, while those to national extension investment varied from 15 to 215 per cent. Returns to international research investment ranged from 68 to 108 per cent (Evenson and McKinsey Jr., 1991).10
While the returns to R&D are high, several factors prevent them from having the kind of impact on LDC agricultural productivity that would bring them even remotely close to their potential.
First, the level of agricultural R&D commitment in low-income countries is relatively low. The Agricultural Science and Technology Indicators compiled by the International Food Policy Research Institute (IFPRI) show that the sector’s agricultural research spending relative to its gross domestic product (GDP) — the research intensity ratio — is substantially lower than in advanced economies. In 2008, low-income countries spent only $0.44 (at 2005 purchasing-power parity (PPP)) on public agricultural R&D for every $100 of agricultural GDP. The corresponding figure for high-income countries was more than $3 (chart 2.10). The average intensity ratio for low-income countries has declined marginally over the past 35 years, meaning that growth in R&D spending has lagged behind the expansion of agricultural GDP. In high-income countries, by contrast, public agricultural R&D spending for every $100 of agricultural GDP (2005 PPP) has risen steadily since the early 1980s, reaching $2.63 in 2000 and $3.07 in 2008.
In much of sub-Saharan Africa, public support for agricultural research and training of scientific personnel to undertake it stagnated or withered from the 1980s to 2005, so that over half of the continent’s national agricultural research systems had fewer than 100 scientists in 2000 (Beintema and Stads, 2006). Private research focused on a few profitable export crops, but there were few private-public partnerships like those which have characterized dynamic agricultural research systems, such as that of Brazil (Pardey et al., 2006).
Second, the high volatility of R&D in low-income economies presents an additional challenge. The inherent lag between the inception of a research
Chart 2.10. Public agricultural R&D expenditure by country income level, 1981–2008, selected years(Per cent of agricultural GDP)
0.0
0.5
1.0
1.5
2.0
2.5
3.0
3.5
Low Middle High World
1981 1990 2000 2008
Source: Beintema et al. (2012).
The agricultural R&D intensity for low-income countries has declined marginally over the past 35 years.
In much of sub-Saharan Africa, public support for agricultural
research and training of scientific personnel to undertake it stagnated or withered from the 1980s to 2005.
59CHAPTER 2. Agricultural Productivity: Developments, Determinants and Impacts
project and the adoption of a new technology or crop variety demands that financial disbursements are sustained and stable, but this is often not the case. Annual agricultural R&D spending levels in low-income countries were twice as volatile as those of high-income countries, and considerably more volatile than those of middle-income countries during the period 2000–2008. Moreover, average volatility in sub-Saharan Africa proved to be much higher than in other developing regions. African LDCs such as Burkina Faso, Mauritania and United Republic of Tanzania recorded volatility coefficients as high as 0.40, compared with a modest 0.11 in the economies of the Organisation for Economic Co-operation and Development (OECD) (Beintema et al., 2012).
Third, in the case of African LDCs the challenge of undertaking locally appropriate R&D is much greater than in Asian LDCs. Several of the latter have to some extent benefited from the Asian green revolution, which relied heavily on productivity improvements in the cultivation of a few staples: rice, wheat and maize. Sub-Saharan Africa, by contrast, has very diversified farming systems, of which FAO has identified 14 major varieties, ranging from near-desert to forest-based systems, with significant diversity within each major category (AfDB et al., 2007). In contrast to the Asian countries that were at the heart of the green revolution, few African countries are heavily reliant on rice and wheat, while maize is dominant only in southern Africa. Sub-Saharan Africa’s diverse agroecologies result in a wide range of farming systems and reliance on a large number of staples, such as cassava in central Africa and millet and sorghum in the Sahel, along with significant reliance on livestock in most farming systems. Accordingly, more varied processing and input technologies for staple crops are required than those which existed in Asia at a comparable stage of agricultural development. This implies a much greater need for investment in R&D that is appropriate to the specific agroecological conditions of the African LDCs.
In addition to generating new technologies with R&D, the innovation process needs to be complemented by (and interact with) the diffusion of these innovations. There is no exact correspondence between expenditures (an input indicator) and technology (an output). Even when technology is actually developed, it does not always result automatically in its adoption (Zepeda, 2001). The diffusion process involves the learning and mastery of new techniques by agricultural producers and their adoption of new varieties, animal species and other types of inputs (such as fertilizers and machinery). It may often take several years for innovation to be adopted by farmers. Typically, some farmers adopt it quickly, while others wait for extension or the results of their neighbours to convince them to do so.
The fact that innovation diffusion is neither automatic nor rapid indicates the importance of agricultural extension services. They are crucial to facilitating the dissemination of new technologies and their learning and adoption by farmers. They provide a link between the generation of innovations by national and international research institutions and their mastery and adoption by producers at the farm level.
The challenges of bringing about the diffusion even of existing technology are highlighted by the spread of high-yield varieties (HYV) of wheat and rice. They have been introduced on less than one third of the area planted with cereal grains in the developing world (Zepeda, 2001). Specifically, in Asia and the Middle East, 36 per cent of the grain area was HYV; in Latin America, 22 per cent; and in Africa, only 1 per cent (Wolf, 1987). This suggests there is much potential for increasing agricultural productivity using existing technology. The use of HYV requires increased use of fertilizer, however, but the inadequate water supply in many LDCs has made fertilizer use and hence HYV unprofitable. Moreover, low levels of adoption of HYV in African LDCs are also the result of a lack of appropriate technology development and of the few extension services
Annual agricultural R&D spending levels in low-income countries were
twice as volatile as those of high-income countries during the period
2000–2008.
Sub-Saharan Africa has very diversified farming systems and
therefore quite varied processing and input technologies for staple
crops are required.
Agricultural extension services are crucial to facilitating the
dissemination of new technologies and their learning and adoption
by farmers.
There is much potential for increasing agricultural productivity
using existing technology.
The Least Developed Countries Report 201560
that target women (Jahnke, Kirschke and Lagemann, 1987). Furthermore, non-traditional crops have rarely been the focus of improved varieties or technology, and the potential exists to develop them in order to increase agricultural production.
Beyond the quality and availability of agricultural extension services, another oft-encountered obstacle to the adoption of new agricultural technologies — especially in LDCs — is poverty. Poorer farmers tend to be very risk-averse. They accept lower returns in exchange for lower risk in order to smooth their consumption. Wealthier farmers, particularly those with larger farms and diversified incomes, have higher rates of farm investment on a per hectare basis (Zepeda, 2001). This can negatively affect their adoption of new technologies, given the higher risks they often entail. This, in turn, reinforces their poverty and keeps them trapped in the vicious circle of poverty and low productivity (chart 2.1).
The difficulties of technological upgrading in LDC agriculture are illustrated by the relative weakness of the agro-industry sectors and agribusiness firms in the United Republic of Tanzania in promoting internal technological learning and acquiring technological capability through investments in new equipment. This weakness is due to inadequate public R&D, low private R&D spending, and weak training, extension, business and technical support systems. All types of (public and private) extension services for firms, in the form of support institutions that can be easily accessed to give advice on new technologies and on new equipment, are weak. Evidence from across the country suggests that management capacity, R&D spending, and extension services and training are crucial to business success and to steady productivity improvements in these sectors (Goedhuys, Janz and Mohnen, 2013). Also important is the intensified dialogue of public research, training and extension institutions with the private sector (and its associations) on reforming and adapting the research agenda, the delivery of extension services and the content of training programmes. Interaction and feedback between users and generators of technological innovation are essential to spurring technological upgrading and productivity increase, in an illustration of the circular model of innovation (Rosenberg, 1982).
b. Human capital
Human capital plays a key role in determining whether and how technology will be adopted in agricultural production, since it affects the use and combination of inputs by farmers. Improvements in human capital influence the acquisition and assimilation of information, and the learning, mastery and implementation of technology. Human capital also has an impact on farmers’ ability to adapt technology to a particular situation and to changing needs (Schultz, 1972; Zepeda, 2001). Even in the absence of innovation, farm productivity may be enhanced by investments in education. There may be an efficiency advantage for farmers who are better prepared to anticipate and cope with instability. Farmers must adapt frequently in order to survive in an LDC environment characterized by high input and output price volatility (Asfaw and Admassie, 1996), unpredictable weather (which is increasingly common due to climate change), pests and crop disease. Therefore, the impact of agricultural extension services is enhanced by the quality of human capital, as research has shown (Dercon et al., 2008).
The quality of human capital, in turn, derives from such factors as the level of education of the labour force, its health situation and its gender composition. The first condition for a (reasonably) productive agricultural labour force is good health, especially in a situation of very low mechanization of agriculture, as is the case of LDCs. Health, in turn, depends on the nutritional situation of agricultural workers and, hence, on the absence of hunger. The latter has a negative impact
Poorer farmers tend to be very risk-averse, which can negatively affect their adoption of new technologies.
Interaction and feedback between users and generators of agricultural
technological innovation are essential to spurring technological
upgrading and productivity increase.
Improvements in human capital influence the acquisition and assimilation of information,
and the learning, mastery and implementation of technology.
The quality of human capital derives from such factors as the level of education of the labour force, its health situation and its gender
composition.
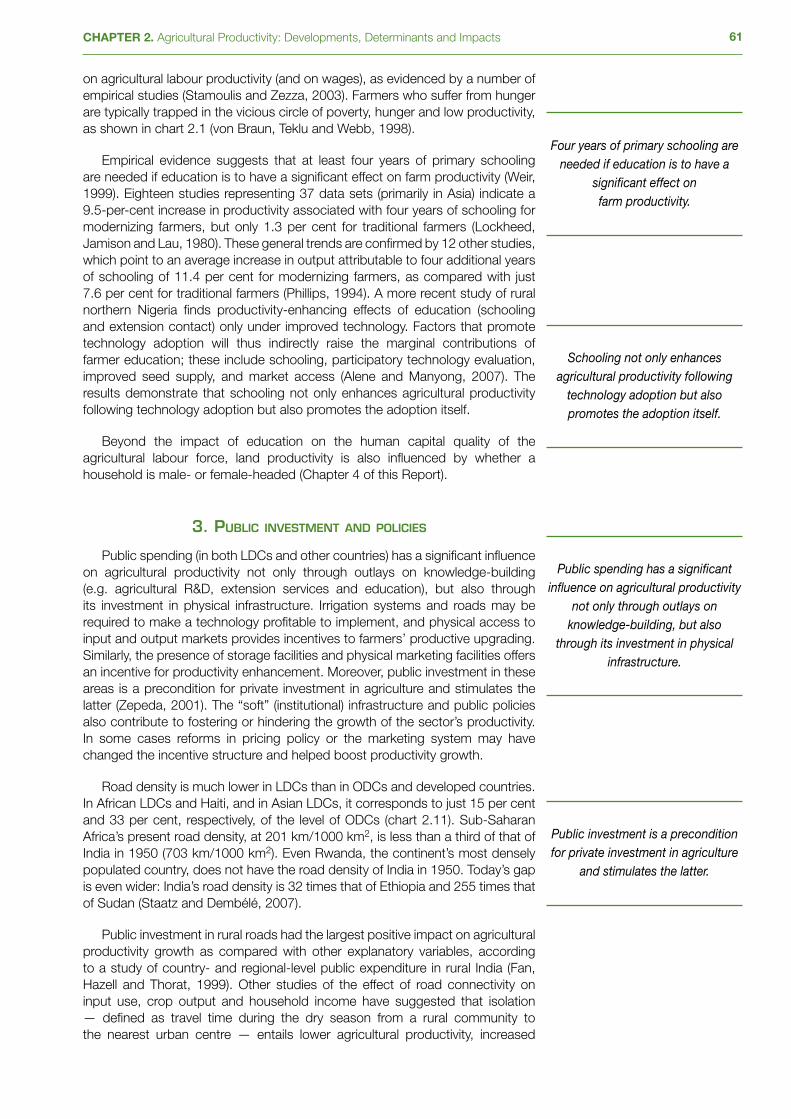
61CHAPTER 2. Agricultural Productivity: Developments, Determinants and Impacts
on agricultural labour productivity (and on wages), as evidenced by a number of empirical studies (Stamoulis and Zezza, 2003). Farmers who suffer from hunger are typically trapped in the vicious circle of poverty, hunger and low productivity, as shown in chart 2.1 (von Braun, Teklu and Webb, 1998).
Empirical evidence suggests that at least four years of primary schooling are needed if education is to have a significant effect on farm productivity (Weir, 1999). Eighteen studies representing 37 data sets (primarily in Asia) indicate a 9.5-per-cent increase in productivity associated with four years of schooling for modernizing farmers, but only 1.3 per cent for traditional farmers (Lockheed, Jamison and Lau, 1980). These general trends are confirmed by 12 other studies, which point to an average increase in output attributable to four additional years of schooling of 11.4 per cent for modernizing farmers, as compared with just 7.6 per cent for traditional farmers (Phillips, 1994). A more recent study of rural northern Nigeria finds productivity-enhancing effects of education (schooling and extension contact) only under improved technology. Factors that promote technology adoption will thus indirectly raise the marginal contributions of farmer education; these include schooling, participatory technology evaluation, improved seed supply, and market access (Alene and Manyong, 2007). The results demonstrate that schooling not only enhances agricultural productivity following technology adoption but also promotes the adoption itself.
Beyond the impact of education on the human capital quality of the agricultural labour force, land productivity is also influenced by whether a household is male- or female-headed (Chapter 4 of this Report).
3. publiC investment and poliCies
Public spending (in both LDCs and other countries) has a significant influence on agricultural productivity not only through outlays on knowledge-building (e.g. agricultural R&D, extension services and education), but also through its investment in physical infrastructure. Irrigation systems and roads may be required to make a technology profitable to implement, and physical access to input and output markets provides incentives to farmers’ productive upgrading. Similarly, the presence of storage facilities and physical marketing facilities offers an incentive for productivity enhancement. Moreover, public investment in these areas is a precondition for private investment in agriculture and stimulates the latter (Zepeda, 2001). The “soft” (institutional) infrastructure and public policies also contribute to fostering or hindering the growth of the sector’s productivity. In some cases reforms in pricing policy or the marketing system may have changed the incentive structure and helped boost productivity growth.
Road density is much lower in LDCs than in ODCs and developed countries. In African LDCs and Haiti, and in Asian LDCs, it corresponds to just 15 per cent and 33 per cent, respectively, of the level of ODCs (chart 2.11). Sub-Saharan Africa’s present road density, at 201 km/1000 km2, is less than a third of that of India in 1950 (703 km/1000 km2). Even Rwanda, the continent’s most densely populated country, does not have the road density of India in 1950. Today’s gap is even wider: India’s road density is 32 times that of Ethiopia and 255 times that of Sudan (Staatz and Dembélé, 2007).
Public investment in rural roads had the largest positive impact on agricultural productivity growth as compared with other explanatory variables, according to a study of country- and regional-level public expenditure in rural India (Fan, Hazell and Thorat, 1999). Other studies of the effect of road connectivity on input use, crop output and household income have suggested that isolation — defined as travel time during the dry season from a rural community to the nearest urban centre — entails lower agricultural productivity, increased
Four years of primary schooling are needed if education is to have a
significant effect on farm productivity.
Schooling not only enhances agricultural productivity following
technology adoption but also promotes the adoption itself.
Public spending has a significant influence on agricultural productivity
not only through outlays on knowledge-building, but also
through its investment in physical infrastructure.
Public investment is a precondition for private investment in agriculture
and stimulates the latter.
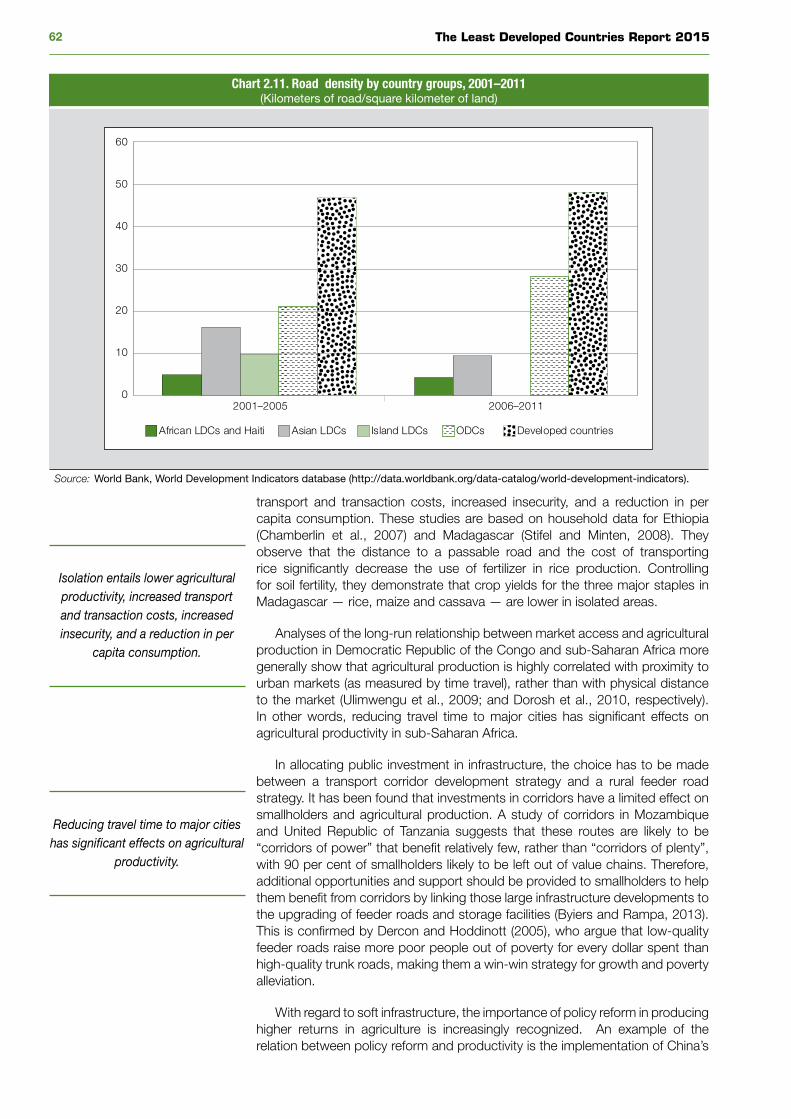
The Least Developed Countries Report 201562
transport and transaction costs, increased insecurity, and a reduction in per capita consumption. These studies are based on household data for Ethiopia (Chamberlin et al., 2007) and Madagascar (Stifel and Minten, 2008). They observe that the distance to a passable road and the cost of transporting rice significantly decrease the use of fertilizer in rice production. Controlling for soil fertility, they demonstrate that crop yields for the three major staples in Madagascar — rice, maize and cassava — are lower in isolated areas.
Analyses of the long-run relationship between market access and agricultural production in Democratic Republic of the Congo and sub-Saharan Africa more generally show that agricultural production is highly correlated with proximity to urban markets (as measured by time travel), rather than with physical distance to the market (Ulimwengu et al., 2009; and Dorosh et al., 2010, respectively). In other words, reducing travel time to major cities has significant effects on agricultural productivity in sub-Saharan Africa.
In allocating public investment in infrastructure, the choice has to be made between a transport corridor development strategy and a rural feeder road strategy. It has been found that investments in corridors have a limited effect on smallholders and agricultural production. A study of corridors in Mozambique and United Republic of Tanzania suggests that these routes are likely to be “corridors of power” that benefit relatively few, rather than “corridors of plenty”, with 90 per cent of smallholders likely to be left out of value chains. Therefore, additional opportunities and support should be provided to smallholders to help them benefit from corridors by linking those large infrastructure developments to the upgrading of feeder roads and storage facilities (Byiers and Rampa, 2013). This is confirmed by Dercon and Hoddinott (2005), who argue that low-quality feeder roads raise more poor people out of poverty for every dollar spent than high-quality trunk roads, making them a win-win strategy for growth and poverty alleviation.
With regard to soft infrastructure, the importance of policy reform in producing higher returns in agriculture is increasingly recognized. An example of the relation between policy reform and productivity is the implementation of China’s
Chart 2.11. Road density by country groups, 2001–2011(Kilometers of road/square kilometer of land)
0
10
20
30
40
50
60
2001–2005 2006–2011
African LDCs and Haiti Asian LDCs Island LDCs ODCs Developed countries
Source: World Bank, World Development Indicators database (http://data.worldbank.org/data-catalog/world-development-indicators).
Isolation entails lower agricultural productivity, increased transport and transaction costs, increased insecurity, and a reduction in per
capita consumption.
Reducing travel time to major cities has significant effects on agricultural
productivity.
63CHAPTER 2. Agricultural Productivity: Developments, Determinants and Impacts
“responsibility system” in 1980–1981, which linked productivity to material reward and resulted in increased crop yields “for every major crop” (Wiens, 1983). Lin (1992) calculated that 42–47 per cent of the growth in agricultural output between 1978 and 1984 was attributable to that system. In another example, price reforms implemented in Egypt in 1986 contributed to increased yields of wheat, maize and rice from 1987 to 1993 (Khedr, Ehrich and Fletcher, 1996). Bevan, Collier and Gunning (1993) show how agricultural production in United Republic of Tanzania accelerated after price controls and export taxes were removed in 1984. These are examples of the long-term process of structural transformation, in which typically net resource transfers from agriculture to other economic sectors are initially high, but are subsequently gradually reduced through changes in tax and other policies and regulatory mechanisms (Timmer, 1988).11 This evolution tends to change the incentives structure for farmers and to favour agricultural productivity growth.
Another form of institutional development that encourages productivity growth is the development of credit institutions and financial markets (including credit and insurance). The dearth of farmers’ access to these mechanisms, or the deficient quality of the supply of the services that are available to them, constitute major obstacles to their risk-taking, their adoption of new technologies and their improvements to productivity. Well-functioning, easily accessible markets for credit, for example, help farmers purchase productivity-enhancing inputs. Unfavourable social outcomes are more likely when these conditions are not in place.
Assigning property rights is viewed as a means of promoting development through the efficient and responsible use of resources (North, 1994). In the case of agriculture, it is argued that tenure security is an incentive for investment and that land property rights can be used as collateral for credit. In keeping with this view, many LDCs have adopted policies to title agricultural land, especially since the 1990s. However, this has also had unintended consequences. It tends to lead to larger average plot sizes, where economies of scale may supposedly be achieved. It also tends to result in large numbers of landless peasants. After titling and the creation of land markets, peasants often view the sale of small plots as an opportunity. However, becoming landless, and with limited opportunities for wage labour in rural areas, these ex-farmers have frequently been forced to emigrate to cities (Bouquet, 2015). Another mechanism of loss of access to land has often been the use of land as collateral in credit operations undertaken by farmers. This has happened a number of times in connection with microcredit operations, where farmers have not been able to service their debt because of the high interest rates which this type of credit typically entails.
4. agroeCologiCal Conditions and Climate Change
The natural fertility of soils is a major determinant of land productivity, as are the other agroecological conditions under which farmers produce. Farmers’ investment decisions and agricultural practices can enhance or alternatively deplete the natural fertility of the soil. The irreversibility of investment in agriculture means that once investment is made, it is impossible — or at least very difficult — to redirect it to uses other than that originally planned. While this is common to any form of physical investment, it occurs much more frequently in agriculture than in other sectors. Allied with the inherent uncertainties of investment, this means that farmers tend to underinvest in equipment, land improvement and human capital. In any given year, net agricultural investment is likely to be negative (depreciation is higher than gross investment (Zepeda, 2001)). This is particularly true in LDCs, where low income and limited financial market development render access to insurance especially difficult for farmers. Therefore, in the absence of investment in land regeneration and low fertilizer
The dearth of farmers’ access to credit institutions and financial
markets constitutes a major obstacle to their risk-taking, their adoption
of new technologies and their improvements to productivity.
Agricultural land titling tends to lead to larger average plot sizes, where economies of scale may
be achieved.
Farmers tend to underinvest in equipment, land improvement
and human capital.
The Least Developed Countries Report 201564
use, land quality tends to deteriorate. This has an adverse long-term impact on land productivity.
These factors will likely be affected by climate change and its related developments, such as temperature increases, changes in precipitation, decreased predictability of rainy seasons and increased frequency of extreme weather events (Keane et al., 2009). Their effects will vary considerably even within countries, ranging from agricultural areas that are lost to those that are gained, and from yield decreases to increases in different areas/crops. For low-income countries, estimates of changes in yield due to climate change between 2000 and 2050 range from -0.51 to -3.37 per cent for maize, from +1.61 to -9.79 per cent for rice and from -10.09 to -18.0 per cent for wheat (Nelson et al., 2010). In aggregate terms, agricultural output is projected to decline by the late twenty-first century even under the most optimistic scenario. The latter assumes carbon fertilization, which means that an increased concentration of carbon dioxide in the atmosphere (associated with climate change) can to some extent have a positive effect on crop productivity, since it stimulates photosynthesis and reduces loss of water by plants. Agricultural production is projected to contract in all 21 LDCs for which data are available, but in proportions that vary widely from less than 5 per cent in Democratic Republic of the Congo, Nepal, Somalia and Uganda to more than 40 per cent in Central African Republic and Senegal (Chart 2.12). The negative impact is generally much greater in African
Chart 2.12. Estimated loss in agricultural output by the 2080s, selected LDCs(Per cent of agricultural output in 2003)
0 10 20 30 40 50 60
Dem. Rep. of the Congo
Somalia
Uganda
Nepal
Bangladesh
Mozambique
United Rep. of Tanzania
Burkina Faso
Afghanistan
Madagascar
Cambodia
Malawi
Liberia
Guinea-Bissau
Sierra Leone
Guinea
Niger
Mali
Zambia
Senegal
Central African Republic
Source: UNCTAD secretariat elaboration, based on data from Cline (2007).Note: Estimates include carbon fertilization, where an increased concentration of carbon dioxide in the atmosphere acts as a stimulus
to crop productivity.
Agricultural output is projected to decline by the late twenty-first
century even under the most optimistic scenario.

65CHAPTER 2. Agricultural Productivity: Developments, Determinants and Impacts
Chart 2.13. Agricultural productivity, land/labour ratios and rural diversification in selected LDCs
0
200
400
600
800
1000
1200
1400
0 20 40 60 80 100 120
Out
put
per w
orke
r (c
urre
nt d
olla
rs)
Per cent of rural workers employed outside agriculture
A. Output per worker and rural diversi�cation
0.0
0.5
1.0
1.5
2.0
2.5
3.0
3.5
4.0
0 20 40 60 80 100 120
Land
/labo
ur r
atio
(hec
tare
s/w
orke
r)
Per cent of rural workers employed outside agriculture
B. Land/labour ratio and rural diversi�cation
Source: UNCTAD secretariat calculations, based on data from FAO, FAOSTAT database (http://faostat.fao.org/) and DHS Program database (www.dhsprogram.com) (both accessed May 2015).
than in Asian LDCs. Considering that the agricultural labour force is projected to continue increasing in all of these countries, climate change is expected to cause a contraction of labour productivity (ceteris paribus) of even greater proportions.
5. rural diversifiCation
Rural diversification (discussed in Chapter 3) is a key driver and facilitator of productivity growth and upgrading in agriculture. The rise in off-farm income provides an additional source of financing for agricultural investment and technological upgrading, and the development of off-farm activities increases the supply of important inputs and services for agriculture, while also boosting demand growth for agricultural production. Improved vertical coordination is critical to achieving the timely flow of productivity-enhancing inputs to farmers and of quality agricultural raw materials to agro-industry. At the same time, production must be closely aligned with the rapidly evolving demands of consumers. Structural change in farming and agro-industry are thus closely interrelated (Staatz, 2011).
The negative impact of climate change on agricultural production
is generally much greater in African than in Asian LDCs.
The Least Developed Countries Report 201566
More diversified rural economies tend to register higher levels of labour productivity in the agricultural sector, as shown by the positive correlation (around 0.4) between rural diversification and labour productivity in the agricultural sector for a sample of 26 LDCs in all geographical regions (chart 2.13A).12
The increases in labour productivity related to rural diversification, however, are not associated with increases in land productivity. There is, in fact, no sign of positive correlation between land productivity and percentage of employment outside the agricultural sector. More diversified rural economies employ fewer workers, on average, in agriculture and are therefore characterized by relatively higher land/labour ratios (chart 2.13B). This relatively lower utilization of land may in part explain why the improvements in labour productivity are not reflected in higher yields per hectare.
E. Summary
The main points raised in this chapter are:
• LDC agriculture employs land and labour intensively, but makes limited use of other inputs (fertilizers, irrigated water, machinery), which results in low levels of productivity.
• Increasing land and labour productivity in agriculture is critical to structural transformation, poverty reduction and food security.
• Agricultural productivity declined across all LDC subgroups in the 1980s, and has exhibited strong growth only in Asian LDCs since 2000, allowing them to overtake the African and island LDCs.
• Labour productivity in agriculture in LDCs (with sectoral production measured by value added) is 18.7 per cent of that in ODCs and 1.8 per cent that in developed countries, and these gaps have widened progressively over time.
• Land productivity has risen much faster in LDCs than labour productivity, starting to converge with developed countries but not with ODCs, and the gaps are much narrower.
• Land/labour ratios have declined for all LDC geographical subgroups.
• Total factor productivity in LDC agriculture stagnated from the 1960s to the 1980s, but started to increase in the 1990s and accelerated after 2000, especially in Asian LDCs.
• Major drivers of increasing agricultural productivity are use and quality of inputs, development and adoption of high-yield varieties, education, public investment in infrastructure and diversification into non-farm activities.
• Well integrated national and international efforts towards technology generation and innovation diffusion can make a major contribution to raising agricultural productivity.
• Public policies can greatly contribute to enhancing agricultural productivity through spending on R&D, extension services, education, and physical and institutional infrastructure.
• Climate change is likely to have a negative effect on agricultural productivity in most LDCs.
More diversified rural economies tend to register higher levels of labour productivity in the
agricultural sector.
67CHAPTER 2. Agricultural Productivity: Developments, Determinants and Impacts
Notes
1 As used in this chapter, “agriculture” refers to agriculture, forestry and fisheries, unless otherwise specified.
2 Conflicts of land use are bound to arise when land becomes scarcer and extensive expansion of agricultural production (which has been the practice especially in African LDCs) becomes more difficult.
3 For the classification of LDCs according to geographical/structural criteria, see page xiii.
4 Data on productivity trends and developments in individual countries are provided in the annex to this chapter.
5 For the classification of LDCs according to export specialization, see page xiii.6 Between 2015 and 2100, the populations of 33 countries, most of them LDCs,
have a high probability of at least tripling. Among them, the populations of Angola, Burundi, Democratic Republic of Congo, Malawi, Mali, Niger, Somalia, Uganda, United Republic of Tanzania and Zambia are projected to increase at least fivefold by 2100. The concentration of population growth in the poorest countries will make it harder for their governments to eradicate poverty and inequality; combat hunger and malnutrition; expand education enrolment and health systems; improve the provision of basic services; and implement other elements of a sustainable development agenda to ensure that no one is left behind (UN/DESA, Population Division, 2015).
7 A study of the competitiveness of commercial agriculture compared the on-farm per-unit production costs for several agricultural products produced in the Guinea-Savannah regions of Africa with production costs for the same products in Brazil and Thailand. It showed that while African farm-level costs were comparable to those in Brazil and Thailand, this “competitiveness” was based on: (1) soil mining (the depletion of soil nutrient reserves, leading to soil degradation); and (2) extremely low returns to labour, reflecting few alternative employment opportunities for workers — hardly a model for poverty reduction (World Bank, 2009).
8 The proportion of land under irrigation in sub-Saharan Africa is currently less than a quarter of that of India in 1961, at the dawn of its green revolution. Increasing the percentage of irrigated land in sub-Saharan Africa to the Indian levels of 1960 would cost approximately $114 billion.
9 The capital intensity of the agriculture of developed countries is significantly higher than that of developing countries, including both LDCs and ODCs. The former use 54.5 machines per hectare, five times as many as in ODCs.
10 In the case of India, public investment in research accounts for over half of agricultural growth, while extension contributes about one third and infrastructure accounts for very little growth. Internal rates of return were estimated at 218 per cent for public research, 177 per cent for public extension and 95 per cent for private research expenditures (Evenson and McKinsey Jr., 1991).
11 In developed countries, this process has typically gone furthest, to the point where other economic sectors transfer net resources to agriculture.
12 Data on rural diversification are extracted from several demographic and health surveys (DHS). Diversification is measured by the share of rural labour force working outside the agricultural sector. For labour productivity, for each country in the sample the most recent DHS available and the corresponding level of output per worker for the same year are used.

The Least Developed Countries Report 201568
References
AfDB, FAO, IFAD, IWMI and World Bank (2007). Investment in agricultural water for poverty reduction and economic growth in sub-Saharan Africa: synthesis report. World Bank. Washington, D.C.
Alene A and V Manyong (2007). The effects of education on agricultural productivity under traditional and improved technology in northern Nigeria: An endogenous switching regression analysis. Empirical Economics. 32(1): 141–159.
Asfaw A and A Admassie (1996). The impact of education on allocative and technical efficiency of farmers: The case of Ethiopian smallholders. Ethiopian Journal of Economics. 5(1): 1–26.
Baumol WJ (1967). Macroeconomics of unbalanced growth: The anatomy of urban crisis. American Economic Review. 57(3): 415–426.
Beintema NM and G-J Stads (2006). Agricultural R&D in sub-Saharan Africa: an era of stagnation. Agricultural Science and Technology Indicators Initiative Background Report. International Food Policy Research Institute. Washington, D.C.
Beintema NM, G-J Stads, KO Fuglie and P Heisey (2012). ASTI global assessment of agricultural R&D spending: developing countries accelerate investment. International Food Policy Research Institute, Agricultural Science and Technology Indicators and Global Forum on Agricultural Research. Washington, D.C. and Rome.
Bevan D, P Collier and JW Gunning (1993). Government policies and agricultural performance: Tanzania and Kenya. In: Goldin I, ed. Economic Reform, Trade and Agricultural Development. Organisation for Economic Co-operation and Development. Paris.
Block S (2010). The decline and rise of agricultural productivity in sub-Saharan Africa since 1961. NBER Working Paper 16481. National Bureau of Economic Research. Cambridge, MA.
Block SA (1995). The recovery of agricultural productivity in sub-Saharan Africa. Food Policy. 20(5): 385–405.
Boserup E (1981). Population and Technology. Blackwell. Oxford.Bouquet C (2015). Bientôt on comptera des dizaines de millions de paysans sans terre
en Afrique subsaharienne. Hérodote. 156: 93–107.Byerlee D and D Jewell (1997). The technological foundation of the revolution. In: Byerlee
D and CK Eicher, eds. Africa’s Emerging Maize Revolution. Lynne Rieder Publishers. Boulder, CO: 127–144.
Byiers B and F Rampa (2013). Corridors of power or plenty? Lessons from Tanzania and Mozambique and implications for CAADP. ECDPM Discussion Paper 138. European Centre for Development Policy Management. Maastricht.
Chamberlin J, M Tadesse, T Benson and S Zakaria (2007). An Atlas of the Ethiopian rural economy: expanding the range of available information for development planning. Information Development. 23(2/3): 181–192.
Cline WR (2007). Global Warming and Agriculture: Impact Estimates by Country. Center for Global Development and Peterson Institute for International Economics. Washington, D.C.
Dercon S, DO Gilligan, J Hoddinott and T Woldehanna (2008). The impact of agricultural extension and roads on poverty and consumption growth in fifteen Ethiopian villages. IFPRI Discussion Paper 00840. International Food Policy Research Institute. Washington, D.C.
Dercon S and J Hoddinott (2005). Livelihoods, growth, and links to market towns in 15 Ethiopian villages. FCND Discussion Paper 194. International Food Policy Research Institute. Washington, D.C.
Dias Avila AF and RE Evenson (2010). Total factor productivity growth in agriculture: The role of technological capital. In: Pingali PL and RE Evenson, eds. Handbook of Agricultural Economics. Elsevier. Amsterdam: 3769–3822.
Dorosh PA, H-G Wang, L You and E Schmidt (2010). Crop production and road connectivity in sub-Saharan Africa : a spatial analysis. Policy Research Working Paper 5385. World Bank. Washington, D.C.
Druilhe Z and J Barreiro-Hurlé (2012). Fertilizer subsidies in sub-Saharan Africa. ESA Working Paper 12-04. Agricultural Development Economics Division– Food and Agriculture Organization of the United Nations. Rome.
Evenson RE and JW McKinsey Jr. (1991). Research, extension, infrastructure and productivity change in Indian agriculture. In: Evenson RE and CE Pray, eds. Research and Productivity in Asian Agriculture. Cornell University Press. Ithaca.
69CHAPTER 2. Agricultural Productivity: Developments, Determinants and Impacts
Fan S, PBR Hazell PBR and S Thorat (1999). Linkages between government spending, growth, and poverty in rural India. IFPRI Research Report 110. International Food Policy Research Institute. Washington, D.C.
Fuglie KO and NE Rada (2013). Resources, policies, and agricultural productivity in sub-Saharan Africa. Economic Research Report 145. United States Department of Agriculture, Economic Research Service. Washington, D.C.
Fulginiti LE and RK Perrin (1997). LDC Agriculture: Non-parametric Malmquist productivity indexes. Journal of Development Economics. 53(2): 373–390.
Gabre-Madin EZ and S Haggblade (2004). Successes in African agriculture: Results of an expert survey. World Development. 32(5): 745–766.
Goedhuys M, N Janz and P Mohnen (2013). Knowledge-based productivity in “low-tech” industries: Evidence from firms in developing countries. Industrial and Corporate Change. 23(1): 1–23.
Gollin D (2010). Agricultural productivity and economic growth. In: Pingali PL and RE Evenson, eds. Handbook of Agricultural Economics. Elsevier. Amsterdam: 3825–3866.
Griliches Z (1987). Productivity: Measurement problems. In: Eatwell J, M Milgate and P Newman, eds. The New Palgrave: A Dictionary of Economics, 1st edition, vol.3: 8084–8091. Palgrave Macmillan. London.
Hayami Y and VW Ruttan (1985). Agricultural Development: An International Perspective. The Johns Hopkins Studies in Development. Johns Hopkins University Press. Baltimore.
Hazell PBR and L Haddad (2001). CGIAR research and poverty reduction. Paper prepared for the Technical Advisory Committee of the CGIAR. International Food Policy Research Institute. Washington, D.C.
Jahnke HE, D Kirschke and J Lagemann (1987). The impact of agricultural research in tropical Africa: a study of the collaboration between the international and national research systems. CGIAR Study Paper 21. Consultative Group on International Agricultural Research. Washington, D.C.
Johnston BF and JW Mellor (1961). The role of agriculture in economic development. American Economic Review. 51(4): 566–593.
Keane J, S Page, A Kergna and J Kennan (2009). Climate change and developing country agriculture: an overview of expected impacts, adaptation and mitigation challenges, and funding requirements. Issues Brief 2. International Centre for Trade and Sustainable Development and International Food and Agricultural Trade Policy Council. Geneva and Washington, D.C.
Kerr J and S Kolavalli (1999). Impact of agricultural research on poverty alleviation: conceptual framework with illustrations fom the literature. Environment and Production Technology Division Discussion Paper 56. International Food Policy Research Institute. Washington, D.C.
Khedr H, R Ehrich and LB Fletcher (1996). Nature, rationale and accomplishments of the agricultural policy reforms, 1987–1994. Egypt’s Agriculture in a Reform Era. Iowa State University Press. Ames, IA.
Kuznets S (1966). Modern Economic Growth: Rate, Structure and Spread. Yale University Press. New Haven and London.
Lewis WA (1954). Economic development with unlimited supplies of labour. Manchester School of Economic and Social Studies. 22(2): 139–191.
Lin JY (1992). Rural Reforms and Agricultural Growth in China. American Economic Review. 82(1): 34–51.
Lockheed ME, DT Jamison and LJ Lau (1980). Farmer education and farm efficiency: A survey. Economic Development and Cultural Change. 29(1): 37–76.
Murphy KM, A Shleifer and RW Vishny (1989). Income distribution, market size, and industrialization. Quarterly Journal of Economics. 104(3): 537–564.
Nelson GC, MW Rosegrant, A Palazzo, I Gray, C Ingersoll, R Robertson, S Tokgoz, T Zhu, TB Sulser, C Ringler, S Msangi and L You (2010). Food security, farming, and climate change to 2050: scenarios, results, policy options. IFPRI Research Monographs. International Food Policy Research Institute. Washington, D.C.
North DC (1994). Economic performance through time. American Economic Review. 84(3): 359–368.
Pardey PG, NM Beintema, S Dehmer and S Wood (2006). Agricultural research: a growing global divide? Agricultural Policy. International Food Policy Research Institute. Washington, D.C.
Phillips JM (1994). Farmer education and farmer efficiency: A meta-analysis. Economic Development and Cultural Change. 43(1): 149–165.
The Least Developed Countries Report 201570
Ravallion M and G Datt (1999). When is growth pro-poor? Evidence from the diverse experiences of India’s states. Policy Research Working Paper Series 2263. World Bank. Washington, D.C.
Roepstoff TM, AM Hawkins, DW te Velde and N Cantore (2011). The new policy space. In: Yumkella KK, PM Kormawa, TM Roepstoff and AM Hawkins, eds. Agribusiness for Africa’s Prosperity. United Nations Industrial Development Organization. Vienna.
Rosenberg N (1982). Inside the Black Box : Technology and Economics. Cambridge University Press. Cambridge.
Rostow WW (1960). The Process of Economic Growth. Clarendon Press. Oxford.Sahn DE, PA Dorosh and SD Younger (1999). Structural Adjustment Reconsidered.
Cambridge University Press. Cambridge.Schultz TW (1972). Human capital: Policy issues and research opportunities. In: Schultz
TW, ed. Economic Research: Retrospect and Prospect , Vol. 6 , Human Resources. National Bureau of Economic Research. Cambridge, MA: 1–84.
Staatz J (2011). Enhancing agricultural productivity. In: Yumkella KK, PM Kormawa, TM Roepstoff and AM Hawkins, eds. Agribusiness for Africa’s Prosperity. United Nations Industrial Development Organization. Vienna: 58–86.
Staatz JM and NN Dembélé (2007). Agriculture for development in sub-Saharan Africa. Background paper for the World Development Report 2008. World Bank. Washington, D.C.
Stamoulis K and A Zezza (2003). A conceptual framework for national agricultural, rural development, and food security strategies and policies. ESA Working Paper 03-17. Food and Agriculture Organization of the United Nations. Rome.
Stifel D and B Minten (2008). Isolation and agricultural productivity. Agricultural Economics. 39(1): 1–15.
Timmer CP (1988). The agricultural transformation. In: Chenery HB and TN Srinivasan, eds. Handbook of Development Economics. Elsevier. Amsterdam: 275–331.
Ulimwengu J, J Funes, D Headey and L You (2009). Paving the way for development? The impact of transport infrastructure on agricultural production and poverty reduction in the Democratic Republic of Congo. IFPRI Discussion Paper 944. International Food Policy Research Institute. Washington, D.C.
UNCTAD (2013). The Least Developed Countries Report: Growth with Employment for Inclusive and Sustainable Development. United Nations publication. Sales No. E.13.II.D.1. United Nations Conference on Trade and Development. New York and Geneva.
UNCTAD (2014). The Least Developed Countries Report 2014: Growth with Structural Transformation - A Post-2015 Development Agenda. United Nations publication. Sales No. E.14.II.D.7. United Nations Conference on Trade and Development. New York and Geneva.
UN/DESA, Population Division (2015). World population prospects: the 2015 revision: key findings and advance tables. UN/DESA Working Paper ESA. United Nations Department of Economic and Social Affairs. New York.
von Braun J, T Teklu and P Webb (1998). Famine in Africa: Causes, Responses, and Prevention. Johns Hopkins University Press for IFPRI. Baltimore and London.
Weir S (1999). The effects of education on farmer productivity in rural Ethiopia. CSAE Working Paper WPS99-7. Centre for the Study of African Economies - University of Oxford. Oxford.
Wiens TB (1983). Price adjustment, the responsibility system, and agricultural productivity. American Economic Review. 73(2): 319–324.
Wolf EC (1987). Raising agricultural productivity. In: Brown LR, ed. State of the World: A Worldwatch Instittute Report on Progress Toward a Sustainable Society. Worldwatch Institute. Washington, D.C.: 139–156.
World Bank (2009). Awakening Africa’s Sleeping Giant: Prospects for Commercial Agriculture in the Guinea Savannah Zone and beyond. Directions in Development. Agriculture and Rural Development 49046. World Bank, Cooperazione Italiana and Food and Agriculture Organization of the United Nations. Washington, D.C.
World Food Summit (1996). Rome Declaration on World Food Security. Rome.Zepeda L (2001). Agricultural investment, production capacity and productivity. In: Zepeda
L, ed. Agricultural Investment and Productivity in Developing Countries. FAO Economic and Social Development Paper. Food and Agriculture Organization of the United Nations. Rome: 3–20.
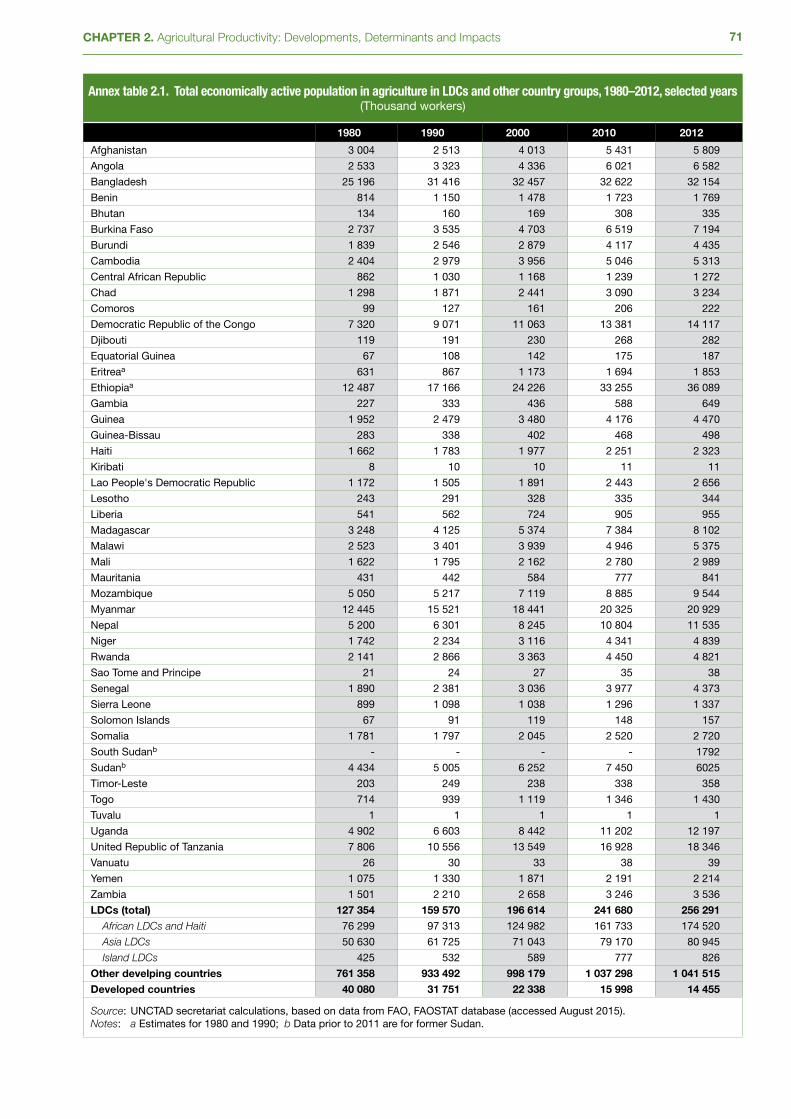
71CHAPTER 2. Agricultural Productivity: Developments, Determinants and Impacts
Annex table 2.1. Total economically active population in agriculture in LDCs and other country groups, 1980–2012, selected years(Thousand workers)
1980 1990 2000 2010 2012
Afghanistan 3 004 2 513 4 013 5 431 5 809
Angola 2 533 3 323 4 336 6 021 6 582
Bangladesh 25 196 31 416 32 457 32 622 32 154
Benin 814 1 150 1 478 1 723 1 769
Bhutan 134 160 169 308 335
Burkina Faso 2 737 3 535 4 703 6 519 7 194
Burundi 1 839 2 546 2 879 4 117 4 435
Cambodia 2 404 2 979 3 956 5 046 5 313
Central African Republic 862 1 030 1 168 1 239 1 272
Chad 1 298 1 871 2 441 3 090 3 234
Comoros 99 127 161 206 222
Democratic Republic of the Congo 7 320 9 071 11 063 13 381 14 117
Djibouti 119 191 230 268 282
Equatorial Guinea 67 108 142 175 187
Eritreaa 631 867 1 173 1 694 1 853
Ethiopiaa 12 487 17 166 24 226 33 255 36 089
Gambia 227 333 436 588 649
Guinea 1 952 2 479 3 480 4 176 4 470
Guinea-Bissau 283 338 402 468 498
Haiti 1 662 1 783 1 977 2 251 2 323
Kiribati 8 10 10 11 11
Lao People's Democratic Republic 1 172 1 505 1 891 2 443 2 656
Lesotho 243 291 328 335 344
Liberia 541 562 724 905 955
Madagascar 3 248 4 125 5 374 7 384 8 102
Malawi 2 523 3 401 3 939 4 946 5 375
Mali 1 622 1 795 2 162 2 780 2 989
Mauritania 431 442 584 777 841
Mozambique 5 050 5 217 7 119 8 885 9 544
Myanmar 12 445 15 521 18 441 20 325 20 929
Nepal 5 200 6 301 8 245 10 804 11 535
Niger 1 742 2 234 3 116 4 341 4 839
Rwanda 2 141 2 866 3 363 4 450 4 821
Sao Tome and Principe 21 24 27 35 38
Senegal 1 890 2 381 3 036 3 977 4 373
Sierra Leone 899 1 098 1 038 1 296 1 337
Solomon Islands 67 91 119 148 157
Somalia 1 781 1 797 2 045 2 520 2 720
South Sudanb - - - - 1792
Sudanb 4 434 5 005 6 252 7 450 6025
Timor-Leste 203 249 238 338 358
Togo 714 939 1 119 1 346 1 430
Tuvalu 1 1 1 1 1
Uganda 4 902 6 603 8 442 11 202 12 197
United Republic of Tanzania 7 806 10 556 13 549 16 928 18 346
Vanuatu 26 30 33 38 39
Yemen 1 075 1 330 1 871 2 191 2 214
Zambia 1 501 2 210 2 658 3 246 3 536
LDCs (total) 127 354 159 570 196 614 241 680 256 291 African LDCs and Haiti 76 299 97 313 124 982 161 733 174 520
Asia LDCs 50 630 61 725 71 043 79 170 80 945
Island LDCs 425 532 589 777 826
Other develping countries 761 358 933 492 998 179 1 037 298 1 041 515Developed countries 40 080 31 751 22 338 15 998 14 455
Source: UNCTAD secretariat calculations, based on data from FAO, FAOSTAT database (accessed August 2015).Notes: a Estimates for 1980 and 1990; b Data prior to 2011 are for former Sudan.
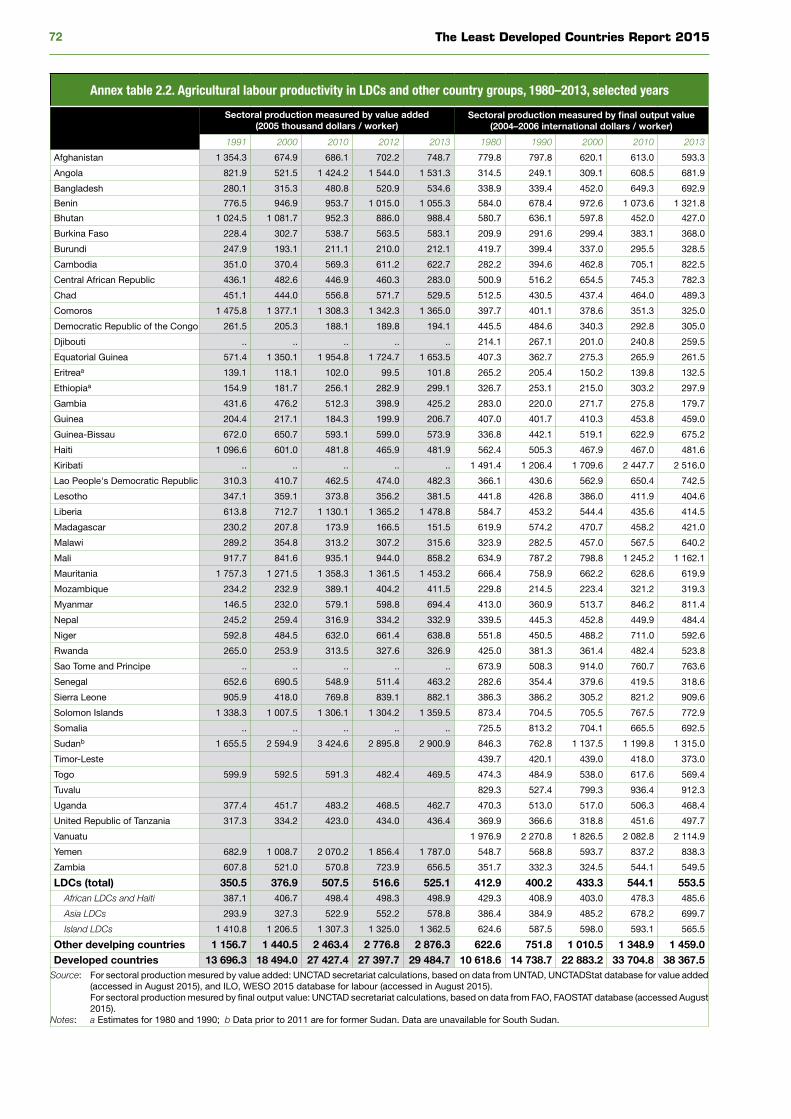
The Least Developed Countries Report 201572
Annex table 2.2. Agricultural labour productivity in LDCs and other country groups, 1980–2013, selected years
Sectoral production measured by value added(2005 thousand dollars / worker)
Sectoral production measured by final output value(2004–2006 international dollars / worker)
1991 2000 2010 2012 2013 1980 1990 2000 2010 2013
Afghanistan 1 354.3 674.9 686.1 702.2 748.7 779.8 797.8 620.1 613.0 593.3
Angola 821.9 521.5 1 424.2 1 544.0 1 531.3 314.5 249.1 309.1 608.5 681.9
Bangladesh 280.1 315.3 480.8 520.9 534.6 338.9 339.4 452.0 649.3 692.9
Benin 776.5 946.9 953.7 1 015.0 1 055.3 584.0 678.4 972.6 1 073.6 1 321.8
Bhutan 1 024.5 1 081.7 952.3 886.0 988.4 580.7 636.1 597.8 452.0 427.0
Burkina Faso 228.4 302.7 538.7 563.5 583.1 209.9 291.6 299.4 383.1 368.0
Burundi 247.9 193.1 211.1 210.0 212.1 419.7 399.4 337.0 295.5 328.5
Cambodia 351.0 370.4 569.3 611.2 622.7 282.2 394.6 462.8 705.1 822.5
Central African Republic 436.1 482.6 446.9 460.3 283.0 500.9 516.2 654.5 745.3 782.3
Chad 451.1 444.0 556.8 571.7 529.5 512.5 430.5 437.4 464.0 489.3
Comoros 1 475.8 1 377.1 1 308.3 1 342.3 1 365.0 397.7 401.1 378.6 351.3 325.0
Democratic Republic of the Congo 261.5 205.3 188.1 189.8 194.1 445.5 484.6 340.3 292.8 305.0
Djibouti .. .. .. .. .. 214.1 267.1 201.0 240.8 259.5
Equatorial Guinea 571.4 1 350.1 1 954.8 1 724.7 1 653.5 407.3 362.7 275.3 265.9 261.5
Eritreaa 139.1 118.1 102.0 99.5 101.8 265.2 205.4 150.2 139.8 132.5
Ethiopiaa 154.9 181.7 256.1 282.9 299.1 326.7 253.1 215.0 303.2 297.9
Gambia 431.6 476.2 512.3 398.9 425.2 283.0 220.0 271.7 275.8 179.7
Guinea 204.4 217.1 184.3 199.9 206.7 407.0 401.7 410.3 453.8 459.0
Guinea-Bissau 672.0 650.7 593.1 599.0 573.9 336.8 442.1 519.1 622.9 675.2
Haiti 1 096.6 601.0 481.8 465.9 481.9 562.4 505.3 467.9 467.0 481.6
Kiribati .. .. .. .. .. 1 491.4 1 206.4 1 709.6 2 447.7 2 516.0
Lao People's Democratic Republic 310.3 410.7 462.5 474.0 482.3 366.1 430.6 562.9 650.4 742.5
Lesotho 347.1 359.1 373.8 356.2 381.5 441.8 426.8 386.0 411.9 404.6
Liberia 613.8 712.7 1 130.1 1 365.2 1 478.8 584.7 453.2 544.4 435.6 414.5
Madagascar 230.2 207.8 173.9 166.5 151.5 619.9 574.2 470.7 458.2 421.0
Malawi 289.2 354.8 313.2 307.2 315.6 323.9 282.5 457.0 567.5 640.2
Mali 917.7 841.6 935.1 944.0 858.2 634.9 787.2 798.8 1 245.2 1 162.1
Mauritania 1 757.3 1 271.5 1 358.3 1 361.5 1 453.2 666.4 758.9 662.2 628.6 619.9
Mozambique 234.2 232.9 389.1 404.2 411.5 229.8 214.5 223.4 321.2 319.3
Myanmar 146.5 232.0 579.1 598.8 694.4 413.0 360.9 513.7 846.2 811.4
Nepal 245.2 259.4 316.9 334.2 332.9 339.5 445.3 452.8 449.9 484.4
Niger 592.8 484.5 632.0 661.4 638.8 551.8 450.5 488.2 711.0 592.6
Rwanda 265.0 253.9 313.5 327.6 326.9 425.0 381.3 361.4 482.4 523.8
Sao Tome and Principe .. .. .. .. .. 673.9 508.3 914.0 760.7 763.6
Senegal 652.6 690.5 548.9 511.4 463.2 282.6 354.4 379.6 419.5 318.6
Sierra Leone 905.9 418.0 769.8 839.1 882.1 386.3 386.2 305.2 821.2 909.6
Solomon Islands 1 338.3 1 007.5 1 306.1 1 304.2 1 359.5 873.4 704.5 705.5 767.5 772.9
Somalia .. .. .. .. .. 725.5 813.2 704.1 665.5 692.5
Sudanb 1 655.5 2 594.9 3 424.6 2 895.8 2 900.9 846.3 762.8 1 137.5 1 199.8 1 315.0
Timor-Leste 439.7 420.1 439.0 418.0 373.0
Togo 599.9 592.5 591.3 482.4 469.5 474.3 484.9 538.0 617.6 569.4
Tuvalu 829.3 527.4 799.3 936.4 912.3
Uganda 377.4 451.7 483.2 468.5 462.7 470.3 513.0 517.0 506.3 468.4
United Republic of Tanzania 317.3 334.2 423.0 434.0 436.4 369.9 366.6 318.8 451.6 497.7
Vanuatu 1 976.9 2 270.8 1 826.5 2 082.8 2 114.9
Yemen 682.9 1 008.7 2 070.2 1 856.4 1 787.0 548.7 568.8 593.7 837.2 838.3
Zambia 607.8 521.0 570.8 723.9 656.5 351.7 332.3 324.5 544.1 549.5
LDCs (total) 350.5 376.9 507.5 516.6 525.1 412.9 400.2 433.3 544.1 553.5 African LDCs and Haiti 387.1 406.7 498.4 498.3 498.9 429.3 408.9 403.0 478.3 485.6
Asia LDCs 293.9 327.3 522.9 552.2 578.8 386.4 384.9 485.2 678.2 699.7
Island LDCs 1 410.8 1 206.5 1 307.3 1 325.0 1 362.5 624.6 587.5 598.0 593.1 565.5
Other develping countries 1 156.7 1 440.5 2 463.4 2 776.8 2 876.3 622.6 751.8 1 010.5 1 348.9 1 459.0Developed countries 13 696.3 18 494.0 27 427.4 27 397.7 29 484.7 10 618.6 14 738.7 22 883.2 33 704.8 38 367.5
Source: For sectoral production mesured by value added: UNCTAD secretariat calculations, based on data from UNTAD, UNCTADStat database for value added (accessed in August 2015), and ILO, WESO 2015 database for labour (accessed in August 2015).
For sectoral production mesured by final output value: UNCTAD secretariat calculations, based on data from FAO, FAOSTAT database (accessed August 2015).
Notes: a Estimates for 1980 and 1990; b Data prior to 2011 are for former Sudan. Data are unavailable for South Sudan.
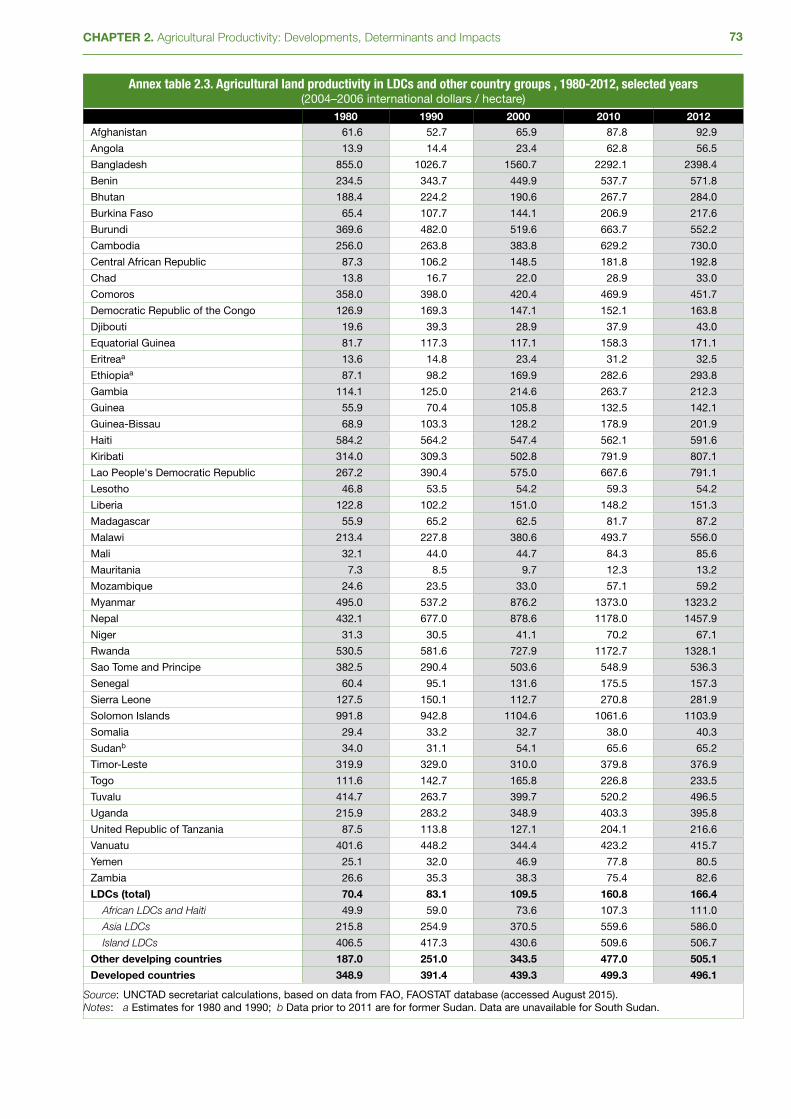
73CHAPTER 2. Agricultural Productivity: Developments, Determinants and Impacts
Annex table 2.3. Agricultural land productivity in LDCs and other country groups , 1980-2012, selected years (2004–2006 international dollars / hectare)
1980 1990 2000 2010 2012Afghanistan 61.6 52.7 65.9 87.8 92.9
Angola 13.9 14.4 23.4 62.8 56.5
Bangladesh 855.0 1026.7 1560.7 2292.1 2398.4
Benin 234.5 343.7 449.9 537.7 571.8
Bhutan 188.4 224.2 190.6 267.7 284.0
Burkina Faso 65.4 107.7 144.1 206.9 217.6
Burundi 369.6 482.0 519.6 663.7 552.2
Cambodia 256.0 263.8 383.8 629.2 730.0
Central African Republic 87.3 106.2 148.5 181.8 192.8
Chad 13.8 16.7 22.0 28.9 33.0
Comoros 358.0 398.0 420.4 469.9 451.7
Democratic Republic of the Congo 126.9 169.3 147.1 152.1 163.8
Djibouti 19.6 39.3 28.9 37.9 43.0
Equatorial Guinea 81.7 117.3 117.1 158.3 171.1
Eritreaa 13.6 14.8 23.4 31.2 32.5
Ethiopiaa 87.1 98.2 169.9 282.6 293.8
Gambia 114.1 125.0 214.6 263.7 212.3
Guinea 55.9 70.4 105.8 132.5 142.1
Guinea-Bissau 68.9 103.3 128.2 178.9 201.9
Haiti 584.2 564.2 547.4 562.1 591.6
Kiribati 314.0 309.3 502.8 791.9 807.1
Lao People's Democratic Republic 267.2 390.4 575.0 667.6 791.1
Lesotho 46.8 53.5 54.2 59.3 54.2
Liberia 122.8 102.2 151.0 148.2 151.3
Madagascar 55.9 65.2 62.5 81.7 87.2
Malawi 213.4 227.8 380.6 493.7 556.0
Mali 32.1 44.0 44.7 84.3 85.6
Mauritania 7.3 8.5 9.7 12.3 13.2
Mozambique 24.6 23.5 33.0 57.1 59.2
Myanmar 495.0 537.2 876.2 1373.0 1323.2
Nepal 432.1 677.0 878.6 1178.0 1457.9
Niger 31.3 30.5 41.1 70.2 67.1
Rwanda 530.5 581.6 727.9 1172.7 1328.1
Sao Tome and Principe 382.5 290.4 503.6 548.9 536.3
Senegal 60.4 95.1 131.6 175.5 157.3
Sierra Leone 127.5 150.1 112.7 270.8 281.9
Solomon Islands 991.8 942.8 1104.6 1061.6 1103.9
Somalia 29.4 33.2 32.7 38.0 40.3
Sudanb 34.0 31.1 54.1 65.6 65.2
Timor-Leste 319.9 329.0 310.0 379.8 376.9
Togo 111.6 142.7 165.8 226.8 233.5
Tuvalu 414.7 263.7 399.7 520.2 496.5
Uganda 215.9 283.2 348.9 403.3 395.8
United Republic of Tanzania 87.5 113.8 127.1 204.1 216.6
Vanuatu 401.6 448.2 344.4 423.2 415.7
Yemen 25.1 32.0 46.9 77.8 80.5
Zambia 26.6 35.3 38.3 75.4 82.6
LDCs (total) 70.4 83.1 109.5 160.8 166.4
African LDCs and Haiti 49.9 59.0 73.6 107.3 111.0
Asia LDCs 215.8 254.9 370.5 559.6 586.0
Island LDCs 406.5 417.3 430.6 509.6 506.7
Other develping countries 187.0 251.0 343.5 477.0 505.1
Developed countries 348.9 391.4 439.3 499.3 496.1
Source: UNCTAD secretariat calculations, based on data from FAO, FAOSTAT database (accessed August 2015).Notes: a Estimates for 1980 and 1990; b Data prior to 2011 are for former Sudan. Data are unavailable for South Sudan.
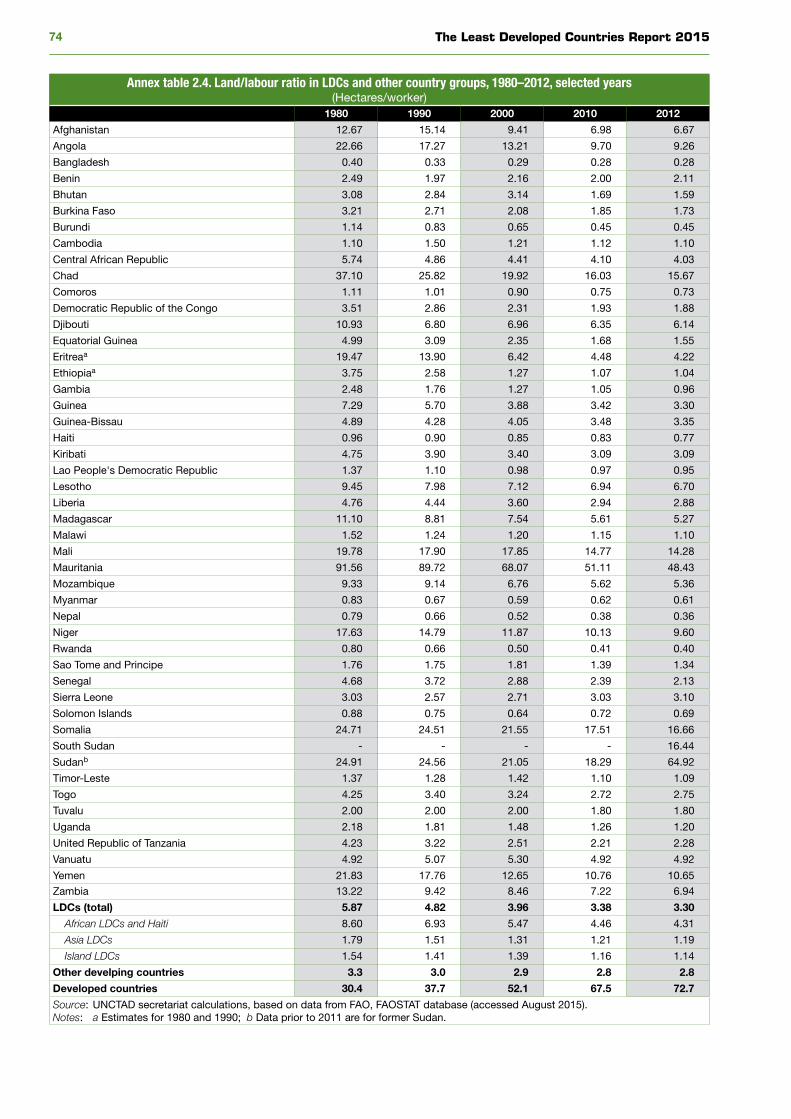
The Least Developed Countries Report 201574
Annex table 2.4. Land/labour ratio in LDCs and other country groups, 1980–2012, selected years(Hectares/worker)
1980 1990 2000 2010 2012
Afghanistan 12.67 15.14 9.41 6.98 6.67
Angola 22.66 17.27 13.21 9.70 9.26
Bangladesh 0.40 0.33 0.29 0.28 0.28
Benin 2.49 1.97 2.16 2.00 2.11
Bhutan 3.08 2.84 3.14 1.69 1.59
Burkina Faso 3.21 2.71 2.08 1.85 1.73
Burundi 1.14 0.83 0.65 0.45 0.45
Cambodia 1.10 1.50 1.21 1.12 1.10
Central African Republic 5.74 4.86 4.41 4.10 4.03
Chad 37.10 25.82 19.92 16.03 15.67
Comoros 1.11 1.01 0.90 0.75 0.73
Democratic Republic of the Congo 3.51 2.86 2.31 1.93 1.88
Djibouti 10.93 6.80 6.96 6.35 6.14
Equatorial Guinea 4.99 3.09 2.35 1.68 1.55
Eritreaa 19.47 13.90 6.42 4.48 4.22
Ethiopiaa 3.75 2.58 1.27 1.07 1.04
Gambia 2.48 1.76 1.27 1.05 0.96
Guinea 7.29 5.70 3.88 3.42 3.30
Guinea-Bissau 4.89 4.28 4.05 3.48 3.35
Haiti 0.96 0.90 0.85 0.83 0.77
Kiribati 4.75 3.90 3.40 3.09 3.09
Lao People's Democratic Republic 1.37 1.10 0.98 0.97 0.95
Lesotho 9.45 7.98 7.12 6.94 6.70
Liberia 4.76 4.44 3.60 2.94 2.88
Madagascar 11.10 8.81 7.54 5.61 5.27
Malawi 1.52 1.24 1.20 1.15 1.10
Mali 19.78 17.90 17.85 14.77 14.28
Mauritania 91.56 89.72 68.07 51.11 48.43
Mozambique 9.33 9.14 6.76 5.62 5.36
Myanmar 0.83 0.67 0.59 0.62 0.61
Nepal 0.79 0.66 0.52 0.38 0.36
Niger 17.63 14.79 11.87 10.13 9.60
Rwanda 0.80 0.66 0.50 0.41 0.40
Sao Tome and Principe 1.76 1.75 1.81 1.39 1.34
Senegal 4.68 3.72 2.88 2.39 2.13
Sierra Leone 3.03 2.57 2.71 3.03 3.10
Solomon Islands 0.88 0.75 0.64 0.72 0.69
Somalia 24.71 24.51 21.55 17.51 16.66
South Sudan - - - - 16.44
Sudanb 24.91 24.56 21.05 18.29 64.92
Timor-Leste 1.37 1.28 1.42 1.10 1.09
Togo 4.25 3.40 3.24 2.72 2.75
Tuvalu 2.00 2.00 2.00 1.80 1.80
Uganda 2.18 1.81 1.48 1.26 1.20
United Republic of Tanzania 4.23 3.22 2.51 2.21 2.28
Vanuatu 4.92 5.07 5.30 4.92 4.92
Yemen 21.83 17.76 12.65 10.76 10.65
Zambia 13.22 9.42 8.46 7.22 6.94
LDCs (total) 5.87 4.82 3.96 3.38 3.30
African LDCs and Haiti 8.60 6.93 5.47 4.46 4.31
Asia LDCs 1.79 1.51 1.31 1.21 1.19
Island LDCs 1.54 1.41 1.39 1.16 1.14
Other develping countries 3.3 3.0 2.9 2.8 2.8
Developed countries 30.4 37.7 52.1 67.5 72.7
Source: UNCTAD secretariat calculations, based on data from FAO, FAOSTAT database (accessed August 2015).Notes: a Estimates for 1980 and 1990; b Data prior to 2011 are for former Sudan.
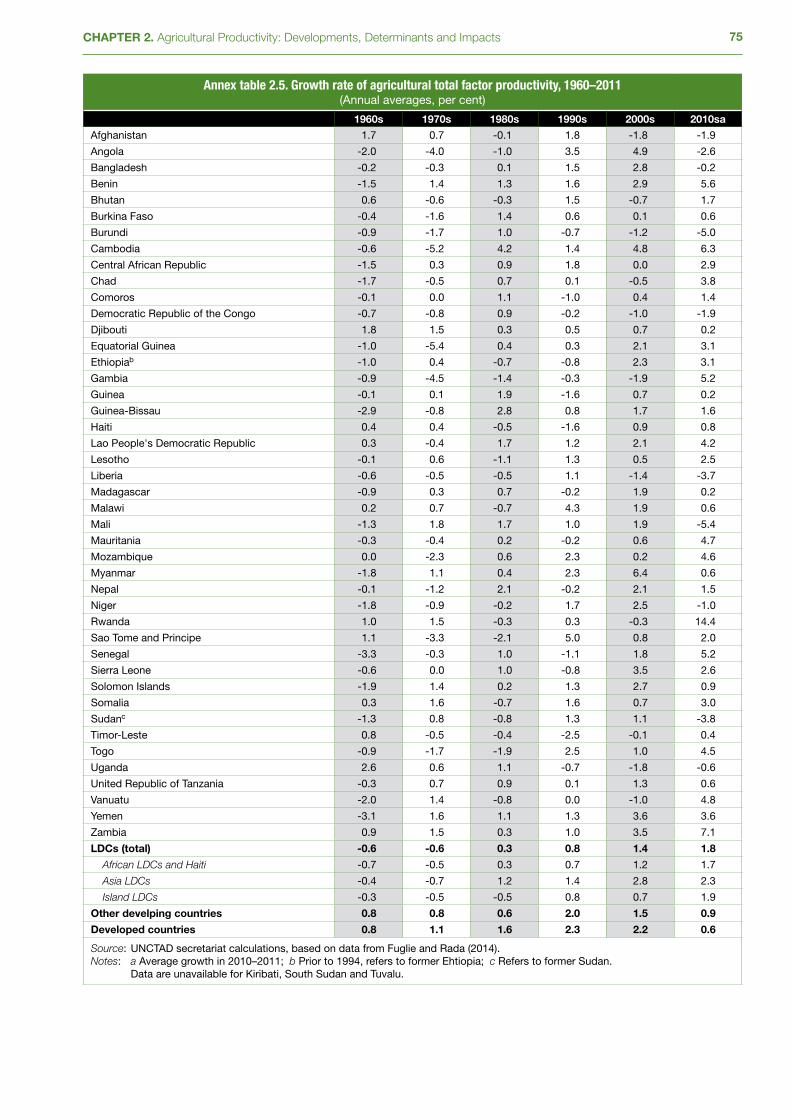
75CHAPTER 2. Agricultural Productivity: Developments, Determinants and Impacts
Annex table 2.5. Growth rate of agricultural total factor productivity, 1960–2011(Annual averages, per cent)
1960s 1970s 1980s 1990s 2000s 2010sa
Afghanistan 1.7 0.7 -0.1 1.8 -1.8 -1.9
Angola -2.0 -4.0 -1.0 3.5 4.9 -2.6
Bangladesh -0.2 -0.3 0.1 1.5 2.8 -0.2
Benin -1.5 1.4 1.3 1.6 2.9 5.6
Bhutan 0.6 -0.6 -0.3 1.5 -0.7 1.7
Burkina Faso -0.4 -1.6 1.4 0.6 0.1 0.6
Burundi -0.9 -1.7 1.0 -0.7 -1.2 -5.0
Cambodia -0.6 -5.2 4.2 1.4 4.8 6.3
Central African Republic -1.5 0.3 0.9 1.8 0.0 2.9
Chad -1.7 -0.5 0.7 0.1 -0.5 3.8
Comoros -0.1 0.0 1.1 -1.0 0.4 1.4
Democratic Republic of the Congo -0.7 -0.8 0.9 -0.2 -1.0 -1.9
Djibouti 1.8 1.5 0.3 0.5 0.7 0.2
Equatorial Guinea -1.0 -5.4 0.4 0.3 2.1 3.1
Ethiopiab -1.0 0.4 -0.7 -0.8 2.3 3.1
Gambia -0.9 -4.5 -1.4 -0.3 -1.9 5.2
Guinea -0.1 0.1 1.9 -1.6 0.7 0.2
Guinea-Bissau -2.9 -0.8 2.8 0.8 1.7 1.6
Haiti 0.4 0.4 -0.5 -1.6 0.9 0.8
Lao People's Democratic Republic 0.3 -0.4 1.7 1.2 2.1 4.2
Lesotho -0.1 0.6 -1.1 1.3 0.5 2.5
Liberia -0.6 -0.5 -0.5 1.1 -1.4 -3.7
Madagascar -0.9 0.3 0.7 -0.2 1.9 0.2
Malawi 0.2 0.7 -0.7 4.3 1.9 0.6
Mali -1.3 1.8 1.7 1.0 1.9 -5.4
Mauritania -0.3 -0.4 0.2 -0.2 0.6 4.7
Mozambique 0.0 -2.3 0.6 2.3 0.2 4.6
Myanmar -1.8 1.1 0.4 2.3 6.4 0.6
Nepal -0.1 -1.2 2.1 -0.2 2.1 1.5
Niger -1.8 -0.9 -0.2 1.7 2.5 -1.0
Rwanda 1.0 1.5 -0.3 0.3 -0.3 14.4
Sao Tome and Principe 1.1 -3.3 -2.1 5.0 0.8 2.0
Senegal -3.3 -0.3 1.0 -1.1 1.8 5.2
Sierra Leone -0.6 0.0 1.0 -0.8 3.5 2.6
Solomon Islands -1.9 1.4 0.2 1.3 2.7 0.9
Somalia 0.3 1.6 -0.7 1.6 0.7 3.0
Sudanc -1.3 0.8 -0.8 1.3 1.1 -3.8
Timor-Leste 0.8 -0.5 -0.4 -2.5 -0.1 0.4
Togo -0.9 -1.7 -1.9 2.5 1.0 4.5
Uganda 2.6 0.6 1.1 -0.7 -1.8 -0.6
United Republic of Tanzania -0.3 0.7 0.9 0.1 1.3 0.6
Vanuatu -2.0 1.4 -0.8 0.0 -1.0 4.8
Yemen -3.1 1.6 1.1 1.3 3.6 3.6
Zambia 0.9 1.5 0.3 1.0 3.5 7.1
LDCs (total) -0.6 -0.6 0.3 0.8 1.4 1.8
African LDCs and Haiti -0.7 -0.5 0.3 0.7 1.2 1.7
Asia LDCs -0.4 -0.7 1.2 1.4 2.8 2.3
Island LDCs -0.3 -0.5 -0.5 0.8 0.7 1.9
Other develping countries 0.8 0.8 0.6 2.0 1.5 0.9
Developed countries 0.8 1.1 1.6 2.3 2.2 0.6
Source: UNCTAD secretariat calculations, based on data from Fuglie and Rada (2014).Notes: a Average growth in 2010–2011; b Prior to 1994, refers to former Ehtiopia; c Refers to former Sudan. Data are unavailable for Kiribati, South Sudan and Tuvalu.


3CHAPTER
economic diveRsification, non-faRm activities and
RuRal tRansfoRmation
CHAPTER
The Least Developed Countries Report 201578
A. Introduction
As discussed in Chapter 1, the rural population of least developed countries (LDCs) accounts for 69 per cent of the total; rural workforces are projected to increase substantially over the next 15 years; and poverty is both more widespread and deeper in rural than in urban areas. The need to increase agricultural productivity limits the potential to absorb more workers productively in the agricultural sector, or even to retain the existing workforce in the sector. The main options available are thus migration to urban areas or engagement in non-farm activities in rural areas (Lanjouw and Lanjouw, 2001). Involvement in non-farm activities can offer a pathway out of poverty — but only if there are sufficiently productive and remunerative opportunities available, and if poor households are able to take advantage of them (Egyei, Harrison and Adzovor, 2013).
While farming is generally the principal economic activity of rural households, and the dominant view of rural development has focused on promoting agriculture among smallholders (Ellis and Biggs, 2001; Haggblade, 2007), most rural households engage in a range of economic activities. Agriculture remains important, but it is by no means the sole, or in some cases even the principal, activity of poor households in rural regions (FAO, 1998; Haggblade, Hazell and Reardon, 2007), and non-farm incomes play a key role in rural economic transformation.
This has led to an increasing appreciation of the importance of non-farm activities and their interlinkages with the agricultural sector since the early 1990s.1 Since two thirds of smallholder farmers lack the resources to “farm their way out of poverty”, poverty eradication will require the creation of remunerative employment in activities outside farming, including agribusiness, industry and services (Yumkella et al., 2011).
In countries with a predominantly rural population, increased agricultural incomes and more equitable distribution in rural areas can boost effective demand for higher-value and more processed agricultural produce, and for industrial goods and services. Equally, viable rural development requires diversification of rural economies into such activities. Increasing incomes and diversifying production both require extension and improvement of infrastructure, including power supply, transport, communication, housing, water supply, marketing and storage facilities, with scale and technology oriented towards the needs of rural populations (FAO, 1998). The combination of higher incomes, increased and diversified employment opportunities, and improved infrastructure can help to limit push-driven rural-urban migration and slow the growth of urban poverty and slums.
The key to rural structural transformation is to move beyond infrastructure provision to link the demand and supply sides of this equation: to enable rural producers to respond effectively to the market changes associated with demand changes as development progresses and incomes rise. This means focusing not only on increasing agricultural productivity, but also on non-farm activities and increasing production of higher-value agricultural products.
Despite the greater attention paid to the rural non-farm economy (RNFE) over the past 20 years, data on rural non-farm (RNF) activities are not systematically available, as data on production, employment and incomes are not routinely disaggregated between rural and urban areas. The available information thus comes largely from individual case studies by academic researchers, based on primary data. As discussed later in this chapter, the coverage of such studies is
Involvement in non-farm activities can offer a pathway out of poverty — but only if there are sufficiently
productive and remunerative opportunities.
Poverty eradication will require the creation of remunerative
employment in activities outside farming.
Rural structural transformation means increasing agricultural
productivity, non-farm activities and production of higher-value
agricultural products.
79CHAPTER 3. Economic Diversification, Non-Farm Activities and Rural Transformation
very limited; and even where data are available, especially at the national level and across large regions, there are serious limitations in their interpretation.
This chapter begins with an assessment of the different motivations for households to engage in non-farm activities, the non-farm income sources available to them, and the routes out of poverty that such incomes can provide. This is followed by a discussion of the multiple dimensions of economic diversification, highlighting the contradiction between need and opportunity (the fact that those households and areas with the greatest need for diversification have the least opportunity to diversify) and the serious problems in interpreting such data on rural economic diversification as are available.
A summary of existing evidence on the extent of non-farm activities in rural areas of LDCs is followed by new estimates for selected LDCs (based on an analysis conducted for this Report) and a brief assessment of the current state of rural structural transformation in LDCs as a whole. After assessing the role of RNF activities in promoting agricultural upgrading and of demand and hard and soft infrastructure as drivers of rural economic transformation, the chapter concludes with an assessment of key sectoral priorities in peri-urban, intermediate and remote/isolated rural areas.
B. Patterns of rural economic diversification
1. household motivations for engagement in non-farm aCtivities
The great majority of people in rural areas in LDCs are engaged in agriculture, as small farmers and/or labourers; and for most households, agriculture is the main source of income (or consumption, for those engaged in subsistence production). For most, however, non-farm economic activities provide a significant source of supplementary income, often from multiple sources: Household income diversification is the norm, and complete specialization the exception (Dimova and Sen, 2010). This multiplicity of income sources (often referred to as pluriactivity) is encapsulated in the livelihoods approach, which views households as using a range of assets in a variety of agricultural and non-agricultural activities, as part of an overall livelihood strategy (Ellis, 2000 and 2005; Winters et al., 2009).
There are three main motivations for engagement in non-farm activities, although the lines between them are blurred. Some households engage in what might be termed “entrepreneurship by choice”, drawn into activities they consider profitable by the pull of remunerative opportunities to generate incomes beyond their immediate consumption needs. These are primarily households with good asset endowments, particularly land, education and infrastructure, which allow them to enter markets with relatively high barriers and higher income levels (Winters et al., 2009). Such households generally pursue accumulation strategies aimed at maximizing benefits from changing contexts (Tacoli, 2003), often based on exploiting complementarities between activities (e.g. crop and livestock production, or crop production and processing) or on exploiting opportunities arising from access to technologies, skills or endowments.
Other households are, rather, driven into “entrepreneurship by necessity” by the push of inadequate farm incomes, either as a temporary expedient (e.g. due to crop failure or illness of a family member) or on a long-term basis, due to the insufficiency of their own production to meet their consumption needs. Non-farm income is thus particularly important where farming income is insufficient, for example due to poor agroecological conditions, low prices, crop and animal
The great majority of people in rural areas in LDCs are engaged in agriculture, as small farmers and/
or labourers.
For most households, non-farm economic activities provide a
significant source of supplementary income, often from multiple sources:
Household income diversification is the norm.
Some households engage in what might be termed “entrepreneurship
by choice”, drawn into activities they consider profitable by the pull of
remunerative opportunities
Other households are driven into “entrepreneurship by necessity” by the push of inadequate farm
incomes.
The Least Developed Countries Report 201580
diseases or limited land availability (Ellis, 2005; World Bank, 2007; Dabalen, Paternostro and Pierre, 2004).
Such “entrepreneurs by necessity” are generally households with little or no land, livestock or other material resources, and limited education. Consequently, they can only engage in activities with low entry barriers, which have commensurately low returns. Others facing constraints on productivity or market participation — for example, female-headed households and people affected by disability or chronic illness — may be in a similar position. In areas with unfavourable agricultural conditions that are more distant from urban markets, much of the income diversification that occurs is of this nature, and may reasonably be characterized as desperation-led (Barrett, Reardon and Webb, 2001). Such circumstances lead to oversupply in low-barrier occupations, depressing incomes still further.
This duality between “push” and “pull” factors is reflected in two contrasting views. Agricultural optimists (e.g. World Bank, 2007; Losch, Fréguin-Gresh and White, 2012; Balihuta and Sen, 2001; Haggblade, 2007) tend to see livelihood diversification as emerging from agricultural success, and agriculture as a driver of non-farm opportunities. Agriculture sceptics (e.g. Ellis, 2005), conversely, see this positive view as underestimating the challenges to agriculture of liberalized markets (and declining farm sizes in some areas). They thus interpret diversification rather as a response to the failure of agriculture to generate sufficient secure livelihoods for the rural population.
The third major motivation for household income diversification is risk management (Holden, Shiferaw and Pender, 2004; Ruben and Pender, 2004). Agriculture is one of the riskiest sectors of economic activity, prone to major shocks to both output and prices, and financial risk-reduction instruments such as insurance are severely lacking in rural areas (and would be unaffordable to those who need them most). Such risks are greatest in poorer and more remote areas, where limited access to markets increases price volatility; and for poorer households within rural areas, who have less savings or saleable assets, and whose incomes may also be at the level of bare survival even before shocks.
Consequently, such shocks can result in further impoverishment and asset depletion of poor households through distress sales of livestock, and even land, from which they may recover only after a considerable period (or not at all, in the case of forced land sales). They can also have impacts on nutrition, health and education that have permanent and even (in the case of girls and women) intergenerational effects. Such risks can thus create downward spirals of perpetual impoverishment (World Bank, 2007), leading households to self-insure against risk through a variety of coping behaviours (Barrett, Reardon and Webb, 2001). A key aspect of such coping strategies is seeking income from multiple sources subject to different risks (although these risks may be highly correlated), even where the returns to the available (low entry-barrier) activities are very low.
2. non-farm inCome sourCes
The potential for wage employment in agriculture2 is generally limited in areas where smallholder agriculture predominates, due to the use of family labour, and such opportunities as exist are primarily for seasonal or casual labour. This applies particularly to subsistence and semi-subsistence-based systems, but also in cash-cropping areas. Farm wages also tend to be lower than in non-farm sectors, partly reflecting more limited skill requirements, although this is not always the case (Lanjouw, Quizon and Sparrow, 2001). Because entry barriers are low, farm wage labour is generally supplied by poorer households (Haggblade, 2007) or by those affected by crop failures.
Agriculture is one of the riskiest sectors of economic activity, prone
to major shocks to both output and prices.
Risks are greatest in poorer and more remote areas and for poorer
households within rural areas.
A key aspect of coping strategies is seeking income from multiple
sources subject to different risks.
Because entry barriers are low, farm wage labour is generally supplied by poorer households or by those
affected by crop failures.

81CHAPTER 3. Economic Diversification, Non-Farm Activities and Rural Transformation
As a result, agricultural wage employment is generally a much less important source of income than non-farm activities, particularly in Africa (FAO, 1998). In LDCs, total household income from non-agricultural activities typically exceeds agricultural wage income by a factor of 3–4 (Annex table 3.2). Wage employment generally accounts for only 5–20 per cent of total agricultural income in African LDCs, but 25–40 per cent in Bangladesh and Nepal.
Contrary to conventional wisdom, migration incomes are also generally (with some exceptions, notably Lesotho) much less than income from local non-farm activities. They are also generally less widely distributed, often being concentrated in relatively few better-off households, and are highly variable over time (de Haan, 1999; de Haan and Rogaly, 2002). Studies in LDCs suggest that local non-farm earnings are typically around 2–5 times migration income overall, and can be as much as 10–20 times in areas of high agricultural potential (table 3.1).
In the absence of a significant market for agricultural wage labour, the main source of alternative incomes is in the rural non-farm economy. This comprises a very wide range of extremely varied activities defined only in terms of not being agricultural (Lanjouw, 2007), including, for example, agroprocessing, manufacturing, mining, commerce, transportation, utilities, tourism and a wide range of other services (Castillo and Sodergren, 2015; Wiggins, 2014).3
Despite widespread self-employment, wage income can be as important to total RNF income as self-employment, and more important in some Asian LDCs. In most African LDCs (Malawi is an exception), self-employment income is more important than wage income, but the reverse is the case in Bangladesh and Nepal (Davis, DiGiuseppe and Zezza, 2014, table 3, p. 9), possibly reflecting the higher level of RNFE development, as discussed later. It should, however, be noted that these averages are likely in practice to include non-farm incomes in some towns in rural regions, as well as rural areas themselves: The relative importance of wage income is generally greater in and closer to towns, and in other areas with higher incomes and denser infrastructure, while self-employment (mostly part-time, reflecting household income diversification) predominates elsewhere (Reardon et al., 2007).
3. household speCializations and routes out of poverty
As noted above, income diversification is the rule rather than the exception among rural households; and the degree and pattern of income diversification varies widely, both between areas and among households. Nonetheless, the majority of households generally have a single primary type of income, with one or more supplementary sources. Five main household types can thus be identified (World Bank, 2007; Losch, Fréguin-Gresh and White, 2012):
• Subsistence-oriented smallholders, who depend mainly on agricultural production for their own consumption;
• Market-oriented smallholders, who derive most of their income from sales of agriculture produce;
• Labour-oriented households, who derive income mostly from paid work on others’ farms and/or from employment or self-employment in non-farm activities, often because of landlessness or insufficient plots;
• Migration-oriented households, who depend primarily on transfers from family members who have migrated (generally to urban areas, but in some cases internationally or to other rural areas); and
• Diversified households, who combine incomes from farming, non-farm activities and/or migrant remittances, with no single dominant source.
Local non-farm earnings are typically around 2–5 times migration income
overall, and can be 10–20 times higher in areas of high agricultural
potential.
In the absence of a significant market for agricultural wage labour,
the main source of alternative incomes is in the rural non-farm
economy.
Despite widespread self-employment, wage income can be as important to total RNF income
as self-employment, and more important in some Asian LDCs.
The majority of households generally have a single primary
type of income, with one or more supplementary sources.
The Least Developed Countries Report 201582
The data needed to estimate the breakdown of households between these types is limited. To illustrate, however, in Malawi the most common type in 2004 was diversified households, representing 39 per cent of rural households, while 24 per cent were labour-oriented, 20 per cent market-oriented smallholders, 14 per cent subsistence-oriented smallholders, and only 3 per cent migration-oriented.4 This is similar to the pattern in Nepal in 1996.5
Given the intrinsic limitations of subsistence agriculture as well as limited opportunities and low wages for agricultural labour, the potential routes out of poverty for rural households thus lie in market-oriented smallholder farming, non-farm activities, rural-urban or cross-border emigration, or some combination of these three (World Bank, 2007).
4. the spatial dimension
Both the composition and the dynamics of the RNFE sector differ considerably between settings, as varied initial endowments and human responses propel the sector along a wide range of potential growth paths (Hazell, Haggblade and Reardon, 2007, pp. 95ff). A key dimension of this is proximity to urban areas, which provide an important engine of growth for surrounding areas, greatly increasing opportunities for income diversification (Barrett, Reardon and Webb, 2001; Reardon et al., 2007). As well as the time, cost and ease of travel to urban centres, the strength of this effect depends on the size of their markets, the vigour of their growth and the extent and nature of their interactions with the surrounding rural areas.
Rural and urban labour markets are linked, to varying degrees, by the potential for rural-urban migration, which tends to be most prevalent among rural households near urban centres (and in peri-urban areas by the potential for daily or weekly commuting). Non-farm employment opportunities in rural areas likewise depend on proximity to urban centres, as do agricultural incomes (Ruben and Pender, 2004; Fafchamps and Shilpi, 2003; Tacoli, 2003; Ruben and Pender, 2004). Rural producers in areas further away from urban markets have less potential to sell to them, not least because they have to compete with producers nearer at hand with lower transportation costs and faster delivery times, and generally better access to inputs and hard and soft infrastructure. Here, therefore, development of the RNFE is focused primarily on local markets, and potentially on export markets for agroprocessing; its scale, structure, and evolution are primarily shaped by agriculture (and to a lesser extent by tourism and mining, where they exist).
Thus, both agricultural and non-farm income opportunities tend to decline as distances from urban centres increase. This is reflected in patterns of RNFE development, which occurs further and faster, and generates higher returns, closer to cities, especially in areas with good agricultural performance. Even good agricultural areas further from the cities are much more constrained in RNFE development, especially in more remunerative activities (Deichmann, Shilpi and Vakis, 2009; Lanjouw, Quizon and Sparrow, 2001). Patterns of agricultural production likewise reflect urban proximity, higher-value crops for local markets being produced mainly near urban centres, and commercial production of other crops predominating in intermediate rural areas, while more remote areas engage mainly in subsistence agriculture (Fafchamps and Shilpi, 2003).
These differences in economic opportunities create a similar pattern in wage levels, with concentric circles around cities, across which wages decline as transport costs increase (Jacoby, 2000; Deichmann, Shilpi and Vakis, 2009). Beyond peri-urban areas, labour markets are typically characterized by an excess supply of labour (except during peak seasons), due to a combination
The potential routes out of poverty for rural households lie in market-
oriented smallholder farming, non-farm activities, rural-urban or cross-border emigration, or some
combination of these three.
Urban markets provide an important engine of growth
for surrounding areas, greatly increasing opportunities for income
diversification.
Both agricultural and non-farm income opportunities tend to decline
as distances from urban centres increase.

83CHAPTER 3. Economic Diversification, Non-Farm Activities and Rural Transformation
of limited opportunities for wage employment and factors pushing poorer households into seeking supplementary incomes and income diversification. Wages are thus very low, and increasing demand for labour may in itself do little to raise them until local rural development progresses far enough to absorb surplus labour productively.
5. the several dimensions of diversifiCation, and impliCations for data interpretation
The trends described above give rise to a complex multilevel pattern of diversification. Not only are rural economies diversified, with incomes drawn from agriculture and non-farm sources, but so, too, are most households; and part of this household income diversification comes from combining incomes from different household members, each of whom may be more or less specialized. The degree and nature of income diversification, and its motivation, varies widely among households; and there are systematic differences between rural areas, reflecting their proximity to urban markets, their agricultural potential and their potential for activities such as mining and tourism.
There is also an important temporal dimension: Income diversification over the course of the year is often partly a result of engaging in different occupations in different seasons. In smallholder-based economies particularly, reliance on family labour gives rise to extremely strong seasonal patterns in the demand for wage labour in agriculture, and non-farm activity typically surges in seasons of lower agricultural labour demand, creating a strongly countercyclical pattern (Haggblade, Hazell and Dorosh, 2007).
Equally, there is an important distinction between diversification of employment (or income sources) and diversification of income. Since the returns on many secondary activities are low, the diversity of occupations does not always translate into income diversification.
These intersecting patterns of specialization and diversification mean that considerable caution is needed in interpreting data on the composition of income and employment.
• A given breakdown of rural employment and income across the rural economy as a whole reflects a combination of very different patterns in peri-urban, intermediate, remote and isolated areas, and between areas of high and low agricultural potential. It thus cannot be interpreted as reflecting the situation in any one of these contexts.
• Sectoral employment data based on primary occupation (e.g. for the proportion of the labour force engaged in agriculture) may not accurately reflect actual labour allocation, as income diversification means that the time devoted to secondary income sources is implicitly attributed to agriculture. Thus, if households devote more time to non-farm activities, but agriculture remains their primary income source, this may represent an unrecorded shift of labour from agriculture to non-farm activities, concealing an increase in agricultural productivity relative to actual labour inputs.
• Even within areas, the breakdown of income may differ markedly from the breakdown of employment, due to differing rates of return in different occupations; and this may be further complicated in national data due to marked differences in relative incomes between different contexts.
• Even where a sectoral breakdown is available, it is impossible to assess from income or employment data alone how non-farm activities are
The degree and nature of income diversification, and its motivation,
vary widely among households; and there are systematic differences
between rural areas.
In smallholder-based economies, reliance on family labour gives
rise to extremely strong seasonal patterns in the demand for wage
labour in agriculture.
Intersecting patterns of specialization and diversification mean that considerable caution is needed in interpreting data on the composition of income and
employment...
The Least Developed Countries Report 201584
divided between high-productivity “entrepreneurship by choice” and low-productivity “entrepreneurship by necessity”, as both may operate in any non-agricultural activity. Thus, the same level (and sectoral composition) of non-farm activity may signify rural economic transformation or desperation. Equally, an increase in the non-farm share in rural income and employment may be a sign of dynamism or decline; and a constant share, even over a prolonged period, may conceal a shift from “survivalist” activities to growth-oriented enterprise.
• Patterns of diversification in overall employment may also reflect very different combinations of specialization and diversification at the individual and household level and between households, which cannot readily be quantified. For example, if 25 per cent of employment is found to be in non-farm activities, this could equally be a result of 25 per cent of the members of each household working full-time in non-farm activities, all the members of 25 per cent of households working full-time in non-farm activities, or the entire working population spending 25 per cent of their working time in non-farm activities.
• Data also do not reflect the allocation of labour at any given point in time: full-year data represent an average across seasons in which income and employment patterns are likely to be very different, while data for less than a year (e.g. based on a fixed recall period shorter than 12 months) will reflect the season in which they were collected. Neither are data for a single year necessarily indicative of a long-term trend, due to wide variations between years resulting from variations in agricultural conditions and prices. Not only is agricultural income higher during good years than bad years, but non-farm income itself is likely to increase in bad agricultural years, as households seek to offset the resulting income shortfall.
Employment and income data for a local economy can provide an overall picture of the relative importance of different activities over the course of a particular year. However, the above-mentioned complications mean that they do not indicate the extent of household (or individual) income diversification, the proportion of households primarily dependent on a particular activity, seasonal patterns, long-term trends, or the balance between positively and negatively motivated diversification. Equally, national-level data conceal wide differences between different localities.
6. rural eConomiC diversifiCation: the ContradiCtion between need and opportunity
A fundamental challenge to rural structural transformation, especially in the context of poverty eradication, is the contradiction between the need for income diversification and the opportunity to diversify, at both the household and the community level. At the community level, this has been termed the “meso paradox” (Reardon, Berdegué and Escobar, 2001). Poorer rural areas away from cities have the greatest need and, in principle, the strongest incentive to develop RNFE activities in order to offset the low productivity and high risk of their agriculture sectors. However, they also face the greatest constraints on developing such activities, lacking a local growth motor of RNF demand and the infrastructure, education, capital and input access needed to develop them. This is an important reason for the unsustainability of many RNFE projects in such areas after external project support ends.
Thus the most advantaged areas (peri-urban areas and some areas of high agricultural potential) may be able to engage in a dynamic process of RNFE
... as data for local economies do not indicate the extent of
household (or individual) income diversification...
... and national-level data conceal wide differences between
different localities.
A fundamental challenge to rural structural transformation is the
contradiction between the need for income diversification and the
opportunity to diversify, at both the household and the community level.
85CHAPTER 3. Economic Diversification, Non-Farm Activities and Rural Transformation
development led by “entrepreneurs by choice”; but the most disadvantaged areas experience a much less favourable RNFE development process, focused on low-income and low-productivity activities, driven by forced income diversification by “entrepreneurs by necessity”. Here, the result is a non-farm sector characterized by push-driven oversupply in activities such as casual labour, where entry barriers are low. The developmental benefits are limited by low productivity, and incomes are driven still lower by oversupply, so that households, too, derive little benefit.
Between these two extremes, with neither the compulsion of inadequate incomes nor the opportunities of potential markets and favourable production conditions, and with greater competition from urban suppliers and imports, economic diversification into non-farm incomes may be much more limited. This is illustrated by the case of Burkina Faso in the 1984 drought (Reardon, Matlon and Delgado, 1988). The southern zone had very high income diversification into RNF activities based on linkages with productive (maize and cotton) agriculture benefiting from favourable local agroclimatic conditions. The dry, risky northern zone had an equal degree of lower-productivity RNF activity, developed over many generations to cope with chronic vulnerability to highly variable rainfall. While food aid was targeted on the northern area, reflecting the relative degree of drought, the highest degree of hunger occurred in the intermediate zone, which had the incentive but not the capacity to diversify.
There is also a counterpart to this phenomenon at the household level. It is the poorest households that have the greatest need and strongest incentives to diversify into RNF activities, but they also have the most limited capacity and opportunities to do so, due to lack of resources, education and access to infrastructure, and inability to bear risks because of perilously low consumption levels. Such opportunities as they have are in occupations characterized by low productivity, low incomes (but also low entry barriers) and chronic oversupply, limiting the benefits to them and to the wider economy. Women are also often overrepresented in low-paid, household-based, labour-intensive activities because of the severe restrictions on their mobility. Better-off households, by contrast, are able to take advantage of their greater resources, better education and greater access to infrastructure to exploit more remunerative RNFE opportunities in activities with higher entry barriers. Thus non-farm self-employment offers much greater benefits to the non-poor than to poorer households (Abdulai and Crole-Rees, 2001; Lanjouw, Quizon and Sparrow, 2001; Dabalen, Paternostro and Pierre, 2004).
Overcoming these contradictions between need and opportunity is critical, not only to successful rural economic transformation, but also to poverty eradication in rural areas of LDCs, and thus globally. This is therefore a key objective of the policies outlined in Chapter 5.
C. Rural economic diversification in LDCs: a snapshot
1. existing data on the importanCe of non-farm aCtivities in ldCs
As indicated in the introduction to this chapter, data on non-farm activity in LDCs (and also other developing countries (ODCs)) are very limited. Table 3.1 provides a summary of the available evidence from academic studies, covering the period since the mid-1980s (including the new data presented below). Over
It is the poorest households that have the greatest need and strongest incentives to diversify into RNF activities, but they also
have the most limited capacity and opportunities to do so.
Non-farm self-employment offers much greater benefits to the non-poor than to poorer households.
Overcoming these contradictions between need and opportunity is
critical to successful rural economic transformation.
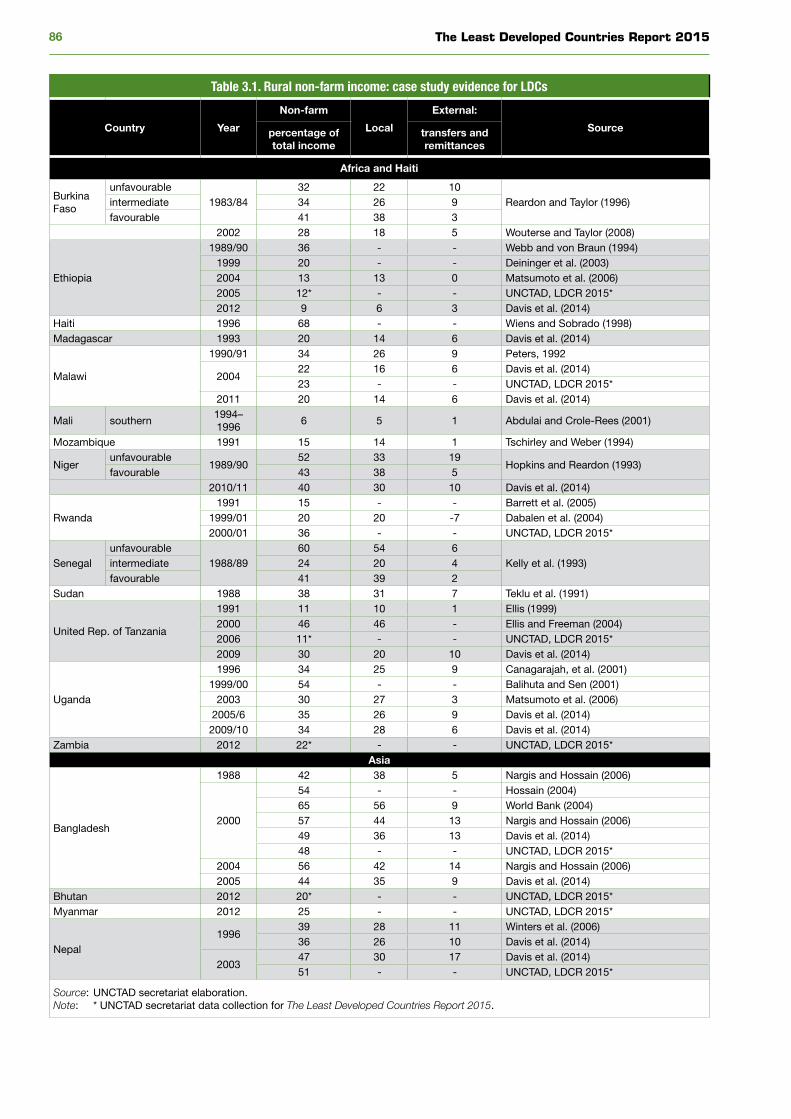
The Least Developed Countries Report 201586
Table 3.1. Rural non-farm income: case study evidence for LDCs
Country Year
Non-farm
Local
External:
Sourcepercentage of total income
transfers and remittances
Africa and Haiti
Burkina Faso
unfavourable1983/84
32 22 10Reardon and Taylor (1996)intermediate 34 26 9
favourable 41 38 32002 28 18 5 Wouterse and Taylor (2008)
Ethiopia
1989/90 36 - - Webb and von Braun (1994)1999 20 - - Deininger et al. (2003)2004 13 13 0 Matsumoto et al. (2006)2005 12* - - UNCTAD, LDCR 2015*2012 9 6 3 Davis et al. (2014)
Haiti 1996 68 - - Wiens and Sobrado (1998)Madagascar 1993 20 14 6 Davis et al. (2014)
Malawi
1990/91 34 26 9 Peters, 1992
200422 16 6 Davis et al. (2014)23 - - UNCTAD, LDCR 2015*
2011 20 14 6 Davis et al. (2014)
Mali southern1994–1996
6 5 1 Abdulai and Crole-Rees (2001)
Mozambique 1991 15 14 1 Tschirley and Weber (1994)
Nigerunfavourable
1989/9052 33 19
Hopkins and Reardon (1993)favourable 43 38 5
2010/11 40 30 10 Davis et al. (2014)
Rwanda1991 15 - - Barrett et al. (2005)
1999/01 20 20 -7 Dabalen et al. (2004)2000/01 36 - - UNCTAD, LDCR 2015*
Senegalunfavourable
1988/8960 54 6
Kelly et al. (1993)intermediate 24 20 4favourable 41 39 2
Sudan 1988 38 31 7 Teklu et al. (1991)
United Rep. of Tanzania
1991 11 10 1 Ellis (1999)2000 46 46 - Ellis and Freeman (2004)2006 11* - - UNCTAD, LDCR 2015*2009 30 20 10 Davis et al. (2014)
Uganda
1996 34 25 9 Canagarajah, et al. (2001)1999/00 54 - - Balihuta and Sen (2001)
2003 30 27 3 Matsumoto et al. (2006)2005/6 35 26 9 Davis et al. (2014)2009/10 34 28 6 Davis et al. (2014)
Zambia 2012 22* - - UNCTAD, LDCR 2015*Asia
Bangladesh
1988 42 38 5 Nargis and Hossain (2006)
2000
54 - - Hossain (2004)65 56 9 World Bank (2004)57 44 13 Nargis and Hossain (2006)49 36 13 Davis et al. (2014)48 - - UNCTAD, LDCR 2015*
2004 56 42 14 Nargis and Hossain (2006)2005 44 35 9 Davis et al. (2014)
Bhutan 2012 20* - - UNCTAD, LDCR 2015*Myanmar 2012 25 - - UNCTAD, LDCR 2015*
Nepal1996
39 28 11 Winters et al. (2006)36 26 10 Davis et al. (2014)
200347 30 17 Davis et al. (2014)51 - - UNCTAD, LDCR 2015*
Source: UNCTAD secretariat elaboration.Note: * UNCTAD secretariat data collection for The Least Developed Countries Report 2015.
87CHAPTER 3. Economic Diversification, Non-Farm Activities and Rural Transformation
the whole of this 30-year period, data are available for only 12 African LDCs (and one subnational region) and four Asian LDCs (two of these from the new estimates produced for this Report, as detailed below), with none at all for island LDCs. Around half of these data are from the 1980s and 1990s; and there are only nine LDCs for which there is more than one data point, and four with more than two data points.
The sparseness of these data limits the conclusions that can be drawn, particularly in light of the problems in interpreting data highlighted in section B.5 above. Few general patterns emerge. The scale of the non-farm economy ranges from 9 per cent in Ethiopia in 2012 to 68 per cent in Haiti in 1996. Among those countries with more than one data point, the share of non-farm activity has increased in Nepal and Rwanda, but declined in Ethiopia and possibly in Burkina Faso and Niger (although the last two are based on only two observations). It appears to have increased and then declined in Bangladesh and possibly United Republic of Tanzania (although this could arise from an exceptional result in 2000), and to have remained broadly constant in Uganda (apart from one apparently aberrant observation in 1999/2000). In those countries where the trend seems to have changed over time, the increases appear to have occurred mostly in the 1990s, while the reductions appear to have occurred mostly after 2000 or over longer periods extending to around 2010, possibly reflecting increases in food prices in 2005–2010.
The case of Bangladesh in 2000 — the one case where there are several estimates for the same country in the same year — further highlights the need for caution in interpreting data on RNF activities, as estimates range from 48 to 65 per cent. While the lowest of these estimates would indicate a rapid increase in the share of RNF income from 2000 until the next observation in 2004, the highest would indicate a rapid decline over the same period.
2. new data on non-farm aCtivities in nine ldCs
This section presents an assessment of the extent of non-agricultural economic activities in rural areas for a sample of five African and four Asian LDCs (Ethiopia, Malawi, Rwanda, United Republic of Tanzania, Zambia, Bangladesh, Bhutan, Myanmar and Nepal) for which raw data are available from various sources. Together, these countries represent 49 per cent of LDCs’ total rural population, based on national household surveys.6 The analysis builds on previous overviews (FAO, 1998; Reardon et al., 2007) by presenting additional survey data collected mainly in the 2000s. This is followed by an assessment of rural incomes in Bangladesh, Malawi and Nepal, based on the Rural Income Generating Activities (RIGA) database, which allows differentiation by gender, age and educational attainment as well as by sector.
In interpreting these data it is important to take account of the intersecting patterns of individual, household and local economy diversification outlined in section B.5 above. In particular, it should be noted that the data are based on nationally representative samples of rural populations. Consequently, the figures presented represent averages across the whole rural population based on national definitions of rurality (box 1.2). Beyond the need for caution required in intercountry comparisons of urban and rural statistics due to differences in national definitions (Castillo and Sodergren, 2015), average figures are likely to mask wide variations, particularly between peri-urban areas and small towns included in national definitions of rural areas on the one hand, and areas further from urban markets on the other. The former are likely to be characterized by higher-than-average levels of non-farm activity but greater individual and household specialization; in the latter, household income diversification is likely to be greater, and the RNFE to be more dominated by low-productivity activities.
Data on non-farm activity in LDCs are very limited.
Data since the mid-1980s are available for only 12 African LDCs
and four Asian LDCs.
Estimates of the scale of non-farm activities range from 9 per cent of the rural economy in Ethiopia in
2012 to 68 per cent in Haiti in 1996.
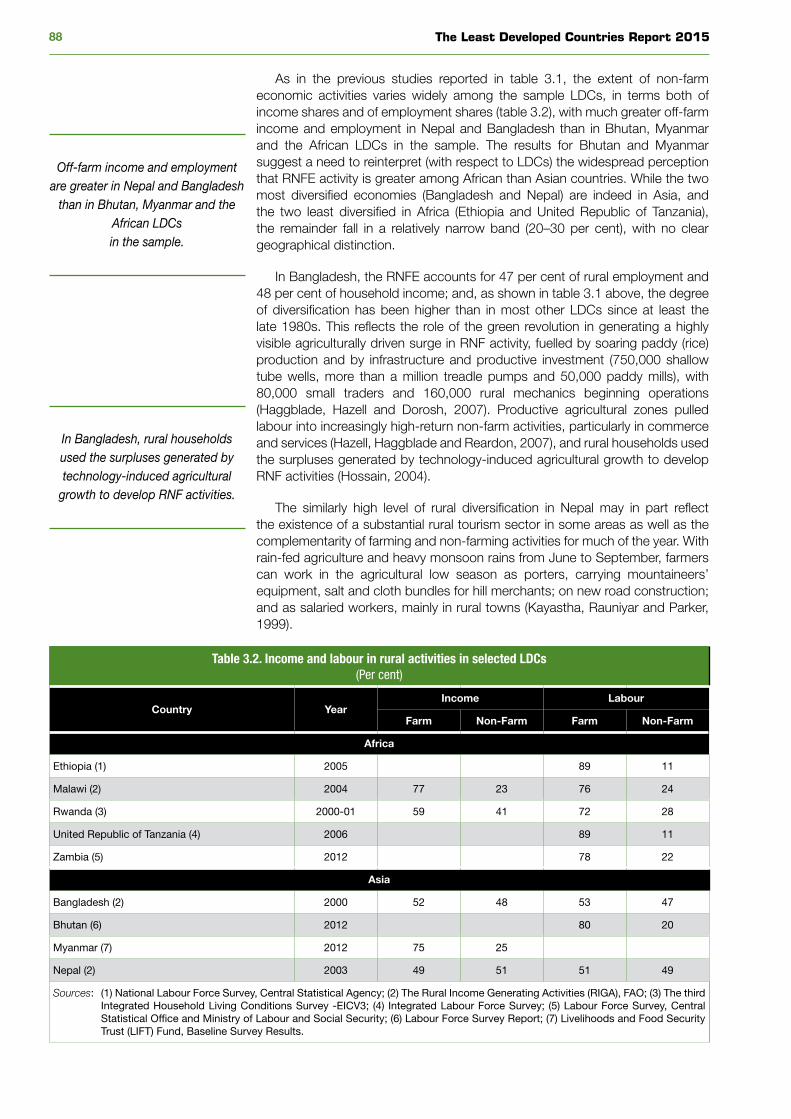
The Least Developed Countries Report 201588
As in the previous studies reported in table 3.1, the extent of non-farm economic activities varies widely among the sample LDCs, in terms both of income shares and of employment shares (table 3.2), with much greater off-farm income and employment in Nepal and Bangladesh than in Bhutan, Myanmar and the African LDCs in the sample. The results for Bhutan and Myanmar suggest a need to reinterpret (with respect to LDCs) the widespread perception that RNFE activity is greater among African than Asian countries. While the two most diversified economies (Bangladesh and Nepal) are indeed in Asia, and the two least diversified in Africa (Ethiopia and United Republic of Tanzania), the remainder fall in a relatively narrow band (20–30 per cent), with no clear geographical distinction.
In Bangladesh, the RNFE accounts for 47 per cent of rural employment and 48 per cent of household income; and, as shown in table 3.1 above, the degree of diversification has been higher than in most other LDCs since at least the late 1980s. This reflects the role of the green revolution in generating a highly visible agriculturally driven surge in RNF activity, fuelled by soaring paddy (rice) production and by infrastructure and productive investment (750,000 shallow tube wells, more than a million treadle pumps and 50,000 paddy mills), with 80,000 small traders and 160,000 rural mechanics beginning operations (Haggblade, Hazell and Dorosh, 2007). Productive agricultural zones pulled labour into increasingly high-return non-farm activities, particularly in commerce and services (Hazell, Haggblade and Reardon, 2007), and rural households used the surpluses generated by technology-induced agricultural growth to develop RNF activities (Hossain, 2004).
The similarly high level of rural diversification in Nepal may in part reflect the existence of a substantial rural tourism sector in some areas as well as the complementarity of farming and non-farming activities for much of the year. With rain-fed agriculture and heavy monsoon rains from June to September, farmers can work in the agricultural low season as porters, carrying mountaineers’ equipment, salt and cloth bundles for hill merchants; on new road construction; and as salaried workers, mainly in rural towns (Kayastha, Rauniyar and Parker, 1999).
Table 3.2. Income and labour in rural activities in selected LDCs(Per cent)
Country YearIncome Labour
Farm Non-Farm Farm Non-Farm
Africa
Ethiopia (1) 2005 89 11
Malawi (2) 2004 77 23 76 24
Rwanda (3) 2000-01 59 41 72 28
United Republic of Tanzania (4) 2006 89 11
Zambia (5) 2012 78 22
Asia
Bangladesh (2) 2000 52 48 53 47
Bhutan (6) 2012 80 20
Myanmar (7) 2012 75 25
Nepal (2) 2003 49 51 51 49
Sources: (1) National Labour Force Survey, Central Statistical Agency; (2) The Rural Income Generating Activities (RIGA), FAO; (3) The third Integrated Household Living Conditions Survey -EICV3; (4) Integrated Labour Force Survey; (5) Labour Force Survey, Central Statistical Office and Ministry of Labour and Social Security; (6) Labour Force Survey Report; (7) Livelihoods and Food Security Trust (LIFT) Fund, Baseline Survey Results.
Off-farm income and employment are greater in Nepal and Bangladesh
than in Bhutan, Myanmar and the African LDCs in the sample.
In Bangladesh, rural households used the surpluses generated by technology-induced agricultural
growth to develop RNF activities.
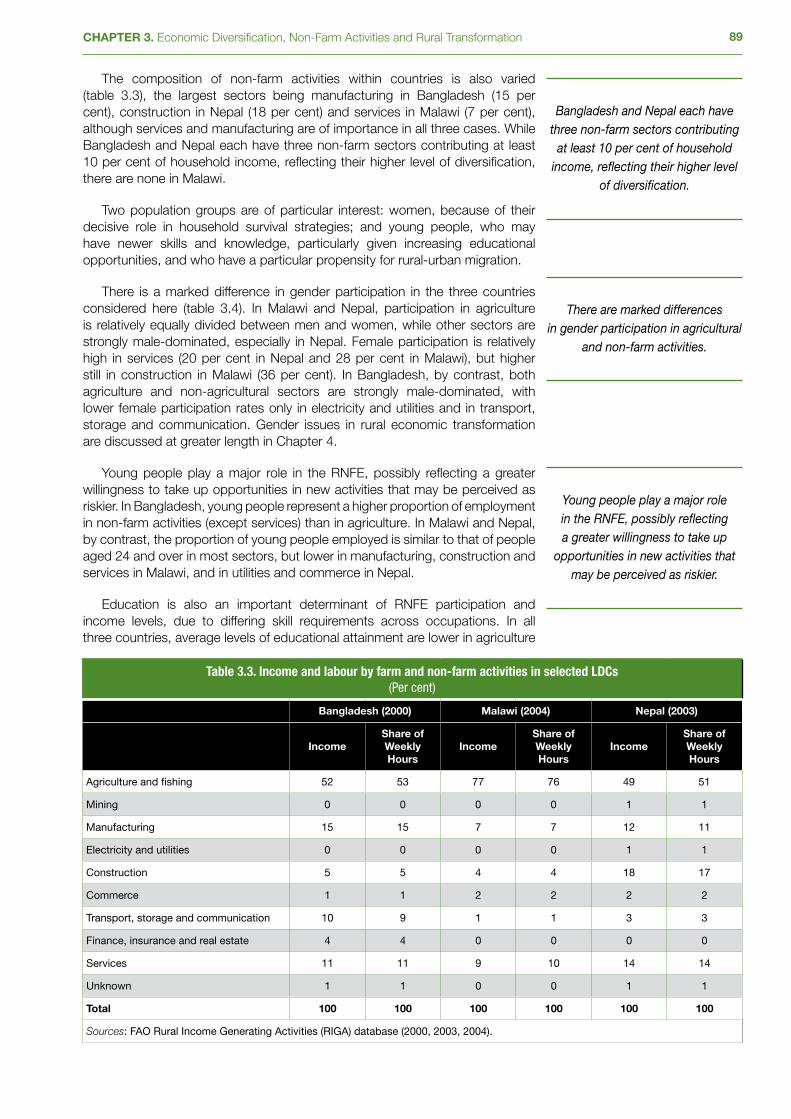
89CHAPTER 3. Economic Diversification, Non-Farm Activities and Rural Transformation
The composition of non-farm activities within countries is also varied (table 3.3), the largest sectors being manufacturing in Bangladesh (15 per cent), construction in Nepal (18 per cent) and services in Malawi (7 per cent), although services and manufacturing are of importance in all three cases. While Bangladesh and Nepal each have three non-farm sectors contributing at least 10 per cent of household income, reflecting their higher level of diversification, there are none in Malawi.
Two population groups are of particular interest: women, because of their decisive role in household survival strategies; and young people, who may have newer skills and knowledge, particularly given increasing educational opportunities, and who have a particular propensity for rural-urban migration.
There is a marked difference in gender participation in the three countries considered here (table 3.4). In Malawi and Nepal, participation in agriculture is relatively equally divided between men and women, while other sectors are strongly male-dominated, especially in Nepal. Female participation is relatively high in services (20 per cent in Nepal and 28 per cent in Malawi), but higher still in construction in Malawi (36 per cent). In Bangladesh, by contrast, both agriculture and non-agricultural sectors are strongly male-dominated, with lower female participation rates only in electricity and utilities and in transport, storage and communication. Gender issues in rural economic transformation are discussed at greater length in Chapter 4.
Young people play a major role in the RNFE, possibly reflecting a greater willingness to take up opportunities in new activities that may be perceived as riskier. In Bangladesh, young people represent a higher proportion of employment in non-farm activities (except services) than in agriculture. In Malawi and Nepal, by contrast, the proportion of young people employed is similar to that of people aged 24 and over in most sectors, but lower in manufacturing, construction and services in Malawi, and in utilities and commerce in Nepal.
Education is also an important determinant of RNFE participation and income levels, due to differing skill requirements across occupations. In all three countries, average levels of educational attainment are lower in agriculture
Table 3.3. Income and labour by farm and non-farm activities in selected LDCs(Per cent)
Bangladesh (2000) Malawi (2004) Nepal (2003)
IncomeShare of Weekly Hours
IncomeShare of Weekly Hours
IncomeShare of Weekly Hours
Agriculture and fishing 52 53 77 76 49 51
Mining 0 0 0 0 1 1
Manufacturing 15 15 7 7 12 11
Electricity and utilities 0 0 0 0 1 1
Construction 5 5 4 4 18 17
Commerce 1 1 2 2 2 2
Transport, storage and communication 10 9 1 1 3 3
Finance, insurance and real estate 4 4 0 0 0 0
Services 11 11 9 10 14 14
Unknown 1 1 0 0 1 1
Total 100 100 100 100 100 100
Sources: FAO Rural Income Generating Activities (RIGA) database (2000, 2003, 2004).
Bangladesh and Nepal each have three non-farm sectors contributing
at least 10 per cent of household income, reflecting their higher level
of diversification.
There are marked differences in gender participation in agricultural
and non-farm activities.
Young people play a major role in the RNFE, possibly reflecting a greater willingness to take up
opportunities in new activities that may be perceived as riskier.
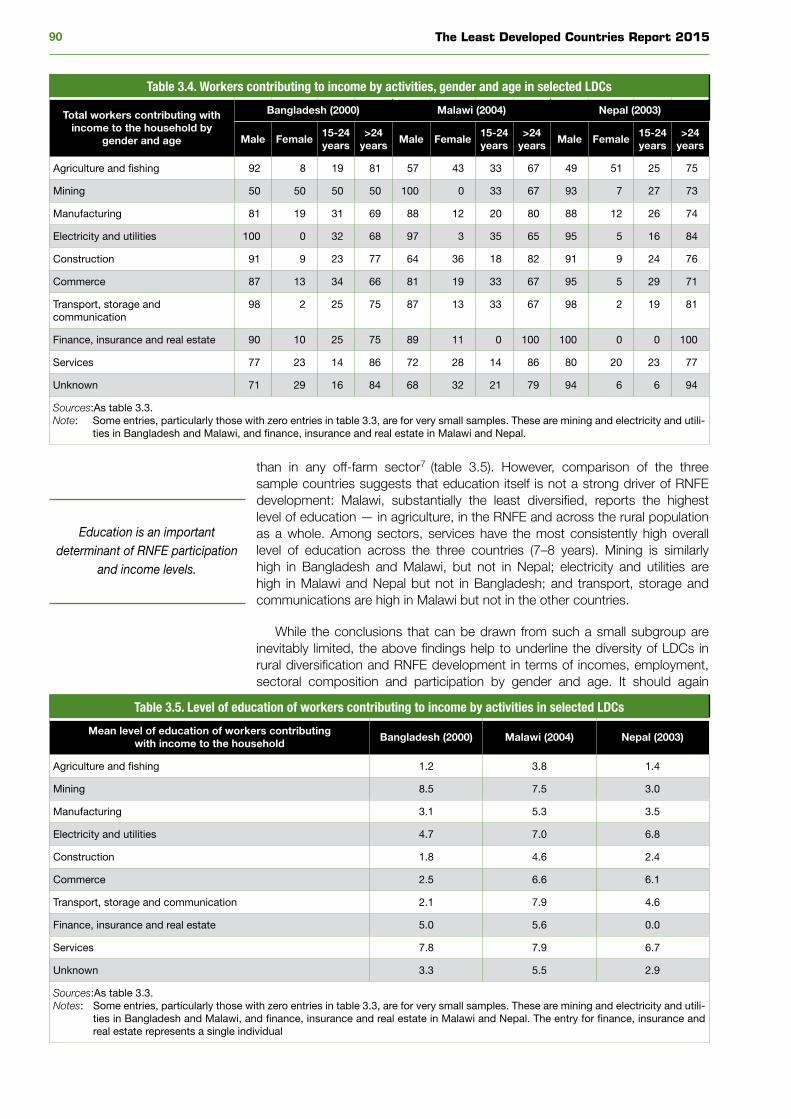
The Least Developed Countries Report 201590
than in any off-farm sector7 (table 3.5). However, comparison of the three sample countries suggests that education itself is not a strong driver of RNFE development: Malawi, substantially the least diversified, reports the highest level of education — in agriculture, in the RNFE and across the rural population as a whole. Among sectors, services have the most consistently high overall level of education across the three countries (7–8 years). Mining is similarly high in Bangladesh and Malawi, but not in Nepal; electricity and utilities are high in Malawi and Nepal but not in Bangladesh; and transport, storage and communications are high in Malawi but not in the other countries.
While the conclusions that can be drawn from such a small subgroup are inevitably limited, the above findings help to underline the diversity of LDCs in rural diversification and RNFE development in terms of incomes, employment, sectoral composition and participation by gender and age. It should again
Table 3.4. Workers contributing to income by activities, gender and age in selected LDCs
Total workers contributing with income to the household by
gender and age
Bangladesh (2000) Malawi (2004) Nepal (2003)
Male Female15-24 years
>24 years
Male Female15-24 years
>24 years
Male Female15-24 years
>24 years
Agriculture and fishing 92 8 19 81 57 43 33 67 49 51 25 75
Mining 50 50 50 50 100 0 33 67 93 7 27 73
Manufacturing 81 19 31 69 88 12 20 80 88 12 26 74
Electricity and utilities 100 0 32 68 97 3 35 65 95 5 16 84
Construction 91 9 23 77 64 36 18 82 91 9 24 76
Commerce 87 13 34 66 81 19 33 67 95 5 29 71
Transport, storage and communication
98 2 25 75 87 13 33 67 98 2 19 81
Finance, insurance and real estate 90 10 25 75 89 11 0 100 100 0 0 100
Services 77 23 14 86 72 28 14 86 80 20 23 77
Unknown 71 29 16 84 68 32 21 79 94 6 6 94
Sources: As table 3.3.Note: Some entries, particularly those with zero entries in table 3.3, are for very small samples. These are mining and electricity and utili-
ties in Bangladesh and Malawi, and finance, insurance and real estate in Malawi and Nepal.
Table 3.5. Level of education of workers contributing to income by activities in selected LDCs
Mean level of education of workers contributing with income to the household
Bangladesh (2000) Malawi (2004) Nepal (2003)
Agriculture and fishing 1.2 3.8 1.4
Mining 8.5 7.5 3.0
Manufacturing 3.1 5.3 3.5
Electricity and utilities 4.7 7.0 6.8
Construction 1.8 4.6 2.4
Commerce 2.5 6.6 6.1
Transport, storage and communication 2.1 7.9 4.6
Finance, insurance and real estate 5.0 5.6 0.0
Services 7.8 7.9 6.7
Unknown 3.3 5.5 2.9
Sources: As table 3.3.Notes: Some entries, particularly those with zero entries in table 3.3, are for very small samples. These are mining and electricity and utili-
ties in Bangladesh and Malawi, and finance, insurance and real estate in Malawi and Nepal. The entry for finance, insurance and real estate represents a single individual
Education is an important determinant of RNFE participation
and income levels.

91CHAPTER 3. Economic Diversification, Non-Farm Activities and Rural Transformation
be highlighted that these findings are based on national data, aggregating all regions and all types of rural areas (including small towns). A fuller picture would require a much more detailed consideration of rural local economies in different contexts. However, such an analysis is beyond the scope of the present Report.
3. struCtural transformation of rural eConomies in ldCs
Successful structural transformation of national economies entails a progressive shift of productive resources from traditional to modern activities, from low-value and low-productivity to higher-value and higher-productivity activities, and from agriculture to services and manufacturing. In rural economies, this process involves diversification into higher-value agricultural production and non-farm activities, which act as a stepping stone between agriculture and urban economic activities (Hazell, Haggblade and Reardon, 2007). The wide variations in the extent and nature of RNF activities, both between and within LDC subgroups, reflect different stages in this process of rural structural transformation. Such transformation may be seen as occurring in three stages (FAO, 1998). The great majority of LDCs in all categories are still in the first stage, in which agriculture is the main source of rural employment, most RNF activity is centred on the rural areas themselves, and dependence on rural-urban links is limited.
In this stage, most RNF activities are directly linked to agriculture, which in turn depends primarily on such activities for supplies of farm inputs and services and for processing and distribution of products. RNF activities are mainly informal, and typically include the manufacture or mixing of fertilizer; production, rental and repair of agricultural and transport equipment; crop processing; transportation; commerce; and construction and maintenance of market facilities. Thus, although strongly focused on agriculture, RNF activities may be fairly evenly divided between commerce, manufacturing and other services sectors. Data from population censuses in eight African countries, including four LDCs, indicate that, on average, 23 per cent of RNF employment is in manufacturing-related activities; 22 per cent in commerce and transportation; 35 per cent in personal, financial and community services; and 30 per cent in construction, utilities, mining and other activities (Haggblade, Hazell and Reardon, 2007, table 1.2, pp. 6–7).8
In the second stage of transformation, non-farm activities are more varied, encompassing activities such as tourism, mining and services as well as those linked with agriculture, and rural-urban links are more important. In some cases, there may also be some nascent subcontracting of rural companies by urban or foreign businesses (e.g. in clothing), “commuting” from peri-urban areas to rural towns and intermediate cities, and/or rapid development of agro-industry in commercial agricultural areas (Yumkella et al., 2011). Levels of capital intensity are mixed, both between and within RNF subsectors, with small-scale labour-intensive production in rural areas alongside relatively capital-intensive enterprises producing similar products in intermediate cities.
While most LDCs remain in this first stage of rural transformation, using the World Bank’s (2007) categorization of agriculture-based and transforming countries as a proxy9 suggests that four LDCs — Angola, Bangladesh, Senegal and Uganda — are in the second stage. (It should be noted, however, that the correlation between the two is far from perfect.)
The third stage of RNF sector transformation, typical of Latin American countries and more advanced Asian economies, is characterized by an intensification of the characteristics that differentiate the second stage from the
Successful structural transformation of rural economies involves
diversification into higher-value agricultural production and
non-farm activities.
The great majority of LDCs in all categories are still in the first stage of rural structural transformation.
In the second stage of transformation, non-farm activities
are more varied.
The third stage of RNF sector transformation is characterized by
an intensification of the characteristics that differentiate the second stage from the first.
The Least Developed Countries Report 201592
first (FAO, 1998; Otsuka, 2007). However, LDCs are unlikely to reach this stage prior to graduation.
D. Key drivers of rural structural transformation
1.rural non-farm aCtivities as a driver of agriCultural upgrading
In addition to providing employment and income opportunities, the RNF sector plays a key role in the dynamism of the agricultural sector, providing services and products upstream and downstream, including inputs and opportunities for increasing value added. It can also provide, and increase access to, market outlets; and it is a major source of funding for agricultural investment. RNFE development thus plays an important role in farm productivity, competitiveness and commercialization, as well as poverty reduction and food security (FAO, 1998; Reardon et al., 2013).
RNFE incomes have a significant effect on farm investments (Reardon, Crawford and Kelly, 1994). Where credit is unavailable or unaffordable, high-return RNF activities are an essential source of financing for investments and input purchases.10 The risk-reduction effects of household income diversification, even into lower-return activities, may also help to encourage agricultural investment and adoption of new technologies and production of cash crops by reducing risk aversion.
In African LDCs in particular, RNF income is usually the main source of cash for agricultural investment (Reardon and Mercado-Peters, 1993; Reardon and Kelly, 1988; Reardon, Crawford and Kelly, 1994; Savadogo, Reardon and Pietola, 1995). It is also used as a substitute for collateral, for example in the Sahel, allowing households with non-farm incomes preferential access to credit (Hoffman and Heidhues, 1993). In rural Bangladesh, rural non-farm incomes have encouraged traders to untie credit from future crop supplies, increasing farmers’ flexibility in marketing, as well as being a major source of cash for investment (Reardon et al., 2013). Conversely, constraints on earning RNF income translate directly into constraints on household investment in agricultural upgrading.
RNF activities are thus important to agricultural upgrading at the community-wide level. However, the linkage between high-income RNFE opportunities and agricultural investment and income can give rise to increasing overall inequality, as such opportunities are closely linked to a household’s prior wealth and education. This can also interact with land tenure and distribution to create a vicious circle of unequal distribution of land and non-farm earnings (Barrett, Reardon and Webb, 2001). In Rwanda, for example:
“Access to regular off-farm income opportunities tends to accentuate rather than mitigate inequalities in land endowments through the operation of an active (and illegal) land market (which implies that customary restrictions on land sales have largely disappeared) where many land parcels are sold under distress conditions and purchased by people with regular RNFE incomes.”
André and Platteau (1998, p. 28)
Similar effects have been observed in Kenya (Francis and Hoddinott, 1993).
The RNF sector plays a key role in the dynamism of the agricultural
sector, providing services and products upstream and
downstream.
In African LDCs in particular, RNF income is usually the main source of
cash for agricultural investment.
The linkage between high-income RNFE opportunities and agricultural investment and income can give rise
to increasing overall inequality.

93CHAPTER 3. Economic Diversification, Non-Farm Activities and Rural Transformation
There may also be some competition between agriculture and RNFE opportunities for the available investment resources, so that RNFE could in principle reduce agricultural investment as well as increasing it (Ellis and Freeman, 2004; Reardon, Berdegué and Escobar, 2001; Ruben and van den Berg, 2001). Such effects have been observed, for example, in the north of Burkina Faso in the 1980s (Christensen, 1989), and in a more recent study in Ghana (a lower-middle-income country) (Egyei, Harrison and Adzovor, 2013).
While competition for labour during peak agricultural seasons could also lead to similar trade-offs, most RNF production typically occurs in the slack season, when agricultural labour demands and opportunities are limited. There may, however, be labour competition between RNFE activities and labour-intensive investments in agricultural sustainability generally conducted in the slack season, such as building and maintaining bunds and terraces.
Beyond the effects of non-farm incomes on investable capital in agriculture, some RNFE activities can also affect choices of crops and technologies by increasing access to input supplies and adapting them to the needs of local farmers. This includes, for example, fertilizer manufacture and mixing; manufacture, rental, and repair of animal traction and transport equipment; and trade in inputs. Other activities, such as construction and maintenance of market facilities, transportation services and crop processing, can also have a positive effect by providing additional commercial outlets for produce. Particularly beyond peri-urban areas, such activities are a major part of the non-farm economy.
In some areas, contract farming for supermarkets (in peri-urban areas), processors or export agents might help some smallholders to overcome capital and liquidity constraints as well as the lack of access and capacity to adopt technological innovations (Losch, Fréguin-Gresh and White, 2012). However, large retailers become gatekeepers to markets, hindering or fostering market access, which depends on producers competing to satisfy their demands. Buyers and chain leaders are becoming increasingly demanding, but do not necessarily provide the support or transfer the knowledge and capabilities necessary to meet their demands (UNCTAD, 2007).
Just as RNF development can be a driver of agricultural upgrading, so under- or inappropriate development of the sector can weaken agricultural development. Aside from resource and liquidity constraints on investment, agricultural upgrading may be limited by local unavailability of inputs, equipment design inappropriate to local conditions, lack of transport services, etc., which reduces productivity and sustainability, discouraging or preventing the introduction of new crops and limiting market access (Matlon and Adesina, 1997; Kelly et al., 1993; Boughton et al., 1995).
2. demand
While governments and donors give a great deal of attention to the supply-side needs of RNFE development, the equally important demand side is often neglected — particularly local demand within rural areas themselves — causing major problems for both policies and projects. Major sources of demand for higher-value agricultural produce and non-farm goods and services are exports (primarily for agricultural produce and agroprocessing, and in some areas mining and tourism); urban markets (mainly for peri-urban areas); and — particularly neglected — local rural markets.
Areas with good transport connections to export markets have substantial potential to increase production of higher-value crops for export. Consumer preferences in developed countries for speciality products and year-round
There may be some competition between agriculture and RNFE opportunities for the available
investment resources.
Most RNF production typically occurs in the slack season, when agricultural labour demands and
opportunities are limited.
Some RNFE activities can also affect choices of crops and technologies
by increasing access to input supplies and adapting them to the
needs of local farmers.
Under or inappropriate development of the non-farm sector can weaken
agricultural development.
The Least Developed Countries Report 201594
supplies of fresh produce have generated rapid growth in markets for horticultural products. Markets for oilseeds and meat are also growing rapidly, and new markets are emerging for feed grains and biofuels.
However, most high-value food products are perishable; and, together with tight public and private quality and safety standards in export markets, this can be an almost insurmountable obstacle to exports from LDCs (Saner and Guilherme, 2006). Public standards for food safety, handling, processing and retail sales throughout the food chain are governed by ISO 22000:2005,11 helping to simplify import and export formalities for countries meeting the ISO standards. However, the capacity to meet and police these standards is limited in most LDCs. Even in Kenya, with greater capacity than most LDCs, more than 75 per cent of food-processing companies still struggle to implement quality management systems effectively (Kibe and Wanjau, 2014). Moreover, the actual impact of such systems on competitiveness remains controversial, a number of empirical studies finding no significant effect (Saner and Guilherme, 2006).
The increasing importance of product standards for food exports, and limited capacity to apply them in many exporting countries, is contributing to an increasing vertical integration of food systems (World Bank, 2007; AfDB, OECD and UNDP, 2014), but also limiting opportunities in areas with less favourable external transport connections and for small producers outside vertically integrated systems.
Regional markets may also offer some potential for increasing agricultural exports. In African LDCs particularly, the low level of intraregional trade compared with other regions suggests the possibility of unexploited opportunities for regional exports, although this may partly reflect preferential access to non-regional markets12 as well as often inefficient and under-resourced customs systems and limited intraregional transport connections. Harmonization of product standards within regional trading blocs could help to facilitate intraregional trade; and, if designed to converge towards ISO 22000 standards, could also facilitate access to non-regional markets over the long term.
Domestic demand plays a critical role, particularly in areas with less favourable transport connections to export markets. Urbanization and income growth in both rural and urban areas offer major opportunities for diversification of agricultural production towards higher-value products such as livestock products, vegetable oils, fruits and vegetables. It has long been recognized that the proportion of income spent on non-food products increases as incomes rise (a principle known as Engel’s Law). Equally, Bennett’s Law (Bennett, 1954) highlights the fact that food demand also shifts from staple to non-staple foods as incomes rise, while demand for processed foods also increases (Dolislager, Tschirley and Reardon, 2015; Reardon et al., 2015). There are strong synergies between these effects, as non-staple products such as dairy produce and fruit are more perishable than grains, and consequently require more post-harvest processing and services.
Thus, a given increase in incomes leads to a greater percentage increase in demand for higher-value agricultural produce, food processing and non-food goods, providing potentially substantial market opportunities for both higher-value agriculture and RNFE activities. Farmers in areas of good agricultural potential and with access to markets are well placed to secure new markets for such products; and their ability to do so can be further enhanced through cooperative enterprises, especially where basic services are limited (ILO, 2011; CSEND, ILO and ICA, 2015). This highlights the importance of ensuring that local producers are able to respond effectively to these demand changes.
Areas with good transport connections to export markets have
substantial potential to increase production of higher-value crops for
export.
Harmonization of product standards within regional trading blocs could help to facilitate intraregional trade.
A given increase in incomes leads to a greater percentage increase in demand for higher-value agricultural
produce and processed foods.
95CHAPTER 3. Economic Diversification, Non-Farm Activities and Rural Transformation
As discussed in section B, urban markets are a major source of demand for peri-urban areas, but offer fewer opportunities to more distant rural areas. Other potentially important sources of local demand (and investable surpluses) include export-oriented agriculture and agro-industry, where conditions are favourable; entrepôts on trading routes, particularly on borders (e.g. Muse, on Myanmar’s border with China) and at junctions between major domestic routes; and transport corridors such as the Beira Corridor in Mozambique (Reardon, Berdegué and Escobar, 2001; Paul and Steinbrecher, 2013). “Implanted” natural resource-based projects or businesses such as mines, oilfields, forestry projects and eco-/cultural tourism can also provide an important engine of demand; but, aside from environmental concerns, such activities are often limited to enclaves with very limited effects on the wider economy. Nonetheless, they may provide some relatively remunerative services sector jobs, generating some consumption linkages.
Migrant remittances can also create employment indirectly, through investment in farming and rural non-farm activity as well as through consumption spending (Taylor, 1999; Wouterse and Taylor, 2008). Depending on the nature of migration, however, remittances may be concentrated often among a limited number of better-off families (Lipton, 1980; Reardon and Taylor, 1996), in which case there is a risk of compounding existing inequalities and concentration of RNF opportunities. The impact of remittances also depends heavily on the destination of migration, as intercontinental migration is often longer-term and generates larger remittances than migration to urban areas or neighbouring countries. Thus, while intraregional remittances may be more equitably distributed, they may have less overall effect on agriculture or RNF employment (Wouterse and Taylor, 2008).
Regardless of the primary engine of demand growth, rural markets themselves can be a major and growing market for both RNFE goods and services and higher-value agricultural produce as rural incomes grow. As in urban areas, increasing rural incomes generate disproportionate increases in demand for non-staple and processed foods and non-farm goods and services, including household goods, such as furniture and clothing; services, including local financial and commercial services, transport, entertainment and hospitality, personal care, etc.; and food processing. In relatively closed economies, much of this demand is, almost by definition, for local (agricultural and non-farm) products, including higher-value and processed foods, clothing, household goods, transportation, etc.
Two recent multi-country studies provide an indication of the scale of demand for higher-value and processed foods as well as non-farm goods and services in rural (and urban) markets in several African and Asian LDCs. In Ethiopia, Malawi, Mozambique, Uganda and United Republic of Tanzania, rural consumers spent on average 34 per cent of their incomes on non-food products (including urban-produced and imported goods), and bought 44 per cent of the food they consumed in 2010. In Bangladesh and Nepal in the same year, rural households bought 73 per cent of their food from the market. In both the African and the Asian LDCs covered by these studies, non-grains accounted for 61 per cent of rural households’ total food expenditure. Processed foods accounted for 29 per cent in the former, and 53 per cent in the latter (Dolislager, Tschirley and Reardon, 2015; Reardon et al., 2015). These proportions can be expected to increase further as incomes rise.
Since additional local purchases in turn increase the incomes of sellers, this generates potentially important multiplier effects. In African LDCs, estimates of such multiplier effects range from 1.3–1.4 in Burkina Faso, Sierra Leone and Zambia to 1.7–2.0 in Gambia, Madagascar, Niger and Senegal. The breakdown
Cooperative enterprises can improve access to higher-value agricultural
produce markets.
Migrant remittances can create employment indirectly, through investment in farming and rural
non-farm activity.
Rural markets themselves can be a major and growing market for
both RNFE goods and services and higher-value agricultural produce as
rural incomes grow.
The Least Developed Countries Report 201596
of additional demand between agriculture and the non-farm sector varies considerably in the few cases where this is estimated: Agriculture accounts for around three quarters of the total in Senegal and Zambia, but little more than one quarter in Niger (Reardon et al., 2007, table 7A.1, pp. 174–182).13
3. hard and soft infrastruCture
Density and quality of infrastructure (e.g. electricity and water supply, storage facilities and roads) are crucial to agriculture and RNF activities. By providing greater access to output and input markets and allowing lower production and transaction costs, better infrastructure increases investments and incomes and improves supply response (Anderson and Leiserson, 1978). Similar benefits are provided by the “soft infrastructure” of institutions (e.g. marketplaces, communications networks, education and health services, financial and payments systems and market information systems). Infrastructure investment policies can thus increase agricultural productivity, strengthen linkages between the RNF sector and agriculture, and create new opportunities for RNF employment (Ahmed and Hossain, 1990; Kingombe, 2011).
However, both hard and soft infrastructure are extremely limited in most rural areas in LDCs, particularly beyond peri-urban areas and in areas of low population density. This further reinforces the other advantages of urban proximity, and can contribute to an agglomeration of capital-intensive firms in urban areas, undermining the viability of smaller and more labour-intensive rural firms.
Rural electrification is a critical element of rural development and diversification. It has the potential to transform non-farm activities — and, indirectly, the agricultural sector — in LDCs, increasing productivity by allowing the introduction of new productive technologies and extending potential working hours, as well as contributing to higher educational attainment and improved health outcomes with longer-term benefits (UNCTAD, 2014, box 5, p. 133). As chart 1.10(e) demonstrates, access to electricity in rural areas is particularly limited, especially in African LDCs, where it is less than 10 per cent in nearly two thirds of cases. Even in most Asian and island LDCs, only a minority of the rural population have access to electricity. The potential effect of moving to universal access is thus considerable, especially in African LDCs, where the proportion of households with access to electricity will increase more than tenfold in just 15 years.
While rural towns and some immediate or densely inhabited peri-urban areas may be able to benefit from grid extension from existing centralized generation and distribution systems, in most other contexts, off-grid and micro-grid approaches will be needed. The potential for such systems is greatly increased by the development of renewable energy technologies, which can operate on a much smaller scale and are now more economically viable than available fossil fuel alternatives (including diesel generators) in many areas, although the costs and logistical challenges remain considerable.
As shown in chart 1.10(g-h), rural areas are also generally disadvantaged in access to education; and this disadvantage tends to increase with distance from urban areas. As discussed in section C.2, the comparative experiences of Malawi, Nepal and Bangladesh suggest that education alone is not sufficient as a driver of RNFE development. Nonetheless, empirical studies identify education as a key determinant of household participation in RNF activities, and of RNF productivity, incomes and enterprise success (e.g. Jolliffe, 1998; Glewwe, 1999; Lanjouw, Quizon and Sparrow, 2001; Abdulai and Crole-Rees, 2001). The higher-productivity RNF activities critical to rural economic transformation,
Infrastructure investment policies can increase agricultural productivity
and strengthen linkages between the RNF sector and agriculture.
Both hard and soft infrastructure are extremely limited beyond peri-urban areas, reinforcing the other
advantages of urban proximity.
Rural electrification has the potential to transform non-farm activities
— and, indirectly, the agricultural sector.
97CHAPTER 3. Economic Diversification, Non-Farm Activities and Rural Transformation
in particular, generally require more advanced skills and knowledge to handle more complicated technologies (Yamauchi, 2004; Fafchamps and Shilpi, 2005; Barrett, Reardon and Webb, 2001); and the lack of such skills is one of the major barriers confining poorer households to less remunerative income sources.
More and better education is thus a significant factor influencing the pace and nature of RNFE development, and the scale and distribution of its benefits. Increasing access to education can provide a means of promoting rural development, diversification and pro-poor growth (Winters et al., 2009); and improvements in school quality can have a still higher return than additional years of schooling (Glewwe, 1999).
Access to financial services and credit is at best limited in most rural areas of LDCs, especially beyond the peri-urban, so that capital for investment is largely limited to each household’s own savings, sometimes supplemented by resources mobilized from family and friends (including remittances). Even in Bangladesh, the home of microfinance, a 2000 survey found that more than 70 per cent of rural enterprises cited household savings as the main source both of start-up capital and of subsequent investment, while only 10 per cent had received loans from banks.
In many LDCs, lack of access to commercial finance reflects both underdevelopment of the financial system and a strong risk aversion in the banking sector, skewing assets towards safer investments such as government securities and away from riskier activities such as lending to small and medium-sized enterprises (SMEs) and microenterprises. Banks are reluctant to lend to small businesses and microenterprises (and suppliers to provide credit), largely because of high risks and limited information about creditworthiness.
Microfinance has been widely promoted as a means of financing small-scale investment in a context of poverty reduction. Since its popularization in Bangladesh, several microfinance programmes have been initiated in developing countries, in particular LDCs, by international organizations, non-governmental organizations (NGOs) and donors.
Despite initial observations highlighting the effects of such schemes in easing the finance constraints of the poor, the evidence for positive effects is at best very weak. Notwithstanding numerous studies, some of which have been widely cited in support of microfinance, a recent systematic (Cochrane review) assessment of the available evidence finds no valid evidence for positive effects due to serious problems in methodology and research design. Its conclusion is that “it remains unclear under what circumstances, and for whom, microfinance has been and could be of real, rather than imagined, benefit to poor people”, and that its “putative success… may well have diverted attention from opportunities for alternatives” (Duvendack et al., 2011, p. 75).
Where microcredit is available, it is characterized by very high interest rates and very short maturities, while rates of return on investment in rural areas of LDCs are highly uncertain, especially on the innovative investments essential to rural transformation, and often relatively low. Additional risks arise from the possibility of crop failure (affecting demand for non-agricultural products as well as agricultural incomes); from household income losses (e.g. due to ill-health) more generally; and from diversion of funds to maintain a minimum level of consumption due to very low and variable incomes. Supply-side constraints on microfinance result from the high cost of reaching clients in widely dispersed populations and problems in enforcing repayment.
A systematic review of evidence from sub-Saharan Africa finds that these factors result in some recipients of microcredit becoming over-indebted and
More and better education is a significant factor influencing the pace and nature of RNFE
development.
Access to financial services and credit is at best limited in most rural areas of LDCs, especially beyond
the peri-urban.
Banks are reluctant to lend to small businesses and microenterprises,
largely because of high risks and limited information about
creditworthiness.
Microcredit is characterized by very high interest rates and short
maturities, while investment returns are highly uncertain.
The Least Developed Countries Report 201598
impoverished rather than enriched, and concludes that “a growing microfinance industry may as easily be a cause for concern as one of hope” (Stewart et al., 2010). High interest rates, short maturities and uncertain returns also limit investments, particularly in innovation; skew investment opportunities to better-off households who can more readily afford to finance investment from their own resources and to bear the costs and risks involved; and increase the risk of business failure. Where land is used as collateral, this results in a risk of dispossession, seriously impairing the borrower’s ability to emerge from poverty.
In peri-urban areas and an increasing proportion of intermediate rural areas, the availability of mobile phone coverage allows the use of mobile phone-based banking services such as those developed in Kenya and South Africa, which can substantially reduce transaction costs. This advantage should spread rapidly to other intermediate rural areas where coverage remains limited, and ultimately to remote and isolated areas. Combined with increasing investment opportunities through rural development, this could contribute substantially to increasing the scale of lending opportunities to a level sufficient to attract commercial lenders to rural areas, potentially reducing the cost of microcredit to a more sustainable level.
Transport infrastructure, particularly roads (but also waterways in some areas), plays a pivotal role in rural economic transformation and RNFE development. As noted above, proximity and access to urban markets is a major determinant of rural development, providing considerable benefits to both the agricultural sector and the RNFE. As towns and cities grow, new towns emerge in rural areas and transport links improve, rural areas will effectively become “closer” to towns and cities economically. Such opening leads, in varying degrees, to a progressive delinking of RNFE growth from agriculture (Haggblade, Hazell and Reardon, 2007), and can create new opportunities for the production of exportable goods and services (e.g. agroprocessing, mining and tourism), promoting wider development through linkages to non-tradable activities (Wiggins, 2014). In the long term, this process is likely to be indispensable to the transformation of rural economies and thus to sustainable poverty eradication.
However, this is not a linear process, and the opening associated with strengthening transport connections is a two-edged sword. In remote and isolated rural areas (and in varying degrees some intermediate rural areas), the high costs of trade beyond the local market provide a substantial degree of natural protection from outside competition; and local rural economies have evolved over many generations in response to this reality. Strengthening transport connections with urban areas effectively reduces this natural protection, and in doing so it radically changes the context within which the RNFE operates: It exposes producers to unprecedented competition in local food and non-food markets from large urban and foreign producers with much greater economies of scale and modern distribution networks (Reardon et al., 2007). While small-scale local producers also gain access to new opportunities and incentives, they typically have neither the experience nor the means to respond to them effectively.
A sudden ingress of urban products and/or imports of non-farm goods into rural areas can thus be a major challenge for local producers, particularly of cottage-industry manufactured goods, and for those dependent on income from unskilled labour. The potential scale of this negative effect is very substantial: The sectoral activities data in table 3.3 above indicate that manufacturing activities account for 22 per cent of RNF employment in Nepal, 29 per cent in Malawi and 32 per cent in Bangladesh.
Where available, mobile phone coverage allows the use of mobile
phone-based banking services which can substantially reduce
transaction costs.
Transport infrastructure, particularly roads, plays a pivotal role in rural
economic transformation and RNFE development...
... but the opening associated with strengthening transport connections
is a two-edged sword.
A sudden ingress of urban products and/or imports of non-farm goods
into rural areas can be a major challenge for local producers.
99CHAPTER 3. Economic Diversification, Non-Farm Activities and Rural Transformation
This highlights a critical paradox of poverty-oriented structural transformation in rural economies. Poverty is unlikely to be eradicated in rural areas of LDCs without improved transport infrastructure; but improving transport links plunges rural producers into a much larger and more competitive market, in which they are ill-equipped to succeed because of their multiple disadvantages, in scale, financial and human resources, access to infrastructure and markets, and inexperience in operating in such markets. Resolving this paradox will be a key challenge in the post-2015 context.
Construction of rural infrastructure can also play a very important secondary role in rural development. As highlighted in Chapter 1, achieving the SDGs will require a considerable increase in the level of infrastructure investment in rural areas of LDCs in the post-2015 era; and, beyond the long-term benefits of infrastructure provision, this can serve the additional and more immediate purpose of creating productive employment opportunities, with the potential to reduce the deficit in demand that constrains RNFE development (ILO, FAO and IFAD, 2010; ILO, 2014; ILO et al., 2015; UNCTAD, 2013b, Chap. 5.D).
Depending on their nature, many infrastructure investments have considerable potential for job creation through the use of labour-based construction methods (Kingombe, 2011), which can also be more cost-effective than intensive use of construction equipment in labour-abundant, low-wage economies. Equally, where construction materials of adequate quality are available, local sourcing can provide additional opportunities for non-farm employment and enterprise development, and may again reduce costs in remote and isolated areas where transport costs are high.
In practice, however, direct and indirect employment effects are not generally considered in decisions on construction methods in infrastructure. By making investment more “employment-friendly” (ILO et al., 2015), taking account of these considerations can make a significant contribution to rural economic transformation. Labour-based approaches also allow wider inclusion of infrastructure beneficiaries at community level in all project stages, permitting more effective integration of social and environmental considerations (ILO, 2014).
“Workfare” programmes of labour-intensive public works are long established in many developing countries as a means of mitigating the adverse consequences of natural disasters, emergencies and humanitarian crises (e.g. droughts, floods, hurricanes and harvest failure) and in post-conflict situations (Lanjouw, 2007; UNCTAD, 2013b); and there have been a number of (mostly donor-funded14) labour-based infrastructure construction projects, primarily in the transport sector. However, many other areas of infrastructure investment are also conducive to labour-based construction methods and local procurement, including water supply (wells and rainwater harvesting), sanitation, agricultural infrastructure (drainage, irrigation, terracing, etc.), and schools and health facilities (including furnishings). Given the scale of such investments required in coming years, a more “employment-friendly” approach could have major benefits for the structural transformation of rural economies.
F. Urban proximity and sectoral priorities for rural economic transformation
As noted above, a key aspect of rural economic transformation is the progressive opening of local rural economies to wider markets as transport infrastructure is improved; but this generates threats to local producers, from
Achieving the SDGs will require a considerable increase in the level
of infrastructure investment in rural areas of LDCs in the post-2015 era.
Many infrastructure investments have considerable potential for job creation through the use of labour-
based construction methods.
Labour-based approaches also allow wider inclusion of infrastructure
beneficiaries at community level in all project stages.
A more “employment-friendly” approach to infrastructure
investment could have major benefits for the structural
transformation of rural economies.

The Least Developed Countries Report 2015100
exposure to wider competition, as well as generating the opportunities offered by larger markets. The potential benefits thus depend on ensuring that producers are able both to withstand the threats and to exploit the opportunities. A key aspect of this is identifying the priorities for agricultural upgrading and economic diversification, based not only on immediate (static) comparative advantage, but also on future (dynamic) comparative advantage within the rapidly changing context implied by a post-2015 world. Such priorities differ widely between peri-urban, intermediate, and remote and isolated areas (table 3.6).
While growth of large cities is a major focus of attention, it should be noted that smaller cities and towns are also of increasing importance. In West Africa, for example, smaller towns and cities comprise 60 per cent of the urban
Table 3.6. Rural development priorities by urban proximity
Agriculture Agroprocessing Other RNFE General
Peri-urban
Develop intensive production of high-value crops for urban market
High-value food processing for urban market
Commuting to urban area Entrepreneurial agriculture
Weekend leisure activities for urban elite/middle class
Primarily microenterprise expansion and SME
development
Transport services
Develop direct links with urban retailers Small-scale industry
Intermediate (and peri-urban areas around small towns)
Expand and increase productivity of traditional
export cropsExport crop processing
Commercialize production of craft products
Entrepreneurial agriculture
Increase productivity of staple production for
local (and possibly urban) markets
Food crop (and meat/fish) preserving and packaging
to increase tradability of agricultural produce to urban and/or export
markets
Construction and related services
Mix of SMEs and microenterprise
Diversify into higher-value crops and livestock for local
markets
Value added processing for local market (and tourism,
where developed)
Construction materials, mining, tourism, fisheries,
sustainable and community forestry, etc., where local conditions are favourable
Develop/ consolidate producers’ associations/
cooperatives
Develop biofuels Biofuel processingDevelop local and supplier-
led value chains
Product differentiation: organic, fair trade, sustainability certification, geographical indicators, etc.
Develop links between smaller towns/rural hubs
Link to tourist sector where developed
Remote/ isolated
Increase productivity of staple crops, mainly for
subsistence consumption (initial focus)
Small-scale processing for local market, initially on-
farm and artisanal“Z goods” (transitional)
Progressive commercialization of small-
scale agriculture
Diversify production towards higher-value crops and
livestock for local market
Food crop (and meat/fish) preserving and packaging
to increase product life and tradability of agricultural
produce to nearby markets
Local services Microenterprise formation
Progressive upgrading and commercialization
Construction and related services
Develop, connect with, and strengthen links between
local hubs
Where local conditions are favourable: construction
materials, sustainable and community forestry, niche (e.g. eco- and adventure)
tourism, etc.
Source: UNCTAD secretariat elaboration.
Identifying the priorities for agricultural upgrading and economic
diversification, based on future (dynamic) comparative advantage is
key to exploiting opportunities.
101CHAPTER 3. Economic Diversification, Non-Farm Activities and Rural Transformation
population (Hollinger and Staatz, 2015), while the near-doubling of Uganda’s urban population between 2002 and 2014 occurred partly through a still greater increase in the number of urban centres, from 75 to 197.15 In the post-2015 context, the establishment of new social infrastructure (schools and health facilities) can be expected to accelerate the emergence of local hubs in rural areas. This is particularly important as smaller towns typically have much stronger linkages with their surrounding rural areas than do larger urban areas (Christiaensen, Weerdt and Todo, 2013; Berdegué and Proctor, 2014).
1. peri-urban areas
The greatest comparative advantage of peri-urban areas, particularly around major cities, lies in servicing urban markets. Urban markets provide a considerable source of demand for goods and services produced in peri-urban areas (e.g. household products and higher-value and processed foods), reflecting higher income levels, and often rapid market growth. Cities in African and Asian LDCs already provide much bigger markets than export sales for food and rural non-food products, and their relative importance is likely to grow further in the future (Dolislager, Tschirley and Reardon, 2015; Reardon et al., 2015).
This can create substantial opportunities for intensive production of fruit, vegetables and other high-value crops, for meat and fish, and for high value added food processing, including production of luxury foods. Proximity and the possibility of regular direct contact provide the potential both to build long-term relationships with larger outlets such as supermarkets and wholesalers and to develop sales to smaller retail outlets and direct sales in markets. Linking with supermarkets may offer particular benefits in terms of women’s employment opportunities, as women tend to be preferred for activities such as cleaning and bundling vegetables (Qaim and Rao, 2012).
Daily commuting can provide another option; and some well-located peri-urban areas close to major cities, with favourable infrastructure, might also hope to attract urban workers as residents. Leisure activities oriented towards better-off urban residents may generate valuable economic opportunities; and such interactions with urban areas increase demand for transport services.
Proximity to urban services, and to urban markets for the purchase of inputs, provides substantial advantages; and access to electricity and water supply (where not already available) may be facilitated by the possibility of extending existing supply grids. Once power supply is available, there may be the scope to develop small-scale industry, exploiting the advantages of lower land costs than in the city itself.
2. intermediate rural areas
In intermediate rural areas, most non-farm activities are closely connected with agriculture, through forward and backward linkages. Hence, a productive agricultural sector increases RNFE activity; but sluggish agricultural growth leads to anaemic consumer demand and to limited opportunities for agroprocessing and input supply (Reardon, 1997; Wiggins, 2014).
Intermediate rural areas (and peri-urban areas around rural towns) are often the primary area for production of export crops. Where this is the case, a major focus is increasing yields for these crops, and moving up value chains through increased local processing. Expansion of the cultivated area may also be possible, where suitable uncultivated land is available, based on assessment of, and appropriate efforts to ease, the economic or institutional constraints that
The establishment of new social infrastructure (schools and health
facilities) can be expected to accelerate the emergence of local
hubs in rural areas.
Urban markets provide a considerable source of demand for
goods and services produced in peri-urban areas.
Once power supply is available, there may be the scope to develop
small-scale industry in peri-urban areas.
In intermediate rural areas, most non-farm activities are closely
connected with agriculture, through forward and backward linkages.
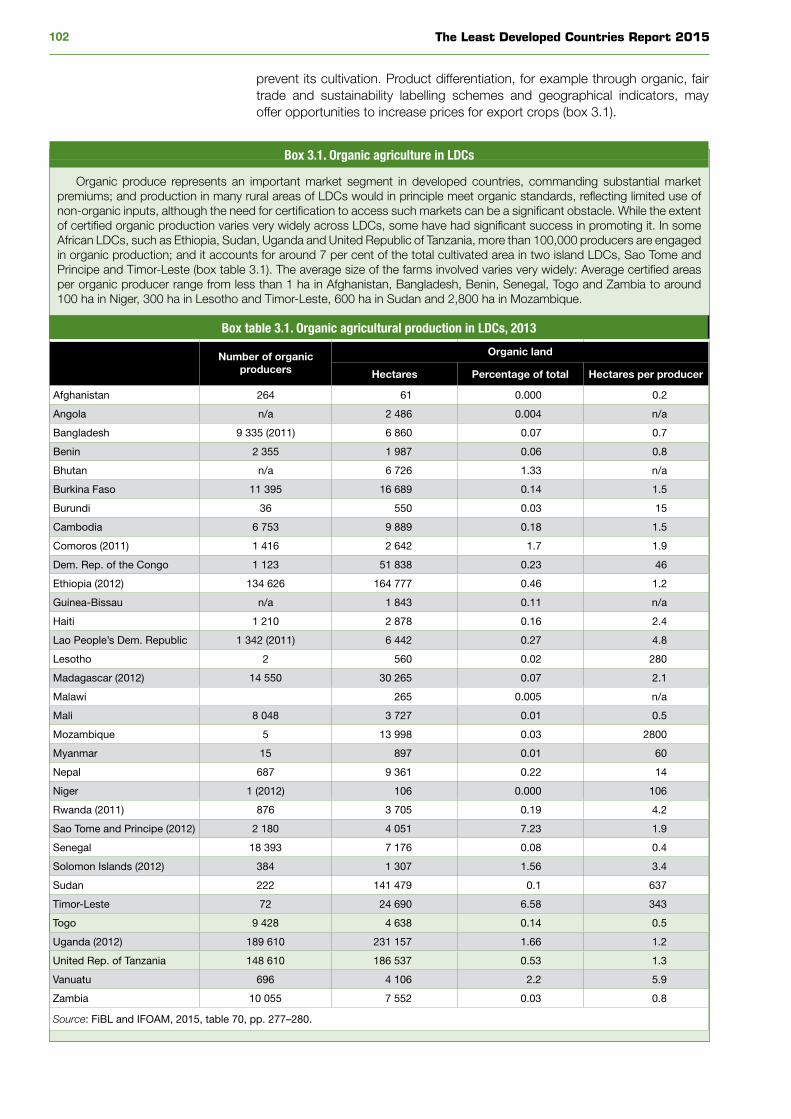
The Least Developed Countries Report 2015102
prevent its cultivation. Product differentiation, for example through organic, fair trade and sustainability labelling schemes and geographical indicators, may offer opportunities to increase prices for export crops (box 3.1).
Box 3.1. Organic agriculture in LDCs
Organic produce represents an important market segment in developed countries, commanding substantial market premiums; and production in many rural areas of LDCs would in principle meet organic standards, reflecting limited use of non-organic inputs, although the need for certification to access such markets can be a significant obstacle. While the extent of certified organic production varies very widely across LDCs, some have had significant success in promoting it. In some African LDCs, such as Ethiopia, Sudan, Uganda and United Republic of Tanzania, more than 100,000 producers are engaged in organic production; and it accounts for around 7 per cent of the total cultivated area in two island LDCs, Sao Tome and Principe and Timor-Leste (box table 3.1). The average size of the farms involved varies very widely: Average certified areas per organic producer range from less than 1 ha in Afghanistan, Bangladesh, Benin, Senegal, Togo and Zambia to around 100 ha in Niger, 300 ha in Lesotho and Timor-Leste, 600 ha in Sudan and 2,800 ha in Mozambique.
Box table 3.1. Organic agricultural production in LDCs, 2013
Number of organic producers
Organic land
Hectares Percentage of total Hectares per producer
Afghanistan 264 61 0.000 0.2
Angola n/a 2 486 0.004 n/a
Bangladesh 9 335 (2011) 6 860 0.07 0.7
Benin 2 355 1 987 0.06 0.8
Bhutan n/a 6 726 1.33 n/a
Burkina Faso 11 395 16 689 0.14 1.5
Burundi 36 550 0.03 15
Cambodia 6 753 9 889 0.18 1.5
Comoros (2011) 1 416 2 642 1.7 1.9
Dem. Rep. of the Congo 1 123 51 838 0.23 46
Ethiopia (2012) 134 626 164 777 0.46 1.2
Guinea-Bissau n/a 1 843 0.11 n/a
Haiti 1 210 2 878 0.16 2.4
Lao People’s Dem. Republic 1 342 (2011) 6 442 0.27 4.8
Lesotho 2 560 0.02 280
Madagascar (2012) 14 550 30 265 0.07 2.1
Malawi 265 0.005 n/a
Mali 8 048 3 727 0.01 0.5
Mozambique 5 13 998 0.03 2800
Myanmar 15 897 0.01 60
Nepal 687 9 361 0.22 14
Niger 1 (2012) 106 0.000 106
Rwanda (2011) 876 3 705 0.19 4.2
Sao Tome and Principe (2012) 2 180 4 051 7.23 1.9
Senegal 18 393 7 176 0.08 0.4
Solomon Islands (2012) 384 1 307 1.56 3.4
Sudan 222 141 479 0.1 637
Timor-Leste 72 24 690 6.58 343
Togo 9 428 4 638 0.14 0.5
Uganda (2012) 189 610 231 157 1.66 1.2
United Rep. of Tanzania 148 610 186 537 0.53 1.3
Vanuatu 696 4 106 2.2 5.9
Zambia 10 055 7 552 0.03 0.8
Source: FiBL and IFOAM, 2015, table 70, pp. 277–280.
103CHAPTER 3. Economic Diversification, Non-Farm Activities and Rural Transformation
Among food crops, diversification into higher-value crops and livestock production to respond to growing local demand is a major opportunity; and increasing processing (preserving and packaging) can boost this opportunity by increasing tradability to urban markets, as well as increasing local value added and providing off-farm income opportunities. To the extent that peri-urban economies move towards higher-value products and non-agricultural production oriented towards urban markets, this may also open up opportunities for the sale of staple foods to the urban market. Development of biofuel crops for local use may also be an important opportunity, providing the potential for employment creation in processing and for foreign exchange savings as well as increasing the sustainability of transportation.
Beyond agroprocessing, RNFE opportunities may arise from commercialization of craft production and, particularly in the post-2015 context, construction and related services and construction materials. Depending on the nature of the area and the natural resources available, other potential sectors may include tourism, fisheries, sustainable forestry (including forest products as well as timber and wood products) and possibly mining, whose developmental benefits can be enhanced by maximizing forward and backward linkages to other sectors.
3. remote and isolated areas
Remote and isolated areas are generally oriented primarily towards subsistence production, particularly in agriculture. A first priority is thus to increase staple productivity and promote reliable market access (and storage). This is an essential foundation for diversification of agricultural production, adoption of new technologies and development of non-farm activities. Households’ critical dependence on staple food production inevitably gives rise to extreme risk aversion; and assurance of access to sufficient food is a prerequisite for investment of resources or effort in other activities. Other mechanisms, such as development of functioning markets and local food security stocks, can contribute as well, but these also depend significantly on local production.
Increasing staple yields allows households to meet their own consumption needs with less land, releasing land for production of higher-value crops for sale as incomes rise and households upgrade and diversify their diets. Demand for livestock can similarly be expected to grow. Processing of locally produced foods may also provide a useful income source, and may lay the foundations for an artisanal agroprocessing sector, which is a major source of income and employment for women; and preserving and packaging foods can contribute to food security and seasonal price stability, as well as potentially allowing sales in more distant markets. Movement from a traditional pattern of home-processing towards purchasing processed foods can also release women’s time from unpaid domestic work to engagement in economic activities outside the home.
Increasing incomes in relatively closed markets are also likely to raise demand for so-called “Z goods” (non-food goods, typically of relatively low quality, produced on a small scale using traditional labour-intensive methods) (Hymer and Resnick, 1969). This does not generally represent a viable option in the long term, as local production will be uncompetitive with industrially produced goods in price and/or quality once they become available; and this limits the resources it is worth investing in upgrading production. Nonetheless, “Z goods” can represent a valuable source of supplementary income in the interim. They may also provide a starting point for microenterprises that may later move into other activities, and a training ground for business skills.
RNFE opportunities may arise from commercialization of craft
production, construction and related services and construction materials.
Remote and isolated areas are generally oriented primarily towards subsistence production, particularly
in agriculture.
A first priority is to increase staple productivity and promote reliable
market access (and storage).
“Z goods” can represent a valuable source of supplementary income and provide a starting point for
microenterprises, but are unlikely to be viable in the long term.

The Least Developed Countries Report 2015104
Increased infrastructure investment can be expected to generate opportunities for the production of construction materials in remote areas, benefiting considerably from the closed nature of local markets, although such materials are unlikely to be competitive beyond the local market. Other possible productive sectors are similar to those in intermediate areas, and again need to be based on available natural resources; but their potential and the nature of the activities developed will inevitably reflect the more closed nature of local markets in remote and isolated areas. For example, the potential for tourism is likely to be limited in most cases, with a few exceptions such as ecotourism (e.g. on small remote islands) and adventure tourism (as in the Himalayas in Nepal).
G. Summary
In summary:
• Aside from outward migration, the main routes out of poverty in rural areas are market-oriented agriculture and productive non-farm activities. Both require rural economic transformation.
• Non-farm activities are a major driver of agricultural upgrading and rural transformation.
• Data on rural diversification and non-farm activities are very limited, and their interpretation is complicated by the multiple dimensions of diversification.
• Nonetheless, it is clear that all but a few LDCs in all regions are still in the first stage of rural economic transformation.
• The extent of rural economic diversification varies widely between LDCs, but does not necessarily reflect transformation: The non-farm sector includes low-productivity “survivalist” activities as well as transformative high-productivity activities.
• The greatest driver of rural economic transformation is proximity to urban areas, but other drivers are needed beyond peri-urban areas.
• Remote areas and the poorest households have the greatest need of income diversification, but the most limited opportunities to diversify productively.
• Demand is critical to rural transformation, but often neglected; local rural markets play a major role, especially beyond peri-urban areas.
• Poverty eradication will require improved transport infrastructure in the long term, but will only have a positive impact if rural producers are enabled to compete in wider markets.
• Sectoral priorities for agriculture and the non-farm economy in the post-2015 context differ markedly between peri-urban, intermediate and remote/isolated areas.
Increased infrastructure investment can be expected to generate
opportunities for the production of construction materials in
remote areas.
105CHAPTER 3. Economic Diversification, Non-Farm Activities and Rural Transformation
Notes
1 See, for example, Haggblade, Hazell and Reardon, 2010; Hossain, 2004; Cannon and Smith, 2002; Lanjouw and Feder, 2001; Gordon and Craig, 2001; http://projects.nri.org/rnfe/; http://www.fao.org/economic/riga/riga-publications/riga-publications/en/.
2 Wage employment in agriculture is generally considered to be part of “off-farm” income (income earned by a household other than from its own farm), but not part of “non-farm” income (income earned other than from agricultural activity).
3 Such a classification, divided between primary processing, manufacturing and services, is provided in Annex III table A2.
4 This is based on the criteria laid out in World Bank (2007). Subsistence-oriented and market-oriented smallholder households are defined as those deriving more than 75 per cent of total income from agriculture, and subdivided between subsistence-oriented and market-oriented according to whether the majority of their output is consumed or sold. Labour-oriented households are defined as those deriving more than 75 per cent of total income from wage or non-farm self-employment; migration-oriented households as those receiving more than 75 per cent of total income from transfers and other non-labour sources; and diversified households as those who do not derive more than 75 per cent of total income from any one of these sources.
5 Estimated on the basis of data from the Rural Income Generating Activities Project (RIGA).
6 Labour Force Surveys and Living Standard Measurement Study surveys. Country selection is based on data availability.
7 While the figure for the finance, insurance and real estate sector in Nepal is zero, as mentioned in the notes to table 3.5, the sample comprises a single individual.
8 The sample consists of data from years between 1986 and 2006 for four LDCs (Ethiopia, 1998; Malawi, 2002; Mozambique, 1986; and Zambia, 2003) and four ODCs (Cameroon, 1992; Côte d’Ivoire, 1996; Namibia, 1996; and South Africa, 1996). Population-weighted figures are also given in the original table. However, while they give a slightly greater weight to LDCs (59 per cent compared with 50 per cent in the unweighted figures), they also skew the result strongly towards Ethiopia, which accounts for 63 per cent of the population of the LDCs included (based on census year populations).
9 Agriculture-based countries are defined as those in which agriculture accounts for at least 32 per cent of GDP growth, largely reflecting a substantial share in total GDP, and at least 70 per cent of the poor are in rural areas. Transforming countries are those with a smaller share of agriculture in economic growth, but where poverty remains overwhelmingly rural (World Bank, 2008).
10 Migrant income and sales of livestock and surplus agricultural produce can play a similar role for those households who have these advantages.
11 http://www.iso.org/iso/home/standards/management-standards/iso22000.htm.12 African exports to markets outside the continent face an average protection rate of 2.5
per cent, largely as a result of preferences under the Generalized System of Preferences, the European Union’s Everything But Arms initiative and the United States’ African Growth and Opportunity Act, compared with 8.7 per cent for intraregional exports (UNCTAD, 2013a).
13 Based on multipliers calculated for rural regions (Burkina Faso, Niger, Senegal, Sierra Leone and Zambia) and national studies estimating rural and urban effects separately (Gambia and Madagascar).
14 While most labour-intensive public works programmes in LDCs are introduced and designed by donors and funded either through donor grants or loans, some independently developed and domestically funded programmes are still in operation, such as the Karnali Employment Programme in Nepal (UNCTAD, 2013b).
15 Uganda - National Household Survey 2012-2013, available from http://catalog.ihsn.org/index.php/catalog/4620.
The Least Developed Countries Report 2015106
References
Abdulai A and A Crole-Rees (2001). Determinants of Income Diversification amongst Rural Households in Southern Mali. Food Policy. 26 (2001): 437–452.
AfDB, OECD, and UNDP (2014). African Economic Outlook 2014: Global Value Chains and Africa’s Industrialisation.
Ahmed R and M Hossain (1990). Development Impact of Rural Infrastructure in Bangladesh. International Food Policy Research Institute. Washington, D.C.
Anderson D and M Leiserson (1978). Rural Enterprise and Non-farm Employment. World Bank. Washington, D.C.
André C and J-P Platteau (1998). Land Relations under Unbearable Stress: Rwanda Caught in the Malthusian Trap. Journal of Economic Behavior and Organization. 34(1): 1–47.
Balihuta AM and K Sen (2001). Macroeconomic Policies and Rural Livelihood Diversification: An Ugandan Case-study. Ladder Working Paper 3. DFID. London.
Barrett CB, M Clark, D Clay and T Reardon (2005). Heterogeneous Constraints,Incentives, and Income Diversification Strategies in Rural Africa. Quarterly Journal of Agricultural Economics. 44(1): 37–60.
Barrett CB, T Reardon and P Webb (2001). Nonfarm Income Diversification and Household Livelihood Strategies in Rural Africa: concepts, dynamics, and policy implications. Food Policy. 26: 315–331.
Bennett MK (1954). The World’s Food. Harper. New York.Berdegué JA and FJ Proctor (2014). Inclusive Rural-Urban Linkages. Document 123.
Working Group: Development with Territorial Cohesion. RIMISP. Santiago.Boughton D, B Teme, O Sanogo, J Staatz, T Reardon and E Crawford (1995). Development
Strategies for Maize in Mali: Using a Commodity Subsector Perspective to Increase the Impact of Agricultural Research and Development. Département Planification Agricole et Economie Rurale, Institut d’Economie Rurale. Bamako.
Canagarajah S, C Newman and R Bhattamishra (2001). Nonfarm Income, Gender and Inequality: Evidence from rural Ghana and Uganda. Food Policy. 26: 405-420.
Cannon T and D Smith (2002). Rural Non-Farm Economy Project. Uganda Fieldwork Case Study Synthesis Report. NRI Report 2701. Natural Resources Institute, University of Greenwich. London.
Castillo M and MC Sodergren (2015). Statistical Activities of the ACI on Decent Work in the Rural Economy. PowerPoint presentation to the meeting on LDCR 2015. Geneva. 3 July.
Christensen G (1989). Determinants of Private Investment in Rural Burkina Faso. Dissertation. Cornell University. Ithaca, NY.
Christiaensen L, J Weerdt and Y Todo (2013). Urbanization and Poverty Reduction: The Role of Rural Diversification and Secondary Towns. Agricultural Economics. 44 (4-5): 435–447.
CSEND, ILO and ICA (2015). Promoting Cooperative-to-Cooperative Trade for Sustainable Development. Joint statement made by the ILO on behalf of the CSEND-ILO-ICA group to the Fifth Global Review of Aid for Trade: Reducing Trade Costs for Inclusive, Sustainable Growth. Geneva. 2 July.
Dabalen A, S Paternostro and G Pierre (2004). The Returns to Participation in the Nonfarm Sector in Rural Rwanda. World Bank Policy Research Working Paper 3462. World Bank. Washington, D.C
Davis B, S DiGiuseppe and A Zezza (2014). Income Diversification Patterns in Rural Sub-Saharan Africa: Reassessing the evidence. World Bank Policy Research Working Paper 7108. World Bank, Washington, D.C.
de Haan A (1999). Livelihoods and Poverty: the Role of Migration. A Critical Review of the Migration Literature. Journal of Development Studies. 36(2): 1–47.
de Haan A and B Rogaly, eds. (2002). Labour Mobility and Rural Society. Frank Cass. London.
Deichmann U, F Shilpi and R Vakis (2009). Urban Proximity, Agricultural Potential and Rural Non-farm Employment: Evidence from Bangladesh. World Development. 37(3): 645–660. March.
Deininger K, S Jin, B Adenw, S Gebre-Selassie and M Demeke (2003). Market and Non-market Transfers of Land in Ethiopia: Implications for Efficiency, Equity and Non-farm Development. World Bank Policy Research Working Paper 2992. World Bank. Washington, D.C.
Dimova RD and K Sen (2010). Is Household Income Diversification a Means of Survival or a Means of Accumulation? Panel Data Evidence from Tanzania. BWPI Working Paper 122. University of Manchester. Brooks World Poverty Institute. Manchester.
107CHAPTER 3. Economic Diversification, Non-Farm Activities and Rural Transformation
Dolislager MD, D Tschirley and T Reardon (2015). Consumption Patterns in Eastern and Southern Africa. Report to USAID by Michigan State University, Innovation Lab for Food Security Policy. East Lansing, MI. May.
Duvendack M, R Palmer-Jones, J Copestake, L Hooper, Y Loke and N Rao (2011). What is the Evidence of the Impact of Microfinance on the Well-Being of Poor People? EPPI-Centre, University of London. London.
Egyei RK, P Harrison and Y Adzovor (2013). Household Non-Farm Income: Any Influence on Agricultural Productivity in Rural Ghana? Developing Country Studies. 3(9).
Ellis F (1999). Non-farm Employment in Tanzania: A Partial Case Study. Natural Resources Institute. Chatham, UK.
Ellis F (2000). Rural Livelihoods and Diversity in Developing Countries. Oxford University Press. Oxford.
Ellis F (2005). Small-Farms, Livelihood Diversification and Rural-Urban Transitions: Strategic Issues in Sub-Saharan Africa. Paper prepared for the Research Workshop on The Future of Small Farms. Wye, Kent. 26–29 June.
Ellis F and S Biggs (2001). Evolving Themes in Rural Development 1950s–2000s. Development Policy Review. 19(4): 437–448.
Ellis F and HA Freeman (2004). Rural Livelihoods and Poverty Reduction Strategies in Four African Countries. Journal of Development Studies. 40(4): 1–30.
Fafchamps M and F Shilpi (2003). The Spatial Division of Labour in Nepal. Journal of Development Studies. 39(6): 23–66.
Fafchamps M and F Shilpi (2005). Cities and Specialisation: Evidence from South Asia. Economic Journal of the Royal Economic Society. 115(503): 477–504.
FAO (1998). The State of Food and Agriculture. Rural Non-farm Income in Developing Countries. Food and Agriculture Organization of the United Nations. Rome.
FiBL and IFOAM (2015). The World of Organic Agriculture: Statistics and Emerging Trends 2015. Research Institute of Organic Agriculture (FiBL) and International Federation of Organic Agriculture Movements (IFOAM). Available from http://orgprints.org/28216/.
Francis E and J Hoddinott (1993). Migration and Differentiation in Western Kenya: A Tale of Two Sub-locations. Journal of Development Studies. 30(1): 115–145.
Glewwe P (1999). The Economics of School Quality Investments in Developing Countries: an Empirical Study of Ghana. St. Martin’s Press. New York.
Gordon A and C Craig (2001). Rural Non-farm Activities and Poverty Alleviation in Sub-Saharan Africa. Policy Series 14. Natural Resources Institute. University of Greenwich. Greenwich, UK.
Haggblade S (2007). Alternative Perceptions of the Rural Nonfarm Economy. In: Haggblade S et al., eds. Transforming the Rural Nonfarm Economy: Opportunities and Threats in the Developing World. Johns Hopkins University Press. Baltimore: 25–54.
Haggblade S, P Hazell and P Dorosh (2007). Sectoral growth linkages between agriculture and the rural nonfarm economy. In: Haggblade S et al., eds. Transforming the Rural Nonfarm Economy: Opportunities and Threats in the Developing World. Johns Hopkins University Press. Baltimore: 141–182.
Haggblade S, P Hazell and T Reardon, eds. (2007). Transforming the Rural Nonfarm Economy: Opportunities and Threats in the Developing World. Johns Hopkins University Press. Baltimore.
Haggblade S, P Hazell and T Reardon (2010). The Rural Non-farm Economy: Prospects for Growth and Poverty Reduction. World Development. 38(10): 1429–1441. October.
Hazell P, S Haggblade and T Reardon (2007). Structural Transformation of the Rural Nonfarm Economy. In: Haggblade S et al., eds. Transforming the Rural Nonfarm Economy: Opportunities and Threats in the Developing World. Johns Hopkins University Press. Baltimore: 83–98.
Hoffman B and F Heidhues (1993). Credit Access in the Informal Sector: A Case Study of Two Villages in the Province Oueme in Benin. In: Cuevas CE and M Benoit-Cattin, eds. Finance and Rural Development in West Africa. Proceedings of the 12th Rural Economy Seminar, Ouagadougou, October 21-25, 1991. Centre de Coopération Internationale en Recherche Agronomique pour le Développement. Montpellier: 271–277.
Holden S, B Shiferaw and J Pender (2004). Non-farm Income, Household Welfare, and Sustainable Land Management in a Less-Favoured Area in the Ethiopian Highlands. Food Policy. 29: 369–392.
Hollinger F and J Staatz (2015). Agricultural Growth in West Africa: Market and Policy Drivers. FAO. Rome.
Hopkins J and T Reardon (1993). Agricultural Price Policy Reform Impacts and Food Aid Targeting in Niger. Final report of the IPFRI/INRAN project. Mimeo, International Food Policy Research Institute. Washington, D.C.

The Least Developed Countries Report 2015108
Hossain M (2004). Rural Non-Farm Economy Evidence from Household Surveys. Economic and Political Weekly. 4 September.
Hymer S and S Resnick (1969). A Model of an agrarian economy with nonagricultural activities. American Economic Review. 59(4): 493–506. September.
ILO (2011). Cooperatives for People-Centred Rural Development. Rural Policy Briefs. Geneva.ILO (2014). Challenges and opportunities for infrastructure investment in LICs. Draft Note.
Development and Investment Branch, Employment Policy Department. Geneva. April.ILO, FAO and IFAD (2010). Women in infrastructure works: Boosting gender equality and
rural development! Gender and Rural Employment Policy Brief 5. Geneva.ILO, OECD, World Bank and IMF (2015). Strengthening the link between growth and
employment. Second report. Report prepared for the G20 Employment and Working Group. Istanbul. 7–8 March.
Jacoby HC (2000). Access to Markets and the Benefits of Rural Roads. Economic Journal of the Royal Economic Society. 110(465): 713–37. July.
Jolliffe D (1998). Skills, Schooling, and Household Income in Ghana. The World Bank Economic Review. 12(1): 81–104.
Kayastha P, GP Rauniyar and W J Parker (1999). Determinants of off-farm employment in eastern rural Nepal. 1999 Conference (43rd), 20–22 January. No. 123825. Australian Agricultural and Resource Economics Society. Christchurch.
Kelly V, T Reardon, A Fall, B Diagana and L McNeilly (1993). Final report for the IFPRI/ISRA study of consumption and supply impacts of agricultural price policies in the Groundnut Basin and Senegal Oriental. International Food Policy Research Institute. Washington, D.C.
Kibe EN and K Wanjau (2014). The Effect of Quality Management Systems on the Performance of Food Processing Firms in Kenya. IOSR Journal of Business and Management. 16(5): 61–72. May.
Kingombe CKM (2011). An Enquiry into the Causes and Nature of the Transmission Mechanisms between Labour-Based Rural Roads, Sustainable Growth, and Agricultural Trade in Zambia’s Eastern Province. PhD Thesis. University of London. London.
Lanjouw J and P Lanjouw (2001). The Rural Nonfarm Sector: Issues and Evidence from Developing Countries. Agricultural Economics. 26: 1–23.
Lanjouw P (2007). Does the Rural Nonfarm Economy Contribute to Poverty Reduction? In: Haggblade S et al., eds. Transforming the Rural Nonfarm Economy: Opportunities and Threats in the Developing World. Johns Hopkins University Press. Baltimore: 55–79.
Lanjouw P and G Feder (2001). Rural non-farm activities and rural development: From experience towards strategy. Rural Strategy Background Paper 4. World Bank. Washington, D.C.
Lanjouw P, J Quizon and R Sparrow (2001). Non-agricultural earnings in peri-urban areas of Tanzania: evidence from household survey data. Food Policy. 26(4): 385–403. August.
Lipton M (1980). Migration from rural areas of poor countries: The impact on rural productivity and income distribution. World Development. 8(1): 1–24. January.
Losch B, S Fréguin-Gresh and ET White (2012). Structural Transformation and Rural Change Revisited: Challenges for Late Developing Countries in a Globalizing World. African Development Forum series. World Bank. Washington, D.C.
Matlon PJ and AA Adesina (1997). Agricultural growth and sustainability: Prospects for semi-arid West Africa. In: Vosti SA and T Reardon, eds. Sustainability, Growth, and Poverty Alleviation: A Policy and Agroecological Perspective. Johns Hopkins University Press. Baltimore: 229–245.
Matsumoto T, Y Kijima and T Yamano (2006). The role of local nonfarm activities and migration in reducing poverty: Evidence from Ethiopia, Kenya and Uganda. Agricultural Economics. 35(s3): 449–458. November.
Nargis N and M Hossain (2006). Income dynamics and pathways out of rural poverty in Bangladesh, 1988-2004. Agricultural Economics. 35: 425–435.
Otsuka K (2007). The Rural Industrial Transition in East Asia: Influences and Implications. In: Haggblade S et al., eds. Transforming the Rural Nonfarm Economy: Opportunities and Threats in the Developing World. Johns Hopkins University Press. Baltimore: 216–233.
Paul H and R Steinbrecher (2013). African agricultural growth corridors and the New Alliance for Food Security and Nutrition: Who benefits, who loses? EcoNexus. Available from www.econexus.com, June.
Peters PE (1992). Monitoring the effects of grain market liberalization on the income, food security and nutrition of rural households in Zomba South, Malawi. Mimeo. Harvard Institute for International Development. Cambridge, MA.
109CHAPTER 3. Economic Diversification, Non-Farm Activities and Rural Transformation
Qaim M and E Rao (2012). The Supermarket Revolution and Smallholder Farmers. Rural 21. 48(4). Available from www.rural21.com/english/news/detail/article/the-supermarket-revolution-and-smallholder-farmers-0000537/.
Reardon T (1997). Using Evidence of Household Income Diversification to Inform Study of the Rural Nonfarm Labour Market in Africa. World Development. 25(5): 735–747.
Reardon T, J Berdegué and G Escobar (2001). Rural Nonfarm Employment and Incomes in Latin America: Overview and Policy Implications. World Development. 29(3): 549–560.
Reardon T, J Berdegué, C Barrett and K Stamolous (2007). Household Income Diversification into Rural Nonfarm Activities. In: Haggblade S et al., eds. Transforming the Rural Nonfarm Economy: Opportunities and Threats in the Developing World. Johns Hopkins University Press. Baltimore: 115–140.
Reardon T, E Crawford and V Kelly (1994). Links between Nonfarm Income and Farm Investment in African Households: Adding the Capital Market Perspective. American Journal of Agricultural Economics. 76(5): 1172–1176.
Reardon T, C Hu, D Tschirley, M Dolislager and J Snyder (2015). Urbanization, Diet Change, and Transformation of Food Supply Chains in Asia. Report for USAID Michigan State University Project of the Global Center for Food System Innovation and the Food Security Policy Innovation Lab. East Lansing, MI. May.
Reardon T and V Kelly (1989). Impact of Liquidity Sources on Chemical Fertilizer Use in Semi-Arid West Africa. Select Paper, AAEA 1989 Meetings. Abstract. American Journal of Agricultural Economics. December.
Reardon T, P Matlon and C Delgado (1988). Coping with household-level food insecurity in drought-affected areas of Burkina Faso. World Development. 16(9): 1065–1074. September.
Reardon, T and M Mercado-Peters (1993). Self-financing of rural household cash expenditures in Burkina Faso: The case of net cereal buyers. In: Cuevas CE and M Benoit-Cattin, eds. Finance and Rural Development in West Africa. Proceedings of the 12th Rural Economy Seminar, Ouagadougou, October 21-25, 1991. Centre de Coopération Internationale en Recherche Agronomique pour le Développement. Montpellier: 31–46.
Reardon T, B Minten, KZ Chen and L Adriano (2013). The Transformation of Rice Value Chains in Bangladesh and India: Implications for Food Security. ADB Economics Working Paper Series 375. Manila. Asian Development Bank.
Reardon T and JE Taylor (1996). Agroclimatic Shock, Income Inequality, and Poverty: Evidence from Burkina Faso. World Development. 24(5): 901–914. May.
Ruben R and J Pender (2004). Rural diversity and heterogeneity in less-favoured areas: The quest for policy targeting. Food Policy. 29(4): 303–320. August.
Ruben R and M van den Berg (2001). Nonfarm Employment and Poverty Alleviation of Rural Farm Households in Honduras. World Development. 29(3): 549–560. March.
Saner R and R Guilherme (2006). ISO 22000’s potential impact on world trade in agricultural products. ISO Management Systems. Geneva. March–April.
Savadogo K, T Reardon and K Pietola. (1995). Mechanization and Agricultural Supply Response in the Sahel: A Farm-Level Profit Function Analysis. Journal of African Economies. 4(3): 336–377. December.
Stewart R, C van Rooyen, K Dickson, M Majoro and T de Wet (2010). What is the Impact of Microfinance on Poor People? Evidence from Sub-Saharan Africa. Technical Report. EPPI-Centre, University of London. London.
Tacoli C (2003). The links between urban and rural development. Editorial. Environment and Urbanization. 15(1). April.
Taylor JE (1999). The new economics of labour migration and the role of remittances in the development process. International Migration. 37(1): 63–88.
Teklu T, J Braun J and E Zaki (1991). Drought and Famine Relationship in Sudan: Policy Implications. Research Report 88. International Food Policy Research Institute. Washington, D.C.
Tschirley DL and MT Weber (1994). Food security strategies under extremely adverse conditions: The determinants of household income and consumption in rural Mozambique. World Development. 22(2): 159–173.
UNCTAD (2007). The Least Developed Countries Report 2007: Knowledge, Technological Learning and Innovation for Development. United Nations publication. Sales No. E.07.II.D.8. New York and Geneva.
UNCTAD (2013a). Economic Development in Africa Report 2013: Intra-African Trade: Unlocking Private Sector Dynamism. United Nations publication. Sales No. E.13.II.D.2. New York and Geneva.
The Least Developed Countries Report 2015110
UNCTAD (2013b). The Least Developed Countries Report 2013: Growth with employment for inclusive and sustainable development. United Nations publication. Sales No. E.13.II.D.1. New York and Geneva.
UNCTAD (2014). The Least Developed Countries Report 2014: Growth with structural transformation: A post-2015 development agenda. United Nations publication. Sales No. E.14.II.D.7. New York and Geneva.
Webb P and J von Braun (1994). Famine and food security in Ethiopia: Lessons for Africa. John Wiley and Sons. Chichester, UK.
Wiens T and C Sobrado (1998). Haiti: The challenges of poverty reduction, Vol.2, Technical Papers. World Bank. Washington, D.C.
Wiggins S (2014). Rural non-farm economy: current understanding, policy options, and future possibilities. In: Hazell P and A Rahman, eds. New Directions for Smallholder Agriculture. International Fund for Agricultural Development. Oxford University Press. Oxford: 482–526.
Winters P, G Carletto, B Davis, K Stamoulis and A Zezza (2006). Rural income generating activities in developing countries: A multi-country analysis. Paper presented at the FAO conference on Beyond Agriculture? The Promise of the Rural Non-Farm Economy for Growth and Poverty Reduction. Rome. 16–18 January.
Winters P, B Davis, G Carletto, K Covarrubia, EJ Quiñones, A Zezza, C Azzarri and K Stamoulis (2009). Assets, Activities and Rural Income Generation: Evidence from a Multicountry Analysis. World Development. 37(9): 1435–1452.
World Bank (2004). Bangladesh Promoting the Rural Non-Farm Sector in Bangladesh (in Two Volumes). Volume II: Main Report. October 7, 2004. Report 29719-BD. Washington, D.C.
World Bank (2007). World Development Report 2008: Agriculture for Development. World Bank. Washington, D.C.
Wouterse F and JE Taylor (2008). Migration and Income Diversification: Evidence from Burkina Faso. World Development. 36(4): 625–640. April.
Yamauchi F (2004). Are experience and schooling complementary? Evidence from migrants’ assimilation in the Bangkok labour market. Journal of Development Economics. 74(2): 489–513. August.
Yumkella K, P Kormawa, T Roepstorff and A Hawkins, eds. (2011). Agribusiness for Africa’s Prosperity. United Nations Industrial Development Organization. Vienna.

111CHAPTER 3. Economic Diversification, Non-Farm Activities and Rural Transformation
Annex table 3.1. Proportion of rural households deriving incomes from different sources, selected LDCs(Per cent)
Year
Agriculture RNFE
Transfers OtherAll
non-agricultureCrops
Live- stock
Employ-ment
AllEmploy-
mentSelf-
employmentAll
African LDCs
Ethiopia 2012 87 80 24 89 6 19 24 22 19 47
Madagascar 1993 93 78 26 96 18 21 36 43 11 67
Malawi2004 96 65 55 98 16 30 42 89 7 93
2011 93 48 49 97 13 16 28 66 11 79
Niger 2010/11 96 77 11 98 8 60 65 58 0 84
United Rep. of Tanzania 2009 88 65 20 99 16 38 43 43 2 77
Uganda2005/06 88 65 20 92 16 38 49 43 2 72
2009/10 89 67 23 92 25 43 56 32 24 77
Asian LDCs
Bangladesh2000 82 39 35 87 32 26 53 49 55 91
2005 85 73 29 93 35 22 53 42 59 90
Nepal1996 93 82 42 98 35 20 50 26 8 69
2003 93 86 38 98 36 21 52 38 27 82
Source: Davis (2014), table 2, p.8.
Annex table 3.2. Proportion of rural household income by source, selected LDCs(Per cent)
Year Agriculture RNFE
Transfers OtherAll
non-agricultureCrops
Live- stock
Employ- ment
AllEmploy-
mentSelf-
employmentAll
African LDCs
Ethiopia 2012 73 11 4 88 2 4 6 3 3 12
Madagascar 1993 57 13 6 77 6 8 15 6 2 23
Malawi2004 56 9 11 77 7 9 16 6 0 23
2011 59 6 15 80 8 6 13 6 0 20
Niger 2010/11 48 9 3 60 4 26 30 10 0 40
United Rep. of Tanzania 2009 53 13 4 70 7 13 19 10 0 30
Uganda2005/06 47 7 11 65 10 16 26 9 0 35
2009/10 48 11 8 66 12 16 28 6 0 34
Asian LDCs
Bangladesh2000 15 1 20 37 20 16 36 13 13 63
2005 18 9 16 43 22 13 36 9 12 57
Nepal1996 32 14 18 64 17 9 26 10 1 36
2003 20 18 13 51 21 9 30 17 2 49
Source: Davis (2014), table 3, p.9.


CHAPTER4gendeR-based patteRns
and constRaints in RuRal development
The Least Developed Countries Report 2015114
A. Introduction
As noted in Chapter 1, women make up around half of the agricultural labour force of the least developed countries (LDCs), a proportion that has increased progressively over time in all three geographical subgroups. Rural women play a pivotal role in ensuring household food security and nutrition, particularly through cultivation of home gardens, and can increase production and food security through improved agroecological practices and crop diversification. They can also be important agents of rural economic diversification, and key players in vibrant micro-entrepreneurial activities such as artisanal agroprocessing, which have significant potential to be developed into viable enterprises. Their economic and social empowerment also yields critical intergenerational benefits, helping to make the next generation better fed, healthier and better educated, and thus better equipped to contribute to the economy and society (FAO, 2011; World Bank and ONE, 2014).
However, rural women in LDCs continue to face multiple constraints on their access to land, credit, agricultural inputs, extension services, labour, markets and education. Together, these constraints hinder women’s ability to engage productively in both farm and non-farm activities, and impede their development of commercial agricultural production. This pattern is reinforced by time and mobility constraints arising from sociocultural gender-based norms that impose a double burden in terms of unpaid care work and productive activities. It is also reinforced by gender segregation in the labour market, which confines women largely to relatively low-income activities, and by intra-household decision-making dynamics that limit their control over household income and their influence on spending priorities.
The problems of data availability, quality and interpretation that pervade rural development (as discussed in Chapter 3) arise even more starkly in the context of the gender dimensions of rural development, particularly as some gender biases are ingrained in the data. Such biases are especially evident in gender-disaggregated household-level data based on “male-headed” and “female-headed” households.
Since the household head is often assumed to be the oldest man in the household, irrespective of the role of women, households considered to be female-headed are generally those headed by unmarried, widowed or divorced women. Thus, observed differences partly reflect the social and economic challenges associated with single parenthood, and not only gender differences as such (UNCTAD, 2014; UNECE and World Bank Institute, 2010). Equally, differences between male- and female-headed households represent only one aspect of gender in rural communities: The position of female members within households (regardless of headship) raises significantly different issues, and affects much more of the female population.
In light of the limited availability of reliable and consistent data, this chapter draws primarily on data (including individual-level data wherever possible) for individual LDCs to illustrate general patterns. However, it is important to emphasize that gender roles in agriculture (and gender norms more broadly) are highly context-specific. The scope for generalization or wider extrapolation of patterns from a small number of countries is therefore limited, especially among a group of countries as geographically, economically and culturally diverse as LDCs: The country examples provided highlight the diversity of national experiences as much as their commonalities. Particularly in rural areas, gender issues need to be assessed in each specific geographic and cultural context, which vary widely both between and within countries.
Women can be important agents of rural economic diversification, and key players in vibrant micro-
entrepreneurial activities...
... but face multiple constraints on their access to land, credit, agricultural inputs, extension services, labour, markets and
education.
Problems of data availability, quality and interpretation are particularly acute in the context of the gender dimensions of rural development.
Differences between male- and female-headed households partly reflect the social and economic
challenges associated with single parenthood.
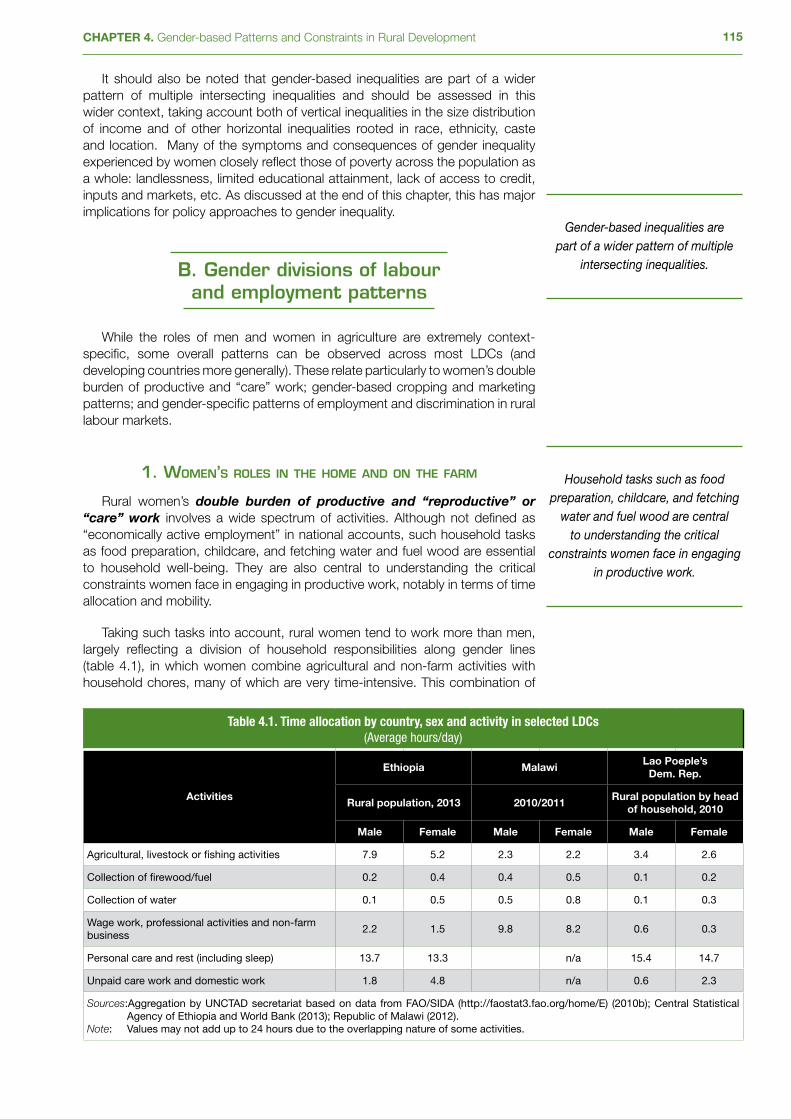
115CHAPTER 4. Gender-based Patterns and Constraints in Rural Development
It should also be noted that gender-based inequalities are part of a wider pattern of multiple intersecting inequalities and should be assessed in this wider context, taking account both of vertical inequalities in the size distribution of income and of other horizontal inequalities rooted in race, ethnicity, caste and location. Many of the symptoms and consequences of gender inequality experienced by women closely reflect those of poverty across the population as a whole: landlessness, limited educational attainment, lack of access to credit, inputs and markets, etc. As discussed at the end of this chapter, this has major implications for policy approaches to gender inequality.
B. Gender divisions of labour and employment patterns
While the roles of men and women in agriculture are extremely context-specific, some overall patterns can be observed across most LDCs (and developing countries more generally). These relate particularly to women’s double burden of productive and “care” work; gender-based cropping and marketing patterns; and gender-specific patterns of employment and discrimination in rural labour markets.
1. women’s roles in the home and on the farm
Rural women’s double burden of productive and “reproductive” or “care” work involves a wide spectrum of activities. Although not defined as “economically active employment” in national accounts, such household tasks as food preparation, childcare, and fetching water and fuel wood are essential to household well-being. They are also central to understanding the critical constraints women face in engaging in productive work, notably in terms of time allocation and mobility.
Taking such tasks into account, rural women tend to work more than men, largely reflecting a division of household responsibilities along gender lines (table 4.1), in which women combine agricultural and non-farm activities with household chores, many of which are very time-intensive. This combination of
Table 4.1. Time allocation by country, sex and activity in selected LDCs(Average hours/day)
Activities
Ethiopia MalawiLao Poeple’s
Dem. Rep.
Rural population, 2013 2010/2011Rural population by head
of household, 2010
Male Female Male Female Male Female
Agricultural, livestock or fishing activities 7.9 5.2 2.3 2.2 3.4 2.6
Collection of firewood/fuel 0.2 0.4 0.4 0.5 0.1 0.2
Collection of water 0.1 0.5 0.5 0.8 0.1 0.3
Wage work, professional activities and non-farm business
2.2 1.5 9.8 8.2 0.6 0.3
Personal care and rest (including sleep) 13.7 13.3 n/a 15.4 14.7
Unpaid care work and domestic work 1.8 4.8 n/a 0.6 2.3
Sources: Aggregation by UNCTAD secretariat based on data from FAO/SIDA (http://faostat3.fao.org/home/E) (2010b); Central Statistical Agency of Ethiopia and World Bank (2013); Republic of Malawi (2012).
Note: Values may not add up to 24 hours due to the overlapping nature of some activities.
Gender-based inequalities are part of a wider pattern of multiple
intersecting inequalities.
Household tasks such as food preparation, childcare, and fetching
water and fuel wood are central to understanding the critical
constraints women face in engaging in productive work.
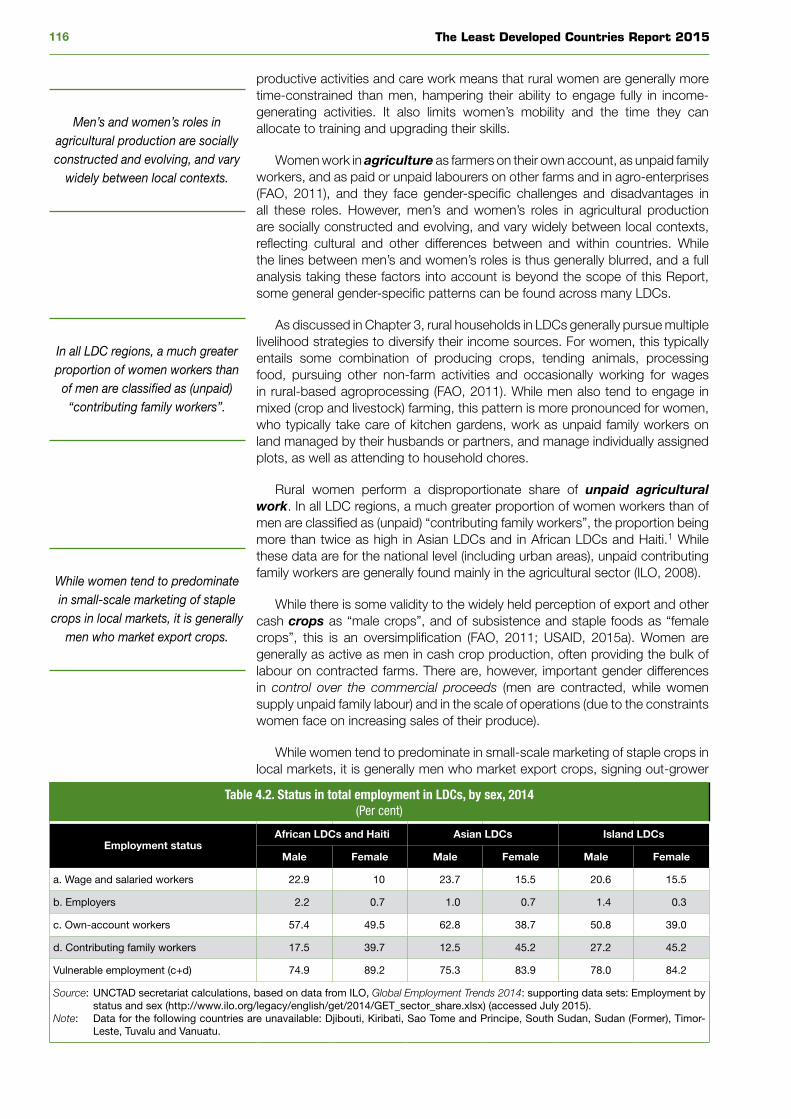
The Least Developed Countries Report 2015116
productive activities and care work means that rural women are generally more time-constrained than men, hampering their ability to engage fully in income-generating activities. It also limits women’s mobility and the time they can allocate to training and upgrading their skills.
Women work in agriculture as farmers on their own account, as unpaid family workers, and as paid or unpaid labourers on other farms and in agro-enterprises (FAO, 2011), and they face gender-specific challenges and disadvantages in all these roles. However, men’s and women’s roles in agricultural production are socially constructed and evolving, and vary widely between local contexts, reflecting cultural and other differences between and within countries. While the lines between men’s and women’s roles is thus generally blurred, and a full analysis taking these factors into account is beyond the scope of this Report, some general gender-specific patterns can be found across many LDCs.
As discussed in Chapter 3, rural households in LDCs generally pursue multiple livelihood strategies to diversify their income sources. For women, this typically entails some combination of producing crops, tending animals, processing food, pursuing other non-farm activities and occasionally working for wages in rural-based agroprocessing (FAO, 2011). While men also tend to engage in mixed (crop and livestock) farming, this pattern is more pronounced for women, who typically take care of kitchen gardens, work as unpaid family workers on land managed by their husbands or partners, and manage individually assigned plots, as well as attending to household chores.
Rural women perform a disproportionate share of unpaid agricultural work. In all LDC regions, a much greater proportion of women workers than of men are classified as (unpaid) “contributing family workers”, the proportion being more than twice as high in Asian LDCs and in African LDCs and Haiti.1 While these data are for the national level (including urban areas), unpaid contributing family workers are generally found mainly in the agricultural sector (ILO, 2008).
While there is some validity to the widely held perception of export and other cash crops as “male crops”, and of subsistence and staple foods as “female crops”, this is an oversimplification (FAO, 2011; USAID, 2015a). Women are generally as active as men in cash crop production, often providing the bulk of labour on contracted farms. There are, however, important gender differences in control over the commercial proceeds (men are contracted, while women supply unpaid family labour) and in the scale of operations (due to the constraints women face on increasing sales of their produce).
While women tend to predominate in small-scale marketing of staple crops in local markets, it is generally men who market export crops, signing out-grower
Table 4.2. Status in total employment in LDCs, by sex, 2014(Per cent)
Employment statusAfrican LDCs and Haiti Asian LDCs Island LDCs
Male Female Male Female Male Female
a. Wage and salaried workers 22.9 10 23.7 15.5 20.6 15.5
b. Employers 2.2 0.7 1.0 0.7 1.4 0.3
c. Own-account workers 57.4 49.5 62.8 38.7 50.8 39.0
d. Contributing family workers 17.5 39.7 12.5 45.2 27.2 45.2
Vulnerable employment (c+d) 74.9 89.2 75.3 83.9 78.0 84.2
Source: UNCTAD secretariat calculations, based on data from ILO, Global Employment Trends 2014: supporting data sets: Employment by status and sex (http://www.ilo.org/legacy/english/get/2014/GET_sector_share.xlsx) (accessed July 2015).
Note: Data for the following countries are unavailable: Djibouti, Kiribati, Sao Tome and Principe, South Sudan, Sudan (Former), Timor-Leste, Tuvalu and Vanuatu.
Men’s and women’s roles in agricultural production are socially constructed and evolving, and vary
widely between local contexts.
In all LDC regions, a much greater proportion of women workers than of men are classified as (unpaid)
“contributing family workers”.
While women tend to predominate in small-scale marketing of staple
crops in local markets, it is generally men who market export crops.
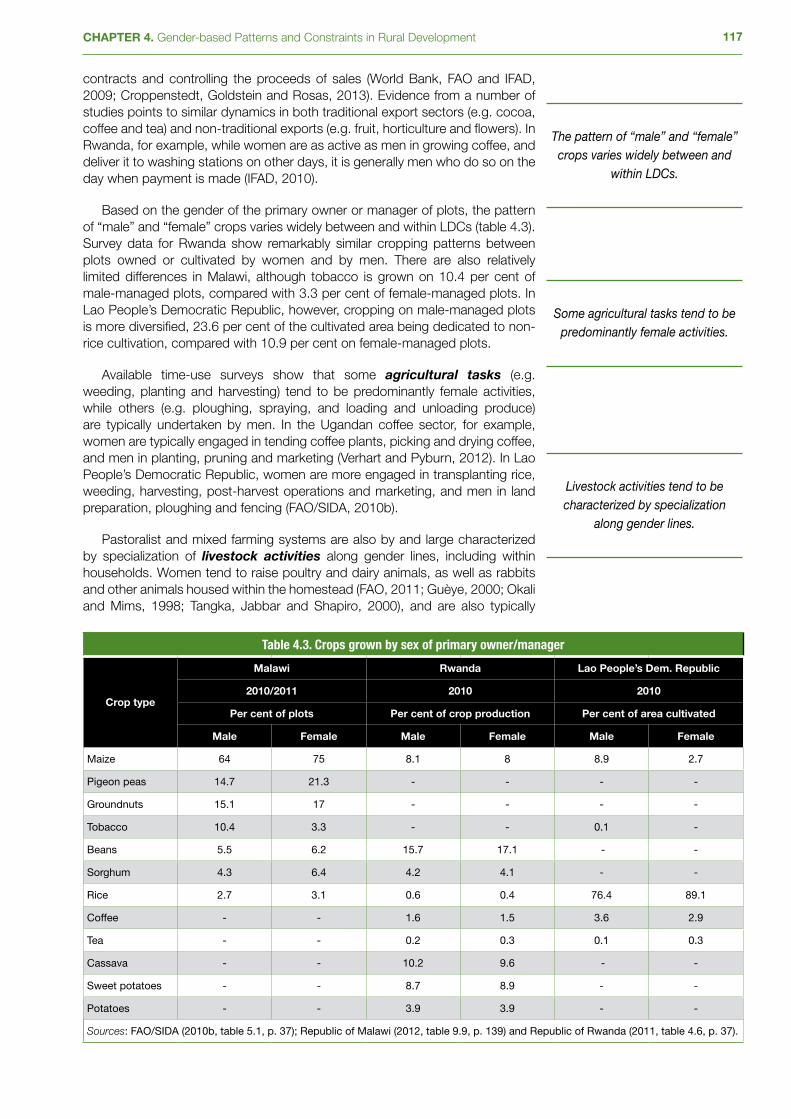
117CHAPTER 4. Gender-based Patterns and Constraints in Rural Development
contracts and controlling the proceeds of sales (World Bank, FAO and IFAD, 2009; Croppenstedt, Goldstein and Rosas, 2013). Evidence from a number of studies points to similar dynamics in both traditional export sectors (e.g. cocoa, coffee and tea) and non-traditional exports (e.g. fruit, horticulture and flowers). In Rwanda, for example, while women are as active as men in growing coffee, and deliver it to washing stations on other days, it is generally men who do so on the day when payment is made (IFAD, 2010).
Based on the gender of the primary owner or manager of plots, the pattern of “male” and “female” crops varies widely between and within LDCs (table 4.3). Survey data for Rwanda show remarkably similar cropping patterns between plots owned or cultivated by women and by men. There are also relatively limited differences in Malawi, although tobacco is grown on 10.4 per cent of male-managed plots, compared with 3.3 per cent of female-managed plots. In Lao People’s Democratic Republic, however, cropping on male-managed plots is more diversified, 23.6 per cent of the cultivated area being dedicated to non-rice cultivation, compared with 10.9 per cent on female-managed plots.
Available time-use surveys show that some agricultural tasks (e.g. weeding, planting and harvesting) tend to be predominantly female activities, while others (e.g. ploughing, spraying, and loading and unloading produce) are typically undertaken by men. In the Ugandan coffee sector, for example, women are typically engaged in tending coffee plants, picking and drying coffee, and men in planting, pruning and marketing (Verhart and Pyburn, 2012). In Lao People’s Democratic Republic, women are more engaged in transplanting rice, weeding, harvesting, post-harvest operations and marketing, and men in land preparation, ploughing and fencing (FAO/SIDA, 2010b).
Pastoralist and mixed farming systems are also by and large characterized by specialization of livestock activities along gender lines, including within households. Women tend to raise poultry and dairy animals, as well as rabbits and other animals housed within the homestead (FAO, 2011; Guèye, 2000; Okali and Mims, 1998; Tangka, Jabbar and Shapiro, 2000), and are also typically
Table 4.3. Crops grown by sex of primary owner/manager
Crop type
Malawi Rwanda Lao People’s Dem. Republic
2010/2011 2010 2010
Per cent of plots Per cent of crop production Per cent of area cultivated
Male Female Male Female Male Female
Maize 64 75 8.1 8 8.9 2.7
Pigeon peas 14.7 21.3 - - - -
Groundnuts 15.1 17 - - - -
Tobacco 10.4 3.3 - - 0.1 -
Beans 5.5 6.2 15.7 17.1 - -
Sorghum 4.3 6.4 4.2 4.1 - -
Rice 2.7 3.1 0.6 0.4 76.4 89.1
Coffee - - 1.6 1.5 3.6 2.9
Tea - - 0.2 0.3 0.1 0.3
Cassava - - 10.2 9.6 - -
Sweet potatoes - - 8.7 8.9 - -
Potatoes - - 3.9 3.9 - -
Sources: FAO/SIDA (2010b, table 5.1, p. 37); Republic of Malawi (2012, table 9.9, p. 139) and Republic of Rwanda (2011, table 4.6, p. 37).
The pattern of “male” and “female” crops varies widely between and
within LDCs.
Some agricultural tasks tend to be predominantly female activities.
Livestock activities tend to be characterized by specialization
along gender lines.
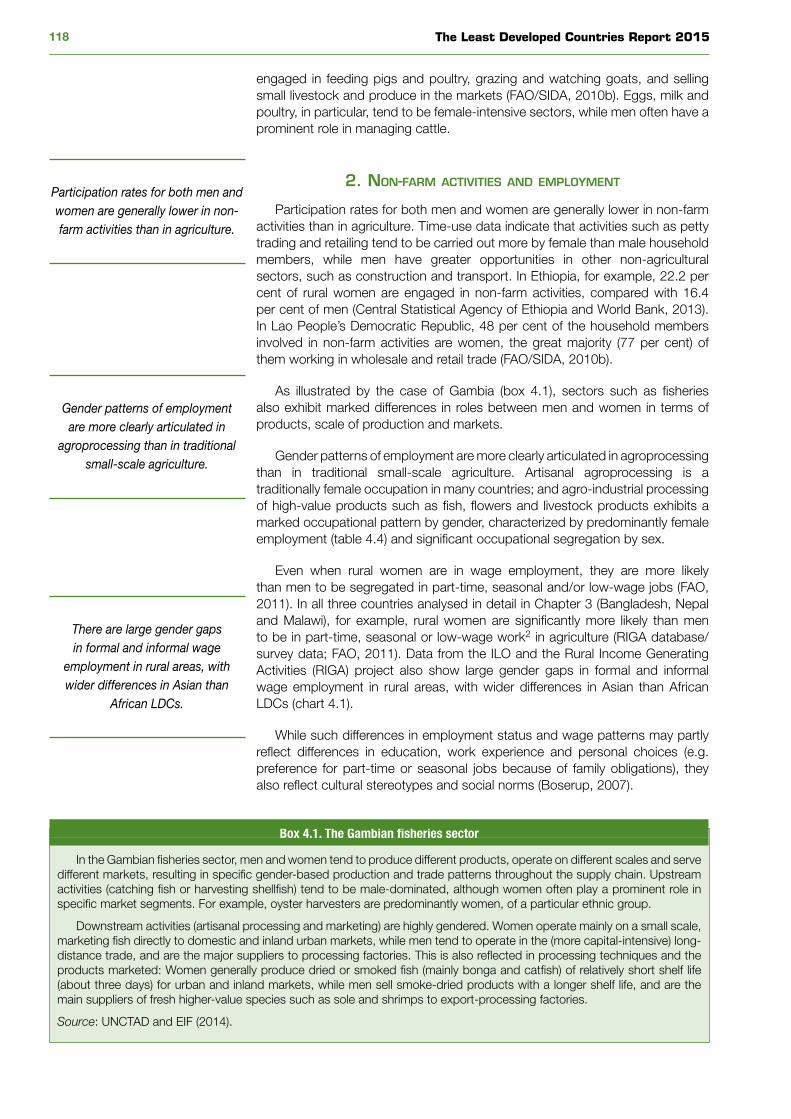
The Least Developed Countries Report 2015118
engaged in feeding pigs and poultry, grazing and watching goats, and selling small livestock and produce in the markets (FAO/SIDA, 2010b). Eggs, milk and poultry, in particular, tend to be female-intensive sectors, while men often have a prominent role in managing cattle.
2. non-farm aCtivities and employment
Participation rates for both men and women are generally lower in non-farm activities than in agriculture. Time-use data indicate that activities such as petty trading and retailing tend to be carried out more by female than male household members, while men have greater opportunities in other non-agricultural sectors, such as construction and transport. In Ethiopia, for example, 22.2 per cent of rural women are engaged in non-farm activities, compared with 16.4 per cent of men (Central Statistical Agency of Ethiopia and World Bank, 2013). In Lao People’s Democratic Republic, 48 per cent of the household members involved in non-farm activities are women, the great majority (77 per cent) of them working in wholesale and retail trade (FAO/SIDA, 2010b).
As illustrated by the case of Gambia (box 4.1), sectors such as fisheries also exhibit marked differences in roles between men and women in terms of products, scale of production and markets.
Gender patterns of employment are more clearly articulated in agroprocessing than in traditional small-scale agriculture. Artisanal agroprocessing is a traditionally female occupation in many countries; and agro-industrial processing of high-value products such as fish, flowers and livestock products exhibits a marked occupational pattern by gender, characterized by predominantly female employment (table 4.4) and significant occupational segregation by sex.
Even when rural women are in wage employment, they are more likely than men to be segregated in part-time, seasonal and/or low-wage jobs (FAO, 2011). In all three countries analysed in detail in Chapter 3 (Bangladesh, Nepal and Malawi), for example, rural women are significantly more likely than men to be in part-time, seasonal or low-wage work2 in agriculture (RIGA database/survey data; FAO, 2011). Data from the ILO and the Rural Income Generating Activities (RIGA) project also show large gender gaps in formal and informal wage employment in rural areas, with wider differences in Asian than African LDCs (chart 4.1).
While such differences in employment status and wage patterns may partly reflect differences in education, work experience and personal choices (e.g. preference for part-time or seasonal jobs because of family obligations), they also reflect cultural stereotypes and social norms (Boserup, 2007).
Box 4.1. The Gambian fisheries sector
In the Gambian fisheries sector, men and women tend to produce different products, operate on different scales and serve different markets, resulting in specific gender-based production and trade patterns throughout the supply chain. Upstream activities (catching fish or harvesting shellfish) tend to be male-dominated, although women often play a prominent role in specific market segments. For example, oyster harvesters are predominantly women, of a particular ethnic group.
Downstream activities (artisanal processing and marketing) are highly gendered. Women operate mainly on a small scale, marketing fish directly to domestic and inland urban markets, while men tend to operate in the (more capital-intensive) long-distance trade, and are the major suppliers to processing factories. This is also reflected in processing techniques and the products marketed: Women generally produce dried or smoked fish (mainly bonga and catfish) of relatively short shelf life (about three days) for urban and inland markets, while men sell smoke-dried products with a longer shelf life, and are the main suppliers of fresh higher-value species such as sole and shrimps to export-processing factories.
Source: UNCTAD and EIF (2014).
There are large gender gaps in formal and informal wage
employment in rural areas, with wider differences in Asian than
African LDCs.
Participation rates for both men and women are generally lower in non-farm activities than in agriculture.
Gender patterns of employment are more clearly articulated in
agroprocessing than in traditional small-scale agriculture.
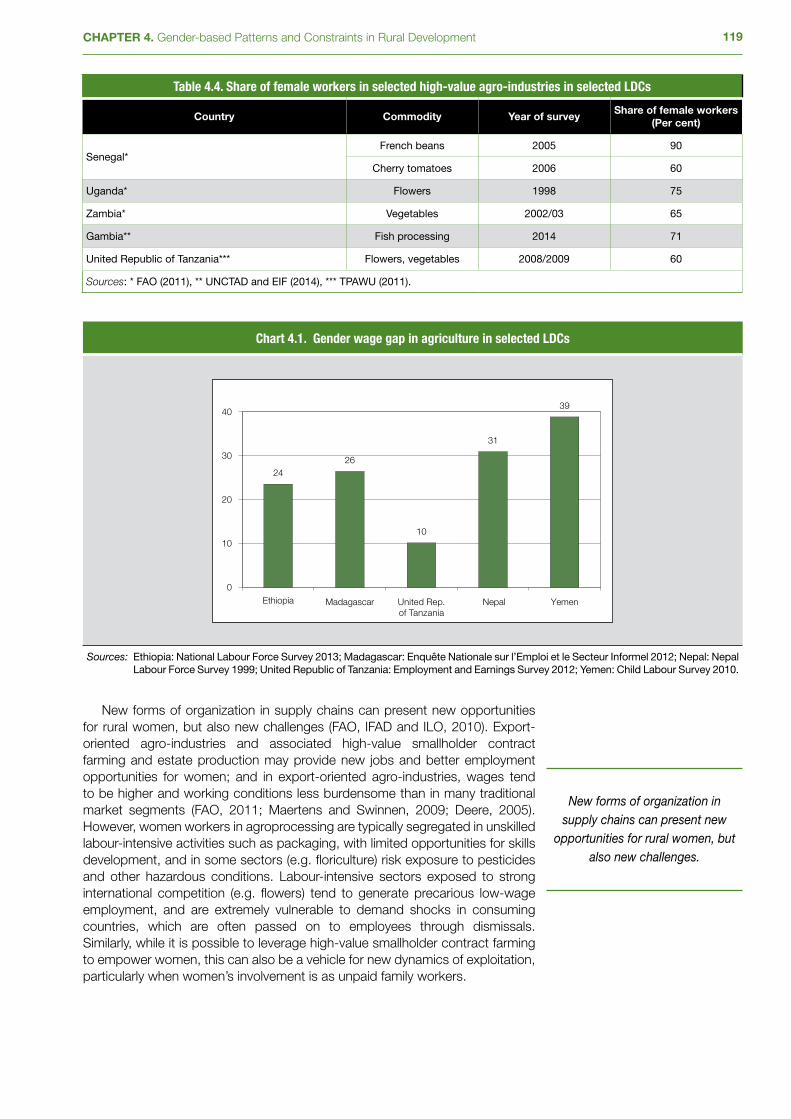
119CHAPTER 4. Gender-based Patterns and Constraints in Rural Development
New forms of organization in supply chains can present new opportunities for rural women, but also new challenges (FAO, IFAD and ILO, 2010). Export-oriented agro-industries and associated high-value smallholder contract farming and estate production may provide new jobs and better employment opportunities for women; and in export-oriented agro-industries, wages tend to be higher and working conditions less burdensome than in many traditional market segments (FAO, 2011; Maertens and Swinnen, 2009; Deere, 2005). However, women workers in agroprocessing are typically segregated in unskilled labour-intensive activities such as packaging, with limited opportunities for skills development, and in some sectors (e.g. floriculture) risk exposure to pesticides and other hazardous conditions. Labour-intensive sectors exposed to strong international competition (e.g. flowers) tend to generate precarious low-wage employment, and are extremely vulnerable to demand shocks in consuming countries, which are often passed on to employees through dismissals. Similarly, while it is possible to leverage high-value smallholder contract farming to empower women, this can also be a vehicle for new dynamics of exploitation, particularly when women’s involvement is as unpaid family workers.
Table 4.4. Share of female workers in selected high-value agro-industries in selected LDCs
Country Commodity Year of surveyShare of female workers
(Per cent)
Senegal*French beans 2005 90
Cherry tomatoes 2006 60
Uganda* Flowers 1998 75
Zambia* Vegetables 2002/03 65
Gambia** Fish processing 2014 71
United Republic of Tanzania*** Flowers, vegetables 2008/2009 60
Sources: * FAO (2011), ** UNCTAD and EIF (2014), *** TPAWU (2011).
Chart 4.1. Gender wage gap in agriculture in selected LDCs
2426
10
31
39
0
10
20
30
40
Ethiopia Madagascar United Rep.of Tanzania
Nepal Yemen
Sources: Ethiopia: National Labour Force Survey 2013; Madagascar: Enquête Nationale sur l’Emploi et le Secteur Informel 2012; Nepal: Nepal Labour Force Survey 1999; United Republic of Tanzania: Employment and Earnings Survey 2012; Yemen: Child Labour Survey 2010.
New forms of organization in supply chains can present new
opportunities for rural women, but also new challenges.
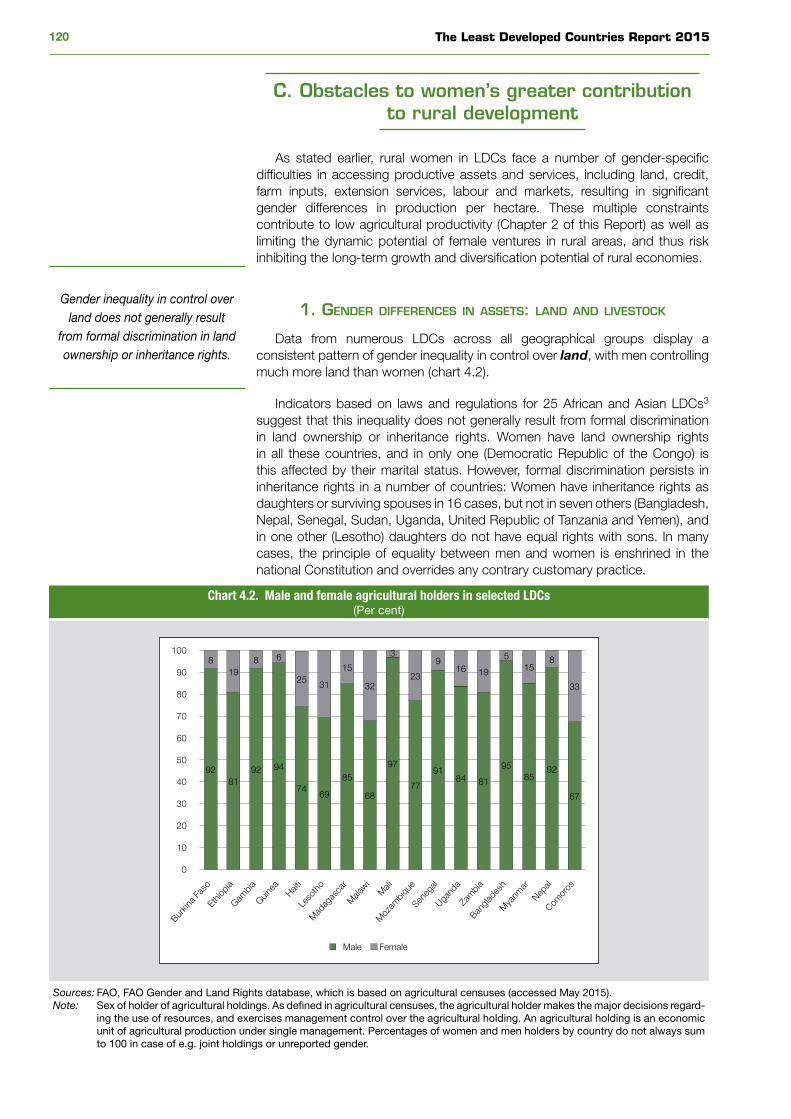
The Least Developed Countries Report 2015120
C. Obstacles to women’s greater contribution to rural development
As stated earlier, rural women in LDCs face a number of gender-specific difficulties in accessing productive assets and services, including land, credit, farm inputs, extension services, labour and markets, resulting in significant gender differences in production per hectare. These multiple constraints contribute to low agricultural productivity (Chapter 2 of this Report) as well as limiting the dynamic potential of female ventures in rural areas, and thus risk inhibiting the long-term growth and diversification potential of rural economies.
1. gender differenCes in assets: land and livestoCk
Data from numerous LDCs across all geographical groups display a consistent pattern of gender inequality in control over land, with men controlling much more land than women (chart 4.2).
Indicators based on laws and regulations for 25 African and Asian LDCs3
suggest that this inequality does not generally result from formal discrimination in land ownership or inheritance rights. Women have land ownership rights in all these countries, and in only one (Democratic Republic of the Congo) is this affected by their marital status. However, formal discrimination persists in inheritance rights in a number of countries: Women have inheritance rights as daughters or surviving spouses in 16 cases, but not in seven others (Bangladesh, Nepal, Senegal, Sudan, Uganda, United Republic of Tanzania and Yemen), and in one other (Lesotho) daughters do not have equal rights with sons. In many cases, the principle of equality between men and women is enshrined in the national Constitution and overrides any contrary customary practice.
Chart 4.2. Male and female agricultural holders in selected LDCs(Per cent)
9281
92 94
7469
85
68
97
77
9184 81
9585
92
67
819
8 6
25 31
15
32
3
23
916 19
515
8
33
0
10
20
30
40
50
60
70
80
90
100
Male Female
Burkin
a Fas
oEt
hiopia
Gambia
Guinea
Haiti
Leso
tho
Mad
agas
car
Mala
wiM
aliM
ozam
bique
Seneg
alUga
nda
Zam
biaBan
glade
shM
yanm
arNep
alCom
oros
Sources: FAO, FAO Gender and Land Rights database, which is based on agricultural censuses (accessed May 2015).Note: Sex of holder of agricultural holdings. As defined in agricultural censuses, the agricultural holder makes the major decisions regard-
ing the use of resources, and exercises management control over the agricultural holding. An agricultural holding is an economic unit of agricultural production under single management. Percentages of women and men holders by country do not always sum to 100 in case of e.g. joint holdings or unreported gender.
Gender inequality in control over land does not generally result
from formal discrimination in land ownership or inheritance rights.
121CHAPTER 4. Gender-based Patterns and Constraints in Rural Development
Thus, gender differences in control over land mainly reflect sociocultural barriers enshrined in customary law and practices, rather than civil law (box 4.2), which leads to major challenges in translating legal enactments on land ownership and inheritance into effective de facto rights. Major impediments include patriarchal cultural norms embedded in customary practices, complications in the formal registration process (e.g. the need for a formal marriage certificate for joint registration of land) and lack of legal awareness (UNCTAD, 2014). Such difficulties may be greater where men and women compete for scarce land. Women who are not formally married face particular obstacles in securing equality and non-discrimination in inheritance rights. In particular, women in unregistered customary law unions, including polygamous unions, often have no legal entitlements, as do those cohabiting without formal or customary marriage.
There are also marked gender differences in ownership of livestock, reflecting the patterns of gender specialization outlined in Section B.1 (box 4.3).
2. human Capital: eduCation and literaCy
Rural women, and female heads of household in particular, tend to have lower literacy rates and significantly fewer years of education than their male counterparts. This translates into substantial competitive disadvantages for female-headed households, for example, in accessing and using market information and extension services; applying for credit; and complying with importing countries’ product standards, particularly in relation to sanitary and phytosanitary (SPS) measures (UNCTAD 2011; UNCTAD 2014).
In Cambodia, for example, 76 per cent of male members of agricultural households have completed at least one level of schooling, compared with 66 per cent of female members. Basic literacy is also more widespread among male than female household heads, with significant differences across regions:
Box 4.2. Women’s access to land in Malawi, Rwanda and Lesotho
Customary practices differ widely between regions, countries and ethnic groups. Malawi exemplifies both the resilience and the complexity of such practices. Formally, when a husband dies, the property is inherited by his wife and children. Actual practices, however, are varied and more complex. In some districts, besides the surviving wife, property can be inherited only by male children, based on an assumption that any land held by girls would be lost to outsiders after their marriage. Equally, on marriage, girls receive items considered more appropriate for women, such as kitchen utensils, rather than land. In other districts, property is shared equally between male and female children; but when girls get married and move out of the household, they leave their land behind. While they may resume use of the land once they return to their home village, they do so under their brothers’ authority.
In Rwanda, progressive legal enactments have constituted significant steps towards redressing customary practices that marginalize women in land control. In particular, the 2005 land law (Organic Land Law No. 08/2005) guarantees equal ownership rights for men and women; and, under the Land Tenure Regularisation programme, legally married wives must be registered as co-owners of the land. Based on data from the Rwanda Natural Resources Authority, 26 per cent of the total registered land in Rwanda was owned by women in 2013, and 54 per cent was jointly owned by female and male spouses. Nonetheless, de facto male control of land remains deeply entrenched. Farmlands are extremely fragmented in Rwanda, with an average farm size of only 0.76 hectares (Republic of Rwanda, 2010); and provisions against the fragmentation of land tenure encroach on the principle of equal inheritance rights for children (IFAD, 2010). By law, plots not exceeding an area of 1 hectare – some 80 per cent of farms – cannot be further partitioned. Where this prevents a plot from being partitioned among children, it is held on behalf of the family in communal/familial possession by a single heir – commonly the oldest male child (UNCTAD, 2014). This shared responsibility conceals patterns of male control over the land.
In Lesotho, virtually all women in rural areas are married by custom or tradition (rather than under civil law), so that matters related to marriage, land ownership and succession are adjudicated by local customary (Basuto) courts, on the basis of customary law, rather than under civil law. In customary practice, only a male child can inherit land, while women can neither enter into contracts nor own property in their own names. It is also noteworthy that Lesotho’s 1993 Constitution places respect for customary practices (cultural rights) above respect for individual civil rights.
Sources: Malawi Human Rights Commission (2006), IFAD (2010), UNCTAD (2012 and 2014).
Gender differences in control over land mainly reflect sociocultural
barriers enshrined in customary law and practices, rather than civil law.
Rural women, and female heads of household in particular, tend to have lower literacy rates and significantly fewer years of education than their
male counterparts.

The Least Developed Countries Report 2015122
In the coastal region, for example, 80 per cent of male household heads are able to read and write a simple message, compared with 38 per cent of female household heads (FAO/SIDA, 2010b).
In Lao People’s Democratic Republic, 75 per cent of male household members and 80 per cent of male household heads are literate, compared with 57 per cent of female household members and only 49 per cent of female heads. Only 45 per cent of female heads of household, but 54 per cent of their male counterparts, have completed primary school; and three times as many female heads as male heads have never attended school. Twice as many women and girls as men and boys (over 6 years of age) have never attended school; and, among those not attending school, girls (24 per cent) are substantially more likely than boys (14 per cent) to be kept out of school because of work-related commitments (FAO/SIDA, 2010b).
In Ethiopia as well, there are significant gender differences in rural literacy rates: 52 per cent of rural men, but only 36 per cent of rural women, are able to read and write without difficulty. However, primary school enrolment is slightly higher for girls (59 per cent) than for boys (57 per cent) (Central Statistical Agency of Ethiopia and World Bank, 2013); and preliminary findings of a survey conducted in 2013 point to full gender parity in the highest grade achieved in school among 12-year-olds (Young Lives, 2014).
In Rwanda, 56.7 per cent of women and girls over six years of age are literate, compared to 61.4 per cent of men and boys nationally; and, as in Lao People’s Democratic Republic, disparities between male and female heads of household in rural areas are substantially wider: 62.4 per cent of female household heads are unable to read or write, compared with only 29.8 per cent of their male counterparts (Republic of Rwanda, 2011, tables 9.7 and 9.8, pp. 42–43).
In Bhutan, the literacy rate among rural women is only 39.2 per cent, and their formal educational attainment is particularly low, as 87 per cent of female heads of households in rural areas have received no formal schooling (National Statistics Bureau, 2007).
Box 4.3. Livestock farming and sale in Cambodia, Lao People’s Democratic Republic and United Republic of Tanzania
In Cambodia, all agricultural households reported being involved in livestock or poultry farming in 2008, the main livestock being chickens, cattle and pigs. Female-headed households (20 per cent of all agricultural households) had fewer livestock on average than their male-headed counterparts. Some 62 per cent of female-headed households kept chickens, compared with 65 per cent of male-headed households; 44 per cent kept cattle, compared with 54 per cent; and 20 per cent kept pigs, compared with 26 per cent. Sales patterns were also gender-differentiated: Sales of livestock and poultry by female-headed agricultural households amounted to just over half (53 per cent) of those of male-headed households, which also sold almost 20 per cent more livestock and poultry products.
In Lao People’s Democratic Republic, more than half of all agricultural households were engaged in livestock and poultry production in 2007–2008, including 58 per cent of male-headed and 39 per cent of female-headed households. Pigs, buffaloes and cattle were the most common farm animals in agricultural households. Cattle were raised by 46 per cent of female-headed and 52 per cent of male-headed households, and pigs were raised by 57 per cent of female-headed and 62 per cent of male-headed households; but female-headed households kept a greater proportion of buffaloes and goats. As in the case of Cambodia, the average prices of livestock and poultry sold were higher for households headed by men than for those headed by women (47 per cent higher for turkeys and 20 per cent for ducks), as a result of differences in the types of markets and/or buyers to which female- and male-headed households have access (FAO/SIDA, 2010b).
In the United Republic of Tanzania, women own only 1.9 per cent of cattle, while men own 98.1 per cent. Nonetheless, women share responsibility for caring for cattle, typically including milking the cows twice a day, tending the herds, fetching water and cleaning shelters, as well as marketing milk.
Source: FAO/SIDA (2010b), Anderson-Saito, Dhar and Pehu, 2004.
Basic literacy is also more widespread among male than
female household heads.

123CHAPTER 4. Gender-based Patterns and Constraints in Rural Development
3. aCCess to inputs and markets
Across many different contexts, women consistently have less access than men to agricultural resources and inputs (FAO, 2011). Where credit is available, women’s access can be affected by their limited control of land, which impairs their ability to provide collateral. Lower levels of education and literacy also mean that women are less likely than men to have the skills required to apply for loans successfully or to design and articulate business plans. They may also be less aware of the credit facilities available to them.
As a result, women are consistently less likely than men to use credit, across countries and contexts. In Lao People’s Democratic Republic, for example, 10 per cent of all female-headed agricultural households had outstanding loans during the reporting period (2002–2003), compared to 15 per cent of male-headed households. Among those with loans, fewer female- than male-headed households borrowed from banks (13.5 per cent, compared with 22 per cent), while more borrowed from neighbours, the main source for both groups (74 per cent, vs. 52 per cent). While all female-headed households with outstanding loans used land as collateral, male-headed households also used livestock, houses and other property (UNCTAD, 2014).
Some Governments have backed rural investment guarantee funds to facilitate women’s access to credit, but they have not always been effective in reaching the intended beneficiaries. Major obstacles include target groups’ lack of awareness and inability to comply with lending requirements. Cooperatives and other civil society organizations could serve as a bridge between these lending institutions and individual women; but establishment and registration procedures are often cumbersome and involve high transaction costs, and civil society organizations often lack the financial and human resources necessary to perform such a role on a large scale (UNCTAD, 2014).
Women also face structural biases in access to agricultural inputs. Survey data indicate that female farmers are less likely than men to use improved seed varieties and purchased inputs (e.g. fertilizers), reflecting their more limited resources and access to finance, as well as poor targeting and limited gender sensitivity of input subsidy schemes. In Ethiopia, Malawi, Niger and Uganda, for example, women use less fertilizer than men; and in Malawi, lower input use accounts for more than 80 per cent of the gap between women’s productivity and men’s (World Bank and ONE, 2014). In some contexts, this gives rise to gender differences in the crop varieties cultivated, with women tending to farm conventional varieties and men, hybrid varieties. In rural Malawi, for example, 45 per cent of all plots owned or managed by women are cultivated with (drought-resistant) local maize and 30 per cent with hybrid varieties, while male-managed plots are equally divided, 32 per cent being planted with each (Republic of Malawi, 2012).
Although some Governments operate input subsidy schemes to promote input use, they are often not gender-neutral. In the case of fertilizer voucher systems, for example, vouchers are typically issued to one person on behalf of the others on communal properties; beneficiaries are required to present the voucher to accredited outlets; they need to cover the unsubsidized portion of the market price; and they must transport the fertilizer (typically sold in sealed and certified 50-kg bags) from the dealer to the farm. Women’s access is thus impaired by their more limited access to cash income, credit and transport, their smaller plot sizes, and the dynamics of communal household ownership (UNCTAD, 2014; World Bank and ONE, 2014).
When women do have access to fertilizers, there may also be gender differences in returns from their use. In Ethiopia and United Republic of Tanzania,
Lower levels of education and literacy mean that women are
less likely than men to have the skills required to apply for loans
successfully or to design and articulate business plans.
Women are consistently less likely than men to use credit, across
countries and contexts.
Female farmers are less likely than men to use improved seed
varieties and purchased inputs (e.g. fertilizers).
When women do have access to fertilizers, there may also be gender differences in returns from their use.
The Least Developed Countries Report 2015124
for example, the fact that there are lower productivity gains with fertilizer use on women’s farms than on men’s suggests that female farmers use fertilizer of lower quality or use it less effectively (World Bank and ONE, 2014).
This may in part reflect gender differences in access to or effectiveness of extension services, which are often more “attuned” to the needs of male than of female farmers (IFAD, 2010; UNCTAD, 2014; World Bank and ONE, 2014). Extension services tend to be male-dominated, and are not designed to respond to the practical needs of women, particularly with respect to the time constraints on their participation in training activities. Power dynamics at the community and household level also tend to limit access of women (and youths) to training opportunities (UNCTAD, 2014).
Agriculture in LDCs is heavily dependent on manual labour, and women who work as farmers on their own account face many difficulties in mobilizing additional labour to work on their farms. Women themselves are prevented by household responsibilities from engaging full-time on their plots; and their ability to hire non-family labour is often restricted by financial and cultural factors. In Ethiopia, Malawi, Uganda and United Republic of Tanzania, for example, female farmers deploy fewer male household labourers than do male-managed farms (World Bank and ONE, 2014).
Women’s access to markets and market information is impaired by their more limited access than men to durable goods such as radios and cell phones, and to means of transport such as bicycles. They are less likely to own cell phones than men, and are at a particular disadvantage in accessing ICTs where they are available; they may be prevented by cultural attitudes from using rural access points frequented by men; and their ability to upgrade their skills is impaired by more limited literacy and educational attainment, as well as time and mobility constraints. These gender differences may reduce female farmers’ access to more lucrative markets, by limiting their access to market information or their ability to transport inputs and farm produce.
4. the rural produCtivity gap
The gender-specific constraints outlined above reduce the productive potential of rural women in both farm and non-farm activities, resulting in lower average productivity on farms managed by women than by men. A comprehensive assessment of survey data from five African LDCs (Ethiopia, Niger, Malawi, Uganda and United Republic of Tanzania) points to a consistent gender gap in agricultural yields per hectare (World Bank and ONE, 2014). In Niger, Uganda and United Republic of Tanzania, these productivity gaps are much more pronounced when differences in plot size and region are taken into account (chart 4.3). In Lao People’s Democratic Republic, however, yields do not differ significantly between male- and female-headed households, except for maize, whose productivity is 20 per cent higher in the former (FAO/SIDA, 2010b).
Households headed by women also tend to experience substantially greater crop losses, typically as a result of robbery, pests, floods or droughts: In Cambodia, female-headed households’ losses in 2008 amounted to 10 per cent for leguminous plants (compared with 3 per cent for male-headed households), 6 per cent for vegetables (vs. 0.6 per cent) and 11 per cent for other crops for industrial purposes (vs. 0.3 per cent) (FAO/SIDA, 2010a). Crop losses are also higher for female-headed households in Lao People’s Democratic Republic, amounting to 10 per cent of total rice production, compared with 4 per cent for male-headed households (FAO/SIDA, 2010b).
Extension services tend to be male-dominated, and are not designed to
respond to the practical needs of women.
Women are prevented by household responsibilities from engaging full-
time on their plots.
Women’s access to markets and market information is impaired by
their more limited access than men to durable goods such as radios and
cell phones, and to means of transport.
A comprehensive assessment of survey data from five African LDCs
points to a consistent gender gap in agricultural yields per hectare.

125CHAPTER 4. Gender-based Patterns and Constraints in Rural Development
The costs of gender constraints are thus considerable. Globally, FAO (2011) estimates suggest that providing women with the same access to productive resources as men could increase yields on their farms by 20–30 per cent, raising total agricultural output by 2.5–4 per cent.
D. Differentiating causes and symptoms of gender inequality
As noted in the introduction to this chapter, there is a close relationship between the disadvantages women face as a result of gender inequality and those faced by the population as a whole as a result of income inequality and poverty. This suggests an important distinction between gender inequalities that arise directly from gender norms and what might be called contingent inequalities — those which arise indirectly from the interaction between the resulting disadvantages and those due to poverty.
As noted above, women face greater time and mobility constraints than men because of the double burden of care and productive work resulting from cultural norms. They may, on average, have more limited educational opportunities because of gender biases in household decision-making and/or differential provision. They are more likely to be landless because of discriminatory conventions and practices in land ownership and inheritance. Their employment opportunities may be limited by gender segregation in employment markets, and their self-employment opportunities by cultural norms regarding “appropriate” activities for women. All these constraints arise directly from gendered social structures and norms; and addressing them effectively requires direct, gender-specific action to correct or compensate for structural gender biases.
However, the ingrained nature of cultural norms, especially in rural areas, makes this a slow (and very sensitive) process. It is therefore necessary also to address the consequences of the resulting disadvantages to women — their limited time and mobility, lack of access to land, limited education and opportunities, etc. — and the contingent inequalities that stem from them.
Chart 4.3. Gender gap in land productivity, selected African LDCs(Per cent)
23 2519
6
13
24 25
66
23
33
0
10
20
30
40
50
60
70
Ethiopia Malawi Niger United Rep.of Tanzania
Uganda
Simple difference Difference after accounting for plot size and regions
Source: World Bank and ONE (2014).
The costs of gender constraints are considerable.
There is an important distinction between gender inequalities and what might be called contingent
inequalities.
Many constraints arise directly from gendered social structures
and norms.
The Least Developed Countries Report 2015126
The inequalities arising directly from gender norms contribute indirectly to further disadvantages — low incomes, limited savings and assets, lack of access to inputs, markets and/or credit, etc. — all of which are themselves interlinked. However, neither symptoms of gender inequality such as lack of education and landlessness, nor these indirect disadvantages, are limited exclusively to women, although women are likely to be disproportionately affected. Men, particularly at lower income levels, may also be landless and have limited education. They also share the consequences of these disadvantages, such as limited access to credit, inputs and markets (although these may be more acute for women where they interact with other social norms). While the double burden of care and productive work is not generally applicable to men, chronic illness or disability may have similar consequences; and in some contexts, men may also face some degree of segregation in labour markets, for example on the basis of ethnicity.
Thus, while the root causes of gender inequality must by their nature be addressed by gender-specific approaches targeting women explicitly, these indirect disadvantages are more appropriately addressed through more inclusive but gender-sensitive approaches, directed both at women and at equally disadvantaged men. Directing support to women while arbitrarily excluding similarly disadvantaged men, particularly in a context of strongly patriarchal traditional cultures, could risk giving rise to alienation, potentially undermining longer-term efforts to tackle the underlying causes of gender inequality.
E. Summary and conclusions
In summary:
• Women represent half the rural and agricultural workforce of LDCs, but face serious constraints on realizing their productive potential as a result of numerous cultural and institutional factors.
• The double burden of care and productive work, together with a disproportionate share of unpaid agricultural work, imposes constraints on women’s time use and mobility, and limits their ability to upgrade their skills.
• Despite a major role in agricultural production, women have limited control over the income it generates.
• In rural labour markets, women are more likely than men to be segregated in part-time, seasonal and/or low-paid work, as well as providing a disproportionate amount of unpaid family work.
• Women’s access to land is constrained by customary law and practices, impeding change through formal law.
• Women, and especially female household heads, generally have lower literacy rates and educational attainment.
• Rural women also face constraints on their access to credit, productive inputs, extension services, markets and market information.
• These constraints limit the productivity of plots managed by women, which in some cases also have greater crop losses.
• While gender-specific measures are needed to overcome disadvantages arising directly from gender norms, more inclusive but gender-sensitive
The inequalities arising directly from gender norms contribute indirectly
to further disadvantages.
While the root causes of gender inequality require gender-specific
approaches, indirect disadvantages require inclusive but gender-
sensitive approaches.
127CHAPTER 4. Gender-based Patterns and Constraints in Rural Development
approaches are more appropriate in dealing with their consequences, which are closely related to those arising from poverty.
These gender-based obstacles compound and interact with other market imperfections in rural areas to diminish women’s productivity and entrepreneurial potential, reducing the dynamic potential of rural economies and slowing their transformation. Unless such constraints are addressed, the supply response to incentives aimed at increasing production and marketed surpluses will remain sluggish, as half of the labour force will still be unable to respond effectively. Increasing rural productivity and accelerating rural economic diversification thus requires effective action to remove these obstacles, so as to address the low-productivity equilibria that trap rural women in poverty, while stimulating non-farm activities upstream and downstream from agriculture.
Notes
1 Such estimates should, however, be treated with caution, due to systematic underreporting of rural wage labour in national statistics (USAID, 2015b).
2 Defined as paying less than the median agricultural wage. 3 Angola, Bangladesh, Benin, Burkina Faso, Burundi, Cambodia, Chad, Democratic
Republic of the Congo, Ethiopia, Lao People’s Democratic Republic, Lesotho, Liberia, Madagascar, Malawi, Mozambique, Nepal, Rwanda, Senegal, Sierra Leone, Sudan, United Republic of Tanzania, Togo, Uganda, Yemen, Zambia. Data from the World Bank, Women, Business and the Law 2014 database (available from http://wbl.worldbank.org/). Land ownership rights refer to ownership rights to property of unmarried/married women; inheritance rights refer to inheritance rights to property of sons and daughters, and of women who survive their spouses.
References
Anderson-Saito K, A Dhar and E Pehu (2004). GENRD Operational Notes for Task Managers to Integrate Gender into Rural Projects. ARD Communiqué. World Bank. Washington, D.C.
Boserup E (2007). Woman’s Role in Economic Development. Earthscan (new edition). London and Sterling, VA.
Central Statistical Agency of Ethiopia and World Bank (2013). Ethiopia Rural Socioeconomic Survey. Available from http://siteresources.worldbank.org/INTLSMS/Resources/ 3358986-1233781970982/5800988-1367841456879/9170025-1367841502220/ ERSS_Survey_Report.pdf.
Croppenstedt A, M Goldstein and N Rosas (2013). Gender and Agriculture. Inefficiencies, Segregation, and Low Productivity Traps. Policy Research Working Paper 6370. World Bank, Washington, D.C. February.
Deere CD (2005). The Feminization of Agriculture? Economic Restructuring in Rural Latin America. United Nations Research Institute for Social Development. Geneva.
FAO (2011). The State of Food and Agriculture 2010–2011: Women in Agriculture: Closing the Gender Gap for Development. Food and Agriculture Organization of the United Nations. Rome.
FAO, IFAD and ILO (2010). Agricultural Value Chain Development: Threat or Opportunity for Women’s Employment? Gender and Rural Employment Policy Brief 4. Available from http://www.fao.org/docrep/013/i2008e/i2008e04.pdf.
FAO/SIDA (2010a). National gender profile of agricultural households, 2010: Report based on the 2008 Cambodia Socio-Economic Survey. Available from http://www.fao.org/docrep/012/k8498e/k8498e00.pdf.
FAO/SIDA (2010b). National gender profile of agricultural households, 2010: Report based on the Lao Expenditure and Consumption Surveys, National Agricultural Census and the National Population Census. Available from http://www.fao.org/docrep/012/k8496e/k8496e00.pdf.
Gender-based obstacles compound and interact with other market
imperfections to diminish women’s productivity and entrepreneurial
potential and slow rural transformation.

The Least Developed Countries Report 2015128
Guèye EF (2000). The Role of Family Poultry in Poverty Alleviation, Food Security and the Promotion of Gender Equality in Rural Africa. Outlook on Agriculture. 29(2):129–136.
IFAD (2010). Gender and Youth in the Tea and Coffee Value Chains. IFAD Report No. 2295-RW. International Fund for Agricultural Development. Rome.
ILO (2008). Report IV: Promotion of Rural Employment for Poverty Reduction. International Labour Conference, 97th session. International Labour Office. Geneva.
ILO (2014). Global Employment Trends 2014: Risk of a Jobless Recovery? International Labour Organization. Geneva.
Maertens M and JFM Swinnen (2009). Are Modern Supply Chains Bearers of Gender Inequality? Paper presented at the ILO-FAO workshop on Gender Dimension of Rural Employment, 30 March–3 April. Rome.
Malawi Human Rights Commission (2006). A Study into Cultural Practices and Their Impact on the Enjoyment of Human Rights: Particularly the Rights of Women and Children in Malawi.
National Statistics Bureau (2007). Bhutan Living Standard Survey, 2007: Report. Royal Government of Bhutan. Thimphu.
Okali C and J Mims (1998). Gender and Smallholder Dairy Production in Tanzania. Report to the Livestock Production Programme of the United Kingdom Department for International Development. Appendices 1-2:37–38.
Republic of Malawi (2012). Integrated Household Survey, 2010–2011: Household Socio-Economic Characteristics Report. September. Available from http://siteresources.worldbank.org/INTLSMS/Resources/3358986-1233781970982/5800988- 1271185595871/IHS3_Report.pdf.
Republic of Rwanda (2011). EICV3 Thematic Report: Gender. Integrated Household Living Conditions Survey 3 (EICV3). National Institute of Statistics of Rwanda, Kigali.
Tangka FK, MA Jabbar and BI Shapiro (2000). Gender Roles and Child Nutrition in Livestock Production Systems in Developing Countries: A Critical Review. Socio-economics and Policy Research Working Paper No. 27. International Livestock Research Institute. Nairobi.
TPAWU (2011). Factors affecting labour conditions in horticulture industry in Tanzania. Tanzania Plantation and Agricultural Workers Union. Available from http://www.women-ww.org/documents/Research-Booklet-TPAWU.pdf.
UNECE and World Bank Institute (2010). Developing Gender Statistics: A Practical Tool. ECE/CES/8. United Nations. Geneva.
UNCTAD and EIF (2014). The Fisheries Sector in The Gambia: Trade, Value Addition and Social Inclusiveness, with a Focus on Women. UNCTAD/DITC/2013/4. Geneva.
UNCTAD (2011). Who is benefiting from trade liberalization in Bhutan? A gender perspective. UNCTAD/OSG/2011/1. Geneva.
UNCTAD (2012). Who is benefiting from trade liberalization in Lesotho? A gender perspective. UNCTAD/OSG/2012/2. Geneva.
UNCTAD (2014). Who is benefiting from trade liberalization in Rwanda? A gender perspective. UNCTAD/DITC/2014/2. Geneva.
USAID (2015a). Intervention Guide for the Women’s Empowerment in Agriculture Index. LEO Report No. 10. Washington, D.C.
USAID (2015b). Wage Labor, Agriculture-based Economies, and Pathways out of Poverty: Tacking Stock of the Evidence. LEO Report No. 15. Washington, D.C.
Verhart, N and R Pyburn (2012). Gender Equality and Certified Agricultural Value Chain. In: Harcourt, W, ed. Women Reclaiming Sustainable Livelihoods: Spaces Lost, Spaces Gained. Palgrave MacMillan. London: 62–82.
World Bank. Women, Business and the Law 2014. Available from http://wbl.worldbank.org/. World Bank, FAO and IFAD (2009). Gender in Agriculture: Sourcebook. World Bank
Publications. Washington, D.C.World Bank and ONE (2014). Levelling the Field: Improving Opportunities for Women
Farmers in Africa. World Bank and the ONE Campaign. Washington, D.C.Young Lives (2014) Education and Learning: Round 4 Preliminary Findings - Preliminary
Findings from the 2013 Young Lives Survey (Round 4) in Ethiopia. Young Lives in Ethiopia, Addis Ababa. November. Available from http://www.younglives.org.uk/files/country-reports/round-4/ethiopia_r4_education.
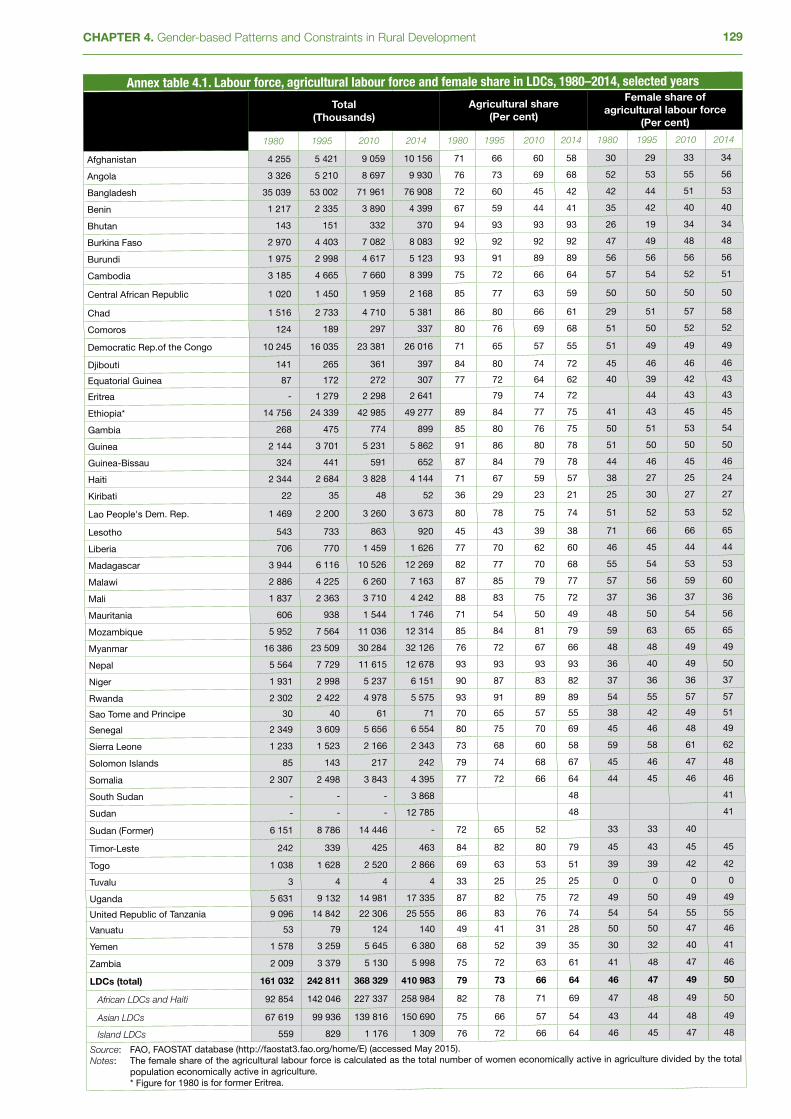
129CHAPTER 4. Gender-based Patterns and Constraints in Rural Development
Annex table 4.1. Labour force, agricultural labour force and female share in LDCs, 1980–2014, selected years
Total(Thousands)
Agricultural share(Per cent)
Female share of agricultural labour force
(Per cent)
1980 1995 2010 2014 1980 1995 2010 2014 1980 1995 2010 2014
Afghanistan 4 255 5 421 9 059 10 156 71 66 60 58 30 29 33 34
Angola 3 326 5 210 8 697 9 930 76 73 69 68 52 53 55 56
Bangladesh 35 039 53 002 71 961 76 908 72 60 45 42 42 44 51 53
Benin 1 217 2 335 3 890 4 399 67 59 44 41 35 42 40 40
Bhutan 143 151 332 370 94 93 93 93 26 19 34 34
Burkina Faso 2 970 4 403 7 082 8 083 92 92 92 92 47 49 48 48
Burundi 1 975 2 998 4 617 5 123 93 91 89 89 56 56 56 56
Cambodia 3 185 4 665 7 660 8 399 75 72 66 64 57 54 52 51
Central African Republic 1 020 1 450 1 959 2 168 85 77 63 59 50 50 50 50
Chad 1 516 2 733 4 710 5 381 86 80 66 61 29 51 57 58
Comoros 124 189 297 337 80 76 69 68 51 50 52 52
Democratic Rep.of the Congo 10 245 16 035 23 381 26 016 71 65 57 55 51 49 49 49
Djibouti 141 265 361 397 84 80 74 72 45 46 46 46
Equatorial Guinea 87 172 272 307 77 72 64 62 40 39 42 43
Eritrea - 1 279 2 298 2 641 79 74 72 44 43 43
Ethiopia* 14 756 24 339 42 985 49 277 89 84 77 75 41 43 45 45
Gambia 268 475 774 899 85 80 76 75 50 51 53 54
Guinea 2 144 3 701 5 231 5 862 91 86 80 78 51 50 50 50
Guinea-Bissau 324 441 591 652 87 84 79 78 44 46 45 46
Haiti 2 344 2 684 3 828 4 144 71 67 59 57 38 27 25 24
Kiribati 22 35 48 52 36 29 23 21 25 30 27 27
Lao People's Dem. Rep. 1 469 2 200 3 260 3 673 80 78 75 74 51 52 53 52
Lesotho 543 733 863 920 45 43 39 38 71 66 66 65
Liberia 706 770 1 459 1 626 77 70 62 60 46 45 44 44
Madagascar 3 944 6 116 10 526 12 269 82 77 70 68 55 54 53 53
Malawi 2 886 4 225 6 260 7 163 87 85 79 77 57 56 59 60
Mali 1 837 2 363 3 710 4 242 88 83 75 72 37 36 37 36
Mauritania 606 938 1 544 1 746 71 54 50 49 48 50 54 56
Mozambique 5 952 7 564 11 036 12 314 85 84 81 79 59 63 65 65
Myanmar 16 386 23 509 30 284 32 126 76 72 67 66 48 48 49 49
Nepal 5 564 7 729 11 615 12 678 93 93 93 93 36 40 49 50
Niger 1 931 2 998 5 237 6 151 90 87 83 82 37 36 36 37
Rwanda 2 302 2 422 4 978 5 575 93 91 89 89 54 55 57 57
Sao Tome and Principe 30 40 61 71 70 65 57 55 38 42 49 51
Senegal 2 349 3 609 5 656 6 554 80 75 70 69 45 46 48 49
Sierra Leone 1 233 1 523 2 166 2 343 73 68 60 58 59 58 61 62
Solomon Islands 85 143 217 242 79 74 68 67 45 46 47 48
Somalia 2 307 2 498 3 843 4 395 77 72 66 64 44 45 46 46
South Sudan - - - 3 868 48 41
Sudan - - - 12 785 48 41
Sudan (Former) 6 151 8 786 14 446 - 72 65 52 33 33 40
Timor-Leste 242 339 425 463 84 82 80 79 45 43 45 45
Togo 1 038 1 628 2 520 2 866 69 63 53 51 39 39 42 42
Tuvalu 3 4 4 4 33 25 25 25 0 0 0 0
Uganda 5 631 9 132 14 981 17 335 87 82 75 72 49 50 49 49
United Republic of Tanzania 9 096 14 842 22 306 25 555 86 83 76 74 54 54 55 55
Vanuatu 53 79 124 140 49 41 31 28 50 50 47 46
Yemen 1 578 3 259 5 645 6 380 68 52 39 35 30 32 40 41
Zambia 2 009 3 379 5 130 5 998 75 72 63 61 41 48 47 46
LDCs (total) 161 032 242 811 368 329 410 983 79 73 66 64 46 47 49 50
African LDCs and Haiti 92 854 142 046 227 337 258 984 82 78 71 69 47 48 49 50
Asian LDCs 67 619 99 936 139 816 150 690 75 66 57 54 43 44 48 49
Island LDCs 559 829 1 176 1 309 76 72 66 64 46 45 47 48
Source: FAO, FAOSTAT database (http://faostat3.fao.org/home/E) (accessed May 2015). Notes: The female share of the agricultural labour force is calculated as the total number of women economically active in agriculture divided by the total
population economically active in agriculture. * Figure for 1980 is for former Eritrea.

The Least Developed Countries Report 2015130
Annex table 4.2. Share of male and female employment in LDCs, by sector, 2000 and 2014(Per cent)
Agriculture Industry Services
Male Female Male Female Male Female
2000 2014p 2000 2014p 2000 2014p 2000 2014p 2000 2014p 2000 2014p
Afghanistan 56.9 51.1 77.3 71.6 11.2 13.6 9.2 11.1 31.8 35.3 13.6 17.3
Angola 52.9 38.7 49.8 32.6 11.6 15.1 4.8 5.9 35.5 46.2 45.4 61.4
Bangladesh 56.3 33.2 78.4 85.4 11.6 19.3 9.2 5.7 32.0 47.5 12.4 9.0
Benin 54.9 54.6 34.0 29.0 10.3 9.0 9.6 7.4 34.9 36.4 56.3 63.5
Bhutan 75.0 44.4 91.3 80.4 3.2 11.4 0.9 6.4 21.8 44.2 7.7 13.3
Burkina Faso 84.4 80.5 88.8 87.9 4.6 3.4 2.2 2.1 11.1 16.0 8.9 10.0
Burundi 87.1 87.1 96.6 96.3 3.8 3.7 0.7 0.6 9.1 9.2 2.7 3.1
Cambodia 72.4 45.2 74.9 49.4 7.1 20.9 9.6 19.0 20.4 33.9 15.5 31.6
Central African Republic 72.5 76.1 70.7 72.2 6.3 4.6 2.6 1.8 21.1 19.3 26.7 26.0
Chad 80.8 73.0 86.0 82.3 3.3 5.7 0.7 1.3 15.8 21.4 13.3 16.4
Comoros 62.1 62.9 69.9 70.2 11.8 11.5 6.3 6.0 26.1 25.6 23.8 23.8
Dem. Rep. of the Congo 84.2 81.7 83.3 78.1 3.3 3.8 1.3 1.5 12.5 14.5 15.4 20.4
Equatorial Guinea 39.0 28.8 48.0 38.3 20.2 25.7 11.6 17.2 40.7 45.5 40.5 44.5
Eritrea 70.5 75.6 79.8 80.5 9.4 7.2 5.5 3.6 20.1 17.3 14.7 15.9
Ethiopia 89.4 78.9 80.9 74.5 2.7 8.0 5.4 11.3 7.9 13.1 13.7 14.2
Gambia 56.0 57.7 74.7 69.1 8.8 6.9 0.9 0.7 35.2 35.4 24.3 30.2
Guinea 72.0 72.1 77.5 74.4 9.3 8.4 2.9 2.5 18.8 19.4 19.6 23.1
Guinea-Bissau 67.3 69.3 68.3 62.8 8.7 6.5 3.8 2.6 24.1 24.2 27.9 34.7
Haiti 60.6 54.2 35.6 29.9 15.9 18.7 5.6 5.1 23.5 27.1 58.7 65.0
Lao People's Dem. Rep. 78.9 67.8 87.6 77.2 5.0 8.4 3.1 5.7 16.1 23.8 9.3 17.2
Lesotho 77.8 73.9 64.0 54.2 9.2 9.9 10.0 9.7 12.9 16.1 26.0 36.0
Liberia 56.5 45.2 55.3 44.6 11.1 15.2 3.9 5.6 32.4 39.6 40.8 49.8
Madagascar 74.0 82.7 78.2 78.7 8.6 4.5 8.8 1.0 17.4 12.9 13.0 20.3
Malawi 67.4 64.0 78.8 76.3 11.8 13.4 7.2 8.1 20.8 22.6 14.0 15.6
Mali 70.2 67.9 68.2 60.5 7.4 7.4 2.6 2.4 22.4 24.7 29.2 37.1
Mauritania 57.4 50.8 59.3 53.5 11.6 14.1 5.3 6.6 31.1 35.1 35.3 39.9
Mozambique 71.8 61.0 90.6 87.2 6.1 9.7 0.4 0.6 22.1 29.4 9.0 12.2
Myanmar 53.5 53.6 69.1 65.2 15.9 16.6 9.5 11.0 30.5 29.8 21.3 23.7
Nepal 66.1 60.3 84.4 80.6 14.9 17.3 5.4 6.7 19.0 22.3 10.2 12.8
Niger 64.7 65.4 38.8 37.8 8.1 7.9 18.6 17.0 27.2 26.8 42.6 45.2
Rwanda 80.1 71.0 84.9 77.7 4.9 7.2 2.0 3.0 15.1 21.8 13.1 19.3
Senegal 51.6 33.7 48.0 37.0 15.7 26.3 8.5 5.2 32.6 39.9 43.5 57.8
Sierra Leone 65.4 54.3 71.6 63.0 9.9 14.4 0.9 1.5 24.6 31.2 27.4 35.5
Solomon Islands 52.2 48.3 54.7 49.2 14.5 16.6 6.8 9.2 33.2 35.2 38.5 41.6
Somalia 76.9 76.0 76.3 72.1 5.4 5.2 2.2 2.0 17.7 18.8 21.5 25.8
Sudan 53.3 50.3 60.0 56.6 7.0 8.4 8.4 9.2 39.7 41.3 31.7 34.3
United Rep. of Tanzania 80.1 67.7 84.8 76.4 4.2 8.5 1.2 2.8 15.7 23.9 14.0 20.8
Togo 58.9 60.2 49.5 45.5 10.8 9.6 5.5 4.3 30.2 30.2 45.0 50.2
Uganda 64.8 58.6 77.6 68.0 7.1 10.9 3.7 5.7 28.0 30.6 18.8 26.3
Yemen 40.5 32.8 88.6 89.4 14.5 17.2 2.1 1.3 45.0 50.1 9.3 9.2
Zambia 65.2 64 79.6 78.5 8.8 14.8 2.0 5.2 26.0 21.2 18.4 16.3
LDCs (total) 66.5 57.5 76.6 73 9.1 12.5 5.8 6.2 24.4 30.0 17.7 20.8
African LDCs and Haiti 74.2 68.4 76.5 70.8 6.3 8.7 3.9 5.1 19.5 22.9 19.6 24.1
Asian LDCs 57.1 41.8 76.8 76.9 12.5 18.0 8.6 8.1 30.3 40.2 14.7 15.1
Island LDCs 57.7 56.3 61.1 58.6 13.0 13.8 6.6 7.8 29.3 29.9 32.3 33.6
Source: UNCTAD secretariat, based on data from ILO (2014): supporting data sets: Share of employment by sector and sex (accessed May 2015).Notes: Data for the following countries are unavailable: Djibouti, Kiribati, Sao Tome and Principe, South Sudan, Sudan (Former), Timor-Leste, Tuvalu
and Vanuatu. p: provisional.

CHAPTER5tRansfoRming RuRal economies
in the post-2015 eRa: a policy agenda

The Least Developed Countries Report 2015132
A. New goals, new context, new strategies
In almost all LDCs, most people live in rural areas, and most workers are engaged in agriculture. Thus rural development, though often neglected, is central to the overall development process; and structural transformation of rural economies is a critical dimension of the economic transformation essential for LDCs to benefit more fully from international trade and investment. As discussed in Chapter 1, the importance of rural development in LDCs is further underlined by the 2030 Agenda for Sustainable Development and the SDGs, which also give rise to both the need and the opportunity for a new approach to rural development. This chapter seeks to address how national and international actions can best contribute to the transformation of rural economies in LDCs in light of the new goals and the new context of the post-2015 era.
In principle, the objective of poverty eradication indicates a need for:
(a) Decent work for all, in line with ILO’s Decent Work Agenda (ILO, 1999), with
(b) A legislated minimum wage, set at a sufficient level to allow households a per capita income above the poverty line, and
(c) Social safety nets to support those unable to generate an income above the poverty line through productive activities.
In the context of the LDCs, however, this may be better seen as the destination rather than the route. To be viable, a minimum wage needs to be underpinned by a corresponding level of productivity; and a social safety net will only be feasible and financially sustainable if all but a small minority of households have primary incomes above the poverty line, and if dips below this level are limited and temporary. Establishing these prior conditions will require a process of poverty-oriented structural transformation (POST), as outlined in Chapter 1, to generate the full and productive employment required to complete a virtuous circle of economic and human development (UNCTAD, 2014a, Chapter 3).
This chapter begins with a discussion of the key priorities for rural economic transformation in the post-2015 era: agricultural upgrading; diversification into non-farm activities; strengthening synergies between agriculture and the non-farm economy; empowering rural women; kick-starting the virtuous circle of rural economic transformation; and sequencing investments and interventions. It continues with a discussion of policies in five cross-cutting areas — finance, technology, human resources, enterprise and institutions — followed by a consideration of international dimensions of policy for rural economic transformation: development cooperation, trade, finance and regional and interregional cooperation.
B. Priorities for rural transformation in the post-2015 era
1. agriCultural upgrading
Agriculture, more than any other sector, must be considered in each particular local context. There are considerable differences between countries and localities, not only in patterns of demand and crops grown, but also in terrain, soil, climatic conditions, hydrology, altitude, land tenure systems, plot
The SDGs give rise to both the need and the opportunity for a new
approach to rural development.
Poverty-oriented structural transformation is needed to complete a virtuous circle of
economic and human development.
133CHAPTER 5. Transforming Rural Economies in the Post-2015 Era: A Policy Agenda
sizes, incidence of pests and crop and livestock diseases, etc. Moreover, such variations arise within as well as between countries.
This makes overgeneralization and one-size-fits-all approaches unrealistic and even dangerous, and limits the potential for transferring successful experiences between geographical contexts. Thus, the potential for an “African Green Revolution” (e.g. Sachs, 2005), seeking to replicate the Green Revolution experienced by some Asian countries since the 1960s, is seriously limited by the marked agroecological differences between the two regions: limited African cultivation of wheat and rice, which offered great potential for productivity improvement in Asia; much greater agroecological heterogeneity, limiting the potential intraregional technology spillovers (Binswanger-Mkhize and McCalla, 2010; Pardey et al., 2007); more limited irrigation; and greater infrastructure constraints (Dethier and Effenberger, 2012).
Hence, in African LDCs in particular, what is needed is less an Asian-style Green Revolution than “numerous ‘rainbow evolutions’” (InterAcademy Council, 2004, p. xviii) or “a series of differentiated agricultural revolutions suited to [their] varied ecological niches and market opportunities” (Staatz and Dembélé, 2007, p. 2). This implies a much more bottom-up, locally based and geographically varied approach to agricultural upgrading than is sometimes envisaged.
A key issue spanning the economic, social and environmental dimensions of agricultural development is that of plot sizes. While agricultural yields have generally been found to be higher on smaller than on larger farms (Eastwood, Lipton and Newell, 2010; Binswanger, Deininger and Feder, 1995), leading to a shift of emphasis towards small farms in recent years (UNCTAD, forthcoming), there is a natural limit to the movement towards smaller farms; some technologies with the potential to increase yields may be better suited to larger plots; and excessively small plots may lead households to overexploit land, resulting in soil exhaustion and/or erosion over time.
This suggests a need for what might be termed agricultural right-sizing. Rather than seeking to promote either small- or large-scale agriculture, consideration should be given to the optimal plot size in a particular location, given the agroecological and other conditions and potential crops, taking account of economic, social and environmental considerations. For some crops, where there are substantial economies of scale, production on small plot sizes may be unviable, making much larger plots necessary. However, overreliance on large-scale production is likely to be ineffective in eradicating poverty, as employment creation (outside peak seasons) is generally relatively limited and agricultural wages are very low. Ideally, therefore, sufficient land should be left available for small-farm agriculture to provide all households with incomes above the poverty line.
Despite the generally greater efficiency of small farms in production, there are important economies of scale favouring larger producers in other dimensions, such as finance, input acquisition, marketing, quality assurance and processing, which may threaten the viability of small farms as businesses, particularly in seeking to integrate with value chains (Hazell and Rahman, 2014). This points to a key role for producers’ associations and cooperatives in maintaining the advantages of small-scale production while overcoming the market disadvantages of small producers.
Reforming policies which artificially favour large producers at the expense of small farmers can also bring substantial benefits. In Malawi, for example, reforms reducing differential protection of large estates dramatically shifted the structure of agricultural production, allowing smallholders both to diversify rapidly into
The local specificity of agriculture makes one-size-fits all approaches
unrealistic and even dangerous.
Producers’ associations and cooperatives have a key role
in overcoming the market disadvantages of small producers.
Policy consideration should be given to agricultural right-sizing, focusing
on socially optimal plot sizes.
The Least Developed Countries Report 2015134
cash crops, increasing their share of burley tobacco production to 70 per cent, and to benefit from greater trade in food crops (World Bank, 2007).
In many rural areas of LDCs, there may be some potential to increase cultivated area, e.g. by easing seasonal labour constraints or by improving or extending agricultural infrastructure such as irrigation and drainage. In general, however, the major elements of agricultural upgrading are diversification of production towards higher-value crops (assisted by the shift in demand patterns arising from declining poverty); increasing physical output relative to land and labour used; and reducing post-harvest losses. Increasing yields and labour productivity is primarily a question of technological change: improving agricultural practices and increasing use of inputs such as fertilizers, pesticides and improved seeds, according to local circumstances. Reducing post-harvest losses requires improved storage facilities. Both will entail significant investment.
Market differentiation, in the form of product certification, provides another means of increasing product value — including for wild collection (e.g. of honey and nuts) as well as cultivation. Helping farmers to secure internationally recognized certification of organic production could provide significant benefits to small farmers in export markets, both for traditional products such as coffee and cocoa, and for horticultural products. In countries with existing tourism sectors or the potential to develop them, this can also provide a useful forward linkage for organic agriculture: It is noteworthy that several of the countries with the largest organic subsectors also have substantial tourism sectors.
Fair trade and sustainability certification may also provide valuable means of product differentiation, beyond any immediate social, developmental and environmental benefits. As discussed in Section D.2 below, such benefits could be further enhanced by the development and promotion of a broader global “sustainable development brand” explicitly linked to the SDGs.
2. developing the rural non-farm eConomy
The second key element of rural economic transformation is the development of a dynamic and productive non-farm economy. As discussed in Chapter 3, non-farm incomes in relatively stagnant rural economies come primarily from survivalist activities in sectors with low entry barriers and low productivity, which offer little scope to generate wider or more lasting benefits. A key aspect of rural transformation is to shift the sector towards the more positively motivated “entrepreneurs by choice” characteristic of more dynamic rural economies. While these also typically take the form of household income diversification initially, they are more likely to grow over time; and such enterprise expansion contributes much more to employment creation and increasing productivity than the formation of new microenterprises (Liedholm, McPherson and Chuta, 2007).
Employment generation is critical, as “it is unlikely to be the case that large scale poverty reduction is going to be achieved by making more and more people dependent on entrepreneurial activities” (Dercon, 2009, p. 18). Not everyone wants, or has the potential, to be a successful entrepreneur: This depends not only on natural aptitude, but also on access to financial resources, education, and ability to bear the risks of entrepreneurship, all of which favour the better-off (Barrett, Carter and Timmer, 2010; Lanjouw and Lanjouw, 1995; 2001). Enterprise expansion thus spreads the benefits of diversification more widely, increasing the effect on poverty reduction.
Thus the key is to find an appropriate balance between enterprise creation and enterprise expansion in the local context, given the current state of rural enterprise. In most remote and isolated areas, where “survivalist” household
The major elements of agricultural upgrading are diversifying
production, increasing productivity and reducing post-harvest losses.
Shifting the RNFE towards “entrepreneurship by choice” and
generating employment are critical.
Market differentiation through certification can increase product
value.
135CHAPTER 5. Transforming Rural Economies in the Post-2015 Era: A Policy Agenda
income diversification predominates, the creation of more dynamic and positively motivated enterprises is needed, to provide a base for future expansion. In peri-urban areas with a substantial number of existing microenterprises, a greater focus on promoting the expansion of existing dynamic enterprises is likely to be more fruitful than promoting a further proliferation. The latter would risk intensifying oversupply and excessive competition, and thus undermining enterprise viability and expansion.
A broad-based agricultural upgrading (and other sources of income such as employment in the construction of infrastructure) can be expected to reduce the “push” factors driving survivalist activities by simultaneously reducing supply and increasing demand, thus helping to increase returns. By combining this easing of push pressures with policies to support “entrepreneurs by choice” (Section C.4 below), it is possible to initiate a transformation towards a more productive and dynamic non-farm sector. Rural electrification (Section C.5 below) can also be expected to contribute substantially to enterprise creation and expansion, by increasing opportunities for new production, new technologies and economies of scale.
The effectiveness of enterprise promotion can be further enhanced by “picking possibles” in the terminology of UNCTAD (2014a, Chapter 5) — focusing on promising subsectors in each local context (Chapter 3, Section F). Identifying and addressing systematically the incentives and capacity constraints that impede the development of priority activities can allow and encourage rural households and RNF enterprises to overcome entry barriers (see e.g. Reardon, 1997), and help to create “linkage-friendly” agriculture and RNF activities (FAO, 1998).
3. maximizing agriCulture-rnfe synergies
As highlighted in Chapters 1 and 3, agricultural upgrading and development of the non-farm sector are interdependent. Consequently, a coherent and consistent approach to rural development is essential, to ensure that they are mutually supportive, and to maximize synergies between them.
A key aspect of this interdependence is production of staple foods. Subsistence producers are reluctant to divert their resources to other activities unless they are confident that food will be available and affordable even in the event of a poor harvest. As well as improving the functioning of and access to markets, upgrading staple crop production can both allow subsistence farmers to meet their own needs while using part of their land for other crops for sale, and help to ensure adequate local supplies. It is thus a high priority for technological upgrading in agriculture (Section C.2), especially in the early stages of rural transformation and in remote and isolated areas.
Creating and maintaining local food stocks can also play a major role in ensuring local food security and stabilizing prices, by buying staple foods when supply is abundant, and selling them in the event of undersupply. Such stocks can also provide opportunities for agroprocessing (e.g. drying and/or grinding produce for storage) and the development of storage infrastructure, an important means of reducing post-harvest losses.
More generally, agroprocessing provides a key channel of production linkages and synergies between agriculture and non-farm activities, as upgrading and diversifying agricultural production creates new opportunities for processing activities, while processing activities make agricultural produce more easily transportable and extend its product life, allowing access to a wider market. Agroprocessing has particular potential to empower women, as artisanal and
In remote areas, creation of dynamic enterprises is needed; in peri-urban areas, enterprise expansion is likely
to be more fruitful.
There are important synergies between agricultural upgrading and
agroprocessing…
Increasing staple food production and maintaining local food stocks
have an important role.
Enterprise promotion can be enhanced by “picking possibles” –
focusing on promising subsectors in each local context.
The Least Developed Countries Report 2015136
informal agroprocessing is often a traditionally female occupation, offering substantial potential for the development of dynamic microenterprises. There is also potential for backward linkages to the production of basic processing equipment to reduce the drudgery of tasks such as grinding, pounding and shredding. This indicates a strong case for focusing on agroprocessing in promoting and supporting non-farm enterprises, and in financing and training (Sections C.1, C.3 and C.4).
However, other sectors are also important, given the interaction between agriculture and the RNFE in the labour market. As noted in Chapter 2, wage labour in agriculture is generally very limited; and the extreme seasonality of agricultural demand for wage labour limits employment opportunities in low seasons, even where the cultivated area is constrained by labour shortages at peak times. Thus a key policy objective of policies aimed at the RNFE is to promote activities that generate employment or income opportunities in seasons of low agricultural labour demand, without compounding labour shortages in peak seasons. Since agroprocessing of perishable crops is concentrated in the period immediately after harvesting, this highlights the importance of a more diversified approach to enterprise promotion, rather than focusing exclusively on agroprocessing.
The development of export crops can also generate increasing opportunities for industrial agroprocessing, creating the potential for the growth of SMEs generating employment as rural development progresses, particularly for women. Creating appropriate incentives to promote the integration of small farmers and SMEs into global value chains (GVCs), and to ensure positive developmental effects, is therefore a high priority for policy (box 5.1).
As discussed in Chapter 3, the demand linkages between agriculture and the RNFE are critical, giving rise to important multiplier effects, as well as helping to provide non-seasonal income opportunities. However, the strength of multiplier effects depends critically on supply response, which is often muted by the constraints facing both farmers and non-farm producers. Policies to strengthen supply response are thus critical, in finance, technologies, skills and market information. Such policies are discussed in greater detail in Section C.
4. the gender dimension: empowering rural women
As discussed in Chapter 4, tackling the constraints faced by rural women and closing the gender gap in agriculture are key elements of rural structural transformation and improving the supply response to new opportunities and incentives. This is not a stand-alone issue, but needs to be an integral part of any rural development strategy. Many of the disadvantages faced by rural women and female-headed households, although they arise from gender-specific constraints and cultural norms, mirror those of other disadvantaged and excluded groups, or of poorer and underresourced households more generally (Chapter 4, Section D). Equally, key drivers of the gender gap in agriculture — access to land, labour, inputs, extension and other supply-side services, credit, markets and human capital — closely reflect the major constraints on agricultural upgrading (World Bank, 2007).
These overlapping issues need to be addressed through gender-sensitive approaches in this broader context, to ensure that women benefit. For example, effective enforcement of labour rights is particularly important for women. While ILO has developed an extensive body of rules to protect and enforce women’s labour rights, many rural women face binding socioeconomic constraints to seeking redress and protection against abuse and exploitation, in both traditional and non-traditional activities, ranging from lack of legal awareness to social exclusion.
…but other subsectors are also important, to generate employment
in the agricultural low season.
Gender needs to be an integral part of any rural development strategy.
Policies to strengthen supply response are critical to maximize
multiplier effects.
137CHAPTER 5. Transforming Rural Economies in the Post-2015 Era: A Policy Agenda
Box 5.1. Agro-industries and global value chains
Export-oriented agro-industries may provide new and better employment opportunities in rural areas; provide a route out of poverty, not least for women; and contribute to diversification of the rural economy. However, incentives must be proactively shaped for this to occur (FAO, IFAD and ILO, 2010a).
In Democratic Republic of the Congo, for example, the Government has recently created a number of agro-industrial parks based on public-private partnerships to attract foreign investment, anticipating participation by smallholder farmers and cooperatives. Such approaches may bring significant employment opportunities, particularly for women, provided gender concerns related to the quality and security of the employment generated are taken into account (UNDP, CAADP and NEPAD, 2013). When seeking investors for agroprocessing zones, governments should carefully weigh any short-term benefits of easing labour standards in attracting investors against the long-term costs in terms of health and safety standards, workers’ rights and constraints on raising incomes above the poverty line (UNCTAD, 2014a).
Another avenue is to link small farmers (individually or in groups) to agricultural value chains. Contract farming or out-grower schemes for high-value produce can offer significant opportunities for small farmers, provided adequate support measures are in place to help them overcome the multiple technical and financial constraints they face in upgrading and scaling up their production and meeting demand requirements. Processing factories can play a pivotal role in turning small farms into viable and efficient enterprises through the extension of appropriate financial incentives and support services. Innovative supply-chain finance schemes may also provide a useful complement to direct public backing for finance, reducing the cost of credit by transferring default risk from small producers to commercial off-takers (buyers and local processing factories) better equipped to sustain it.
This is of particular importance to women farmers, and off-takers can act as catalysts for the empowerment of rural women by structuring their procurement in a way that favours women farmers and by providing extension support, quality inputs and finance. However, sourcing from plots managed by women is often perceived as risky, and out-grower schemes are often arranged with male farmers: While women are generally involved as family labourers, it is men who control the contracts (FAO, 2011). In Senegal, for example, only one woman was found in a sample of 59 farmers contracted to produce French beans for the export sector (Maertens and Swinnen, 2009).
The issues raised above largely reflect the very unequal bargaining power between large buyers and scattered peasant producers, and the tendency of large buyers to favour larger and more commercially-oriented farmers, to the detriment of smaller and female farmers. Harnessing value chains to provide opportunities for smaller and women farmers thus requires appropriate monitoring mechanisms and incentives; and benefits depend on their sustainable integration into the chain, as well as ensuring that the contracted acreage does not crowd out production of staple food crops for home and local consumption (Dolan, 2001). Public sector intervention may therefore be necessary to structure incentives for off-takers to include smaller and female farmers in their procurement, widening bilateral contractual relationships between farmers and off-takers to triangular public-private partnerships including the public sector.
More generally, profits from GVCs are heavily concentrated in the entities that control them, and in downstream activities such as distribution and retailing; and LDCs (particularly more remote island LDCs and landlocked countries) face numerous structural disadvantages in competing for GVC segments. Consequently, greater potential benefits to development may be available in the long term from establishing supplier-led value chains than in competing for segments of chains led by transnational corporations (TNCs). A key issue is control of “brand”, which in part underlies the beneficial impact of tourism (the destination itself being a brand) and of national reputational advantages in agricultural supply. Value chains based on products subject to geographical indications offer one approach.
There may also be benefits in bypassing existing value chains, by establishing direct linkages between individual suppliers (or producers’ associations) and distributors in other countries. This may be facilitated by the spread of electronic communications and the Internet, as well as diaspora networks.
In other areas, disadvantages arise directly from sociocultural gender norms, for example concerning asset ownership and inheritance, access to education and engagement in particular economic activities. In such cases, more proactive gender-specific or gender-redistributive measures are needed. This applies particularly to women’s land rights, which are often constrained more by cultural norms than by law. It is therefore important that land registration and titling systems are designed to secure women’s land tenure (Carpano, 2011; World Bank and ONE, 2014; UNCTAD, 2014b; UN Women and OHCHR, 2013).
However, land rights are a particularly complex area, and policy interventions need to be carefully crafted to take into account the local conditions (e.g. land shortage in some areas) and often deeply entrenched sociocultural norms. Gender sensitivity is essential in such processes, as the perception that policies are antagonistic to men may risk further marginalization of women, through social pressure and social exclusion. Such risks may be reduced by identifying
Gender-specific measures are needed to deal with gender
disadvantages arising directly from sociocultural norms, but gender
sensitivity is essential.
The Least Developed Countries Report 2015138
male champions — men of high social standing, including local leaders — to promote women’s land rights. Where customary norms are strong, it may also be beneficial to hold some village meetings separately for men and women, to allow them to speak more freely.
Co-titling and individual titling for women can be encouraged by offering financial incentives (e.g. fee discounts) and/or streamlined procedures to prospective owners who accept their (formally or customarily married) wives as co-owners, and to divorced, separated or widowed women. Co-titling can also be mandated by law, as under Rwanda’s Land Tenure Registration programme. Gender aspects should be considered in all steps of the registration process: Both men and women should be included in the process of identifying individual owners and boundaries of plots for registration, and in teams charged with their delimitation; and the names of all family members should be included in registration.
Women’s ‘time poverty’ — a critical constraint to opportunities for developing non-farm activities — can be reduced by enhancing access to locally appropriate time-saving technologies and equipment attuned to women’s strength, requirements and needs, as well as mobilizing additional labour on women’s plots (Carr and Hartl, 2010; World Bank and ONE, 2014). Appropriate interventions may include financial incentives (e.g. vouchers, cash transfers or discounts) for hiring or buying appropriate equipment, and incentives for women farmers’ associations and cooperatives to procure equipment collectively and for suppliers to extend services to female farmers (World Bank and ONE, 2014). Efforts to ease women’s double burden as workers and family care providers can also contribute, and may be facilitated by social partners such as health services, producers’ associations and women’s networks.
5. kiCk-starting rural eConomiC transformation
Despite the potential for a virtuous circle of agricultural upgrading and rural diversification leading towards sustainable rural development and accelerated poverty reduction, such a process has not taken root in most LDCs. This partly reflects the need for more effective policies to promote small-scale agriculture and non-agricultural sectors, and to strengthen the synergies between them. However, it also indicates a need to identify means of kick-starting the process, to initiate what should be a largely self-sustaining process once initiated.
Ideally, such kick-start mechanisms should be administered on both the demand side and the supply side. There are numerous policy interventions that can contribute to the necessary increase in supply capacity and improved supply response. Policy approaches in the areas of finance, technology, skills development, enterprise promotion and institutions are discussed in greater detail in Section C below.
Rural electrification can provide an additional boost. The very low levels of access to electricity in almost all LDCs, especially in African LDCs and Haiti (Figure 1.7(a)), is a major constraint on the development of non-agricultural activities, and imposes serious limits on productivity and competitiveness (UNCTAD, 2014a, box 5, p. 133). Thus the major acceleration in the rate of rural electrification implied by the 2030 Agenda has a potentially transformative supply-side effect on rural economic diversification, by simultaneously increasing the potential for local non-agricultural production and increasing the productivity, competitiveness and viability of existing enterprises.
The major increase in infrastructural investment also offers the potential for a corresponding kick-start on the demand side. As discussed in Chapter 3, public
Women’s land titling can be encouraged by financial incentives
and/or streamlined procedures.
Rural electrification has a potentially transformative supply-side effect.
Demand- and supply-side kick start mechanisms can initiate a largely self-sustaining process of rural
transformation.
139CHAPTER 5. Transforming Rural Economies in the Post-2015 Era: A Policy Agenda
investment in labour-intensive construction projects and local procurement can both increase wage incomes (increasing local demand for food and other consumption goods and services) and generate demand for local supply of construction materials and construction-related services. The benefits to village economies of investments in local rural hubs (e.g. construction or expansion of schools and health facilities) and of infrastructure development in rural towns can be strengthened by recruiting the workforce from surrounding rural areas as well as the hub or town itself. As well as demand effects, this can foster greater contacts among local economies, and spread the longer-term benefits of skills acquisition more widely.
Since such investment will necessarily be financed largely from outside the rural economy (given the insufficiency of local resources in rural areas of LDCs relative to the scale of investment required), it will have an effect comparable to a temporary increase in exports, with similar multiplier effects.1 In this context, the use of labour-based construction methods and local procurement (where possible) is equivalent to increasing the labour intensity and local value added of such exports. The boost to local economic demand would in many cases be substantial relative to the size of local economies.
In remote and isolated areas, the acquisition, processing and storage of local food security stocks may provide a secondary demand-side driver of rural transformation. Purchasing surplus supplies of staple foods with public funds when production exceeds local consumption needs can provide an additional injection of income into the local economy. In the longer term, the maintenance of such stocks would also remove an important obstacle to diversification by stabilizing prices (increasing demand when there is excess supply and increasing supply when there is excess demand), while also providing greater assurance of food access in subsequent years.
6. seQuenCing investments and interventions
The combination of a substantial demand-side boost and constraints on supply response highlights the need to phase investments and interventions in such a way as to ensure that demand does not outstrip local supply capacity. As discussed in UNCTAD (2014a, Chapter 5), different infrastructure investments have different effects on demand, supply and openness. By focusing initially on investments (notably electrification) that primarily affect supply and productivity, and on policies and interventions that promote more effective supply response (e.g. enterprise promotion, training, finance and access to inputs), the ground can be prepared to enhance the supply response for investments that have a greater potential for demand generation (e.g. roads, sanitation, water supply via wells or rainwater harvesting, construction of schools and health facilities). The combined effect can provide a more solid foundation for a net positive effect from opening the economy to wider markets and competition when roads are completed.
The impact of infrastructure investment can also be enhanced by prior implementation of related interventions. For example, opportunities for local employment and procurement in infrastructure construction can be enhanced through prior implementation of training programmes in construction-related activities and support to the development of enterprises producing construction materials.
Sequencing of investment in transport infrastructure itself may be beneficial as well. As discussed in Chapter 3, improving transport infrastructure creates both opportunities and threats for rural producers. The opportunities arise from access to a larger market, while the threats arise from exposure to unequal
Labour-based infrastructure investment and local procurement can provide an important demand-
side kick start.
Sequencing of investments and interventions is important, to
maximize their development impact.
In remote areas, acquisition of food security stocks can provide a
secondary demand-side driver.
The Least Developed Countries Report 2015140
competition with larger, established and advantaged urban producers. To survive and thrive in the new environment, producers must be able both to exploit the new opportunities of the wider market and to withstand exposure to competition from larger established suppliers, by expanding production, harnessing economies of scale, adopting new technologies and marketing goods in new markets.
This requires proactive measures to prepare local producers for this new environment. As well as improved economic infrastructure, such measures include policies to ensure access to affordable finance, production technologies and inputs; training in financial, business and vocational skills; and fostering a favourable institutional environment, for example by facilitating the emergence and strengthening of producers’ associations and cooperatives. Such policies are discussed in greater detail in Section C below.
In this context, it may be beneficial to focus initially on construction of roads between local hubs and surrounding areas and between local hubs themselves. In this way, the size of the market can be enlarged progressively, while competition remains among producers with similar endowments (and similar challenges). By providing some of the benefits of market opening while limiting the shock of exposure to competition from established producers with much greater economies of scale, this would help producers to exploit economies of scale and prepare them for the more demanding competition entailed in competing with much larger producers. It can thus provide a stepping stone to the wider opening associated with improved transport to more urbanized areas.
There are also synergies between such sequencing of transport investment and social goals such as access to health and education, as well as access to extension services. Increasing school attendance and health-service provision will entail more travel between rural areas and local hubs (and in many cases construction of new schools or facilities in such hubs). This will both require improvements in accessibility of hubs from surrounding areas, and almost certainly contribute to an acceleration in their growth.
This suggests three broad phases of a post-2015 process of rural economic transformation, the first focusing primarily on creating the preconditions for effective supply response; the second on demand-creating infrastructure investment, including in local rural roads, and increasing supply capacity; and the third on improving transport connections with urban areas, while further strengthening the capacity of rural producers to compete with their urban counterparts.
C. Key policy areas for rural transformation
1. finanCing produCtive investment
Alleviating capital constraints on small farms and rural enterprises is critical to rural economic transformation. Possible approaches include provision of credit or grants by public agencies, commercial microfinance and vertical integration of smaller with larger firms (Wiggins, 2014). However, the weak evidence of positive effects of microcredit, and the possibility that it may in fact have negative impacts (Chapter 3), suggest that it is far from a panacea. This highlights the need for an active search for more effective means of financing small-scale productive investment, and a more systematic and objective assessment of the effects of microfinance (Duvendack et al., 2011), including in the very particular context
Investment in transport infrastructure may usefully focus initially on
transport within rural areas and later on rural-urban linkages.
Microcredit is far from a panacea: more effective mechanisms for
financing small-scale investment should be sought.
141CHAPTER 5. Transforming Rural Economies in the Post-2015 Era: A Policy Agenda
of rural areas of LDCs. Similarly, the risk of dispossession and impoverishment associated with the use of land as collateral in already poor rural communities indicates a need for caution. Warehouses issuing negotiable receipts for crops, which can be used as collateral for short-term finance, could provide a more satisfactory alternative (Beck et al., 2011, p. 124).
Use of microcredit to upgrade “survivalist” non-farm activities is particularly inappropriate, given their low productivity and limited potential for expansion. Economies of scale in lending suggest that larger loans to SMEs are likely to be more beneficial. More dynamic small farms and growth-oriented microenterprises in peri-urban and intermediate rural areas may also be able to benefit from access to credit, although cost and risks remain important issues. A possible approach is to provide conditional interest rate subsidies on microcredit — for example, where the market rate on microcredit is 40 per cent per annum, an interest subsidy of 30 per cent could be provided, conditional on the interest rate to the borrower not exceeding 10 per cent. The greater assurance of payment this would provide to lenders might also make it possible to require a minimum repayment period. This could leverage private financing more effectively and greatly increase the uptake of microcredit, while minimizing its potential negative impacts.
Training in financial literacy and business skills and assistance in preparing viable business projects are an essential precondition to credit-based financing, particularly where education is limited, so as to limit risks (to creditors and borrowers) and increase returns on investment. Credit-based schemes should therefore be closely linked with training and/or mentoring. Cooperatives, producers’ associations and women’s networks can play a major role in this regard. They can also help to improve access to credit and reduce its cost by acting as intermediaries or guarantors for borrowing by members, or through credit-and-loan arrangements among members. Such activities can also provide an important mechanism to leverage and strengthen such networks.
Ensuring equal access to finance for women and men is a significant aspect of overcoming gender constraints in rural development. However, the primary means of doing so is to mainstream gender into core programmes and policies, as schemes that target exclusively women arbitrarily exclude vulnerable men and may cause male resentment. Targeted interventions may nonetheless have a role in specific contexts where women are a marginalized social group (FAO, 2002); and the establishment of publicly backed schemes oriented towards women, though important, is not sufficient for this purpose (UNCTAD, 2014b). Effective targeting of rural women may also require measures such as informal guarantees (e.g. group lending and liability and other trust relationships) or collateral and more lenient repayment terms.
The potential for mobile phone-based payments systems to reduce transaction costs strengthens the case for investment in extending networks. Combined with increasing investment opportunities through rural development, this could contribute substantially to increasing the scale of lending opportunities to a level sufficient to attract commercial lenders to rural areas. Such systems can also enhance business viability by increasing access to market information, and facilitate and reduce the cost of remittances from migrants in urban (and other rural) areas and abroad (Maloumby and Kingombe, forthcoming; Wiggins, 2014).
In remote and isolated areas, economies are often oriented mainly towards subsistence production, so that commercial activity and monetization are limited. In such conditions, microcredit is unlikely to provide a viable option, even with conditional interest rate subsidies. Here, there may be a case for in-kind microgrants of productive inputs: Each household could be offered a
Interest rate subsidies, conditional on an interest rate cap, could
increase the developmental benefits of microfinance.
In remote areas, in-kind microgrants of productive inputs can
combine financing with access to technologies and selective opening
of local economies.
Training in financial literacy and business skills is an essential precondition for microcredit.
The Least Developed Countries Report 2015142
choice of locally appropriate agricultural inputs, with advice on their use, or equipment or materials for non-agricultural production, up to a specified value, delivered annually ahead of the planting season. This would have the combined effect of financing investment in agricultural upgrading, which would otherwise be problematic in a largely demonetized local economy, providing access to technologies that would otherwise be unavailable, and engineering a selective opening of the economy to productive inputs.
While the costs of such an approach would be substantial, few other options can be envisaged for transformation of remote and isolated rural areas of LDCs, which is essential to poverty eradication globally. This would justify the funding of such schemes from additional ODA (Section D.1), although a few fuel-exporting LDCs may be able to do so from resource rents. The net effect on the overall cost of achieving the SDGs could be reduced by combining input deliveries under microgrant schemes with other local-level activities necessary to the SDGs more broadly. A concerted effort to meet the SDGs would require baseline surveys and assessments of local needs and options (e.g. for water and energy supply); and progress towards health and education goals could be accelerated by early identification of potential village health workers, educators and trainees. Combining such activities with input deliveries under in-kind microgrant schemes would allow overall costs to be reduced significantly through economies of scale. Early deliveries would also provide an opportunity to identify possible future development opportunities, such as natural resources (e.g. for construction materials), and crafts and foods with a wider potential market.
Over time, as productivity increases and the local economy becomes more commercialized, it should become possible to make a transition to (subsidized) microcredit or cash sales, for example by reducing the value of free goods provided while allowing additional amounts to be purchased on credit. In most cases, given the importance of ensuring supply of basic foods and the role of inadequate staple production as a driver of “survivalist” off-farm activities, the emphasis should initially be on increasing staple productivity, but with increasing emphasis on inputs for higher-value crops and non-farm production as staple production and incomes rise.
2. harnessing teChnologies for agriCultural transformation
As well as financing, access to productive technologies — both in agriculture and in non-farm activities — is central to increasing productivity and promoting structural transformation. In agriculture, the diversity of local economic and agroecological conditions means that local appropriateness of technologies is critical. This means that technological upgrading cannot be a simple top-down process; rather, it should be based on an interaction between producers and those who develop and disseminate technologies.
Agricultural extension services are central to technological upgrading in agriculture, in order to provide access to locally appropriate agricultural technologies and the inputs and knowledge required for their effective use. Strengthening extension services is therefore a high priority in rural development strategies. However, the importance of local appropriateness (and of early technology adoption by disadvantaged producers, as discussed below), suggests that extension may be more appropriately viewed as an intermediary in a two-way process between R&D agencies and producers, rather than as a one-way channel for technology delivery. As well as providing access to locally appropriate technologies, extension workers can identify and share with R&D agencies the needs of local producers in their areas, and successful local innovations and adaptations of technologies, to facilitate better-targeted
Input deliveries under microgrant schemes could usefully be
combined with other SDG-related activities.
Agricultural extension should be a two-way process between R&D
agencies and producers.

143CHAPTER 5. Transforming Rural Economies in the Post-2015 Era: A Policy Agenda
R&D and wider sharing of approaches among producers. The development of effective communication systems oriented towards ensuring that R&D activities address the needs of small farmers could thus significantly enhance the effectiveness of both R&D and agricultural extension, as well as information-sharing among extension workers themselves. Effective and innovative use of ICTs has a particularly important role in this regard.
A POST approach to rural development also requires ensuring that access to extension services is not skewed away from smaller, poorer and women farmers, so as to promote their early adoption of more productive agricultural technologies. Without such efforts, early adopters are generally better-off producers, who have more resources for investment, better access to credit, greater capacity to bear investment risks, and often higher levels of education and better access to extension services. This is problematic from a poverty perspective, because the direct benefits of new technologies accrue largely to early adopters, who have a first-mover advantage: They are able to increase their production while total supply remains relatively unchanged, so that their output increases outweigh the reduction in prices resulting from increased overall supply. As use becomes more widespread, supply increases more, reducing prices more substantially, so that later adopters gain less, and the incomes of non-adopters are reduced.
Those with higher levels of education also achieve greater increases in output from the adoption of a given technology than those with less education (Foster and Rosenzweig, 2010); and commercial incentives for R&D often skew their benefits towards larger-scale production. As well as limiting the poverty-reducing effect of technological upgrading (and potentially even having perverse effects), such factors may reduce multiplier effects by concentrating income gains among higher-income households, who typically buy fewer local goods where other options are available.
Pro-poor targeting of extension services can be enhanced by proactively recruiting and training more women and small-scale farmers, particularly from remote areas, as extension workers, and by ensuring that training reflects the particular needs of women and other underresourced or disadvantaged farmers, and of remote and isolated areas. Women’s involvement, as providers and beneficiaries of extension services, can be facilitated by ensuring that schedules for training of and by extension workers reflect constraints on women’s time use.
Technology adoption can also be encouraged by identifying and supporting local volunteer farm advisers, specifically including women, who regularly meet with extension agents and transfer information within their social circles. Producers’ associations and cooperatives can also play a role in encouraging the adoption of new technologies and dissemination among their members of information on locally appropriate use of inputs. In areas with mobile coverage, mobile phone applications can be another valuable tool, and should include applications specifically oriented to the particular needs of women farmers and other disadvantaged groups (World Bank and ONE, 2014).
Subsidy schemes for agricultural inputs can help to promote the adoption of higher-productivity technologies involving greater use of locally appropriate purchased inputs (Druilhe and Barreiro-Hurlé, 2012). Where there are marked differences in commercialization or ability to pay for inputs, targeting subsidies towards those unable to pay market prices, for example through appropriately designed voucher systems, may be beneficial where this can be done cost-effectively.
Input subsidies are most effective if based on wider packages of inputs and complementary services (e.g. extension services, improved seeds and appropriate fertilizers and pesticides) covering the full range of agroecological
It is important to ensure that extension services are not skewed
away from smaller, poorer and women farmers.
Appropriate recruitment and training policies can improve pro-poor targeting of extension services.
The Least Developed Countries Report 2015144
contexts and farming systems. Such a package approach can help to overcome the tendency of small farmers to adopt single technology components, limiting productivity benefits, and to ensure availability and appropriate use of inputs. Over time, demonstration effects increase awareness of the benefits of greater input use; and, coupled with the additional incomes generated, this will increase input demand and help to foster the development of input markets. Provided procurement and distribution are designed to complement market development and not to suppress it, this should allow subsidies to be phased out over time, though over a very long period where agricultural commercialization is limited, notably in remote and isolated areas.
Input use may also be encouraged by measures to tackle scale issues in supply (World Bank and ONE, 2014). Fertilizers, for example, are generally sold in quantities too large for smaller producers (typically, 50-kg bags). Access could thus be enhanced by encouraging supply in smaller quantities, for example through collective procurement by producers’ associations on behalf of their members, or encouragement of commercial resale in retail quantities.
3. human resourCes
Increasing educational access and quality, as envisaged in the SDGs, is also critical to structural transformation, and can be expected to yield considerable dividends in the long term, particularly if basic education motivates students, equips them with the skills needed for the labour market and enables them to benefit from further training (World Bank, 2007).
However, these benefits are inherently long-term in nature; and in many rural areas of most LDCs, especially beyond the peri-urban, most adults have had at best limited educational opportunities. Consequently, adult education is equally important. Particular priorities are basic literacy and numeracy, vocational skills relevant to rural economies, and financial literacy and business skills. Adult education for women is of particular importance: Even in those LDCs that are approaching or have reached gender parity, access to education has historically exhibited a substantial male bias, leaving most women significantly disadvantaged relative to their male counterparts. A number of rural adult education programmes, with flexible class schedules attuned to the needs of female farmers, have yielded positive results in specific contexts (World Bank and ONE, 2014).
A key aspect of promoting more vibrant and entrepreneurial rural economies is the development of the functional competencies essential to successful microenterprise and entrepreneurial agriculture, such as basic record-keeping, sustainable production methods and marketing skills. Such skills are particularly important where enterprise development is financed by credit. Possible approaches to the development of such skills include mobile training units, extension schemes and community-based modules (FAO, IFAD and ILO, 2010b and 2010c). In many cases, however, development of basic literacy and numeracy skills will be a precondition. As discussed in Section C.4 below, higher-level business skills will become increasingly important as rural economic transformation progresses.
An early priority for training in vocational skills in the post-2015 context is in construction-related activities such as carpentry, metal-working, stone-cutting, brick-making, bricklaying, etc. (depending on local resources and construction traditions). Employing local workers in skilled occupations both increases the demand impact and provides an additional human-resource legacy, as the experience of engagement in infrastructure construction helps to enhance and consolidate skills, including those required for maintenance and repairs. India’s
Input subsidies are most effective if based on wider packages of inputs
and extension services.
An early priority for vocational training is construction-related
activities.
Adult education is as important as schooling for children, and should include financial literacy, business
skills and vocational skills.
145CHAPTER 5. Transforming Rural Economies in the Post-2015 Era: A Policy Agenda
Barefoot College provides a valuable model for such training, supported by South-South cooperation (box 5.2). Equally, using local materials in construction where possible, as well as contributing to the demand-creating impact, can help to ensure that the skills developed are locally relevant and continue to provide a basis for incomes beyond the initial investment phase.
These human resource benefits can be enhanced by explicitly including an on-the-job training component in infrastructure investment projects, and by providing training after their completion to facilitate the application of the skills acquired to activities for which there is likely to be continuing demand (e.g. maintenance; construction and repair of domestic housing; production of construction materials; tool-making and repair; and small-scale manufacturing).
Training electricians and mechanics is another priority ahead of the installation of electricity and water supply, to maintain and repair supply equipment and electrical appliances as they are adopted (as well as other equipment, e.g. in transport and agriculture): Reliance on service providers outside the immediate rural area risks creating prolonged delays in the case of equipment failure, as well as additional costs, with the potential for serious disruption of production.
Other vocational skills will also be needed to enhance productivity in existing non-farm rural activities and facilitate the introduction of new activities and new and locally unfamiliar technologies, particularly following electrification. Potential supply bottlenecks can be avoided by identifying priority sectors (as discussed in Chapter 3, Section F) and the skills gaps impeding their development in each area, and facilitating the appropriate training. Over the longer term, as rural wage-labour markets develop, labour market observatories may be beneficial in aligning the demand and supply of vocational skills (Carton and Kingombe, 2012).
Apprenticeships are often an important mechanism for intergenerational skills transfer; but some caution is required in a context of rapid economic and technological change, as they can perpetuate traditional technologies. While such technologies are of great importance in some sectors — for example, craft products for urban, tourist and export markets — they may be less useful in sectors where the primary considerations are cost and functionality. Nonetheless, as a traditional mechanism of skills transfer, apprenticeships may be useful for the spread of new skills, for example by encouraging (or requiring) those receiving vocational training to engage apprentices.
Box 5.2. Barefoot solar engineers: South-South cooperation for renewable energy
As the cost of solar photovoltaic panels has fallen over recent years, as a result of learning effects in production and increasing economies of scale, this has become a least-cost technology for electrification in many rural areas of LDCs, where low population density and limited purchasing power render grid-based centralized supply systems unviable.
As well as the investment costs and the necessary equipment, solar electrification requires skilled technicians, both for installation and for maintenance. In a noteworthy South-South cooperation programme, India’s Barefoot College provides specially adapted six-month training courses on solar engineering to illiterate or semi-literate older women (aged 35 and over) from rural communities across the developing world, who return to their home countries to install solar units. Older uneducated women are targeted, not only because they are a particularly vulnerable group, but also because they are considered more likely to return to, and remain in, their home communities. This ensures both that the benefits are more widely spread, and that they extend beyond installation to maintenance.
This initiative, supported by grants from India Technical and Economic Cooperation, has been successful in many LDCs, including Afghanistan, Ethiopia, Malawi, Sierra Leone and United Republic of Tanzania, as well as ODCs. The Barefoot College model is now also being replicated in some LDCs, including Liberia and Sierra Leone, with support from the Government of India.
Source: “The ‘barefoot’ solar engineers”, MakingIt Magazine, 11 March 2013, http://www.makingitmagazine.net/?p=6441; www.barefootcollege.org.
Human-resource benefits of infrastructure investment can be
enhanced by including on-the-job training.
Apprenticeships may be useful for the spread of new skills.
Potential supply bottlenecks can be avoided by identifying priority
sectors and filling the related skills gaps.
The Least Developed Countries Report 2015146
As well as training, consideration could be given to seeking to harness urban-rural skills transfers, by encouraging (and paying) rural-urban migrants who have developed skills in priority activities to return to their home areas to train others. This may be a particularly helpful option where language barriers are an impediment to training. It may also be beneficial to arrange temporary placement of rural vocational trainees with existing enterprises in urban (or other rural) areas to consolidate and develop their skills, although it may be necessary to require a minimum period of return to the home area following the placement.
Cooperatives, producers’ associations and women’s networks can play a valuable role as well, not only in facilitating training, but also in information-sharing and mutual learning.
4. fostering enterprise and innovation
Entrepreneurship in both agriculture and the RNFE is central to rural economic transformation, driving innovation and playing a vital role in the transmission of information on adaptation, products and processes; but in most LDCs, farmers as entrepreneurs lack the support needed to realize their full potential. Public policies, regulations, laws and norms are therefore needed to create a more enabling environment for innovation and entrepreneurship (Juma and Spielman, 2014), and to give farmers the same level of recognition and support accorded to industrial entrepreneurs. This is a key objective of the improvements in infrastructure, skills and financing outlined in Sections B.5, C.1 and C.3 above.
Improving the business environment is easiest in peri-urban areas and intermediate areas with relatively high population densities and favourable natural resource endowments. Elsewhere, the menu of interventions is more limited, especially with scarce public resources. This indicates a need both for an increased role of ODA, and for consideration of more innovative approaches such as the use of in-kind microgrants proposed in Section C.1 and the urban-rural skills transfer and use of apprenticeships as a multiplier for training proposed in Section C.3.
Fostering innovation and enterprise, particularly among primarily subsistence producers and in areas dominated by subsistence agriculture, requires placing as much emphasis on business skills as on vocational skills. In such areas, eradicating poverty within 15 years will require an extraordinarily rapid transformation, from economies in which technologies and modes of economic activity have been entrenched for generations into diversified, entrepreneurial and rapidly growing markets, in a context where educational attainment is very low and illiteracy is widespread.
Surviving and thriving in this transformed context will require a new and different set of skills. Beyond providing adult education in basic numeracy and literacy skills, a first step is to design and implement simple and effective financial literacy programmes, such as the financial education project of the Association of Church Development Projects in Ghana, the Microfinance Consumer Education Programme in Uganda, and Financial Education for Young Women in Zambia, which have had a positive impact on savings behaviour and financial awareness (Messy and Monticone, 2012).
Over time, progressively more advanced courses will need to be developed to support the creation and growth of dynamic enterprises and more commercially oriented farming, encompassing a broader range of business skills, including accessing, interpreting and acting on market information; financial planning and management; identifying investment opportunities; choosing among technology and financing options; and understanding supply and value chains.
Urban-rural skills transfers may be effected by circular migration and temporary placements with urban
enterprises.
Where subsistence production predominates, financial literacy
and basic business skills are a high priority.
147CHAPTER 5. Transforming Rural Economies in the Post-2015 Era: A Policy Agenda
The development of SMEs will require more sophisticated training to upgrade managerial skills. Successful examples include training of small suppliers of intermediate goods for processing and exporting in Madagascar, Integrated Training for Entrepreneurship Promotion in the United Republic of Tanzania and the Opportunities Industrialization Council of Ghana (World Bank, 2007; OECD and AfDB, 2008).
While policy for enterprise and innovation is often preoccupied with supply-side policies related to finance and human resources, it is equally important to address the demand side of the equation. This was an important shortcoming of policies in this area from the 1950s to the 1990s, which focused on promoting supply from individual enterprises but neglected demand, whose sluggish growth limited enterprise creation and expansion (Haggblade et al., 2007). It is thus important to learn the central lesson of this experience — that promoting parallel growth of demand and supply can have a more favourable impact on the overall climate for microenterprise and SMEs at lower cost than supply-side measures alone (Wiggins, 2014). Thus demand-side measures, such as labour-based infrastructure investment, are as much a part of policy for enterprise and innovation as finance and skills development.
Equally, demand growth will have little effect on promoting enterprise development and innovation unless it is matched with an effective supply response. As well as access to finance, technology and skills, this requires information, not only about current market conditions, but about anticipated changes — in demand patterns, technological options and competition — arising from rising incomes, electrification and improved transport infrastructure. Without such information, producers are unlikely to invest soon enough to meet increasing demand: There are considerable time lags between investment and production (inherent in the annual or semi-annual cycles of agriculture, but also because of the need to acquire equipment, inputs and skills for new RNFE activities); and the risk aversion inevitably associated with poverty (or more accurately, the extremely high non-financial risks associated with even small financial risks) is a serious deterrent to investment. Effective supply response requires investments to be made in anticipation of demand changes that may not materialize or may prove short-lived; and poorer households cannot afford to make unprofitable investments, especially where they need to be financed with credit at very high interest rates.
This need can in principle be met by estimating both the income increases likely to be generated by interventions in the local economy (e.g. labour-based infrastructure construction) and the resulting demand changes on the basis of household expenditure survey data. Providing this information as a public good, and orienting interventions (access to finance, inputs, equipment and training, extension services, etc.) to production of goods and services for which demand is expected to increase, could greatly improve supply response, and hence increase local multiplier effects.
The rapid spread of cell phone coverage in rural areas of most LDCs provides an important channel for information on local and more distant markets, and on new technologies, as well as helping to spread financial inclusion and reduce transaction costs. However, ICT is beneficial only to the extent that it is available and affordable; and its reach is further limited by low levels of literacy and the need for material to be available in (often multiple) local languages. It is therefore far from a panacea, particularly as availability is generally greatest in the most advantaged areas, and affordability and literacy considerations skew the benefits to the better-off. As discussed in Chapter 4, ICTs are also by no means gender-neutral; but they can be made more appropriate for women farmers and entrepreneurs by building on established women’s networks and taking
Demand-side measures are as much a part of policy for enterprise and innovation as finance and skills
development.
Anticipated demand increases can be estimated on the basis of expected income changes and household expenditure surveys.
Effective supply response requires information about anticipated changes in market conditions.
The Least Developed Countries Report 2015148
particular account of gender constraints and needs, such as female time and mobility constraints and social norms.
Consequently, policymakers should not allow the immense potential of ICT to distract them from the complementary role of older alternatives, notably broadcast radio. While ICTs are a better means of reaching targeted audiences, radio provides an effective means of mass communication, which, though less conducive to targeting, is more widely available, more accessible (not requiring literacy) and more affordable. Even where cell phone coverage is available, and especially where it is not, there is therefore a strong case for support to local radio stations to provide information about potential economic opportunities, agricultural and other technologies, and anticipated changes in market conditions. There is also a strong case for ensuring access to radio sets through subsidization and/or free distribution.
5. institutions
The scale and the nature of the economic transformation needed in rural areas of LDCs clearly point to the need for a developmental State (UNCTAD, 2009). Major changes will be needed in LDCs’ rural economies if poverty is to be eradicated sustainably; and the changes required go beyond overcoming market imperfections that obstruct economically efficient outcomes and limit economic growth. Important as such imperfections undoubtedly are, market forces must also be channelled towards achieving the societal goals embodied in the SDGs, in areas such as poverty, nutrition, health, education and environmental sustainability. This can only be achieved by proactive government policies and interventions, as part of a coherent overall development strategy.
Beyond the provision of health and education services essential to fulfilment of the SDGs, key priorities include support to, and appropriate policies towards, agricultural R&D, extension services and access to inputs; economic infrastructure, notably for agriculture and in the transport and communications sectors; adult education and skills development; access to finance on appropriate terms; acquisition and management of local food stocks; and access to information on prospective market changes.
The multidimensional nature, and the sheer scale and complexity, of the challenge of rural economic transformation make effective policy coordination essential. As noted in Chapter 1, rural development clearly cannot be considered in isolation from urban development. However, the two are very different in nature. Moreover, the 2030 Agenda for Sustainable Development both increases the relative importance of rural development, and widens still further the difference between the development models needed for rural and urban areas.
In practice, however, the long-observed urban bias in policymaking persists, and rural development policy is generally focused primarily on agriculture, while the RNFE is “orphaned”, lacking any specific public agency responsible for its development, any effective mechanism for policy coordination and any organized interest group to promote it. Responsibility for the RNFE is often divided across ministries of agriculture (for agroprocessing), industry, commerce, business development, etc., and regional public institutions, while rural social and economic infrastructure falls to ministries of works, health, education and transport. Even where ministries of rural development exist, their primary focus is generally on social investments and agriculture (Wiggins, 2014).
This indicates the need for an effective interministerial coordinating mechanism, including all relevant ministries, and chaired by the head of government or someone at the highest level of government, to establish a
Despite the potential of new ICTs, older alternatives such as broadcast
radio still have an important role.
An effective interministerial coordinating mechanism is needed.
A developmental state is needed to channel market forces towards
societal goals.

149CHAPTER 5. Transforming Rural Economies in the Post-2015 Era: A Policy Agenda
comprehensive and coherent strategy for rural economic transformation; to monitor performance; and to ensure that timely remedial action is taken.
By its nature, however, rural development is as much a local process as a national one, requiring action at subnational levels down to individual villages. Consequently, decentralization of decision-making, to the extent practicable given financial and human resource constraints, is also an important aspect of effective policymaking for rural development (Wiggins, 2014). However, the potential for decentralization to the local level is limited in many remote and isolated areas: Almost by definition, areas remote from markets are at least equally remote from public institutions. Hence, the instruments directly available to public authorities to effect change at the village level are at one or two steps removed. While the key role of existing and emerging rural hubs in rural development highlights the need to develop or strengthen public institutions at this level, including through village-level extension services, the potential to do so will often be limited by financial and human resource constraints, and it is important to be realistic about their capacity and capabilities.
This underlines the importance of formal and informal organizations and networks at the local level as catalysts of rural economic transformation. Cooperatives, producers’ associations, women’s networks and extension service providers (both official and volunteers), in particular, can play a critical role in many key areas, including access to finance and inputs, technological upgrading, vocational training and learning, acquisition of business skills, harnessing economies of scale, lowering costs through collective procurement and sharing of equipment, facilitating product marketing, strengthening bargaining power of small producers, and developing more effective and equitable supply chains. Women’s networks have a particularly important role, not only in empowering women and overcoming gender-based obstacles to rural development, but also in promoting participation in other, non-gender-based (and often male-dominated) community associations and networks, and in civil society more broadly, and in the delivery of literacy and health programmes (ILO, undated).
Rural organizations and networks more generally can also help to strengthen the social capital and trust in transactions essential to the development of market-oriented economies, and provide a channel for informing and influencing decision-making (World Bank, 2007). By creating an organized constituency for rural development, they can also help to correct urban bias in policymaking.
There is therefore a strong case, not only for streamlining procedures for the establishment of such organizations and networks, but also for proactively encouraging and supporting their development through training, mentoring and promoting connections and networking among similar groups in different communities. Explicitly including organizations and networks in the delivery of interventions and services such as training, finance and input supply can play a very valuable role in strengthening and consolidating them (and incentivizing their creation), provided appropriate practical and material support is available to enable them to fulfil their designated role. International NGOs may provide an important source of such support, which would also be an appropriate use for additional ODA (Section D.1).
D. International dimensions
The 2030 Agenda for Sustainable Development represents an extraordinarily ambitious undertaking, and nowhere more so than in rural areas of LDCs. Here,
Cooperatives, producers’ associations, women’s networks and extension service providers can play
a critical role at the local level…
…and can be promoted by streamlining establishment
procedures, direct support and inclusion in service delivery.
The Least Developed Countries Report 2015150
achieving the SDGs will require increasing minimum incomes to $1.25 per person per day, from a level below a tenth of that in some areas, and providing access to water to some 600 million people, and electricity and sanitation to some 900 million in just 15 years.
These goals signal a fundamental shift in global priorities towards meeting the basic needs of all those hitherto excluded from the benefits of globalization, within planetary resources and global climate constraints. Ensuring economic as well as environmental sustainability will require a different approach to development, centred on a process of poverty-oriented structural transformation; and central to this will be the transformation of rural economies.
As well as a fundamental reorientation of approaches to rural development within LDCs, this will require major changes at the international level, most notably in development cooperation. However, as the eighteenth-century philosopher Immanuel Kant observed:
Whoever wills the end, wills also (so far as reason decides his conduct) the means in his power which are indispensably necessary thereto.
(Kant, 1873, para. 24)
This is generally translated into the philosophical principle that “to will the end is to will the means”. In adopting the 2030 Agenda for Sustainable Development and the SDGs, the international community has clearly and explicitly willed an end: that of eradicating extreme poverty and material deprivation by 2030, while ensuring environmental sustainability. Delivering on this commitment will require the members of that community to go on to will the means within their power that are essential to the achievement of that end, including the necessary changes in the international economic system and development cooperation, as well as in national policies.
1. mobilization of external resourCes
The financial costs of rural economic transformation will be very considerable, not only for infrastructure investment, but also for training and human resources development, financial support for agricultural upgrading and enterprise development, agricultural R&D, extension services, support to producers’ associations and women’s networks, etc. Adequate resources are also essential to effective policymaking, particularly with a substantial level of decentralization. While there may be some scope for harnessing private-sector financing for some of these uses, most of these resources will in practice need to come from the public sector,2 and in many cases public funding will be needed even to catalyse private investment.
In principle, such expenditures — especially recurrent expenditures — should come from domestic sources as far as possible; and building the revenue base of the public sector, through widening the tax base, diversifying revenue sources and strengthening tax administration is essential. Improved global governance of taxation could also make a substantial contribution, by limiting the scope for tax avoidance and evasion and for abuses such as transfer-price manipulation (UNCTAD, 2014a, p. 137). One or two LDCs may be able to generate a substantial proportion of the resources required in the next 15 years by harnessing large-scale resource rents from energy exports; and a few others close to transition may also have sufficiently favourable economic prospects and sufficiently limited needs and low costs to bear a significant part of the costs before 2030.
The SDGs will require major changes at the international level, as well as a fundamental reorientation
of development approaches.
The financial costs of rural economic transformation will be very
considerable.
Delivering on their SDG commitments will require all members of the international
community to “will the means” needed to achieve the goals.
151CHAPTER 5. Transforming Rural Economies in the Post-2015 Era: A Policy Agenda
In the great majority of LDCs, however, meeting the public financing needs of achieving the SDGs sustainably will undoubtedly need to be met from ODA. In principle, part of the public financing needs of rural transformation could be met by borrowing on international markets; and, with insufficient ODA, current very low interest rates may make this appear an attractive option to those LDCs with market access. However, the experience of the 1980s debt crisis affecting many LDCs — which extended well into the twenty-first century in many African LDCs — amply demonstrates the dangers of commercial borrowing to fill large financing gaps left by inadequate ODA (Woodward, 2013, pp. 18–19, 32–38). With the possible exception of those with large-scale resource rents from energy exports, this is unlikely to be a viable or sustainable option for LDCs.
Target 17.2 of SDG 17 is for “developed countries to implement fully their ODA commitments”, including commitments to provide 0.7 per cent of GNI in ODA to developing countries and 0.15–0.20 per cent to LDCs. However, a strong case can be made for increasing the latter percentage well beyond 0.2 per cent. LDCs account for some 40–50 per cent of global needs to meet the SDGs in terms of extreme poverty and increased access to water and electricity; and their ability to finance SDG-related infrastructure investment is much more limited than that of ODCs.
In the context of the 2030 Agenda for Sustainable Development, this presents a strong case for increasing the target for ODA to LDCs to at least half of the overall ODA target — that is, to 0.35 per cent of donor GNI. This would increase the amount from an actual level of around $40 billion in 2013–2014 to some $165 billion per annum in 2015 and $250 billion per annum by 2030, broadly commensurate with the increase in rural infrastructure investment needed to fulfil the SDGs (chart 1.12). This should not, and need not, prevent a major increase in allocations to other developing countries, which will also have substantial needs for infrastructure and other investment in order to achieve the new goals: Provided the 0.7-per-cent target is also met, such an increase in ODA to LDCs could be achieved while also expanding total ODA to ODCs by around 150 per cent over the same period.
While such an increase in ODA will be essential to achieve the rural economic transformation needed to meet the SDGs sustainably, it is important to ensure that it reduces financial dependency rather than increasing it. This further underlines the importance of ensuring that ODA contributes to a solid economic development process, rather than seeking to address human development needs through stand-alone measures, so as to generate the domestic public and private resources needed for a self-sustaining development process.
The composition of aid flows also needs to be carefully examined. The MDG-led focus on human development has allowed a very welcome reduction in the underfunding of social sectors; but, in combination with the continued failure of most donors to fulfil their existing commitments on total ODA, it has diverted resources away from productive sectors (UNCTAD, 2014a, Chapter 2). This neglects the need for a process of poverty-oriented structural transformation to make gains in human development economically sustainable. This imbalance can be rectified, while continuing to increase the funding for social sectors (which is also essential to achieving the SDGs), by directing a substantial proportion of additional aid to productive sectors, particularly in rural areas. Support to agricultural R&D and extension, technology adoption and human resources development are particular priorities. The need to reduce financial dependency also highlights the importance of strengthening governments’ capacity to raise public revenues as a high and early priority for ODA allocations.
Support to improved collection and processing of data on rural communities and economies can also contribute significantly to effective policymaking (box 5.3).
In the great majority of LDCs, the costs of achieving SDGs substantially will need to be
met from ODA.
A substantial proportion of additional aid should be directed to productive sectors, particularly in
rural areas.
A target of 0.35 per cent of donor GNI for ODA to LDCs would
increase flows from $40 billion to $250 billion by 2030.

The Least Developed Countries Report 2015152
Aid effectiveness is another key issue, and as much a part of the donor commitments referred to in target 17.2 (under the 2005 Paris Declaration, the 2008 Accra Agenda for Action and the 2012 Busan Partnership3) as amounts and allocations. There is a growing consensus around the principles established in these agreements to eliminate tying, to reduce the unpredictability of aid flows, to deal with the fragmentation of flows among sources and destinations, and to transfer ownership of aid programmes to recipient countries. However, although the measures taken as part of the aid effectiveness process are encouraging, much more progress is needed to realize these ideals, particularly to strengthen mutual accountability and country ownership.
It is also important to ensure that ODA conditionalities provide the policy flexibility needed for recipient countries to pursue nationally appropriate strategies and to allow opportunities for learning and experimentation. Other issues of particular relevance to the policy options discussed in this chapter are untying aid to allow local procurement (and to ensure that procurement processes are not biased against local providers, particularly SMEs); encouraging the adoption of labour-based methods in construction; ensuring that rural infrastructure projects are timed to coincide with seasons of low labour demand; and ensuring that the sequencing of rural infrastructure development maximizes the long-term effect on rural transformation.
China and other emerging economies are now providing considerable financial assistance to African LDCs, much of it for transport infrastructure. This support generally takes the form of grants and low-interest loans to countries with low credit ratings. China Development Bank, the largest of the country’s three policy banks, has reportedly granted more loans to Africa as a whole over the past six years than the World Bank, the African Development Bank and the Asian Development Bank combined;4 and the Chinese Government has indicated that it will provide $1 trillion in financing to the continent by 2025, including support from State-owned banks (Alessi and Xu, 2015).
Resources on this scale could go a considerable way towards meeting the rural infrastructure needs of LDCs in the region, although appropriate debt management will be necessary to avoid over-indebtedness. However, the
Box 5.3. Better rural data for better rural policies
Statistics are vital to assess the social and economic situation of the inhabitants of an area, to design policies and interventions effectively and to assess policy impacts. However, as discussed in Chapters 3 and 4, statistical information on rural areas is scarce, and its interpretation problematic, despite significant improvements in access to reliable and relevant national statistics more generally in several LDCs. Population and housing censuses and national household surveys provide a broad approximation of the development in rural areas but do not furnish sufficient depth of information to give a complete picture of rural life and economies in LDCs. Even data on basic indicators such as non-farm employment and income sources in rural areas are not systematically collected or published, and are unavailable or outdated for the great majority of LDCs.
In light of the critical importance of rural development, ILO is conducting an innovative project on decent work in the rural economy. It has prepared an in-depth inventory of national definitions of rural and urban areas, on which basis it has used the Labour Force Survey to construct a set of disaggregated indicators of decent work (e.g. employment, unemployment and labour force by sex, age and geographical area). Another important data source is agriculture censuses conducted under the umbrella of the FAO World Programme for the Census of Agriculture, which have been or are to be conducted in several LDCs (including Afghanistan, Angola, Cambodia, Chad, Gambia and Lesotho).
While financial and human resource constraints make external support essential, national prioritization of rural data collection is also important. Building national capacities for data collection and analysis and effective use of ICT, with the support of international organizations and donors, can make a major contribution. For example, scanning technology allowed a major reduction in data capture time in Malawi’s 2008 Population and Housing Census. While this required a substantial amount of human and financial resources, due to inadequate monitoring and supervisor training, learning lessons from this and other experiences can reduce such costs and increase effectiveness in the future (Msosa, 2009). This points to a need for increased sharing of such lessons among LDCs.
Aid effectiveness is as much a part of donor commitments on ODA as
amounts and allocations.
Much more progress is needed to strengthen mutual accountability and recipient country ownership.
153CHAPTER 5. Transforming Rural Economies in the Post-2015 Era: A Policy Agenda
developmental impact could be enhanced by increasing the focus on rural feeder roads relative to transport corridors, and by increasing the use of local labour, including at supervisory, technical and managerial levels.
Purpose-specific funds may have a role to play in priority areas such as women’s empowerment. UNCTAD (2014a, pp. 146–149) has proposed Female Rural Entrepreneurship for Economic Diversification (FREED) as an international support mechanism to promote women’s engagement in the non-farm sector. In the agricultural sector, the World Bank and the ONE Campaign have proposed a challenge fund to provide technical assistance to African policymakers for the implementation of policies to support women farmers (World Bank and ONE, 2014). This might usefully be extended to encompass non-African LDCs, and could be linked to the Aid for Trade initiative and the Enhanced Integrated Framework, to engender these frameworks and marshal resources through them. More generally, gender considerations should be included in the formulation and implementation of existing funds, as in the African Development Bank’s Agriculture Fast Track Fund.
In relation to commercial financing, less conventional forms of cross-border investment such as diaspora investment may offer greater potential than traditional FDI to finance rural infrastructure investment in LDCs (UNCTAD, 2014a, pp. 119–120, 138). While dependence on high-income migration, together with limited educational opportunities in more remote areas, are likely to skew diaspora investment towards peri-urban areas, such investment could nonetheless release public resources and ODA for use elsewhere. Its contribution could be enhanced by moving beyond diaspora bonds to consideration of diaspora direct investment, including, for example, encouraging pooling of resources by diaspora investors to increase economies of scale. If extended to non-farm activities, the Diaspora Investment in Agriculture Initiative launched by the United States Department of State and the International Fund for Agricultural Development (IFAD) in 2011 (IFAD, undated) could facilitate diaspora investments for rural structural transformation.
Another possible source of private financing would be the development of proactively “ethical” investment vehicles. While “ethical” investment funds have grown considerably in recent years, they are generally based on a negative-list approach, pursuing investment strategies similar to other investment funds, but excluding companies in sectors such as tobacco, alcohol, armaments and fossil fuels. However, the ethos of solidarity and sustainability embodied in the SDGs, and the growth of the social enterprise sector, are indicative of a growing desire to combine personal gain with providing wider benefits — to “do well by doing good”. At the same time, reduced public provision of pensions and the shift from social to private health insurance in some developed countries has greatly widened the market for investment funds to encompass, for example, public servants, voluntary sector workers and employees of religious organizations. Since many people in these categories are oriented as much towards societal goals as towards private gain, this suggests there is a significant and growing market for investment vehicles that espouse stronger and more explicit ethical principles than those which characterize existing “negative-list” approaches.
This points to the existence of a potentially significant niche market for proactively ethical investment funds, not pursuing a conventional return-maximizing approach with certain sectoral constraints, but rather seeking an acceptable combination of return and risk (optimized through risk pooling) while maximizing contribution to the achievement of social goals. This could potentially provide greater funding for developmentally and environmentally focused investments in LDCs than has occurred under existing arrangements. Simply creating a distinct category of ethical investment funds that meet this criterion would provide a basis for (for example) people working on development
Purpose-specific funds may have a role to play in priority areas.
Development of proactively “ethical” investment vehicles could provide
an additional source of private financing.
Diaspora direct investment may have greater potential than traditional FDI to finance rural infrastructure
investment.
The Least Developed Countries Report 2015154
and environmental issues in the public and voluntary sectors to press their employers and pension funds to invest part of their resources in such vehicles. This could be strengthened by regulatory measures, for example requiring funds described as “ethical” to publish the proportion of funds invested in proactively ethical vehicles (generating market pressure to increase the proportion) or to invest a minimum proportion in such vehicles in order to use the term “ethical”.
Investments oriented towards social goals in rural areas of LDCs, whether in infrastructure or to increase incomes, would clearly fit into this category; and the global publicity for the 2030 Agenda could readily be harnessed by providers of proactively ethical investment vehicles to market their products. It might also be possible to combine funding from such sources with diaspora investment funds (for example as “global solidarity funds” and “local solidarity funds”) to maximize the synergies between the two — increasing the resources available to diaspora (impact) investors, and the local knowledge and contacts available to international ethical funds.
2. trade
Average tariffs on LDC exports have decreased over time, in line with global declines in most-favoured-nation (MFN) tariffs, preference schemes, and the World Trade Organization (WTO) Decision on duty-free, quota-free market access. However, relatively high duties persist on a number of products of importance for LDC producers, especially in agriculture and clothing, and significant distortions remain in agriculture, especially due to the use of subsidy measures. LDCs have repeatedly highlighted that these issues should be addressed as a matter of priority in the Doha Round negotiations.
The potential benefits to LDCs of further multilateral tariff reduction are offset by its effect in eroding the preference margins afforded by their existing preferential trade arrangements with most major markets. Of greater importance, therefore, is the implementation (by all developed countries and by developing countries in a position to do so) of WTO commitments to “provide duty-free and quota-free market access on a lasting basis, for all products originating from all LDCs by 2008 or no later than the start of the implementation period in a manner that ensures stability, security and predictability”, as agreed at the 2005 Ministerial Conference (WTO, 2005, Annex F, para. 36(a)(i)). Although some progress has been recorded in this regard, full implementation remains to be achieved.
Consensus among the LDCs on advancing the duty-free, quota-free agenda has been impeded by differences among LDCs in market access conditions under the United States Generalized System of Preferences (GSP) and the African Growth and Opportunities Act (AGOA). Resolution 21 (ii), adopted at UNCTAD II (New Delhi, 1968), established non-discrimination as one of the fundamental principles of granting trade preferences. Accordingly, LDCs should find an equitable common position to ensure full implementation of the duty-free, quota-free commitment by the remaining developed and developing countries, taking existing trade preferences into account where possible.
There is also substantial scope for improvements in the terms of existing preferential arrangements for LDCs. Substantial benefits could arise from increasing the lifespan and predictability of preferential arrangements such as AGOA, so as to encourage longer-term (rather than footloose) investments in export sectors, with greater rootedness in local economies, and from less restrictive rules of origin. In the latter context, value added rules could be liberalized to take account of the fragmentation of production and global value chains, and to allow regional or global cumulation among beneficiary countries.
For LDCs, WTO commitments to duty-free and quota-free market access are more important than
multilateral tariff reduction.
LDCs should find an equitable common position to ensure full
implementation of the duty-free and quota-free commitments.
155CHAPTER 5. Transforming Rural Economies in the Post-2015 Era: A Policy Agenda
This would help to encourage intraregional trade in intermediate goods among LDCs and other members of regional trade arrangements. Full implementation of the WTO 2013 Bali Ministerial Decision on preferential rules of origin could also help to facilitate the more effective use of preferential arrangements.
In addition, consideration could be given to establishing and promoting a new “sustainable development brand” linked to the SDGs, sourced from value chains controlled by producers in LDCs (and possibly similarly disadvantaged regions of ODCs) themselves.5 One of the key obstacles to development in LDCs is the dominant model of consumerism among the global elite and middle class, which is based on uniformity of products and conformity of consumers. This skews demand in the most lucrative markets towards the large-scale capital-intensive production typical of TNC-led value chains; but LDCs struggle to compete for segments of such value chains, particularly higher value added segments, because they lack the basic conditions that help to attract TNC investment: Good and reliable infrastructure, a healthy and productive workforce, high levels of education and skills, macroeconomic and political stability, favourable living conditions for expatriate workers, and so forth.
As global value chains increasingly dominate global trade, this is an ever more important constraint to export growth and diversification among LDCs; and it represents a major barrier to the economic transformation required to attain the conditions needed to attract TNCs and participate beneficially in global value chains. This may be seen as a national counterpart of the contradiction between need and opportunity for economic diversification observed at the household and local levels, as discussed in Chapter 3.
An actively promoted “sustainable development brand” could provide a way out of this impasse, by challenging the features of consumerism that currently obstruct LDCs’ export opportunities, and by developing a global niche market emphasizing diversity, distinctiveness and non-conformity, promoting an “ethnic chic” ethos, and appealing to principles of global solidarity and sustainability. The existing demand for products bearing fair trade and sustainability labels demonstrates the existence of a significant niche market in which premiums are paid for products perceived as contributing positively to ethical goals; and the 2030 Agenda for Sustainable Development, by fostering an ethos of greater global solidarity and environmental sustainability, could provide a considerable further boost to such demand. If effectively harnessed through astute marketing, and provided rigorous quality control could be maintained, this could greatly increase export demand and value added for SMEs in LDCs, not least in rural areas, for goods such as clothing, accessories, footwear, household fabrics, furniture, ornaments, toys, processed foods, artwork and traditional craft products.
3. developmental regionalism for rural development
UNCTAD has long advocated developmental regionalism, as a powerful tool for the structural transformation of LDCs (UNCTAD, 2011, 2013). This approach is particularly important to rural development and may therefore be of value to LDCs in their rural development strategies.
Developmental regionalism is regional integration that aims to maximize the developmental benefits of regional cooperation, with the ultimate goal of achieving an advantageous insertion of members’ economies into world markets. It combines gradual and sequenced trade liberalization with policies to build up member countries’ productive capacities. It thus goes beyond the creation of larger regional markets through trade liberalization to encompass joint initiatives in the fields of industrial policy; provision of infrastructure and other public goods; transboundary development corridors that cluster
A new “sustainable development brand” linked to the SDGs could
offer development benefits…
Developmental regionalism is particularly important to rural
development.
…by challenging the features of consumerism that obstruct LDCs’
export opportunities, and developing a global niche market.

The Least Developed Countries Report 2015156
different types of economic activity around particular infrastructure projects; R&D; harmonization of standards; etc. This approach has been implemented successfully in the Greater Mekong Subregion of South-East Asia (UNCTAD, 2011, pp. 100–105), and there are initiatives moving in a similar direction in Africa (UNCTAD and UNIDO, 2011, pp. 79–84; UNCTAD, 2013, pp. 95–121). Two examples demonstrate the potential of developmental regionalism for rural transformation in LDCs.
First, there is significant potential for the creation of regional value chains in agriculture and agroprocessing, which could contribute to economic diversification, increased productivity, food security, job creation and poverty alleviation. Geographical proximity, economic size and cultural affinity create the potential for countries in the same region to increase intraregional trade in agriculture-based products. Integration into regional markets for these products is strong in Asian LDCs (which direct 85 per cent of their agricultural goods to regional markets); but it is much weaker in African LDCs and Haiti (where the corresponding share is just 26 per cent) and island LDCs (approximately 10 per cent), where the development of regional agricultural value chains is held back by infrastructure deficits, poor competitiveness in production and trade, and weak implementation of regional integration initiatives.
However, regional value chains and markets could help these countries to overcome the constraints of small national markets and optimize the use of their diverse but fragile agroecological systems. Developmental regionalism can contribute to this by simplifying regional cross-border movements of goods, financing and capital; strengthening regional infrastructure in transport, energy, communications and water; harmonizing regional regulations; standardizing consumer and industrial regulations (e.g. environmental and safety standards); developing cross-border production clusters dealing directly with strategic value chains; and developing a regional marketing strategy. Instead of raw agricultural commodities and related jobs and processing industries being exported, strengthening forward linkages with agribusiness and agroprocessing could significantly increase employment and non-farm incomes for rural populations in many LDCs (UNECA and African Union Commission, 2009).
Second, regionally based R&D centres and extension programmes for agriculture can overcome some of the most binding constraints to faster agricultural productivity growth. This would allow countries in the same region to pool resources, undertake joint agricultural R&D and strengthen the structure and human resources of their agricultural extension services, taking advantage of the similarity of agroecological conditions and the commonality of challenges facing producers in different countries in the region. By allowing the exploitation of economies of scale, this could make a significant contribution to countering the low level of spending on agricultural R&D, particularly in the smaller LDCs, and to overcoming the problem of excessively small national agricultural innovation systems (Chapter 2).
Establishing effective collaboration arrangements for information-sharing in agricultural R&D within and between regions can thus significantly enhance its benefits, as can information-sharing among extension workers in different countries within regions. An effective global network of national and regional R&D centres in LDCs (regions being based primarily on agroecological considerations) could thus provide an effective means of sharing appropriate technologies and adapting them to local needs, particularly if combined with the two-way relationship between national R&D centres and small farmers, through extension workers, outlined in Section C.2 above.
There is significant potential for the creation of regional value chains in
agriculture and agroprocessing.
Regionally based R&D centres and extension programmes could help
overcome constraints to agricultural productivity growth.
157CHAPTER 5. Transforming Rural Economies in the Post-2015 Era: A Policy Agenda
F. Conclusion
More than ever, rural economic transformation will be central to development in LDCs in the post-2015 era; and the SDGs signal both the need and the opportunity for a new approach, given the gap between the progress required by 2030 and that achieved in recent decades. This chapter has highlighted some elements of such an approach.
• Successful rural economic transformation depends on a combination of agricultural upgrading and development of non-farm economies, maximizing the synergies between the two.
• Sequencing investments and interventions is critical, to ensure that producers are ready to respond effectively to increased demand and to market opening when they happen.
• Affordable financing is essential: Options may include interest subsidies on microcredit subject to interest ceilings, and in-kind microgrants in remote and isolated areas.
• Agricultural upgrading requires higher and more stable R&D spending, and strong extension services acting as a two-way conduit between R&D agencies and small farmers.
• Adult education and training is important as well as sending children to school, and it should include financial literacy and vocational and business skills as well as basic literacy and numeracy.
• An enabling environment for enterprise requires attention to the demand side as well as the supply side. Information about prospective changes in demand and market conditions is a key element.
• Effective policy coordination is essential at the national level; and producers’ associations, cooperatives and women’s networks have an important role at the local level.
• Fulfilment by donors of their commitments on ODA quantity and quality will be essential; and there is a strong case for increasing the target for ODA to LDCs to 0.35 per cent of donor GNI.
• Innovative approaches to trade and cross-border investment could make a significant contribution to rural transformation in the post-2015 context.
• Developmental regionalism can also have substantial benefits, particularly in sub-Saharan Africa, as can regional and interregional collaboration in agricultural R&D.
The policy recommendations presented in this chapter are summarized in table 5.1.
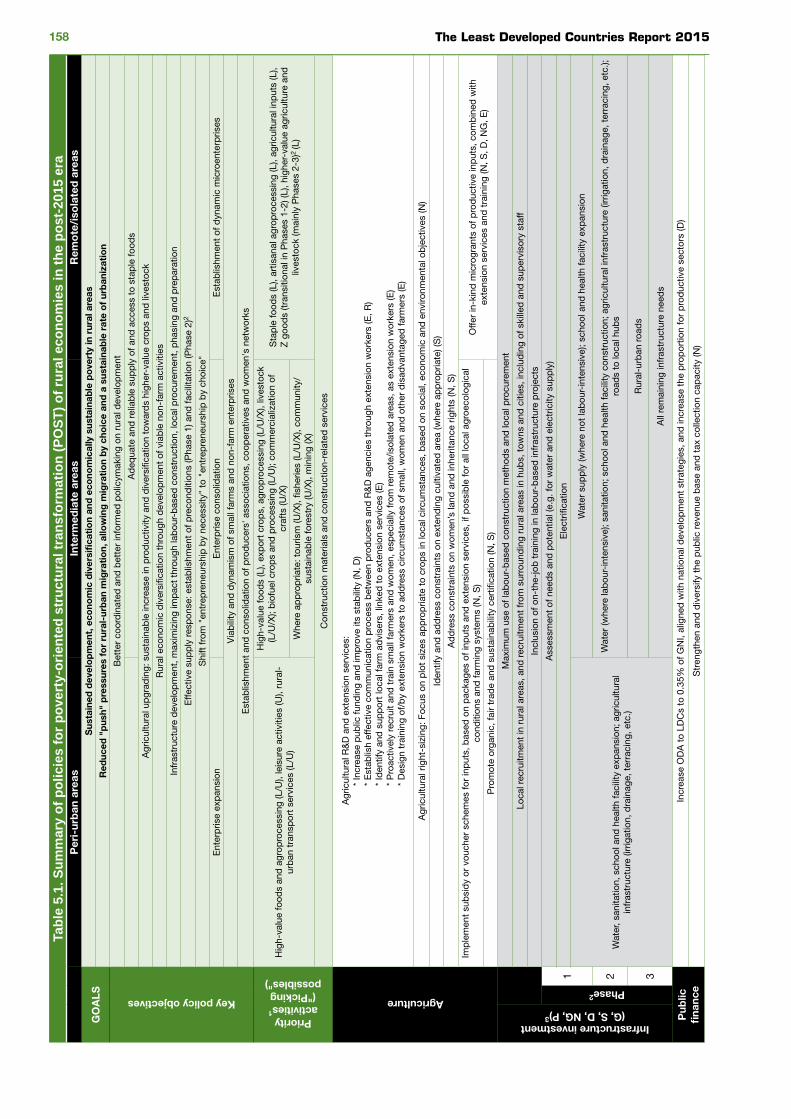
The Least Developed Countries Report 2015158
Tabl
e 5.
1. S
umm
ary
of p
olic
ies
for p
over
ty-o
rient
ed s
truc
tura
l tra
nsfo
rmat
ion
(PO
ST) o
f rur
al e
cono
mie
s in
the
post
-201
5 er
aP
eri-
urb
an a
reas
Inte
rmed
iate
are
asR
emo
te/i
sola
ted
are
as
GO
ALS
Sus
tain
ed d
evel
op
men
t, e
cono
mic
div
ersi
fica
tio
n an
d e
cono
mic
ally
sus
tain
able
po
vert
y in
rur
al a
reas
Red
uced
"p
ush"
pre
ssur
es f
or
rura
l-ur
ban
mig
rati
on,
allo
win
g m
igra
tio
n b
y ch
oic
e an
d a
sus
tain
able
rat
e o
f ur
ban
izat
ion
Key policy objectivesB
ette
r co
ord
inat
ed a
nd b
ette
r in
form
ed p
olic
ymak
ing
on r
ural
dev
elop
men
t
Ad
equa
te a
nd r
elia
ble
sup
ply
of a
nd a
cces
s to
sta
ple
food
s
Agr
icul
tura
l up
grad
ing:
sus
tain
able
incr
ease
in p
rod
uctiv
ity a
nd d
iver
sific
atio
n to
war
ds
high
er-v
alue
cro
ps
and
live
stoc
k
Rur
al e
cono
mic
div
ersi
ficat
ion
thro
ugh
dev
elop
men
t of
via
ble
non
-far
m a
ctiv
ities
Infr
astr
uctu
re d
evel
opm
ent,
max
imiz
ing
imp
act
thro
ugh
lab
our-
bas
ed c
onst
ruct
ion,
loca
l pro
cure
men
t, p
hasi
ng a
nd p
rep
arat
ion
Effe
ctiv
e su
pp
ly r
esp
onse
: est
ablis
hmen
t of
pre
cond
ition
s (P
hase
1) a
nd fa
cilit
atio
n (P
hase
2)2
Shi
ft fr
om "
entr
epre
neur
ship
by
nece
ssity
" to
"en
trep
rene
ursh
ip b
y ch
oice
"
Ent
erp
rise
exp
ansi
onE
nter
pris
e co
nsol
idat
ion
Est
ablis
hmen
t of
dyn
amic
mic
roen
terp
rises
Via
bili
ty a
nd d
ynam
ism
of s
mal
l far
ms
and
non
-far
m e
nter
pris
es
Est
ablis
hmen
t an
d c
onso
lidat
ion
of p
rod
ucer
s' a
ssoc
iatio
ns, c
oop
erat
ives
and
wom
en's
net
wor
ks
Priority activities1
("Picking possibles")
Hig
h-va
lue
food
s an
d a
grop
roce
ssin
g (L
/U),
leis
ure
activ
ities
(U),
rura
l-ur
ban
tra
nsp
ort
serv
ices
(L/U
)
Hig
h-va
lue
food
s (L
), ex
por
t cr
ops,
agr
opro
cess
ing
(L/U
/X),
lives
tock
(L
/U/X
); b
iofu
el c
rop
s an
d p
roce
ssin
g (L
/U);
com
mer
cial
izat
ion
of
craf
ts (U
/X)
Sta
ple
food
s (L
), ar
tisan
al a
grop
roce
ssin
g (L
), ag
ricul
tura
l inp
uts
(L),
Z g
ood
s (tr
ansi
tiona
l in
Pha
ses
1-2)
(L),
high
er-v
alue
agr
icul
ture
and
liv
esto
ck (m
ainl
y P
hase
s 2-
3)2
(L)
Whe
re a
pp
rop
riate
: tou
rism
(U/X
), fis
herie
s (L
/U/X
), co
mm
unity
/su
stai
nab
le fo
rest
ry (U
/X),
min
ing
(X)
Con
stru
ctio
n m
ater
ials
and
con
stru
ctio
n-re
late
d s
ervi
ces
Agriculture
Agr
icul
tura
l R&
D a
nd e
xten
sion
ser
vice
s:*
Incr
ease
pub
lic fu
ndin
g an
d im
pro
ve it
s st
abili
ty (N
, D)
* E
stab
lish
effe
ctiv
e co
mm
unic
atio
n p
roce
ss b
etw
een
pro
duc
ers
and
R&
D a
genc
ies
thro
ugh
exte
nsio
n w
orke
rs (E
, R)
* Id
entif
y an
d s
upp
ort
loca
l far
m a
dvi
sers
, lin
ked
to
exte
nsio
n se
rvic
es (E
)*
Pro
activ
ely
recr
uit
and
tra
in s
mal
l far
mer
s an
d w
omen
, esp
ecia
lly fr
om r
emot
e/is
olat
ed a
reas
, as
exte
nsio
n w
orke
rs (E
)*
Des
ign
trai
ning
of/
by
exte
nsio
n w
orke
rs t
o ad
dre
ss c
ircum
stan
ces
of s
mal
l, w
omen
and
oth
er d
isad
vant
aged
farm
ers
(E)
Agr
icul
tura
l rig
ht-s
izin
g: F
ocus
on
plo
t si
zes
app
rop
riate
to
crop
s in
loca
l circ
umst
ance
s, b
ased
on
soci
al, e
cono
mic
and
env
ironm
enta
l ob
ject
ives
(N)
Iden
tify
and
ad
dre
ss c
onst
rain
ts o
n ex
tend
ing
culti
vate
d a
rea
(whe
re a
pp
rop
riate
) (S
)
Ad
dre
ss c
onst
rain
ts o
n w
omen
’s la
nd a
nd in
herit
ance
rig
hts
(N, S
)
Imp
lem
ent
sub
sid
y or
vou
cher
sch
emes
for
inp
uts,
bas
ed o
n p
acka
ges
of in
put
s an
d e
xten
sion
ser
vice
s, if
pos
sib
le fo
r al
l loc
al a
groe
colo
gica
l co
nditi
ons
and
farm
ing
syst
ems
(N, S
)O
ffer
in-k
ind
mic
rogr
ants
of p
rod
uctiv
e in
put
s, c
omb
ined
with
ex
tens
ion
serv
ices
and
tra
inin
g (N
, S, D
, NG
, E)
Pro
mot
e or
gani
c, fa
ir tr
ade
and
sus
tain
abili
ty c
ertifi
catio
n (N
, S)
Infrastructure investment (G, S, D, NG, P)3
Max
imum
use
of l
abou
r-b
ased
con
stru
ctio
n m
etho
ds
and
loca
l pro
cure
men
t
Loca
l rec
ruitm
ent
in r
ural
are
as, a
nd r
ecru
itmen
t fr
om s
urro
und
ing
rura
l are
as in
hub
s, t
owns
and
citi
es, i
nclu
din
g of
ski
lled
and
sup
ervi
sory
sta
ff
Incl
usio
n of
on-
the-
job
tra
inin
g in
lab
our-
bas
ed in
fras
truc
ture
pro
ject
s
Phase2
1
Ass
essm
ent
of n
eed
s an
d p
oten
tial (
e.g.
for
wat
er a
nd e
lect
ricity
sup
ply
)
Ele
ctrifi
catio
n
Wat
er, s
anita
tion,
sch
ool a
nd h
ealth
faci
lity
exp
ansi
on; a
gric
ultu
ral
infr
astr
uctu
re (i
rrig
atio
n, d
rain
age,
ter
raci
ng, e
tc.)
Wat
er s
upp
ly (w
here
not
lab
our-
inte
nsiv
e); s
choo
l and
hea
lth fa
cilit
y ex
pan
sion
2W
ater
(whe
re la
bou
r-in
tens
ive)
; san
itatio
n; s
choo
l and
hea
lth fa
cilit
y co
nstr
uctio
n; a
gric
ultu
ral i
nfra
stru
ctur
e (ir
rigat
ion,
dra
inag
e, t
erra
cing
, etc
.);
road
s to
loca
l hub
s
3R
ural
-urb
an r
oad
s
All
rem
aini
ng in
fras
truc
ture
nee
ds
Pub
lic
fina
nce
Incr
ease
OD
A t
o LD
Cs
to 0
.35%
of G
NI,
alig
ned
with
nat
iona
l dev
elop
men
t st
rate
gies
, and
incr
ease
the
pro
por
tion
for
pro
duc
tive
sect
ors
(D)
Str
engt
hen
and
div
ersi
fy t
he p
ublic
rev
enue
bas
e an
d t
ax c
olle
ctio
n ca
pac
ity (N
)
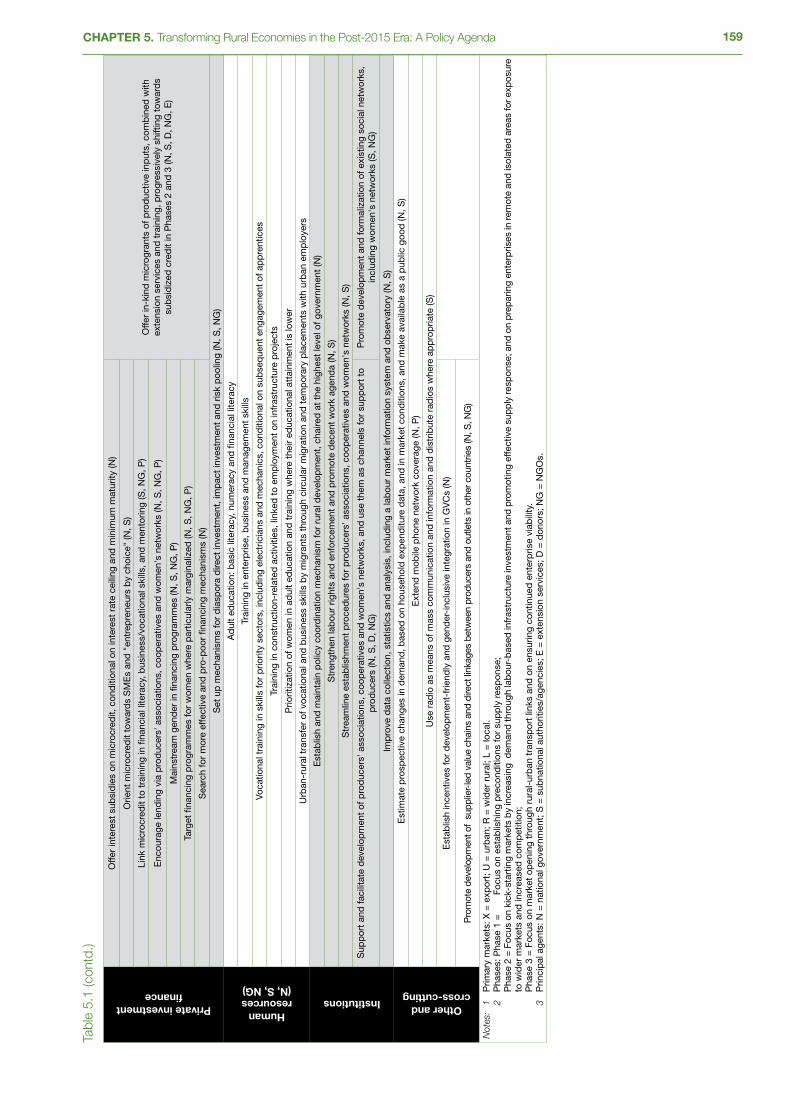
159CHAPTER 5. Transforming Rural Economies in the Post-2015 Era: A Policy Agenda
Private investment finance
Offe
r in
tere
st s
ubsi
die
s on
mic
rocr
edit,
con
diti
onal
on
inte
rest
rat
e ce
iling
and
min
imum
mat
urity
(N)
Offe
r in
-kin
d m
icro
gran
ts o
f pro
duc
tive
inp
uts,
com
bin
ed w
ith
exte
nsio
n se
rvic
es a
nd t
rain
ing,
pro
gres
sive
ly s
hift
ing
tow
ard
s su
bsi
diz
ed c
red
it in
Pha
ses
2 an
d 3
(N, S
, D, N
G, E
)
Orie
nt m
icro
cred
it to
war
ds
SM
Es
and
"en
trep
rene
urs
by
choi
ce"
(N, S
)
Link
mic
rocr
edit
to t
rain
ing
in fi
nanc
ial l
itera
cy, b
usin
ess/
voca
tiona
l ski
lls, a
nd m
ento
ring
(S, N
G, P
)
Enc
oura
ge le
ndin
g vi
a p
rod
ucer
s' a
ssoc
iatio
ns, c
oop
erat
ives
and
wom
en's
net
wor
ks (N
, S, N
G, P
)
Mai
nstr
eam
gen
der
in fi
nanc
ing
pro
gram
mes
(N, S
, NG
, P)
Targ
et fi
nanc
ing
pro
gram
mes
for
wom
en w
here
par
ticul
arly
mar
gina
lized
(N, S
, NG
, P)
Sea
rch
for
mor
e ef
fect
ive
and
pro
-poo
r fin
anci
ng m
echa
nism
s (N
)
Set
up
mec
hani
sms
for
dia
spor
a d
irect
inve
stm
ent,
imp
act
inve
stm
ent
and
ris
k p
oolin
g (N
, S, N
G)
Human resources(N, S, NG)
Ad
ult
educ
atio
n: b
asic
lite
racy
, num
erac
y an
d fi
nanc
ial l
itera
cy
Trai
ning
in e
nter
pris
e, b
usin
ess
and
man
agem
ent
skill
s
Voca
tiona
l tra
inin
g in
ski
lls fo
r p
riorit
y se
ctor
s, in
clud
ing
elec
tric
ians
and
mec
hani
cs, c
ond
ition
al o
n su
bse
que
nt e
ngag
emen
t of
ap
pre
ntic
es
Trai
ning
in c
onst
ruct
ion-
rela
ted
act
iviti
es, l
inke
d t
o em
plo
ymen
t on
infr
astr
uctu
re p
roje
cts
Prio
ritiz
atio
n of
wom
en in
ad
ult
educ
atio
n an
d t
rain
ing
whe
re t
heir
educ
atio
nal a
ttai
nmen
t is
low
er
Urb
an-r
ural
tra
nsfe
r of
voc
atio
nal a
nd b
usin
ess
skill
s b
y m
igra
nts
thro
ugh
circ
ular
mig
ratio
n an
d t
emp
orar
y p
lace
men
ts w
ith u
rban
em
plo
yers
Institutions
Est
ablis
h an
d m
aint
ain
pol
icy
coor
din
atio
n m
echa
nism
for
rura
l dev
elop
men
t, c
haire
d a
t th
e hi
ghes
t le
vel o
f gov
ernm
ent
(N)
Str
engt
hen
lab
our
right
s an
d e
nfor
cem
ent
and
pro
mot
e d
ecen
t w
ork
agen
da
(N, S
)
Str
eam
line
esta
blis
hmen
t p
roce
dur
es fo
r p
rod
ucer
s' a
ssoc
iatio
ns, c
oop
erat
ives
and
wom
en's
net
wor
ks (N
, S)
Sup
por
t an
d fa
cilit
ate
dev
elop
men
t of
pro
duc
ers'
ass
ocia
tions
, coo
per
ativ
es a
nd w
omen
's n
etw
orks
, and
use
the
m a
s ch
anne
ls fo
r su
pp
ort
to
pro
duc
ers
(N, S
, D, N
G)
Pro
mot
e d
evel
opm
ent
and
form
aliz
atio
n of
exi
stin
g so
cial
net
wor
ks,
incl
udin
g w
omen
's n
etw
orks
(S, N
G)
Imp
rove
dat
a co
llect
ion,
sta
tistic
s an
d a
naly
sis,
incl
udin
g a
lab
our
mar
ket
info
rmat
ion
syst
em a
nd o
bse
rvat
ory
(N, S
)
Other and cross-cutting
Est
imat
e p
rosp
ectiv
e ch
ange
s in
dem
and
, bas
ed o
n ho
useh
old
exp
end
iture
dat
a, a
nd in
mar
ket
cond
ition
s, a
nd m
ake
avai
lab
le a
s a
pub
lic g
ood
(N, S
)
Ext
end
mob
ile p
hone
net
wor
k co
vera
ge (N
, P)
Use
rad
io a
s m
eans
of m
ass
com
mun
icat
ion
and
info
rmat
ion
and
dis
trib
ute
rad
ios
whe
re a
pp
rop
riate
(S)
Est
ablis
h in
cent
ives
for
dev
elop
men
t-fr
iend
ly a
nd g
end
er-i
nclu
sive
inte
grat
ion
in G
VC
s (N
)
Pro
mot
e de
velo
pmen
t of
supp
lier-
led
valu
e ch
ains
and
dire
ct li
nkag
es b
etw
een
prod
ucer
s an
d ou
tlets
in o
ther
cou
ntrie
s (N
, S, N
G)
Not
es:
1 P
rimar
y m
arke
ts: X
= e
xpor
t; U
= u
rban
; R =
wid
er r
ural
; L =
loca
l.
2 P
hase
s: P
hase
1 =
Fo
cus
on e
stab
lishi
ng p
reco
nditi
ons
for
sup
ply
res
pon
se;
Pha
se 2
= F
ocus
on
kick
-sta
rtin
g m
arke
ts b
y in
crea
sing
dem
and
thro
ugh
lab
our-
bas
ed in
fras
truc
ture
inve
stm
ent a
nd p
rom
otin
g ef
fect
ive
sup
ply
resp
onse
; and
on
pre
par
ing
ente
rpris
es in
rem
ote
and
isol
ated
are
as fo
r ex
pos
ure
to w
ider
mar
kets
and
incr
ease
d c
omp
etiti
on;
Pha
se 3
= F
ocus
on
mar
ket
open
ing
thro
ugh
rura
l-ur
ban
tra
nsp
ort
links
and
on
ensu
ring
cont
inue
d e
nter
pris
e vi
abili
ty.
3
Prin
cip
al a
gent
s: N
= n
atio
nal g
over
nmen
t; S
= s
ubna
tiona
l aut
horit
ies/
agen
cies
; E =
ext
ensi
on s
ervi
ces;
D =
don
ors;
NG
= N
GO
s.
Tabl
e 5.
1 (c
ontd
.)

The Least Developed Countries Report 2015160
Notes
1 In the case of private commercial investment in services provision from outside the local economy, the financial effect is rather comparable to foreign direct investment in non-tradable services, which is less favourable over the longer term due to outflow of profits from the local economy in subsequent years.
2 While some such investment could in principle be undertaken on a commercial basis, in rural areas of LDCs the potential is limited as the main investments required are in sectors that are of limited commercial interest (e.g. sanitation and education for unserved populations), problematic in terms of achieving social goals (e.g. health services), and where incentives for international investment are limited by the fragmented nature and/or low financial rates of return on the investment required (e.g. water and electricity supply in sparsely populated rural areas). Moreover, the conditions that make a market attractive to FDI in non-tradable sectors — large and growing domestic markets and economic and political stability — are largely absent.
3 OECD (2008; 2012).4 “China rail group signs $5.5bn in Africa deals”, Financial Times. 28 April 2015.5 Existing fair trade suppliers of non-food products, such as Just Business in Scandinavia
and Wereldwinkels in the Netherlands, could provide a useful starting point for such an approach, although it would require a more proactive and resource-intensive approach to marketing and integration with mainstream retail outlets.
References
Alessi C and B Xu (2015). China in Africa. CFR Backgrounders, Council on Foreign Relations. 27 April. Available from http://www.cfr.org/china/china-africa/p9557.
Barrett C, M Carter and CP Timmer (2010). A Century-Long Perspective on Agricultural Development. American Journal of Agricultural Economics. 92(2): 447–468.
Beck T, S Maimbo, I Faye and T Triki (2011). Financing Africa through the Crisis and Beyond. Federal Ministry for Economic Cooperation and Development, Germany, and World Bank.
Binswanger H, K Deininger and G Feder (1995). Power, Distortions, Revolt and Reform in Agricultural Land Relations. In: Behrman J and TN Srinivasan, eds. Handbook of Development Economics, Volume 3B. North Holland. Amsterdam.
Binswanger-Mkhize H and A McCalla (2010). The Changing Context and Prospects for Agricultural and Rural Development in Africa. In: R Evenson and P Pingali, eds. Handbook of Agricultural Economics, Volume 4. North Holland. Amsterdam.
Carpano F (2011). Strengthening Women’s Access to Land into IFAD Projects. The Rwanda Experience. International Fund for Agricultural Development. Rome.
Carr M and M Hartl (2010). Lightening the Load: Labour-saving Technologies and Practices for Rural Women. International Fund for Agricultural Development. Rome.
Carton M and C Kingombe (2012). TVET Scoping and Advisory Mission to Sierra Leone 2012. Diagnostic Report. International Growth Centre. London. December.
Dercon S (2009). Rural Poverty: Old Challenges in New Contexts. World Bank Research Observer. 24(1): 1–28. February.
Dethier J-J and A Effenberger (2012). Agriculture and Development: A Brief Review of the Literature. Economic Systems. 36: 175–205.
Dolan C (2001). The ‘Good Wife’: Struggles over Resources in the Kenyan Horticultural Sector. Journal of Development Studies. 37(3): 39–70.
Druilhe Z and J Barreiro-Hurlé (2012). Fertilizer Subsidies in Sub-Saharan Africa. ESA Working Paper 12-04. Food and Agriculture Organization of the United Nations. Rome, July.
Duvendack M, R Palmer-Jones, J Copestake, L Hooper, Y Loke and N Rao (2011). What is the Evidence of the Impact of Microfinance on the Well-Being of Poor People? EPPI-Centre, University of London. London.
Eastwood R, M Lipton and A Newell (2010). Farm Size. In: R Evenson and P Pingali, eds. Handbook of Agricultural Economics, Volume 4. North Holland. Amsterdam.
FAO (1998). The State of Food and Agriculture 1998: Rural Non-farm Income in Developing Countries. Food and Agriculture Organization of the United Nations. Rome.
FAO (2002). A Guide to Gender Sensitive Microfinance. Socio-Economic and Gender Analysis Programme. Food and Agriculture Organization of the United Nations. Rome.
161CHAPTER 5. Transforming Rural Economies in the Post-2015 Era: A Policy Agenda
FAO (2011). The State of Food and Agriculture 2010–2011: Women in Agriculture: Closing the Gender Gap for Development. Food and Agriculture Organization of the United Nations. Rome.
FAO, IFAD and ILO (2010a). Agricultural Value Chain Development: Threat or Opportunity for Women’s Employment? Gender and Rural Employment Policy Brief 4. Food and Agriculture Organization of the United Nations. Rome.
FAO, IFAD and ILO (2010b). Investing in Skills for Socio-economic Empowerment of Rural Women. Gender and Rural Employment Policy Brief 2. Food and Agriculture Organization of the United Nations. Rome.
FAO, IFAD and ILO (2010c). Rural Women’s Entrepreneurship Is ‘Good Business’. Gender and Rural Employment Policy Brief 3. Food and Agriculture Organization of the United Nations. Rome.
Foster A and M Rosenzweig (2010). Microeconomics of Technology Adoption. Economic Growth Center Discussion Paper 984. Yale University. New Haven, CT.
Haggblade S, P Hazell and T Reardon, eds. (2007). Transforming the Rural Nonfarm Economy: Opportunities and Threats in the Developing World. Johns Hopkins University Press. Baltimore.
Hazell P and A Rahman, eds. (2014). New Directions for Smallholder Agriculture. International Fund for Agricultural Development. Oxford University Press. Oxford.
IFAD (undated). Diaspora Investment in Agriculture Initiative. International Fund for Agricultural Development. Rome. Available from http://www.ifad.org/remittances/pub/dia.pdf.
ILO (1999). Decent Work. International Labour Office. Geneva.ILO (undated). Small Change, Big Changes: Women and Microfinance. International
Labour Office. Geneva. Available from http://www.ilo.org/wcmsp5/groups/public/@dgreports/@gender/documents/meetingdocument/wcms_091581.pdf.
InterAcademy Council (2004). Realizing the Promise and Potential of African Agriculture. InterAcademy Council. Amsterdam.
Juma C and D Spielman (2014). Farmers as Entrepreneurs: Sources of Agricultural Innovation in Africa. In: P Hazell and A Rahman, eds. New Directions for Smallholder Agriculture. International Fund for Agricultural Development. Oxford University Press. Oxford.
Kant I (1873). Fundamental Principles of the Metaphysic of Morals, Second Section: Transition from Popular Moral Philosophy to the Metaphysic of Morals (TK Abbot, Trans.). Longman, Green and Co. London and New York. (Original work published by Johann Friedrich Hartknoch. Riga 1785.)
Lanjouw J and P Lanjouw (1995). Rural Nonfarm Employment: A Survey. Policy Research Working Paper 1463. World Bank. Washington, D.C.
Lanjouw J and P Lanjouw (2001). The Rural Non-Farm Sector: Issues and Evidence from Developing Countries. Agricultural Economics. 26: 1–23.
Liedholm C, M McPherson and E Chuta (2007). Enterprise Dynamics in the Rural Nonfarm Economy. In: Haggblade S, P Hazell and T Reardon, eds. Transforming the Rural Nonfarm Economy: Opportunities and Threats in the Developing World. Johns Hopkins University Press. Baltimore.
Maertens M and JFM Swinnen (2009). Are Modern Supply Chains Bearers of Gender Inequality? Paper presented at the ILO-FAO workshop “Gender Dimension of Rural Employment”. Rome. 30 March–3 April.
Maloumby Baka RC and Kingombe, CKM (forthcoming). The Quest to Lower High Remittance Costs in Africa - A Brief Review of the Use of Mobile Banking and Bitcoins. Centre for Finance and Development Working Paper. Graduate Institute. Geneva.
Messy F-A and C Monticone (2012). The Status of Financial Education in Africa. OECD Working Papers on Finance, Insurance and Private Pensions 25. July.
Msosa A (2009). Challenges in Census Data Processing Using Contemporary Technologies: The Case of Malawi. National Statistical Office. Zomba, Malawi. Available from http://unstats.un.org/unsd/censuskb20/Attachments/2009MWI-GUID2bcdf5bd9e0341f68813deda2eab1e61.pdf.
OECD (2008). The Paris Declaration on Aid Effectiveness and the Accra Agenda for Action. Organisation for Economic Co-operation and Development. Paris. Available from http://www.oecd.org/dac/effectiveness/34428351.pdf.
OECD (2012). The Busan Partnership for Effective Development Cooperation. Organisation for Economic Co-operation and Development. Paris. Available from http://www.oecd.org/dac/effectiveness/Busan%20partnership.pdf.
OECD and AfDB (2008). African Economic Outlook 2008: Developing Technical and Vocational Skills in Africa. Organisation for Economic Co-operation and Development. Paris.
The Least Developed Countries Report 2015162
Pardey P, J Alston, J James, P Glewwe, E Binenbaum, T Hurley and S Wood (2007). Science, Technology and Skills. Background Paper for the World Development Report 2008. World Bank. Washington, D.C.
Reardon T (1997). Using Evidence of Household Income Diversification to Inform Study of the Rural Nonfarm Labor Market in Africa. World Development. 25(5): 735–748.
Sachs J (2005). The End of Poverty: Economic Possibilities for Our Time. Penguin Press. New York.
Staatz J and N Dembélé (2007). Agriculture for Development in Sub-Saharan Africa. Background Paper for the World Development Report 2008. World Bank. Washington, D.C.
UNCTAD (2009). The Least Developed Countries Report 2009: The State and Development Governance. United Nations publication. Sales No. E.09.II.D.9. New York and Geneva.
UNCTAD (2011). The Least Developed Countries Report 2011: The Potential Role of South-South Cooperation for Inclusive and Sustainable Development. United Nations publication. Sales No. 11.II.D.5. New York and Geneva.
UNCTAD (2013). Economic Development in Africa Report 2013: Intra-African Trade: Unlocking Private Sector Dynamism. United Nations publication. Sales No. E.13.II.D.2. New York and Geneva.
UNCTAD (2014a). The Least Developed Countries Report 2014: Growth with Structural Transformation: a Post-2015 Development Agenda. United Nations publication. Sales No. E.14.II.D.7. New York and Geneva.
UNCTAD (2014b). Who is Benefiting from Trade Liberalization in Rwanda? A Gender Perspective. Geneva: UNCTAD/DITC/2014/2. Geneva.
UNCTAD (forthcoming). Commodities and Development Report 2015: Inclusive and Sustainable Commodity Development: the Case of Smallholder Farmers.
UNCTAD and UNIDO (2011). Economic Development in Africa Report 2011: Fostering Industrial Development in Africa in the New Global Environment. United Nations publication. Sales No. E.11.II.D.14. New York and Geneva.
UNDP, CAADP and NEPAD (2013). Democratic Republic of Congo Investment Opportunities Brief. CAADP Investment Facilitation Programme. Johannesburg.
UNECA and African Union Commission (2009). Economic Report on Africa 2009: Developing African Agriculture through Regional Value Chains. United Nations Economic Commission for Africa. Addis Ababa.
UN Women and OHCHR (2013). Realizing Women’s Rights to Land and Other Productive Resources. HR/PUB/13/04. New York and Geneva.
Wiggins S (2014). Rural Non-farm Economy: Current Understanding, Policy Options, and Future Possibilities. In: Hazell P and A Rahman, eds. New Directions for Smallholder Agriculture. International Fund for Agricultural Development. Oxford University Press. Oxford.
Woodward D (2013). A High Price to Pay: IMF Governance, Management of Developing Country Financial Crises, and Health Impacts. Background Paper. The Lancet–University of Oslo Commission on Global Governance for Health. January. Available from http://www.med.uio.no/helsam/english/research/global-governance-health/background-papers/imf-governance-health.pdf.
World Bank (2007). World Development Report 2008: Agriculture for Development. World Bank. Washington, D.C.
World Bank and ONE (2014). Levelling the Field: Improving Opportunities for Women Farmers in Africa. World Bank and the ONE Campaign. Washington, D.C.
WTO (2005). 2005 Doha Work Programme. Ministerial Declaration: Annexes Adopted on 18 December 2005. WT/MIN(05)/DEC. Geneva. 22 December. Available from https://www.wto.org/english/thewto_e/minist_e/min05_e/final_annex_e.htm.
U n i t e d n at i o n s C o n f e r e n C e o n t r a d e a n d d e v e l o p m e n t
THE LEA
ST D
EVELO
PED
CO
UN
TRIES
REP
OR
T 20
15
UNCTA
DUNITED NATIONS
Printed at United Nations, GenevaGE.15-00000–October 2015–5,188
UNCTAD/LDC/2015
United Nations publicationSales No E.15.II.D.7e-ISBN 978-92-1-057413-6 ISSN 0257-7550
USD 50ISBN 978-92-1-112893-2
Phot
o cr
edits
: ©IL
O: K
. Cas
sidy
, M. C
roze
t, E.
Gia
notti
, Y.R
. Per
era
– Fo
tolia
.com
: DN6
, Yul
iaB
Transforming Rural Economies
THE LEAST DEVELOPED COUNTRIES REPORT 2015
EMBARGOThe contents of this Report must not be quoted or summarized in the print, broadcast or electronic media before25 November 2015, 17:00 hours GMT
Front cover The pictures on the top and bottom represent a range of key activities that can contribute to rural economic transformation in least developed countries: eco- and adventure tourism, agroprocessing, small-scale industry and sales of high-value agricultural produce in urban areas. The centre-left picture illustrates rural electrification, a major driver of development of non-farm activities. Eventually, a successful process of rural economic transformation might culminate in more capital-intensive and mechanized agriculture.
The headline of the newly adopted 2030 Agenda for Sustainable Development and Sustainable Development Goals (SDGs) is a global commitment to eradicate poverty by 2030. Nearly half the population of the 48 least developed countries (LDCs) – some 400 million people – remain in extreme poverty, compared with less than a quarter in any other developing country. The LDCs are thus the battleground on which the 2030 Agenda will be won or lost. This is where shortfalls from the SDG targets are greatest, where improvement has been slowest, and where the barriers to further progress are highest.
Rural development will be central to the quantum leap in the rate of progress required for LDCs to achieve the SDGs. More than two thirds of people in LDCs live in rural areas, where poverty is also most widespread and deepest, and infrastructure and social provision most lacking. Rural development is essential, not only to poverty eradication, employment generation and economic development, but also to sustainable urbanization.
UNCTAD’s Least Developed Countries Report 2015 therefore focuses on the transformation of rural economies. Assessing LDCs’ progress in agricultural productivity, the extent and nature of their rural economic diversification, and gender issues in rural transformation, it shows that: • Agricultural productivity began to increase in LDCs in 2000, following decades of stagnation or decline, but has risen
strongly only in Asian LDCs.• Rural economic diversification varies widely between LDCs, but only a few have passed beyond the stage in which
non-farm activities are centred on agriculture and urban linkages are limited.• Women comprise half the rural workforce in LDCs, but face serious constraints on realizing their productive potential,
slowing rural transformation.
The 2030 Agenda both highlights the need and provides the opportunity for a new approach to rural development centred on poverty-oriented structural transformation (POST), to generate higher incomes backed by higher productivity. In rural areas, this means upgrading agriculture, developing viable non-farm activities, and fully exploiting the synergies between the two, through appropriately designed and sequenced efforts to achieve the SDGs.
The Report argues that:• Differentiation is needed between peri-urban, intermediate, remote and isolated rural areas.• A key priority is to overcome the contradiction between need and opportunity, by which more remote areas and poorer
households have the greatest need but also the most limited opportunities for income diversification.• A POST process can be promoted by labour-based methods and local procurement in infrastructure investment to
stimulate demand, coupled with parallel measures to strengthen local supply response. • Supply response can be improved by appropriate sequencing of infrastructure investment and interventions, and
provision of information about prospective changes in demand and market conditions.• Gender-specific measures are needed to overcome disadvantages arising directly from gender norms, and more
inclusive gender-sensitive approaches to address their poverty-related consequences.• Access to appropriate technologies, inputs, skills and affordable finance needs to be fostered.• Effective policy coordination is required nationally, while producers’ associations, cooperatives and women’s networks
can play a key role locally.• Innovative approaches to trade and cross-border investment could make a substantial contribution.
Finally, the Report highlights the importance of adequate support from the international community to achieve structural transformation and fulfil the SDGs, based on the principle that “to will the end is to will the means”. It calls for donors to meet their commitments on the quantity and quality of official development assistance (ODA), and for an increase in the target for ODA to LDCs to 0.35 per cent of donors’ gross national income (GNI). This would be commensurate with LDCs’ share of global shortfalls from SDG targets in the context of the 0.7 per cent of donor GNI target for overall ODA.