REPORT ON OPERATIONS OF THE PETROL GROUP IN · PDF fileREPORT ON OPERATIONS OF THE PETROL...
62
REPORT ON OPERATIONS OF THE PETROL GROUP IN THE FIRST THREE MONTHS OF 2009
Transcript of REPORT ON OPERATIONS OF THE PETROL GROUP IN · PDF fileREPORT ON OPERATIONS OF THE PETROL...

REPORT ON OPERATIONS OF THE PETROL GROUP IN THE FIRST THREE MONTHS OF 2009

Entered into the Companies Register of Ljubljana District Court, entry no. 1/05773/00, share capital: EUR 52,240,977.04, VAT ID: SI80267432 2/62
CONTENTS
INTRODUCTION............................................................................................................................. 4
HIGHLIGHTS .................................................................................................................................. 5
The Petrol Group ............................................................................................................... 5
Petrol d.d., Ljubljana .......................................................................................................... 7
Key impacts on operations................................................................................................. 9
Events after the end of the period ...................................................................................... 9
BUSINESS REPORT .................................................................................................................... 12
Profile of the Petrol Group ................................................................................................12
Petroleum activity .............................................................................................................15
Sales of petroleum products..........................................................................................15
The Petrol Group...........................................................................................................15
Sales of supplementary and other merchandise............................................................18
Sales of services ...........................................................................................................18
Gas activity .......................................................................................................................19
Other energy activities and efficient energy consumption .................................................19
Production, sales and distribution of electricity and heat................................................19
Efficient energy consumption projects and other energy projects ..................................19
Environment activities .......................................................................................................20
Sustainable development..................................................................................................20
Employees ....................................................................................................................20
Investments...................................................................................................................22
The quality system ........................................................................................................22
Business risks...................................................................................................................23
The share .........................................................................................................................27
Authorised capital .............................................................................................................29
Contingent increase in called-up capital............................................................................29
Payment of dividends........................................................................................................29
Own shares ......................................................................................................................29
Supervisory Board ............................................................................................................30
Other explanations by Petrol d.d., Ljubljana......................................................................30
FINANCIAL REPORT.................................................................................................................... 31
Overview of the financial performance of the Petrol Group and the company Petrol d.d.,
Ljubljana ...........................................................................................................................31
Income statement of the Petrol Group and the company Petrol d.d., Ljubljana..............31
Balance sheet of the Petrol Group and the company Petrol d.d., Ljubljana ...................32
Entered into the Companies Register of Ljubljana District Court, entry no. 1/05773/00, share capital: EUR 52,240,977.04, VAT ID: SI802674322 3/62
Cash flow statement of the Petrol Group and the company Petrol d.d., Ljubljana..........33
Statement of changes in equity of the Petrol Group.......................................................34
Statement of changes in equity of the company Petrol d.d., Ljubljana ...........................35
Accounting policies of the Petrol Group.........................................................................36
Accounting policies of the company Petrol d.d., Ljubljana .............................................47
Entered into the Companies Register of Ljubljana District Court, entry no. 1/05773/00, share capital: EUR 52,240,977.04, VAT ID: SI802674322 4/62
INTRODUCTION
The publication of the report on operations of the Petrol Group and the company Petrol, d.d., Ljubljana, Dunajska 50, in the first three months of 2009 is in compliance with the Ljubljana Stock Exchange Rules (Articles 23 and 26), Guidelines on Disclosure for Listed Companies, and other relevant legislation. The figures and explanations on the operations have been prepared on the basis of unaudited consolidated financial statements of the Petrol Group and unaudited financial statements of the company Petrol, d.d., Ljubljana for the first three months of 2009 in compliance with the Companies Act and International Financial Reporting Standards (IFRS). Subsidiaries have been included in the consolidated financial statements prepared in accordance with IFRS on the basis of the full consolidation method, while joint ventures and associated companies have been included on the basis of the equity method. In the stand-alone financial statements prepared in accordance with IFRS, investments in subsidiaries have been carried at historical cost, while investments in jointly controlled companies and associates have been carried at fair value as available-for-sale assets. The report on operations in the first three months of 2009 has been published on the website of Petrol d.d., Ljubljana (http://www.petrol.si), and is available on demand at the registered office of Petrol d.d., Ljubljana, Dunajska cesta 50, 1527 Ljubljana, every working day between 8 am and 3 pm. The Supervisory Board of the company discussed the report on the company’s operations in the first three months of 2009 at its meeting held on 18 May 2009.

Entered into the Companies Register of Ljubljana District Court, entry no. 1/05773/00, share capital: EUR 52,240,977.04, VAT ID: SI802674322 5/62
HIGHLIGHTS
The Petrol Group � In the first three months of 2009, the business environment was
marked by the financial crisis and deepening of the economic recession. The Petrol Group has considered the anticipated impact of the worsened economic conditions on operations when preparing the programme of operations for the year 2009. What is more, in October 2008, measures were taken in response to the financial crisis and difficult business conditions, which in addition to the effective risk management system enable the Group to quickly and effectively react to developments in the business environment. These measures enabled us to mitigate the adverse impacts of the economic downturn on the Petrol Group's operations, as evident from the business results from ordinary activities which were higher than planned in the first quarter.
… � In light of the above, we estimate that at this stage there is no
need to adjust our plans to current market and financial situation, but further intensive monitoring of operations will show whether the market conditions will require additional measures or adjustments to the plans.
… � Following the first announcement of the estimated performance
of Petrol d.d., Ljubljana and the Petrol Group in the first three months of 2009, the company Istrabenz, holdinška družba, d.d. published a call for convening the General Meeting, proposing to increase its share capital through additional cash contributions in the amount of EUR 13.80 per share. Because the proposed value of new shares was based on an independent appraisal dated 31 March 2009, the company Petrol d.d., Ljubljana and the Petrol Group again revalued their investment in the associate, which adversely affected the amount of net profit or loss.
… � Gross invoiced sales totalled EUR 667 million.
…

Entered into the Companies Register of Ljubljana District Court, entry no. 1/05773/00, share capital: EUR 52,240,977.04, VAT ID: SI802674322 6/62
� Net sales revenue totalled EUR 555 million and was, due to lower oil prices, 14% lower than in the same period of 2008 and 3% lower than planned despite an increase in the quantity sold.
… � Gross profit or loss from sales stood at EUR 66.8 million, which
is on a par with the same period of 2008 and 2% less than planned.
… � Operating profit or loss before the impairment of investments
amounted to EUR 8.8 million, down 48% from the same period of 2008 and 22% more than planned. Operating profit or loss after the impairment of investments stood at EUR -11.9 million.
… � Net profit or loss for the period before the impairment of
investments totalled EUR 10.9 million, a decrease of 30% compared with the same period of 2008 and 102% more than planned. Net profit or loss for the period after the impairment of investments totalled EUR -5.6 million.
… � In the first three months of 2009, the Petrol Group sold 580
thousand tons of petroleum products, which is 5% more than in the same period of 2008 and 12% more than planned.
… � Revenue from the sale of supplementary and other merchandise
by the Petrol Group stood at EUR 90.6 million, up 20% compared with the same period of 2008 and 8% more than planned.
… � At the end of March 2009, the number of service stations
operated by Petrol was 428, of which 312 in Slovenia, 69 in Croatia, 41 in Bosnia and Herzegovina, 3 Serbia, 2 in Kosovo (these two being owned by a jointly controlled company) and 1 in Montenegro.
… � The sales of liquefied petroleum gas totalled 12.5 thousand tons,
up 9% on the same period of the previous year. In the first three months of 2009, the sales of natural gas totalled 46,176 thousand m3, an increase of 10% compared with the same period of the previous year.
…

Entered into the Companies Register of Ljubljana District Court, entry no. 1/05773/00, share capital: EUR 52,240,977.04, VAT ID: SI802674322 7/62
� In the first three months of 2009, the Petrol Group operated 27 gas supply concessions. At the end of March 2009, liquefied petroleum gas was supplied to customers also from 2,035 gas depots, which is 35 more than at the end of 2008.
… � In the first three months of 2009, the Petrol Group sold 74,253
MWh of electricity or 2% less than planned. …
� The Petrol Group's investments in fixed assets totalled EUR 10.5 million in the first three months of 2009.
… � At the end of March 2009, the Petrol Group had 3,587 employees,
which is 51 more than at the end of 2008.
Petrol d.d., Ljubljana � Gross invoiced sales totalled EUR 550,7 million.
… � Net sales revenue totalled EUR 463 million, down 18% on the
same period of 2008 and 6% less than planned. …
� Gross profit or loss from sales stood at EUR 49 million, down 1% compared with the same period of 2008 and 1% more than planned.
… � Operating profit or loss before the impairment of investments
amounted to EUR 5.4 million, down 57% from the same period of 2008 and 35% more than planned. Operating profit or loss after the impairment of investments stood at EUR -15.2 million.
… � Net profit or loss for the accounting period before the
impairment of investments totalled EUR 7.6 million, a decrease of 38% compared with the same period of 2008, but considerably more than planned. Operating net profit or loss after the impairment of investments stood at EUR -8.9 million.
…

Entered into the Companies Register of Ljubljana District Court, entry no. 1/05773/00, share capital: EUR 52,240,977.04, VAT ID: SI802674322 8/62
� Earnings per share1 before the impairment of investments stood at EUR 3.69, with earnings per share after the impairment of investments amounting to EUR -4.31.
… � Book value of share2: EUR 191.55.
… � In the first three months of 2009, Petrol d.d., Ljubljana sold 528
thousand tons of petroleum products, which is 5% less than in the same period of 2008 and 6% more than planned.
… � Revenue from the sale of supplementary and other merchandise
by Petrol d.d., Ljubljana stood at EUR 84.5 million, up 25% on the same period of 2008 and 8% above the plan.
… � On 14 January 2009, Andrej Bratož resigned as member of the
Supervisory Board. …
� At its 47th regular meeting held on 24 March 2009, the Supervisory Board of Petrol d.d., Ljubljana discussed and approved the Annual Report of the Petrol Group and the company Petrol d.d., Ljubljana for the year 2008.
… � The company Istrabenz d.d. notified Petrol of its disposal of
43,500 and 126,365 shares of Petrol d.d., Ljubljana (PETG), which represents 8.15% of voting rights. 126,365 PETG shares or 6.057% of voting rights were obtained by the company NLB d.d. on the basis of unfulfilled contractual obligations arising from a repurchase agreement. NLB d.d. then entered into an agreement with the company Poslovni sistem Mercator, d.d. which thus became the owner of 126,365 shares or a 6.057% equity interest.
… � Petrol d.d. Ljubljana was again among the finalists of the media
and research project Golden Thread, an award presented by the newspaper company Dnevnik to the best employers in 2008.
… � Petrol d.d., Ljubljana received the Superbrands award, which
stands for excellence in brand and product development. It is 1 Earnings per share = Net profit or loss for accounting period / Weighted average number of issued ordinary shares, excluding own shares 2 Book value of share = Equity at the end of accounting period / Number of ordinary shares issued
Entered into the Companies Register of Ljubljana District Court, entry no. 1/05773/00, share capital: EUR 52,240,977.04, VAT ID: SI802674322 9/62
awarded for recognition, reputation, appropriate strategic and marketing management of the brand, and trust demonstrated by customers through their loyalty.
Key impacts on operations
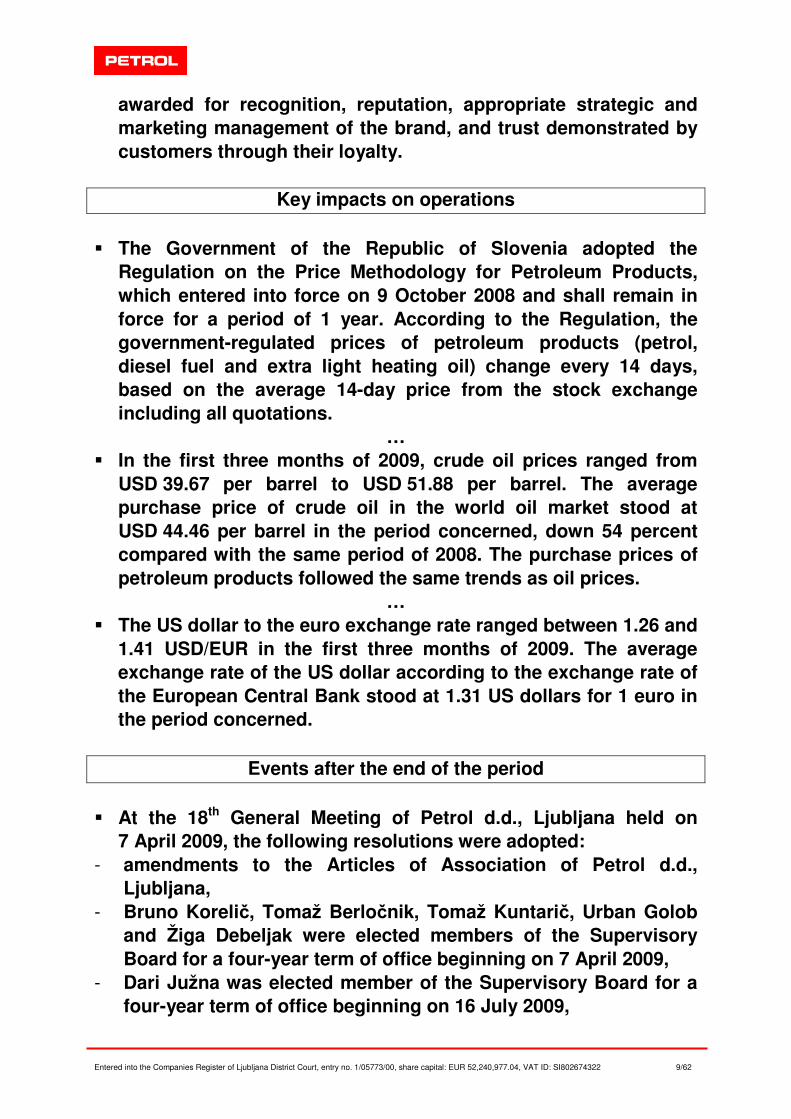
� The Government of the Republic of Slovenia adopted the
Regulation on the Price Methodology for Petroleum Products, which entered into force on 9 October 2008 and shall remain in force for a period of 1 year. According to the Regulation, the government-regulated prices of petroleum products (petrol, diesel fuel and extra light heating oil) change every 14 days, based on the average 14-day price from the stock exchange including all quotations.
… � In the first three months of 2009, crude oil prices ranged from
USD 39.67 per barrel to USD 51.88 per barrel. The average purchase price of crude oil in the world oil market stood at USD 44.46 per barrel in the period concerned, down 54 percent compared with the same period of 2008. The purchase prices of petroleum products followed the same trends as oil prices.
… � The US dollar to the euro exchange rate ranged between 1.26 and
1.41 USD/EUR in the first three months of 2009. The average exchange rate of the US dollar according to the exchange rate of the European Central Bank stood at 1.31 US dollars for 1 euro in the period concerned.
Events after the end of the period
� At the 18th General Meeting of Petrol d.d., Ljubljana held on
7 April 2009, the following resolutions were adopted: - amendments to the Articles of Association of Petrol d.d.,
Ljubljana, - Bruno Korelič, Tomaž Berločnik, Tomaž Kuntarič, Urban Golob
and Žiga Debeljak were elected members of the Supervisory Board for a four-year term of office beginning on 7 April 2009,
- Dari Južna was elected member of the Supervisory Board for a four-year term of office beginning on 16 July 2009,

Entered into the Companies Register of Ljubljana District Court, entry no. 1/05773/00, share capital: EUR 52,240,977.04, VAT ID: SI802674322 10/62
- amounts of meeting fees payable to Supervisory Board president and members.
… � At the 19th General Meeting of Petrol d.d., Ljubljana held on
5 May 2009, the following resolutions were adopted: - allocation of accumulated profit to dividends payable to
shareholders in the amount of EUR 12,309,175.90 or in the gross amount of EUR 5.90 per share from the 2004 other revenue reserves, and allocation of accumulated profit to other revenue reserves in the amount of EUR 2,294,931.10,
- appointment of the company KPMG Slovenija, podjetje za revidiranje, d.o.o., Ljubljana, as auditor of the financial report and reviewer of the business report for the year 2009.
… � On 22 April 2009, the Supervisory Board of Petrol d.d., Ljubljana
was convened for the first time in its new composition. At the meeting, Viktor Baraga resigned as member and president of the Supervisory Board. In accordance with provisions of the Companies Act, Supervisory Board members elected Tomaž Kuntarič as president and Bruno Korelič as vice-president of the Supervisory Board. They also appointed new members of the Audit Committee and the Human Resources and Management Board Evaluation Committee.
… � On 1 April 2009, the company Petrol Toplarna Hrastnik d.o.o. was
merged into Petrol Energetika d.o.o. …
� In April and May 2009, Petrol d.d., Ljubljana acquired a 0.3385-percent interest in the company Geoplin d.o.o., thereby increasing its equity interest to 30.36 percent.
… � On 23 April 2009, Petrol d.d., Ljubljana took over the operation of
Sežana waste treatment plant under the contract signed with the Municipality of Sežana on 8 April 2009. The company thus obtained a concession for the performance of public economic service of wastewater treatment in Sežana. Petrol d.d., Ljubljana purchased the waste treatment plant with the capacity of 6,000 population equivalents from the company Adriaplin d.o.o. which had built the plant and managed it since 2002.
Entered into the Companies Register of Ljubljana District Court, entry no. 1/05773/00, share capital: EUR 52,240,977.04, VAT ID: SI802674322 11/62
… � In April 2009, Petrol d.d., Ljubljana presented itself to investors
at the Slovene Capital Market Day event organised by the Ljubljana Stock Exchange and Central Securities Clearing Corporation in cooperation with their partners, stock exchange member, and at the investors’ conference in Zuers, Austria, which was organised by Raiffeisen Centrobank.
… � In April 2009, the traditional meeting of energy providers took
place in Portorož. The general sponsor of the event was Petrol d.d., Ljubljana. The event was prepared in cooperation with Jožef Stefan Institute’s Energy Efficiency Centre and the Ministry of the Environment and Spatial Planning. This year's theme was “Technological and business possibilities for implementing energy efficiency”.
… � Petrol d.d., Ljubljana is one the biggest sponsors of the 57th
Festival Ljubljana, which will take place under the honorary patronage of Ljubljana' mayor. The festival will host more than 80 events at which performers from more than 20 countries will give their performances.
… � Petrol d.d., Ljubljana took part in the humanitarian campaign –
The Mammography Machine Initiatives. Thanks to Petrol's donation, the General Hospital Izola received a state-of-the-art mammography machine which will be used to diagnose breast cancer in the Littoral-Karst region.
Entered into the Companies Register of Ljubljana District Court, entry no. 1/05773/00, share capital: EUR 52,240,977.04, VAT ID: SI802674322 12/62
BUSINESS REPORT
Profile of the Petrol Group
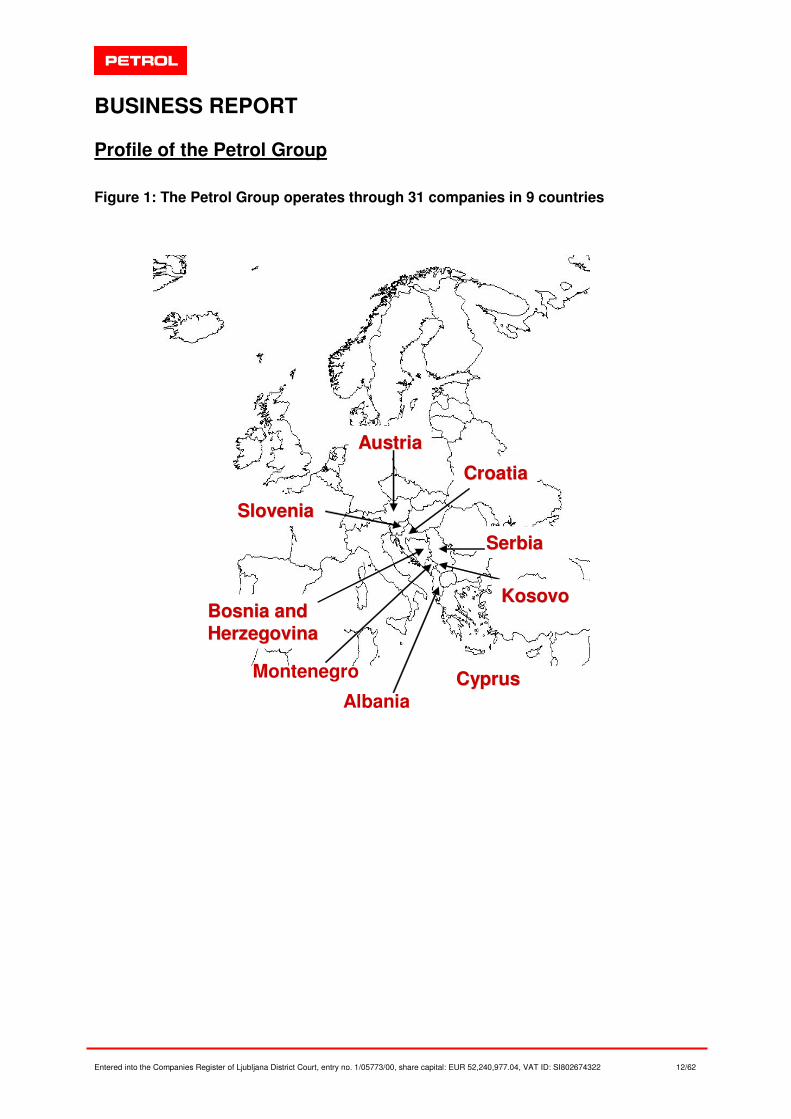
Figure 1: The Petrol Group operates through 31 companies in 9 countries
AustriaAustria
SloveniaSlovenia
BosniaBosnia andandHerzegovinaHerzegovina
CyprusCyprus
CroatiaCroatia
SerbiaSerbia
Montenegro
Albania
KosovoKosovo

Entered into the Companies Register of Ljubljana District Court, entry no. 1/05773/00, share capital: EUR 52,240,977.04, VAT ID: SI80267432 13/62
Table 1: Organisational structure of the Petrol Group
PETROL TOPLARNA HRASTNIK d.o.o.* AQUASYSTEMS d.o.o.
LEGENDA:
matična družba
odvisna podjetja
skupaj obvladovana podjetja
pridružena podjetja
* On 1 April 2009, the company Petrol Toplarna Hrastnik d.o.o. was merged into Petrol Energetika d.o.o.
GEOENERGO d.o.o.
OGREVANJE PIRAN d.o.o.
PETROL BH OIL COMPANY d.o.o. Sarajevo
EURO-PETROL d.o.o.
GEOPLIN d.o.o.
RODGAS AD Bačka Topola
ISTRABENZ d.d.
PETROL SKLADIŠČENJE d.o.o. PETROL TRGOVINA d.o.o., ZAGREB
PETROL GROUP
OIL AND MERCHANDISE SALES AND DISTRIBUTION OF GAS
ENVIRONMENT ACTIVITIESOTHER ENERGY ACTIVITIES
AND EFFICIENT ENERGY USE
SLOVENIA SE EUROPE
PETROL d.d.
PETROL TEHNOLOGIJA, d.o.o.
CYPET OILS Ltd. PETROL ENERGETIKA d.o.o.
PETROL-TRADE H.m.b.H. PETROL PLIN, d.o.o.
PETROL GAS GROUP d.o.o.
MARCHÉ GOSTINSTVO d.o.o.
BIO GORIVA d.o.o.
PETROL VNC d.o.o.
KARKASA, d.o.o.
PETROL-OTI-SLOVENIJA L.L.C.
PETROL SLOVENIA TIRANA WHOLESALE SH.A.
PETROL SLOVENIA TIRANA DISTRIBUTION SH.P.K.
CYPET-TRADE Ltd.
INSTALACIJA, d.o.o. KOPER
PETROL d.o.o. BEOGRAD
PETROL INVEST d.o.o.
PETROL-BONUS d.o.o.
PETROL MALOPRODAJA SLOVENIJA, d.o.o.

Entered into the Companies Register of Ljubljana District Court, entry no. 1/05773/00, share capital: EUR 52,240,977.04, VAT ID: SI80267432 14/62
Table 2: Profile of the parent company Petrol d.d., Ljubljana
Company name Petrol, slovenska energetska družba, d.d., LjubljanaAbbreviated company name Petrol d.d., LjubljanaRegistered office Dunajska 50,
1527 LjubljanaTelephone (01) 47 14 234Telefax (01) 47 14 809Website http://www.petrol.siActivity code 50.501Company registration number 5025796Tax number SI 80267432Share capital EUR million 52.24Number of shares 2,086,301President of the Management board Marko KryžanowskiVice-president of the Management board Igor Irgolič
Members of the Management boardBoštjan Napast, Alenka Vrhovnik Težak, Bojan Herman (worker director)
President of the Supervisory boardViktor Baraga (until 22 April 2009)Tomaž Kuntarič (since 23 April 2009)
Table 3: Subsidiaries, jointly controlled companies and associates in the Petrol Group as at 31/03/2009
SubsidiariesCountry of Registered
officeOwnership
in % PETROL MALOPRODAJA SLOVENIJA, d.o.o. Slovenia 100PETROL PLIN, d.o.o. Slovenia 100PETROL SKLADIŠČENJE d.o.o. Slovenia 100PETROL TEHNOLOGIJA, d.o.o. Slovenia 100PETROL ENERGETIKA d.o.o. Slovenia 99.33PETROL VNC d.o.o. Slovenia 100CYPET OILS Ltd. Cyprus 100PETROL-TRADE H.m.b.H., Austria 100
includingCYPET-TRADE Ltd. Cyprus 100
PETROL TRGOVINA d.o.o., ZAGREB Croatia 100PETROL BH OIL COMPANY d.o.o. SARAJEVO Bosnia and Herzegovina 100PETROL d.o.o. BEOGRAD Serbia 100PETROL GAS GROUP d.o.o. Serbia 100RODGAS AD Serbia 84.22PETROL INVEST d.o.o. Montenegro 100EURO-PETROL d.o.o. Croatia 51PETROL TOPLARNA HRASTNIK, d.o.o. Slovenia 100
Joint venturesPETROL SLOVENIA TIRANA WHOLESALE SH.A. Albania 55
includingPETROL SLOVENIA TIRANA DISTRIBUTION SH.P.K. Albania 100
GEOENERGO d.o.o. Slovenia 50INSTALACIJA, d.o.o. KOPER Slovenia 49KARKASA, d.o.o. Slovenia 50PETROL-BONUS d.o.o. Montenegro 50PETROL - OTI - SLOVENIJA L.L.C. Kosovo 51
AssociatesMARCHE GOSTINSTVO d.o.o. Slovenia 25OGREVANJE PIRAN d.o.o. Slovenia 40AQUASYSTEMS d.o.o. Slovenia 26GEOPLIN d.o.o. Slovenia 30.02ISTRABENZ d.d. Slovenia 32.63BIO GORIVA d.o.o. Slovenia 25

Entered into the Companies Register of Ljubljana District Court, entry no. 1/05773/00, share capital: EUR 52,240,977.04, VAT ID: SI80267432 15/62
Petroleum activity Sales of petroleum products The Petrol Group In the first three months of 2009, the Petrol Group3 sold 580 thousand tons of oil and petroleum products, which is 12 percent more than planned and 5 percent more than in the same period of the previous year. The Group sold 46 percent more extra light heating oil than in the same period of 2008, with the sales of motor fuels (petrol and diesel fuel) decreasing by 4 percent. Good sales of heating oil are the result of relatively low prices and low winter temperatures. On the other hand, lower sales of motor fuels were largely affected by uncompetitive prices in Slovenia's border area, which are the result of higher excise duties, and economic downturn, which was reflected in decreased freight traffic and construction works. In Slovenia, the Petrol Group sold 440 thousand tons of petroleum products in the first three months of 2009, which accounts for 76 percent of the Petrol Group’s total sales. In the same period, the Group sold 110 thousand tons of petroleum products in the markets of Southeast Europe, representing 19 percent of the Petrol Group’s total sales, and 30 thousand tons in the EU market, which represents 5 percent of the Group's total sales. In the first three months of 2009, the Petrol Group sold 46 percent of oil and petroleum products in the retail market, selling the remaining 54 percent in the wholesale market. At the end of March 2009, the Petrol Group's retail network consisted 428 service stations, of which 312 were in Slovenia, 69 in Croatia, 41 in Bosnia and Herzegovina, 3 Serbia, 2 in Kosovo (these two being owned by a jointly controlled company) and 1 in Montenegro. Key impacts on operations Setting of fuel prices in Slovenia On 9 October 2008, the Government of the Republic of Slovenia adopted the Regulation on the Price Methodology for Petroleum Products which shall remain in force for 1 year. According to the Regulation, the government-regulated prices of petroleum products (petrol, diesel fuel and extra light heating oil) change every 14 days, based on the average 14-day price from the stock exchange including all quotations. Since 15 December 2008, quotations for petrol and diesel of improved quality have been used for calculating retail prices. In the Regulation on the Price Methodology for Petroleum Products, the model-based margin (for petrol, diesel fuel and extra light heating oil) is set at a fixed amount.
3 In addition to the parent company Petrol d.d., Ljubljana, the following Petrol Group companies sold oil and petroleum products in the first three
months of 2009: Petrol Trgovina, d.o.o., Zagreb, Petrol BH Oil Company d.o.o., Petrol d.o.o Beograd, Petrol-Trade H.m.b.H., Cypet-Trade Ltd.,
Petrol Plin d.o.o and Euro-Petrol d.o.o.

Entered into the Companies Register of Ljubljana District Court, entry no. 1/05773/00, share capital: EUR 52,240,977.04, VAT ID: SI80267432 16/62
Setting of fuel prices in Croatia In Croatia, the prices of petroleum products, i.e. petrol, diesel fuel and extra light heating oil, are also government-regulated. They are set in accordance with the Petroleum Product Pricing Rules (“Pravilnik o utvrđivanju cijena naftnih derivata”) which have been in force since 4 January 2009. The prices change fortnightly according to the prescribed methodology, provided that prices, inclusive of all duties, increase or decrease by more than 2 percent. The prescribed methodology for setting maximum permitted retail prices of fuel is similar to the methodology in place in Slovenia. Also, the harmonisation of prices is subject to changes in prices in the oil market and changes in the exchange rate of the US dollar against the national currency. Despite the above model, the leading oil company, INA, which in contrast to its previous practice set retail prices at service stations at the maximum permitted level in the first three months of 2009, plays a major role in the setting of prices in the Croatian market. Setting of fuel prices in Bosnia and Herzegovina In Bosnia and Herzegovina, retail prices of petroleum prices are not government-regulated and are set freely in accordance with market conditions. The prices change weekly. In the Federation of Bosnia and Herzegovina, retailers notify the Federal Ministry of Commerce of new retail prices three days in advance, whereas in the Republic of Srpska changes in prices need not be notified in advance. Despite the free setting of prices, retail fuel prices do not vary significantly between service stations, but they are slightly lower in the Republic of Srpska, which enjoys lower purchase prices thanks to its supply sources. Setting of fuel prices in Serbia In Serbia, the prices of petroleum products are regulated by the Government and set in accordance with the Petroleum Product Pricing Regulation (“Uredba o cenama derivata nafte”). The prescribed margin for all petroleum products amounts to RSD 5 per litre, except for eurodiesel, where it amounts to RSD 10 per litre. Under the applicable legislation, the prices are harmonised every fifteen days, subject to certain conditions. Setting of fuel prices in Montenegro In Montenegro, the prices of petroleum products are set in accordance with the Regulation on the Method of Setting Maximum Retail Prices (“Uredba o načinu obrazovanja maksimalnih maloprodajnih cijena”), which has been in force since 1 January 2003. The prices are thus changed fortnightly, reflecting changes in the oil market (Platt's European Marketscan) and in the exchange rates of the euro and US dollar. In addition to market oil prices and changes in the exchange rates, the price calculation methodology also includes all taxes and charges as well as the oil companies’ margin. Setting of fuel prices in Kosovo In Kosovo, retail and wholesale prices of petroleum products are not government-regulated. Only in petroleum product sales to government institutions and state-owned companies are prices set in accordance with the prescribed methodology, which takes into account market

Entered into the Companies Register of Ljubljana District Court, entry no. 1/05773/00, share capital: EUR 52,240,977.04, VAT ID: SI80267432 17/62
prices, changes in the exchange rate of the euro and US dollar, logistics costs and the maximum margin. This price represents an unofficial basis for setting retail prices, which change two to three times a month. Changes in oil and petroleum product prices in the world market In the first three months of 2009, the average price of Brent Dated crude oil was USD 44.46 per barrel. In the period concerned, the price of Brent crude peaked on 23 March, reaching USD 51.88 per barrel. Its lowest price was recorded on 18 February, when it stood at USD 39.67 per barrel. Compared with the same period of 2008, the average price was lower by 54.06 percent in 2009. The purchase prices of petrol and middle distillates followed the same trends as crude oil prices. Figure 2: Changes in the price of Brent Dated High in the first three months of 2009 in USD
SOURCE: Petrol, 2009 The record high oil prices observed in the first half of 2008 were more than halved in the last six months of 2008. The financial crisis and the deepening of the economic recession in the most developed countries, especially in the US, was also reflected in substantially lower oil prices. In the first three months of 2009, oil prices were on a par with the trend observed in the last months of 2008. They only slightly increased due to aggravation of the natural gas supply dispute between Russia and Ukraine, but this did not have a lasting impact on the growth in prices. Worsened situation in the Middle East was another factor that contributed to a slight increase in oil prices. Oil price movements in the first three months of 2009 were mainly subject to weak demand, with productions cuts in OPEC countries causing no increases in the prices. According to OPEC, oil prices should be in the area between 60 and 75 USD/barrel, which is rather unrealistic at this stage given the poor economic growth prospects. Economic measures taken by governments of the most development countries to tackle the economic crisis are yet to produce concrete results in terms of reviving the economy. Oil prices did increase
9APR09
2JAN09 to 31MAR09
Brent Dated High
Max. 51.88 Min. 39.67 Mean 44.46 Std.Dev. 2.89 Last 46.53
38
40
42
44
46
48
50
52
54
JAN09 FEB09 MAR09 38
40
42
44
46
48
50
52
54
U S $ / B b l
Entered into the Companies Register of Ljubljana District Court, entry no. 1/05773/00, share capital: EUR 52,240,977.04, VAT ID: SI80267432 18/62
somewhat when the US government adopted its economic measures, only to drop again below 50 USD/barrel. Oil price movements will continue to be most affected by expectations regarding the recovery from recession and reinvigoration of economic activities, as well as by US oil stocks data and demand in China. Additional production cuts by OPEC failed to push the prices up because Brazil and Russia did not join OPEC's efforts to increase prices, but are instead raising production and, consequently, increasing their market share in the United States. Changes in the US dollar to the euro exchange rate The US dollar to the euro exchange rate ranged between 1.26 and 1.41 USD/EUR in the first three months of 2009. The average exchange rate of the US dollar according to the exchange rate of the European Central Bank stood at 1.31 US dollars for 1 euro in the period concerned. Sales of supplementary and other merchandise The Petrol Group In the first three months of 2009, the Petrol Group4 generated EUR 90.6 million in revenue from the sale of supplementary5 and other merchandise6, an increase of 20 percent compared with the same period of the previous year and 8 percent more than planned. EUR 89 million was generated through the sale of supplementary merchandise, which is 22 percent more than in the same period of 2008 and 8 percent more than planned, while EUR 2 million was generated through the sale of other merchandise, which is 4 percent less than planned. In the first three months of 2009, the sales within the lottery ticket, coupon and card segment increased the most compared with the previous year, in particular due to the sale of vignettes. Sales of services
The majority of the Petrol Group’s revenue from services is generated by Petrol d.d., Ljubljana. The services include renting of business premises and hospitality facilities, transportation, carwash services, Magna services, management of storage facilities of ZORD and ZRSBR, waste treatment plant services, “coffee to go”, sales promotions and other services. In the first three months of 2009, Petrol d.d., Ljubljana generated EUR 8.5 million in revenue from the sale of services, which is 7 percent more than planned and up 10 percent on the same period of the previous year. Revenue from services increased mainly thanks to the “coffee to go” service, sales promotions, transportation and renting.
4 In addition to the parent company Petrol d.d., Ljubljana, supplementary and other merchandise is sold by the following Petrol Group companies:
Petrol Trgovina d.o.o., Zagreb, Petrol BH Oil Company d.o.o., Petrol d.o.o. Beograd and Euro-Petrol d.o.o. 5 Supplementary merchandise is comprised of automotive products, foodstuffs, accessories, tobacco and lottery products, coupons and cards. 6 Other merchandise is comprised in particular of raw materials and chemical products.

Entered into the Companies Register of Ljubljana District Court, entry no. 1/05773/00, share capital: EUR 52,240,977.04, VAT ID: SI80267432 19/62
Gas activity In the first three months of 2009, the Petrol Group7 operated 27 gas supply concessions (22 for the supply of natural gas and 5 for the supply of liquefied petroleum gas). Twenty-one concessions are operated by Petrol Plin d.o.o. (three of which are owned by Petrol d.d., Ljubljana), four by Petrol Energetika d.o.o., one by Rodgas AD in Bačka Topola, and one by Petrol Gas Group d.o.o. in the Municipality of Pećinci. The company Petrol Gas Group d.o.o. will begin to generate revenue from the supply of natural gas in the second half of the year because its distribution network is currently still under construction. At the end of March 2009, liquefied petroleum gas was supplied to customers also from 2,035 gas depots, which is 35 more than at the end of 2008. In the first three months of 2009, the Petrol Group sold 12.5 thousand tons of liquefied petroleum gas, exceeding the plan by 27 percent and the sales in the same period of the previous year by 9 percent. The Group also sold 32.4 thousand tons (46,176 thousand m3) of natural gas, which is 7 percent more than planned 10 percent more than in the same period of the previous year.
Other energy activities and efficient energy consumption Production, sales and distribution of electricity and heat In the first three months of 2009, the Petrol Group8 sold 74,253 MWh of electricity, which is 2 percent less than planned and 23 percent less than in the same period of the previous year. The decrease in the sales arises from the fact that the Group lost the customer Štore Steel d.o.o. Out of the total quantity sold, 16,851 MWh were produced through co-generation and 53,000 MWh were distributed. In the first three months of 2009, the Petrol Group sold 27,368 MWh of heat, thus exceeding the sales in the previous year by 47 percent and accomplishing 95 percent of the plan. Efficient energy consumption projects and other energy projects Efficient energy consumption (EEC) is a concept used by the Petrol Group to provide its partners with guaranteed efficiency in the consumption of energy products, with optimal management of energy plants and, as a result, with energy cost savings, through proper management, financing9 and implementation of the entire energy project. Within the Petrol Group, efficient energy consumption (EEC) projects that are based on a third party financing (TPF) model are undertaken by the parent company Petrol d.d., Ljubljana. In the first three months of 2009, all existing efficient energy consumption projects were run as planned. 7 The following Petrol Group companies are engaged in gas activity: Petrol d.d., Ljubljana, Petrol Plin d.o.o., Petrol Energetika d.o.o., Petrol
Trgovina, d.o.o., Zagreb, Petrol BH Oil Company d.o.o., Petrol d.o.o. Beograd, Petrol-Trade H.m.b.H., Rodgas AD, Bačka Topola, Euro-Petrol
d.o.o. and Petrol Gas Group d.o.o. 8 Within the Petrol Group, the companies engaged in the production, sales and distribution of electricity and heat are Petrol Energetika d.o.o. and
Petrol Toplarna Hrastnik d.o.o.
9 Third party financing (TPF)
Entered into the Companies Register of Ljubljana District Court, entry no. 1/05773/00, share capital: EUR 52,240,977.04, VAT ID: SI80267432 20/62
Environment activities
In the first three months of 2009, the Petrol Group held concessions for the operation of municipal wastewater treatment plants and the performance of public economic service of municipal wastewater treatment in the Municipality of Murska Sobota (capacity of 42,000 population equivalents) and in the Municipality of Mežica (capacity of 4,000 population equivalents). Both waste treatment plants operated as planned in the first three months of 2009. As an important member of Aquasystems d.o.o., Petrol d.d., Ljubljana is also involved in the treatment of municipal wastewaters in the Municipality of Maribor (capacity of 190,000 population equivalents).
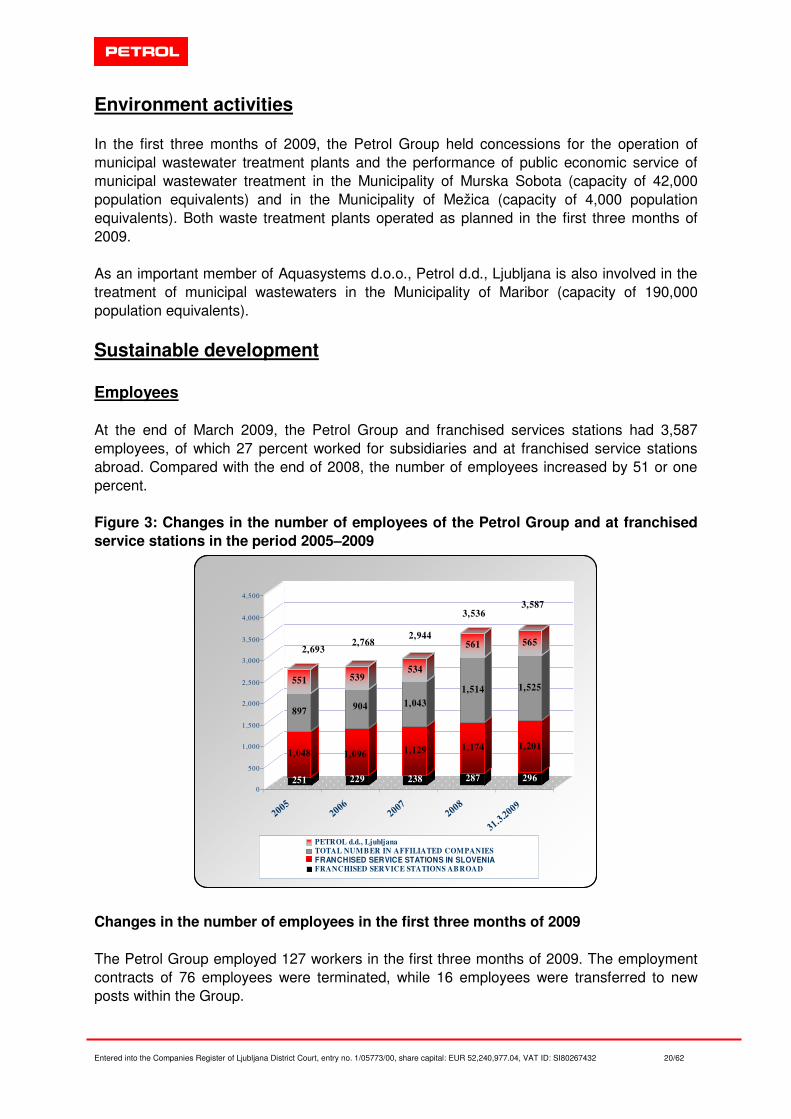
Sustainable development Employees At the end of March 2009, the Petrol Group and franchised services stations had 3,587 employees, of which 27 percent worked for subsidiaries and at franchised service stations abroad. Compared with the end of 2008, the number of employees increased by 51 or one percent. Figure 3: Changes in the number of employees of the Petrol Group and at franchised service stations in the period 2005–2009
251
1,048
897
551
229
1,096
904
539
238
1,129
1,043
534
287
1,174
1,514
561
296
1,201
1,525
565
0
500
1,000
1,500
2,000
2,500
3,000
3,500
4,000
4,500
20052006
20072008
31.3.2
009
PETROL d.d., Ljubljana
TOTAL NUMBER IN AFFILIATED COMPANIES
FRANCHISED SERVICE STATIONS IN SLOVENIAFRANCHISED SERVICE STATIONS ABROAD
2,6932,768
2,944
3,5363,587
Changes in the number of employees in the first three months of 2009 The Petrol Group employed 127 workers in the first three months of 2009. The employment contracts of 76 employees were terminated, while 16 employees were transferred to new posts within the Group.

Entered into the Companies Register of Ljubljana District Court, entry no. 1/05773/00, share capital: EUR 52,240,977.04, VAT ID: SI80267432 21/62
Table 4: Changes in the number of employees of the Petrol Group and at franchised service stations in the first three months of 2009
Joined Left Joined Left
Petrol d.d. 565 13 9 0 0 13 9 561
Subsidiaries 1,525 51 36 6 10 57 46 1,514
Franchised service in Slovenia 1,201 53 23 2 5 55 28 1,174
Franchised service abroad 296 10 8 8 1 18 9 287
The Petrol Group 3,587 127 76 16 16 3,536
Total number of people left in 2009
Balance as at 31.12.2008in the Company in the Petrol Group
Balance as at 31.3.2009
New employments/employment terminations in 2009
Internal transfer of employees in 2009
Total number of people joined in
2009
Organisational unit
Employee structure At the end of March 2009, the average age of Petrol Group employees was 41 years. 69 percent of employees were male and 31 percent were female. The educational structure of the Petrol Group has been improving over the years. This is a result of employee training on the one hand and HR policy on the other. Newly hired employees with higher education thus improve the educational structure, while at the same time employees with lower education leave the company. In this respect it should be noted that the Petrol Group is interested in the training of its employees and devotes much attention to it because knowledge represents one of Petrol’s key competitive advantages. As at 31/03/2009, the average education level of Petrol Group employees, as measured on a scale of 1 to 8, stood at 4.7, meaning that on average employees have completed secondary school. Training In the first three months of 2009, 1,626 individuals took part in various forms of training and 90 participated in a formal education process. In all, the Petrol Group provided 16,541 teaching hours of training, which represents, on average, 5 teaching hours of training per employee in the period concerned. In the same period, the company continued to carry out management and sales programmes at service stations, technical and legally required training, and innovation workshops. At the Petrol Group, particular attention is given to the training of outworkers (hauliers and students) and customers. In the period concerned, several seminars were organised in this field, which were attended by 351 participants. Motivation of employees Performance acknowledgment Performance orientation is the basis of the Petrol Group’s remuneration system. Salaries thus consist of a fixed and variable part. Collective performance, which is calculated using a performance benchmark, is an important component of variable pay. For service stations and regional retail and wholesale units, the performance is calculated on a monthly basis, for
Entered into the Companies Register of Ljubljana District Court, entry no. 1/05773/00, share capital: EUR 52,240,977.04, VAT ID: SI80267432 22/62
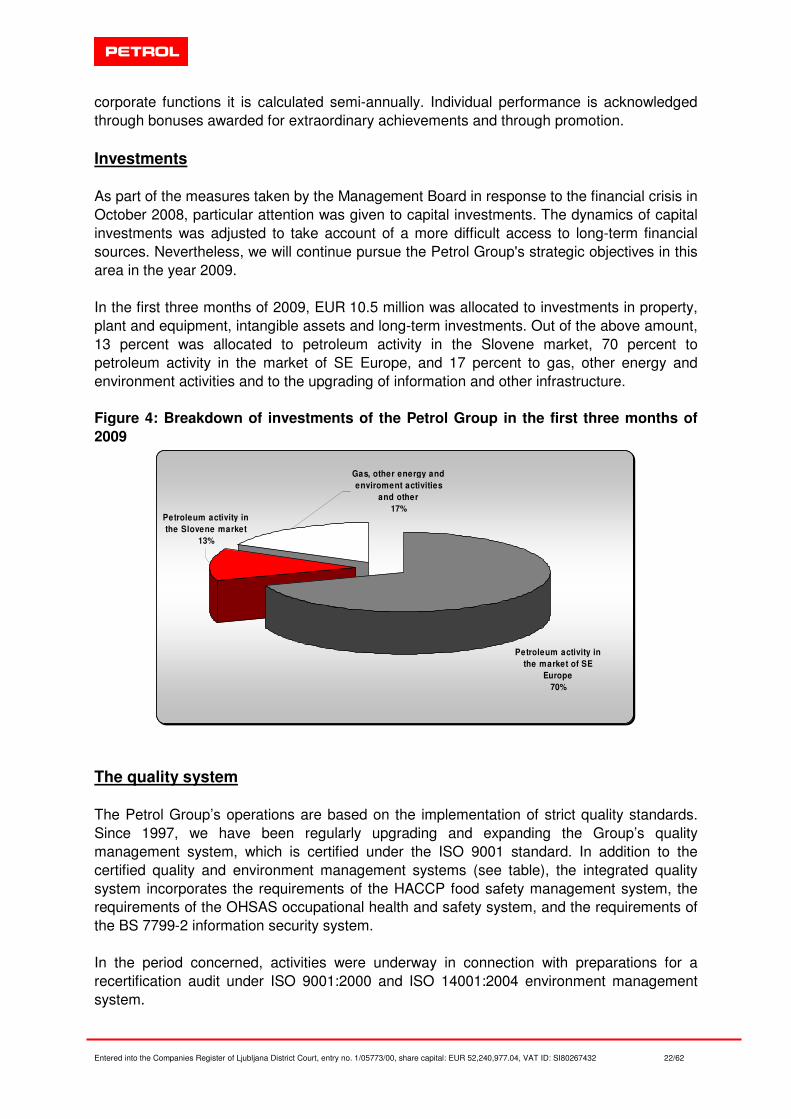
corporate functions it is calculated semi-annually. Individual performance is acknowledged through bonuses awarded for extraordinary achievements and through promotion. Investments As part of the measures taken by the Management Board in response to the financial crisis in October 2008, particular attention was given to capital investments. The dynamics of capital investments was adjusted to take account of a more difficult access to long-term financial sources. Nevertheless, we will continue pursue the Petrol Group's strategic objectives in this area in the year 2009. In the first three months of 2009, EUR 10.5 million was allocated to investments in property, plant and equipment, intangible assets and long-term investments. Out of the above amount, 13 percent was allocated to petroleum activity in the Slovene market, 70 percent to petroleum activity in the market of SE Europe, and 17 percent to gas, other energy and environment activities and to the upgrading of information and other infrastructure. Figure 4: Breakdown of investments of the Petrol Group in the first three months of 2009
Petroleum activity in the market of SE
Europe70%
Gas, other energy and enviroment activities
and other17%
Petroleum activity in the Slovene market
13%
The quality system The Petrol Group’s operations are based on the implementation of strict quality standards. Since 1997, we have been regularly upgrading and expanding the Group’s quality management system, which is certified under the ISO 9001 standard. In addition to the certified quality and environment management systems (see table), the integrated quality system incorporates the requirements of the HACCP food safety management system, the requirements of the OHSAS occupational health and safety system, and the requirements of the BS 7799-2 information security system. In the period concerned, activities were underway in connection with preparations for a recertification audit under ISO 9001:2000 and ISO 14001:2004 environment management system.

Entered into the Companies Register of Ljubljana District Court, entry no. 1/05773/00, share capital: EUR 52,240,977.04, VAT ID: SI80267432 23/62
At Petrol Tehnologija, d.o.o., a review was performed for the purpose of expanding the accreditation. Three testing methods associated with flow meter control were assessed under MID (Measurement Instrument Directive). Petrol Tehnologija, d.o.o. now has 13 accredited testing methods. Table 5: Overview of certificates and laboratory accreditations Company Quality
management system
Environment management system
Laboratory accreditations
Petrol d.d., Ljubljana ISO 9001: 2000 ISO 14001: 2004 SIST EN ISO/IEC 17025 : 2005
Petrol Skladiščenje d.o.o. ISO 9001: 2000 ISO 14001: 2004 / Petrol Tehnologija, d.o.o. ISO 9001: 2000 ISO 14001: 2004 SIST EN ISO/IEC 17020
: 2004 Petrol Energetika d.o.o. ISO 9001: 2000 ISO 14001: 2004 / Petrol Plin, d.o.o. ISO 9001: 2000 ISO 14001: 2004 / Petrol Trgovina d.o.o., Zagreb
ISO 9001: 2000 / /
Business risks Past events affecting business risks and their management In the first three months of 2009, business risk management at the Petrol Group was marked by the continuation of the financial crisis, which has also hit the real sector. The difficulties of the banking industry lead to uncertainty, particularly in the fields of interest rate, credit and liquidity risk management. Realising that a weakened liquidity of banks and unfavourable financing conditions could significantly affect the operations of companies and individuals, the Petrol Group stepped up its vigilance with regard to the management of financial risks. We pay additional attention to the solvency of customers and, consequently, to the balance of operating receivables. The liquidity or short-term solvency of Petrol Group companies is ensured through central management and reconciliation of current cash flows. We are thus able to successfully adapt to the financial situation despite rapidly changing capital and financial markets. Petrol's business risk model and most relevant and probable business risks In the field of risk management, a reassessment of the 2008 business risks was performed at the end of 2008. Participating in the business risk assessment process were the Management Board of Petrol d.d., Ljubljana, advisors to the Management Board, directors of departments of Petrol d.d., Ljubljana, and directors of subsidiaries from the Petrol Group. For the purpose of simplifying the assessment and obtaining more realistic results, individual business risks were classified into 20 business risk groups based on their characteristics. In addition, the assessment methodology was expanded to include value variables (a 5-grade

Entered into the Companies Register of Ljubljana District Court, entry no. 1/05773/00, share capital: EUR 52,240,977.04, VAT ID: SI80267432 24/62
scale of relevance and probability (frequency) was established in respect of individual business risks). In the first three months of 2009, we prepared a report on business risks of the Petrol Group for the year 2008, which includes the results of the latest assessment of business risks, an overview of the implementation of business risk management recommendations from previous periods, and new recommendations for an even better management of business risks in the Petrol Group. Petrol’s business risk model comprises 20 business risk categories that are divided into two major groups: - environment risks and - operating risks. According to the results of the 2008 business risk assessment, the most relevant and probable business risks comprise all financial risks, i.e. price risk, currency risk, credit risk, liquidity risk, interest rate risk and financial instrument risk. In addition to financial risks, most relevant and probable risks also include financial environment risk, commercial risk, risk of strategic decision-making, risk of business and financial decision-making and economic environment risk. Individual financial risks of the Petrol Group and the procedures put in place to hedge against them are specified below. Price and currency risk The Petrol Group purchases petroleum products under conditions on international markets, pays for them in US dollars and sells them in local currencies. Because the US dollar and the global oil market constitute two of the most volatile global markets, the Petrol Group is exposed to the currency risk (changes in EUR/USD exchange rate) and the price risk (changes in prices of petroleum products) when pursuing its core line of business. Since April 2000, the pricing model for petroleum products has allowed changes in world prices of petroleum products and exchange rates to be passed on to domestic prices. This has significantly reduced the Petrol Group’s exposure to price and currency risk. The Petrol Group hedges against price risks by harmonising the procurement and sales price formulas of petroleum products, but also by using appropriate financial instruments. In certain cases, it hedges against changes in petroleum product prices at the OTC market (direct transactions between two parties outside the stock exchange) using price and commodity swaps. These precautions are mainly aimed at matching the prices recognised by the petroleum product-pricing model. Our business partners in this area are international financial organisations, banks and major oil corporations, which supply petroleum products to the Petrol Group. In the first three months of 2009, the Petrol Group paid for purchases of petroleum products within deadlines standard for the oil business (30 days of the B/L), thus exposing its business to currency risks, i.e. to changes in the EUR/USD exchange rate occurring in the period between the transaction date and the payment date. The controlling company uses forward contracts on EUR/USD entered into with Slovene banks to hedge against currency risks. The
Entered into the Companies Register of Ljubljana District Court, entry no. 1/05773/00, share capital: EUR 52,240,977.04, VAT ID: SI80267432 25/62
value of such forward contracts is determined by the sales department and the finance department, which coordinate their work weekly so as to ensure optimal hedging against currency risks in the time when the economic crisis makes the forecasting of sales volumes an even more demanding task. Moreover, the controlling company supervises and offers advice on hedging against currency risks also to its subsidiaries. The Group enters into transactions with derivatives only to hedge against price and currency risks and not for reasons of speculative nature. Credit risk In the time of the economic crisis, we estimate that the management of credit risk is the most demanding of all. Lay away sales mean exposure to the counterparty risk. As part of the measures taken to mitigate the consequences of the financial crisis in October 2008, the Management Board of Petrol d.d., Ljubljana drew attention to the area of receivables management in which the company should intensify the collection of receivables, consistently apply the rules on blocking sales to defaulting customers, and accelerate the use of legal remedies to collect receivables. The company offers deferred payments out of the need to provide its customers with at least some form of crediting and thereby increase its sales revenue. The sales function is thus in constant conflict between the tendency to increase sales and, given the increased number of defaults, the tendency to keep the balance of receivables at manageable levels. The controlling company and its subsidiaries actively monitor the balance of operating receivables using a decentralisation principle, while conducting a uniform policy on payment terms and potential exposure to individual customers or groups of customers. Receivables are systematically monitored by age, region and organisational unit as well as by quality and individual customer. To monitor receivables, we use a shared computer-based receivables management application, providing us with automated control over exposure to individual customers and the possibility to respond immediately. The process of managing counterparty risks involves active involvement of numerous functions, and employees regularly meet and adopt appropriate measures. Despite the general weakening of the financial strength of our customers due to liquidity problems, decreased production and reduced exports, we estimate that the Petrol Group is not exposed to significant credit risks in relation to any individuals or groups of individuals that could pose a significant single risk. Our estimate relies on the nature of our products, our market share and diversified customer base. Through information support and exchange of information between all company employees, we actively monitor credit ratings of our customers and suppliers. Given the risk assessment for the current year, customers are required to provide a wider range of security types. To this end, the Petrol Group uses numerous types of credit insurance (mortgages, pledges, bank guarantees, collaterals, promissory notes, etc.).

Entered into the Companies Register of Ljubljana District Court, entry no. 1/05773/00, share capital: EUR 52,240,977.04, VAT ID: SI80267432 26/62
Liquidity risk The financial crisis in the Slovene and global financial market resulted in a considerably reduced liquidity of the banking industry. The weakened liquidity of banks and unfavourable financing conditions significantly affect the operations of companies and individuals. For this reason, the Petrol Group is exercising greater caution in maintaining its short-term solvency, which is achieved through central management and careful planning and coordination of cash flows within the Group. The controlling company and its subsidiaries use dedicated automated tools to plan and monitor daily liquidity, giving them detailed insight into and control over cash flows. The overall uncertainty makes the planning of cash flows considerably more difficult. Because a substantial number of our customers have problems financing their operations due to the general increase in the number of defaults and decrease in sales, cash inflows from lay away sales are the most difficult to plan. To be able to efficiently manage our cash flows, we introduced in 2006 a cash pooling system for all Slovene subsidiaries. Due to tax and economic reasons (costs of payment transactions, foreign exchange differences), subsidiaries in SE Europe markets are not yet able to take advantage of the system. The Petrol Group is capable of meeting all of its outstanding liabilities at any given moment as it has, in addition to its own funds, access to liquidity reserves through approved credit lines with domestic and foreign banks. It thus maintains a high credit rating with its business partners and financial organisations at home and abroad. Owing to the lower prices of petroleum products, we required less working capital and, consequently, a smaller number of credit lines in the first three months of 2009. The Petrol Group ensures its long-term solvency by establishing a proper financial balance. This is achieved through the creation and continuous establishment of appropriate financing structure and maturity, which proved especially difficult in recent months because banks, concerned for their own liquidity, have only been granting short-term loans since autumn 2008. Due to uncertainty in the banking industry, a lot of time and attention is dedicated to daily communication with banks. Interest rate risk The Petrol Group regularly monitors its exposure to the interest rate risk. Its long-term loans contain a variable interest rate which is linked to EURIBOR. In the first three months of 2009, EURIBOR decreased by half, but interest rates remained largely the same because the banks increased their interest margins. In addition, banks have also considerably increased other costs associated with financing. To hedge against exposure to the interest rate risk, a portion of variable interest rates is transformed into a fixed interest rate using derivative financial instruments. Exposure to the interest rate risk is hedged up to the amount of half of the Petrol Group's net interest position. When deciding whether to pursue additional hedging activities, forecasts regarding interest rate changes are considered. The time of hedging and the type of instruments used to this effect are determined on the basis of market conditions.

Entered into the Companies Register of Ljubljana District Court, entry no. 1/05773/00, share capital: EUR 52,240,977.04, VAT ID: SI80267432 27/62
In the first three months of the year, no additional interest rate hedges were concluded because we estimated that the European Central Bank will further reduce its interest rates to revive the economy.
The share Price trends in world and European stock markets did show signs of considerable improvement in the first quarter of 2009. Similar situation was observed at the Ljubljana Stock Exchange. The indices of the majority of the stocks comprising the Slovene stock exchange index (SBI20) declined in the period concerned. In the period from January to March 2009, the Slovene Stock Exchange Index (SBI20), one of the fundamental indicators of the situation at the Ljubljana Stock Exchange, dropped by 4.0 percent relative to its value at the end of 2008, with Petrol’s share dropping by 11.4 percent.
Figure 5: Changes in Petrol d.d., Ljubljana’s average price base index and changes in the SBI20 index in the first three months of 2009 relative to the end of 2008
85
87
89
91
93
95
97
99
101
103
105
107
109
31.1
2.20
08
9.1.
2009
16.1
.200
9
23.1
.200
9
30.1
.200
9
6.2.
2009
13.2
.200
9
20.2
.200
9
27.2
.200
9
6.3.
2009
13.3
.200
9
20.3
.200
9
27.3
.200
9
Ind
ex v
alu
e
Petrol SBI20
In the first three months of 2009, the price of Petrol’s share ranged between EUR 230.66 and EUR 286.13 per share, while its average price in the period stood at EUR 260.62. Earnings per share10 before the impairment of investments stood at EUR 3.69, with earnings per share after the impairment of investments amounting to EUR -4.31. The share's book value11 stood at EUR 191.55. Petrol d.d., Ljubljana had 39,670 shareholders as at 31/03/2009.
10 Earnings per share = Net profit or loss for the period / Weighted average number of issued ordinary shares, excluding own shares
11 Book value of share = Equity at the end of the period / Number of all shares

Entered into the Companies Register of Ljubljana District Court, entry no. 1/05773/00, share capital: EUR 52,240,977.04, VAT ID: SI80267432 28/62
Figure 6: Average price and the volume of trading in Petrol's share in the first three months of 2009
200
210
220
230
240
250
260
270
280
290
300
5.1.
2009
13.1
.200
9
21.1
.200
9
29.1
.200
9
6.2.
2009
16.2
.200
9
24.2
.200
9
4.3.
2009
12.3
.200
9
20.3
.200
9
30.3
.200
9
Ave
rag
e p
rice
(E
UR
)
0
50
100
150
200
250
300
350
400
450
500
Tra
din
g in
sh
are
s
Average price Trading in shares
Figure 7: Ownership structure of Petrol d.d., Ljubljana as at 31/03/2009
Slovenska odškodninska družba d.d.
19.7%
Banks14.7%
Kapitalska družba Group8.9%
Insurance copm anies1.2%
Other35.8%
Other inves tors18.5%
Treas ury shares fund1.2%
Table 6: Changes in the ownership structure of Petrol d.d., Ljubljana
Numberof shares in %
Numberof shares in %
Slovenska odškodninska družba d.d. 412,009 19.7% 412,009 19.7%Kapitalska družba Group 185,240 8.9% 185,240 8.9%Banks 306,232 14.7% 309,300 14.8%Insurance copmanies 24,548 1.2% 24,700 1.2%Other investors 385,721 18.5% 379,568 18.2%Other 747,848 35.8% 750,781 36.0%Treasury shares fund 24,703 1.2% 24,703 1.2%
Total 2,086,301 100.0% 2,086,301 100.0%
31.3.2009 31.12.2008

Entered into the Companies Register of Ljubljana District Court, entry no. 1/05773/00, share capital: EUR 52,240,977.04, VAT ID: SI80267432 29/62
Table 7: 10 largest shareholders of Petrol d.d., Ljubljana as at 31/03/2009
Shareholder Adress No. of sharesParticipation
in %
SLOVENSKA ODŠKODNINSKA DRUŽBA, D.D. MALA ULICA 5, 1000 LJUBLJANA 412,009 19.75%KAPITALSKA DRUŽBA, D.D. DUNAJSKA CESTA 119, 1000 LJUBLJANA 172,639 8.27%NLB d.d. TRG REPUBLIKE 2, 1000 LJUBLJANA 126,365 6.06%GB d.d., Kranj BLEIWEISOVA CESTA 1, 4000 KRANJ 84,299 4.04%ISTRABENZ D.D. CESTA ZORE PERELLO-GODINA 2, 6000 KOPER 79,990 3.83%JULIUS FOND d.d. in JULIUS k.d.d. TRG SVOBODE 3, 2000 MARIBOR 78,985 3.79%VIZIJA HOLDING, K.D.D. DUNAJSKA CESTA 156, 1000 LJUBLJANA 71,676 3.44%
VIZIJA HOLDING ENA, K.D.D. DUNAJSKA CESTA 156, 1000 LJUBLJANA 63,620 3.05%NFD 1 DELNIŠKI INVESTICIJSKI SKLAD D.D. TRDINOVA 4, 1000 LJUBLJANA 62,620 3.00%HYPO BANK D.D. DUNAJSKA CESTA 117, 1000 LJUBLJANA 43,500 2.09% Table 8: Shares owned by members of the Supervisory and Management Board as at 31/03/2009
Supervisory board 190 0.01%
Internal members 135 0.01%
Samo Gerdin Member of the Supervisory board - 0.0000%Franc Premrn Member of the Supervisory board 135 0.0065%Andrej Tomplak Member of the Supervisory board - 0.0000%
External members 55 0.00%
Viktor Baraga President of the Supervisory board 21 0.0010%Milan Podpečan Vice-president of the Supervisory board 34 0.0016%Bojan Šrot Member of the Supervisory board - 0.0000%Aleš Marinček Member of the Supervisory board - 0.0000%
Management board 2,379 0.11%
Marko Kryžanowski President of the Management board 641 0.0307%Igor Irgolič Vice-president of the Management board 256 0.0123%Alenka Vrhovnik Težak Member of the Management board 739 0.0354%Boštjan Napast Member of the Management board 326 0.0156%Bojan Herman Member of the Management board - Worker director 417 0.0200%
Authorised capital Petrol d.d., Ljubljana had no authorised capital as at 31/03/2009.
Contingent increase in called-up capital The General Meeting of Petrol d.d., Ljubljana did not adopt any resolutions regarding the contingent increase in called-up capital.
Payment of dividends Petrol d.d., Ljubljana did not pay dividends in the first three months of 2009.
Own shares Petrol d.d., Ljubljana did not repurchase its own shares in the first three months 2009. On 31 March 2009, the company held 24,703 own shares, representing 1.2 percent of its registered
Entered into the Companies Register of Ljubljana District Court, entry no. 1/05773/00, share capital: EUR 52,240,977.04, VAT ID: SI80267432 30/62
share capital. The total cost of own shares equalled EUR 2.6 million as at 31 March 2009 and was EUR 3.3 million lower than their market value on the said date. Own shares were purchased between 1997 and 1999, under the first indent (10,371 own shares) and second indent (22,830 own shares) of Article 240 of the Companies Act. Own shares are used in accordance with the company’s Articles of Association. Supervisory Board On 14 January 2009, Andrej Bratož resigned as member of the Supervisory Board. At the 18th General Meeting of Petrol d.d., Ljubljana held on 7 April 2009: - Bruno Korelič, Tomaž Berločnik, Tomaž Kuntarič, Urban Golob and Žiga Debeljak were elected members of the Supervisory Board for a four-year term of office beginning on 7 April 2009, - Dari Južna was elected member of the Supervisory Board for a four-year term of office beginning on 16 July 2009. On 22 April 2009, the Supervisory Board of Petrol d.d., Ljubljana was convened for the first time in its new composition. At the meeting, Viktor Baraga resigned as member and president of the Supervisory Board. In accordance with provisions of the Companies Act, Supervisory Board members elected Tomaž Kuntarič as president and Bruno Korelič as vice-president of the Supervisory Board. They also appointed new members of the Audit Committee and the Human Resources and Management Board Evaluation Committee.
Other explanations by Petrol d.d., Ljubljana The prospectus of the company Petrol d.d., Ljubljana, which has been prepared for the purpose of listing the shares on the stock exchange, is published on the company’s website. All amendments have been published in the company’s strategy document, annual report of Petrol d.d., Ljubljana and public announcements that are available at the company's website and at the website of the Ljubljana Stock Exchange, d.d. (SEOnet).

Entered into the Companies Register of Ljubljana District Court, entry no. 1/05773/00, share capital: EUR 52,240,977.04, VAT ID: SI80267432 31/62
FINANCIAL REPORT Overview of the financial performance of the Petrol Group and the company Petrol d.d., Ljubljana Income statement of the Petrol Group and the company Petrol d.d., Ljubljana
(In EUR) Notes
Period ended 31 March 2009
before impairment
Period ended 31 March 2009
Period ended 31 March 2008
Index 09 before
impariment /08 Index 09/08
Period ended 31 March 2009
before impairment
Period ended 31 March 2009
Period ended 31 March 2008
Index 09 before
impariment /08 Index 09/08
Net sales revenues 1. 555,251,098 555,251,098 647,436,601 86 86 462,773,037 462,773,037 561,242,585 82 82 Cost of merchandise sold (486,171,401) (486,171,401) (579,884,522) 84 84 (411,444,605) (411,444,605) (511,302,875) 80 80 Net profit/(loss) on commodity swaps (2,316,082) (2,316,082) (488,571) 474 474 (2,316,082) (2,316,082) (488,571) 474 474 Gross profit or loss from sale 66,763,615 66,763,615 67,063,508 100 100 49,012,350 49,012,350 49,451,138 99 99
Selling costs 3. - 10. (47,133,569) (47,133,569) (44,020,425) 107 107 (36,119,037) (36,119,037) (33,311,748) 108 108 General and administrative expenses 3. - 10. (14,360,742) (34,982,463) (9,264,395) 155 378 (10,189,705) (30,811,426) (6,184,972) 165 498 Other operating revenues 2. 3,483,780 3,483,780 3,113,960 112 112 2,722,596 2,722,596 2,756,433 99 99 Profit from operations 8,753,084 (11,868,637) 16,892,647 52 - 5,426,205 (15,195,516) 12,710,852 43 -
Net financial revenues from interests due to equity method valuation 5,899,358 5,899,358 4,981,805 118 118 - - - - -Financial revenues from dividends from subsidiaries, associates and joint ventures - - - - - 5,665,005 5,665,005 3,552,511 159 159 Other financial revenues 11. 30,935,652 30,935,652 19,256,062 161 161 28,523,659 28,523,659 17,822,461 160 160 Other financial expenses 11. (33,104,837) (33,104,837) (21,442,486) 154 154 (30,909,229) (30,909,229) (18,448,067) 168 168 Profit or loss before tax 12,483,257 (8,138,464) 19,688,028 63 - 8,705,640 (11,916,081) 15,637,756 56 -
Taxes (2,072,935) 2,051,409 (3,857,780) 54 - (1,103,981) 3,020,363 (3,393,500) 33 -
Net profit or loss for the year 10,410,322 (6,087,055) 15,830,248 66 - 7,601,659 (8,895,718) 12,244,256 62 -Net profit or loss attributable to minority shareholders (459,996) (459,996) 271,201 - - - - - - -
Net profit or loss attributable to owners of the parent company 10,870,318 (5,627,059) 15,559,047 70 - 7,601,659 (8,895,718) 12,244,256 62 -
Earnings per share 12. 5.27 (2.73) 7.55 70 - 3.69 (4.31) 5.94 62 -
Petrol Group Petrol d.d.
After the initial announcement of the performance of Petrol d.d., Ljubljana and Petrol Group in the first three months of 2009, the company Istrabenz, holdinška družb, d.d. has, as per April 23, 2009 announced the convocation of the General Meeting of its shareholders. The convocation holds a proposition to increase the company’s share capital in consideration with the pre-emptive right of the present shareholders to share subscription. To increase the share capital the company proposes to issue 34,420,290 ordinary shares of 13.80 EUR nominal share value. As the nominal share value was based on an independent value assessment as per March 31, 2009, the company Petrol d.d., Ljubljana as well as the Group Petrol reassessed its investment in the associated company to reflect the fair value of the investment. On this account the company Petrol d.d., Ljubljana and the Petrol Group have impaired as per March 31, 2009 the investment in amount of 20,621,721 EUR or 16,497,377 EUR after deferred taxes calculation.

Entered into the Companies Register of Ljubljana District Court, entry no. 1/05773/00, share capital: EUR 52,240,977.04, VAT ID: SI80267432 32/62
Balance sheet of the Petrol Group and the company Petrol d.d., Ljubljana
(In EUR) Notes31 March 2009
before impairment 31 March 2009 31 December 2008
Index 09 before
impairment/ 08 Index 09/08
31 March 2009 before impairment 31 March 2009 31 December 2008
Index 09 before
impairment/ 08
Index 09/08
ASSETS
Non-current (long-term) assetsIntangible assets 13. 26,718,497 26,718,497 26,803,719 100 100 3,718,152 3,718,152 3,900,006 95 95 Property, plant and equipment 14. 561,769,141 561,769,141 559,293,520 100 100 296,410,958 296,410,958 301,369,951 98 98 Investment property 15. 15,314,800 15,314,800 15,513,826 99 99 15,792,455 15,792,455 16,003,040 99 99 Investments in subsidiaries 16. 0 0 0 - - 212,740,219 212,740,219 208,650,219 - -Investments in joint ventures 17. 17,252,574 17,252,574 16,587,067 104 104 56,098,000 56,098,000 56,098,000 100 100 Investments in associates 18. 133,938,759 113,317,038 128,782,444 104 88 170,576,930 149,955,209 170,576,930 100 88 Available-for-sale financial assets 19. 22,692,913 22,692,913 22,692,913 100 100 22,613,870 22,613,870 22,613,870 100 100 Financial receivables 20. 2,498,571 2,498,571 2,534,518 99 99 14,302,579 14,302,579 8,917,435 160 160 Operating receivables 21. 1,860,416 1,860,416 1,860,543 100 100 1,730,603 1,730,603 1,726,835 100 100 Deferred tax assets 32,212,771 36,337,115 30,655,307 105 119 31,149,315 35,273,659 29,643,141 105 119
814,258,442 797,761,065 804,723,857 101 99 825,133,081 808,635,703 819,499,428 101 99
Current assetsInventories 22. 81,093,673 81,093,673 87,982,638 92 92 66,656,721 66,656,721 72,463,273 92 92 Financial receivables 23. 10,566,805 10,566,805 2,842,426 372 372 10,714,522 10,714,522 1,953,649 548 548 Operating receivables 24. 245,093,519 245,093,519 288,221,308 85 85 209,013,866 209,013,866 259,371,137 81 81 Corporate income tax receivables 738,300 738,300 483,184 153 153 915,238 915,238 0 - -Financial assets at fair value through profit or loss 29. 2,490,683 2,490,683 2,455,034 101 101 2,550,635 2,550,635 2,455,034 104 104 Cash and cash equivalents 8,860,100 8,860,100 13,961,546 63 63 3,365,741 3,365,741 9,421,536 36 36 Def.costs and accrued rev.and other assets 25. 4,196,398 4,196,398 8,238,226 51 51 2,443,735 2,443,735 4,116,858 59 59
353,039,478 353,039,478 404,184,362 87 87 295,660,458 295,660,458 349,781,486 85 85
Total assets 1,167,297,920 1,150,800,543 1,208,908,219 97 95 1,120,793,539 1,104,296,162 1,169,280,916 96 94
EQUITY AND LIABILITIES
Equity attributable to owners of the Petrol GroupCalled-up capital 52,240,977 52,240,977 52,240,977 100 100 52,240,977 52,240,977 52,240,977 100 100 Capital reserves 80,991,385 80,991,385 80,991,385 100 100 80,991,385 80,991,385 80,991,385 100 100 Legal reserves 61,903,494 61,903,494 61,903,494 100 100 61,749,884 61,749,884 61,749,884 100 100 Reserves for own shares 2,604,670 2,604,670 2,604,670 100 100 2,604,670 2,604,670 2,604,670 100 100 Own shares (2,604,670) (2,604,670) (2,604,670) 100 100 (2,604,670) (2,604,670) (2,604,670) 100 100 Other revenue reserves 113,008,754 113,008,754 113,008,754 100 100 113,008,754 113,008,754 113,008,754 100 100 Investment revaluation reserves (51,192) (51,192) (51,192) 100 100 97,224,229 97,224,229 97,224,229 100 100 Hedging reserve (8,339,853) (8,339,853) (5,211,970) 160 160 (8,339,854) (8,339,854) (5,211,970) 160 160 Translation differences (2,744,234) (2,744,234) (385,690) 712 712 0 0 0 - -Net profit or loss carried forward 61,022,073 61,022,073 61,022,073 100 100 0 0 0 - -Net profit or loss for the year 10,870,318 (5,627,059) 0 - - 7,601,659 (8,895,717) 0 - -
368,901,722 352,404,345 363,517,832 101 97 404,477,035 387,979,658 400,003,259 101 97
Capital of minority shareholders 32,612,889 32,612,889 33,757,885 97 97 - - - - -
Total equity 401,514,611 385,017,234 397,275,717 101 97 404,477,035 387,979,658 400,003,259 101 97
Non-current liabilitiesProvisions for employee benefits 3,489,993 3,489,993 3,491,975 100 100 1,493,574 1,493,574 1,493,574 100 100 Other provisions and long-term deferred revenues 16,739,370 16,739,370 17,112,473 98 98 14,455,818 14,455,818 14,933,149 97 97 Financial liabilities 336,010,356 336,010,356 306,723,368 110 110 305,278,279 305,278,279 275,766,939 111 111 Operating liabilities 1,487,982 1,487,982 1,487,982 100 100 1,202,196 1,202,196 1,202,196 100 100 Deferred tax liabilities 6,575,540 6,575,540 6,716,210 98 98 24,438,059 24,438,059 24,438,059 100 100
364,303,241 364,303,241 335,532,008 109 109 346,867,926 346,867,926 317,833,917 109 109
Current liabilitiesFinancial liabilities 26. 201,868,313 201,868,313 227,487,188 89 89 114,444,081 114,444,081 132,818,573 86 86 Operating and other liabilities 27. 185,003,599 185,003,599 236,601,092 78 78 243,568,609 243,568,609 309,227,463 79 79 Corporate income tax liabilities 478,952 478,952 435,510 110 110 0 0 113,008 - -Accrued costs and deferred revenues 28. 14,129,204 14,129,204 11,576,704 122 122 11,435,888 11,435,888 9,284,695 123 123
401,480,068 401,480,068 476,100,494 84 84 369,448,579 369,448,579 451,443,739 82 82
Total liabilities 765,783,309 765,783,309 811,632,502 94 94 716,316,505 716,316,505 769,277,656 93 93
Total equity and liabilities 1,167,297,920 1,150,800,543 1,208,908,219 97 95 1,120,793,539 1,104,296,162 1,169,280,916 96 94
Petrol Group Petrol d.d.

Entered into the Companies Register of Ljubljana District Court, entry no. 1/05773/00, share capital: EUR 52,240,977.04, VAT ID: SI80267432 33/62
Cash flow statement of the Petrol Group and the company Petrol d.d., Ljubljana
(In EUR) Notes 31 March 2009 31 March 2008 Index 09/08 31 March 2009 31 March 2008 Index 09/08Cash flows from operating activitiesCash generated from operations 30 33,129,204 (4,393,235) - 7,145,011 24,641,511 29 Interest paid (7,309,581) (5,166,661) 141 (6,335,687) (2,998,523) 211 Taxes paid (3,173,720) (2,907,923) 109 (2,856,431) (2,556,866) 112
Net cash flows from operating activities 22,645,903 (12,467,819) - (2,047,107) 19,086,122 -
Cash flows from investing activitiesPayments for investments in subsidiaries 0 (12,000,000) - (4,090,000) (19,800,000) 21 Receipts form investments in joint ventures 0 1,659,759 - 0 0 -Payments for investments in joint ventures 0 (2,342,245) - 0 (2,342,245) -Payments for investments in associates 0 (569,588) - 0 (569,588) -Receipts from intangible assets 7,463 5,204 143 0 0 -Payments for intangible assets (199,007) (2,166,528) 9 0 (207,543) -Receipts from property, plant and equipment 2,051,674 2,932,933 70 1,606,874 2,039,023 79 Payments for property, plant and equipment (29,375,729) (16,654,576) 176 (8,029,775) (7,745,475) 104 Receipts from loans granted 5,851,707 1,849,605 316 175,366 1,669,338 11 Payments for loans granted (13,775,157) (6,598,546) 209 (14,527,025) (10,276,581) 141 Interest received 2,278,732 1,373,028 166 2,312,464 1,291,244 179 Dividends received from subsidiaries 0 0 - 5,587,468 3,552,511 157 Dividends received from associates 77,536 0 - 77,536 0 -Dividends received from others 39,680 33,180 120 39,680 33,180 120
Net cash flows from investing activities (33,043,101) (32,477,774) 102 (16,847,412) (32,356,136) 52
Cash flows from financing activitiesReceipts from loans received 566,752,484 546,975,415 104 147,335,989 128,392,025 115 Payments for loans received (560,987,094) (500,185,180) 112 (134,097,940) (123,271,148) 109 Dividends paid to shareholders (399,325) (12,737) - (399,325) (12,737) -
Net cash flows from financing activities 5,366,065 46,777,498 11 12,838,724 5,108,140 251
Increase / (decrease) in cash and cash equivalents (5,031,133) 1,831,905 - (6,055,796) (8,161,874) 74
Changes in cash and cash equivalents
Balance at the beginning of the year 13,961,546 10,170,684 137 9,421,536 10,513,377 90 Translation reserves (70,313) 11,944 - 0 0 -Increase / (decrease) (5,031,133) 1,831,905 - (6,055,796) (8,161,874) 74
Balance at the end of the period 8,860,100 12,014,533 74 3,365,741 2,351,503 143
The Petrol Group Petrol d.d.

Entered into the Companies Register of Ljubljana District Court, entry no. 1/05773/00, share capital: EUR 52,240,977.04, VAT ID: SI80267432 34/62
Statement of changes in equity of the Petrol Group
(In EUR)Legal
reserves
Reserves for own shares Own shares Other reserves
Net profit or loss carried forward
Net profit of loss for the year
Balance as at 1 January 2008 52,240,977 80,778,118 61,854,074 2,638,832 (2,638,832) 156,732,106 3,072,944 0 532,999 53,968,960 30,309,982 439,490,160 727,765 440,217,925
Transfer of net profit or loss of previous year to retained earnings 30,309,982 (30,309,982) 0 0
Valuation of available for sale financial assets (38,459) (38,459) (38,459)
Deferred tax assets 8,461 8,461 8,461
Translation differences 233,754 233,754 (35,866) 197,888
Settlement of retained loss (2,719) 2,719 0 0
Increase in minority interest 0 11,529,411 11,529,411
Profti or loss for the current period 15,559,047 15,559,047 271,201 15,830,248
Balance as at 31 March 2008 52,240,977 80,778,118 61,851,355 2,638,832 (2,638,832) 156,732,106 3,042,946 0 766,753 84,281,661 15,559,047 455,252,963 12,492,511 467,745,474
Balance as at 1 January 2009 52,240,977 80,991,385 61,903,494 2,604,670 (2,604,670) 113,008,754 (51,192) (5,211,970) (385,690) 61,022,073 0 363,517,832 33,757,885 397,275,717
Çhanges of fair value of financial instruments (3,909,854) (3,909,854) (3,909,854)
Deferred tax assets 781,971 781,971 781,971
Translation differences (2,358,544) (2,358,544) (685,000) (3,043,544)
Profti or loss for the current period (5,627,059) (5,627,059) (459,996) (6,087,055)
Balance as at 31 March 2009 52,240,977 80,991,385 61,903,494 2,604,670 (2,604,670) 113,008,754 (51,192) (8,339,853) (2,744,234) 61,022,073 (5,627,059) 352,404,345 32,612,889 385,017,234
Hedge accounting
reserves TotalCalled-up
capitalCapital
reserves
Profit reserves
Investment revaluation
reservesTranslation differences
Retained earningsEquity
attributable to owners of the Petrol Group
Equity of minority owners

Entered into the Companies Register of Ljubljana District Court, entry no. 1/05773/00, share capital: EUR 52,240,977.04, VAT ID: SI80267432 35/62
Statement of changes in equity of the company Petrol d.d., Ljubljana
(In EUR)Legal
reserves
Reserves for own shares Own shares Other reserves
Net profit or loss carried
forwardNet profit of loss
for the year
Balance as at 1 January 2008 52,240,977 80,778,118 61,749,884 2,638,832 (2,638,832) 156,732,105 3,072,944 0 9,924,842 22,911,140 387,410,010
Adjustments due to change of accounting policy 0 0 0 0 0 0 90,478,438 0 0 0 90,478,438 Balance as at 1 January 2008 after adjustment 52,240,977 80,778,118 61,749,884 2,638,832 (2,638,832) 156,732,105 93,551,382 0 9,924,842 22,911,140 477,888,448
Transfer of net profit or loss of previous year to retained earnings 22,911,140 (22,911,140) 0
Valuation of available for sale financial assets (38,459) (38,459)
Deferred tax assets 8,461 8,461
Profti or loss for the current period 12,244,256 12,244,256
Balance as at 31 March 2008 52,240,977 80,778,118 61,749,884 2,638,833 (2,638,833) 156,732,105 93,521,384 0 32,835,982 12,244,256 490,102,706
Balance as at 1 January 2009 52,240,977 80,991,385 61,749,884 2,604,670 (2,604,670) 113,008,754 97,224,229 (5,211,970) 0 0 400,003,259
Çhanges of fair value of financial instruments (3,909,854) (3,909,854)
Deferred tax assets 781,971 781,971
Profti or loss for the current period (8,895,718) (8,895,718)
Balance as at 31 March 2009 52,240,977 80,991,385 61,749,884 2,604,670 (2,604,670) 113,008,754 97,224,229 (8,339,854) 0 (8,895,718) 387,979,658
Called-up capital
Capital reserves
Hedge accounting
reserves
Retained earnings
Total
Profit reserves
Investment revaluation
reserves

Entered into the Companies Register of Ljubljana District Court, entry no. 1/05773/00, share capital: EUR 52,240,977.04, VAT ID: SI80267432 36/62
Accounting policies of the Petrol Group
A. Basis of preparation In this report, the financial statements have been presented in euros (EUR) without cents. Due to rounding, some immaterial differences may arise with regard to the sums presented in the tables. The consolidated financial statements have been prepared on the historical cost basis, with the exception of the following assets and liabilities that are carried at their fair value: derivatives, investments held for trading, financial assets at fair value through profit or loss, and available-for-sale financial assets. All group companies keep their books of account in accordance with International Financial Reporting Standards.
B. Change in accounting policy On 1 October 2008, the Petrol Group changed its accounting policy relating to accounting for derivative financial instruments. Consequently, the method of recognising gains or losses arising from fair value changes depends on the type of hedging, regardless of whether it relates to accounting hedging or not. From 1 October 2008 onwards, the Petrol Group recognises the resulting gains or losses in equity provided that the accounting hedging is effective. The accounting method is described in note X.c.
C. Basis of consolidation
Consolidated financial statements comprise the financial statements of the controlling company and its subsidiaries. A subsidiary is a company in which the controlling company holds a dominant equity interest or has a controlling influence on other grounds. On acquisition, the assets, liabilities and contingent liabilities of a subsidiary are measured at their fair values as at the date of acquisition. Any excess of the cost over the controlling company's share of the fair value of the acquired identifiable assets and liabilities is recognised as goodwill. Any excess of the share of the fair value of the acquired identifiable assets and liabilities over the cost is recognised in profit or loss in the period of acquisition. The minority interest is stated at the minority’s proportion of the fair values of recognised assets and liabilities. Any losses relating to the minority interest in excess of the minority interest are subsequently allocated to the share attributable to the parent company. Shares of the profit of subsidiaries acquired or disposed of during the year are included in the consolidated income statement from the effective date of the acquisition or up to the effective date of disposal, as appropriate. For the purpose of compiling consolidated financial statements, adjustments are made to the financial statements of subsidiaries to bring their accounting policies into line with those used by the Group, as necessary.
Entered into the Companies Register of Ljubljana District Court, entry no. 1/05773/00, share capital: EUR 52,240,977.04, VAT ID: SI80267432 37/62
All intra-group balances, unrealised gains, revenue and expenses are eliminated in full. Investments in associates An associate is a company in which the Group has a significant influence as a result of its equity interest or on other grounds. Shares of profit are recorded in the financial statements using the equity method, except when investments are classified as available-for-sale financial assets (see below). Any excess of the cost over the controlling company's share of the fair value of acquired identifiable assets and liabilities is recognised as goodwill which is not carried separately, but instead represents a part of an investment in the associate. Any excess of the share of the fair value of the acquired identifiable assets and liabilities over the cost is recognised in profit or loss in the period of acquisition. Joint ventures The Group’s interest in joint ventures is accounted for using the equity method, as described above for the associates. Joint ventures are companies in which the Group holds 50 percent of voting rights.
D. Goodwill
Goodwill resulting from consolidation represents the excess of the cost over the Group's share of the fair value of the acquired identifiable assets, liabilities and contingent liabilities of a subsidiary as at the date of acquisition. Goodwill is recognised as an asset and is reviewed for impairment at least once a year. Any impairment is immediately recognised in profit or loss and is not subsequently reversed.
E. Financial instruments The Group classifies its financial instruments into the following categories: available-for-sale financial assets, financial assets at fair value through profit or loss, derivative financial instruments, financial and operating receivables, cash, and financial and operating liabilities. The classification depends on the purpose for which an investment was acquired.
F. Available-for-sale financial assets Available-for-sale financial assets are non-derivative financial assets that are designated as available for sale or are not classified as loans and receivables or as financial assets at fair value through profit or loss. If fair value can be determined and gains or losses arising from the valuation are recognised directly in equity, except for impairment losses and foreign exchange gains or losses, such assets are valued at fair value until the financial asset is derecognised, at which point

Entered into the Companies Register of Ljubljana District Court, entry no. 1/05773/00, share capital: EUR 52,240,977.04, VAT ID: SI80267432 38/62
previously recognised accumulated gain or loss is recognised in profit or loss for the period. Interest calculated using the effective interest method is recognised in profit or loss. Dividends are recognised when paid. If there is not enough reliable information about the investment’s fair value, such investment is carried at cost less a write-down to an eventual lower carrying amount of shares or interests. Considering the shallowness of the over-the-counter securities market and poor transparency of transactions involving such securities, the Management Board believes that discounted return models are not appropriate for determining the value of such securities as there is too much uncertainty about input data used in such models to allow reasonable planning. To determine a need for the impairment of investments, the company tries to obtain as much current information as possible about the business performance of companies and analyse their financial statements.
G. Financial assets at fair value through profit or loss Financial assets at fair value through profit or loss comprise financial assets held for trading and assets designated at fair value through profit or loss upon recognition. Such assets are measured at fair value, whereas realised/unrealised gains and losses on valuation are recognised in profit or loss.
H. Loans and receivables Loans and receivables are non-derivative financial assets with fixed or determinable payments, which are not listed on an active market. They are part of current assets, except when their maturity is greater than 12 months from the balance sheet date, in which case they are classified as long-term assets. In the balance sheet, loans and receivables are carried as operating or other receivables and at amortised cost using the effective interest rate.
I. Foreign currency translation Consolidated financial statements are presented in euros, the controlling company’s local and reporting currency. Line items of each group company that are included in the financial statements are measured in the currency of the primary economic environment in which the company operates (the “local currency”). The profit or loss and the financial position of group companies (none of which has the currency of a hyperinflationary economy) that have a local currency that is different from the presentation currency are translated into the reporting currency as follows:
- assets and liabilities from each balance sheet presented are translated using the middle exchange rate of the ECB on the balance sheet date;
- revenue and expenses from each income statement presented are translated using the average exchange rate of the ECB; and
- any foreign exchange differences are recognised as a separate component of equity (translation differences).
Entered into the Companies Register of Ljubljana District Court, entry no. 1/05773/00, share capital: EUR 52,240,977.04, VAT ID: SI80267432 39/62
Foreign exchange differences arising from the translation of net investments in companies abroad, liabilities and other currency instruments designated as hedges of such investments are disclosed as consolidated equity translation differences. When a company abroad is disposed of, these foreign exchange differences are recognised in the income statement as part of gains or losses on the disposal. Foreign currency transactions are converted into the presentation currency using the exchange rate valid on the date of transaction. Gains and losses arising from such transactions and from the conversion of cash and liabilities denominated in a foreign currency are recognised in profit or loss.
J. Segment reporting A business segment is a group of assets and operations engaged in the production of products or rendering of services that are subject to risks and returns different from those of other business segments. In the preparation and presentation of financial statements, the Group uses the following business segments:
- petroleum products, - supplementary and other merchandise, - services, and - energy.
A geographical segment represents products or services within a particular economic environment that are subject to risks and returns different from those of geographical segments operating in other economic environments.
K. Intangible assets On initial recognition, concessions for the construction of gas networks and distribution of natural gas are carried at cost less accumulated amortisation. Other intangible assets are initially measured at cost. Amortisation is calculated using the straight-line method of amortisation, taking into account the useful life of intangible assets (except for goodwill in the case of which the need for impairment is assessed on an annual basis), as follows: (in %) 2009 2008Concessions 3.45 - 20.00 % 3.45 - 20.00 %Computer software 20.00 - 25.00 % 20.00 - 25.00 %Other rights 3.33 - 20.00 % 3.33 - 20.00 %
The Group does not have intangible assets with unidentifiable useful lives.
L. Property, plant and equipment The items of property, plant and equipment are recorded at cost less accumulated depreciation and accumulated impairment losses, except for land, which is carried at cost

Entered into the Companies Register of Ljubljana District Court, entry no. 1/05773/00, share capital: EUR 52,240,977.04, VAT ID: SI80267432 40/62
less impairment. The cost comprises expenses that are directly attributable to the acquisition of a fixed asset. Maintenance and repairs, replacements and minor improvements are recognised as expensed in the period in which they are incurred. Amounts of major renovations are depreciated over the remaining useful life of the corresponding asset or to the date of the next major renovation, whichever is sooner. The residual values and useful lives of an asset are reviewed annually and adjusted, if appropriate. If the carrying amount of an asset is greater than its estimated recoverable amount, the asset’s carrying amount is immediately written down to its recoverable amount and recognised in profit or loss. Depreciation is calculated using the straight-line method of depreciation, taking into account the useful life of property, plant and equipment, as follows: (in %) 2009 2008Buildings:Buildings at service stations 2.50 - 10.00 % 2.50 - 10.00 %Underground and ground level reservoirs 2.85 - 50.00 % 2.85 - 50.00 %Underground service paths on service stations
5.00 - 14.30 % 5.00 - 14.30 %
Other buildings 1.43 - 50.00 % 1.43 - 50.00 %Equipment:Equipment - machinery and electronics for maintenance of other equipment
10.00 - 25.00 % 10.00 - 25.00 %
Gas station equipment 3.33 - 20.00 % 3.33 - 20.00 %Pumping equipment at service stations 5.00 - 25.00 % 5.00 - 25.00 %Motor vehicles 10.00 - 25.00 % 10.00 - 25.00 %Cargo vehicles - tank wagons 25.00 % 25.00 %Computer hardware 15.00 - 25.00 % 15.00 - 25.00 %Office equipment - furniture 6.7 - 12.50 % 6.7 - 12.50 %Small tools: 33.33 % 33.33 %Environmental fixed assets: 5.00 - 25.00 % 5.00 - 25.00 %
Depreciation begins when an asset is ready for use. Construction in progress is not depreciated. Gains and losses on disposal or elimination are determined by comparing sales revenue with the carrying amount. They are included in the income statement. Borrowing costs attributable to a qualifying asset are recognised in profit or loss when incurred. Available-for-sale items of property, plant and equipment are disclosed separately from other assets and are not depreciated in the year of the sale.
M. Investment property Investment property is the property held by the Group to earn rentals or increase the value of long-term investments or both.
Entered into the Companies Register of Ljubljana District Court, entry no. 1/05773/00, share capital: EUR 52,240,977.04, VAT ID: SI80267432 41/62
Investment property is measured using the cost model. After recognition, an asset is recorded at cost less accumulated depreciation and accumulated impairment losses. Depreciation rates are the same as for other tangible assets. The preponderant share of investment property leased to lessees outside the Petrol Group consists of the parts of buildings used by the Petrol Group in the performance of its own business activities. The Petrol Group does not intend to dispose of the whole of the buildings that are being leased. Consequently, the fair value of parts of the buildings has not been assessed. The Management Board believes that the fair value of the investment property is at least equal to its carrying amount.
N. Lease Finance lease
A lease is classified as a finance lease when under the terms of the lease all significant risks and rewards of ownership are transferred to the lessee. All other leases are classified as operating leases. The Group as a lessor
Amounts due from lessees under a finance lease are recorded as receivables in the amount of the net investment under lease. Finance lease revenue is allocated to accounting periods so as to reflect a constant periodic rate of return on the leased net investment that has not yet been realised. Finance lease revenue is recognised on a straight-line basis over the lease term. The Group as a lessee
Assets acquired under a finance lease are carried at the lower of fair value or minimum payments to the end of the lease less accumulated depreciation and impairment losses. Finance lease expenses are recognised on a straight-line basis over the lease term. Operating lease
Expenses and revenue arising from an operating lease are recognised in the income statement on a straight-line basis over the lease period.
O. Inventories
Inventories of merchandise and materials are initially valued at cost, which consists of their purchase cost, import duties and direct costs of purchase. Any discounts are subtracted from the purchase cost. Direct costs of purchase include transportation costs, costs of loading, transhipment and unloading, transport insurance costs, goods tracking costs, costs of agency arrangements and other similar costs incurred prior to initial storage and borne by the purchaser, and non-refundable duties. Purchase cost discounts include discounts indicated on invoices and subsequently obtained discounts relating to a specific purchase.
Duties included in the purchase cost of petroleum product stocks in non-customs warehouses and at service stations are mainly comprised of import duties, excise duty, carbon tax, and fees related to the mandatory commodity reserves of the Republic of Slovenia.
Inventories are revalued due to impairment if their carrying amount exceeds their market value. The market value means the replacement cost unless the replacement cost exceeds the net

Entered into the Companies Register of Ljubljana District Court, entry no. 1/05773/00, share capital: EUR 52,240,977.04, VAT ID: SI80267432 42/62
realisable value (in this case the net realisable value is considered to be the market value) or the net realisable value less gross return exceeds the replacement cost of merchandise (in this case the net realisable value less gross return is considered to be the market value). A decrease in the value of inventories of materials and small tools is charged to the costs of materials, while a decrease in the value of inventories of merchandise is charged to the corresponding operating expenses.
The consumption of merchandise is accounted for using the first-in, first-out (FIFO) method. The FIFO method assumes that the items of inventories that have been purchased or produced first are also the first to be sold. Accordingly, the items remaining in the inventories at the end of the period are the ones that were bought most recently.
The consumption of materials is accounted for using the average cost method applicable to an accounting period. At the end of each month, the inventories of materials are restated to a new value corresponding to the average cost for the accounting period.
For inventories that have remained unchanged for more than a year, the Group forms a 100% allowance charged to operating expenses.
P. Trade receivables Trade receivables are carried at their nominal value less relevant allowances for estimated irrecoverable amounts. Receivables are revalued for impairment if their carrying amount exceeds their fair value, i.e. the collectible amount. Receivables for which it can be assumed they will not be settled in a regular payment period or up to their full amount are deemed doubtful. Should court proceedings be initiated, they are deemed disputed. Allowances are made as follows: - 100% for domestic trade receivables more than 60 days overdue, - 70% for doubtful and disputed receivables, - for receivables that are subject to allowances on the basis of an individual assessment of
collectability, irrespective of the above conditions. For receivables from foreign legal and natural persons, a 100% allowance is made for all doubtful and disputed receivables other than secured receivables. In the income statement, allowances are disclosed under general and administrative costs or write-downs.
Q. Cash and cash equivalents Cash and cash equivalents comprise cash, bank deposits with maturities of up to 3 months, and other current and highly liquid investments with original maturities of three months or less. Cash and cash equivalents are carried at cost.
R. Share capital The called-up capital of the controlling company Petrol d.d. consists of the share capital that is nominally defined in the company’s articles of association, has been registered with the court and paid up by owners.

Entered into the Companies Register of Ljubljana District Court, entry no. 1/05773/00, share capital: EUR 52,240,977.04, VAT ID: SI80267432 43/62
Dividends on ordinary shares are recognised in equity for the period in which they were approved by the General Meeting. Capital reserves
General equity revaluation adjustments as at 31 December 2003 made in accordance with Slovene Accounting Standards comprised the revaluation of share capital before the year 2002. Because of the transition to International Financial Reporting Standards, the revaluation adjustment was transferred to capital reserves. It can only be used to increase share capital. Legal and other reserves
Legal and other reserves comprise shares of profit from previous years that have been retained for a dedicated purpose, mainly for offsetting eventual future losses. When created, they are recognised by the body responsible for preparation of the annual report or by a resolution of this body. Reserves for own shares
If the parent company or its subsidiaries acquire an ownership interest in the parent company, the amount paid, including transaction costs less tax, is deducted from the total equity in the form of own shares until such shares are cancelled, reissued or sold. If own shares are subsequently sold or reissued, the consideration received is included in equity net of transaction costs and related tax effects.
S. Liabilities Liabilities are initially recognised at fair value less transaction costs incurred. They are subsequently carried at amortised cost using the effective interest rate method. During the borrowing period, any differences between their amount (less transaction costs) and the amortised cost are recognised in the income statement using the effective interest rate method.
T. Taxation Tax expenses are the sum of current tax liabilities and deferred tax liabilities. Current tax liabilities are based on the taxable profit for the year. The taxable profit differs from the net profit reported in the income statement as it excludes revenue and expense items taxable or deductible in other years, and other items that are never subject to taxation or deduction. The Group's current tax liabilities are calculated using tax rates effective on the balance sheet date. Deferred income tax is disclosed in its entirety using the balance sheet liability method for temporary differences between the tax base of assets and liabilities and their carrying amounts in individual financial statements. Deferred income tax is determined using the tax rates (and legislation) that are effective on the balance sheet date and are expected to apply when a deferred tax asset is realised or a deferred tax liability is settled. Deferred income tax assets are recognised to the extent that it is probable that future taxable profit will be available against which temporary differences can be utilised.

Entered into the Companies Register of Ljubljana District Court, entry no. 1/05773/00, share capital: EUR 52,240,977.04, VAT ID: SI80267432 44/62
U. Provisions Provisions are recognised when the Group has a current legal or constructive obligation arising from past events if it is probable that an outflow of resources will be required to settle the obligation and its amount can be reliably estimated. Environmental provisions
The creation of long-term provisions for investments in environmental modernisation, improvements and the clean-up of the bitumen dump at Pesniški Dvor has been approved by the Ministry of the Environment in the framework of laws relating to the ownership transformation of Slovene companies. In accordance with the Act Governing the Use of Funds Reserved on a Long-Term Basis for Environmental Rehabilitation, the provisions are reduced each year by an amount equal to the depreciation of acquired environment fixed assets and by an amount allocated to cover costs relating to the clean-up of the bitumen dump at Pesniški Dvor.
Post-employment benefits
Employees are entitled to termination benefits on retirement, for which they become eligible on termination of the employment relationship, as laid down in the Employment Relationship Act. Termination benefits on retirement are determined using the projected unit credit method (a method for accruing benefits in proportion to years of service). The provisions set aside by the Group in this respect thus correspond to the number of years of service. On 30 November each year, an actuarial valuation is performed and appropriately recorded through profit or loss. Payments of termination benefits on retirement reduce the provisions as they fall due. Other long-term benefits
Employees are entitled to jubilee benefits, for which they become eligible on the fulfilment of conditions relating to the length of service. Jubilee benefits are determined using the projected unit credit method (a method for accruing benefits in proportion to years of service). The provisions set aside by the Group in this respect thus correspond to the number of years of service. On 30 November each year, an actuarial valuation is performed and appropriately recorded through profit or loss. Payments of jubilee benefits reduce the provisions as they fall due. Jubilee benefits are paid to employees based on the calculations and thresholds set out in the following table:

Entered into the Companies Register of Ljubljana District Court, entry no. 1/05773/00, share capital: EUR 52,240,977.04, VAT ID: SI80267432 45/62
Years of service Benefit (% of average monthly salary in
Slovenia) 10 years 40 20 years 60 25 years 70 30 years 80 35 years 90 40 years 100
V. Recognition of revenue Revenue is measured at the fair value of consideration received or receivable, and represents the amounts receivable in connection with goods and services provided in the normal course of business, less discounts, VAT and other sales taxes. Revenue is recognised as follows: Sale of goods A sale of goods is recognised when the Group delivers products to a customer, the customer accepts the products, and the collectability of the related receivables is reasonably assured. Sale of services A sale of services is recognised in the accounting period in which the services are rendered by reference to the completion of a transaction assessed on the basis of the actual service provided as a proportion of total services to be provided. Connection fee Because concessions are amortised over a period of 20 to 30 years, revenue from connection fees is recognised on a straight-line basis over the same period as the concessions. Interest revenue Interest revenue is accrued on a time basis by reference to the principal outstanding and at the effective interest rate, which is a rate that accurately discounts estimated future cash receipts over the expected life of a financial asset to the asset’s net carrying amount. Dividend revenue Dividend revenue from investments is recognised when a payment is received.
W. Financial expenses
Financial expenses comprise expenses arising from the impairment of long-term and short-term investments, interest and other financial expenses.
X. Risks management and derivates Derivative financial instruments are initially recognised at cost. Subsequent to initial recognition, they are carried at fair value.
a) Forward transactions

Entered into the Companies Register of Ljubljana District Court, entry no. 1/05773/00, share capital: EUR 52,240,977.04, VAT ID: SI80267432 46/62
The Petrol Group purchases petroleum products in US dollars, but sells them primarily in euros. Because purchases and sales are made in different currencies, mismatches occur, which are hedged against using forward transactions. The fair value of forward transactions on the balance sheet date is determined by obtaining the value each outstanding transaction would have if it had been concluded on the balance sheet date. Gains and losses are recognised in profit or loss.
b) Commodity swaps When petroleum products are purchased or sold, mismatches occur between purchase and selling prices, which are hedged against using commodity swaps. The fair value of commodity swaps on the balance sheet date is determined using a table of publicly available data on commodity swaps as at the balance sheet date issued by relevant institutions. Gains and losses are recognised in profit or loss.
c) Interest rate swaps and collars Interest rates on loans received are exposed to a risk of interest rate fluctuations, which is hedged against using interest rate swaps and collars. The fair value of interest rate swaps and collars on the balance sheet date is determined by discounting future cash flows arising as a result of a variable interest rate (interest proceeds from a swap) and a fixed interest rate (payment of interest on a swap). When an interest rate swap is designated as an instrument for hedging against the variability of cash flows from recognised assets, liabilities or a forecast transaction, the portion of the gain or loss on the instrument that is determined to be an effective hedge is recognised directly in equity from 1 October 2008 onwards. Gains or loss on the instrument that is determined to be ineffective are recognised in the income statement.
Y. Comparative figures Comparative financial statements have been prepared on a comparable basis for the previous year.
Z. Use of estimates The preparation of financial statements requires management to make estimates and assumptions affecting the reported amounts of assets and liabilities, the disclosure of contingent assets and liabilities on the date of financial statements, and the reported amounts of revenue and expenses in the reporting period. These estimates and assumptions are mainly related to the following:
- impairment of property, plant and equipment and intangible assets, - estimation of useful lives of depreciable assets, - goodwill impairment test, - estimation of the fair value of investments in associates and joint ventures, - estimation of available-for-sale financial assets,

Entered into the Companies Register of Ljubljana District Court, entry no. 1/05773/00, share capital: EUR 52,240,977.04, VAT ID: SI80267432 47/62
- value of net realisable value of inventories, - employee benefits, provisions, etc.
Because estimates are subject to subjective judgement and a certain degree of uncertainty, actual results may differ from the estimated ones. The preparation of estimates and the related assumptions and uncertainties are disclosed in notes to individual items. Estimates are reviewed regularly. Changes in accounting estimates are recognised in the period in which the estimates were changed if the change affects that period only. If the change affects future periods, they are recognised in the period of the change and in future periods.
AA. Cash flow statement In the section referring to business operations, the income statement has been prepared on the basis of the indirect method using data derived from the balance sheet as at 31/12/2008 and 31/03/2009 and data derived from the income statement for first three months of 2009. The section referring to investing and financing has been prepared on the basis of the direct method. Accounting policies of the company Petrol d.d., Ljubljana Accounting policies of the company Petrol d.d., Ljubljana are the same as the accounting policies of the Petrol Group, with the exception of the policies relating to investments in subsidiaries, joint ventures and associates.
BB. Investments in subsidiaries In the separate financial statements of the company Petrol d.d., Ljubljana, investments in subsidiaries have been accounted for at cost.
CC. Change in accounting policy In 2008 Petrol d.d., Ljubljana changed the accounting policy relating to investments in joint ventures and associates. In accordance with IAS 39, the investments are now carried at fair value and designated as available-for-sale, with changes in fair value being recognised directly in equity. When such investments are disposed of, accumulated losses or gains that were previously recorded in equity are also eliminated and recognised in the income statement. Any indications of impairment of investments are determined on the balance sheet date. If an investment is impaired, the difference between the recoverable amount and its existing carrying amount is recognised in profit or loss. At the same time, accumulated losses or gains that were previously recorded in equity are also eliminated. The company changed the accounting policy so that the financial statements would provide more reliable and relevant information. Petrol d.d., Ljubljana applied the changed accounting policy retrospectively, i.e. from the beginning of the first comparative period for which the company was able to obtain comparable

Entered into the Companies Register of Ljubljana District Court, entry no. 1/05773/00, share capital: EUR 52,240,977.04, VAT ID: SI80267432 48/62
data. The effect of applying the changed accounting policy is evident from the adjustment of the opening balance as at 1 January 2008 in the table of changes in investments in associates and joint ventures, in the table of changes in deferred taxes and in the table of changes equity.

Entered into the Companies Register of Ljubljana District Court, entry no. 1/05773/00, share capital: EUR 52,240,977.04, VAT ID: SI80267432 49/62
Notes to the financial statements of the Petrol Group and Petrol d.d., Ljubljana Company
1. Segment reporting of the Petrol Group
(In EUR) Oil products
Supplementary and other
merchandise Services EnergyNet
eliminations TotalPeriod ended 31 March 2008
Revenue 881,056,727 75,736,978 12,200,970 43,148,047 0 1,012,142,722 Revenues from relations with subsidiaries (350,310,765) (226,664) (5,399,820) (8,768,872) 0 (364,706,121) Net revenue 530,745,962 75,510,314 6,801,150 34,379,175 0 647,436,601
Segment result (operating profit) 13,646,190 1,588,154 81,755 1,580,677 (4,129) 16,892,647
Period ended 31 March 2009
Revenue 604,173,357 90,802,064 12,355,181 45,974,751 0 753,305,353 Revenues from relations with subsidiaries (183,492,284) (219,927) (5,523,572) (8,818,472) 0 (198,054,255) Net revenue 420,681,073 90,582,137 6,831,609 37,156,279 0 555,251,098
Segment result (operating profit) (11,090,111) (2,820,995) (312,055) 2,445,602 (91,078) (11,868,637) Segment reporting of Petrol d.d., Ljubljana
(In EUR) Oil products
Supplementary and other
merchandise Services Energy TotalPeriod ended 31 March 2008
Revenue 421,001,080 67,624,746 6,390,670 7,460,828 502,477,324 Revenues from relations with subsidiaries 55,080,809 224,006 615,365 2,845,081 58,765,261 Net revenue 476,081,889 67,848,752 7,006,035 10,305,909 561,242,585
Segment result (operating profit) 10,781,344 1,536,742 158,886 233,880 12,710,852
Period ended 31 March 2009
Revenue 340,138,756 84,333,480 6,157,952 7,016,711 437,646,899 Revenues from relations with subsidiaries 23,250,108 151,144 168,677 1,556,209 25,126,138 Net revenue 363,388,864 84,484,624 6,326,629 8,572,920 462,773,037
Segment result (operating profit) (11,932,159) (2,774,119) (207,740) (281,499) (15,195,516)

Entered into the Companies Register of Ljubljana District Court, entry no. 1/05773/00, share capital: EUR 52,240,977.04, VAT ID: SI80267432 50/62
2. Other operating revenues
(In EUR)Period ended 31
March 2009Period ended 31
March 2008 Index 09/08Period ended 31
March 2009Period ended 31
March 2008 Index 09/08
Reversal of accrued litigation costs 1,770,716 0 - 1,770,716 0 -Utilisation of environmental provisions 408,739 438,147 93 408,739 438,147 93Written off receivables collected 246,755 4,448 - 2,084 4,448 47Gain on disposal of fixed assets 212,801 1,747,163 12 45,299 1,737,593 3Contractual penalties received 206,682 0 - 206,682 0 -Cash discounts, rebates received 154,447 0 - 42,164 0 -Reversal of allowances for receivables 120,185 144,669 83 30,258 457 -Compensation from insurance companies 63,365 0 - 41,181 0 -Payment of court fees 30,914 0 - 22,291 0 -Elimination of accrued costs and expenses 21,043 6,414 328 20,271 6,414 316Depreciation of assets under management 3,285 0 - 13,065 0 -Other operating revenue 244,848 773,119 32 119,846 569,374 21
Total operating income 3,483,780 3,113,960 112 2,722,596 2,756,433 99
Petrol d.d.Petrol Group
3. Selling costs and general administrative costs
(In EUR) Notes Selling costs
General adiministrative
costs Total Selling costs
General adiministrative
costs Total
Period ended 31 March 2008
Costs of material 4. 6,222,229 303,228 6,525,460 2,275,137 155,903 2,431,040 Costs of services 5. 22,025,261 3,104,084 25,129,345 22,977,322 2,417,589 25,394,911 Labour costs 6. 8,115,904 3,966,598 12,082,502 2,992,640 2,583,228 5,575,868 Depreciation and amortisation 7. 6,939,623 780,688 7,720,311 4,986,334 495,709 5,482,043 Writte-downs 8. 0 363,174 363,174 0 30,840 30,840 Other costs 9. 627,924 686,451 1,314,359 58,344 495,221 553,565 Other operating expenses 10. 89,484 60,173 149,670 21,970 6,482 28,452
Total 44,020,425 9,264,395 53,284,820 33,311,748 6,184,972 39,496,720
(In EUR) Notes Selling costs
General adiministrative
costs Total Selling costs
General adiministrative
costs Total
Period ended 31 March 2009
Costs of material 4. 6,388,337 937,479 7,325,816 2,309,993 179,807 2,489,800 Costs of services 5. 23,919,947 3,406,879 27,326,826 25,499,275 2,565,027 28,064,302 Labour costs 6. 9,017,592 4,844,518 13,862,110 3,219,780 2,977,793 6,197,573 Depreciation and amortisation 7. 7,566,169 858,932 8,425,101 5,029,330 468,075 5,497,405 Writte-downs 8. 0 24,324,828 24,324,828 0 24,246,519 24,246,519 Other costs 9. 209,522 508,322 717,844 59,566 374,175 433,741 Other operating expenses 10. 32,002 101,505 133,507 1,093 30 1,123
Total 47,133,569 34,982,463 82,116,032 36,119,037 30,811,426 66,930,463
Petrol Group Petrol d.d.
Petrol Group Petrol d.d.
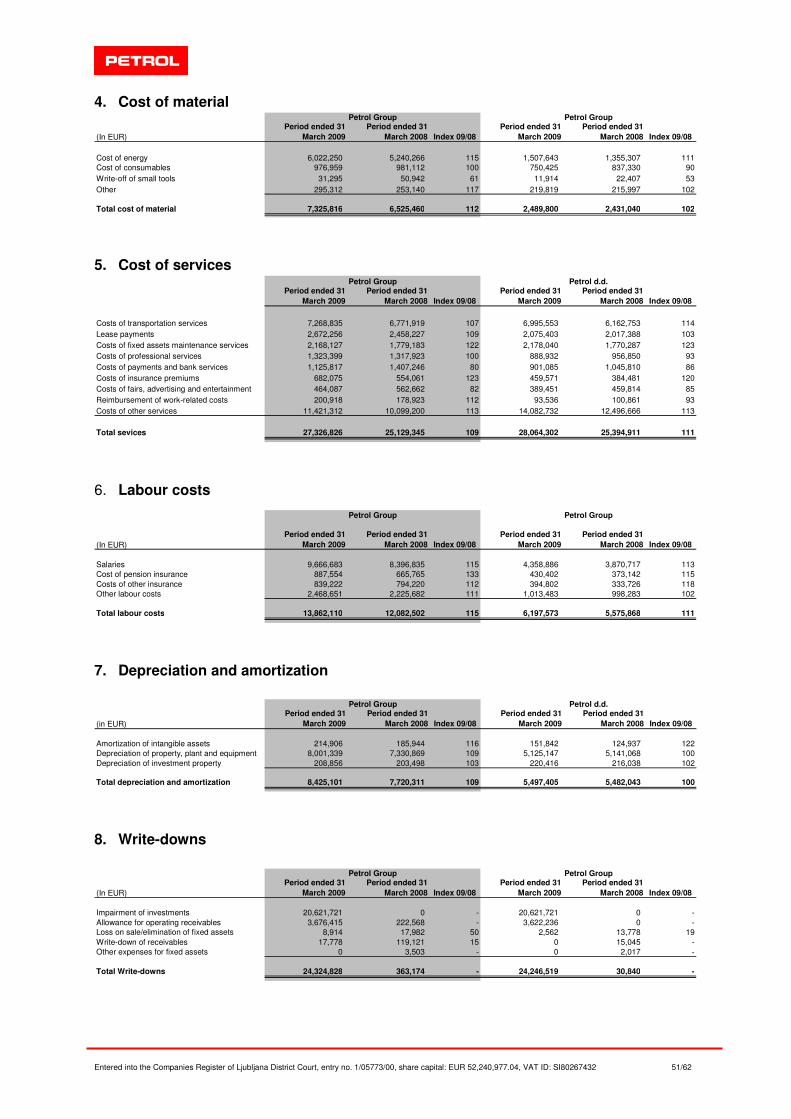
Entered into the Companies Register of Ljubljana District Court, entry no. 1/05773/00, share capital: EUR 52,240,977.04, VAT ID: SI80267432 51/62
4. Cost of material
(In EUR)Period ended 31
March 2009Period ended 31
March 2008 Index 09/08Period ended 31
March 2009Period ended 31
March 2008 Index 09/08
Cost of energy 6,022,250 5,240,266 115 1,507,643 1,355,307 111Cost of consumables 976,959 981,112 100 750,425 837,330 90Write-off of small tools 31,295 50,942 61 11,914 22,407 53Other 295,312 253,140 117 219,819 215,997 102
Total cost of material 7,325,816 6,525,460 112 2,489,800 2,431,040 102
Petrol Group Petrol Group
5. Cost of services
Period ended 31 March 2009
Period ended 31 March 2008 Index 09/08
Period ended 31 March 2009
Period ended 31 March 2008 Index 09/08
Costs of transportation services 7,268,835 6,771,919 107 6,995,553 6,162,753 114Lease payments 2,672,256 2,458,227 109 2,075,403 2,017,388 103Costs of fixed assets maintenance services 2,168,127 1,779,183 122 2,178,040 1,770,287 123Costs of professional services 1,323,399 1,317,923 100 888,932 956,850 93Costs of payments and bank services 1,125,817 1,407,246 80 901,085 1,045,810 86Costs of insurance premiums 682,075 554,061 123 459,571 384,481 120Costs of fairs, advertising and entertainment 464,087 562,662 82 389,451 459,814 85Reimbursement of work-related costs 200,918 178,923 112 93,536 100,861 93Costs of other services 11,421,312 10,099,200 113 14,082,732 12,496,666 113
Total sevices 27,326,826 25,129,345 109 28,064,302 25,394,911 111
Petrol Group Petrol d.d.
6. Labour costs
(In EUR)Period ended 31
March 2009Period ended 31
March 2008 Index 09/08Period ended 31
March 2009Period ended 31
March 2008 Index 09/08
Salaries 9,666,683 8,396,835 115 4,358,886 3,870,717 113Cost of pension insurance 887,554 665,765 133 430,402 373,142 115Costs of other insurance 839,222 794,220 112 394,802 333,726 118Other labour costs 2,468,651 2,225,682 111 1,013,483 998,283 102
Total labour costs 13,862,110 12,082,502 115 6,197,573 5,575,868 111
Petrol Group Petrol Group
7. Depreciation and amortization
(in EUR)Period ended 31
March 2009Period ended 31
March 2008 Index 09/08Period ended 31
March 2009Period ended 31
March 2008 Index 09/08
Amortization of intangible assets 214,906 185,944 116 151,842 124,937 122Depreciation of property, plant and equipment 8,001,339 7,330,869 109 5,125,147 5,141,068 100Depreciation of investment property 208,856 203,498 103 220,416 216,038 102
Total depreciation and amortization 8,425,101 7,720,311 109 5,497,405 5,482,043 100
Petrol Group Petrol d.d.
8. Write-downs
(In EUR)Period ended 31
March 2009Period ended 31
March 2008 Index 09/08Period ended 31
March 2009Period ended 31
March 2008 Index 09/08
Impairment of investments 20,621,721 0 - 20,621,721 0 -Allowance for operating receivables 3,676,415 222,568 - 3,622,236 0 -Loss on sale/elimination of fixed assets 8,914 17,982 50 2,562 13,778 19Write-down of receivables 17,778 119,121 15 0 15,045 -Other expenses for fixed assets 0 3,503 - 0 2,017 -
Total Write-downs 24,324,828 363,174 - 24,246,519 30,840 -
Petrol Group Petrol Group
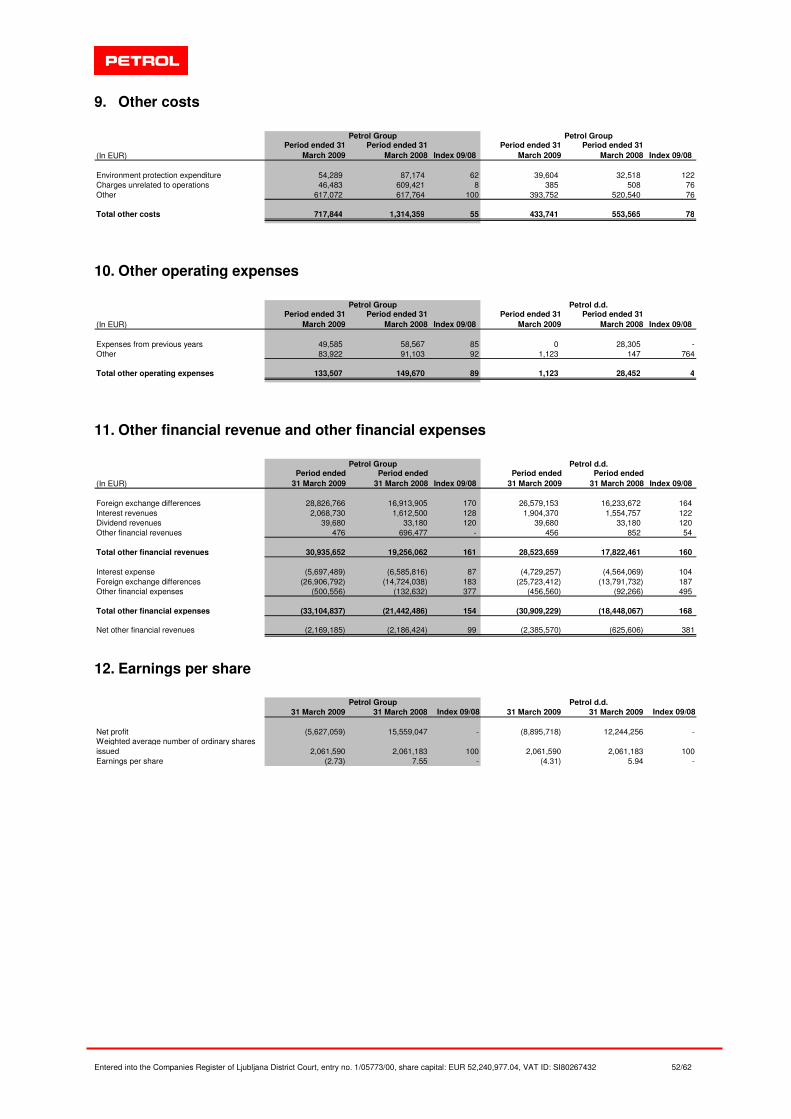
Entered into the Companies Register of Ljubljana District Court, entry no. 1/05773/00, share capital: EUR 52,240,977.04, VAT ID: SI80267432 52/62
9. Other costs
(In EUR)Period ended 31
March 2009Period ended 31
March 2008 Index 09/08Period ended 31
March 2009Period ended 31
March 2008 Index 09/08
Environment protection expenditure 54,289 87,174 62 39,604 32,518 122Charges unrelated to operations 46,483 609,421 8 385 508 76Other 617,072 617,764 100 393,752 520,540 76
Total other costs 717,844 1,314,359 55 433,741 553,565 78
Petrol Group Petrol Group
10. Other operating expenses
(In EUR)Period ended 31
March 2009Period ended 31
March 2008 Index 09/08Period ended 31
March 2009Period ended 31
March 2008 Index 09/08
Expenses from previous years 49,585 58,567 85 0 28,305 -Other 83,922 91,103 92 1,123 147 764
Total other operating expenses 133,507 149,670 89 1,123 28,452 4
Petrol Group Petrol d.d.
11. Other financial revenue and other financial expenses
(In EUR)Period ended
31 March 2009Period ended
31 March 2008 Index 09/08Period ended
31 March 2009Period ended
31 March 2008 Index 09/08
Foreign exchange differences 28,826,766 16,913,905 170 26,579,153 16,233,672 164 Interest revenues 2,068,730 1,612,500 128 1,904,370 1,554,757 122 Dividend revenues 39,680 33,180 120 39,680 33,180 120 Other financial revenues 476 696,477 - 456 852 54
Total other financial revenues 30,935,652 19,256,062 161 28,523,659 17,822,461 160
Interest expense (5,697,489) (6,585,816) 87 (4,729,257) (4,564,069) 104 Foreign exchange differences (26,906,792) (14,724,038) 183 (25,723,412) (13,791,732) 187 Other financial expenses (500,556) (132,632) 377 (456,560) (92,266) 495
Total other financial expenses (33,104,837) (21,442,486) 154 (30,909,229) (18,448,067) 168
Net other financial revenues (2,169,185) (2,186,424) 99 (2,385,570) (625,606) 381
Petrol Group Petrol d.d.
12. Earnings per share
31 March 2009 31 March 2008 Index 09/08 31 March 2009 31 March 2009 Index 09/08
Net profit (5,627,059) 15,559,047 - (8,895,718) 12,244,256 -Weighted average number of ordinary shares issued 2,061,590 2,061,183 100 2,061,590 2,061,183 100Earnings per share (2.73) 7.55 - (4.31) 5.94 -
Petrol Group Petrol d.d.

Entered into the Companies Register of Ljubljana District Court, entry no. 1/05773/00, share capital: EUR 52,240,977.04, VAT ID: SI80267432 53/62
13. Intangible assets of the Petrol Group
(In EUR) Software Concessions GoodwillOngoing
investments TotalCostBalance as at 1 January 2008 3,613,860 8,113,610 255,816 292,050 12,275,336 Additions 67,399 0 0 2,156,588 2,223,987 Disposals (1,533) 0 0 (3,799) (5,332) Transfer from ongoing investments 207,542 0 0 (207,542) 0Exchange rate differences 295 15,295 0 (2,438) 13,152 Balance as at 31 March 2008 3,887,563 8,128,905 255,816 2,234,859 14,507,143
Accumulated allowanceBalance as at 1 January 2008 (2,658,781) (1,511,376) 0 0 (4,170,157) Depreciation and amortization (107,221) (78,727) 0 0 (185,948) Disposals 128 0 0 0 128 Exchange rate differences (102) (3,084) 0 0 (3,186) Balance as at 31 March 2008 (2,765,976) (1,593,187) 0 0 (4,359,163)
Net carrying amount as at 31 March 2008 1,121,587 6,535,718 255,816 2,234,859 10,147,979
Net carrying amount as at 1 January 2008 955,079 6,602,234 255,816 292,050 8,105,180
CostBalance as at 1 January 2009 4,325,035 8,389,517 18,835,789 230,660 31,781,002 Additions 250 0 0 198,757 199,007 Disposals 0 (7,463) 0 0 (7,463) Transfer from ongoing investments 273,250 0 0 (303,262) (30,012) Exchange rate differences (2,933) (39,335) 0 (730) (42,998) Balance as at 31 March 2009 4,595,602 8,342,719 18,835,789 125,425 31,899,536
Accumulated allowanceBalance as at 1 January 2009 (3,138,501) (1,838,781) 0 0 (4,977,281) Depreciation and amortization (136,260) (78,702) 0 0 (214,962) Exchange rate differences 1,594 9,612 0 0 11,206 Balance as at 31 March 2009 (3,273,167) (1,907,871) 0 0 (5,181,037)
Net carrying amount as at 31 March 2009 1,322,435 6,434,848 18,835,789 125,425 26,718,497
Net carrying amount as at 1 January 2009 1,186,534 6,550,736 18,835,789 230,660 26,803,719

Entered into the Companies Register of Ljubljana District Court, entry no. 1/05773/00, share capital: EUR 52,240,977.04, VAT ID: SI80267432 54/62
Intangible assets of Petrol d.d., Ljubljana
(In EUR) Software ConcessionsOngoing
investments TotalCostBalance as at 1 January 2008 3,259,061 3,508,883 7,652 6,775,596 Additions 0 0 207,542 207,542 Transfer from on-going investments 207,542 0 (207,542) 0Balance as at 31 March 2008 3,466,603 3,508,883 7,652 6,983,138
Accumulated allowanceBalance as at 1 January 2008 (2,431,747) (737,731) 0 (3,169,478) Depreciation and amortization (89,848) (35,089) 0 (124,937) Balance as at 31 March 2008 (2,521,595) (772,820) 0 (3,294,415)
Net carrying amount as at 31 March 2008 945,008 2,736,065 7,652 3,688,724
Net carrying amount as at 1 January 2008 827,313 2,771,154 7,652 3,606,118
CostBalance as at 1 January 2009 3,881,519 3,508,883 202,658 7,593,060 Transfer from on-going investments 172,646 0 (202,658) (30,012) Balance as at 31 March 2009 4,054,165 3,508,883 0 7,563,048
Accumulated allowanceBalance as at 1 January 2009 (2,814,968) (878,086) 0 (3,693,054) Depreciation and amortization (116,754) (35,089) 0 (151,842) Balance as at 31 March 2009 (2,931,722) (913,175) 0 (3,844,896)
Net carrying amount as at 31 March 2009 1,122,444 2,595,709 0 3,718,152
Net carrying amount as at 1 January 2009 1,066,551 2,630,797 202,658 3,900,006
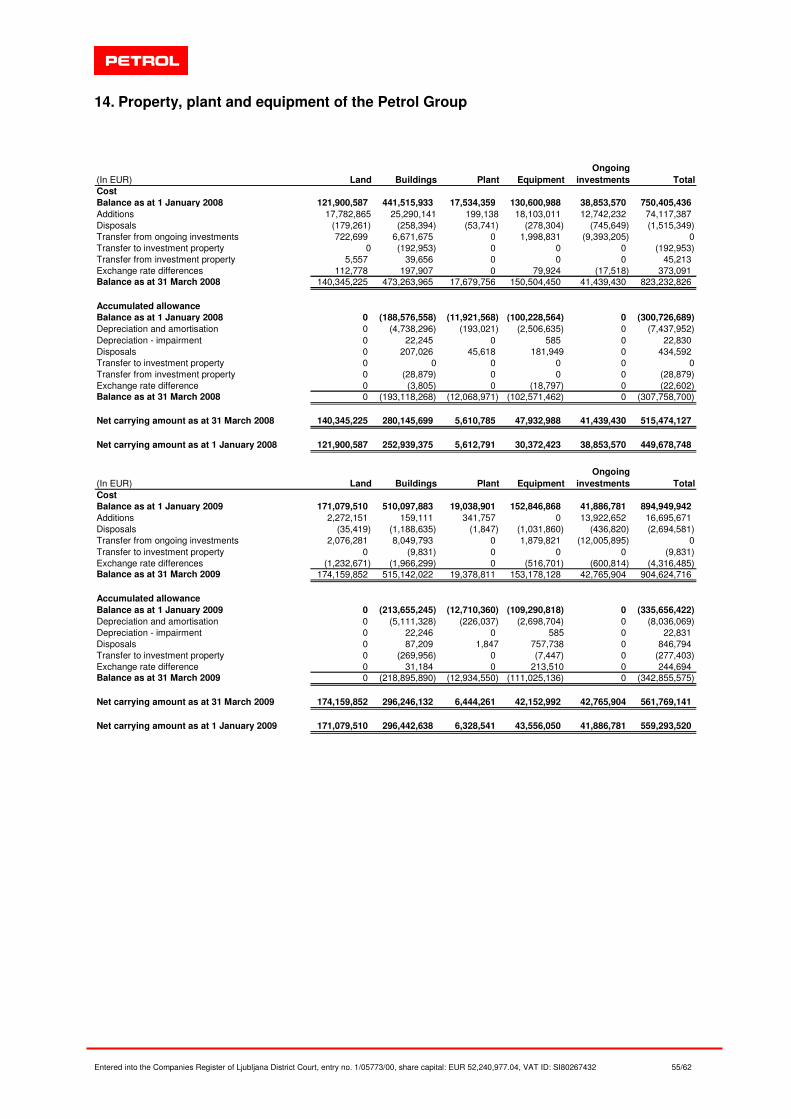
Entered into the Companies Register of Ljubljana District Court, entry no. 1/05773/00, share capital: EUR 52,240,977.04, VAT ID: SI80267432 55/62
14. Property, plant and equipment of the Petrol Group
(In EUR) Land Buildings Plant EquipmentOngoing
investments TotalCostBalance as at 1 January 2008 121,900,587 441,515,933 17,534,359 130,600,988 38,853,570 750,405,436 Additions 17,782,865 25,290,141 199,138 18,103,011 12,742,232 74,117,387 Disposals (179,261) (258,394) (53,741) (278,304) (745,649) (1,515,349) Transfer from ongoing investments 722,699 6,671,675 0 1,998,831 (9,393,205) 0Transfer to investment property 0 (192,953) 0 0 0 (192,953) Transfer from investment property 5,557 39,656 0 0 0 45,213 Exchange rate differences 112,778 197,907 0 79,924 (17,518) 373,091 Balance as at 31 March 2008 140,345,225 473,263,965 17,679,756 150,504,450 41,439,430 823,232,826
Accumulated allowanceBalance as at 1 January 2008 0 (188,576,558) (11,921,568) (100,228,564) 0 (300,726,689) Depreciation and amortisation 0 (4,738,296) (193,021) (2,506,635) 0 (7,437,952) Depreciation - impairment 0 22,245 0 585 0 22,830 Disposals 0 207,026 45,618 181,949 0 434,592 Transfer to investment property 0 0 0 0 0 0Transfer from investment property 0 (28,879) 0 0 0 (28,879) Exchange rate difference 0 (3,805) 0 (18,797) 0 (22,602) Balance as at 31 March 2008 0 (193,118,268) (12,068,971) (102,571,462) 0 (307,758,700)
Net carrying amount as at 31 March 2008 140,345,225 280,145,699 5,610,785 47,932,988 41,439,430 515,474,127
Net carrying amount as at 1 January 2008 121,900,587 252,939,375 5,612,791 30,372,423 38,853,570 449,678,748
(In EUR) Land Buildings Plant EquipmentOngoing
investments TotalCostBalance as at 1 January 2009 171,079,510 510,097,883 19,038,901 152,846,868 41,886,781 894,949,942 Additions 2,272,151 159,111 341,757 0 13,922,652 16,695,671 Disposals (35,419) (1,188,635) (1,847) (1,031,860) (436,820) (2,694,581) Transfer from ongoing investments 2,076,281 8,049,793 0 1,879,821 (12,005,895) 0Transfer to investment property 0 (9,831) 0 0 0 (9,831) Exchange rate differences (1,232,671) (1,966,299) 0 (516,701) (600,814) (4,316,485) Balance as at 31 March 2009 174,159,852 515,142,022 19,378,811 153,178,128 42,765,904 904,624,716
Accumulated allowanceBalance as at 1 January 2009 0 (213,655,245) (12,710,360) (109,290,818) 0 (335,656,422) Depreciation and amortisation 0 (5,111,328) (226,037) (2,698,704) 0 (8,036,069) Depreciation - impairment 0 22,246 0 585 0 22,831 Disposals 0 87,209 1,847 757,738 0 846,794 Transfer to investment property 0 (269,956) 0 (7,447) 0 (277,403) Exchange rate difference 0 31,184 0 213,510 0 244,694 Balance as at 31 March 2009 0 (218,895,890) (12,934,550) (111,025,136) 0 (342,855,575)
Net carrying amount as at 31 March 2009 174,159,852 296,246,132 6,444,261 42,152,992 42,765,904 561,769,141
Net carrying amount as at 1 January 2009 171,079,510 296,442,638 6,328,541 43,556,050 41,886,781 559,293,520
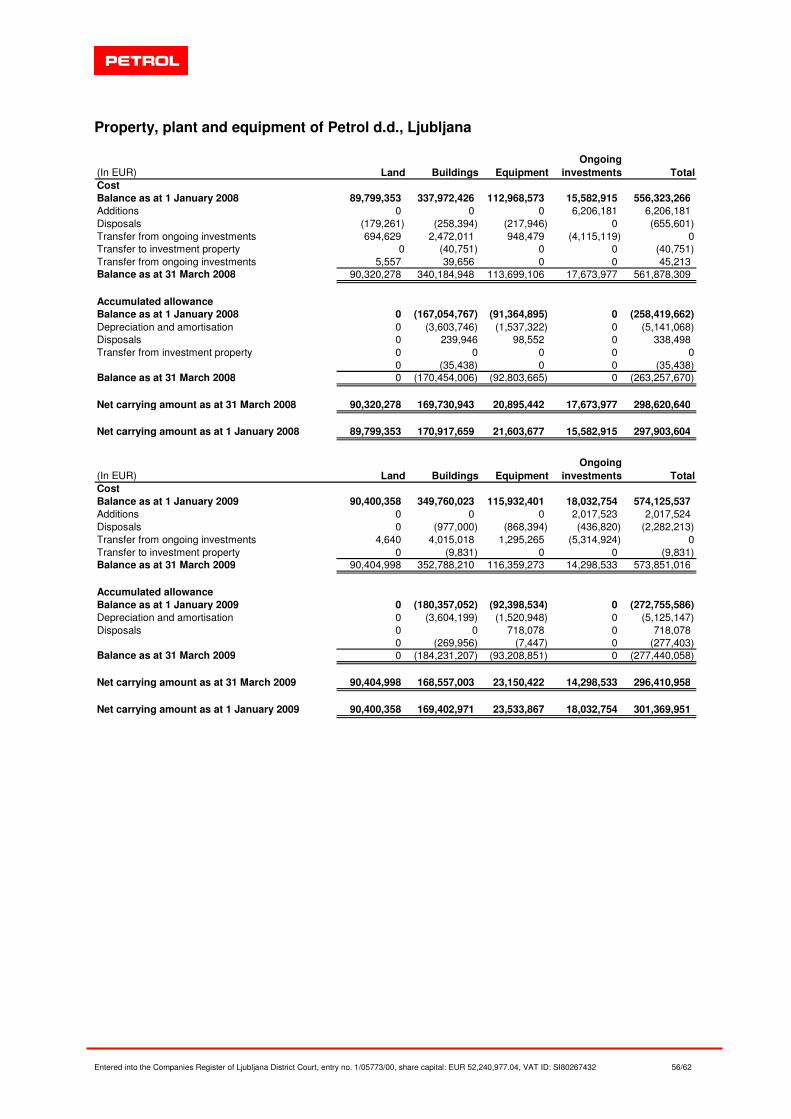
Entered into the Companies Register of Ljubljana District Court, entry no. 1/05773/00, share capital: EUR 52,240,977.04, VAT ID: SI80267432 56/62
Property, plant and equipment of Petrol d.d., Ljubljana (in
(In EUR) Land Buildings EquipmentOngoing
investments TotalCostBalance as at 1 January 2008 89,799,353 337,972,426 112,968,573 15,582,915 556,323,266 Additions 0 0 0 6,206,181 6,206,181 Disposals (179,261) (258,394) (217,946) 0 (655,601) Transfer from ongoing investments 694,629 2,472,011 948,479 (4,115,119) 0Transfer to investment property 0 (40,751) 0 0 (40,751) Transfer from ongoing investments 5,557 39,656 0 0 45,213 Balance as at 31 March 2008 90,320,278 340,184,948 113,699,106 17,673,977 561,878,309
Accumulated allowanceBalance as at 1 January 2008 0 (167,054,767) (91,364,895) 0 (258,419,662) Depreciation and amortisation 0 (3,603,746) (1,537,322) 0 (5,141,068) Disposals 0 239,946 98,552 0 338,498 Transfer from investment property 0 0 0 0 0
0 (35,438) 0 0 (35,438) Balance as at 31 March 2008 0 (170,454,006) (92,803,665) 0 (263,257,670)
Net carrying amount as at 31 March 2008 90,320,278 169,730,943 20,895,442 17,673,977 298,620,640
Net carrying amount as at 1 January 2008 89,799,353 170,917,659 21,603,677 15,582,915 297,903,604
(In EUR) Land Buildings EquipmentOngoing
investments TotalCostBalance as at 1 January 2009 90,400,358 349,760,023 115,932,401 18,032,754 574,125,537 Additions 0 0 0 2,017,523 2,017,524 Disposals 0 (977,000) (868,394) (436,820) (2,282,213) Transfer from ongoing investments 4,640 4,015,018 1,295,265 (5,314,924) 0Transfer to investment property 0 (9,831) 0 0 (9,831) Balance as at 31 March 2009 90,404,998 352,788,210 116,359,273 14,298,533 573,851,016
Accumulated allowanceBalance as at 1 January 2009 0 (180,357,052) (92,398,534) 0 (272,755,586) Depreciation and amortisation 0 (3,604,199) (1,520,948) 0 (5,125,147) Disposals 0 0 718,078 0 718,078
0 (269,956) (7,447) 0 (277,403) Balance as at 31 March 2009 0 (184,231,207) (93,208,851) 0 (277,440,058)
Net carrying amount as at 31 March 2009 90,404,998 168,557,003 23,150,422 14,298,533 296,410,958
Net carrying amount as at 1 January 2009 90,400,358 169,402,971 23,533,867 18,032,754 301,369,951

Entered into the Companies Register of Ljubljana District Court, entry no. 1/05773/00, share capital: EUR 52,240,977.04, VAT ID: SI80267432 57/62
15. Investment property
Petrol Group Petrol d.d.Investment property Investment property
CostBalance as at 1 January 2008 24,875,663 25,953,846 Disposals (145,714) 0Transfer to property, plant and equipment (45,213) (45,213) Transfer from property, plant and equipment 192,953 40,751 Balance as at 31 March 2008 24,877,689 25,949,384
Accumulated depreciationBalance as at 1 January 2008 (9,193,987) (9,637,983) Depreciation for the year (203,498) (216,038) Transfer to property, plant and equipment 28,879 35,438 Transfer from property, plant and equipment 0 0Balance as at 31 March 2008 (9,368,606) (9,818,583)
Net carrying amount as at 31 March 2008 15,509,081 16,130,800
Net carrying amount as at 1 January 2008 15,681,677 16,315,863
CostBalance as at 1 January 2009 25,891,264 26,871,660 Transfer from property, plant and equipment 9,831 9,831 Balance as at 31 March 2009 25,901,095 26,881,491
Accumulated depreciationBalance as at 1 January 2009 (10,377,439) (10,868,618) Depreciation for the year (208,856) (220,416) Balance as at 31 March 2009 (10,586,295) (11,089,034)
Net carrying amount as at 31 March 2009 15,314,800 15,792,455
Net carrying amount as at 1 January 2009 15,513,826 16,003,040

Entered into the Companies Register of Ljubljana District Court, entry no. 1/05773/00, share capital: EUR 52,240,977.04, VAT ID: SI80267432 58/62
16. Investments of Petrol d.d., Ljubljana in subsidiaries
(In EUR) 31 March 2009 31 March 2008 Index 09/08
Balance at 1 January 208,650,219 137,348,899 152 New acquisitions 4,090,000 19,800,000 21
Balance as at 31 March 212,740,219 157,148,899 135
Petrol d.d.
17. Investments of Petrol d.d., Ljubljana in joint ventures
(In EUR) 31 March 2009 31 March 2008 Index 09/08 31 March 2009 31 March 2008 Index 09/08
As at 1 January 16,587,067 14,637,908 113 56,098,000 9,792,885 -Adjustment due to change in accounting policy 0 0 - 0 39,982,535 -Balance at 1 January after the adjustment 16,587,067 14,637,908 113 56,098,000 49,775,420 113 Attributed profit 665,508 608,496 109 0 0 -New investments 0 2,342,245 - 0 2,342,245 -
Balance as at 31 March 17,252,574 17,588,649 98 56,098,000 52,117,665 108
Petrol Group Petrol d.d.
18. Investments in associates
(In EUR) 31 March 2009 31 March 2008 Index 09/08 31 March 2009 31 March 2008 Index 09/08
As at 1 January 128,782,444 255,490,263 50 170,576,930 230,563,013 74 Adjustment due to change in accounting policy 0 0 - 0 73,115,512 -Balance at 1 January after the adjustment 128,782,444 255,490,263 50 170,576,930 303,678,525 56 Net attributed profit 5,233,851 4,373,309 120 0 0 -Dividends received (77,536) 0 - 0 0 -New acquisitions - 569,588 - 0 569,588 -Impairment of investments (20,621,721) 0 - (20,621,721) 0 -
Balance as at 31 December 113,317,038 260,433,160 44 149,955,209 304,248,113 49
Petrol Group Petrol d.d.
19. Available-for-sale financial assets
(In EUR) 31 March 2009 31 March 2008 Index 09/08 31 March 2009 31 March 2008 Index 09/08
Balance as at 1 January 22,692,913 10,509,249 216 22,613,870 10,430,206 217 Decrease in revaluation surplus due to disposal 0 (38,459) - 0 (38,459) -
Balance as at 31 March 22,692,913 10,470,790 217 22,613,870 10,391,747 218
Petrol Group Petrol d.d.
20. Non-current financial receivables
(In EUR) 31 March 2009 31 December 2008 Index 09/08 31 March 2009 31 December 2008 Index 09/08
Financial receivables from companies 1,393,903 1,414,993 99 13,246,235 7,846,234 169 Financial receivables from others 1,056,344 1,071,201 99 1,056,344 1,071,201 99 Finance lease receivables 48,324 48,324 100 0 0 -
Total non-current financial receivables 2,498,571 2,534,518 99 14,302,579 8,917,435 160
Petrol Group Petrol d.d.
21. Non-current operating receivables
(In EUR) 31 March 2009 31 December 2008 Index 09/08 31 March 2009 31 December 2008 Index 09/08
Receivables from companies 1,426,404 1,426,404 100 1,430,872 1,430,872 100 Allowance for receivables from companies (1,426,404) (1,426,404) 100 (1,426,404) (1,426,404) 100 Receivables from municipalities 1,777,182 1,781,077 100 1,642,901 1,642,901 100 Other receivables 83,234 79,466 105 83,234 79,466 105
Total non-current operating receivables 1,860,416 1,860,543 100 1,730,603 1,726,835 100
Petrol Group Petrol d.d.

Entered into the Companies Register of Ljubljana District Court, entry no. 1/05773/00, share capital: EUR 52,240,977.04, VAT ID: SI80267432 59/62
22. Inventories
(In EUR) 31 March 2009 31 December 2008 Index 09/08 31 March 2009 31 December 2008 Index 09/08
Inventory of spare parts and materials 1,023,232 970,673 105 0 0 -Merchandise: 80,070,441 87,011,965 92 66,656,721 72,463,273 92 - fuel 55,309,952 61,614,559 90 45,518,144 50,587,418 90
- other petroleum products 5,943,190 5,548,907 107 5,110,910 4,781,597 107
- other merchandise 18,817,299 19,848,499 95 16,027,667 17,094,258 94
Total inventories 81,093,673 87,982,638 92 66,656,721 72,463,273 92
Petrol Group Petrol d.d.
23. Short-term financial receivables
(In EUR) 31 March 2009 31 December 2008 Index 09/08 31 March 2009 31 December 2008 Index 09/08
Time deposits with banks from 90 to 365 days 5,788,257 1,693,156 342 5,127,117 0 -Loans to companies 5,400,744 1,569,991 344 6,126,079 2,286,483 268 Adjustments of loans to companies (786,669) (786,925) 100 (786,669) (786,925) 100 Finance lease receivables 15,342 20,307 76 0 0 -Interest receivables 859,948 1,056,978 81 953,543 1,159,796 82 Allowance for interest receivables (710,817) (711,081) 100 (705,548) (705,705) 100
Total current financial receivables 10,566,805 2,842,426 372 10,714,522 1,953,649 -
Petrol Group Petrol d.d.
24. Short-term operating receivables
(In EUR) 31 March 2009 31 December 2008 Index 09/08 31 March 2009 31 December 2008 Index 09/08
Trade receivables 253,313,847 289,751,988 87 219,579,738 261,559,232 84 Allowance for trade receivables (16,636,446) (16,848,945) 99 (14,483,633) (11,065,706) 131 Operating receivables from state 6,714,284 13,851,427 48 2,892,706 8,147,216 36 Allowance for receivables from state (125,133) (125,133) 100 0 0 -Operating receivables from interest 2,312,259 2,145,882 108 1,851,126 1,563,621 118 Allowance for interest receivables (1,095,311) (911,164) 120 (1,062,266) (877,841) 121 Other trade receivables 686,038 433,272 158 236,195 44,615 -Allowance of other trade receivables (76,019) (76,019) 100 0 0 -
Total short-term operating receivables 245,093,519 288,221,308 85 209,013,866 259,371,137 81
Petrol Group Petrol d.d.
25. Accrued revenue and deferred costs and other assets
(In EUR) 31 March 2009 31 December 2008 Index 09/08 31 March 2009 31 December 2008 Index 09/08
Advances 1,444,530 3,276,175 44 79,168 190,341 42Accrued default interests 530,747 530,747 100 530,747 530,747 100Uninvoiced natural gas 520,430 552,796 94 520,430 97,186 -Receivables from accrued costs 503,614 908,772 55 503,256 908,574 55Prepaid costs of subscriptions, sponsorships, ... 392,312 286,401 137 384,742 283,055 136Receivables for insurance 245,035 263,175 93 237,573 244,893 97Prepaid insurance premiums 135,659 694,586 20 105,060 516,935 20Inventory of virtual cards 93,077 377,929 25 0 286,751 -Transitional account for merchandise sold 68,282 962,677 7 68,065 961,978 7Prepaid costs arising from Magna card 20,927 15,705 133 0 0 -Deferred operating costs - DARS 14,694 96,398 15 14,694 96,398 15Deferred costs for purchase price for natural gas 0 144,393 - 0 0 -Other 227,091 128,472 177 0 0 -
Total deferred costs and accrued revenues and other assets 4,196,398 8,238,226 51 2,443,735 4,116,858 59
Petrol Group Petrol d.d.

Entered into the Companies Register of Ljubljana District Court, entry no. 1/05773/00, share capital: EUR 52,240,977.04, VAT ID: SI80267432 60/62
26. Financial liabilities
(In EUR) 31 March 2009 31 December 2008 Index 09/08 31 March 2009 31 December 2008 Index 09/08Current
Bank loans 185,259,265 209,434,363 88 89,514,723 107,868,236 83 Liabilities arising from forward transactions 763,454 7,525,045 10 763,454 7,525,045 10 Liabilities arising from interest rate swaps 9,107,016 5,160,936 176 9,107,016 5,160,936 176 Liabilities arising from commodity swaps 3,077,879 748,874 411 3,593,724 1,236,240 291 Finance lease liabilities 1,200,160 1,680,668 71 0 0 -Other loans 2,460,539 2,937,302 84 11,465,164 11,028,116 104
201,868,313 227,487,188 89 114,444,081 132,818,573 86 Non-current
Bank loans 328,166,316 298,733,884 110 305,278,279 275,766,939 111 Finance lease liabilities 7,844,040 7,989,484 98 0 0 -
336,010,356 306,723,368 110 305,278,279 275,766,939 111
Total financial liabilities 537,878,669 534,210,556 101 419,722,360 408,585,512 103
Petrol Group Petrol d.d.
27. Short-term operating and other liabilities
(In EUR) 31 March 2009 31 December 2008 Index 09/08 31 March 2009 31 December 2008 Index 09/08
Trade payables 99,858,791 157,645,835 63 170,145,448 229,681,601 74 Excise duty liabilities 53,741,815 42,875,470 125 48,293,777 40,045,431 121 Value added tax (VAT) liabilities 17,009,626 13,820,063 123 15,717,693 12,292,491 128 Carbon tax 1,622,675 1,948,025 83 1,576,872 1,895,429 83 Import duty liabilities 3,273,248 6,015,036 54 1,546,989 3,894,108 40 Social security contributions 531,489 562,209 95 233,415 239,352 98 Other liabilities to the state 318,751 2,411,947 13 109,074 1,933,168 6 Liabilities to employees 6,022,376 7,108,333 85 3,546,698 4,322,586 82 Liabilities associated with the profit distribution 397,806 405,100 98 397,806 405,100 98 Liabilities arising from advances and collaterals 626,247 623,504 100 592,655 12,462,334 5 Other liabilities 1,600,775 3,185,570 50 1,408,183 2,055,862 68
Total short-term liabilities 185,003,599 236,601,092 78 243,568,609 309,227,463 79
Petrol Group Petrol d.d.
28. Accrued costs and deferred revenue (In EUR) 31 March 2009 31 December 2008 Index 09/08 31 March 2009 31 December 2008 Index 09/08Sales - Magna card 1,744,475 0 - 1,744,475 0 -Accrued interest associated with lawsuits 1,496,392 2,697,587 55 1,460,164 2,663,772 55Accrued costs of leave 1,482,446 1,051,490 141 932,143 633,163 147Accrued costs for legal action 1,470,760 2,099,593 70 929,858 1,496,927 62Accrued environment protection costs 1,222,433 1,222,433 100 1,222,433 1,222,433 100Accrued merchandise deficits 1,134,426 609,543 186 1,086,330 609,543 178Accrued expenses for tanker demurrage 849,707 849,707 100 849,707 849,707 100Accrued interest on arrears arising from overdue trade receivables 703,534 530,747 133 530,747 530,747 100Accrued costs for ZORD 605,965 0 - 605,965 0 -Accrued concession charges 269,599 180,793 149 152,503 102,857 148Cogeneration lease 191,595 66,800 287 0 0 -
Accrued costs of motorway sites payable to DARS 127,457 147,974 86 127,457 147,974 86
Accrued costs of annual report audit 73,380 96,167 76 45,950 45,950 100Customer net credit - Magna prepayment card 68,136 83,540 82 68,136 83,540 82Accrued expenses for claims 33,092 36,021 92 33,092 36,021 92Accrued licence fees 9,925 39,700 25 9,925 39,700 25Other accrued expenses 1,541,853 645,857 239 918,987 204,760 449Short-term deferred revenue from gas connections 272,231 289,090 94 212,469 209,411 101Short-term deferred heating revenue 243,983 315,147 77 0 0 -Short-term deferred revenue from Lubricoat project 67,745 69,387 98 67,745 69,387 98Short-term deferred revenue from assigned contributions 55,420 107,020 52 55,420 47,205 117Short-term deferred revenue from termination of education contracts 2,873 10,611 27 2,873 10,611 27Other current deferred revenues 461,777 427,497 108 379,509 280,987 135
Total accrued and deferred revenues 14,129,204 11,576,704 122 11,435,888 9,284,695 123
Petrol Group Petrol d.d.

Entered into the Companies Register of Ljubljana District Court, entry no. 1/05773/00, share capital: EUR 52,240,977.04, VAT ID: SI80267432 61/62
29. Financial assets at fair value through profit or loss (In EUR) 31 March 2009 31 December 2008 Index 09/08 31 March 2009 31 December 2008 Index 09/08
Receivables arising from forward transactions 0 1,435,280 - 0 1,435,280 -Receivables arising from interest rate swaps 32,690 34,108 96 32,690 34,108 96Receivables from arising form commodity swaps 2,457,993 985,646 249 2,517,945 985,646 255
Total financial assets at fair value through profit or loss 2,490,683 2,455,034 101 2,550,635 2,455,034 104
Petrol d.d.Petrol Group
30. Cash from operations (In EUR) 31 March 2009 31 March 2008 Index 09/08 31 March 2009 31 March 2008 Index 09/08
Profit before tax (8,138,464) 19,688,028 (41) (11,916,081) 15,637,756 (76)
Adjustments for:Depreciation on property, plant and equipment 8,210,195 7,641,450 107 5,345,563 5,357,107 100 Amortisation of intangible assets 214,906 185,944 116 151,842 124,937 122 (Gain)/loss on disposal of property, plant and equipment (203,887) (1,729,181) 12 (42,737) (1,723,815) 2 Other fixed assets (revenues)/expenses 0 218 - 0 2,017 -Other (revenue)/expenses arising from fixed assets 3,556,230 77,899 - 3,592,150 (457) -Net decrease of allowance for operating receivables (228,977) 114,673 - (2,257) 10,597 -Impairment of investments 20,621,721 0 20,621,721 - Impairment of inventories (64,166) (82,083) 78 0 0 -Revenue from assets under management (16,350) (16,350) 100 (13,065) (13,065) 100 Net (decrease in)/creation of other provisions (373,103) (360,617) 103 (477,331) (421,187) 113 Net (decrease in)/creation of accrued costs and deferred revenue 2,552,500 3,172,560 80 2,151,193 3,759,365 57 Net (decrease in)/creation of accrued revenue and deferred costs 2,210,183 939,577 235 1,715,854 (44,374) -Net merchandise shortages 376,731 557,152 68 176,746 496,877 36 Net financial (revenues)/expenses 4,089,116 4,120,372 99 3,241,267 3,067,545 106 Share of profit of joint ventures (665,507) (608,498) 109 0 0 -Share of profit of associates (5,233,851) (4,373,307) 120 0 0 -Financial revenues from dividends received from subsidiaries 0 0 - (5,587,468) (3,552,511) 157 Financial revenues from dividends received from associates 0 0 - (77,536) 0 -
Changes in working capital increases or decreases in investments in subsidiaries Inventories 6,576,400 1,306,001 - 5,629,806 2,023,104 278 Operating and other receivables 44,079,510 (13,078,216) - 45,718,982 (18,907,232) -Operating and other liabilities (44,433,983) (21,948,857) 202 (63,083,638) 18,824,847 -
Cash generated from operations 33,129,204 (4,393,235) - 7,145,011 24,641,511 29
Petrol Group Petrol d.d.

Entered into the Companies Register of Ljubljana District Court, entry no. 1/05773/00, share capital: EUR 52,240,977.04, VAT ID: SI80267432 62/62
31. Related party transactions
(In EUR)Period ended
'31 March 2009
Share in total
amountPeriod ended
'31 March 2008
Share in total
amountPeriod ended
'31 March 2009
Share in total
amountPeriod ended
'31 March 2008
Share in total
amount
Sales revenues:Revenue from sales to subsidiaries - - - - 25,126,139 5.4295% 58,765,261 10.4706%Revenue from sales to joint ventures 318,503 0.0574% 55,635 0.0086% 318,384 0.0688% 31,409 0.0056%Revenue from sales to associates 804,350 0.1449% 836,475 0.1292% 727,137 0.1571% 794,540 0.1416%
Cost of merchandise sold:Cost of merchandise sold to subsidiaries - - - - 161,713,074 39.3037% 302,464,155 59.1556%Cost of merchandise sold to joint ventures 70,291 0.0145% 87,085 0.0149% 70,291 0.0171% 87,085 0.0170%Cost of merchandise sold to associates 18,406,448 3.7860% 14,939,397 2.5620% 955,263 0.2322% 1,970,951 0.3855%
Selling costs:Cost of sales to subsidiaries - - - - 5,909,378 16.3608% 5,468,098 16.4089%Cost of sales to joint ventures 1,870,947 3.9695% 1,798,460 4.4085% 1,870,947 5.1799% 1,798,460 5.3989%Cost of sales to associates 28,548 0.0606% 38,943 0.0955% 27,274 0.0755% 38,430 0.1154%
General and administrative costs:General and administrative costs of subsidiaries - - - - 25,501 0.2503% 520 0.0084%General and administrative costs of joint ventures 300 0.0021% 0 0.0000% 0 0.0000% 0 0.0000%General and administrative costs of associates 1,875 0.0131% 1,908 0.0206% 1,557 0.0153% 1,780 0.0288%
Financial revenues and expenses shares in result:Financial revenues - subsidiaries - - - - 5,587,468 98.6313% 3,552,511 100.0000%Financial revenues - joint ventures 703,480 11.6723% 625,542 12.1997% 0 0.0000% 0 0.0000%Financial revenues - associates 5,323,463 88.3277% 4,501,989 87.8003% 77,536 1.3687% 0 0.0000%Financial expenses - joint ventures 37,973 29.7629% 17,044 11.6959% 0 0.0000% 0 0.0000%Financial expenses - associates 89,612 70.2371% 128,682 88.3041% 0 0.0000% 0 0.0000%
Financial revenues and expenses from interest:Financial revenues from interest - subsidiaries - - - - 398,135 20.9064% 193,915 12.4724%Financial revenues from interest - associates 7,700 0.3722% 48,400 3.0016% 7,700 0.4043% 48,400 3.1130%Financial expenses from interest - subsidiaries - - - - 482,070 10.1934% 239,346 5.2441%Financial expenses from interest - joint ventures 14,329 0.2515% 683 0.0104% 14,329 0.3030% 683 0.0150%Financial expenses from interest - associates 14,919 0.2619% 10,947 0.1662% 14,919 0.3155% 10,947 0.2399%
(In EUR)Period ended
'31 March 2009
Share in total
amountPeriod ended
'31 March 2008
Share in total
amountPeriod ended
'31 March 2009
Share in total
amountPeriod ended
'31 March 2008
Share in total
amount
Investments:Investments in subsidiaries - - - - 212,740,218 48.4144% 208,650,219 47.9297%Investments in joint ventures 17,252,574 11.4111% 16,587,067 11.4103% 56,098,000 12.7665% 56,098,000 12.8865%Investments in associates 133,938,759 88.5889% 128,782,444 88.5897% 170,576,930 38.8191% 170,576,930 39.1838%
Non-current financial receivables:Non-current financial receivables from subsidiaries - - - - 12,882,246 90.0694% 7,482,246 83.9058%Non-current financial receivables from associates 363,989 14.5679% 363,989 14.3613% 363,989 2.5449% 363,989 4.0818%
Non-current operating receivables:Non-current operating receivables from subsidiaries - - - - 4,467 0.2581% 4,467 0.2587%
Current operating receivables:Current operating receivables from subsidiaries - - - - 31,462,033 15.0526% 48,517,840 18.7060%Current operating receivables from joint ventures 401,301 0.1637% 217,701 0.0794% 401,182 0.1919% 217,701 0.0839%Current operating receivables from associates 478,070 0.1951% 456,403 0.1665% 433,287 0.2073% 436,232 0.1682%
Current financial receivables:Current loans granted to subsidiaries - - - - 989,511 9.1838% 958,246 49.0490%Current loans granted to associates 7,700 0.0729% 19,707 0.6933% 7,700 0.0715% 19,707 1.0087%
Short-term deposits (up to 3 months)Short-term deposits(up to 3 months) with subsidiaries - - - - 140,349 99.7073% 5,024,627 99.9716%
Current financial liabilities:Current financial liabilities to subsidiaries - - - - 9,520,465 8.3189% 8,578,178 6.4586%Current financial liabilities to joint ventures 1,328,527 0.6581% 1,320,773 0.5797% 1,328,527 1.1609% 1,320,773 0.9944%Current financial liabilities to associates 1,006,556 0.4986% 1,510,070 0.6627% 1,006,556 0.8795% 1,510,070 1.1369%
Current operating liabilities:Current operating liabilities to subsidiaries - - - - 121,091,993 49.7158% 156,225,583 50.5213%Current operating liabilities to joint ventures 732,222 0.3958% 768,338 0.3339% 732,222 0.3006% 768,338 0.2485%Current operating liabilities to associates 6,307,175 3.4092% 8,481,704 3.5848% 433,856 0.1781% 388,465 0.1256%
Petrol Group Petrol d.d.
Petrol Group Petrol d.d.