REPORT ON ENVIRONMENTAL STATUS OF NAVI …mpcb.gov.in/images/pdf/envstatusreportnm.pdfREPORT ON...
26
REPORT ON ENVIRONMENTAL STATUS OF NAVI MUMBAI REGION - MAHARASHTRA MAHARASHTRA POLLUTION CONTROL BOARD Kalpataru Point, Sion Circle, Sion (East) Mumbai 400 022
-
Upload
trinhxuyen -
Category
Documents
-
view
221 -
download
1
Transcript of REPORT ON ENVIRONMENTAL STATUS OF NAVI …mpcb.gov.in/images/pdf/envstatusreportnm.pdfREPORT ON...

REPORT ON ENVIRONMENTAL STATUS OF NAVI MUMBAI REGION - MAHARASHTRA
MAHARASHTRA POLLUTION CONTROL BOARD Kalpataru Point, Sion Circle, Sion (East) Mumbai 400 022

2
Index
Sr. No. Topic Page
numbers
1 INTRODUCTION 1-1
2 BACKGROUND 2-2
3 INVENTORY OF POLLUTION SOURCES 3-4
4 STATUS OF Municipal Solid Wastes as per MSW (M & H) RULES 5-5
5 Status of Bio-medical Waste Management 6-6
6 WATER ENVIRONMENT 7-11
7 Air Quality Monitoring 12-13
8 Monitoring of Noise Pollution 14-14
9 Status of Hazardous Waste Management 15-16
10 Review of yearly activities of MPCB, Navi Mumbai Region 17-17
11 Area specific problems and tasks ahead of the Board 18-19

3
1. INTRODUCTION: Maharashtra Pollution Control Board was established under the Maharashtra
Prevention and Control of Water Pollution Act, 1969 in the year 1970. The
primary responsibility of the Board at that time was related to the water
pollution activity. With the increasing environmental awareness and
associated newer environmental legislations, MPCB is being entrusted the
newer areas of pollution control and environmental protection. This has made
the MPCB a multidisciplinary science and technology based organisation.
MPCB is now regulating all the major environmental legislations in the state
including;
Water (Prevention and Control of Pollution) Act, 1974.
Air (Prevention and Control of Pollution) Act, 1981.
Environmental (Protection) Act,1986 and the rules made there under
Environmental Impact Assessment Notification, 1994 Coastal Zone Regulation, 1991 Hazardous Waste (Management and Handling) Rules, 1989 Bio-Medical Waste (M&H) Rules, 1998 Municipal Solid Waste (M&H) Rules, 2000 Plastic Rules, 2000 Fly ash Utilisation Notification, 1999 etc.
There is now a paradigm shift in the functioning and approach of MPCB
towards pollution control and environmental protection. One of the important
tools for effective regulatory control is adequate and informative public
awareness. Board has taken several steps for informative public awareness
including up to-date website, advertisements in print and TV media, booklets,
special programs etc. Board has also decided that the environmental status
report for each region is made available in public domain. The status of
Environment Report of Navi Mumbai region is prepared with this background
and published.

4
2. BACKGROUND: The Navi Mumbai region comprises of Navi Mumbai Municipal Corporation
area belonging to Thane district and Uran taluka and Taloja MIDC of Raigad
district. The jurisdiction of Navi Mumbai Region is further sub divided as
follows:
Sub Regional office Navi Mumbai-1: This Sub Region comprises of the residential & industrial areas of
Belapur, Shirawane, Nerul, Turbhe, Pawane, Vashi.
Sub Regional office Navi Mumbai-2: This Sub Region comprises of the residential & industrial areas of Airoli, Rabale, Ghansoli, Mahape, Khairane.
Sub Regional office Navi Mumbai-3:
This Sub Region comprises of the residential & industrial areas of MIDC Taloja area and Uran Taluka. The Thane Belapur area was earlier well known for the largest industrial belt
in Asia. Thereafter, this area was developed as a satellite township to solve
the various problems arised due to the congestion in Mumbai city based on
the recommendations made in the year 1962by Barve committee. Accordingly
“CIDCO” was constituted as a wholly owned subsidiary of the State
Government to exclusively develop the township. The area was gradually
urbanized and also industrialized. The proximity to Mumbai, good transport
network, and surplus manpower has helped the industrial sector of this area
to bloom. The proximity to sea / creek has assisted to solve many problems
related to disposal of treated effluents generated due to domestic and
industrial activities. Due to proximity to the sea the port activities at JNPT
were established which has helped immensely in the import of raw materials
and export of finished goods and thus facilitating good economical growth of
the region.
The water supply for this region is mainly done through network of closed
pipeline from the following water sources.
A. Morabe dam (MJP) – 55MLD.
B. Hetawane dam (CIDCO) --- 40 MLD.
C. Baravi dam (MIDC) --- 142 MLD.
D. Ransai dam (MJP) --- 3 MLD.

5
The total water supply to the area covered under NAVI MUMBAI REGION
amounts to 240 MLD.
Due to heavy urbanization and heavy industrialization this area has to face
unique environmental issues. Considering the newer environmental
regulations in the sector of municipal solid waste, bio medical waste,
hazardous waste, the role of MPCB as a regulatory body in this area achieves
high significance. The first step to understand the problem is to identify the
source of pollution. Accordingly inventory of pollution sources is made.

6
3. INVENTORY OF POLLUTION SOURCES: The region has two major MIDC industrial estates namely, TTC and Taloja
and few industries scattered in Uran taluka. These industrial estates mainly
comprises of Chemical, bulk drugs & intermediates, dye and dye
intermediates, pharmaceutical, pesticide, petrochemical, engineering goods
and textile manufacturing industries. There are also three breweries in this
area. The distribution of industries in the area is as follows:
Distribution of industries by Sub Region
District Sub Region Category LSI MSI SSI TOTAL
RED 31 19 246 296
ORANGE 2 3 173 178 NM-I
GREEN 2 1 203 206
Thane (part)
Sub Total 35 23 622 680
RED 13 6 325 344
ORANGE 0 3 142 145 NM-II
GREEN 0 2 540 542
Thane (part)
Sub Total 13 11 1007 1031
RED 43 22 221 286
ORANGE 5 8 41 54 NM-III
GREEN 3 1 263 267
Raigad (part)
Sub Total 51 31 525 607
Total 99 65 2154 2318

7
MAP Showing Jurisdiction of Navi Mumbai Sub Region 1 & 2

8
4. STATUS OF Municipal Solid Wastes as per MSW (M & H) RULES: Navi Mumbai Region jurisdiction for MSW M&H Rules 2000 covers Municipal
Corporation of Navi Mumbai and Municipal Council of Uran (‘C’ Class).
Considering the extensive urbanization of Navi Mumbai, and multiple
residential nodes the challenges in management of municipal solid waste are
numerous The State Government has allotted 65 acres of land for proper
treatment and disposal of municipal solid waste at Turbhe. The first phase on
10 acres of land is developed and scientifically developed landfill site has
been made operational since June 2005. The proposal of bio-methanisation
with power generation is under active consideration.
Uran Municipal area covers an area of 2.2 sq.km. About 8 MT/D municipal
solid wastes is generated. A vermiculture plant is installed in the premises of
Uran municipal council building, where the part solid waste is treated. The
remaining solid waste is presently dumped at Boripakhadi.
Details of local bodies are as follows: Sr.No. Name of local body Navi Mumbai
Municipal Corporation
Uran Municipal Council
1 Class Corporation C
2 Population 703947 23254
3 Area in Sq.Km. 162.5 2.2
4 Qty. of MSW in MT/D 400 8
5 Details of Authorisation granted by MPCB
BO/MSW A/B-109 dated 25.1.2005
RONM/TB/03 dated 31.8.2004
6 Details of Proposed project Bio-methanisation Vermiculture
7 Capital cost of Project in Rs. 9.00 Crores 18.0 Lacs
8 Expected annual O&M expenses in Rs. 7.00 Crores 18.0 Lacs

9
5. Status of Bio-medical Waste Management There are about 134 identified hospitals having bed strength of 2669 in Navi
Mumbai. The total bio-medical waste generated in this region is to the tune of
860 kg per day. All of these hospitals are members of M/s. Mumbai Waste
Management Ltd., Taloja common bio medical waste treatment and disposal
facility.
Details of bio-medical waste generation in Navi Mumbai: Sr.no.
Particulars of hospitals with beds No.of
hospitals No. of beds No. of
authorisation issued
No. of hospitals complying
1 300 and above 02 1050 02 02 2 Between 200– 300 02 500 02 02 3 Between 50-200 01 70 01 01 4 Between 5-50 83 994 83 83 5 Below 5 46 55 46 46 6 No. of clinics 540 00 Undertaking
submitted 540
Common BMW facility at Taloja: MWML at Taloja has established a bio medical waste facility for disposal of
BMW wastes in the year 2003. Following units are operational in this facility:
Segregation of waste and colour coded bagging of waste at source.
Door to door BMW collection and transportation facility
Incinerator of capacity 200 Kg/ Hour
Autoclave two nos of capacity 600 & 400 liters respectively.
Shredder
Secured landfill
BMW facility at Uran: Uran municipal council has provided deep burial facility in accordance with
BMW Rules. The deep burial facility for councils with population less than 5
lacs is permissible.

10
The compliance in respect of Bio-medical waste (M & H) Rules 2000 in the
region is fairly good. Additional capacity of CBMWTDF is presently used by
GMMC.
6. WATER ENVIRONMENT: 6.1. Domestic waste water generation, treatment and disposal details
The total sewage effluent generated in Navi Mumbai Municipal Corporation
area is to the tune of 190 MLD and is collected through closed underground
sewerage system provided in most of the areas. There are 8 operational
STPs in this area and details are as follows:
Details of STP in Navi Mumbai
Sr. Node capacity in MLD Treatment type Final
disposal 1 Belapur, Sector 12 21.00 Aerated lagoon Creek
2 Belapur, Sector 26 0.15 Primary treatment Gardening
3 Nerul, Sector 2 17.00 Aerated lagoon Creek
4 Nerul, Sector 50 23.00 Aerated lagoon Creek
5 Vashi, Sector 18 34.00 Pri. & Sec treatment. Creek
6 Sanpada, Sector 20 31.00 Aerated lagoon Creek
7 Airoli, Sector 18 18.00 Aerated lagoon Creek
8 Koparkhairne, Sector 14 36.00 Aerated lagoon Creek
Slum area of Turbhe node, Ghansoli are yet to be covered under planned
sewage collection and treatment system.
The total sewage effluent generated in Uran Municipal Council is to the tune
of 2.1 MLD. This effluent reaches the sea through open drains. There is no

11
treatment facility provided by the local body and untreated sewage effluent is
discharged into creek through nallah.
MPCB regularly monitors treated sewage effluent quality. Treated effluent
quality of Vashi STP is as follows:
STP NERUL—Sec-2
Sr.No. Date pH BOD COD SS O & G 1 28.01.05 6.9 55 108 48 BDL 2 11.02.05 6.8 90 136 48 BDL 3 18.03.05 7.0 82 112 142 BDL 4 20.04.05 7.0 95 128 106 BDL 5 20.05.05 7.2 120.0 264.0 68.0 BDL 6 19.07.05 6.8 120.0 216.0 122.0 1.6 STP Belapur—Sec-26
Sr.No. Date pH BOD COD SS O & G 1 28.01.05 7.7 17 56 16 BDL 2 28.02.05 8.5 10 32 20 BDL 3 18.03.05 7.3 27 40 28 BDL 4 20.04.05 6.9 11 40 66 BDL 5. 19.07.05 7.3 74.0 160.0 58.0 BDL STP near NRI—Sec-50
Sr.No. Date pH BOD COD SS O & G 1 28.01.05 7.2 50 120 76 BDL 2. 28.02.05 7.3 50 140 106 2.0 3. 18.03.05 7.2 90 192 202 BDL 4. 20.04.05 7.3 16 96 134 BDL 5. 20.05.05 7.4 56.0 88.0 78.0 BDL 6. 19.07.05 6.9 115.0 264.0 86.0 BDL STP Belapur—Sec-12
Sr.No. Date pH BOD COD SS O & G 1. 31.01.05 7.3 80 148 42 BDL 2. 28.02.05 7.3 24 128 72 BDL 3. 18.03.05 6.9 80 176 164 BDL 4. 20.04.05 6.9 27 132 116 BDL 5. 03.05.05 7.0 75 176 114 BDL 7. 19.07.05 7.1 18.0 112.0 70.0 0.8
STP Vashi—Sec-18
Sr.No. Date pH BOD COD SS O & G 1 28.01.05 6.7 190 392 166 4.4

12
2 24.02.05 6.8 120 268 108 1.2 3 15.03.05 6.9 33 144 92 BDL 4 28.04.05 6.8 38.0 112.0 110.0 BDL 5 18.05.05 6.9 220.0 400.0 116.0 BDL 6. 19.07.05 6.9 105.0 228.0 176.0 0.8
6.2. Industrial / trade effluent generation, treatment and disposal: There are 1136 industries generating industrial effluents. The large and
medium scale effluent generating industries have comprehensive treatment
facilities of their own while the small scale industries have provided primary
treatment facilities. The treated effluents of all these industries in the MIDC
estates are further treated in 2 Common Effluent Treatment Plants (CETP) at
Taloja and TTC Pawane. MPC Board regularly monitors treated effluent
quality from individual industries and CETPs. Details of CETPs are as
follows:
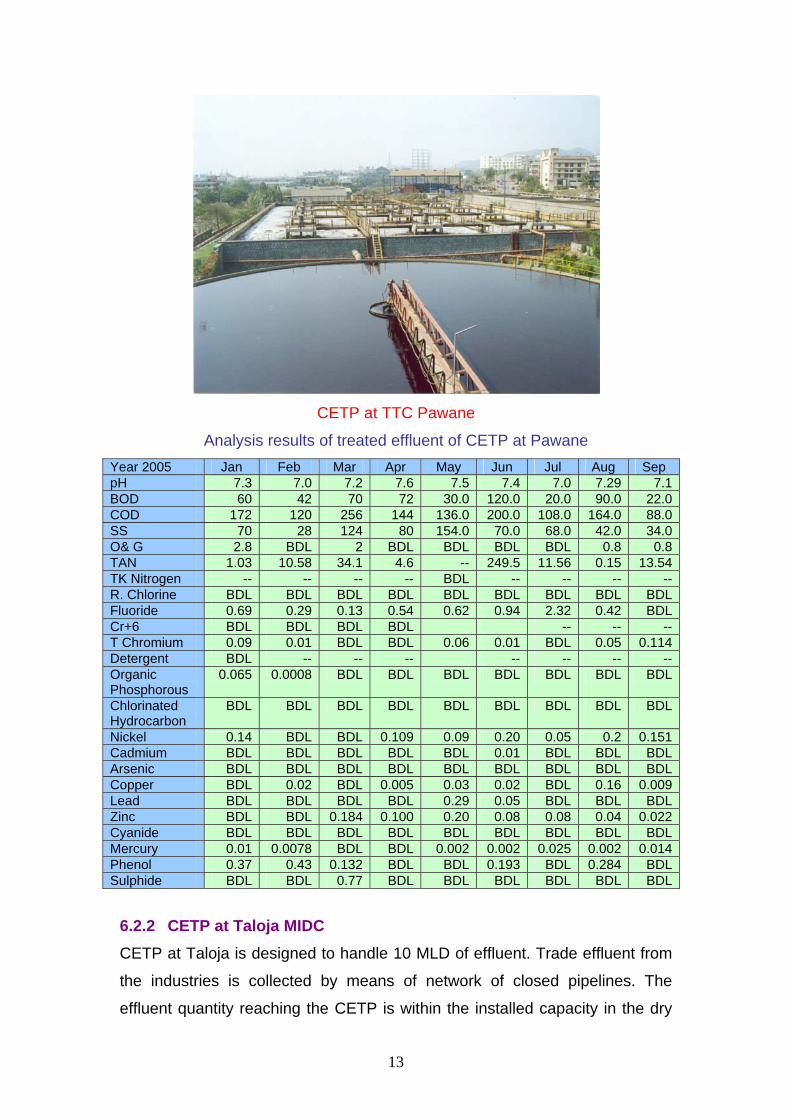
6.2.1 CETP at TTC MIDC, Pawane
CETP at TTC was established on November 1997 and is designed to handle
12 MLD of effluent. This CETP is upgraded to enhance the total capacity upto
27 MLD. There are 425 small scale user members, 55 medium / large scale
user members and 1905 non user associate members to the CETP. Treated
and partially treated effluent is collected through closed underground pipeline
network and brought to CETP. After secondary treatment effluent is
discharged through a closed pipeline of length 3.5 Kms. by means of gravity
into the Trans Thane Creek through submerged outfall. The sludge generation
from the CETP is about 5 MT/Day and is disposed at CHWTSDF at
TTCWMA.
13
CETP at TTC Pawane
Analysis results of treated effluent of CETP at Pawane Year 2005 Jan Feb Mar Apr May Jun Jul Aug Sep pH 7.3 7.0 7.2 7.6 7.5 7.4 7.0 7.29 7.1BOD 60 42 70 72 30.0 120.0 20.0 90.0 22.0COD 172 120 256 144 136.0 200.0 108.0 164.0 88.0SS 70 28 124 80 154.0 70.0 68.0 42.0 34.0O& G 2.8 BDL 2 BDL BDL BDL BDL 0.8 0.8TAN 1.03 10.58 34.1 4.6 -- 249.5 11.56 0.15 13.54TK Nitrogen -- -- -- -- BDL -- -- -- --R. Chlorine BDL BDL BDL BDL BDL BDL BDL BDL BDLFluoride 0.69 0.29 0.13 0.54 0.62 0.94 2.32 0.42 BDLCr+6 BDL BDL BDL BDL -- -- --T Chromium 0.09 0.01 BDL BDL 0.06 0.01 BDL 0.05 0.114Detergent BDL -- -- -- -- -- -- --Organic Phosphorous
0.065 0.0008 BDL BDL BDL BDL BDL BDL BDL
Chlorinated Hydrocarbon
BDL BDL BDL BDL BDL BDL BDL BDL BDL
Nickel 0.14 BDL BDL 0.109 0.09 0.20 0.05 0.2 0.151Cadmium BDL BDL BDL BDL BDL 0.01 BDL BDL BDLArsenic BDL BDL BDL BDL BDL BDL BDL BDL BDLCopper BDL 0.02 BDL 0.005 0.03 0.02 BDL 0.16 0.009Lead BDL BDL BDL BDL 0.29 0.05 BDL BDL BDLZinc BDL BDL 0.184 0.100 0.20 0.08 0.08 0.04 0.022Cyanide BDL BDL BDL BDL BDL BDL BDL BDL BDLMercury 0.01 0.0078 BDL BDL 0.002 0.002 0.025 0.002 0.014Phenol 0.37 0.43 0.132 BDL BDL 0.193 BDL 0.284 BDLSulphide BDL BDL 0.77 BDL BDL BDL BDL BDL BDL
6.2.2 CETP at Taloja MIDC CETP at Taloja is designed to handle 10 MLD of effluent. Trade effluent from
the industries is collected by means of network of closed pipelines. The
effluent quantity reaching the CETP is within the installed capacity in the dry

14
season. In the rainy season the effluent quantity is higher resulting in some
quantity of untreated effluent being discharged, but due to the dilution factor of
rain water the impact is not significant. CETP is in the process of increasing
its handling capacity. Upgradation in the existing aeration tank by installing
Diffused Aeration System carried out at a cost of Rs.1.25 crores in May 2005
has resulted in treated effluent quality being well within prescribed standards.
Hazardous waste generated from this unit in the form of sludge is regularly
sent to CHWTSDF at MWML, Taloja for scientific disposal.
The treated effluent from CETP is disposed into the creek through a closed 7
kilometers long pipeline by means of gravity into creek. The blockage /
breaking of effluent carrying pipelines to CETP and treated effluent carrying
pipeline from CETP to the final disposal point is a cause of effluent entering
adjacent rivers. Vigilance is maintained by MPC Board as well as CETP staff,
and any such incidence is brought to the notice of CETP officials and CETP f
is directed by MPC Board to carry out repairs at the earliest.
Diffused aeration system provided at CETP Taloja Analysis results of treated effluent of CETP at Taloja
Parameter. Jan Feb Mar Apr May Jun Jul Aug PH 7.2 6.8 7.0 7.4 6.5 7.6 7.5 7.7BOD 320.0 360.0 140.0 190.0 400.0 65.0 35.0 52.0COD 896.0 704.0 1328.0 1200.0 1520.0 200.0 104.0 140.0S.S 164.0 216.0 162.0 304.0 442.0 -- 106.0 50.0OG. 5.4 12.0 1.0 BDL 3.6 2.0 BDL BDL

15
T.A.N. 228.0 198.45 42.5 62.4 185.0 91.6 61.8 30.20Res. Chlorine. BDL -- BDL BDL BDL -- BDL BDLFluoride. 0.33 0.64 0.95 0.93 1.2 5.14 4.39 0.49T.K.N. -- -- -- -- -- -- 73.0 96.32Chromium BDL BDL BDL BDL BDL BDL BDL --Total Chromium BDL BDL BDL BDL BDL BDL BDL 0.035Nickel 0.20 0.22 0.261 0.072 0.285 0.137 0.126 0.118Cadmium 0.01 BDL BDL 0.017 BDL BDL BDL BDLAresenic BDL BDL BDL BDL BDL BDL BDL BDLCopper 0.01 BDL 0.028 0.009 0.011 0.011 BDL 0.261Lead BDL BDL BDL BDL 0.055 0.049 0.083 0.058Zinc BDL 0.02 0.154 0.060 0.028 0.922 0.229 0.059Cyanide BDL -- 1.3435 0.364 0.053 0.011 0.017 BDLMercury. 0.01 0.016 BDL 0.025 0.045 0.020 BDL 0.02Phenol 0.08 0.44 0.665 0.176 0.376 BDL 0.298 BDLSulphide. BDL -- 4.98 3.77 4.90 0.58 -- BDLBoron. -- 6.10 -- -- -- -- -- --

16
7. Air Quality Monitoring: Navi Mumbai Region accommodates highly populated urban areas like Airoli, Vashi, Nerul, Turbhe and Belapur. Being heavily industrialized in addition to urbanization, the air quality in the area suffers due to vehicular and industrial emissions. The industries in this region are visited regularly to monitor and verify the adequacy of air pollution control systems that are in place. Action is initiated against defaulting units, if any. MPCB monitors ambient air quality at several locations including industrial, commercial and residential areas. A continuous air monitoring station is in operation at Vashi with an on-line display for public awareness.
Display board of continuous air monitoring station at Vashi
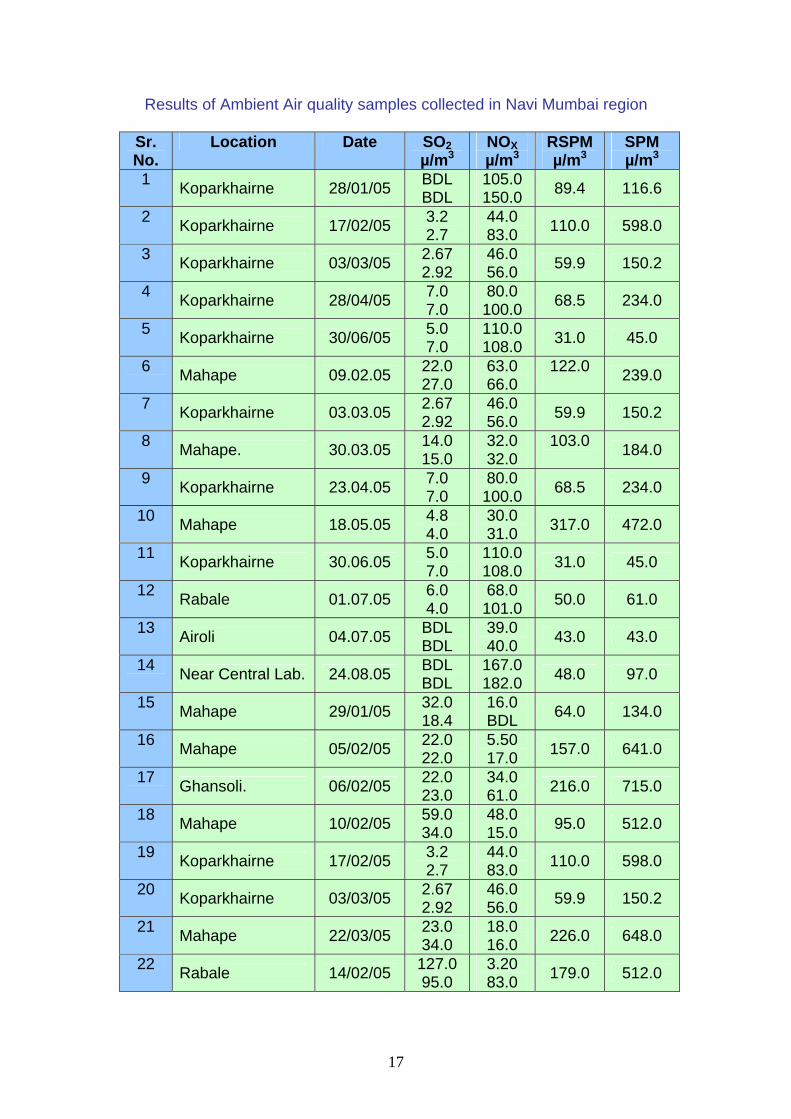
The Board also monitors quality of the emissions from the stack on regular basis. Total number of 197 stack monitoring has been carried out since January 2005. Most of the large and medium scale industries have their own air quality monitoring facility and carry out air quality monitoring within their own premises and submit the analysis to the Board. Some industries also get air quality monitored in their premises through private agencies. The average air quality as monitored by MPC Board is illustrated in the table below:
17
Results of Ambient Air quality samples collected in Navi Mumbai region
Sr. No.
Location Date SO2 µ/m3
NOX µ/m3
RSPM µ/m3
SPM µ/m3
1 Koparkhairne 28/01/05 BDL BDL
105.0 150.0 89.4 116.6
2 Koparkhairne 17/02/05 3.2 2.7
44.0 83.0 110.0 598.0
3 Koparkhairne 03/03/05 2.67 2.92
46.0 56.0 59.9 150.2
4 Koparkhairne 28/04/05 7.0 7.0
80.0 100.0 68.5 234.0
5 Koparkhairne 30/06/05 5.0 7.0
110.0 108.0 31.0 45.0
6 Mahape 09.02.05 22.0 27.0
63.0 66.0
122.0 239.0
7 Koparkhairne 03.03.05 2.67 2.92
46.0 56.0 59.9 150.2
8 Mahape. 30.03.05 14.0 15.0
32.0 32.0
103.0 184.0
9 Koparkhairne 23.04.05 7.0 7.0
80.0 100.0 68.5 234.0
10 Mahape 18.05.05 4.8 4.0
30.0 31.0 317.0 472.0
11 Koparkhairne 30.06.05 5.0 7.0
110.0 108.0 31.0 45.0
12 Rabale 01.07.05 6.0 4.0
68.0 101.0 50.0 61.0
13 Airoli 04.07.05 BDL BDL
39.0 40.0 43.0 43.0
14 Near Central Lab. 24.08.05 BDL BDL
167.0 182.0 48.0 97.0
15 Mahape 29/01/05 32.0 18.4
16.0 BDL 64.0 134.0
16 Mahape 05/02/05 22.0 22.0
5.50 17.0 157.0 641.0
17 Ghansoli. 06/02/05 22.0 23.0
34.0 61.0 216.0 715.0
18 Mahape 10/02/05 59.0 34.0
48.0 15.0 95.0 512.0
19 Koparkhairne 17/02/05 3.2 2.7
44.0 83.0 110.0 598.0
20 Koparkhairne 03/03/05 2.67 2.92
46.0 56.0 59.9 150.2
21 Mahape 22/03/05 23.0 34.0
18.0 16.0 226.0 648.0
22 Rabale 14/02/05 127.0 95.0
3.20 83.0 179.0 512.0

18
The above mentioned reports of the Ambient Air Quality Monitoring show that , the values of RSPM and SPM frequently exceeding the quality norms prescribed by Central Pollution Control Board. This may be because of the regular road traffic and the construction activities in this area. The other parameters like SO2 and NOX are mostly found within the limits.

19
8. Monitoring of Noise Pollution: The noise levels in some parts of the region are high due to heavy vehicular traffic, industrial operations and com mercial activities. The Board monitors noise levels regularly in industrial zones. Noise monitoring is also carried out when there are complaints regarding noise pollution in commercial and residential areas. A special drive to ascertain the levels of noise pollution due to firecrackers was undertaken by the Board during the Diwali Festival. A statement of noise levels during explosions of crackers during Diwali is shown below:
Noise Level Readings in dB(A) during Diwali
Sr. No. Locations Date Time Readings
in dB(A)
1. Nerul Sector-18 01.11.2005 19.10 PM
103.4 99.0 99.2
119.0 121.0
2. Vashi Sector-17 01.11.2005 20.30 PM
127.0 117.6 111.3 112.7 98.6
3. A.P.M.C Yard 02.11.2005 19.25 PM
77.3 84.2 81.3 78.6 76.7
4. Airoli Naka 02.11.2005 19.10 PM
90.7 95.2 88.5
102.4 110.6
5. Swatantra Sangram Chowk Ghansoli
02.11.2005 19.50 PM
120.0 104.1 127.2 96.2 94.3
6. Koperkhairane Sect – 10 02.11.2005 20.50
PM
98.4 95.6
104.2 123.8 100.1

20
In spite of the regulation made by the Central Government for enforcing the norms on crackers manufacturing the noise level monitored during the Diwali festival were observed on higher side . 9. Hazardous Waste Management:
Navi Mumbai Region accommodates a large number of industrial units such
as chemicals, textiles, pesticides etc. and as such the hazardous waste
generation in the region is significant. As per the inventory made by the
Board based on 2003 amendment in the Rules, there are about 517
hazardous waste generation units. Details are as follows:
No. of units generating Hazardous waste: 517 nos. Total Quantity of Hazardous waste generated: 111996 MTA. Quantity of waste recyclable: 13958 MTA. Quantity of waste incinerable: 50991 MTA. Quantity of land disposable waste: 47047.2 MTA.
The inventory prepared on the basis of available records is being verified on the field and will be revised accordingly.
9.1 Treatment & Disposal of Hazardous Waste: The area is fortunate in having with two common facilities for management of
hazardous waste at TTC and Mumbai Waste Management Ltd. (MWML),
Taloja. MPC Board has made it mandatory to the industries generating
hazardous waste in this region to become members of this common
hazardous waste treatment, storage and disposal facility (CHWTSDF) and
send their hazardous waste regularly for scientific disposal.
CHWTSDF of TTCWMA, Mahape:
CHWTSDF was established in January 2004. The facilities provided are
treatment like solidification and physical chemical treatment along with
secured land fill. The capacity of landfill is 25,000 Mt of waste. This facility has
membership of about 1000 hazardous waste generating units.
21
Secured landfill site of TTCWMA
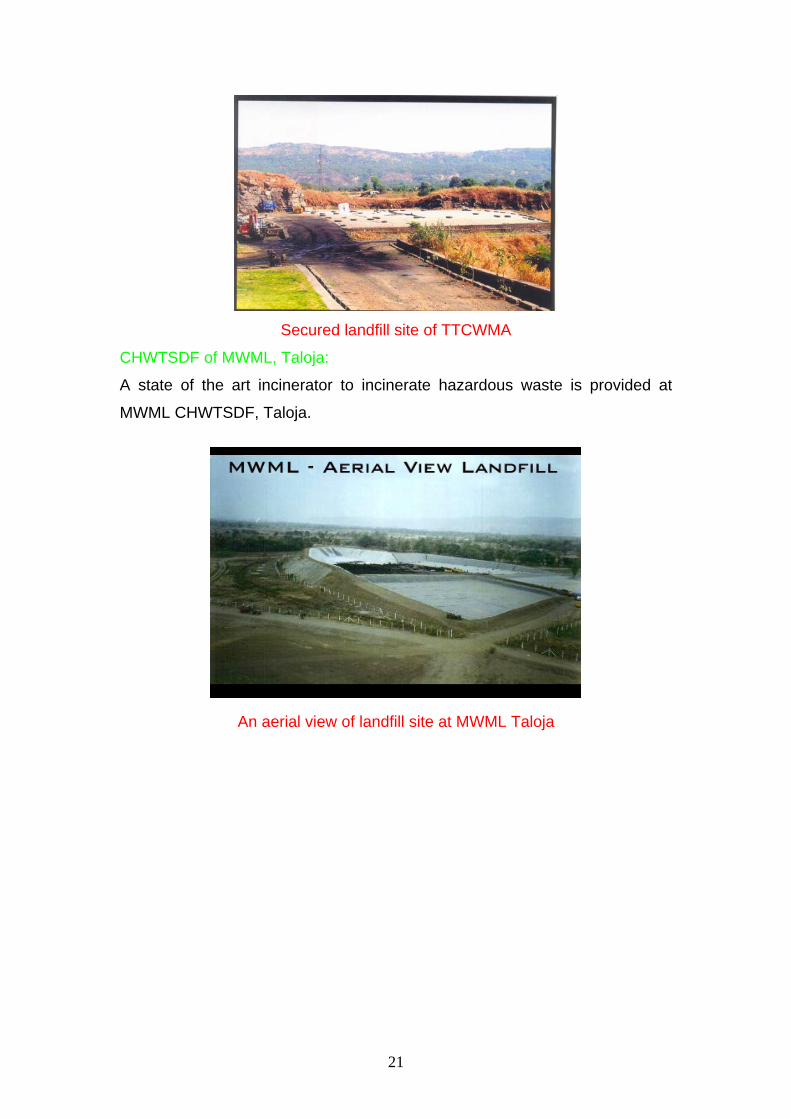
CHWTSDF of MWML, Taloja:
A state of the art incinerator to incinerate hazardous waste is provided at
MWML CHWTSDF, Taloja.
An aerial view of landfill site at MWML Taloja

22
Units of the incinerator provided at MWML Taloja In addition to these CHWTSDF, Navi Mumbai Region has waste reprocessing / recycling industries as follows:
No. of units for non ferrous recycling units 15 nos. No. of units recycling other hazardous wastes 31 nos. No. of industries having own incineration facility 6 nos.
10. Review of yearly activities of MPCB, Navi Mumbai Region: The Navi Mumbai region covers 2318 industries, 8 STPs, 2 CETPs, 2
CHWTSDFs, 540 hospitals, 1 BMWTDF and numerous environmental
monitoring stations. The technical staff strength of this region is 13 The Board
regularly monitors the air and water quality and noise levels. The details of
samples collected for the period January – November 2005 are summarised
below:
Sr.no Particulars SRO-NM I SRO-NM II SRO-NM III Total 1. Water samples a. Industrial 595 266 639 1500 b. River 0 0 30 30 c. Creek 18 11 19 48 d. Ponds & 93 59 22 174

23
lakes 2. Air samples a. Ambient 35 41 16 92 b. Stack 96 68 33 197 3. Hazardous waste 76 56 11 143 4. Noise samples 30 25 2 57 5. Bio-medical
waste 0 0 2 2
Public Complaints about Pollution Problems:- There are several complaints regarding pollution received by the Board in this Region. Officials promptly visit and assess the situation in each case and carry out investigation. If the complaints are found to be genuine, necessary action is initiated. The details complaints attended to for the period January – November 2005 are summarized below: Sr.no Particulars SRO-NM I SRO-NM II SRO-NM III Total 1. Complaint
received
a. Air 23 13 6 42 b. Water 06 07 10 23 c. noise 08 01 00 09 2. Complaints
attended
a. Air 23 13 6 42 b. Water 06 07 10 23 c. noise 08 01 00 09

24
11. Area specific problems and tasks ahead of the Board: Given the varied topography, heavy industrialization and urbanization in the
region, there are several problems that need to be addressed. Some key
problems have been identified and the action taken, probable solutions and
the tasks that lie ahead of the board are listed below:
11.1. Problems 11.1.1 Illegal Disposal of Hazardous Waste Several instances of illegal disposal of Hazardous waste have come to light in
the MIDC and at their outskirts. Due to the presence of several similar types
of waste generating units in the area, it is difficult to pinpoint the culprits. It
has been observed that such instances occur on non-working days and at
night time. Thus it becomes extremely difficult to exercise control over such
activity in spite of vigilance by the MPC Board. Taking help of outside agency
to keep a round the clock vigilance in this area could be a probable solution.
Such illegal disposal of hazardous wastes are usually carried out through an
unauthorized transports. Hence has the back tracking investigations could
be accomplished by the police agency. Also the regular control can be
possible only if , local public, police depart, industrial association , NGO’s
and HW facility operator come together and work for the general cause of
the public health.
11.1.2. Fishkill incidents in the area:
A few instances of fish kill have occurred in the region.
They are briefly narrated as follows.:-
1) Fish kill incident at Diwale Creek .
This was occurred on 26th june 2005 near village Diwale. Which is located at downs steam of the effluent disposal point of CETP of Tajola Industrial Area. The mortality was found on higher side.
The creek water and fish samples were analyzed but no chemical toxicity was detected .

25
2) Fish Kill at Ghansoli Area.:- The Fish kill was reported at a small fish breeding pond located near Ghansoli Village. It can be categorized as a minor incident. The region was found due to discharge of sewage from local nalla. This was earlier sprayed by Municipal Corporation with Larvicide Chemicals.
The probable causes of death in most of the fish kill incidents could not
be pinpointed. Causes of death could include environmental factors, illegal disposal of hazardous wastes / chemicals by tankers from outside the region etc. 11.1.3. Smell nuisance in residential sectors: Since the residential areas lie in the vicinity of the industrial belt, several
complaints of smell nuisance especially during nighttime have been
registered. Probable causes of such smell nuisance include non-operation of
air pollution control systems at night time and illegal incineration of chemical
waste in brick kilns. Action is initiated against such defaulting industries and
brick kilns.
Due to the heavy flooding occurred on July 26th 2005 food grains stored in
warehouses in Pawane area were contaminated and emanated foul smell n
surrounding areas due to decomposition. Directions were issued to the
warehouses to scientifically dispose these grains at MSW site of NMMC..
11.2. Tasks ahead 11.2.1. Upgradation / capacity enhancement of CETPs: The CETP at Taloja was designed for 10 MLD and CETP of TTC was
designed for 12 MLD. Increase in the number of industries generating waste
water and run-offs during rainy season results in a much larger quantity of
effluent entering the CETPs. The Board has directed the CETPs to enhance
their capacity. The capacity enhancement of CETP Taloja will be completed
by the end of 2006 and that of CETP TTC is almost completed and will be
commissioned soon.
26
11.2.2 . Mangrove Protection The mangroves in the region are suffering as a result of improper
environmental management. The Board has appointed an Expert Committee
for environmental improvement of the Airoli Creek at Navi Mumbai and an
action plan based on the committee’s recommendations has been submitted
to the State Government. In addition to implementation of the action plan for
this area, similar studies need to be undertaken for protection of mangroves in
other parts of the region.
Conclusion: There are numerous tasks like the implementation of the Environment
Protection Act – Water Act and Air Act and implementation of the Honourable
Supreme Court’s directives in respect of hazardous waste, MSW etc. At
present the staff strength of the Board is quite small. These tasks can be
undertaken and targets can be better achieved if the technical staff strength is
augmented.