
Report of the CLIPS Training Workshop for Eastern and ...€¦ · report of the climate information...
60
REPORT OF THE CLIMATE INFORMATION AND PREDICTION SERVICES (CLIPS) TRAINING WORKSHOP FOR EASTERN AND SOUTHERN AFRICA (Nairobi, Kenya, 29 July – 9 August 2002) WCASP - No. 58 WMO-TD No. 1152 WORLD METEOROLOGICAL ORGANIZATION August 2002
Transcript of Report of the CLIPS Training Workshop for Eastern and ...€¦ · report of the climate information...

REPORT OF THE CLIMATE INFORMATION AND PREDICTION SERVICES (CLIPS) TRAINING WORKSHOP FOR EASTERN AND
SOUTHERN AFRICA
(Nairobi, Kenya, 29 July – 9 August 2002)
WCASP - No. 58
WMO-TD No. 1152
WORLD METEOROLOGICAL ORGANIZATION August 2002

T A B L E O F C O N T E N T S EXECUTIVE SUMMARY.......................................................................................................... 4 1. INTRODUCTION............................................................................................................. 6
1.1 Objectives of CLIPS .................................................................................................................. 6 1.2 Objectives of the CLIPS training workshop............................................................................ 6
2. SUMMARY OF THE WORKSHOP PRESENTATION .................................................... 7 2.1 Background of the CLIPS Training Workshop ....................................................................... 7 2.2 Climate variability in eastern and southern Africa................................................................. 7
2.2.1 Climate variability in the Eastern African region: its causes and relationship to El Niño – Southern Oscillation (ENSO).................................................................................... 7
2.2.2 Climate variability in the Southern African region,............................................................... 8 2.2.3 Roles of the Indian and Atlantic Oceans on the climate variability of eastern
Africa.................................................................................................................................... 9 2.2.4 Roles of the Indian and Atlantic oceans on the southern Africa climate variability ............. 9
2.3 Empirical models..................................................................................................................... 10 2.3.1 Fundamentals of global seasonal to interannual prediction .............................................. 10 2.3.2 Introduction to empirical models ........................................................................................ 11 2.3.3 Creating empirical models ................................................................................................. 12 2.3.4 Data requirements for empirical models ............................................................................ 13 2.3.5 Climate data quality control methods................................................................................. 13
2.4 El Niño – Southern Oscillation (ENSO) ................................................................................. 14 2.4.1 Dynamics of ENSO............................................................................................................ 14 2.4.2 Overview of ENSO indices................................................................................................. 15 2.4.3 Fundamentals of ENSO prediction .................................................................................... 16
2.5 Country presentations on the current national meteorological capabilities in data management; climate information and prediction; and needs for the future ................... 16
2.5.1 Botswana ........................................................................................................................... 17 2.5.2 Burundi............................................................................................................................... 17 2.5.3 Djibouti ............................................................................................................................... 17 2.5.4 Ethiopia .............................................................................................................................. 17 2.5.5 Kenya................................................................................................................................. 18 2.5.6 Lesotho .............................................................................................................................. 18 2.5.7 Malawi................................................................................................................................ 19 2.5.8 Mauritius ............................................................................................................................ 19 2.5.9 Mozambique ...................................................................................................................... 19 2.5.10 Namibia.............................................................................................................................. 20 2.5.11 Rwanda.............................................................................................................................. 20 2.5.12 Seychelles.......................................................................................................................... 20 2.5.13 Somalia .............................................................................................................................. 21 2.5.14 South Africa ....................................................................................................................... 21
1

2.5.15 Sudan................................................................................................................................. 22 2.5.16 Swaziland........................................................................................................................... 22 2.5.17 Tanzania ............................................................................................................................ 23 2.5.18 Uganda .............................................................................................................................. 24 2.5.19 Zambia ............................................................................................................................... 24 2.5.20 Zimbabwe .......................................................................................................................... 25
2.6 Dynamical modeling................................................................................................................ 26 2.6.1 Basics of numerical atmospheric modeling ....................................................................... 26 2.6.2 Basics of numerical oceanic and coupled modeling.......................................................... 27 2.6.3 Drought Monitoring Centre – Nairobi (DMCN) climate modeling activities........................ 27 2.6.4 Ensemble modeling ........................................................................................................... 28 2.7.1 Basics of verification .......................................................................................................... 28 2.7.2 Verification methods used by DMCN and DMCH.............................................................. 29 2.7.3 Verification of rainfall/temperature predictions – how good are operational
forecasts? .......................................................................................................................... 30 2.7.4 Forecast value ................................................................................................................... 30
2.8 Communicating climate forecasts......................................................................................... 31 2.8.1 Simple concepts of probability including conditional probabilities and generation
of terciles............................................................................................................................ 31 2.8.2 Chaos................................................................................................................................. 31 2.8.3 Cognitive illusions .............................................................................................................. 31
2.9 Dissemination and application of climate information........................................................ 32 2.9.1 The importance of climate data and monitoring ................................................................ 32 2.9.2 The role of the media in the dissemination of climate information .................................... 33 2.9.3 Application of climate information in disaster management .............................................. 34 2.9.4 Application of climate information in public health............................................................. 34 2.9.5 Application of climate information in livestock management ............................................. 35 2.9.6 Application of climate information in water resources ....................................................... 35 2.9.7 Application of climate information in agriculture and food security.................................... 35 2.9.8 Application of climate information in energy, industry, transport and
communications ................................................................................................................. 36 2.9.9 Application of climate information in human settlement and public safety ........................ 36 2.9.10 Application of climate information and prediction services in production and
management of seeds in Kenya ........................................................................................ 37 2.9.11 Project formulation and management................................................................................ 38
2.10 Recommendations and the way forward .............................................................................. 38 2.10.1 Decision making with climate information and predictions ................................................ 38 2.10.2 Recommendations ............................................................................................................. 39
Annex I: WORKSHOP PROGRAMME.................................................................................. 40 Annex II: LIST OF PARTICIPANTS ...................................................................................... 46 Annex III: SPEECHES ........................................................................................................... 50
2

Annex IV: QUESTIONNAIRE FOR PARTICIPANTS EVALUATION OF THE WORKSHOP .......................................................................................................................... 55 Annex V: ACRONYM GLOSSARY ....................................................................................... 57
3

EXECUTIVE SUMMARY The Twelfth Congress of the World Meteorological Organization (WMO), which was held in June 1995, recognized the important advances that had been made in science and climate services as an outcome of the World Climate Programme (WCP). The Congress therefore established the Climate Information and Prediction Services (CLIPS) project within the WCP Department. The fundamental goal of the CLIPS project is to develop the capacity of the National Meteorological and Hydrological Services (NMHS) to take advantage of the recent advances in climate science and in the processing and delivery of climate information, and to pass on the benefits of the improved climate services to the user community. The Climate Outlook Forums that have been implemented in various parts of the World have fostered valuable interaction between the producers and users of climate information. Capacity building of users from various sectors has been enhanced in matters related to the application of climate information. This is in line with the capacity building aspects of CLIPS. In general, the benefits that have been gained through these forums, especially during the 1997/98 El Niño-related climate anomalies, have therefore been enormous. However, new challenges to the NMHS have emerged, in particular during the 1997/98 period. It became clear that further training of climate scientists was necessary to equip them with the skills that would enable them respond to these challenges. As a result, a three-pronged training strategy within CLIPS was developed to assist all the NMHS. The strategy involves the identification of Focal Points and their coordination into regional networks, the development of the CLIPS Curriculum, and the organization of training opportunities. In conjunction with the National Oceanic and Atmospheric Administration’s Office of Global Programs (NOAA-OGP), the Drought Monitoring Centres in Nairobi (DMCN) and Harare (DMCH), and the Kenya Meteorological Department (KMD), WMO organized a CLIPS training workshop for eastern and southern African countries in Nairobi, Kenya, from 29 July to 9 August 2002. This workshop was the third in the series. The previous two workshops had been held in Auckland, New Zealand, in December 2000 for the Pacific Region, hosted by the National Institute of Water and Atmospheric Research (NIWA), and in Niamey, Niger, in May 2001 for the West African region, hosted by the African Centre of Meteorological Applications for Development (ACMAD). Both workshops were supported by WMO and NOAA-OGP. The participants of the third training workshop comprised mainly of climate scientists (national CLIPS Focal Points) from 20 countries in eastern and southern Africa. Since training and capacity building have always been a part of the CLIPS project, the national Focal Points have been chosen from among climate scientists with limited exposure to the fundamental principles of modern climate dynamics. The Focal Points can then apply the knowledge acquired by taking part in CLIPS training workshops to economic management and other environmental and societal issues as well as to the training of other scientists in their home countries. The concept of the regional network of CLIPS Focal Points is to develop capacity in NMHS through the selection and training of individual experts and to develop interaction on a regional basis. The development of Focal Points has enabled this training to be focused in an effective manner while the creation of the CLIPS Curriculum has aided the facility with which training can be undertaken. The training workshop was intended to improve the capabilities of the NMHS in the following respects:
• Understanding the behavior of the global climate system; • Using such understanding to develop or adapt seasonal climate prediction
schemes for their countries; and
4

• Working with professionals in their nations to apply the prediction schemes among others in the management of agricultural production and food security, water resources, energy generation and consumption, public health, environment, disaster management.
The two-week training workshop addressed the following topics:
• Background to the CLIPS project and the training workshop; • Climate variability in eastern and southern Africa: Causes and relationships to
the El Niño – Southern Oscillation (ENSO) phenomenon; • Roles of the Indian and Atlantic Oceans in the climate variability of eastern and
southern Africa; • Climate data quality control procedures; • Introduction to empirical models and data requirements for these models;
Fundamentals of seasonal to inter-annual climate prediction; • Dynamics of ENSO: Overview of ENSO indices; ENSO modeling;
Fundamentals of ENSO prediction; • Country presentations on: Current national meteorological capabilities in data
management; Current capabilities in climate information and prediction, and needs for the future;
• Dynamical modeling: Basics of numerical atmospheric modeling; Basics of numerical oceanic and coupled modeling; DMCN climate modeling programmes and facilities; Ensemble modeling;
• Climate prediction verification methods: Basics of verification; Verification hands-on-exercise of Deterministic and Probabilistic forecasts; Verification methods used by DMCN and DMCH; Verification of rainfall/temperature predictions – How good are operational forecasts; Forecast value;
• Communication of climate forecasts: Simple concepts of probability including conditional probabilities and generation of terciles; Chaos; Deterministic versus probabilistic predictions; Cognitive illusions; Presentation and interpretation of the forecast;
• Dissemination and application of climate information: The importance of climate data and monitoring; The role of the media in the dissemination of climate information; Application of climate information in disaster management, public health, livestock management, water resources, agriculture and food security, energy, industry, transport and communications, human settlement and public safety, production and management of seeds in Kenya; Project formulation and management; and
• Recommendations and the way forward: Decision making with climate information and predictions; Recommendation from workshop participants; Questionnaire for participants evaluation of the workshop.
The participation of climate experts from national, regional and international institutions and some end-users of climate information reflects the importance that has been given to the activity by WMO and its partners.
5

1. INTRODUCTION The Twelfth World Meteorological Congress held in June 1995 recognized that important advances had been occurring in science and climate services, including the important scientific outcome of the World Climate Research Programme (WCRP). Congress therefore decided upon the establishment of the World Meteorological Organization’s (WMO) Climate Information and Prediction Services (CLIPS) project within the World Climate Programme (WCP) Department, and included it in the Fourth WMO Long-term Plan for 1996-2005. 1.1 Objectives of CLIPS The primary objective of the CLIPS project is to develop the capacity of the National Meteorological and Hydrological Services (NMHS) to take advantage of the recent advances in the science of climate and in the processing and delivery of climate information, and to pass on the benefits of the improved climate services to the user community. CLIPS exists to take advantage of current data bases, increasing climate knowledge, and improving prediction capabilities to limit the negative impacts of climate variability and to enhance planning activities based on the developing capacity of climate science. CLIPS sits at the interface between the science and the applications, building the bridges essential to promote development activities in a manner beneficial to climatologists, climate modelers, decision makers, enterprise managers, and individuals alike. The main project components include training, demonstration/pilot projects, liaison with research programmes, and networking. The third in the series of CLIPS training workshops was jointly organized by WMO, the National Oceanic and Atmospheric Association’s Office of Global Programs (NOAA-OGP) and the two Drought Monitoring Centres in Nairobi (DMCN) and Harare (DMCH). The workshop aimed at the Eastern and Southern African region and was hosted by DMCN. Delegates from 20 countries in the region participated. 1.2 Objectives of the CLIPS training workshop The objective of the training workshop was to improve the capabilities of regional climate scientists in climate prediction, and to address how to enhance the use of climate information in various socio-economic sectors. Such information can enable governments in the region to put in place appropriate measures to mitigate the potential impacts associated with climate-related extremes for sustainable development. In brief, the workshop addressed the following issues:
(a) The fundamental principles of modern climate dynamics and their application to economic management, and other environmental and societal issues;
(b) Development of seasonal climate (especially rainfall) prediction and application schemes for the respective countries;
(c) Enhancement of national/regional preparedness in early warning systems by informing about planning processes and developing communication networks; and
(d) Collaboration with other professionals in the application of climate information in other sectors including agriculture and food security, water resources, energy generation/consumption, public health, environment, disaster management, etc.
6
2. SUMMARY OF THE WORKSHOP PRESENTATION 2.1 Background of the CLIPS Training Workshop
by Dr. B. Nyenzi, Chief of the World Climate Applications and CLIPS (WCAC) Division under WCP
Dr. Nyenzi welcomed the participants to the workshop and urged them to be more informal and free to express and exchange ideas during the presentations. This would facilitate a good interactive process of the workshop. He explained that CLIPS is the implementing project of the World Climate Application Services Programme (WCASP), and it focuses on climate applications and services. The main objective of CLIPS is to provide assistance to NMHS in building their capacity to interact with and serve the various users of climate information. Dr. Nyenzi emphasized that CLIPS deals with climate variability and NOT climate change. It involves an adaptation and mitigation strategy for climate change. CLIPS provides a link between climate prediction, information and application. Specific objectives of CLIPS were highlighted as:
• To encourage the development of operational climate prediction; • To facilitate the development and strengthening of a global network of
regional/national climate centres; • To collaborate with other WMO programmes and other relevant institutions; • To coordinate activities related to the Open Program Area Group (OPAG) on
Climate, Application, Information and Prediction Services of the Commission for Climatology (CCl) – CCl-OPAG3; and
• Application of climate information in food security (agriculture), water resources, energy, health, livestock, etc.
It was noted that CLIPS has a substantial number of currently ongoing activities which include the development of verification methods, collaboration with other partners and WMO programmes/establishments, the infrastructure of operational forecasts and the training and capacity building such as:
• Establishment of CLIPS Focal Points; • Networking of CLIPS Focal Points; • Development of CLIPS Training Curriculum; • Organizing CLIPS Training Workshop; and • Training end-users through workshops, pilot application projects and climate
outlook forums. 2.2 Climate variability in eastern and southern Africa 2.2.1 Climate variability in the Eastern African region: its causes and
relationship to El Niño – Southern Oscillation (ENSO) by Z. Atheru, DMCN
Mr. Atheru presented the climate variability in the eastern Africa region emphasizing its potential causes and relationships with ENSO events. He noted that rainfall is the most important climatic factor for many African countries and its interannual variability has a major impact on national economies. Weather and climate extremes such as droughts and floods are quite common in eastern Africa. Such extremes, like the recent 1997/98 floods and the 1999/2001 droughts in the Greater Horn of Africa (GHA), are often associated with food, energy and water shortages, loss of life and property among
7

many other socio-economic disruptions. Some examples of the impacts of the recent climate extremes were presented. The climate systems that play an important role in influencing and modulating the climate variability in the region include the Inter-Tropical Convergence Zone (ITCZ), intra-seasonal Madden Julian Oscillation (MJO), Quasi Biennial Oscillation (QBO), tropical cyclones, jet streams, and sub-tropical anticyclones as well as Sea Surface Temperature (SST) anomalies over the Pacific, Atlantic and Indian Oceans. Other systems include, among others, disturbances from the mid latitudes, ENSO, easterly waves, equatorial westerlies, persistent meso-scale circulations and monsoon circulations. The climate of eastern Africa depicts very strong seasonality, and the climate anomalies are sometimes associated with ENSO events. Warm/cold ENSO events are often, but not always, associated with below/above average rainfall amounts over most parts of eastern Africa during the major rainfall seasons. However, the SST anomalies over the surrounding ocean basins of the Atlantic and Indian Oceans as well as the inland topographic features modulate the overall anomalies. Most predictors for seasonal rainfall anomaly in the region are therefore mainly based on ENSO and SST anomalies in the tropical Pacific, Indian and Atlantic Oceans. Climate monitoring and skilful seasonal climate prediction are crucial for the proper planning and management of all climate-related activities including agriculture, water resources and hydroelectric power supply, among many others. On a routine basis therefore, DMCN produces two types of products, namely decadal (ten day) and monthly. The products include:
• Rainfall distribution; • Drought severity; • Agrometeorological conditions; • General impacts; and • Weather outlook. •
Monthly and seasonal products contain the following:
• Climatological summaries; • Drought severity; • Dominant synoptic systems; • Climate outlook; and • Socio-economic conditions and their impacts.
2.2.2 Climate variability in the Southern African region,
by Dr. A. Makarau, Department of Physics, University of Zimbabwe, Harare, Zimbabwe
The climate variability in southern Africa was presented by Dr. Amos Makarau. Dr. Makarau highlighted that the fundamental considerations of variability are the time scales of variability which is best described by cycles. The time scales of interest here are:
• inter-annual/seasonal variability; and • intra-seasonal (sub-seasonal) variability
Predominant climate systems in southern Africa include: ITCZ (north of 20 °S), Botswana Upper Anticyclone (BUH, mainly affecting Botswana, Namibia, Zambia,
8

Zimbabwe, South Africa), tropical cyclones (Islands, Mozambique, Zimbabwe, Swaziland, Zambia, Tanzania and Malawi), westerly waves and frontal systems (all mainland countries except Tanzania, Malawi, the Democratic Republic of Congo (DRC) and Zambia), easterly waves (Tanzania, Malawi, Zambia, Mozambique), monsoons (the Islands, Tanzania, Malawi, DRC and Zambia), the Mozambique Channel-Angola Trough (MCAT) which oscillates between 12°S and 16°S, and teleconnection-related climate variability. ENSO has also been associated with the climate variability in southern Africa. Mean circulation patterns (winds, moisture flux, and horizontal divergence) for the wet and dry spells during the austral summer were demonstrated, focusing mainly on Zimbabwe. The influence of the systems is both spatial and temporal across the region, since the region is climatologically inhomogeneous. In summary:
• Easterly (westerly) disturbances are associated with wet (dry) spells; • Variability between climate extremes has increased in the recent decades; • Extreme patterns have become more severe (floods and droughts); • Climate variability is biased towards drier southern Africa; • There is an apparent shift towards fewer but more intense precipitation events
per season; and • Severest droughts have been recurring every 10 years since 1982 (1982, 1992,
2002), the last year not ENSO related. This suggests that droughts are not always linked to El Niño events. Therefore there is a need for further research into the causes of droughts.
2.2.3 Roles of the Indian and Atlantic Oceans on the climate variability of
eastern Africa by Dr. C. Mutai, Kenya Meteorological Department (KMD)
The roles of the Indian and Atlantic Oceans on the climate variability of eastern Africa was presented by Dr. Mutai. Dr. Mutai gave an overview of the current understanding of eastern Africa climate based on:
• Seasonal rainfall variability; • Prediction of seasonal rainfall based on ENSO, and SSTs from the Pacific,
Atlantic and Indian Oceans; • Anomalous tropical circulation patterns associated with above normal SST
patterns; and • East – west dipole in the equatorial Indian Ocean is important for enhanced
rainfall in eastern Africa Statistical and dynamical General Circulation Model (GCM) simulation studies have shown the relative contribution of Atlantic and Indian Ocean SST anomalies on East African rainfall variability. It was emphasized that the sources of moisture affecting the climate of the region come from the two oceans. 2.2.4 Roles of the Indian and Atlantic oceans on the southern Africa climate
variability by Dr. A. Makarau, University of Zimbabwe, Harare, Zimbabwe
Dr. Makarau gave an account of the influence of the Indian and Atlantic Oceans on the climate variability of southern Africa. He noted that the Atlantic and Indian Oceans have direct and indirect influences on the climate variability over southern Africa.
9

The direct impacts of the Atlantic Ocean on the climate variability of southern Africa include:
• Sub-tropical high pressure belt and associated wave-trains; • Cold upwelling (west coasts of South Africa, Namibia, Angola, and DRC); and • Westerly waves (South Africa, Namibia, Botswana, and Zimbabwe).
The indirect impacts of the Atlantic Ocean on the climate variability of southern Africa include:
• BUH (Namibia, Botswana, South Africa, Zimbabwe, Zambia); • Tropical-sub-tropical troughs (Namibia, South Africa, Lesotho, Angola,
Botswana, Zimbabwe); and • Reinforcement of the Indian Ocean Anticyclone.
Correlations between Atlantic Ocean SSTs and area-averaged rainfall in southern Africa have been found to be too weak for operational purposes. However, central Atlantic SSTs are positively correlated with early summer rainfall over western South Africa, Namibia, Angola and DRC. For the Indian Ocean, the direct influences on the climate variability over southern Africa include, among others:
• Tropical cyclones (the Islands, Tanzania, Malawi, Mozambique, Zimbabwe, Swaziland, South Africa);
• Monsoons and easterly waves (Tanzania, DRC, Zambia, Malawi, Mozambique, the Islands); and
• ITCZ. Negative correlations (about -0.6) exist between area-averaged rainfall in southern Africa and central equatorial Indian Ocean SSTs. The window encompassed by the equator and 10°S latitude and 60°E-70°E longitude offers useful forecast guidance at 3-6 months prior to Southern Hemisphere summer. At a lag of 9 months, rainfall is positively correlated with SSTs in the South Indian Ocean (r = +0.42 near 35°S, 65°E). The central equatorial Indian Ocean is the major source of moisture and energy variability over northeastern southern Africa (the Islands, Tanzania, DRC, Zambia, Malawi, Mozambique, Zimbabwe, northeastern South Africa and Swaziland) by modulating the ITCZ, monsoons, the low-level jet and related easterly waves as well as tropical cyclones. 2.3 Empirical models 2.3.1 Fundamentals of global seasonal to interannual prediction
by Dr. W. Landman, South Africa Weather Service (SAWS) Dr. Landman provided the workshop participants with the fundamentals of seasonal to interannual climate predictions. He highlighted a background to the science of seasonal climate forecasting. The surface forcing conditions (e.g. SSTs) are predictable, and drive atmospheric circulation evolution. It was noted that:
• The quality of daily numerical forecasts declines quickly from 1 to 10 days; • Monthly averages increase the forecast time limit to positive or negative 20
days; • Oceanic information and the use of ensembles make seasonal prediction viable;
10

• The three basic seasonal modeling approaches are Statistical models; Atmospheric GCMs (AGCMs) forced with persisted or predicted SST
anomalies; and Fully coupled atmospheric and oceanic GCMs (AOGCMs);
• Surface variables (e.g. rainfall) are highly unsteady, and their association with predictors such as SSTs is sample dependent;
• Model skill varies with time (season) and space (location); • Forecast verification is very important to
Verify models; Build users’ confidence;
• Probability forecasts are preferred to deterministic forecasts; • Statistical and dynamical downscaling can improve on GCM rainfall forecasts; • Good observational network is necessary for good forecasts and also
verification; and • Forecast products should be tailored for end-users.
Recommendations:
• Need to have people go for training on Seasonal to Interannual Prediction (SIP) modeling at advanced centres; and
• Need to study the details of the various mechanisms, including El Niño, that affect local weather.
2.3.2 Introduction to empirical models
by Dr. W. Landman, SAWS An introduction to empirical models was presented by Dr. Landman. Dr. Landman drew the participants’ attention to the importance of knowing the origin and limitations of the datasets used in empirical models. Statistical seasonal forecasting methods that are usually used include the following:
• Regression Analysis - aims to establish an expression between a predictand and predictors;
• Neural Networks; • Discriminant Analysis; • Cluster Analysis; • Analogue Methods; • Time-Series Analysis; and • Period Analysis
The predictand can be seasonal rainfall, SSTs, surface temperature, etc. while predictors contain the SSTs, QBO, SOI, etc. There are some assumptions on the association stability between the predictand and the predictors (e.g., predictability remains constant so that the relationships between predictor and predictand variables are valid under future climate conditions). Many potential predictors may be available, and care should be taken during the identification of potential predictors. It s therefore important to choose only physically reasonable or meaningful potential predictors, and test prediction equations on large independent samples of data to ensure the stability of the regression models. Large skill difference between dependent and independent samples may suggest overfitting of the models. On the other hand, small sample sizes may lead to sampling error.
11

There are some dangers in selecting too many predictors in model equations. In addition, collinearity between variables should be tested since:
• Independent variables (the predictors) should be uncorrelated; • If multiple regression equations are to be interpretable, collinearity should not
be accepted; and • The role of each independent variable may be uncertain
Cross validation from independent periods is important to determine model skill. It should be noted that:
• Statistical models tend to underestimate observed variance; • Correlation coefficients provide no explanation for the physical relationship
between two variables; • Relationships between predictor and predictand variables are not always valid
under future climate conditions; and • The shorter the climate period, the higher the required correlation for statistical
significance Variance Adjusting – statistical models tend to underestimate the observed variance, perpetual near-normal forecasts may result. The pros and cons of Variance Adjustment include:
• Forecasts’ variance similar to observed; • High amplitude forecast events are better captured; • Large forecast discrepancies are further magnified; and • Inflated forecasts may have too many extremes.
Simple statistical models should be continuously improved to challenge the skill levels associated with more advanced models such as dynamical GCMs. 2.3.3 Creating empirical models
by Dr. C. Oludhe, Department of Meteorology, University of Nairobi, Kenya With the background information provided by Dr. Landman in section 2.3.2, Dr. Oludhe discussed the process of creating empirical models. Major issues highlighted in the presentation were:
• Basis of linear correlation analysis. The importance of correlation coefficient and statistical significance (e.g. SSTs over the global oceans related to rainfall at a certain given location or region);
• Simple linear regression equation - functional relationship between two variables;
• Scatter plot and line of best fit; • Multiple linear regression (MLR) models - have more than one predictor
variable. Stepwise regression can be used in the choice of the predictors which improve the overall performance of the model. The choice of the predictors will depend on the variance being added to the overall improvement of the regression equation by each predictor;
• Cross-validation technique; • Goodness-of-fit measures including root mean square error (RMSE), coefficient
of determination (R2); • Forecast skill estimation – contingency table(s) for above-, near-, and below
normal forecast(s); and
12
• Accuracy of multi-category forecasts: Hit score - number of times a correct category is forecast; Bias - The fraction of forecast events that failed to materialize; and False alarm ratio (FAR) - Comparison of the average forecast with the
average observation.
2.3.4 Data requirements for empirical models by Dr. W. Landman, SAWS
An outline of empirical methods used for climate predictions was presented by Dr. Landman. He emphasized the fact that there are various data observing platforms/stations, and that there is need to address the sampling problem and missing data issues including outliers. The main predictands are rainfall, temperature, SST, hurricane occurrence, etc while the main predictors are SST, various indices such as Southern Oscillation Index (SOI), North Atlantic Oscillation Index (NAOI), Quasi Biennial Oscillation (QBO), and El Niño indices, among others. Derived data are also very useful for empirical models. These include area average anomaly indices, and empirical orthogonal functions (EOF, covariance and correlation matrices) 2.3.5 Climate data quality control methods
by R. Masika, KMD Mr. Masika gave a run down of the Quality Control procedures used for climate data. He reiterated that it is essential that regular monitoring of meteorological data is carried out to identify poor quality and to meet certain standards. In 1985, the Commission of Basic Systems (CBS) of WMO agreed that there was a need for the major centres to monitor the quality of observations on the global telecommunication system (GTS) and to exchange monthly lists of those stations providing observations that appear to be in error. These errors take many forms ranging from storage media problems to missing data to data inhomogeneities. Various methods that can be used to monitor the quality of climatological and meteorological data are discussed below. (i) Climatological data quality control Data quality control (QC) refers to attempts by data processing personnel to minimize errors and possibly remove mistakes from an observation data set. While the actual QC may use numerical formulae or visual inspections of graphs, at the core of most techniques are some basic statistical relationships. The relationships fall mainly in three categories:
• relationship of data elements to themselves (e.g. outliers to long-term means); • relationships to nearby data (e.g. neighbour checks to ensure spatial
consistency); and • relationships to some other data parameter (e.g. sea level pressure to station
pressure). If the mean and standard deviation for data for a particular station are available, then incoming data can be checked against confidence limits computed from the mean and standard deviation. In the case of upper air data the hydrostatic and thermal wind equations have been used to good effect.
13

Data inhomogeneity can be defined as the non-climatic change in the statistical characteristics of a climatic time series. This can be caused by artificial or natural changes at an observing station e.g. instrument relocation, change of instrument, urban warming, landscape changes (tree growth), changes in averaging methods etc. (ii) Real time manual quality control The purpose of real time quality control is to detect errors in the information content of an observation used in meteorological analysis and forecasting and, if possible, to correct them before they are used in meteorological applications and also before they are archived. In summary, QC involves the following:
(a) Observer - it is necessary that suspect data are reported as quickly as possible to the data source so that the observer can quickly rectify any problems;
(b) Transmitter - observational errors picked up in this early stage can be referred back to the initial observer so that the observer is involved in the correction activities;
(c) Receiver - The national telecommunication centre has a dual responsibility in compiling the observations into bulletins before transmission on the GTS, and providing the observations to the local users for forecasting and model applications purposes. Typically the data receiver performs the following checks: header check, message type check, date and time checks, syntax and grouping checks, position checking, and duplicate checking; and
(d) Forecaster - The forecaster has a unique position to be able to conduct final QC on observation data before they are used in meteorological applications, be they manual forecasts and warnings, or as input to forecasting models.
Given the wide variety of data quality problems, it is not surprising that numerous techniques have been developed to identify them. Unfortunately, no standard quality control methodology is exhaustive. 2.4 El Niño – Southern Oscillation (ENSO) 2.4.1 Dynamics of ENSO
by Dr. W. Landman, SAWS, and Dr. R. Washington, University of Oxford, UK The dynamics of ENSO were presented by Dr. Landman. He noted that the strongest large scale ocean-atmosphere circulation signals are related to the ENSO phenomenon which is associated with large east – west shifts of mass in the tropical atmosphere between the western and eastern Pacific Ocean in conjunction with variability in the tropical Pacific SST. Bjerknes established the link between El Niño and the Southern Oscillation. In the western Pacific, the air is heated and supplied with moisture from the warm water, giving rise to the equatorial circulation associated with the zonal pressure gradient (Walker Circulation). Surface winds are driven westward along the equator by the zonal SST gradient creating the cold upwelling ocean water in the east. Cold eastern equatorial Pacific waters are explained by the horizontal advection of westward currents along the equatorial Pacific upwelling along the equator upward thermocline displacement. The participants were informed that Bjerknes pointed out that during El Niño the ocean has to be responding dynamically rather than just to the changes in the surface heat
14
flux. This concept was first developed into a specific theory by Klaus Wyrtki who showed that an El Niño event is associated, preceded in fact, by a transfer of warm water from west to east through Kelvin waves. The timing and energy of the Kelvin waves determine the strength and development of ENSO events. The global scale teleconnection patterns of ENSO are now well documented. The presence of buoys in the equatorial Pacific and capabilities in modeling have developed further understanding of ENSO. It was noted that equatorial Pacific SSTs are predictable at long lead times, but persistence is best strategy at short lead times. It was also noted that the time evolution of each ENSO event is different. Similar initial conditions can still lead to varied time evolutions. Comparison between the El Niño phase of 1997-98 and the La Niña phase of 1999-2000 and associated teleconnection patterns were demonstrated. 2.4.2 Overview of ENSO indices
by Dr. S. Mason, International Research Institute for Climate Predictions (IRI), USA
Dr. Mason presented an overview of ENSO indices. He informed the participants that there are many indices used to measure the current state of the ENSO phenomenon. The SOI is perhaps the simplest and most widely available index of the atmospheric component of ENSO. It is calculated in different ways, but all the methods are based on some difference between the atmospheric pressure at Tahiti and Darwin. Time-series of SOI are updated routinely each month at various climate centers such as the National Centers for Environmental Prediction (NCEP), the Bureau of Meteorology Research Centre (BMRC, Australia), etc. There is some difference in SOI units due to the different formulae used at each center. It is therefore important to use a consistent source for updating the data. However, the SOI can be noisy because of the influence of atmospheric weather variability. Area-averaged SST indices in the equatorial Pacific are also used as measures of ENSO. The most commonly used are:
• Niño1+2 (Oº - 10ºS, 90ºW - 80Wº); • Niño3 (5ºN - 5ºS, 150ºW - 90Wº); • Niño3.4 (5ºN - 5ºS, 170ºW - 120Wº), probably the best monitor of the eastward
shift of the Pacific warm pool during El Niño events; • Niño4 (5ºN - 5ºS, 160ºE - 150Wº): has low variance and is hard to predict; a
critical zone for monitoring zonal wind-stress; and • Niño5 and Niño6 regions have been defined, but are not widely used. The
Niño5 region indicates the tendency for a negative correlation between sea-surface temperatures in the far western tropical Pacific and the Niño3 region. The Niño6 region is of interest in monitoring off-equatorial temperatures that are important in the delayed-oscillator mechanism of ENSO variability, and it is designed to monitor the MJO.
Other indices of interest include:
• The depth of the thermocline (or the 20°C isotherm), used to monitor Kelvin waves;
• Zonal wind anomalies at 850 and 200 hPa levels over the equatorial Pacific used to monitor the state of the Walker circulation;
15

• Zonally averaged 500 hPa temperatures used to monitor the warming and cooling of the tropical atmosphere in response to El Niño and La Niña events; and
• Outgoing Longwave Radiation (OLR) (5ºN - 5ºS, 160ºE - 150Wº). The Multivariate ENSO Index combines atmospheric and oceanic measures of the state of ENSO. It is a bit difficult to calculate, and not as easy to interpret, and so is not widely used. The Pacific Decadal Oscillation Index defined by SSTs north of 20°N indicates low-frequency variability in ENSO. It can be noisy, and is difficult to forecast, so it is not widely used in forecasting ENSO, either. 2.4.3 Fundamentals of ENSO prediction
by Dr. S. Mason, IRI, USA An introduction to dynamical and statistical prediction models including their bases, strengths, weaknesses and operational skill was given by Dr. Mason. There are forecast skills for equatorial Pacific SSTs at different lead months. A 9-month lead-time is the most honest estimate of the limit of the current operational predictability. There is a large range in the complexity of models used to forecast ENSO. However, model forecasts of ENSO only outperform simple strategies such as persistence at lead-times of about 3 months and more. Furthermore, only a part of the tropical Pacific can be forecast successfully, specifically the Niño 3 and Niño 3.4 regions. The simplest distinction concerning the model type is between statistical and dynamical models. Statistical models do not consider the physical processes responsible for those associations that can result in spurious results, and the models may not work under changed climatic conditions. The advantages of statistical methods are that they are easy to build, apply, interpret, diagnose and run. Dynamical models attempt to model the physical processes responsible for tropical Pacific variability. These models are based on the laws of physics and parameterization. The main advantage of dynamical models is their explicit consideration of physical processes. The dynamical model hierarchy includes:
• Intermediate models: very elementary and relatively simple atmospheric and oceanic models;
• Hybrid models: consider most processes thought to be responsible for oceanic (not just ENSO) variability; and
• Coupled ocean-atmosphere models: simulate the physical climate system. An important problem with dynamical models is that they require high computing resources. Sometimes, they are very difficult to initialize and often produce poor forecasts simply because the observed conditions are not assimilated well. An improvement in the forecast can be achieved by considering a range of model runs with slightly different initial conditions (ensembles). 2.5 Country presentations on the current national meteorological capabilities in data management; climate information and prediction; and needs for the future The country focal points made short presentations on their current national meteorological capabilities in data management, climate information and prediction services and the future needs. These are summarized below.
16

2.5.1 Botswana by Mrs. Tebogo T. Nkago
Mrs Nkago presented the case for Botswana. She noted that in Botswana Meteorological Services there are 14 synoptic stations and 400 rainfall stations distributed over the country. Data from these stations are transmitted to the data processing office, the Central Forecasting Office (CFO) and the climatological division of the Meteorological Services. The main constraints include financial resources for database management such as microfilming, computing facilities and human development. 2.5.2 Burundi
by Mr. Ruben Barakiza The case of Burundi was presented by Mr. Barakiza. It was noted that Burundi has 22 operational meteorological/climatological stations. There are also about 40 volunteer observation stations by secondary schools, agricultural and health centres. Telecommunication and database management are poor due to social instability in the country. Climate information and prediction are mainly used in agriculture, livestock, public health, environment and land conservation, water resources, transport and communications, etc. Nonetheless, there is further need to sensitize users of the importance of integrating climate information and prediction services in their socio-economic activities. Training of meteorologists in data management and climate prediction is highly recommended. 2.5.3 Djibouti
by Mr. Mohammed Yossouf An overview of the status of the Djibouti Meteorological Service (DMS) in data management and climate information and prediction services was given by Mr. Youssouf. The DMS is under the Djibouti Airport authority. It is composed of four units/sections: observatory, data processing, climatology and forecasting with total personnel of 25. The weather/climate forecasts mainly target the general public, aviation and marine. The future needs of the DMS include the establishment of more climatological and rainfall observation stations. This may not be possible without donor financial support. 2.5.4 Ethiopia
by Mr. Diriba Korecha Mr. Korecha highlighted the case of Ethiopia. The data management and dissemination department of the National Meteorological Services Agency (NMSA) of Ethiopia consists of the Technical Services, Data Management, Data User Services and Meteorological Communication Teams. The discontinuity of climatological data and the incompatibility of software for retrieval purposes are the main problems in data management. Access to regional/global climate centers is sometime not possible due to the low resolution/speed of the Meteorological Data Distribution (MDD) and internet products.
17

Climate prediction techniques used at NMSA are: synoptic analysis, statistical (probabilistic) models, analogue analysis, and teleconnection with ENSO. It was noted that ENSO based climate predictions are very useful in indicating the likelihood of rainfall patterns over Ethiopia. However, further research work is needed to improve the climate prediction techniques and the dissemination of climate information to end-users. Emphasis has to be given to downscaling the regional and global climate model outputs. There is also need to decentralize the forecasting center by creating sub-regional offices. 2.5.5 Kenya
by Mr. Samwel Mwangi The case of Kenya was given by Mr. Mwangi. KMD currently operates 36 synoptic-agrometeorological stations and about 800 rainfall stations distributed over the country. Real-time data from GTS and satellite supplement the data required for operational purposes. The purpose of data management is to ensure QC measures for operational and research work. Data from synoptic/rainfall stations are transmitted to the climatological (data processing) section which applies mainframe computer to PC-based procedures. Archive media consist of magnetic tapes, diskettes, CDs, hard drives. Climate information and prediction services are very important in almost all societal activities such as national planning, environment and disaster management, agriculture and food security, energy generation and consumption, etc. It is well known that climate information should be aimed at meeting the specific needs of the end-users. KMD, DMCN, and the United Nations Development Programme (UNDP) have formulated a policy on how to integrate climate information and prediction services in disaster preparedness, response, mitigation and management for sustainable socio-economic development in Kenya. Statistical models are currently being used in the seasonal (monthly) climate predictions. In addition, down-scaling of regional/global climate model outputs have proven useful in the country. 2.5.6 Lesotho
by Ms. Joalane Mphethi The status of data management in Lesotho was presented by Ms. Mphethi. It was noted that Lesotho Meteorological Services obtains climate data from 36 synoptic, 45 rainfall, and 10 agrometeorological stations. There is a limitation in the skilled man-power and data management resources. Currently, climate prediction is based on statistical/empirical models and on the Southern African Regional Climate Outlook Forum (SARCOF) consensus for the rainy season November to March. It is updated in December. Climate information and prediction services are applied in many sectors such as agriculture, environment, insurance, transport, energy, tourism, etc. There are needs that would improve climate data management as well as climate information and prediction services. These include increasing public awareness with regard to meteorological and climate issues, the availability and usefulness of climate information and prediction services, as well as the development of effective communication links with other sectors, and promoting the conservation of biodiversity
18

and the combat against desertification through the application of the science of meteorology. 2.5.7 Malawi
by Mrs. Elina Kululanga Mrs. Kululanga presented the status of data management in Malawi. Malawi climate data have been computerized since 1987 for improved data management. Before that year, the data had been compiled in hard copy manuscripts. However, the good database is not well documented due to the lack of computer resources. Climate information and prediction services are used in the agricultural sector, building and construction industry, disaster and preparedness, general public, etc. Specific end-user climate advisories are also provided. The future needs for data management and climate information and prediction services in Malawi include the establishment of the National Climate Change Section in the National Meteorological Services (NMS) to enhance its capabilities of detecting climate change, good collaboration with other sectors to actively involve meteorologists in climate related activities, interaction with the many users of climate information to help them manage climate risks, make better decisions and reduce losses, and appropriate computer resources for further research work in climate information and predictions. 2.5.8 Mauritius
by Mr. Mohammud S. Oozeerally Mr. Oozeerally provided the data management and climate information and prediction services of Mauritius. Quality control of meteorological data is carried out prior to archiving using CLICOM software. Data are processed in various sections such as climatology, agrometeorology, hydrometeorology, and marine meteorology. Final products from the applied sections are channeled in the publication section and presented as pentad reports, monthly bulletins, and annual reports, and distributed to all stakeholders. The NMS model for the preparation of the seasonal forecast includes the monitoring and forecast of tropical cyclone tracks in the South West Indian Ocean. The forecast model outputs cater for the needs of the government, local authorities and private sectors for planning purposes. The future needs for data management and climate information and prediction services in Mauritius include, among others, the upgrading of existing data management systems (Central Statistics Office) and capacity building in climate prediction and data management. 2.5.9 Mozambique
by Moises V. Benessene The case for Mozambique was presented by Mr. Benessene. Mozambique Meteorological Services operate 18 synoptic stations. Computer software packages such as MS Excel/Word, Surfer, SYSTAT, etc. are currently being used on data management. Four meteorologists have taken part in the capacity training workshop in climate prediction at DMCH. Climate information and prediction services are applied in various sectors including disaster management, water resources, agriculture, health, etc.
19

2.5.10 Namibia
by Ms. Jennifer Moetie Namibia Meteorological Services have six weather offices, eight first order stations and two Automatic Weather Stations. Ms. Moetie indicated that this station network is extremely unsatisfactory in the spatial coverage and the degree of operation needs strengthening. There is no control over volunteer observations and the quality of data is therefore not guaranteed. Without a properly functioning station network, it is not possible to ensure the availability of weather and climate information needed in sensitive areas. The national data service centre ensures that climate data supplied to public is acceptable and of good quality. Climate information products issued include the “What’s Happening Out There?” (WHOT) Bulletin, which is issued on a ten-daily and monthly basis, special bulletins issued during the rainy season on a quarterly basis or as needed, and information on surface winds in Namibia. Current users of climate information include, among others, agriculture (agronomy, animal husbandry, rangeland utilization), environment and natural resources, water resources, disaster management & impact reduction, transport (air, land and sea), building and construction industry. Dissemination of climate information is done through both the print and electronic media such as newspapers, radio and national television, and public presentations to various farmers unions. Namibia Meteorological Services actively participate in routine SARCOFs and end-user community workshops. 2.5.11 Rwanda
by Mr. Anthony Twahirwa Mr. Twahirwa presented the data management status for Rwanda. He noted that the number of meteorological stations has declined from 160 before 1994 to less than 30 today. Data quality control is carried out in the Climate Section using CLICOM software. Seasonal (3-month) forecasts are normally based on statistical model outputs carried out at DMCN as well as on observed data and downscaling information from internet. The climate forecasts are usually disseminated to end-users depending on their specific needs. This has turned out to be very useful since the number of climate users keeps increasing every year. Indeed, climate information is used in many sectors including research, agriculture and food security, building construction, energy, environment, leisure, etc. The future needs of the Rwanda Meteorological Services include the acquisition of appropriate equipment, the upgrading of communication network, and human development. 2.5.12 Seychelles
by Mr. Denis Chang-Seng Seychelles has over 30 rainfall stations distributed over the islands. Mr. Chang-Seng observed that the other climate data are the upper air, ozone, SST, tide/sea level, and biological oceanographic data. The limitations with data management include, among others, the inhomogeneity of some data (change of instruments or their location), the accuracy of some instruments, the lack of instrument maintenance (data gaps), and the lack of resource personnel to transfer data into useful applications and information.
20

Climate information is applied in the management of water resources, tourism, fishery resources, search and rescue mission, planning for potential oil spill, land reclamation, etc. The users of climate prediction include the general public, the tourism ministry/hotels, non-governmental organizations (NGOs), coast guards, media, water department, agriculture, engineers, and the Fishing Authority. New working environment, human capacity building, and the promotion of climate products through affiliation/sponsorship are among the important future needs for Seychelles Meteorological Services. 2.5.13 Somalia
by Mr. Ali Warsame Mr. Warsame gave an account of the status of the Meteorological Services in Somalia. The Department belongs to the Ministry of Agriculture. Before the civil war, the Department had 25 climatological stations. After the re-establishment of the Department, records of rainfall impacts have been documented based on the prediction of the original climate outlook and field surveys. The Meteorological Services are responsible for providing the end-users, mainly agricultural production and Food Security Assessment, with regular information on climate variability. The Meteorological Department is trying to revive its activities in order to supply the required climate information. Unfortunately, there are neither meteorological equipment nor computer resources for database management. Future plans include for instance human development in climate information and prediction services, the establishment of more meteorological stations. 2.5.14 South Africa
by Mr. Shumani M. Mugeri SAWS became a public entity in July 2001 providing both commercial and public good services. Mr. Mugeri pointed out that the service maintains a comprehensive observational network comprised of more than 1750 rainfall stations, 136 Automatic Weather Stations, 139 manned climate stations, 20 Weather Offices, and 30-50 drifting weather buoys. The main responsibility of SAWS is to safely store the weather/climate data, convert it into useful information and make the products available to end users. Data from the station network are sent to the Weather Offices, where quality control checks are carried out, and then relayed to the Central Forecasting Office in Pretoria for further quality control before the final database is archived. Back-ups are done on daily, weekly and monthly bases. Some of SAWS’s commercial services, which are part of the data management, are the provision of specialized climate information services, and contracted weather/climate-related research. Climate information and prediction services are very useful and have a profound impact on socio-economic decisions. SAWS has a dedicated staff of highly specialized and experienced researchers who issue Seasonal Outlooks (using statistical and dynamical models) for 3 to 6 months for South Africa as well as Botswana, Namibia, Lesotho and Swaziland and provide input into the SARCOF project. The users of climate information consist mainly of commercial users, subsistence users, and the general public. SAWS is actively involved in training and research as these are essential to better understand and use the climate information. The liaison between users and producers
21

of climate information is fundamental in determining the future needs since these needs are interdisciplinary. 2.5.15 Sudan
by Mr. Ismail A. Leimoon Mr. Leimoon presented the data management status and its application in Sudan. He noted that the use of climate data for a broad range of resource management activities, planning and research is rapidly gaining importance. The rise in public awareness in weather/climate is due to frequent occurrence of climate-related disasters such as droughts and floods in the country during the last few decades. Sudan Meteorological Service has about 59 meteorological stations, of which 21 are synoptic stations and 7 agrometeorological stations. There are, however, problems of trained manpower in database management and communication activities. Timely availability of climate information could assist planners, resource managers and decision makers to the best use of available resources to mitigate the negative impacts of climate extremes. Since the 1980’s, regular seasonal forecasts for the main rainy season (June-September) have been received from the U.K. Met Office (UKMO). Since 1998, seasonal forecasts (March-May and June-September) have been provided in collaboration with DMCN. The application of meteorological information to various human activities supports numerous national development projects. These include civil and military aviation, the Sea-Port Authority, energy, national television channels, newspapers and radio, the research and education sector, etc. Agrometeorological Services benefit from the five-day precipitation, decadal, and monthly bulletins. The users of climate information need more detailed information on for instance the onset/withdrawal of seasonal rainfall, and dry/wet spells within season. Improvement in the rainfall station network, especially at farm level, and the establishment of more agrometeorological stations at some selected intensive crop production areas are essential. Automatic Weather Stations should be introduced especially in the desert areas (hostile environments) to improve the spatial coverage and also to help in the desertification monitoring. There is also a need to develop practical methods to apply climate information in development activities by making joint projects with applied researchers especially in the field of agriculture, water resources management and energy. 2.5.16 Swaziland
by Mr. Mandla A. Dlamini Mr. Dlamini indicated that, like in other African countries, the number of meteorological stations has drastically reduced in Swaziland. The Meteorological Service uses meteorological data mainly to address user requirements. These include:
(i) Climate data summaries for specific applications; (ii) Climate data summaries input on rainfall assessment bulletins such as: ten-day,
monthly, and seasonal/annual bulletin assessments; and (iii) Downscaling to produce climate forecasts.
Data management problems include the delay/lack of reliable communication systems (internet), delay in climate data dissemination to the head office, decentralisation of data digitisation, inadequate training of volunteer observers, data quality control (erroneous data), no Geographic Information System (GIS) technique (software), etc.
22
Seasonal forecasts are downscaled at national level immediately after the SARCOF consensus forecast, though not user specific. Nonetheless, the climate information is widely used in the country for several purposes, for instance in energy (e.g. hydro-power generation), agriculture and forestry (crop/tree/rangeland monitoring), health (diseases control), government/public (planning and decision), tourism/environment (environmental degradation, weather/climate patterns), construction (roads/building/planning, etc), transport (safety measures), etc. Problems faced in climate information and applications include, among others:
• User community sensitisation and participation is not optimal; • Lack of basic standards within the regions for downscaling forecasts; • Office automation systems limit the production of climate information; • Communication networks between the forecasters and users of climate
information; and • Lack of trained climate experts.
There is a need to form a national CLIPS group which includes end-users to help promote climate information and application services. 2.5.17 Tanzania
by Mr. Emmanuel J. Mpeta Mr. Mpeta gave an overview of the status of the data management and climate information and prediction services in Tanzania. Tanzania Meteorological Agency operates 25 synoptic stations, 600 rainfall stations (previously 2000), 13 agrometeorological stations, and 3 upper air stations (currently not operational). Six meteorologists have been trained in data management. Data quality control (QC) is first carried out at the station, and then at the Head Office before the data are entered into the computer using CLICOM Software. Data are archived using CD-ROMs, tape cartridges and manuscripts. These are stored at two different places for safe custody. About ten meteorologists have been trained in seasonal rainfall prediction at DMCN, DMCH, the African Centre of Meteorological Applications for Development (ACMAD), and the African Desk in the USA. Two scientists have been trained in numerical modeling. However, there are some limitations to access global SSTs and other parameters. The climate information is used by many sectors including agriculture, energy, livestock, tourism, and by the general public. Future needs in climate information and applications:
• More capabilities to access international data bases e.g. NCEP, ECMWF; • More training in climate data management and climate prediction e.g. dynamical
techniques • Powerful computing resources required; • Creating awareness in users of climate information and prediction to understand
the information so that maximum benefit can be derived from it; • Train more meteorologists on how to tailor climatological information and
prediction to different application sectors - agriculture, health, livestock, energy, etc.; and
• Find a way of ensuring that the information reaches the user community at the right time.
23

2.5.18 Uganda
by Mr. Abushen W. Majugu The case of Uganda was presented by Mr. Majugu. He pointed out that rainfall observations are made at the various rainfall stations once every day at 0600 GMT (09.00 a.m. E.A.S.T) by rainfall observers who then record their observations on rainfall cards. At the end of every month the cards are posted to the climate section of the Meteorological Department where experienced meteorological supervisors do physical inspections of all the cards received and also recheck the monthly rainfall totals given on the cards by the observers. The cards so checked are then passed on to the data processing section for computer data entry. The data are entered using the CLICOM software. Data validations in the CLICOM database are carried out by experienced meteorologists, then ‘loaded’ for storage in the main database. The Meteorological Department participates in the capacity building programs, e.g. the seasonal Climate Outlook Forums conducted by DMCN where seasonal forecasts are produced based on statistical/empirical SST models. The department also utilizes empirical/diagnostic methodologies to refine the spatial and temporal rainfall anomaly patterns related to the different phases of the ENSO evolution. There is a wide and growing use of climate information and prediction services. The main users include
• Government institutions involved in planning and executing various socio-economical activities;
• A limited number of private organizations, especially those running projects funded by the international community or NGOs;
• The general public, especially the peasant farmers. It must be pointed out, though, that there are still serious constraints with respect to the timeliness, interpretation and non-specific nature of the predictions;
• Specialized agencies like the aviation industry; and • Research activities, especially those related to applied meteorology and climate
change issues. The need of climate information and applications is growing quite fast as confidence grows in the prediction products resulting from improved forecasts and increased Public Awareness Campaigns and overall improved government recognition of the role of meteorology in the various socio-economic activities of the country. 2.5.19 Zambia
by Dr. Richard Mugara Dr. Mugara presented the data management status for Zambia. He pointed out that there are 36 synoptic stations in Zambia and about 800 rainfall stations most of which are run on a voluntary basis. Meteorological data is collected manually at the observation stations. Upon arrival at Headquarters, QC is carried out manually by experienced observers. The data is then passed on to the computer section for input into the computer. The Data Base Management System is CLICOM. There is no data bank for synoptic data, apart from the charts that are analyzed. Recently, NOAA has been sponsoring a project called “Upper air data rescue”. This involves filming the upper air data ready for digitizing.
24

During the past few years, capabilities in climate prediction have improved through the capacity building programs conducted by DMCH and ACMAD in collaboration with WMO and NOAA-OGP. The major weakness is that the forecasting methodologies are still basically simple, using the same old linear regression techniques. This weakness is being minimized by the availability of dynamical forecasts from other advanced centers. There are various users of climate information and prediction products from all sectors of the nation’s economy. In fact, there is a growing demand for weather/climate information. Future challenges for climate scientists are: (i) Credibility in climate products
• Strengthen prediction capabilities through modeling, and longer lead-time; • Spatial and temporal down-scaling; • Temperature forecasts at seasonal time scales; • Monthly forecast updates; • Repackaging the forecasts to make them more user friendly; and • Strengthening the verification techniques
(ii) Usability of the information provided
• Need of climate forecasts to translate into a usable commodity; • Assess the value (cost-benefits) of these climate information/forecasts; • Need to show the use of the early warning climate prediction services in
preparing for natural disasters; • Constraints related to the availability of options for climate forecasts; • General climate forecasts for specific users with different lead-times; and • Classification of end-users according to their understanding of the responses
and constraints. In conclusion, there is need for climate experts to improve the quality and packaging of the information through interaction with the user community. 2.5.20 Zimbabwe
by Mr. Desmond Manatsa The main activities of the Meteorological Services’ Data Management System include data collection, data management, product presentation, and provision of a user interface (dissemination). There are 66 ground stations (49 synoptic stations and 17 part-time stations) and over 1000 volunteer observations for rainfall data. Real-time data is mainly dependent upon observer and instrument accuracy. The reliability of observers/stations depends on number of errors the observers make on average. Data QC procedures are carried out both manually and electronically. The purpose of database management is to ensure a comprehensive and accessible long-term documentation of climate parameters, based on documentation on hardcopies, microfilms, and electronic formats (magnetic tapes, CD-ROMS, state-of-the-art hardware). Zimbabwe Meteorological Services have actively participated in SARCOFs for seasonal climate forecasts. Consensus forecasts are based on the weighted average of all contributing models and expert interpretations. The methods used are mainly based on statistical/empirical models, although some dynamical outputs from advanced
25

centers are also considered. Usually, the end-users are given probabilistic forecasts. Verification of the previous season is also issued. The use of climate information and predictions may involve a workshop organized for potential users (media, industry, agriculture, general public, etc.). The participants are educated on the interpretation of the forecasts as well as on potential applications and impacts. Needs for the future:
• Enhance capacity building in climate information and prediction services; • Greater collaborations with the local, regional and international institutions; • Spatial and temporal resolution of climate forecasts need to be addressed
further; • Climate forecasts should be user specific, with adequate lead-time; • Prediction of the onset and cessation of the rainfall season; and • To get rid of the notion that associates El Niño to droughts in the country.
2.6 Dynamical modeling 2.6.1 Basics of numerical atmospheric modeling
by Dr. W. Landman, SAWS Dr Landman gave a simple presentation to introduce the participants to AGCMs. He pointed out that a set of primitive equations consisting of dynamical processes (conservation laws) and parameterization schemes (i.e. for convection, clouds, radiation, etc.) is applied in a GCM. The solution of primitive equations is not possible analytically. The equations must therefore be discretized, i.e. the atmosphere is divided into a horizontal grid with a certain number of vertical levels. Model grids are used for parameterization and grid-point models, spectral models and finite element models are used for spherical harmonics and Galerkin Functions. The most commonly used vertical coordinate is the sigma coordinate. The time derivative of the equations is also discretized (centered and decentered methods). The initial state of the atmosphere at time t is used by the model to calculate the state of the atmosphere in the future. A time-step of 20–30 minutes is usually used for seasonal forecasts. A succession of short forecasts is performed until the period of the forecast is reached. For post-processing grid transformations, vertical and horizontal interpolations, and systematic error correction and other methods can be used. For seasonal forecasts, the selected domain should be large enough to capture large scale features. Model performance and resolution have improved significantly over the past two decades. Limited Area Models (LAMs) can be used for a specific domain of interest with smaller spatial scales. Forecasts may be improved through:
• Quality and quantity of observations; • Assimilation schemes; • Parameterization schemes; • Simulation of compiling processes; • Computing power; and • Verification methods.
26

2.6.2 Basics of numerical oceanic and coupled modeling by Dr. S. Mason, IRI, USA
Dr. Mason gave a run down of the basics of numerical oceanic and coupled modeling. He stressed that the ocean is a vital part of the climate system and so even atmospheric general circulation models have to have some kind of in built ocean model. This component is modeled with varying degrees of complexity such that a dynamical ocean acts as a source and sink of atmospheric moisture. SSTs are varied in response to sensible and latent heat transfer and vertical and horizontal transport of heat within the ocean are calculated. There are some important differences between dynamical oceanic models and dynamical atmospheric models:
(i) The oceans are confined to only certain parts of the globe. As such, spectral representation of grids is not possible;
(ii) The grid resolution needs to be much finer than that of atmospheric models because of the small size of oceanic eddies and the narrow ocean currents; and
(iii) Observational data of the oceans is very limited. It is much harder to initialize ocean models – typically to they are spun-up by being forced with observed wind-stress over the previous few months before a forecast can be made.
The initialization of ocean models is a major weakness. The initial conditions at the start of the forecast are often poor, and poor use is made of some of the existing observational data. Most improvement in ocean forecasts in the short-term is likely to be achieved by improving data assimilation schemes. Fully-coupled models actually consist of separate oceanic and atmospheric GCMs that are run separately and communication between the two models is achieved by a coupling. The computational expense of running fully-coupled models is prohibitively high. In seasonal climate forecasts, the ocean models are usually run at a resolution that is unable to resolve oceanic eddies, and poorly represents ocean currents. As a result, there are usually some serious systematic biases in these models. Another problem is that these models typically have large drifts (or trends) as they settle towards their own climatological conditions after initialization. Consequently, fully-coupled models are not yet widely used in seasonal climate forecasting. 2.6.3 Drought Monitoring Centre – Nairobi (DMCN) climate modeling activities
by Prof. L. Ogallo and Mr. J. N. Mutemi, DMCN An introduction to where DMCN is heading to in terms of climate modeling and the facilities in place for this activity was given by Prof. Ogallo and Mr. Mutemi. Dynamical climate modeling work at DMCN started in June 2001. The regional spectral model (RSM) is embedded into a global general circulation model is run on a calibrational/sensitivity basis. The model domain is large and covers most of the GHA countries. This domain can be expanded, though. Some model outputs for recent decades are now available at DMCN. The model verification requires a lot of observational data, and therefore it is important that member countries explore ways of availing these data to DMCN from more stations than are currently used by DMCN in its monthly and seasonal climate outlooks. DMCN is a centre of excellence for training in climate information and prediction services, including specific end-users from the GHA. It should be noted that DMCN collaborates with a number of local, regional and international scientists and institutions
27

in the climate prediction process. It was reported that there is a good progress in down-scaling products from the global models. 2.6.4 Ensemble modeling
by Dr. S. Mason, IRI, USA The methods of producing forecast ensembles and probabilistic predictions were highlighted by Dr. Mason. Probabilistic forecasts can be produced using statistical and dynamical methods (and by a combination of both). The most common statistical methods include: contingency tables, discriminant analysis as well as probabilities derived from regression models. Probabilistic forecasts from dynamical models are derived from an ensemble of forecasts. Instabilities and feed-backs at work in the atmosphere that are called “chaotic” processes impose limits on deterministic predictability. Inherent uncertainty in medium to long-range forecasts exist because of uncertainty in initial conditions and imperfect models. Numerical models are imperfect representations of the atmosphere. There will always be uncertainties in the formulation of dynamics and physical parameterisations. Recognition of the above has lead to the development of ensemble prediction systems. An ensemble is a collection of predictions which collectively “explore” the possible future outcomes, given the uncertainties inherent in the forecast process. A multiple-model ensemble is simply a combination of ensembles from individual ensemble systems. From the same set of initial states, different models will typically produce a different set of forecast outcomes.
The presentation and interpretation of ensemble forecasts include ensemble mean, ensemble spread, individual ensembles (trajectory plumes and spaghetti diagrams), ensemble clusters, and probabilities of events. There are, however, some problems associated with ensemble modeling, such as the inclusion of models with minimal skill, bimodal forecasts, smoothing, spatial combination, etc. Benefits of multiple-model ensembles include:
• The ensemble spread is increased relative to the individual model ensembles. Thus the observed outcome more frequently falls within the range of forecast solutions provided by the ensemble; and
• The multiple-model provides a filter for the more skilful individual model (the best model will vary with season/variable/region). Thus the strengths of the individual models are exploited, improving capabilities for global seasonal prediction.
2.7 Climate verification methods 2.7.1 Basics of verification
by Dr. S. Mason, IRI, USA Dr. Mason provided an overview of forecast quality and its measurement. The WMO Standardized Verification System (SVS) was presented. The standardization of the verification is important to ensure:
• The inter-comparison of results from different models; • That the verification addresses specific issues; and • Those calculations are made in a consistent manner.
It is equally important to standardize the verification to assist in:
28
• The further development of the models; and • Determining the potential uses of a model, etc.
Most of the verification methods commonly used provide minimal, if any, information in terms of applications. Deciding whether a forecast is correct depends on deterministic or probabilistic methods used. The SVS methods include:
(i) RMSE skill score which is the commonly used method. It measures the improvement in comparison to the standard, alternate forecast system. The standards include chance, climatology, and persistence. It should be noted that RMSE skill score does not handle probability forecasts, only deterministic forecasts;
(ii) Relative (or Receiver) Operating Characteristic (ROC) converts probabilistic forecasts to deterministic forecasts by issuing a warning if the probability exceeds a threshold minimum. The ROC is used to estimate whether forecasts are potentially useful. Plots of the hit rates against the false alarm rate for varying thresholds are generated.
By raising the threshold, fewer warnings are likely to be issued thus reducing the potential of issuing a false alarm, but increasing the potential of a miss. By lowering the threshold, more warnings are likely to be issued thus reducing the potential of a miss, but increasing the potential of a false alarm;
(iii) The Hit Rate (HR) defines the proportion of events for which a warning was provided correctly. It estimates the probability that an event will be fore-warned; and
(iv) The False Alarm Rate (FAR) defines the proportion of non-events for which a warning was provided incorrectly. It estimates the probability that a warning will be provided incorrectly for a non-event.
The participants were also introduced to verification hands-on exercises for both the deterministic and probabilistic predictions. 2.7.2 Verification methods used by DMCN and DMCH
by Z. Atheru, DMCN, and H. Saleh, DMCH Skill scores utilized include Hit Rate (HR), Heidke Hit Skill Score (HHSS), Linear Error in Probability Space (LEPS), False Alarm Rate (FAR), etc. The verification methods used at DMCN and DMCH are mainly based on the evaluation of the 2001 consensus climate outlook compared with the observation. The DMCN forecast for the September – December (SOND) 2001 season was interpolated into the national climatological zones to enable comparison with the observed rainfall. Rainfall totals in each climatological zone for the period 1961 to 1990 were ranked in ascending order. The respective ranks of the observed SOND 2001 rainfall were identified among the ranked rainfall totals for each climatological zone. If the rank is ≤ 10, then the observed rainfall in the particular zone was in the below normal category. A rank >10 and ≤ 20 indicated that the observed rainfall was in the near normal rainfall category. A rank > 20 indicated that the observed rainfall was in the above normal category. The derived categories of the observed SOND 2001 rainfall were then plotted and gridded on the GHA map by the Kriging method. DMCH uses 2° x 2° grid and defines hits, half-hits and misses for the Southern African region to get the spatial distribution of the evaluation with some limitations related to the grid. Both DMCN and DMCH demonstrated that the forecasts have some skill.
29

2.7.3 Verification of rainfall/temperature predictions – how good are operational forecasts? by Dr. R. Washington, University of Oxford, UK
Dr. Washington outlined the routes to seasonal forecasting. These included:
• Empirical/statistical models which are computationally cheap but not physically based; and
• Dynamic Models (GCMs, climate models, etc.) which are computationally very expensive and are physically based. These involve: AGCMs: The model is forced with observed (usually persisted) SSTs, e.g. 3
month forecast for July 2002 made with observed April SSTs which do not change over the 3 months; and
Coupled AOGCMs: Model is provided with observed SSTs at the start of the experiment and then calculates SSTs.
An honest look at the operational performance of seasonal climate forecasts depends on how well the model climatology matches observed rainfall. It should be noted that not all rainfall variability is from SSTs. In summary, climate variability in modeling has among others the following characteristics:
• Skill scores vary with time of year and location; • Temperature is generally better than precipitation; • Problems in simulating variability relate to problems with climatology; • Problems with climatology relate to model physics; and • Empirical models still have an important role.
2.7.4 Forecast value
by Dr. S. Mason, IRI, USA Dr. Mason presented the forecast value. He noted that the method of forecast verification depends on the type of information provided in the forecast. Use of forecast may mitigate losses or introduce further costs. The following questions involve measuring forecast value, as opposed to forecast quality. The questions are:
(a) How do we decide whether a forecast was “correct”? (b) How do we decide whether a forecast was “accurate”? (c) How do we decide whether a forecast was “reliable”? and (d) How do we decide whether a forecast was “skilful”?
How can we answer any of the above questions when forecasts are expressed probabilistically? As long as what happened was not given a 0% chance of occurring, a probabilistic forecast cannot be wrong. However, the forecaster’s level of confidence can be “correct” (relibale) or “incorrect”. If forecasts are consistent and reliable, the probability that the event will occur is the same as the forecast probability. Even for deterministic forecasts, there is no single measure that gives a comprehensive summary of forecast quality: accuracy, skill, uncertainty. Cost-benefit analysis of using a deterministic forecast showed that there are different scenarios resulting from a forecast. The most important aspects of forecast quality depending on the most likely outcome must be the one that occurs most frequently; confidence in the forecast must be
30
appropriate (reliability); and forecast probabilities should be sharp (without compromising reliability). 2.8 Communicating climate forecasts 2.8.1 Simple concepts of probability including conditional probabilities and
generation of terciles by Prof. J. Owino and Mr. G. Muhua, Department of Mathematics, University of Nairobi, Kenya
Prof. Owino and Mr. Muhua highlighted simple concepts of probability including conditional probabilities and the generation of terciles, i.e. the partitioning of climate data and forecast into the three categories of BELOW, NEAR & ABOVE NORMAL. Probability is the chance of occurrence of an event. Conditional probability is a chance given that an event has occurred (e.g. probability that it will rain today given that it is (not) a rainy season, probability of suffering from Malaria during a rainy season, probability of a high maize yield during a rainy season). The partitioning of data is very important in climate forecasting (e.g. the number of days of rainfall in a year). Median (two equal categories), terciles (three equal categories), deciles (ten equal categories), percentiles (hundred equal categories), etc. are usually used in the partitioning of climate data. Terciles are common in probabilistic forecasts that involve finding probabilities of classification into Above, Near & below normal categories. Group exercises for obtaining terciles for a given rainfall station in Kenya and using a ball game to simulate forecasts were demonstrated. 2.8.2 Chaos
by Dr. R. Washington, University of Oxford, UK Dr. Washington presented the concept of chaos in forecasting. The weather/climate model outputs will be different from observed conditions after only a few days due to the model sensitivity to initial conditions. With the help of the Lorenz attractor the sensitivity of the atmosphere to infinitesimal changes in the initial conditions was illustrated. This sensitivity occurs since weather/climate tends to modes or patterns of variability. The question therefore is how to quantify the sensitivity to initial conditions? How chaotic is the atmospheric variability?
(i) Like many systems the atmosphere is sensitive to initial conditions; (ii) The same forcing due to SST can produce a different outcome if the starting
conditions are different; and (iii) But the tropics is the least chaotic part of the atmosphere.
Methods can be designed to overcome the problem partially, e.g. by ensemble forecasting. 2.8.3 Cognitive illusions
by Dr. R. Washington, University of Oxford, UK An introduction to some common pitfalls in the presentation and communication of the use of climate forecasts was given by Dr. Washington. Some impediments to the use of seasonal climate predictions include scientific problems (e. g. limited skill),
31

inappropriate content (e.g. categorical forecasts), external constraints (e.g. inability of users to change decisions), complexity of target system (e.g. impacts of a predicted climate anomaly may be unpredictable), communication problems (e.g. confusion due to multiple forecasts), user resistance or misuse (e.g. user conservatism), and cognitive illusions (e.g. probability illusions). There are some pitfalls to communicating each element so that the user of a forecast understands what its producer means. Some cognitive illusions are framing effect, availability, anchoring, asymmetry between losses and gains, ignoring base rates, overconfidence, decision regret, inconsistent intuition, belief persistence, group conformity, confirmation and hindsight bias. Reducing the effects of cognitive biases on the use of climate predictions involves
(i) De-biasing the groups who prepare forecasts to reduce over-confidence; (ii) Avoiding “anchoring” media reports and thus users (e.g., to the 1997/98 El
Niño); (iii) Determining how users interpret probabilities (worded and numerical) - then use
these interpretations in forecast preparation; (iv) Writing forecasts to avoid possible “framing” biases (e.g., include multiple
versions of forecasts, framed in different ways); (v) Avoiding to combine forecasts subjectively or intuitively; and (vi) Avoiding base rate underestimate bias (e.g., include specific base rate
information in forecast). 2.9 Dissemination and application of climate information 2.9.1 The importance of climate data and monitoring
by Dr. S. Marigi, DMCN Climate variability has impacts on all countries and on all strata of socio-economic activity. Climate monitoring, prediction and early warning upon which appropriate actions can be taken will undoubtedly assist in mitigating some of the negative impacts of climate variability while taking advantage of the positive impacts. Availability of long-term, high quality data with good spatial coverage is therefore a prerequisite to such an endeavour.
Sources of data fall into four observation categories, i.e. atmospheric, oceanographic, terrestrial, and spaced-based observations. The goal of climate information and monitoring is to provide information that enables and persuades people/organizations to take action to minimize the negative impacts of climate variability and to take advantage of good years/seasons. In this respect, climate forecasting services should be supported by monitoring activities. Monitoring is required for forecast verification and provides necessary data for updating forecasts as well as the season’s (forecast period’s) progress. Climate anomalies affect vulnerability and the monitoring of these anomalies is a vital component for interpreting the possible impacts of forecast climate. The five-step simplification of the climate information system includes
(i) Data - Global Surface Network (GSN), Global Upper Air Network (GUAN), Global Atmospheric Watch (GAW), etc.;
(ii) Analysis and Predictions - Anomalies, ENSO, QBO, SST gradients, etc.; (iii) User oriented products - Rainfall probabilities, drought index, etc.; (iv) User interface - Outreach, media, etc.; and
32

(v) User applications and benefits - Increased yields, better decisions, improved profits, less losses, etc.
Challenges in Africa include data gaps, declining station network, obsolete databases (tapes, microfilms), and delivery and application problems. There is a critical need to develop and/or improve the African climate information system to better understand the African climate variability and change. Regional Climate Outlook Forums (RCOFs), national user workshops and pilot applications projects have been initiated with the objective of addressing some of the problems associated with information delivery and applications. Without doubt, these activities have played a significant role in capacity building in many parts of the continent and have developed good collaboration between climate scientists and the end-users of seasonal forecasts. This has helped to demonstrate the economic value of applying climate information and prediction products in decision making for socio-economic development. 2.9.2 The role of the media in the dissemination of climate information
by Ms. J. Akolo, East African Standard, Kenya The media is a major communication channel and a shaper of public opinion through which the public can receive weather/climate information, forecasts and early warnings as projected by the climate scientist. However, another area that has not been exploited for weather and climate information dissemination is the performing arts, drama and theatre. It would be important to at least use this medium of exchange of information as it involves the young people who must be encouraged to develop interest in the weather and climate domain. Lately, the challenges have been how to continue selling information to a population that is becoming more and more enlightened. Radio has a very wide reach, serving far flung areas where newspapers hardly reach, although it has the problem of information not being permanent. Once a listener misses out on a news item, that marks the end of it. This limits the climate information reach to large parts of the population in the country. Listening to climate information and forecasts from the radio would be boring if there was no music to go with it. Reading a newspaper would be boring if the information did not flow or were not presentable to the eye. Watching television would be boring if the information coming through were not entertaining. The role of the media in dissemination of weather information, is to create interest in the issue being raised. For instance today, many people, even if they do not know the exact meaning of weather phenomena like El Niño or La Niña, can in their ignorance argue about them in bars and on the streets. The media also creates awareness of an impending weather phenomenon, for instance right now the media is talking about the current weak El Niño phenomenon which may continue up to early 2003. The challenge of getting expert information into news stories has been real, yet on the other hand the climate professionals want their piece of information broadcast or written without any alteration. The traditional role of the media has been to inform, entertain and educate. This role therefore calls for the proper presentation of facts while making the information look attractive and presentable to the audience to make the paper sell.
33

2.9.3 Application of climate information in disaster management by Col (Rtd) B. Wendo, National Disaster Operation Centre, Office of the President, Kenya
A disaster may be defined as a serious disruption of the functioning of a society, causing widespread human, material or environmental damage and losses which exceed the ability of the affected society to cope using only its own resources. Broad categories of disasters include: (i) natural - rapid onset (floods, epidemics, earthquakes, volcanic eruptions; and (ii) natural - slow onset (desertification, drought, famine). Disasters can be human-made (crowd incidents, terrorism, war/conflict, deforestation) or complex (war/ conflicts, famine, refugees, epidemics, environmental/ecological). Some casual factors of disaster include: poverty, population growth, rapid urbanization, transition in cultural practices, environmental degradation, lack of awareness and information, war/conflict, and extreme climatic impacts. About 75% of all natural disasters are caused by or influenced by climatic conditions, extreme climatic conditions on their own are some of the worst triggers of disasters. The remaining 25% can be complicated by climate. Disaster management aims at reducing or averting potential loss of lives or property and/or damage of environment; assure prompt and appropriate assistance to those in need; and achieve rapid and durable recovery from disasters/impacts.
Due to the foregoing, there is need to understand and appreciate climate information and application for planning, preparedness, mitigation, response, recovery and development in the disaster management sector. 2.9.4 Application of climate information in public health
by Mr. J. Mwitari, Ministry of Health, Kenya Human beings respond physiologically to a number of atmospheric conditions, including temperature, humidity, wind, solar radiation and air pollution. In health, climate information is exclusively used in the prevention, control and containment of diseases whose majority are infectious:
(i) Vector borne diseases – experience and recent studies have shown that heavy rains (near or above normal magnitudes) are strongly linked to epidemics of vector borne diseases such as rift valley fever;
(ii) Diarrheal and eye infections – diseases such as cholera, bacillary dysentery and amoebic dysentery are all associated with contaminated waters;
(iii) Acute respiratory infections – local effects from pollution, such as smog and low level ozone concentrations, as well as the presence of certain pollens in the air, have been linked to acute attacks of asthma and other respiratory diseases. The number of people potentially affected varies depending on the prevailing winds and humidity that can encourage either the dispersal or concentration of the pollutants and pollens;
(iv) Meningitis – menigococal meningitis is a disease which is associated with low humidity and dry weather. Most of the outbreaks in our African meningitis belt are experienced during the dry seasons; and
(v) Nutritional disorders – weather related natural disasters such as tropical cyclones, droughts, severe floods, and abnormal monsoons have health implications. For instance, food supplies are destroyed resulting in mal-nutritional disorders particularly in children.
34
In conclusion, sufficient climate information, particularly on variability in parameters such as rainfall, humidity, temperatures, wind and air pollution, is a prerequisite to the Ministry of Health in planning for disease prevention and controlling response activities. 2.9.5 Application of climate information in livestock management
by Dr. S. Kisia, Faculty of Veterinary Medicine, University of Nairobi, Kenya Livestock (cattle, sheep, goats, camels and donkeys) forms about 15% of the agricultural GDP in Sub-Saharan Africa. Climate effects on livestock management like the onset, duration and intensity of rainfall, drought, temperature, etc. are more severe if changes are sudden instead of gradual. Solutions to the problems the livestock industry faces when climate information – especially the onset, intensity and duration of rainfall or drought – is known:
• Provision of alternative sources of water other than rainfall; • Fodder/forage conservation e.g. hay, silage; • Infrastructures e.g., slaughter houses for local and export purposes, roads, etc.; • Provision of extension services; • Observing the proper carrying capacity; • Application of disease control techniques; • Drought monitoring system whose information should reach the end users; and • Security in pastoral communities.
2.9.6 Application of climate information in water resources
by Prof. F. Mutua, Department of Meteorology, University of Nairobi, Kenya The terrestrial surface water resources are strongly influenced by climate factors such as rainfall and evaporation. To a smaller extent, the rechargeable groundwater resources are also influenced (with a considerable time lag) by rainfall and evaporation. Consequently, climate information is vital in the planning and management of water resources in any country. Water management can be defined as the optimal use of water resources through distribution and control. Therefore, it is important to factor climate information in the management policies for water resources related activities such as floods, droughts, landslides, soil erosion, water pollution, dam breaks and water-borne diseases. The availability of a good communication network is essential to the water management. 2.9.7 Application of climate information in agriculture and food security
by Mr. J. Oduor, Ministry of Agriculture and Rural Development, Kenya Rain-fed agricultural production is the main socio-economical activity in many African countries. Years of poor rainfall amounts become bad agricultural years. There is, therefore, immense need for the application of climate/weather information in the agricultural sector in order to attain food security. The application of climate and weather information is important for the preparation of balance sheets, the timing of food imports, the replenish of the Strategic Grain Reserve, famine relief operations, drought recovery programmes, intervention by government in the market, the choice of appropriate farm operations, the choice of appropriate technology, food storage, advise to seed stockists, livestock destoking programmes, livestock restocking programmes, hay conservation, the maintenance of livestock watering sources, and the timing of livestock migration.
35

The main problems of climate information and applications are:
(i) Dissemination; (ii) Interpretation of scientific terminologies; and (iii) Inability of some farming communities to take advantage of good rainfall.
For the effective use of climate information in agriculture and food security it is recommended that
• Strong linkages be established between users and climate scientists; • Dissemination of weather and climate information be strengthened; • Reasonable lead times be provided when releasing forecast; and • User specific products be provided.
2.9.8 Application of climate information in energy, industry, transport and
communications by Dr. C. Oludhe, Department of Meteorology, University of Nairobi, Kenya
Extreme weather and climate events have been found to significantly affect the activities in the energy, industry, transport and communication sectors. Dr. Oludhe hinted that economic losses from extreme climate events could retard development among many other socio-economic miseries. The severe impacts associated with extreme climate events in the various sub-sectors can be reduced through good understanding of the climate patterns/events, enhanced monitoring, early warning, effective and timely dissemination of early warning products and awareness creation on the usefulness of climate information and prediction products. There is need to utilize the climate information and prediction products supplied by the national meteorological services and other climate centres in order to minimise the impacts of extreme climate events. Closer collaboration between the producers of climate information and the end-users of this information is very important. 2.9.9 Application of climate information in human settlement and public safety
by Prof. J. Nganga, Department of Meteorology, University of Nairobi, Kenya Extreme weather and climate related hazards have their greatest impacts in densely populated areas. Application of climate information is aimed at reducing the impacts of climate related hazards in human settlements and enhancing public safety. Successful application of climate information in reducing impacts of hazards depends on the following:
• Having institutions that are mandated to manage climate related hazards/disasters;
• Having the technical capacity within the institutions to translate climate information into action plans;
• Close collaboration between National Meteorological Services and the sectoral user institutions leading to information exchange including feedback;
• Good understanding of the characteristics of climate related hazards through documentation and analysis of past weather or climate events;
• Mapping of areas that are vulnerable to climate related hazards, assessment of vulnerability level e.g. land use patterns, vegetation, topography, urban area
36

characteristics, location of buildings, their design and construction, proximity to water bodies, poverty level, infrastructure, proximity of pastoral and agricultural community settlements and cultural traditions etc.; and
• Acceptable degree of confidence in the seasonal forecasts, monitoring and early warning e.g. enhanced national expertise in climate/seasonal forecasts, including processing power, interpretation and application etc.
In this respect close collaboration between National Meteorological Services and the relevant national and local institutions is of utmost necessity. Involvement of communities in the management of hazards in their areas or settlements ensures success in the reduction of the impacts. It is also important to develop climate information dissemination methodologies that are sector customised.
2.9.10 Application of climate information and prediction services in production
and management of seeds in Kenya by Mr. J. M. Mwaura and Mr. P. Munene, Faida Seeds Company, Nakuru, Kenya
Climate information is one of the major factors put into consideration in a seed production program. Climate is a natural parameter, in fact it is the most important of all. It determines the quantity and quality of seed produced if all other parameters are constant. There are four major climate parameters considered in the seed production program: rainfall, temperature, sunlight, and wind/air. Critical stages in the plant growth when these factors are highly influential, e.g. in the maize seed production, are:
• Germination; • Vegetative stages (2nd to 14th leave stages); • silking and tussling (all parameters); • Grain filling (water most critical); • Dry down period (temperature most critical); and • Harvesting season (temperature most critical).
It is critical to plan seed production operations in relation to when the rainy season is predicted to start, how much rainfall is expected, and how long the rainy season is predicted to last. This helps in planning for the commencement of planting season, expected crop growth stage at certain part of the year, expected time for cultural field operations, e.g. weeding, top-dressing, etc., and pest and disease control. Challenges in seed production in relation to climatic change/variability include uncertainty in climatic weather conditions (extreme conditions), and abrupt changes in climatic weather conditions which favor crop diseases and pests and hence lead to yield reduction. Adaptive measures to uncertain climatic weather conditions are timeliness operations (e.g. field preparation), zonal cropping, relay cropping, intermittent cropping, and crop growing cultural practices observation (e.g. deep digging, mulching, weeding, etc.). Observations and recommendations: A seed production program takes more than 3 months. The climate information usually covers a period of three months. This information falls short of the production program hence there is uncertainty of the occurrence of rainfall after such periods. It would be more useful if the climatic weather information covered the duration required in seed production. The decadal forecast is very important but is currently very general as its
37

regional coverage is too wide. These reports should be more tailor-made as to cover sub-regions (e.g. district levels). There is need for more intensified efforts towards collaboration in the gathering of climate information to supplement the efforts undertaken by the National Meteorological Services and other organizations involved in the generation of such information. 2.9.11 Project formulation and management
by Prof. J. Nganga, Department of Meteorology, University of Nairobi, Kenya The fundamental goals of project formulation and management were highlighted by Prof. Nganga as:
• To ensure that the project is correctly designed to meet its objectives; • To ensure that the project is completed on schedule, within resources and
budget; and • To provide a mechanism for monitoring the project.
It is essential to ensure that the project is correctly designed to meet its objectives; and to ensure that it is completed on schedule, within resources and budget. It is the sponsor’s role to ensure that the project is an appropriate activity that satisfies program requirements and justifies funding. Essential contents of a project document include:
• Project scope (Problem and Background); • Justification; • Goals; • Objectives and planning activities; • Results and outputs; • Situation at end of project; • Methods; • Resources (Budget); and • Project schedule (Workplan).
Hands-on exercises to write a project document for one of the projects given below in any country were done in groups:
• Development of an empirical forecast model; • Creation of a climate atlas; and • Improvement of crop yields (select an appropriate crop) through application of
seasonal forecasts. 2.10 Recommendations and the way forward 2.10.1 Decision making with climate information and predictions The Famine Early Warning Systems Network (FEWS-NET) led the presentation on the decision making with climate information and predictions. The vision of FEWS-NET is to strengthen the abilities of African countries and regional organizations to manage threats of food insecurity through the provision of timely and analytical early warning and vulnerability information. FEWS-NET makes use of DMC forecasts to develop contingency plans for drought and implications analysis. This involves translating forecast probabilities into potential rainfall amounts. Dissemination of this climate information is via reports.
38

2.10.2 Recommendations Participants made suggestions and recommendations as to what they wanted CLIPS to do for them:
a) The training process in the region needs to be sustained. It was recommended that some Focal Points should go for further training in Oklahoma, USA, should funds permit;
b) Focal Points so trained may become trainers of CLIPS in their respective countries;
c) It was stressed that African projects need to involve African participants; d) Outreach programs are to be facilitated so as to foster close contact with users; e) Participants are to devise own ways to do the outreach programs and then
integrate them with DMC and WMO; f) There is need to market the programs to potential clients so that they know what
CLIPS can offer; g) Need for regular reports on CLIPS activities so as to access how active Focal
Points are in their respective country. All information may be posted on the web site;
h) CLIPS Focal Points should become source of climate information at national level;
i) Need for computers for CLIPS participants to be looked into; j) Need for alternative methods (e.g. dynamical modeling) other than the statistical
methods to do climate forecasting in the region; k) Pilot Application Projects to be submitted to DMC for funding, if acceptable; l) The project has to go through the national Permanent Representative with
WMO (PR) so as to avoid misappropriation of funds; m) Simple language should be used that is clearly understood by the end-users.
Participants were encouraged to go home, simplify the meteorological jargon as much as possible and share what has been learnt with others; and
n) Factoring of climate information into economic activities in an effort to reduce poverty for sustainable development.
Participants were also asked to evaluate the training workshop (see Annex IV). The responses were very good, and many suggested more practical exercises.
39

Annex I: WORKSHOP PROGRAMME
Monday 29 July
0830 – 0930 Karume Nyagah Faith Githui Registration
0930 – 1000 WMO/KMD / DMCN/DMCH Workshop Opening
1000 – 1030 Coffee break CHAIRMAN: R. MUGARA RAPPORTEUR: H. SALEH
TOPIC Time
Lead Introduction and Background
1030 – 1130 Buruhani Nyenzi Background to Workshop 1130 – 1200 1200 – 1230
Zakary Atheru Amos Makarau
Climate variability in the Eastern African region; its causes and relationship to ENSO Climate variability in the Southern African region. Delegates will be expected to synthesize the information presented in this lecture in a format suitable for presentation to the user-community, and should consider different levels of presentation that would be suitable for users with different levels of sophistication.
1230 – 1300 Discussion 1300 – 1400 Lunch Break
1400 – 1530 Willem Landman Fundamentals of global seasonal to inter-annual prediction A background to the science of seasonal climate forecasting. PowerPoint (PP) version available
1530 – 1600 Coffee Break
1600 – 1700 Peter Ambenje Data requirements for seasonal to inter-annual climate prediction
1700 – 1730 Discussion Tuesday, 30 July CHAIRMAN: B. NYENZI RAPPORTEUR: C. MUTAI/A. MAJUGU 0830 – 0900 Buruhani Nyenzi Synopsis of Monday’s presentations
TOPIC Time
Lead Empirical models
0900 – 1030 Willem Landman
Introduction to empirical models. An overview of some of the different statistical methods available, their strengths and weaknesses, assumptions etc. PP version available
1030 – 1100 Coffee break
1100 – 1230 Christopher Oludhe
Creating empirical models A step-by-step introduction to the construction of a simple correlation and regression-based forecast model, including cross-validation, and contingency table analysis. PP version available
1230 – 1300 Discussion 1300 – 1400 Lunch break
1400 – 1430
Willem Landman
Data requirements for empirical models. A discussion of data types, quality issues, problems of artificial skill etc. PP version available
1430 – 1500 Richard Masika Climate Data Quality Control procedures used in the region 1500 – 1530 Discussion 1530 - 1600 Coffee break
40
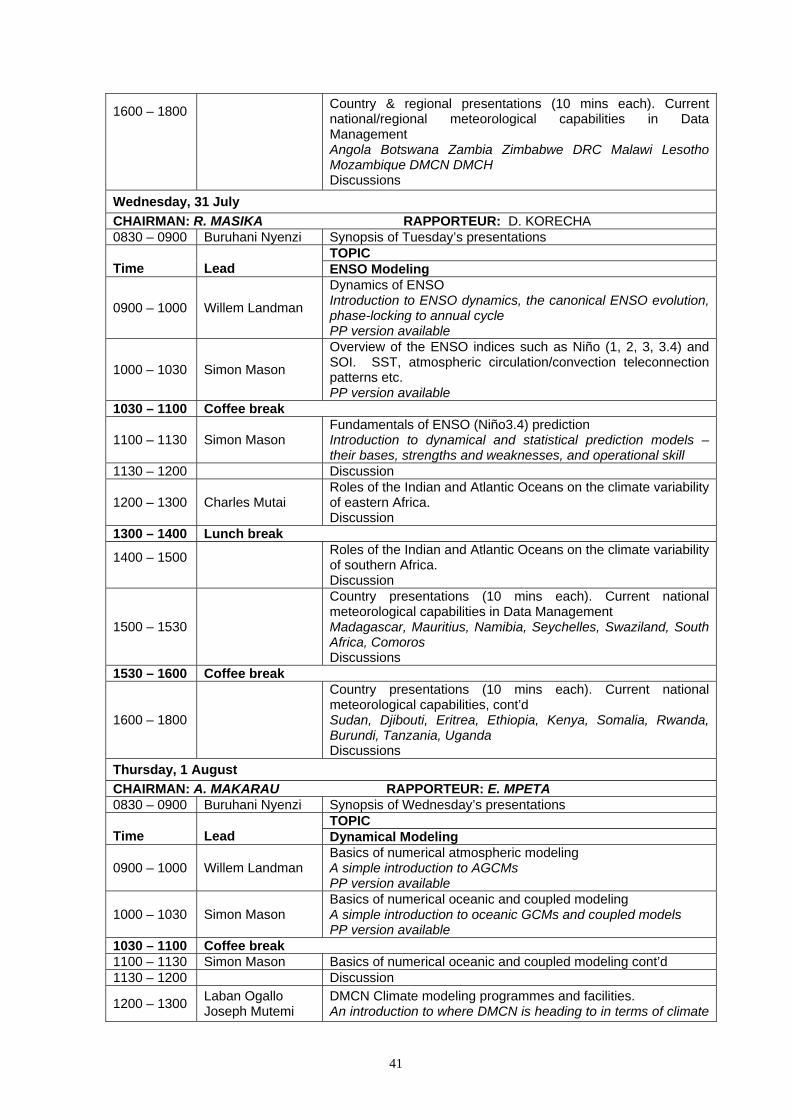
1600 – 1800
Country & regional presentations (10 mins each). Current national/regional meteorological capabilities in Data Management Angola Botswana Zambia Zimbabwe DRC Malawi Lesotho Mozambique DMCN DMCH Discussions
Wednesday, 31 July CHAIRMAN: R. MASIKA RAPPORTEUR: D. KORECHA 0830 – 0900 Buruhani Nyenzi Synopsis of Tuesday’s presentations
TOPIC Time
Lead ENSO Modeling
0900 – 1000 Willem Landman
Dynamics of ENSO Introduction to ENSO dynamics, the canonical ENSO evolution, phase-locking to annual cycle PP version available
1000 – 1030 Simon Mason
Overview of the ENSO indices such as Niño (1, 2, 3, 3.4) and SOI. SST, atmospheric circulation/convection teleconnection patterns etc. PP version available
1030 – 1100 Coffee break
1100 – 1130 Simon Mason Fundamentals of ENSO (Niño3.4) prediction Introduction to dynamical and statistical prediction models – their bases, strengths and weaknesses, and operational skill
1130 – 1200 Discussion
1200 – 1300 Charles Mutai Roles of the Indian and Atlantic Oceans on the climate variability of eastern Africa. Discussion
1300 – 1400 Lunch break
1400 – 1500
Roles of the Indian and Atlantic Oceans on the climate variability of southern Africa. Discussion
1500 – 1530
Country presentations (10 mins each). Current national meteorological capabilities in Data Management Madagascar, Mauritius, Namibia, Seychelles, Swaziland, South Africa, Comoros Discussions
1530 – 1600 Coffee break
1600 – 1800
Country presentations (10 mins each). Current national meteorological capabilities, cont’d Sudan, Djibouti, Eritrea, Ethiopia, Kenya, Somalia, Rwanda, Burundi, Tanzania, Uganda Discussions
Thursday, 1 August CHAIRMAN: A. MAKARAU RAPPORTEUR: E. MPETA 0830 – 0900 Buruhani Nyenzi Synopsis of Wednesday’s presentations
TOPIC Time
Lead Dynamical Modeling
0900 – 1000 Willem Landman Basics of numerical atmospheric modeling A simple introduction to AGCMs PP version available
1000 – 1030 Simon Mason Basics of numerical oceanic and coupled modeling A simple introduction to oceanic GCMs and coupled models PP version available
1030 – 1100 Coffee break 1100 – 1130 Simon Mason Basics of numerical oceanic and coupled modeling cont’d 1130 – 1200 Discussion
1200 – 1300 Laban Ogallo Joseph Mutemi
DMCN Climate modeling programmes and facilities. An introduction to where DMCN is heading to in terms of climate
41

modeling and the facilities in place for this activity including a guided tour to see the facilities
1300 – 1400 Lunch break 1400 – 1530 KMD/DMCN Guided tour of the KMD facilities 1530 – 1600 Coffee break
1600 – 1730 Simon Mason
Ensembles: reasons for and methods of producing An introduction to methods of producing forecast ensembles and probabilistic predictions. PP version available Discussion
Friday, 2 August CHAIRMAN: W. NYAKWADA RAPPORTEUR: C. MUTAI/T. NKAGO
0830 – 0900 Buruhani Nyenzi Synopsis of Thursday’s presentations TOPIC
Time Lead Dynamical Modeling (cont’d)
0900 – 1030
Country Presentations (10 mins each). Current capabilities in climate prediction, uses of climate information and predictions, needs for the future: Angola, Botswana, Burundi, DRC, Djibouti, Eritrea, Ethiopia, Kenya, Lesotho, Madagascar, Malawi, Mauritius Discussions
1030 – 1100 Coffee Break
1100 – 1130
Country Presentations (10 mins each). Current capabilities in climate prediction, uses of climate information and predictions, needs for the future (cont’d) Discussions
1130 – 1300
Country Presentations (10 mins each). Current capabilities in Climate Prediction; uses of climate information and predictions; needs for the future (cont’d) Mozambique, Namibia, Rwanda, Seychelles, Somalia, South Africa, Sudan, Swaziland, Tanzania, Comoros, Uganda, Zambia, Zimbabwe Discussions
1300 – 1400 Lunch Break TOPIC
Time Lead Verification
1400 – 1530 Simon Mason
Basics of verification An overview of forecast quality and its measurement The WMO verification system. A more detailed introduction to the WMO SVS – RMSE and ROC PP version available
1530 – 1600 Coffee Break 1600 – 1800 Simon Mason Verification hands-on exercise (deterministic forecasts) Monday, 5 August CHAIRMAN: H. SALEH RAPPORTEUR: S. MWANGI 0830 – 0900 Buruhani Nyenzi Synopsis of Friday’s presentations
Topic Time
Lead Verification (cont’d)
0900 – 0930 Zakary Atheru Hemed Saleh Verification methods used by DMCN/DMCH
0930 – 1030 Richard Washington
Verification of rainfall/temperature predictions – how good are operational forecasts? An honest look at the operational performance of seasonal climate forecasts.
42
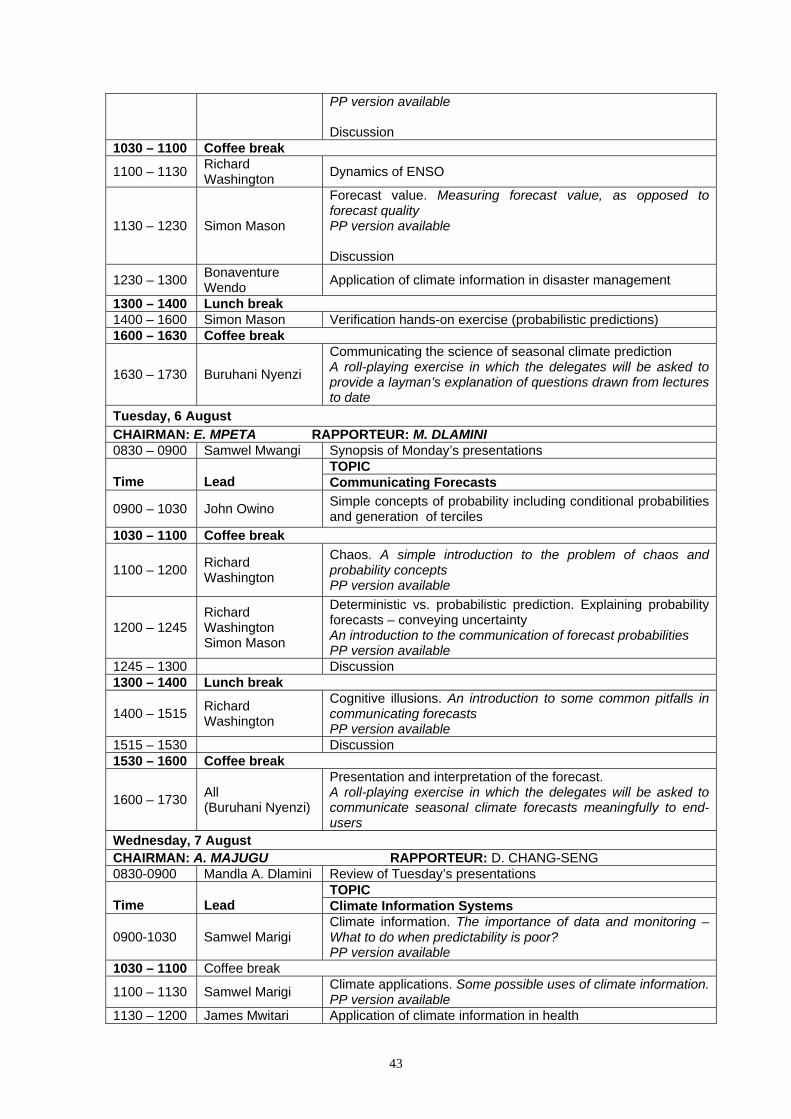
PP version available Discussion
1030 – 1100 Coffee break
1100 – 1130 Richard Washington Dynamics of ENSO
1130 – 1230 Simon Mason
Forecast value. Measuring forecast value, as opposed to forecast quality PP version available Discussion
1230 – 1300 Bonaventure Wendo Application of climate information in disaster management
1300 – 1400 Lunch break 1400 – 1600 Simon Mason Verification hands-on exercise (probabilistic predictions) 1600 – 1630 Coffee break
1630 – 1730 Buruhani Nyenzi
Communicating the science of seasonal climate prediction A roll-playing exercise in which the delegates will be asked to provide a layman’s explanation of questions drawn from lectures to date
Tuesday, 6 August CHAIRMAN: E. MPETA RAPPORTEUR: M. DLAMINI 0830 – 0900 Samwel Mwangi Synopsis of Monday’s presentations
TOPIC Time
Lead Communicating Forecasts
0900 – 1030 John Owino Simple concepts of probability including conditional probabilities and generation of terciles
1030 – 1100 Coffee break
1100 – 1200 Richard Washington
Chaos. A simple introduction to the problem of chaos and probability concepts PP version available
1200 – 1245 Richard Washington Simon Mason
Deterministic vs. probabilistic prediction. Explaining probability forecasts – conveying uncertainty An introduction to the communication of forecast probabilities PP version available
1245 – 1300 Discussion 1300 – 1400 Lunch break
1400 – 1515 Richard Washington
Cognitive illusions. An introduction to some common pitfalls in communicating forecasts PP version available
1515 – 1530 Discussion 1530 – 1600 Coffee break
1600 – 1730 All (Buruhani Nyenzi)
Presentation and interpretation of the forecast. A roll-playing exercise in which the delegates will be asked to communicate seasonal climate forecasts meaningfully to end-users
Wednesday, 7 August CHAIRMAN: A. MAJUGU RAPPORTEUR: D. CHANG-SENG 0830-0900 Mandla A. Dlamini Review of Tuesday’s presentations
TOPIC Time
Lead Climate Information Systems
0900-1030 Samwel Marigi Climate information. The importance of data and monitoring – What to do when predictability is poor? PP version available
1030 – 1100 Coffee break
1100 – 1130 Samwel Marigi Climate applications. Some possible uses of climate information. PP version available
1130 – 1200 James Mwitari Application of climate information in health
43
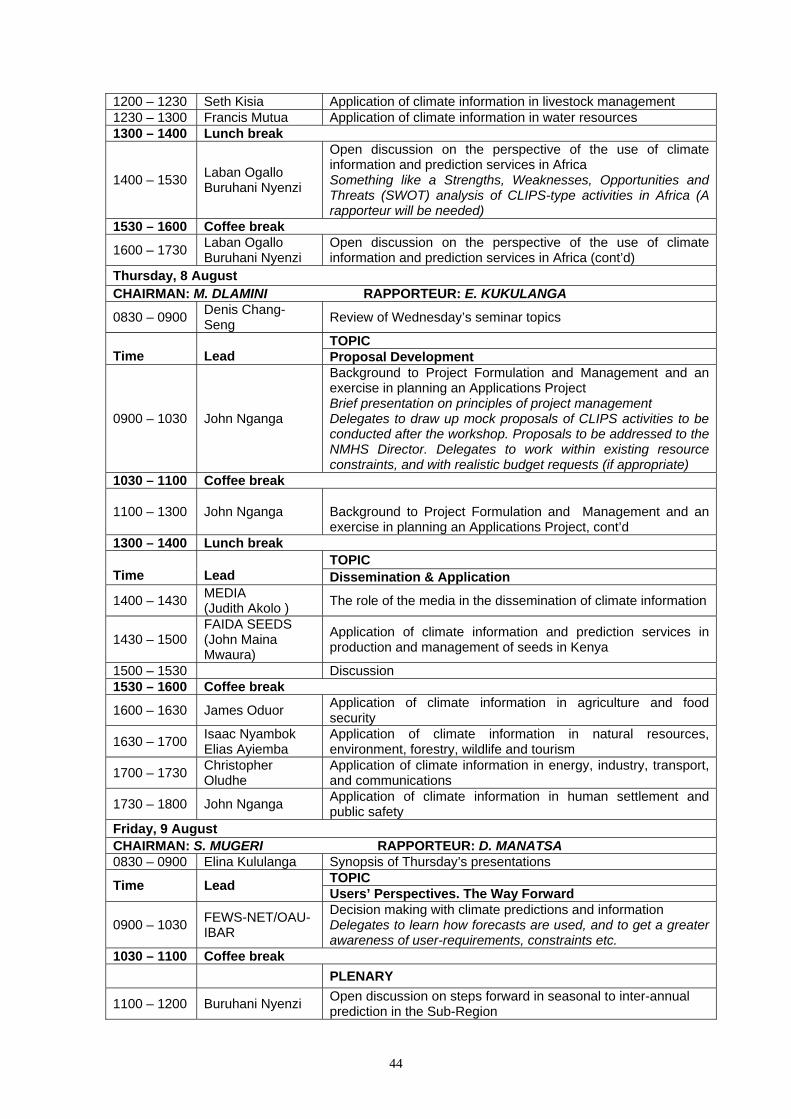
1200 – 1230 Seth Kisia Application of climate information in livestock management 1230 – 1300 Francis Mutua Application of climate information in water resources 1300 – 1400 Lunch break
1400 – 1530 Laban Ogallo Buruhani Nyenzi
Open discussion on the perspective of the use of climate information and prediction services in Africa Something like a Strengths, Weaknesses, Opportunities and Threats (SWOT) analysis of CLIPS-type activities in Africa (A rapporteur will be needed)
1530 – 1600 Coffee break
1600 – 1730 Laban Ogallo Buruhani Nyenzi
Open discussion on the perspective of the use of climate information and prediction services in Africa (cont’d)
Thursday, 8 August CHAIRMAN: M. DLAMINI RAPPORTEUR: E. KUKULANGA
0830 – 0900 Denis Chang-Seng Review of Wednesday’s seminar topics
TOPIC Time
Lead Proposal Development
0900 – 1030 John Nganga
Background to Project Formulation and Management and an exercise in planning an Applications Project Brief presentation on principles of project management Delegates to draw up mock proposals of CLIPS activities to be conducted after the workshop. Proposals to be addressed to the NMHS Director. Delegates to work within existing resource constraints, and with realistic budget requests (if appropriate)
1030 – 1100 Coffee break
1100 – 1300 John Nganga Background to Project Formulation and Management and an exercise in planning an Applications Project, cont’d
1300 – 1400 Lunch break TOPIC
Time Lead Dissemination & Application
1400 – 1430 MEDIA (Judith Akolo ) The role of the media in the dissemination of climate information
1430 – 1500 FAIDA SEEDS (John Maina Mwaura)
Application of climate information and prediction services in production and management of seeds in Kenya
1500 – 1530 Discussion 1530 – 1600 Coffee break
1600 – 1630 James Oduor Application of climate information in agriculture and food security
1630 – 1700 Isaac Nyambok Elias Ayiemba
Application of climate information in natural resources, environment, forestry, wildlife and tourism
1700 – 1730 Christopher Oludhe
Application of climate information in energy, industry, transport, and communications
1730 – 1800 John Nganga Application of climate information in human settlement and public safety
Friday, 9 August CHAIRMAN: S. MUGERI RAPPORTEUR: D. MANATSA 0830 – 0900 Elina Kululanga Synopsis of Thursday’s presentations
TOPIC Time Lead Users’ Perspectives. The Way Forward
0900 – 1030 FEWS-NET/OAU-IBAR
Decision making with climate predictions and information Delegates to learn how forecasts are used, and to get a greater awareness of user-requirements, constraints etc.
1030 – 1100 Coffee break PLENARY
1100 – 1200 Buruhani Nyenzi Open discussion on steps forward in seasonal to inter-annual prediction in the Sub-Region
44

Build on from SWOT analysis to discuss possible CLIPS-related projects. Possibly include some mock presentations so delegates can refine their ideas.
1200 – 1300 KMD/DMCN WMO CLOSING
1300 – 1400 Lunch break
45

Annex II: LIST OF PARTICIPANTS
COUNTRY NAME ORGANIZATION TEL/FAX/E-MAIL/
1. Botswana Mrs Tebogo Thelma NKAGO
Senior Meteorologist Botswana Meteorological Services P.O. Box 10100 GABORONE
Tel No: (267) 361 2237 Fax No: (267) 356 282 E-mail: [email protected]
2. Burundi
Mr Ruben BARAKIZA
Senior Meteorologist Institut Geographique du Burundi Forecast Unit, Bujumbura Airport P.O. Box 331 BUJUMBURA
Tel No: (257) 223 150 Fax No: (257) 040 2526 E-mail: [email protected] [email protected]
3. Djibouti Mr Mohamed Youssouf MOHAMED
Ingenior-Deputy of Chief Service de la Météorologie B.P. 204 DJIBOUTI
Tel No: (253) 340 500 Fax No: (253) 340 723 E-mail: [email protected]
4. Ethiopia Mr Diriba KORECHA DADI
Team Leader Weather Forecasting & Early Warning, National Meteorological Services Agency P.O. Box 1090 ADDIS ABABA
Tel No: (251-1) 615 779 Fax No: (251-1) 517 066 E-mail: [email protected]
5. Kenya Prof. Laban A. OGALLO
Project Coordinator Drought Monitoring Centre-Nairobi Dagoretti Corner, Ngong Road P.O. Box 10304 GPO NAIROBI 00100
Tel No: (254-2) 578 340 Fax No: (254-2) 576 955/577373 E-mail: [email protected]
6. Kenya Dr Charles C. MUTAI
Meteorologist Kenya Meteorological Department Dagoretti Corner, Ngong Road P.O. Box 30259 GPO NAIROBI 00100
Tel No: (254-2) 574 214 Fax No: (254-2) 576 955/577373 E-mail: [email protected]
7. Kenya Mr Peter G. AMBENJE
Senior Meteorologist Drought Monitoring Centre-Nairobi Dagoretti Corner, Ngong Road P.O. Box 10304 GPO NAIROBI 00100
Tel No: (254-2) 578 340 Fax No: (254-2) 578 343/577 373 E-mail: [email protected]
8. Kenya Mr Zakary K. K. ATHERU
Climate Scientist Drought Monitoring Centre-Nairobi Dagoretti Corner, Ngong Road P.O. Box 10304 GPO NAIROBI 00100
Tel No: (254-2) 578 340 Fax No: (254-2) 578 343/577 373 E-mail: [email protected]
9. Kenya Dr Samwel MARIGI Climate Scientist Drought Monitoring Centre-Nairobi Dagoretti Corner, Ngong Road P.O. Box 10304 GPO NAIROBI 00100
Tel No: (254-2) 578 340 Fax No: (254-2) 578 343/577 373 E-mail: [email protected]
10. Kenya Mr Samwel MWANGI Meteorologist Meteorological Department Dagoretti Corner, Ngong Road P.O. Box 30259 GPO NAIROBI
Tel No: (254-2) 574 214 Fax No: (254-2) 576 955/577 373 E-mail: [email protected]
11. Kenya Prof. Isaac O. NYAMBOK
University of Nairobi Department of Geology P.O. Box 30197, Nairobi
Tel.: (254-2) 44201-4/5/6 Fax: (254-2) 44 9539 E-mail: [email protected]
12. Kenya Prof. Elias H. O. AYIEMBA
University of Nairobi Department of Geography P.O. Box 30197, Nairobi
Tel.: (254-2) Fax: E-mail:
13. Kenya Dr. Christopher OLUDHE
Lecturer University of Nairobi Department of Meteorology P.O. Box 30197 GPO NAIROBI 00100
Tel: (254-2) 441045 Fax: (254-2) 578343/577373 E-mail: [email protected]
14. Kenya Mr. Hussein GADAIN Regional Hydrologist USGS-USAID/FEWSNET P.O. Box 66613 or 10304 NAIROBI
Tel: (254-2) 578340 or 350523/4/5 Fax: (254-2) 578343 or 3750839 E-mail: [email protected]
46

15. Kenya Mr. Joseph Nzau MUTEMI
Research Scientist, Climate Modeling, University of Nairobi Department of Meteorology P.O. Box 30197 GPO NAIROBI 00100
Tel: (254-2) 441045 or (254) 0722 890176 Fax: (254-2) 578343/577373 E-mail: [email protected]
16. Kenya Dr. Raphael Eric OKOOLA
Senior Lecturer, University of Nairobi, Department of Meteorology P.O. Box 30197 GPO NAIROBI 00100
Tel: (254-2) 441045 Fax: (254-2) 578343/577373 E-mail: [email protected]
17. Kenya Mr. Stephen J. M. NJOROGE
Programme Officer World Meteorological Organisation, WMO Subregional Office for Eastern & Southern Africa P O Box 47464 NAIROBI
Tel: (254-2) 577371 Fax: (254-2) 577373 E-mail: [email protected]
18. Kenya Col. B. S. WENDO Director NOC-OOP P O Box 30510 GPO NAIROBI 00100
Tel: (254-2) 210053 Fax: (254-2) 211660 E-mail: [email protected]
19. Kenya Mr. James O. ODUOR Senior Agricultural Officer Ministry of Agriculture and Rural Development Kilimo House, Crop Development Division P O Box 30028 GPO NAIROBI 00100
Tel.: (254-2) 713901 or 716665/719014/3 Ext. 48075 Fax: (254-2) 713901 E-mail: [email protected]
20. Kenya Prof. John NGANGA Department of Meteorology University of Nairobi P O Box 30197 GPO NAIROBI 00100
Tel: (254-2) 441045 E-mail: [email protected]
21. Kenya Dr. Seth M. KISIA Senior Lecturer University of Nairobi P O Box 30197 GPO NAIROBI 00100
Tel: (254-2) 442400 E-mail: [email protected] or [email protected]
22. Kenya Prof. F. M. MUTUA Lecturer University of Nairobi P O Box 30197 GPO NAIROBI 00100
Tel: (254-2) 441045 Fax: (254-2) 577373 Mobile Tel: 254 -722-835867 E-mail: [email protected]
23. Kenya Mr. Gideon Kinyonda GALU
Regional Representative USGS/FEWS-NET P O Box 66614 NAIROBI
Tel: (254-2) 350523/4/5 E-mail: [email protected]
24. Kenya Mr. William NYAKWADA
Assistant Director Kenya Meteorological Department Dagoretti Corner P O Box 30259 GPO NAIROBI 00100
Tel: (254-2) 567880/9 Fax: (254-2) 576955/567889 E-mail: [email protected]
25. Kenya Prof. John Okoth OWINO
Senior Lecturer-Mathematics University of Nairobi P O Box 30197 GPO NAIROBI 00100
Tel: (254-2) 445751 E-mail: [email protected]
26. Kenya Mr. Richard MASIKA Assistant Director Kenya Meteorological Department P O Box 30259 GPO NAIROBI 00100
Tel: (254-2) 567880/576957 Fax: (254-2) 576955 E-mail: [email protected]
27. Kenya Ms. Judith AKOLO Journalist East African Standard P.O. Box 30080 NAIROBI
Tel: (254-2) 332658 Fax: (254-2) 337697 E-mail: [email protected]
28. Kenya Mrs. Rungano KARIMANZIRA
Senior Programme Officer United Nations Environmental Programme UNEP Regional Programme for Africa P.O. Box 47074 Gigiri NAIROBI
Tel: (254-2) 624616 Fax: (254-2) 623928 E-mail: [email protected]
47
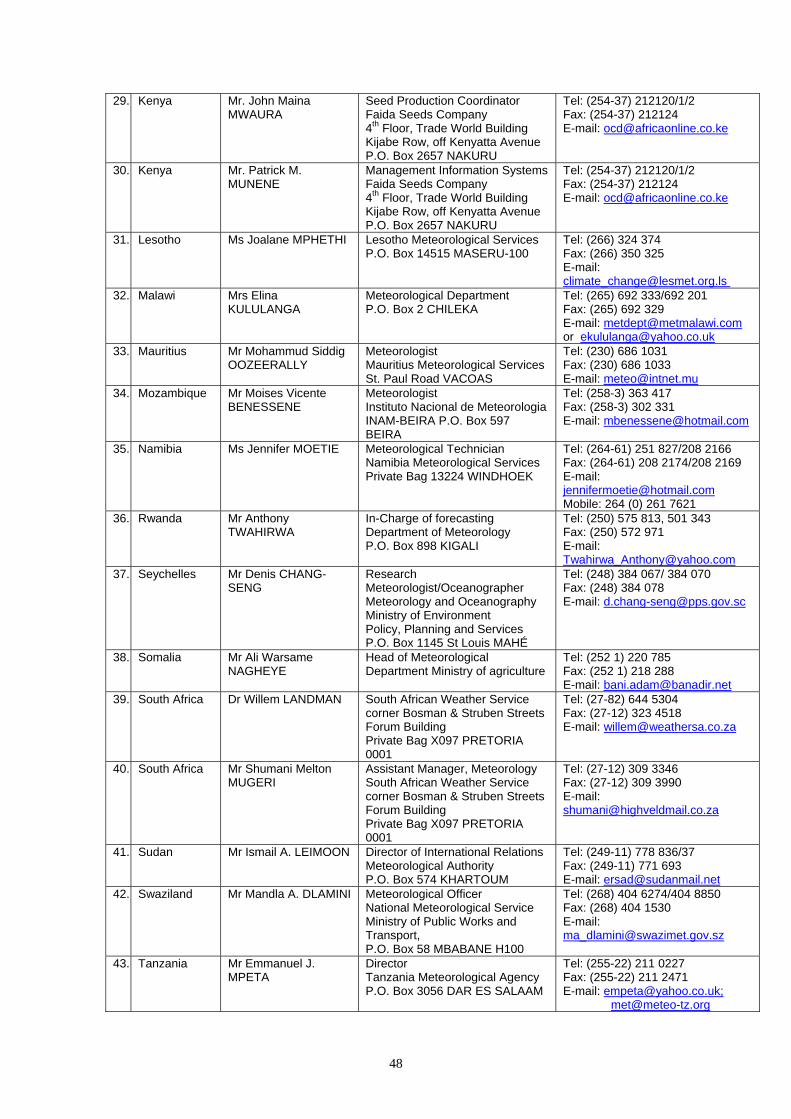
29. Kenya Mr. John Maina MWAURA
Seed Production Coordinator Faida Seeds Company 4th Floor, Trade World Building Kijabe Row, off Kenyatta Avenue P.O. Box 2657 NAKURU
Tel: (254-37) 212120/1/2 Fax: (254-37) 212124 E-mail: [email protected]
30. Kenya Mr. Patrick M. MUNENE
Management Information Systems Faida Seeds Company 4th Floor, Trade World Building Kijabe Row, off Kenyatta Avenue P.O. Box 2657 NAKURU
Tel: (254-37) 212120/1/2 Fax: (254-37) 212124 E-mail: [email protected]
31. Lesotho Ms Joalane MPHETHI Lesotho Meteorological Services P.O. Box 14515 MASERU-100
Tel: (266) 324 374 Fax: (266) 350 325 E-mail: [email protected]
32. Malawi Mrs Elina KULULANGA
Meteorological Department P.O. Box 2 CHILEKA
Tel: (265) 692 333/692 201 Fax: (265) 692 329 E-mail: [email protected] or [email protected]
33. Mauritius Mr Mohammud Siddig OOZEERALLY
Meteorologist Mauritius Meteorological Services St. Paul Road VACOAS
Tel: (230) 686 1031 Fax: (230) 686 1033 E-mail: [email protected]
34. Mozambique Mr Moises Vicente BENESSENE
Meteorologist Instituto Nacional de Meteorologia INAM-BEIRA P.O. Box 597 BEIRA
Tel: (258-3) 363 417 Fax: (258-3) 302 331 E-mail: [email protected]
35. Namibia Ms Jennifer MOETIE Meteorological Technician Namibia Meteorological Services Private Bag 13224 WINDHOEK
Tel: (264-61) 251 827/208 2166 Fax: (264-61) 208 2174/208 2169 E-mail: [email protected] Mobile: 264 (0) 261 7621
36. Rwanda Mr Anthony TWAHIRWA
In-Charge of forecasting Department of Meteorology P.O. Box 898 KIGALI
Tel: (250) 575 813, 501 343 Fax: (250) 572 971 E-mail: [email protected]
37. Seychelles Mr Denis CHANG-SENG
Research Meteorologist/Oceanographer Meteorology and Oceanography Ministry of Environment Policy, Planning and Services P.O. Box 1145 St Louis MAHÉ
Tel: (248) 384 067/ 384 070 Fax: (248) 384 078 E-mail: [email protected]
38. Somalia Mr Ali Warsame NAGHEYE
Head of Meteorological Department Ministry of agriculture
Tel: (252 1) 220 785 Fax: (252 1) 218 288 E-mail: [email protected]
39. South Africa Dr Willem LANDMAN South African Weather Service corner Bosman & Struben Streets Forum Building Private Bag X097 PRETORIA 0001
Tel: (27-82) 644 5304 Fax: (27-12) 323 4518 E-mail: [email protected]
40. South Africa Mr Shumani Melton MUGERI
Assistant Manager, Meteorology South African Weather Service corner Bosman & Struben Streets Forum Building Private Bag X097 PRETORIA 0001
Tel: (27-12) 309 3346 Fax: (27-12) 309 3990 E-mail: [email protected]
41. Sudan Mr Ismail A. LEIMOON Director of International Relations Meteorological Authority P.O. Box 574 KHARTOUM
Tel: (249-11) 778 836/37 Fax: (249-11) 771 693 E-mail: [email protected]
42. Swaziland Mr Mandla A. DLAMINI Meteorological Officer National Meteorological Service Ministry of Public Works and Transport, P.O. Box 58 MBABANE H100
Tel: (268) 404 6274/404 8850 Fax: (268) 404 1530 E-mail: [email protected]
43. Tanzania Mr Emmanuel J. MPETA
Director Tanzania Meteorological Agency P.O. Box 3056 DAR ES SALAAM
Tel: (255-22) 211 0227 Fax: (255-22) 211 2471 E-mail: [email protected]; [email protected]
48

44. Tanzania Mrs Juliana J ADOSI Student, Department of Meteorology, University of Nairobi P O Box 30197 GPO NAIROBI 00100
Tel: (255-744) 584212 E-mail: [email protected]: (254) 0733 989699
45. Uganda Mr Abushen W. MAJUGU
Principal Meteorologist Department of Meteorology P.O. Box 7025 KAMPALA
Tel: (256-41) 251 798 Fax: (256-41) 251 797 E-mail: [email protected]
46. UK Dr Richard WASHINGTON
School of Geography & Environment, University of Oxford Mansfield Rd OXFORD 0X1 3TB
Tel: (44-1865) 271 919 Fax: (44-1865) 271 929 E-mail: [email protected]
47. USA Dr Simon MASON SCRIPPS Institution of Oceanography, University of California 9500 Gilman Drive La Jolla, CA 92093-0230
Tel: (1-858) 822 2574 Fax: (1-858) 534 8561 E-mail: [email protected]
48. Zambia Dr Richard MUGARA Chief Meteorologist Zambia Meteorological Department P.O. Box 30200 10101 LUSAKA
Tel: (260-1) 252 728 Fax: (260-1) 251 795/889 E-mail: [email protected]
49. Zimbabwe Dr Amos MAKARAU Lecturer, Department of Physics University of Zimbabwe P.O. Box MT 167 Mount Pleasant HARARE
Tel: (263-4) 303 211 Fax: (263-4) 333 407 E-mail: [email protected]
50. Zimbabwe Mr. Hemed K. SALEH Visiting Scientist Drought Monitoring Centre-Harare P.O. Box 150 BE Belvedere HARARE
Tel: (263-4) 778 172 Fax: (263-4) 778 172 E-mail: [email protected]
51. Zimbabwe Mr Desmond MANATSA
Meteorologist Department of Meteorology P.O. Box BE 150 Belvedere HARARE
Tel: (263-4) 778 175/3/4 Fax: (263-4) 778 161 E-mail: [email protected]
52. WMO Secretariat
Dr Buruhani S. NYENZI
Chief, World Climate Applications and CLIPS Division World Climate Programme Department 7bis, Avenue de la Paix CP 2300 CH-1211 GENEVA 2
Tel: (41 22) 730 8273 Fax: (41 22) 730 8042 E-mail: [email protected]
49

Annex III: SPEECHES (a) SPEECH BY PROF. CRISPUS KIAMBA, VICE-CHANCELLOR UNIVERSITY OF
NAIROBI, ON THE OPENING CEREMONY FOR THE CLIMATE INFORMATION AND PREDICTION SERVICES (CLIPS) TRAINING WORKSHOP FOR EASTERN AND SOUTHERN AFRICA, Nairobi Kenya: 29 July – 9 August 2002
• Representative of the World Meteorological Organization (WMO), Mr. Kenneth
Davidson • Chief of the World Climate Applications, and Climate Information and Prediction
Services (CLIPS) division of WMO, Dr. Buruhani Nyenzi • Mr. Stephen Njoroge, WMO Sub-regional Office for eastern and southern Africa • Director of the Kenya Meteorological Department (KMD), Dr. Joseph Mukabana • Principal of the Institute of Meteorological Training and Research (IMTR), Mr.
William Chebukaka • Coordinator of Drought Monitoring Centre – Nairobi (DMCN), Prof. Laban Ogallo • Distinguished Guests • Workshop participants • Ladies and Gentlemen It gives me great pleasure to be with you here today to mark the opening of the Climate Information and Prediction Services (CLIPS) training workshop for eastern and southern Africa. We are all aware that new discoveries in science and technology and the associated applications are coming out day by day giving new opportunities in all fields. These discoveries have also been known to change the traditional ways that various disciplines have been using to address the specific professional challenges. The new science and technology areas that continue to change our day-to-day ways of doing things include advancement in computer science, information and communication technology, biotechnology, space science, among many others. Discoveries and applications of advanced and new technologies require among others: basic and applied research, skilled human resources, and continuous training. These are key focal issues at the University of Nairobi, which is the first public university in Kenya. Regarding human resource development in meteorology, the University of Nairobi has played pivotal roles in Africa. For many years, it has been the only University providing full undergraduate and post-graduate degree programmes in meteorology for English speaking countries in the continent. It has therefore trained most of the meteorologists in Africa through the support of the World Meteorological Organization (WMO). I would like to take this opportunity to thank WMO for the support that they continue to give to the Department of Meteorology at the University. I am aware that WMO has continued to provide new equipment including computers to the Department of Meteorology at the University. I am also aware that most of the staff at the Department have been trained through WMO support. WMO, Kenya Meteorological Department (KMD) and Department of Meteorology at the University have also been collaborating very closely in many other capacity building initiatives. These include running of specialized training activities at the Institute of Meteorological Training and Research (IMTR) and Drought Monitoring Centre – Nairobi (DMCN), as well as research and development. The current Operational Hydrology Course is a good example where the University of Nairobi postgraduate diploma course is being offered at the IMTR. I am also proud to note that two senior staff members from the University of Nairobi, Dr. Mukabana and Prof. Ogallo, are currently on leave of absence from the University working with you to address meteorological challenges of the region.
50

• Distinguished Guests • Ladies and gentlemen I would like to commend the unique collaboration that has been forged between the Kenya Meteorological Department (KMD), the Drought Monitoring Centre – Nairobi (DMCN) and the Department of Meteorology of the University of Nairobi. I am also happy to note that the KMD and DMCN has spread its wings to also equally collaborate with other departments of the University of Nairobi (UON) such as nuclear science, geography, computer sciences, among others. In this regard, I want to recognize the recent collaboration between KMD, DMCN and many departments at University of Nairobi to produce a very unique publication on how to factor climate on various socio-economic sectors in Kenya. This is a unique volume of its kind and will be an important reference material worldwide. I wish to encourage this unique partnership to be strengthened for the benefit of this country and region. • Distinguished Guests • Workshop participants • Ladies and gentlemen Regarding this activity, I am informed that it is a training workshop on the use of new computer and information technology for enhanced application of the science and technology of meteorology in the region. These include how best to produce, interpret and disseminate climate information and prediction services to the end-users in their respective countries and sectors. I am informed that the participants of this workshop comprise of climate scientists of National Meteorological and Hydrological Services (NMHS) from 25 countries in eastern and southern Africa. The presence of climate experts from the national, regional and international institutions and some end-users of climate information reflect the importance that has been given to the activity by the region and WMO. • Distinguished Guests • Ladies and gentlemen
Climate affects all aspects of life. For example, it is well known that rain-fed agricultural production is the main stay of economic activity in many African countries, and it is highly vulnerable to climate variations. It is also known that extreme weather events, such as droughts and floods, cause massive disruptions on valuable resources including infrastructure and are detrimental to the economic development in Africa and beyond, as was observed in Kenya during the floods of 1997/98 and the droughts of 1999/2000. The onus is therefore on the climate scientists to provide timely and accurate information that can be used to minimize the impacts of extreme climate events. Such information can enable governments of the region to put appropriate measures in place to mitigate against the potential impacts associated with the event. I am happy to note that the World Meteorological Organization (WMO) and the National Meteorological and Hydrological Services (NMHS) are addressing how to enhance the use of meteorological information in various sectors of economy. I am informed that the CLIPS Office of the WMO and DMCN have been established to help WMO member countries address these challenges.
• Distinguished Guests • Workshop participants • Ladies and gentlemen
51

I would like to comment the Kenya Meteorological Department and the Drought Monitoring Centres in Nairobi and Harare for taking a lead role in building a regional capacity on applications of climate information and prediction services in various socio-economic sectors including agriculture and food security, water resources, energy generation/consumption, public health, environment, disaster management, etc. It is my hope that they will continue to organize more specialized training workshops that will continue to enhance the capacity in addressing the challenges associated with application of meteorological information and products in support of sustainable development efforts of the region. I wish to assure you that the University of Nairobi will continue to provide support, within its means, in collaborating with KMD, DMCN and others in such endeavours and in addressing challenges associated with enhanced development, and application of meteorological sciences and technology in Africa. Last but not least, Ladies and gentlemen, I would like to take this opportunity to welcome you to Kenya, especially those who are visiting for the first time. I would like to recommend that you take sometime off your busy schedule to visit some of the numerous tourist sites of our country and enjoy the beauty of the physical features and to sample the hospitality of our people. We like visitors and hope you will enjoy your stay. With those remarks, ladies and gentlemen, it is now my great pleasure to declare the Climate Information and Prediction Services (CLIPS) training workshop for eastern and southern Africa officially open. I THANK YOU ALL (b) STATEMENT BY DR BURUHANI NYENZI, WORLD METEOROLOGICAL
ORGANISATION DURING THE OFFICIAL OPENING OF CLIPS TRAINING WORKSHOP FOR EASTERN AND SOUTHERN AFRICA, Nairobi Kenya 29 July – 9 August 2002
Prof. Crispus Kiamba, Vice Chancellor, University of Nairobi, Dr. Joseph Mukabana Director Meteorological Department and Permanent Representative of Kenya with WMO, Prof. Laban Ogallo, Co-ordinator of the Drought Monitoring Centre, Nairobi, Mr. Stephen Njoroge, WMO sub-regional Office for Eastern and Southern Africa Distinguished Guests, Ladies and Gentlemen It is a great pleasure for me to be with you on this occasion of the opening of the CLIPS Training Workshop for Eastern and Southern Africa. On behalf of the World Meteorological Organisation (WMO) and that of my own, I wish to express my sincere appreciation to the Government of Kenya for hosting this important workshop. This is testimony of the commitment of the Government of Kenya in supporting the optimum application of climate information and prediction products for sustainable development in Kenya and in the region as a whole. I would like to take this opportunity to thank Dr Mukabana, the Director of the Kenya Meteorological Department, and Prof Ogallo, for the kind hospitality and warm welcome that has been extended to all of us since our arrival in this country. I wish to commend
52

the entire Local organising committee of the workshop for the excellent arrangements they have made, which will no doubt contribute to the successful conclusion of the meeting. Ladies and Gentlemen, This Workshop is being organised by the World Meteorological Organisation in collaboration with DMC Nairobi and NOAA-OGP. I wish to express WMO’s gratitude to all these institutions for the assistance extended to support this workshop. I am also thankful to the National Meteorological and Hydrological Services in the region, various institutions including universities and individual scientists that are providing inputs to this workshop. Over twenty countries from the region are participating in this workshop. Ladies and Gentlemen,
Past and recent events in this region and elsewhere in the world have demonstrated that extreme climate events such as droughts and floods often have devastating consequences in terms of economic hardship, poverty and political instability among many other socio-economic activities of the region. A live example still in our memories is the floods, which affected East Africa in 1997/98 and in Southern Africa in 2000. These floods caused damage to infrastructure, loss of life and property. Effective, accurate and timely prediction and well established early warning mechanisms can enable the governments and stakeholders to put into motion appropriate actions for mitigating against the adverse impacts brought by these climate related extreme events. It is within this context that the World Meteorological Organization in 1997 established the Climate Information and Prediction Services Project (CLIPS) with the view to supporting Member countries to optimise the use of climate information and prediction products. Within the context of CLIPS, WMO and many other partners such as the IRI and NOAA-OGP have organised many climate outlook forums in many other parts of the world. In eastern, western and southern Africa these have become a routine feature. These forums have provided opportunities for researchers from various major climate centres to collaborate with scientists and experts from National Meteorological and Hydrological Services and regional operational climate centres to develop consensus climate outlook products, their interpretation and dissemination to users, and their potential impacts on the various socio-economic sectors. Furthermore, WMO and the Member countries provide regular updates and future projections of the extreme climate events such as the ENSO phenomena to government agencies, UN organisations, the media and other users of this information. Such information has been successfully used to mitigate the adverse impacts of these events. I would like to assure you that WMO is working very hard to see how it can help the Meteorological services within the region in provision of early warning for climate related extreme events.
This is achieved through provision of support to NMHS with training its experts who can produce and deliver of this information, timely and accurately. Apart from participants exchanging information, one of the main objectives of this workshop is to train experts in climate information and prediction. Ladies and Gentlemen, Since the training process started in other parts of the world, it has established itself as an effective mechanism for co-ordinating the generation, dissemination, interpretation
53

and application of climate information and prediction products in the region. It has also served as a useful tool for assessing the effectiveness of these forecasts, and for translating lessons learnt into future corrective actions. 1 would, therefore, like to urge governments, relevant partners and other stakeholders in the region to identify ways and means of sustaining this process, in view of positive impacts these training activities have had in these other regions in building capacity of experts. There is also need for governments in the region to provide adequate support to NMHS, as well as to the DMCs and other related national and regional programmes in order to ensure that these institutions and programmes continue to utilise new developments in climate prediction in support of sustainable development. Finally, 1 would like to assure you that on its part, WMO will continue to support the activities of the NMHS and those of the DMCs in their effort to further contribute effectively to the national and regional sustainable socio-economic development efforts. WMO will also continue to work with its partners in the international community as well as Governments in order to ensure the sustainability of these institutions. In concluding, I wish once again to thank the Government of Kenya for the hospitality, and wish the workshop fruitful deliberations. Thank you.
54

Annex IV: QUESTIONNAIRE FOR PARTICIPANTS EVALUATION OF THE WORKSHOP All participants are kindly requested to complete this evaluation form and submit it to the Workshop co-ordinator. Where possible, kindly rate the questionnaire on a scale of ONE (low) to FIVE (high) according to the legend given: Legend: Excellent=5, Good=4, Satisfactory=3, Fair=2, Poor=1. A) COURSE CONTENT 1. Did the workshop meet the intended objectives as described in the invitation letter?
……………………………………………………………………………………………………………
2. Did the course content meet your expectations and needs?
………………………………………………………………………………………………………
3. How useful was the course documentation?
………………………………………………………………………………………………………
4. How do you assess the quality of the lectures?
…………………………………………………………………………………………………………
5. How do you assess the quality of the answers to questions?
…………………………………………………………………………………………………………
6. What can you say about the practical component of the course?
…………………………………………………………………………………………………………
7. How do you assess the duration of the workshop?
…………………………………………………………………………………………………………
8. State how the workshop has improved your knowledge on climate information and
prediction services
…………………………………………………………………………………………………………
B) APPLICABILITY 9. How useful will the training acquired be to your organization?
….………………………………………………………………………………………………………
10. How do you expect to assist your institution in the areas you have learnt?
…………………………………………………………………………………………………………
C) ORGANIZATION 11. How do you assess the quality of:
a) The training facilities…………………………………………………………………………..….
55

b) Logistics…………………………………………………………………………………………...
c) Accommodation………………………………………………………………………………...
d) Lunches……………………………………………………………………………………………
e) Financial arrangements…………………………………………………………………………
f) Transportation………………………………………………………….……………………….
g) Any other………………………………………………………………………………………….
D) FOLLOW UP WORKSHOPS Comment on when these could be carried out, period and new areas to be covered.
…………………………………………………………………………………………………………
E) ANY ADDITIONAL COMMENTS?
…………………………………………………………………………………………………………
56

Annex V: ACRONYM GLOSSARY ACMAD African Centre of Meteorological Applications for Development AGCM Atmospheric GCM AOGCM Atmospheric and Oceanic GCM BMRC Bureau of Meteorology Research Centre BUH Botswana Upper High CBS Commission of Basic Systems CFO Central Forecasting Office CCl WMO Commission for Climatology CLICOM CLImate COMputing CLIPS Climate Information and Prediction Services DMCN Drought Monitoring Centre Nairobi DMCH Drought Monitoring Centre Harare DMS Djibouti Meteorological Service DRC Democratic Republic of Congo ECMWF European Centre for Medium Range Weather Forecasts ENSO El Niño – Southern Oscillation EOF Empirical Orthogonal Function FAR False Alarm Rate FEWS-NET Famine Early Warning Systems Network GAW Global Atmospheric Watch GCM General Circulation Model GHA Greater Horn of Africa GIS Geographic Information System GSN Global Surface Network GTS Global Telecommunication System GUAN Global Upper Air Network HHSS Heidke Hit Skill Score HR Hit Rate IMTR Institute of Meteorological Training and Research IRI International Research Institute for Climate Predictions ITCZ Inter-Tropical Convergence Zone KMD Kenya Meteorological Department LAM Limited Area Model LEPS Linear Error in Probability Space MCAT Mozambique Channel-Angola Trough MDD Meteorological Data Distribution MJO Madden Julian Oscillation NCEP National Centers for Environmental Prediction NGO Non-Governmental Organization NIWA National Institute of Water and Atmospheric Research NMHS National Meteorological and Hydrological Services NMS National Meteorological Services NMSA National Meteorological Services Agency NOAA-OGP National Oceanic and Atmospheric Administration - Office of Global Programs OAU-IBAR Organization of African Unity - Inter-African Bureau for Animal Resources OLR Outgoing Longwave Radiation OPAG Open Programme Area Group PP PowerPoint PR Permanent Representative QBO Quasi Biennial Oscillation QC Quality Control RCOF Regional Climate Outlook Forum RMSE Root mean square error RSM Regional Spectral Model ROC Relative (or Receiver) Operating Characteristic SARCOF Southern African Regional Climate Outlook Forum SAWS South African Weather Service SIP Seasonal to Interannual Prediction
57

SOI Southern Oscillation Index SOND September, October, November, December SST Sea Surface Temperature SVS WMO Standardized Verification System SWOT Strengths, Weaknesses, Opportunities and Threats UKMO United Kingdom Meteorological Office UNDP United Nations Development Programme WCAC World Climate Applications and CLIPS division under WCP WCASP World Climate Applications and Services Programme WCP World Climate Programme WCRP World Climate Research Programme WHOT? “What’s Happening Out There?” WMO World Meteorological Organization
58


![· Web view[Clips from Dirty Pretty Things, Amazing Grace, Eastern Promises, Hummingbird, Peaky Blinders and Locke] [Applause]](https://static.fdocuments.in/doc/165x107/5a9e62a17f8b9a71178b4b62/doc-viewclips-from-dirty-pretty-things-amazing-grace-eastern-promises-hummingbird.jpg)