REPORT OF IMCI HEALTH FACILITY SURVEY IN SOUTH …s3.amazonaws.com/zanran_storage/ · The role of...
32
Final - 050317 0 REPORT OF IMCI HEALTH FACILITY SURVEY IN SOUTH AFRICA
Transcript of REPORT OF IMCI HEALTH FACILITY SURVEY IN SOUTH …s3.amazonaws.com/zanran_storage/ · The role of...
Final - 050317
0
REPORT OF IMCI HEALTH FACILITY
SURVEY IN SOUTH AFRICA
Final - 050317
1
ABBREVIATIONS AARR: Average annual rate of reduction DHS: Demographic and Health Survey EC: Eastern Cape province FS: Free State province G: Gauteng province HFS: Health facility survey IMCI: Integrated Management of Childhood Illness Strategy IMR: Infant mortality rate ITHW: IMCI-trained health workers KZN: Kwa Zulú Natal province L: Limpopo province MIAA: Mean index of integrated assessment MDG: Millennium Development Goal MP: Mpumalanga province NC: Northern Cape province NDoH: National Department of Health NW: North West province ORS: Oral rehydration salts PMTCT: Preventing mother to child transmission of HIV SA: South Africa SADHS: South African Demographic and Health survey TOT.: Total WC: Western Cape province WHO: World Health Organisation WHO AFRO: WHO Regional office for Africa U5MR: Under-five mortality rate UNICEF: United Nations Children’s Fund
Final - 050317
2
EXECUTIVE SUMMARY Background In 1998 South Africa adopted IMCI as a strategy to reduce under five mortality . In 2001, 2002 and 2003 South Africa conducted IMCI health facility surveys in provinces that had completed 2 years of IMCI implementation - in 2001, surveys conducted in KwaZulu Natal, Mpumalanga, Limpopo and Northern Cape provinces; in 2002: surveys conducted in Gauteng, Western Cape and Free State provinces and in 2003, surveys in Eastern Cape and North West provinces. By 2003 all nine provinces had completed their IMCI surveys. Methods Cross sectional IMCI Health Facility Surveys (HFS) were conducted during 2001, 2002 and 2003 in facilities where at least one health worker had been trained in IMCI. The aim of the HFS was to determine the quality of care provided for sick chidren aged two to 59 months and t the availability of essential drugs, equipment, supplies and referral / communication systems to manage sick children. In 2001, 20 facilities were selected by each provincial health department, based on a geographical representation of facilities implementing IMCI. In 2002 and 2003 the NdoH randomly selected between 25 and 30 health facilities from each province. The number of facilities selected per district per province was proportionate to the percentage of facilities implementing IMCI within each district per province. Study participants were sick children aged two months to five years visiting a selected health facility for an initial sick visit. Any health worker (not only IMCI-trained health workers) managing sick children was observed. Surveyors, who were IMCI facilitators or course directors, conducted one of four tasks at each health facility, viz. (i) observation of case management of sick children (ii) exit interview with the caretaker (iii) re-examination of the child (by a skilled IMCI surveyor who was the Gold Standard) and (iv) health facility review. Data were entered into EPI-INFO version 6.04and analysed using a standardised WHO analysis programme. During data analysis various variables were created such as the mean index of integrated assessment (MIAA). The latter, measured on a scale of 1 to 10, showed whether children received a comprehensive assessment: the closer to 10 the score, the more comprehensive the assessment. Results • 215 health facilities were visited in total • case management of 693 sick children was observed • ITHW managed 92% of sick children in 2001; 90% in 2002 and 58% in
2003 Assessment • 59% (406/693) of children were checked for three general danger signs • 83% (496/598) of children were checked cough, diarrhoea and fever • 74% (494/670) of children had their weight checked against a growth chart • 58% (298/514) of children <2 years were assessed for feeding • 88% (608/693) of children had their vaccination status checked • 36% (141/396) of children were checked for visible severe wasting • 31% of children were checked for oedema • The MIAA ranged from 6.1 (in KZN) to 9.3 (in the Free State)
Final - 050317
3
• ITHW tended to perform a more comprehensive assessment than non-ITHW
Classification • Health worker ability to correctly classify children for general danger signs,
cough, diarrhoea and fever correctly varied from 33% to 77% Treatment • 55% of children needing urgent referral were identified and referred • 77% (102/133) of children with pneumonia were treated correctly • 57% (142/250) of children needing an antibiotic were prescribed the drug
correctly • 87% (348/401) of children not needing an antibiotic left the facility without
an antibiotic • 50% (104/209) of children needing vaccination were correctly vaccinated Counselling • In general counselling skills and caregiver understanding of counselling
were poor: o 46% (312/672) of caregivers were advised when to return immediately; o only 59% (48/81) of caregivers of children with low weight received
correct counselling o 34% (133/392) of caregivers of children with diarrhoea were advised to
give extra fluids and continue feeding o two-thirds of caregivers whose children were prescribed oral medication
knew how to give medication; Health Facility Support • 35% (76/215) of facilities had all seven essential oral drugs • 73% (158/215)of facilities had all the four essential vaccines available:
BCG,polio, DTP and measles • 57% (122/215) of facilities had all the essential equipment and supplies • 93% (199/215) of facilities had an IMCI chart booklet • Supervisory support was poor, with only 28% of facilities having received a
supervisory visit in the previous 6 months, which included observation of case management
Recommendations The role of IMCI as a key strategy to meet MDG4 should be emphasised. IMCI case management training • The expansion of IMCI case management training should occur in a manner
that optimizes the expected synergy between community and health facility-based interventions
• Expansion of case management training should saturate health facilities, thus avoiding a dilution of the effect of IMCI implementation
• The cost of IMCI case management training needs to be reviewed and possible alternatives to the current methods should be explored and field tested
• Case management training must pay particular attention to the issues raised in section 4.6 so that morbidity and mortality from common illnesses are reduced. Case management training should include aspects of HIV management, including managing children born to an HIV infected mother
Final - 050317
4
• In the interim, perhaps a health workers card highlighting the details relating to issues listed in section 4.6 could be printed so that health workers, even if not trained in the complete 11 day course can start to understand how children should be managed (i.e. what questions should be asked etc.)
Health system Support • The reasons for non-availability of drugs and essential supplies should be
investigated with a view to addressing barriers and ensuring that all facilities have the essential drugs, supplies and equipment needed to manage children
• An integrated supervisory system, together with appropriate resource allocation for supervision is needed
Final - 050317
5
1. BACKGROUND
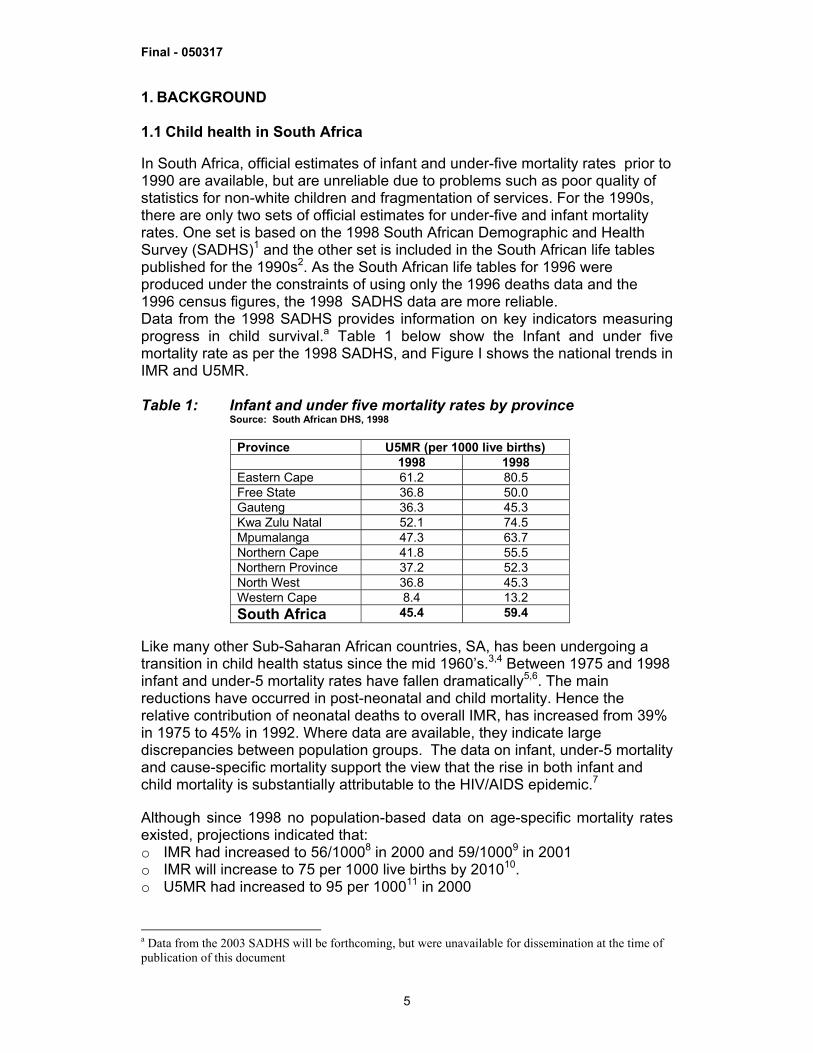
1.1 Child health in South Africa In South Africa, official estimates of infant and under-five mortality rates prior to 1990 are available, but are unreliable due to problems such as poor quality of statistics for non-white children and fragmentation of services. For the 1990s, there are only two sets of official estimates for under-five and infant mortality rates. One set is based on the 1998 South African Demographic and Health Survey (SADHS)1 and the other set is included in the South African life tables published for the 1990s2. As the South African life tables for 1996 were produced under the constraints of using only the 1996 deaths data and the 1996 census figures, the 1998 SADHS data are more reliable. Data from the 1998 SADHS provides information on key indicators measuring progress in child survival.a Table 1 below show the Infant and under five mortality rate as per the 1998 SADHS, and Figure I shows the national trends in IMR and U5MR. Table 1: Infant and under five mortality rates by province
Source: South African DHS, 1998
Province U5MR (per 1000 live births) 1998 1998 Eastern Cape 61.2 80.5 Free State 36.8 50.0 Gauteng 36.3 45.3 Kwa Zulu Natal 52.1 74.5 Mpumalanga 47.3 63.7 Northern Cape 41.8 55.5 Northern Province 37.2 52.3 North West 36.8 45.3 Western Cape 8.4 13.2 South Africa 45.4 59.4
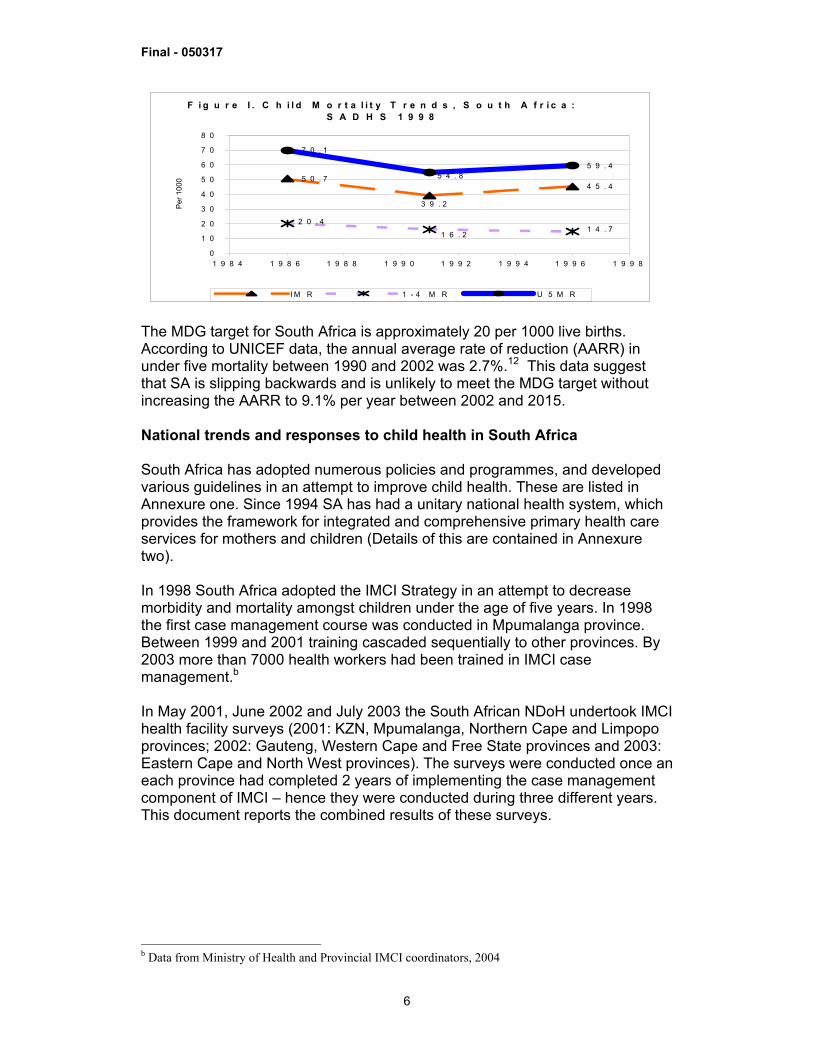
Like many other Sub-Saharan African countries, SA, has been undergoing a transition in child health status since the mid 1960’s.3,4 Between 1975 and 1998 infant and under-5 mortality rates have fallen dramatically5,6. The main reductions have occurred in post-neonatal and child mortality. Hence the relative contribution of neonatal deaths to overall IMR, has increased from 39% in 1975 to 45% in 1992. Where data are available, they indicate large discrepancies between population groups. The data on infant, under-5 mortality and cause-specific mortality support the view that the rise in both infant and child mortality is substantially attributable to the HIV/AIDS epidemic.7 Although since 1998 no population-based data on age-specific mortality rates existed, projections indicated that: o IMR had increased to 56/10008 in 2000 and 59/10009 in 2001 o IMR will increase to 75 per 1000 live births by 201010. o U5MR had increased to 95 per 100011 in 2000
a Data from the 2003 SADHS will be forthcoming, but were unavailable for dissemination at the time of publication of this document
Final - 050317
6
F i g u r e I . C h i l d M o r t a l i t y T r e n d s , S o u t h A f r i c a : S A D H S 1 9 9 8
5 0 . 74 5 . 4
7 0 . 1
5 9 . 4
3 9 . 2
1 6 . 2
2 0 . 41 4 . 7
5 4 . 8
0
1 0
2 0
3 0
4 0
5 0
6 0
7 0
8 0
1 9 8 4 1 9 8 6 1 9 8 8 1 9 9 0 1 9 9 2 1 9 9 4 1 9 9 6 1 9 9 8
Per 1
000
I M R 1 - 4 M R U 5 M R The MDG target for South Africa is approximately 20 per 1000 live births. According to UNICEF data, the annual average rate of reduction (AARR) in under five mortality between 1990 and 2002 was 2.7%.12 This data suggest that SA is slipping backwards and is unlikely to meet the MDG target without increasing the AARR to 9.1% per year between 2002 and 2015. National trends and responses to child health in South Africa South Africa has adopted numerous policies and programmes, and developed various guidelines in an attempt to improve child health. These are listed in Annexure one. Since 1994 SA has had a unitary national health system, which provides the framework for integrated and comprehensive primary health care services for mothers and children (Details of this are contained in Annexure two). In 1998 South Africa adopted the IMCI Strategy in an attempt to decrease morbidity and mortality amongst children under the age of five years. In 1998 the first case management course was conducted in Mpumalanga province. Between 1999 and 2001 training cascaded sequentially to other provinces. By 2003 more than 7000 health workers had been trained in IMCI case management.b In May 2001, June 2002 and July 2003 the South African NDoH undertook IMCI health facility surveys (2001: KZN, Mpumalanga, Northern Cape and Limpopo provinces; 2002: Gauteng, Western Cape and Free State provinces and 2003: Eastern Cape and North West provinces). The surveys were conducted once an each province had completed 2 years of implementing the case management component of IMCI – hence they were conducted during three different years. This document reports the combined results of these surveys.
b Data from Ministry of Health and Provincial IMCI coordinators, 2004
Final - 050317
7
2. METHODS The overall objective was to assess the quality of case management and the availability of drugs, supplies and services essential for managing sick children aged 2 months to five years in facilities implementing IMCI (defined as any facility with at least one health worker trained in IMCI). 2.1 Design The three surveys had a cross sectional design. 2.2 Sampling and sample size Only facilities that had at least one health worker trained in IMCI were included in the sampling frame. For the 2001 survey 20 facilities were selected by each province, based on a geographical representation of facilities implementing IMCI. In 2002 and 2003 the NdoH randomly selected between 25 and 30 health facilities from each province. The number of facilities selected per district was proportional to the number of facilities implementing IMCI in that district. Annexure two presents details of the districts and facilities included in the study 2.3 Selection of study population Sick children aged 2 months – 5 years, attending for an initial sick visit and whose caregivers consented to participating in the survey were enrolled. 2.4. Sample size In each of the health facilities, a maximum of 6 child/caretaker pairs were interviewed. This was based on a recommended subject sample of 6-8 to minimize the error margin to 10%. Sequential sampling of health facility survey attendees was done. Verbal consent was obtained from all caretakers. 2.5 Selection of Health workers Any health worker whether or not IMCI-trained, managing sick children on the day of the survey was eligible for observation. The surveyor observed whichever health worker/s managing the child or children enrolled in the survey. 2.6 Survey Instruments The four WHO generic HFS instruments were adapted for South Africa 2.7 Training of Supervisors and Surveyors A three-day training course, during the week prior to the survey, was conducted during each year, with support from WHO AFRO during 2001 and 2002. Training included practical sessions. The number of surveyors trained was as follows: 20 in 2001, 18 in 2002 and 15 in 2003. All the surveyors had been actively involved in IMCI as facilitators or supervisors. Reliability scores ranged from 83%-92% in 2001 and 2002 and 90-95% in 2003. 2.8 Data Collection Between two and three teams visited each province. Each survey team comprised three people (one surveyor for observation of case management, one for exit interview and re-examination – i.e. the Gold Standard and one for health facility review and enrolment of sick children). Each team appointed a supervisor and visited two facilities daily. 2.9 Data Processing and Analysis Data collection was completed in 5 days. EPIINFO 6.04 package was used for data entry and analysis. Staff from the National and Provincial Departments of Health, with technical assistance from WHO AFRO (and from WHO Geneva during 2001), conducted data entry and analysis.
Final - 050317
8
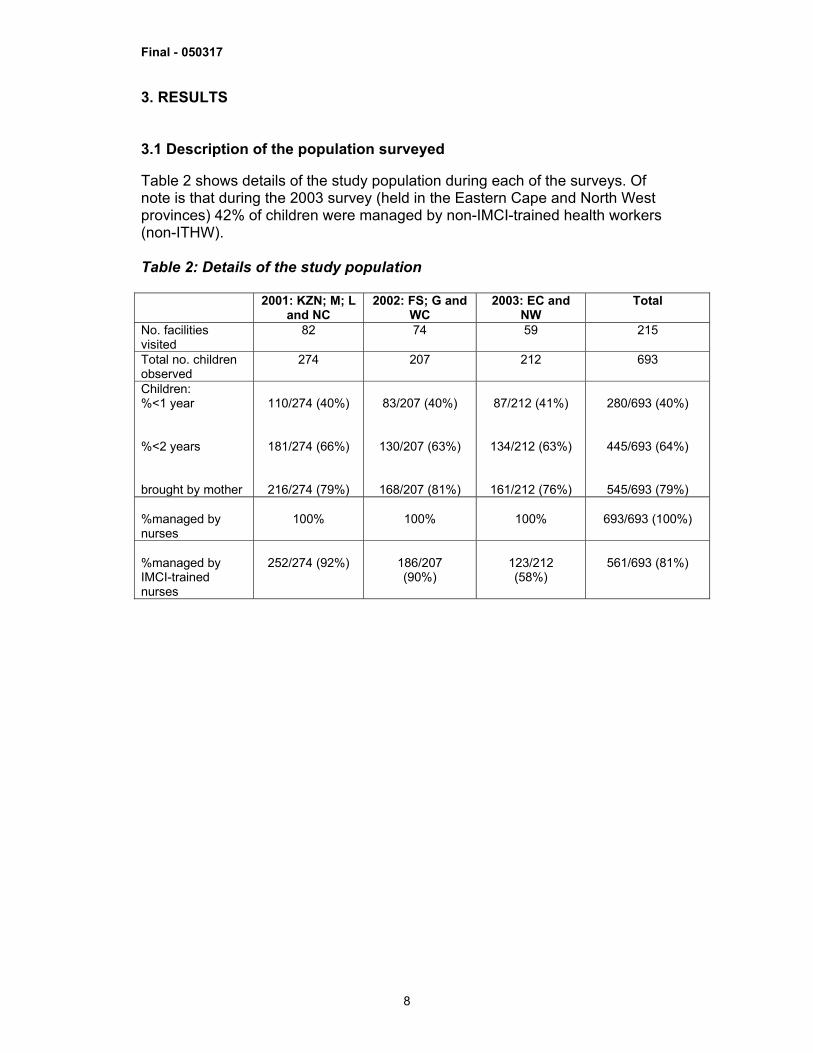
3. RESULTS 3.1 Description of the population surveyed Table 2 shows details of the study population during each of the surveys. Of note is that during the 2003 survey (held in the Eastern Cape and North West provinces) 42% of children were managed by non-IMCI-trained health workers (non-ITHW). Table 2: Details of the study population 2001: KZN; M; L
and NC 2002: FS; G and
WC 2003: EC and
NW Total
No. facilities visited
82
74
59 215
Total no. children observed
274 207 212 693
Children: %<1 year %<2 years brought by mother
110/274 (40%)
181/274 (66%)
216/274 (79%)
83/207 (40%)
130/207 (63%)
168/207 (81%)
87/212 (41%)
134/212 (63%)
161/212 (76%)
280/693 (40%)
445/693 (64%)
545/693 (79%) %managed by nurses
100%
100%
100%
693/693 (100%)
%managed by IMCI-trained nurses
252/274 (92%)
186/207 (90%)
123/212 (58%)
561/693 (81%)
Final - 050317
9
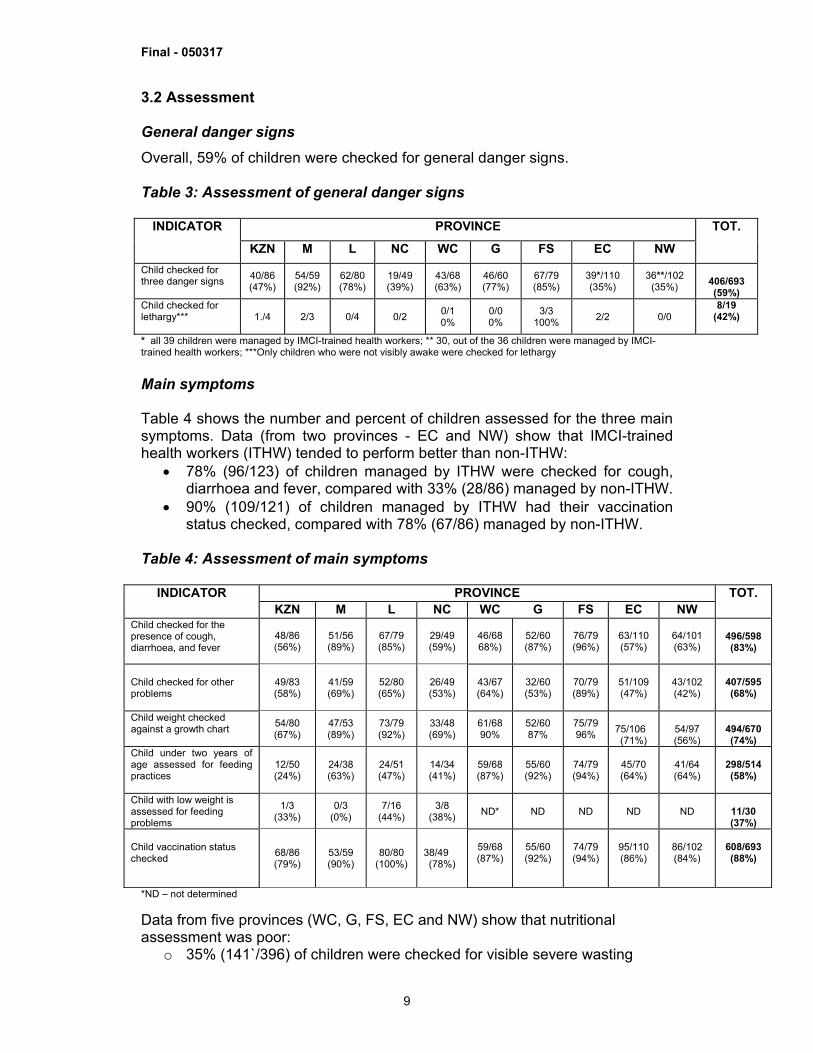
3.2 Assessment General danger signs Overall, 59% of children were checked for general danger signs. Table 3: Assessment of general danger signs
PROVINCE INDICATOR KZN M L NC WC G FS EC NW
TOT.
Child checked for three danger signs
40/86 (47%)
54/59 (92%)
62/80 (78%)
19/49 (39%)
43/68 (63%)
46/60 (77%)
67/79 (85%)
39*/110 (35%)
36**/102 (35%)
406/693 (59%)
Child checked for lethargy***
1./4 2/3 0/4 0/2 0/1 0%
0/0 0%
3/3 100% 2/2 0/0
8/19 (42%)
* all 39 children were managed by IMCI-trained health workers; ** 30, out of the 36 children were managed by IMCI-trained health workers; ***Only children who were not visibly awake were checked for lethargy Main symptoms Table 4 shows the number and percent of children assessed for the three main symptoms. Data (from two provinces - EC and NW) show that IMCI-trained health workers (ITHW) tended to perform better than non-ITHW:
• 78% (96/123) of children managed by ITHW were checked for cough, diarrhoea and fever, compared with 33% (28/86) managed by non-ITHW.
• 90% (109/121) of children managed by ITHW had their vaccination status checked, compared with 78% (67/86) managed by non-ITHW.
Table 4: Assessment of main symptoms
*ND – not determined Data from five provinces (WC, G, FS, EC and NW) show that nutritional assessment was poor:
o 35% (141`/396) of children were checked for visible severe wasting
PROVINCE INDICATOR KZN M L NC WC G FS EC NW
TOT.
Child checked for the presence of cough, diarrhoea, and fever
48/86 (56%)
51/56 (89%)
67/79 (85%)
29/49 (59%)
46/68 68%)
52/60 (87%)
76/79 (96%)
63/110 (57%)
64/101 (63%)
496/598 (83%)
Child checked for other problems
49/83 (58%)
41/59 (69%)
52/80 (65%)
26/49 (53%)
43/67 (64%)
32/60 (53%)
70/79 (89%)
51/109 (47%)
43/102 (42%)
407/595 (68%)
Child weight checked against a growth chart 54/80
(67%) 47/53 (89%)
73/79 (92%)
33/48 (69%)
61/68 90%
52/60 87%
75/79 96%
75/106 (71%)
54/97 (56%)
494/670 (74%)
Child under two years of age assessed for feeding practices
12/50 (24%)
24/38 (63%)
24/51 (47%)
14/34 (41%)
59/68 (87%)
55/60 (92%)
74/79 (94%)
45/70 (64%)
41/64 (64%)
298/514 (58%)
Child with low weight is assessed for feeding problems
1/3 (33%)
0/3 (0%)
7/16 (44%)
3/8 (38%)
ND*
ND
ND
ND
ND
11/30 (37%)
Child vaccination status checked 68/86
(79%) 53/59 (90%)
80/80 (100%)
38/49 (78%)
59/68 (87%)
55/60 (92%)
74/79 (94%)
95/110 (86%)
86/102 (84%)
608/693 (88%)
Final - 050317
10
o 41% (172/416) of children were checked for palmar pallour and o 31% (129/419) of children were checked for oedema
However, data (from two provinces - EC and NW) show that more children managed by ITHW had their weight plotted on a Road to Health Chart, compared with children managed by a non-ITHW. During data analysis a variable called the “index of integrated assessment” was created. Ten tasks contributed to this integrated assessment, namely, checking for: three danger signs, diarrhoea, cough, fever, palmar pallor, vaccination status, child’s weight and whether weight was plotted against the RTHC. For each child observed a score of 1 was allocated every time a task was performed. Hence the integrated assessment for each child observed was scored out of 10. This variable is important because it describes whether a child was assessed for danger signs as well as all the common symptoms of childhood illnesses. The higher the score the more complete the assessment, and less likely that other symptoms (which may not be the presenting complaint) are missed. Table 5 shows that the arithmetic mean of 10 tasks performed for each child ranged from 6.1 to 9.3. Table 5: Index of Integrated Assessment by Province
PROVINCE INDICATOR KZN M L NC WC G FS EC NW
Crude MIAA for
9 provinces
Arithmetic mean of 10 tasks performed for each child
6.1 8.4 8.4 6.5 7,8 8,8 9,3
6.5
6.8
7.6
Table 6 shows that IMCI-trained health workers tended to provide a more integrated / comprehensive assessment than non-IMCI trained health workers.
Final - 050317
11
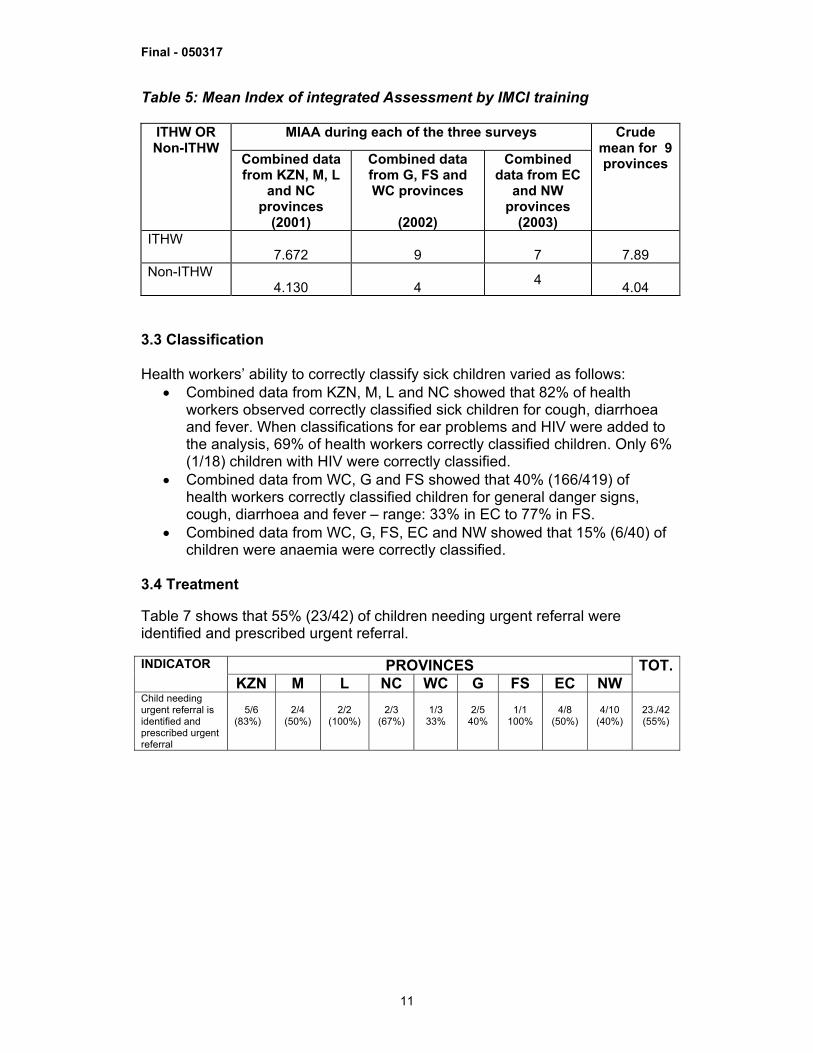
Table 5: Mean Index of integrated Assessment by IMCI training
MIAA during each of the three surveys ITHW OR Non-ITHW
Combined data from KZN, M, L
and NC provinces
(2001)
Combined data from G, FS and WC provinces
(2002)
Combined data from EC
and NW provinces
(2003)
Crude mean for 9 provinces
ITHW 7.672
9
7
7.89
Non-ITHW 4.130
4 4
4.04 3.3 Classification Health workers’ ability to correctly classify sick children varied as follows:
• Combined data from KZN, M, L and NC showed that 82% of health workers observed correctly classified sick children for cough, diarrhoea and fever. When classifications for ear problems and HIV were added to the analysis, 69% of health workers correctly classified children. Only 6% (1/18) children with HIV were correctly classified.
• Combined data from WC, G and FS showed that 40% (166/419) of health workers correctly classified children for general danger signs, cough, diarrhoea and fever – range: 33% in EC to 77% in FS.
• Combined data from WC, G, FS, EC and NW showed that 15% (6/40) of children were anaemia were correctly classified.
3.4 Treatment Table 7 shows that 55% (23/42) of children needing urgent referral were identified and prescribed urgent referral.
PROVINCES INDICATOR KZN M L NC WC G FS EC NW
TOT.
Child needing urgent referral is identified and prescribed urgent referral
5/6
(83%)
2/4
(50%)
2/2
(100%)
2/3
(67%)
1/3
33%
2/5
40%
1/1
100%
4/8
(50%)
4/10
(40%)
23./42 (55%)
Final - 050317
12
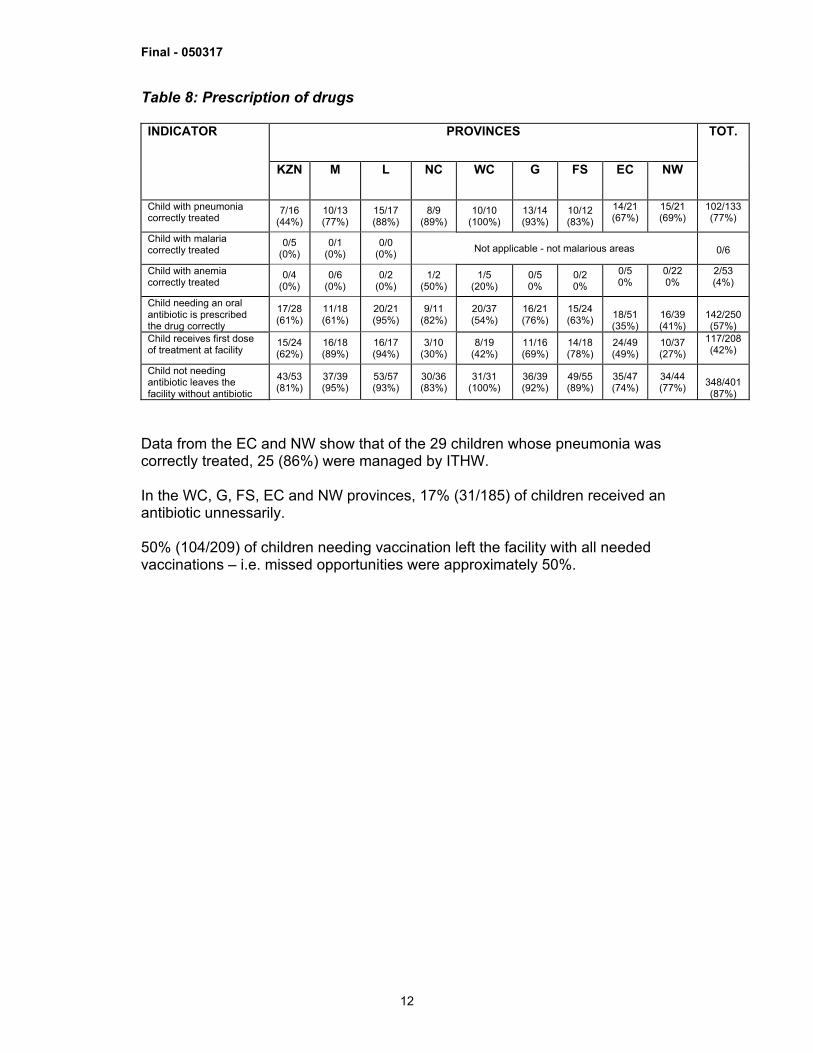
Table 8: Prescription of drugs
PROVINCES INDICATOR
KZN
M
L NC WC G FS EC NW
TOT.
Child with pneumonia correctly treated
7/16 (44%)
10/13 (77%)
15/17 (88%)
8/9 (89%)
10/10 (100%)
13/14 (93%)
10/12 (83%)
14/21 (67%)
15/21 (69%)
102/133 (77%)
Child with malaria correctly treated
0/5 (0%)
0/1 (0%)
0/0 (0%) Not applicable - not malarious areas
0/6
Child with anemia correctly treated
0/4 (0%)
0/6 (0%)
0/2 (0%)
1/2 (50%)
1/5 (20%)
0/5 0%
0/2 0%
0/5 0%
0/22 0%
2/53 (4%)
Child needing an oral antibiotic is prescribed the drug correctly
17/28 (61%)
11/18 (61%)
20/21 (95%)
9/11 (82%)
20/37 (54%)
16/21 (76%)
15/24 (63%)
18/51 (35%)
16/39 (41%)
142/250 (57%)
Child receives first dose of treatment at facility
15/24 (62%)
16/18 (89%)
16/17 (94%)
3/10 (30%)
8/19 (42%)
11/16 (69%)
14/18 (78%)
24/49 (49%)
10/37 (27%)
117/208 (42%)
Child not needing antibiotic leaves the facility without antibiotic
43/53 (81%)
37/39 (95%)
53/57 (93%)
30/36 (83%)
31/31 (100%)
36/39 (92%)
49/55 (89%)
35/47 (74%)
34/44 (77%)
348/401 (87%)
Data from the EC and NW show that of the 29 children whose pneumonia was correctly treated, 25 (86%) were managed by ITHW. In the WC, G, FS, EC and NW provinces, 17% (31/185) of children received an antibiotic unnessarily. 50% (104/209) of children needing vaccination left the facility with all needed vaccinations – i.e. missed opportunities were approximately 50%.
Final - 050317
13
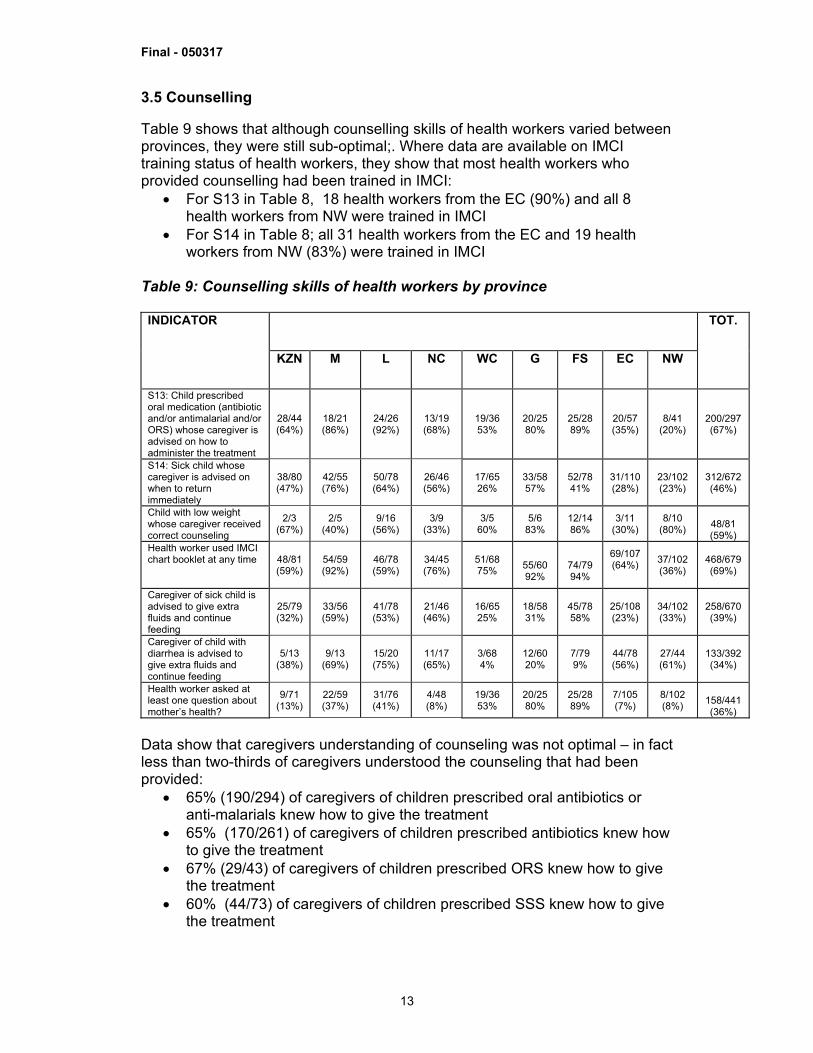
3.5 Counselling Table 9 shows that although counselling skills of health workers varied between provinces, they were still sub-optimal;. Where data are available on IMCI training status of health workers, they show that most health workers who provided counselling had been trained in IMCI:
• For S13 in Table 8, 18 health workers from the EC (90%) and all 8 health workers from NW were trained in IMCI
• For S14 in Table 8; all 31 health workers from the EC and 19 health workers from NW (83%) were trained in IMCI
Table 9: Counselling skills of health workers by province
INDICATOR
KZN
M
L NC WC G FS EC NW
TOT.
S13: Child prescribed oral medication (antibiotic and/or antimalarial and/or ORS) whose caregiver is advised on how to administer the treatment
28/44 (64%)
18/21 (86%)
24/26 (92%)
13/19 (68%)
19/36 53%
20/25 80%
25/28 89%
20/57 (35%)
8/41 (20%)
200/297 (67%)
S14: Sick child whose caregiver is advised on when to return immediately
38/80 (47%)
42/55 (76%)
50/78 (64%)
26/46 (56%)
17/65 26%
33/58 57%
52/78 41%
31/110 (28%)
23/102 (23%)
312/672 (46%)
Child with low weight whose caregiver received correct counseling
2/3 (67%)
2/5 (40%)
9/16 (56%)
3/9 (33%)
3/5 60%
5/6 83%
12/14 86%
3/11 (30%)
8/10 (80%)
48/81 (59%)
Health worker used IMCI chart booklet at any time 48/81
(59%) 54/59 (92%)
46/78 (59%)
34/45 (76%)
51/68 75%
55/60 92%
74/79 94%
69/107 (64%)
37/102 (36%)
468/679 (69%)
Caregiver of sick child is advised to give extra fluids and continue feeding
25/79 (32%)
33/56 (59%)
41/78 (53%)
21/46 (46%)
16/65 25%
18/58 31%
45/78 58%
25/108 (23%)
34/102 (33%)
258/670 (39%)
Caregiver of child with diarrhea is advised to give extra fluids and continue feeding
5/13 (38%)
9/13 (69%)
15/20 (75%)
11/17 (65%)
3/68 4%
12/60 20%
7/79 9%
44/78 (56%)
27/44 (61%)
133/392 (34%)
Health worker asked at least one question about mother’s health?
9/71 (13%)
22/59 (37%)
31/76 (41%)
4/48 (8%)
19/36 53%
20/25 80%
25/28 89%
7/105 (7%)
8/102 (8%)
158/441 (36%)
Data show that caregivers understanding of counseling was not optimal – in fact less than two-thirds of caregivers understood the counseling that had been provided:
• 65% (190/294) of caregivers of children prescribed oral antibiotics or anti-malarials knew how to give the treatment
• 65% (170/261) of caregivers of children prescribed antibiotics knew how to give the treatment
• 67% (29/43) of caregivers of children prescribed ORS knew how to give the treatment
• 60% (44/73) of caregivers of children prescribed SSS knew how to give the treatment
Final - 050317
14
• 45% (302/671) of caregivers knew at least 2 signs for seeking care immediately
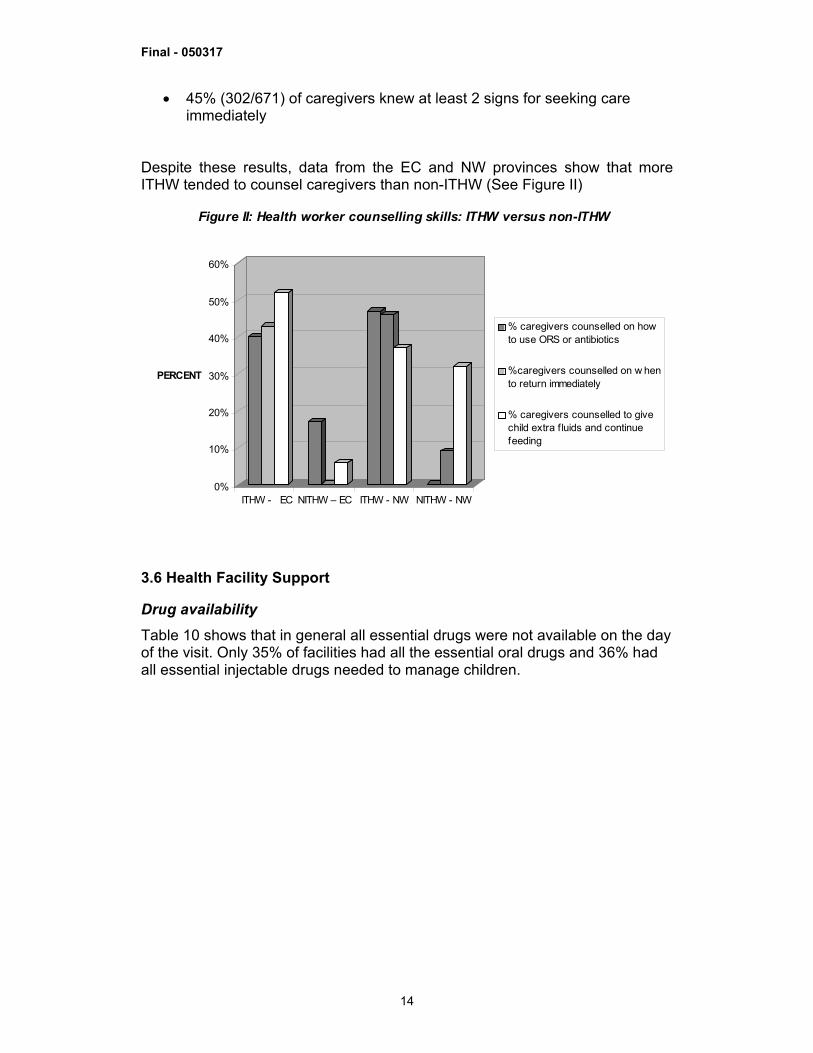
Despite these results, data from the EC and NW provinces show that more ITHW tended to counsel caregivers than non-ITHW (See Figure II)
0%
10%
20%
30%
40%
50%
60%
PERCENT
ITHW - EC NITHW – EC ITHW - NW NITHW - NW
Figure II: Health worker counselling skills: ITHW versus non-ITHW
% caregivers counselled on howto use ORS or antibiotics
%caregivers counselled on w hento return immediately
% caregivers counselled to givechild extra f luids and continuefeeding
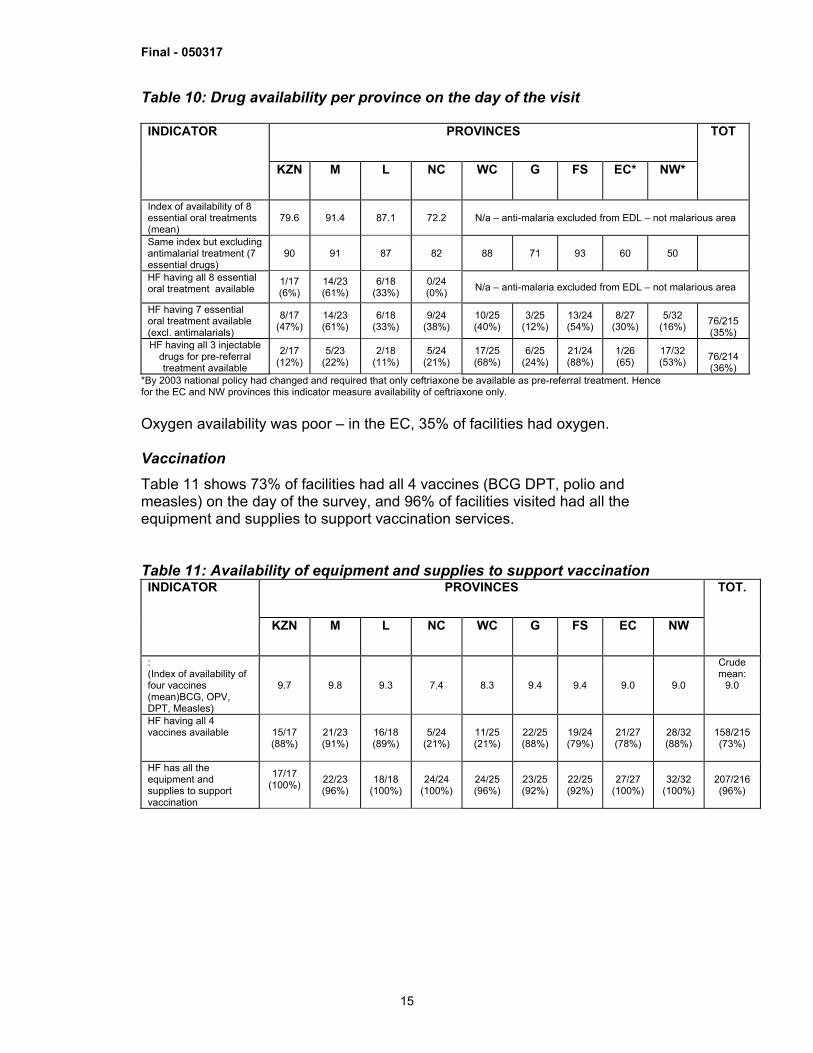
3.6 Health Facility Support Drug availability Table 10 shows that in general all essential drugs were not available on the day of the visit. Only 35% of facilities had all the essential oral drugs and 36% had all essential injectable drugs needed to manage children.
Final - 050317
15
Table 10: Drug availability per province on the day of the visit
PROVINCES INDICATOR
KZN
M
L NC WC G FS EC* NW*
TOT
Index of availability of 8 essential oral treatments (mean)
79.6 91.4 87.1 72.2 N/a – anti-malaria excluded from EDL – not malarious area
Same index but excluding antimalarial treatment (7 essential drugs)
90 91 87 82 88 71 93 60 50
HF having all 8 essential oral treatment available
1/17 (6%)
14/23 (61%)
6/18 (33%)
0/24 (0%) N/a – anti-malaria excluded from EDL – not malarious area
HF having 7 essential oral treatment available (excl. antimalarials)
8/17 (47%)
14/23 (61%)
6/18 (33%)
9/24 (38%)
10/25 (40%)
3/25 (12%)
13/24 (54%)
8/27 (30%)
5/32 (16%)
76/215 (35%)
HF having all 3 injectable drugs for pre-referral treatment available
2/17 (12%)
5/23 (22%)
2/18 (11%)
5/24 (21%)
17/25 (68%)
6/25 (24%)
21/24 (88%)
1/26 (65)
17/32 (53%)
76/214 (36%)
*By 2003 national policy had changed and required that only ceftriaxone be available as pre-referral treatment. Hence for the EC and NW provinces this indicator measure availability of ceftriaxone only. Oxygen availability was poor – in the EC, 35% of facilities had oxygen. Vaccination Table 11 shows 73% of facilities had all 4 vaccines (BCG DPT, polio and measles) on the day of the survey, and 96% of facilities visited had all the equipment and supplies to support vaccination services. Table 11: Availability of equipment and supplies to support vaccination
PROVINCES INDICATOR
KZN
M
L NC WC G FS EC NW
TOT.
: (Index of availability of four vaccines (mean)BCG, OPV, DPT, Measles)
9.7 9.8 9.3 7.4 8.3 9.4 9.4 9.0 9.0
Crude mean:
9.0
HF having all 4 vaccines available 15/17
(88%) 21/23 (91%)
16/18 (89%)
5/24 (21%)
11/25 (21%)
22/25 (88%)
19/24 (79%)
21/27 (78%)
28/32 (88%)
158/215 (73%)
HF has all the equipment and supplies to support vaccination
17/17 (100%)
22/23 (96%)
18/18 (100%)
24/24 (100%)
24/25 (96%)
23/25 (92%)
22/25 (92%)
27/27 (100%)
32/32 (100%)
207/216 (96%)
Final - 050317
16
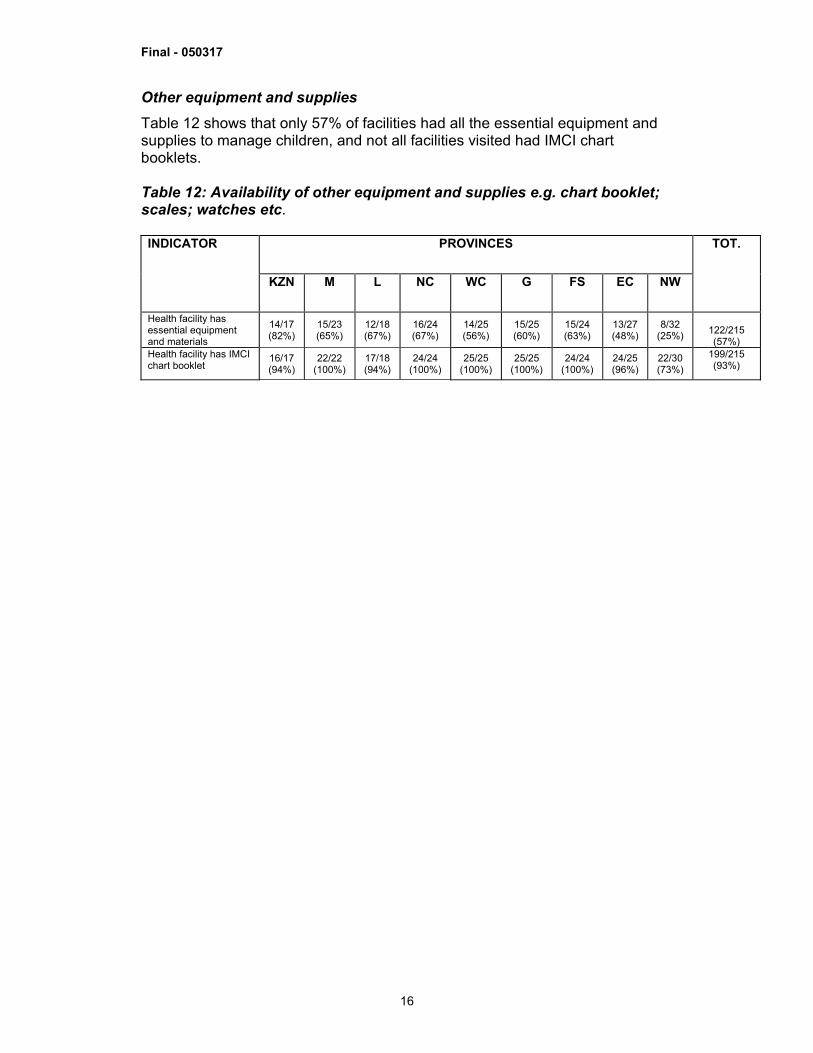
Other equipment and supplies Table 12 shows that only 57% of facilities had all the essential equipment and supplies to manage children, and not all facilities visited had IMCI chart booklets. Table 12: Availability of other equipment and supplies e.g. chart booklet; scales; watches etc.
PROVINCES INDICATOR
KZN
M
L NC WC G FS EC NW
TOT.
Health facility has essential equipment and materials
14/17 (82%)
15/23 (65%)
12/18 (67%)
16/24 (67%)
14/25 (56%)
15/25 (60%)
15/24 (63%)
13/27 (48%)
8/32 (25%)
122/215 (57%)
Health facility has IMCI chart booklet
16/17 (94%)
22/22 (100%)
17/18 (94%)
24/24 (100%)
25/25 (100%)
25/25 (100%)
24/24 (100%)
24/25 (96%)
22/30 (73%)
199/215 (93%)
Final - 050317
17
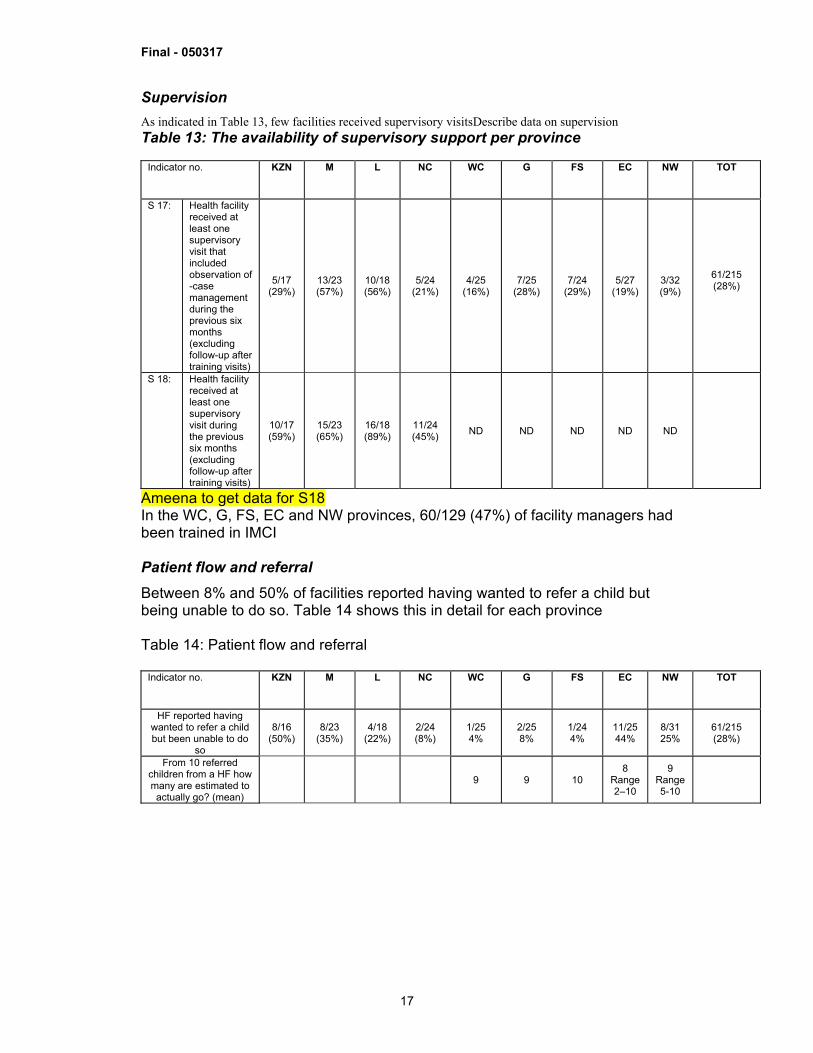
Supervision As indicated in Table 13, few facilities received supervisory visitsDescribe data on supervision Table 13: The availability of supervisory support per province
Indicator no. KZN
M
L NC WC G FS EC NW TOT
S 17: Health facility received at least one supervisory visit that included observation of -case management during the previous six months (excluding follow-up after training visits)
5/17 (29%)
13/23 (57%)
10/18 (56%)
5/24 (21%)
4/25 (16%)
7/25 (28%)
7/24 (29%)
5/27 (19%)
3/32 (9%)
61/215 (28%)
S 18: Health facility received at least one supervisory visit during the previous six months (excluding follow-up after training visits)
10/17 (59%)
15/23 (65%)
16/18 (89%)
11/24 (45%) ND ND ND ND ND
Ameena to get data for S18 In the WC, G, FS, EC and NW provinces, 60/129 (47%) of facility managers had been trained in IMCI Patient flow and referral Between 8% and 50% of facilities reported having wanted to refer a child but being unable to do so. Table 14 shows this in detail for each province Table 14: Patient flow and referral
Indicator no. KZN
M
L NC WC G FS EC NW TOT
HF reported having wanted to refer a child but been unable to do
so
8/16 (50%)
8/23 (35%)
4/18 (22%)
2/24 (8%)
1/25 4%
2/25 8%
1/24 4%
11/25 44%
8/31 25%
61/215 (28%)
From 10 referred children from a HF how many are estimated to actually go? (mean)
9 9 10 8
Range 2–10
9 Range 5-10
Final - 050317
18
4. DISCUSSION AND IMPLICATIONS OF THE FINDINGS The discussion below is presented in the context of achieving MDG 4, taking cognizance of data which show that South Africa requires to increase efforts in order to meet MDG 4. Of note is that no national baseline survey was done prior to IMCI implementation. However a baseline survey had been conducted in the Western Cape province. Furthermore, neither the 2001 or 2002 or 2003 surveys had been set up to measure the difference in case management between children managed by IMCI-trained versus non-IMCI-trained health workers. 4.1 Methodological issues This survey was a cross-sectional study that observed health workers. Data collected by observation have inherent biases, including subjectivity on the part of the “observer”, or altered behaviour on the part of the “observed”. It may be speculated that direct observation may have introduced some bias, resulting in overall better performance than is the actual situation during regular consultations. 4.2 The study population Most children were under the age of 2 years, and had one or more conditions that could be managed by IMCI. This reaffirms the fact that, despite the transition in child health status in South Africa, IMCI is still relevant for the management of sick children in South Africa. Except for the 2003 survey, IMCI-trained health workers managed most children. 4.3 Assessment In general the assessment skills of health workers need to be improved – health workers performed between 6 and 9 tasks (out of 10 tasks) when assessing a sick child. Data from section 3.2 show that various aspects of assessment are lacking:
• 59% of children were checked for general danger signs (range: 35% to 92%0
• 42% of children who were not visible awake were checked for lethargy • 83% of children were checked for cough, diarrhoea and fever (range:
56%-96%) • 88% of children had their vaccination status checked (range: 79%-100%)
In the 2001 survey, surveyors identified 10 areas that were inadequately assessed by health workers. These include palmar pallor, visible severe wasting, neck stiffness, fast breathing, bulging fontanelle and chest indrawing. A baseline survey conducted in the WC province prior to IMCI implementation found that <20% of children were checked for cough, diarrhoea and fever; hence the 68% (data from WC) and 83% (pooled data from all provinces) found in this study documents an improvement post IMCI implementation.13 However in order to improve child health care and decrease morbidity from common illnesses, it is essential that assessment skills be improved so that 100% of children are assessed for all the common symptoms of childhood illness.
Final - 050317
19
Of grave concern is the poor assessment for nutrition:
• 74% of children had their weight checked against a growth chart • 58% of children under two years were assessed for feeding practices
(range: 24%-94%) • Less that 45% of children were checked for visible severe wasting,
palmar pallour or oedema The importance of comprehensive assessment cannot be overemphasised: Data from a descriptive hospital-based study conducted in the NW province of South Africa found that at least 83% of deaths were associated with avoidable factors relating to administration or management at primary health care level. 14 The main causes of death were lower respiratory tract infections (31.4%), AIDS (21.3%) and sepsis (13.4%). When adding all causes of death and contributing conditions, 61.9% were AIDS- or HIV-related. Priority problems identified were case management of lower respiratory tract infections, failure to thrive or malnutrition, and insufficient documentation of patient care. Hence, it is crucial that all children at primary health care faciities are appropriately assessed for all the common symptoms of childhood illness so that no treatable or preventable condition is missed. The reasons for the poor assessment of children need to be ascertained – bearing in mind that, with the exception of the 2003 survey, most health workers had been trained in IMCI case management. 4.2 Classification Poor assessment skills may be one of the reasons why health workers did not correctly classify children. However, It is unlikely that poor classification was solely due to poor assessment. Of particular concern is that few health workers correctly classified children for HIV or anaemia. Incorrect or omitted classifications have grave consequences, as the child will not be treated for these illnesses. This will increase morbidity and mortality from these illnesses. 4.3 Treatment Only 55% (23/42) children who needed urgent referral were identified and prescribed urgent referral. It can be speculated that this may have been because, as observed by surveyors, the main omissions in assessment related to poor assessment of signs that point to severe illness – such as bulging fontanelle and chest indrawing. With regards to drug prescription and use, just over half of the children were prescribed oral antibiotics correctly, and less than half of the children who needed treatment received their first dose at the health facility. Correct prescription of antibiotics is important so that treatment is initiated as son as posible and morbidity and mortality are minimised. Few children with anaemia were correctly treated – hence this needs to be emphasised in future courses.
Final - 050317
20
There were no unnecessary prescription of antibiotics in the Western Cape province; unnecessary prescription of antibiotics was 17% for the pooled data from WC, G, FS, EC and NW. This compares favourably with the baseline Western Cape data15 which found that 55% of consultations resulted in the prescription of antibiotics, and 47% of these prescriptions were unnecessary. Of grave concern is the number of missed immunisation opportunities. The target coverage for full immunisation in South Africa is 90%.16 Furthermore, South Africa is committed to measles elimination and polio eradication. The count down to measles elimination is occurring against a backdrop of an increased number of measles cases and deaths since 200317; hence it is of paramount importance that missed immunisation opportunities are reduced to 0%.
4.4 Counselling Data from all provinces show that counselling skills are sub-optimal. The following are of particular concerní:
• two-thirds of caregivers whose children were prescribed oral medication knew how to give medication;
• 46% of caregivers were advised when to return immediately; • only 59% of caregivers of children with low weight received correct
counselling • 34% of caregivers of children with diarrhoea were advised to give extra
fluids and continue feeding The baseline survey in the Western Cape province found that:
• Only 25% of health workers counseled caregivers on the use of medication prescribed
• Less then 20% of health workers advised caregivers when to return immediately
Although the results from this study compares favourably with the baseline data from the Western Cape Province, counselling skills should be improved so that ALL caregivers are counselled about home treatment of illness. Counselling about home treatment of illness is a key step in the management of sick children, as appropriate home treatment can prevent severe morbidity and mortality. Data from the EC and NW provinces suggests that IMCI training is beneficial for counselling. It is likely that when heath worker counselling skills are improved, then caregiver understanding of counselling will improbé.
Final - 050317
21
4.5 Health Facility equipment and supplies The limited availability of essential drugs, equipment and supplies to manage sick children begs many questions about the health system: Why did only 35% of facilities have all the essential oral drugs? Was there a transport problem? or a problem relating to communicating with stores? These reasons need to be ascertained. However, it should be realized that health system constraints to IMCI implementation relate to the delivery system for health care, and thus extends beyond the scope of child heath only. They need to be addressed in an wholistic manner for all health programmes or interventions. The lack of adequate supervisión needs attention (get results from Bamford et al and comment on supervisión and posible reasons for poor supervisión.). Furthermore the lack of managerial support for IMCI is evident from the small [ercentage of managers who have been 4.6 Implications of these results Get data from Lucy Wagstaff study on feasibility of IMCI implementation in Gauteng The data provides a snap shot of the quality of case management of sick children at public health facilities and other health system issues relating to the management of sick children. If South Africa were to meet MDG 4 then efforts to decrease under five and infant mortality need to intensify. Data from other countries show that when public health programmes are planned, implemented and assessed well, they can make a difference. There is no doubt that IMCI is an intervention that can contribute towards decreasing under five mortality18. There is also no doubt that training of health workers in IMCI produces positive effects if the training includes clinical practice, sufficient facilitators and use of materials relevant to local culture and language.19 The surveys show that despite the training of health workers and managers, gaps and defiencies exist in assessing, classifying and managing sick children. The health facility surveys did not determine the reasons for these. However, results from other studies (quote Bamford and Wagstaff) show that IMCI, as a delivery system for improving coverage of child survival interventions, is facing key challenges. These are listed below: 2. The high cost of case management training – alternate ways of training need
to be field tested, to ensure that the quality of training is maintained 3. A possible piece meal implementation style of the three components of IMCI
and which has resulted in low coverage of facilities with IMCI-trained health workers: Although 49 out of 53 districts in South Africa are implementing
Final - 050317
22
IMCI, implementation is piece-meal, and most facilities and districts are not saturated with IMCI-trained health workers; hence IMCI-trained health workers are dispersed throughout the health system and have little synergistic effect to impact on how sick children are managed.
4. Health system constraints – including supply of drugs and equipment. These constraints extend beyond the realm of work of the IMCI practitioner and need to be discussed at district and provincial levels.
As a priorty the following skills of health workers need to be improved so that progress towards meeting MDG4 is accelerated:
• Clinical assessment skills, especially: o Assessing for general danger signs o Assessing for difficult breathing or cough o Assessing nutrition – including feeding; oedema; visible severe
wasting and checking for anaemia • Interpretation of clinical findings • Treatment, including:
o Management of children with pneumonia, diarrhoea, malnutrition and anaemia
o Management of children with HIV infection or children born to HIV positive women
5. RECOMMENDATIONS The role of IMCI as a key strategy to meet MDG4 should be emphasised. IMCI case management training • The expansion of the IMCI case management training should occur in a
manner that optimizes the expected synergy between community and health facility-based interventions
• Expansion of case management training should saturate health facilities, thus avoiding a dilution of the effect of IMCI implementation
• The cost of IMCI case management training needs to be reviewed and possible alternatives to the current methods should be explored and field tested
• Case management training must pay particular attention to the issues raised in section 4.6 so that morbidity and mortality from common illnesses are reduced. Case management training should include aspects of HIV management, including managing children born to an HIV infected mother
• In the interim, perhaps a health workers card highlighting the details relating to issues listed in section 4.6 could be printed so that health workers, even if not trained in the complete 11 day course can start to understand how children should be managed (i.e. what questions should be asked etc.)
Health system Support • The reasons for non-availability of drugs and essential supplies should be
investigated with a view to addressing barriers and ensuring that all facilities
Final - 050317
23
have the essential drugs, supplies and equipment needed to manage children
• An integrated supervisory system, together with appropriate resource allocation for supervision is needed
Final - 050317
24
ANNEX ANNEXURE ONE: POLICIES, PROGRAMMES AND GUIDELINES
RELEVANT TO CHILD HEALTH Key Strategies and Programmes relevant to Child Health
o The Integrated Management of Childhood illness Strategy (IMCI) o Prevention of Mother to Child Transmission of HIV (pMTCT) o Perinatal Problem Identification Programme (PPIP) o The Expanded Programme on Immunisation, SA (EPISA) o The Integrated Nutrition Programme (INP)
Child Health Policies and Guidelines Relevant for Children Under the Age of 5 Years - SA Policies: • Draft: Child Health Policy and Implementation Guidelines • Draft: Infant and Young Child Feeding Policy • Draft: Policy Framework for non-communicable chronic conditions in children • Policy Guidelines for the Management and Prevention of Genetic Disorders, Birth Defects, and
Disabilities • Draft: National Policy Framework for Child Abuse • National Health Policy Guidelines for Improved Mental health in South Africa • Policy Guidelines for Child and Adolescent Mental Health • National Rehabilitation Policy Strategies and Guidelines (excluding training packages) • Comprehensive Primary Health Care Package + Norms and Standards • District Hospital Service Package for South Africa • Draft Maternal and Neonatal Strategy • SA Breastfeeding Guidelines for Health Workers • Guidelines for Nutrition Interventions at Health Facilities to Manage and Prevent Child Malnutrition • PMTCT Protocol for Pilot Sites • Expanded Programme on Immunisation (South Africa) – Immunisation Schedule and Fact Sheets • Integrated Management of Childhood Illness Strategy: Case Management Guidelines • National Guidelines on Palliative Care for Children • Draft: Guidelines for health care providers managing suspected child abuse, neglect and
exploitation • HIV and / or AIDS: Strategic Plan of the National Department of Health: 2000-2005 • Comprehensive Treatment Plan for HIV and AIDS • Management of Diabetes Type I in children (<18 years) at hospital level • Management of Asthma in Children • National Guidelines on Primary Prevention and Prophylaxis of Rheumatic Fever and Rheumatic
Heart Disease for Health Professionals at primary level
Final - 050317
25
Annexure two: Government responses fo improve child health Free health care for children under the age of 6 years was implemented in 1994. The National Health Bill20 reiterates Government’s commitment to providing free health care to children below the age of six years and children with disabilities, who are not medical aid scheme members or beneficiaries. National, provincial and district directorates or offices, of the Department of Health (DoH), that focus on maternal and child health are responsible, respectively, for: (i) developing national goals, objectives, indicators and policies, monitoring the attainment of national objectives and programme implementation and providing support to provinces (ii) developing provincial goals and Indicators, monitoring the attainment thereof and monitoring programme implementation - including providing support to districts and (iii) programme implementation and monitoring thereof
Final - 050317
26
Annexure three: Districts and facilities included in the IMCI Health facility surveys Table 3.1. Districts visited during the 2001 survey
Province District Enhlanzeni Mpumalanga Ekangala Lower Umfolozi Ndwedwe Okhamlamba Ugu Uthukela
Kwa Zulu Natal
Halegratz NMTTS PPMMMC
Limpopo Province
Diamond Fields Northern Cape Lower Orange
Final - 050317
27
Table 3.2: Districts and facilities visited in the Free State during 2002
Table 3.3: Districts and facilities visited in Gauteng province during 200 2 REGION A REGION B (EKURHULENI) and
(SEDIBENG) REGION C (TSHWANE)
Lillian Ngoyi C.H.C Discovery C.H.C Itireleng clinic Zola C.H.C Orange Farm ext 7 clinic Mofolo clinic C.H.C.
Nokuthela Ngwenya C.H.C Levai Mbatha C.H.C J.Dumane C.H.C Helga Kuhn clinic Esangweni clinic Tshepiso clinic Winnie Mandela clinic Driehoek clinic Kingsway clinic Bophelong clinic Daveyton Main clinic Brackenhurst clinic White City clinic
Soshanguve 3 C.H.C Laudium C.H.C Pyramid clinic Stanza Bopape clinic Skinner Street clinic Pretoria North clinic
District
Name of clinic visited
Motheo Heidedal CHC Bainsvlei clinic Langenhoven Park clinic Kagisanong Botshabelo E Botsahbelo F Botsahbelo B Botsahbelo C Botsahbelo M
Xhariep Edenburg clinic Jagersfontein clinic Jacobsdal clinic
Thabo Mofutsanyana Lesedi Marakong Namahali Matsieng Nthabiseng Makhalaneng Qholaqoe Makoane Bohlokong Clocolan
Northern District Thusanong Lejweleputswa Kgotsong
Final - 050317
28
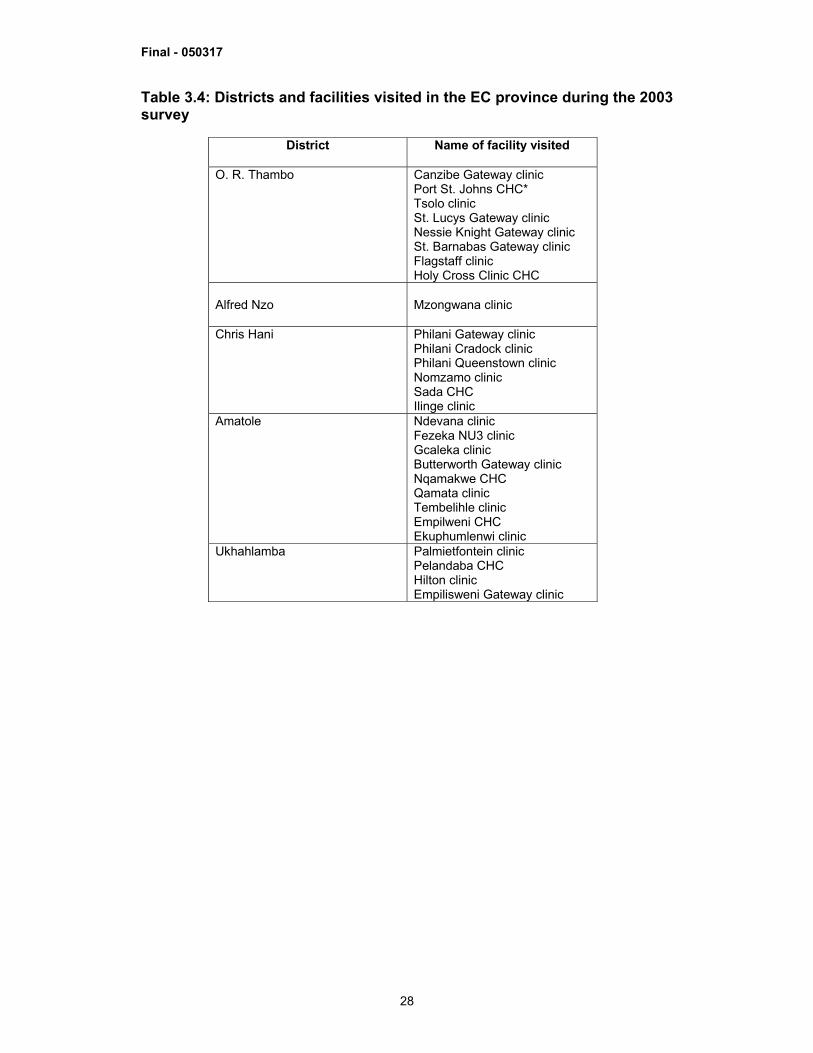
Table 3.4: Districts and facilities visited in the EC province during the 2003 survey
District
Name of facility visited
O. R. Thambo Canzibe Gateway clinic Port St. Johns CHC* Tsolo clinic St. Lucys Gateway clinic Nessie Knight Gateway clinic St. Barnabas Gateway clinic Flagstaff clinic Holy Cross Clinic CHC
Alfred Nzo
Mzongwana clinic
Chris Hani Philani Gateway clinic Philani Cradock clinic Philani Queenstown clinic Nomzamo clinic Sada CHC Ilinge clinic
Amatole Ndevana clinic Fezeka NU3 clinic Gcaleka clinic Butterworth Gateway clinic Nqamakwe CHC Qamata clinic Tembelihle clinic Empilweni CHC Ekuphumlenwi clinic
Ukhahlamba Palmietfontein clinic Pelandaba CHC Hilton clinic Empilisweni Gateway clinic
Final - 050317
29
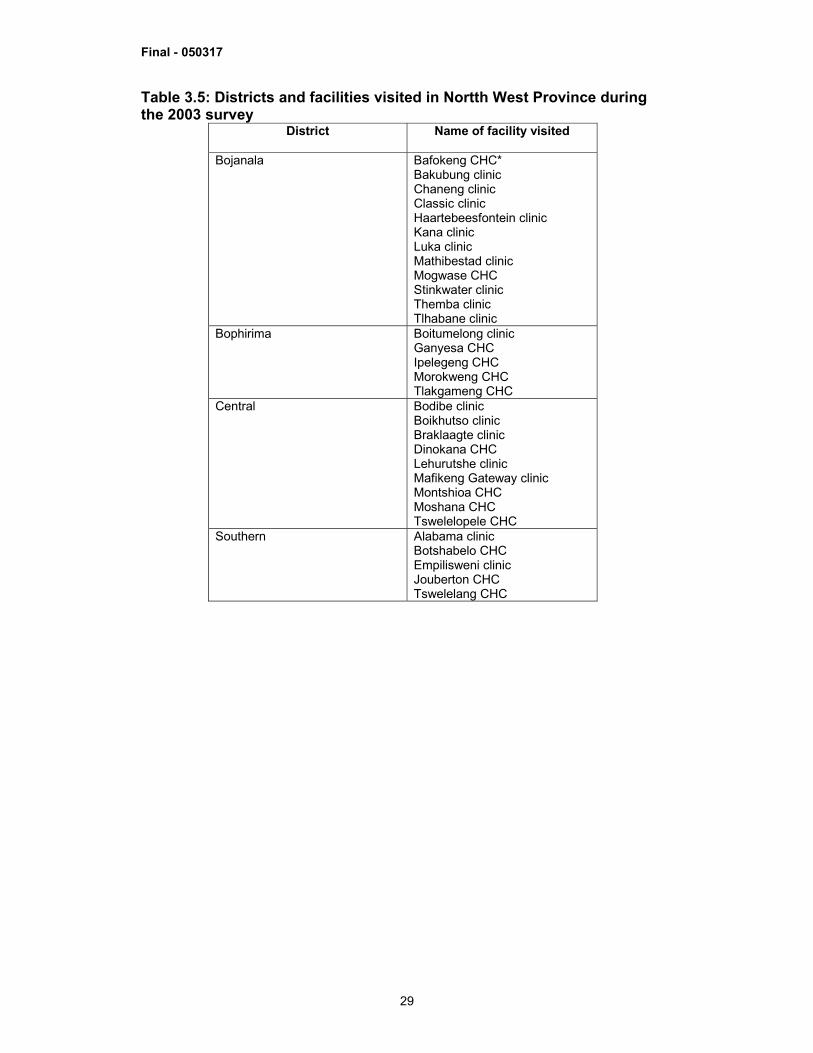
Table 3.5: Districts and facilities visited in Nortth West Province during the 2003 survey
District
Name of facility visited
Bojanala Bafokeng CHC* Bakubung clinic Chaneng clinic Classic clinic Haartebeesfontein clinic Kana clinic Luka clinic Mathibestad clinic Mogwase CHC Stinkwater clinic Themba clinic Tlhabane clinic
Bophirima Boitumelong clinic Ganyesa CHC Ipelegeng CHC Morokweng CHC Tlakgameng CHC
Central Bodibe clinic Boikhutso clinic Braklaagte clinic Dinokana CHC Lehurutshe clinic Mafikeng Gateway clinic Montshioa CHC Moshana CHC Tswelelopele CHC
Southern Alabama clinic Botshabelo CHC Empilisweni clinic Jouberton CHC Tswelelang CHC
Final - 050317
30
ACKNOWLEDGEMENTS The caregivers and children who agreed to participate in the survey Health workers who agreed to be observed IMCI-trained health workers who conducted the survey The nine Provincial Departments of Health, SA The Ministry of Health of South Africa UNICEF The Italian Corporation WHO Geneva WHO AFRO
Final - 050317
31
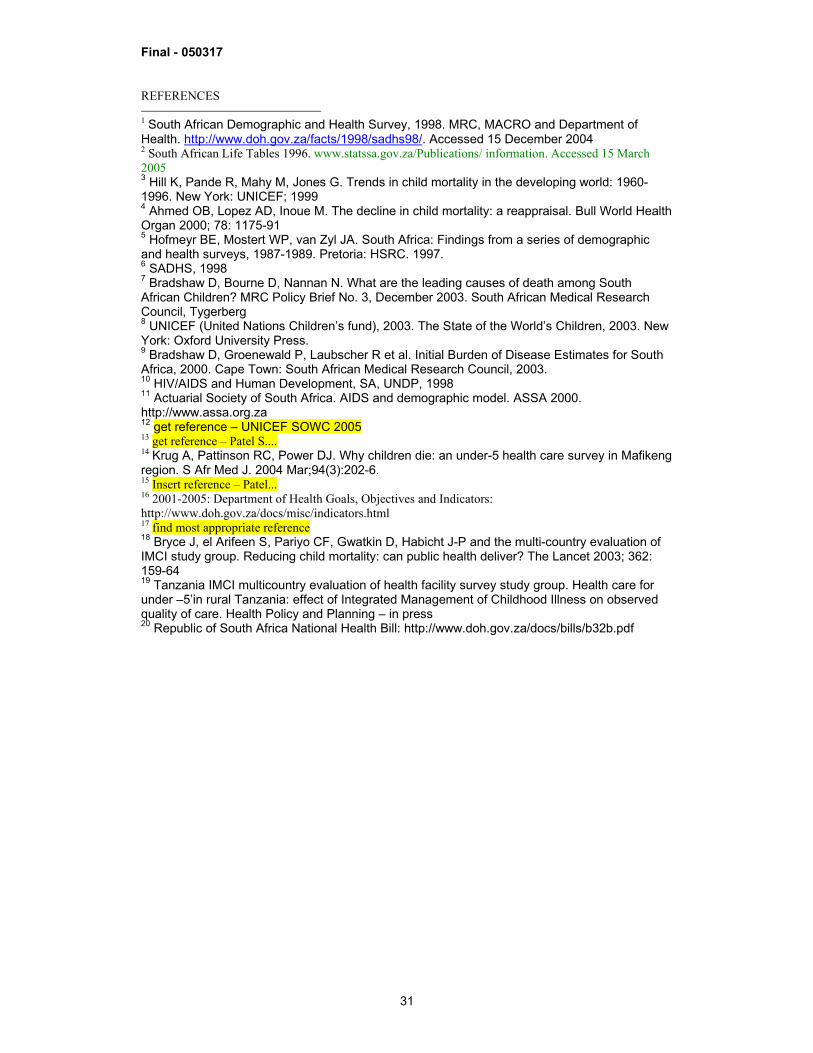
REFERENCES 1 South African Demographic and Health Survey, 1998. MRC, MACRO and Department of Health. http://www.doh.gov.za/facts/1998/sadhs98/. Accessed 15 December 2004 2 South African Life Tables 1996. www.statssa.gov.za/Publications/ information. Accessed 15 March 2005 3 Hill K, Pande R, Mahy M, Jones G. Trends in child mortality in the developing world: 1960-1996. New York: UNICEF; 1999 4 Ahmed OB, Lopez AD, Inoue M. The decline in child mortality: a reappraisal. Bull World Health Organ 2000; 78: 1175-91 5 Hofmeyr BE, Mostert WP, van Zyl JA. South Africa: Findings from a series of demographic and health surveys, 1987-1989. Pretoria: HSRC. 1997. 6 SADHS, 1998 7 Bradshaw D, Bourne D, Nannan N. What are the leading causes of death among South African Children? MRC Policy Brief No. 3, December 2003. South African Medical Research Council, Tygerberg 8 UNICEF (United Nations Children’s fund), 2003. The State of the World’s Children, 2003. New York: Oxford University Press. 9 Bradshaw D, Groenewald P, Laubscher R et al. Initial Burden of Disease Estimates for South Africa, 2000. Cape Town: South African Medical Research Council, 2003. 10 HIV/AIDS and Human Development, SA, UNDP, 1998 11 Actuarial Society of South Africa. AIDS and demographic model. ASSA 2000. http://www.assa.org.za 12 get reference – UNICEF SOWC 2005 13 get reference – Patel S.... 14 Krug A, Pattinson RC, Power DJ. Why children die: an under-5 health care survey in Mafikeng region. S Afr Med J. 2004 Mar;94(3):202-6. 15 Insert reference – Patel... 16 2001-2005: Department of Health Goals, Objectives and Indicators: http://www.doh.gov.za/docs/misc/indicators.html 17 find most appropriate reference 18 Bryce J, el Arifeen S, Pariyo CF, Gwatkin D, Habicht J-P and the multi-country evaluation of IMCI study group. Reducing child mortality: can public health deliver? The Lancet 2003; 362: 159-64 19 Tanzania IMCI multicountry evaluation of health facility survey study group. Health care for under –5’in rural Tanzania: effect of Integrated Management of Childhood Illness on observed quality of care. Health Policy and Planning – in press 20 Republic of South Africa National Health Bill: http://www.doh.gov.za/docs/bills/b32b.pdf