Report No: ACS16819 Kingdom of Cambodia Strengthening...
79
1 Report No: ACS16819 Kingdom of Cambodia Strengthening Sustainable Water Supply Services through Domestic Private Sector Providers in Cambodia 28 January 2016 GWASE EAST ASIA AND PACIFIC Public Disclosure Authorized Public Disclosure Authorized Public Disclosure Authorized Public Disclosure Authorized
Transcript of Report No: ACS16819 Kingdom of Cambodia Strengthening...
1
Report No: ACS16819
Kingdom of Cambodia
Strengthening Sustainable Water Supply Services through Domestic Private Sector Providers in Cambodia
28 January 2016
GWASE
EAST ASIA AND PACIFIC
Pub
lic D
iscl
osur
e A
utho
rized
Pub
lic D
iscl
osur
e A
utho
rized
Pub
lic D
iscl
osur
e A
utho
rized
Pub
lic D
iscl
osur
e A
utho
rized
2
Standard Disclaimer:
This volume is a product of the staff of the International Bank for Reconstruction and Development/ The World Bank. The findings, interpretations, and conclusions expressed in this paper do not necessarily reflect the views of the Executive Directors of The World Bank or the governments they represent. The World Bank does not guarantee the accuracy of the data included in this work. The boundaries, colors, denominations, and other information shown on any map in this work do not imply any judgment on the part of The World Bank concerning the legal status of any territory or the endorsement or acceptance of such boundaries.
Copyright Statement:
The material in this publication is copyrighted. Copying and/or transmitting portions or all of this work without permission may be a violation of
applicable law. The International Bank for Reconstruction and Development/ The World Bank encourages dissemination of its work and will
normally grant permission to reproduce portions of the work promptly.
For permission to photocopy or reprint any part of this work, please send a request with complete information to the Copyright Clearance
Center, Inc., 222 Rosewood Drive, Danvers, MA 01923, USA, telephone 978-750-8400, fax 978-750-4470, http://www.copyright.com/.
All other queries on rights and licenses, including subsidiary rights, should be addressed to the Office of the Publisher, The World Bank, 1818 H
Street NW, Washington, DC 20433, USA, fax 202-522-2422, e-mail [email protected].
3
Contents List of Figures ................................................................................................................................................ 4
List of Tables ................................................................................................................................................. 5
List of Boxes .................................................................................................................................................. 5
List of Annexes .............................................................................................................................................. 5
List of Abbreviations ..................................................................................................................................... 6
Acknowledgements ....................................................................................................................................... 6
Executive Summary ....................................................................................................................................... 7
1. Introduction and Global Context ........................................................................................................ 17
2. Cambodia Country Context and Rationale ......................................................................................... 18
2.1. Government strategy on piped water services ........................................................................... 18
2.2. Facts about private water service provision in Cambodia .......................................................... 19
2.3. Engagement of Partners and Rationale ...................................................................................... 21
3. Technical Assistance Objectives and Summary Results ...................................................................... 21
4. Implementation Process ..................................................................................................................... 25
4.1. Professionalizing water operators through Business Development Services ............................. 25
4.2. Facilitating access to finance ...................................................................................................... 30
4.3. Improving regulatory environment and monitoring................................................................... 36
4.4. Enhancing industry organization, dialogue and knowledge on private sector provision ........... 39
5. Key Results .......................................................................................................................................... 44
5.1. Results from the Business Development Services program ....................................................... 44
5.2. Results of the Access to Finance program .................................................................................. 53
5.3. Results for improving sector regulation and monitoring ............................................................ 59
5.4. Results on dialogue and knowledge ........................................................................................... 66
5.5. Results on gender aspects .......................................................................................................... 71
6. Lessons Learned, Challenges and Recommendations ........................................................................ 72
6.1. Lessons learned and challenges .................................................................................................. 72
6.2. Recommendations going forward .............................................................................................. 75
Annexes ....................................................................................................................................................... 79
References .................................................................................................................................................. 79
4
List of Figures
Figure 1: Theory of Change for achieving scale through Domestic Private Sector Provision ..................... 17 Figure 2 Regional comparison of access to piped water supply services at premises (JMP, 2015) ........... 18 Figure 3 Equity aspects of piped water service provision in Cambodia. .................................................... 19 Figure 4 Steps in Business Development Services (BDS) program of Cambodia Water Association .......... 26 Figure 5 Booklets developed for Business Development Services program .............................................. 27 Figure 6 Illustrations of the coaching process on site................................................................................. 29 Figure 7 Overall satisfaction of operator staff with the training program ................................................. 29 Figure 8 Steps in implementation of the Access to Finance program ........................................................ 30 Figure 9 Work flow for FTB and other commercial banks and FTB eligibility criteria (for AFD supported loan). ........................................................................................................................................................... 33 Figure 10 Detailed task and elements of the Investment Study (phase 2) ................................................. 34 Figure 11 Illustration of catalytic role of WSP TA complementing Access to Finance program of AFD/EU with FTB. ..................................................................................................................................................... 35 Figure 12 Implementation process to develop economic regulation ......................................................... 38 Figure 13 Benefits of Water Services Monitoring System (WSMS) ............................................................ 39 Figure 14 Phases to develop and roll out the Water Services Management System ................................. 40 Figure 15 Profile of operators participating in the program (n=47) ........................................................... 44 Figure 16 Self-assessment by operators on performance improvement (n=47) ........................................ 45 Figure 17 Average no. of connections per operator and connection growth from baseline (BS) to endline (ES) .............................................................................................................................................................. 45 Figure 18 Changes in water quality observed through external testing across operators ......................... 46 Figure 19 Observed changes in monthly revenues and expenses (in USD/conn) from baseline (BS) to endline (ES) ................................................................................................................................................. 47 Figure 20 Uptake of billing software by operators from baseline (BS) to endline (ES) .............................. 48 Figure 21 Uptake of computerized expense registration tools from baseline (BS) to endline (ES) ........... 48 Figure 22 Water pressure at end of network (in mH2O) at baseline (BS) and endline (ES). ...................... 49 Figure 23 Observed trends for Non-Revenue Water for Phase A operators (in %). ................................... 50 Figure 24 Changes observed in technical monitoring from baseline (BS) to endline (ES). ......................... 50 Figure 25 Changes in production cost structure in KHR for operators from baseline (BS) to endline (ES). .................................................................................................................................................................... 51 Figure 26 Cost analysis for Phase B of the BDS package in USD/operator ................................................. 52 Figure 27 Investment amounts in million USD over different components of the water systems ............ 55 Figure 28 Expected increase in service coverage across 20 operators based in investment studies ......... 56 Figure 29 Expected increase in connections across all 20 operators (split per loan segment) .................. 56 Figure 30 Appraised book value of fixed assets per existing connection (Dec 2014) ................................. 58 Figure 31 Investment amount per new connection (by Dec 2020) ............................................................ 58 Figure 32 Illustration of categorization, methodologies and extent of review for tariff setting ................ 61 Figure 33 Overview of data processing flows in the Water Services Monitoring System .......................... 65 Figure 34 Example screenshot, illustrating functionality to look up areas of licensed service providers. . 66 Figure 35 Growth of CWA members since its establishment. .................................................................... 67 Figure 36 CWA promotion material ............................................................................................................ 67 Figure 37 ID-poor incidence rate in villages under network reach (n=39) ................................................. 69 Figure 38 Inequality in connection rates (n=39) (left) and Fees overcharging connection cost (n=39) (right) .......................................................................................................................................................... 69 Figure 39 Reasons for poor households not connecting to piped water supply (n=468)........................... 70
5
List of Tables Table 1 Summary of interventions ................................................................................................................ 8 Table 2 Achievements CWA organizational development as per strategic plan ........................................ 10 Table 3 Overview of status of implementation of licensing regulation ...................................................... 11 Table 4 Summary of reform proposals in National Strategic Development Plan 2014-2018 ..................... 19 Table 5 Overview of Intermediate outcome and achievement of customized indicators ......................... 23 Table 6 Summary data on delivery of training and coaching ..................................................................... 28 Table 7 Implementation period of performance monitoring ..................................................................... 30 Table 8 Criteria for selection and ranking of operators for Access-to-Finance program ........................... 32 Table 9 Result of action-planning from Philippines knowledge exchange in March 2014. ........................ 41 Table 10 Tariff and connection fees of operators in the BDS program (n=47) ........................................... 44 Table 11 Costing proposal for rationalized BDS package, externalizing ERMS and operator logistical cost (USD) ........................................................................................................................................................... 52 Table 12 Progress to date in processing loan applications ......................................................................... 53 Table 13 Investment results of operators who did not complete the A2F program .................................. 54 Table 14 Investment results from operators who applied for FTB financing ............................................. 55 Table 15 Operating and financial metrics from 20 detailed investment studies........................................ 59 Table 16 Overview of status of implementation of licensing regulation .................................................... 60 Table 17 Weighted Average Cost of Capital (WACC) for private Water Operators in Cambodia............... 64 Table 18 Data requirements for the Water Monitoring Management System. ......................................... 64 Table 19 Result of national training for Water Services Monitoring System ............................................. 65 Table 20 Characteristics of monthly piped household water consumption and expenditures for different segments (n=938) ....................................................................................................................................... 69
List of Boxes Box 1 Findings on private water industry in Cambodia based on (Frenoux, 2013) (n= 30 operators) ....... 20 Box 2 Business Development Services content for Advanced and Beginner operators ............................ 28 Box 3 New elements of the licensing ministerial decree, issued May 2014 ............................................... 37 Box 4 Key reasons for attrition of operators in the A2F program .............................................................. 53 Box 5 Collateral requirements of FTB under the AFD-funded Access to Finance program ........................ 57 Box 6 Summary of objective, scope and principles in the proposed tariff regulation decree ................... 63 Box 7 Summary of findings of the pro-poor service delivery study in Cambodia (2013/2014) ................. 68 Box 8 Lessons in moving from firm level to industry level capacity ........................................................... 72 Box 9 Lessons in accelerating access-to-finance......................................................................................... 73 Box 10 Lessons on enhancing public sector support .................................................................................. 74
List of Annexes Annex 1 Infographic Tapping the Market Cambodia .................................................................................. 79 Annex 2 Final report and annexes on Business Development Services program ....................................... 79 Annex 3 Final report and annexes on Access-to-Finance program ............................................................ 79 Annex 4 Ministerial decrees on Licensing ................................................................................................... 79 Annex 5 Final report and annexes on Economic Regulation ...................................................................... 79 Annex 6 Final report and annexes on Water Management Monitoring System ........................................ 79 Annex 7 Strategic Plan CWA 2014-2019 ..................................................................................................... 79
6
List of Abbreviations A2F Access to Finance AFD French Development Agency BDS Business Development Services CWA Cambodia Water Supply Association DIH Provincial Department of Industry and Handicraft DFAT Department for Foreign Aid and Trade of the Australian Government EMAS Enterprise Monitoring and Advisory System ERMS Enterprise Resource Management System EU European Union EMC Emerging Market Consultants FTB Foreign Trade Bank FY Fiscal Year GPOBA Global partnership for Output Based Aid GRET French Development NGO IFC International Finance Cooperation ISEA Innovative Services Engineering Advisory IWA International Water Association JICA Japan International Cooperation Agency JMP Joint Monitoring Program KHR Khmer Real (4000 KHR = 1 USD) KPI Key Performance Indicator M&E Monitoring and Evaluation MIME Ministry of Mines and Energy MIH Ministry of Industry and Handicraft MIH-DPWS Ministry of Industry and Handicraft – Department of Potable Water Supply NPV Net Present Value NRW Non Revenue Water NSDP National Strategic Development Plan PPIAF Public Private Infrastructure Advisory Facility PPWSA Phnom Penh Water Supply Authority ROI Return On Investment SDG Sustainable Development Goals TA Technical Assistance UNICEF United Nations Children’s Fund WACC Weighted Average Cost of Capital WBG World Bank Group WHO World Health Organization WSMS Water Services Monitoring System WSP Water and Sanitation Program
Acknowledgements This report is a synthesis of the Technical Assistance ‘Strengthening Sustainable Water Supply Services through Domestic Private Sector Providers in Cambodia’ (P132172) carried out by the World Bank’s Water and Sanitation Program (WSP). This synthesis, including lessons and recommendations, is based on various project documents delivered throughout the TA implementation, intensive consultation and collaboration with the Ministry of Industry and Handicraft (MIH), the Cambodian Water Supply Association (CWA), as well as development partner and NGOs supporting the sector. The Task Team Leader for this TA is Susanna Smets. The following World Bank staff and consultants have provided valuable contributions: Sopheap Ly, Phyrum Kov, Virak Chan, Chettra Sophean, Cristina Mc Millan, Sokyeng Chan, Nicolas Polham and the consultant teams from EMC and GRET, notably Clement Frenoux, Sokkol Yi, Mam Deth, Alicia Tsitsikalis (GRET), and David Totten, David Tomlins, Engleng Kov, and Sok Kha (EMC). Valuable guidance was received from Jemima Sy, Kevin Bender, Joel Kolker and Almud Weitz. The team is
7
grateful for the contributions from WBG peer reviewers Jemima Sy, Iain Menzies, William Kingdom, and Nonito Bernardo.
Executive Summary Government strategy for improving piped water supply services – partnering with the private sector With the exception of Myanmar, Cambodia has the lowest access to piped water supply in the South East Asia region, which was estimated to be 21% in 2015. Less than one in ten rural households (7%) have access to piped water services on their premises, while for urban households, three out of four households enjoy these services (75%) (WHO and UNICEF, 2015). Against this backdrop, the Government of Cambodia in its National Strategic Development Plan 2014-2018 (Royal Government of Cambodia, 2013) prioritizes the acceleration of access to piped water services, in partnership with the domestic private sector. Private water operators are licensed and regulated by the Ministry of Industry and Handicraft (MIH). Scarce public domestic financial resources are solely channeled to state-owned utilities and enforcement of regulations is generally weak. With the exception of the French Development Agency (AFD), most development partners focus their grant and lending support on public utility investments. In 2012 the private sector is already estimated to provide 1.4 million Cambodians with piped water services, with the immediate potential for expansion of existing schemes covering another 2 million and further new schemes that could viably be developed for another 3 million Cambodians (Sy, Warner, & Jamieson, 2014) and ( (DFAT, 2014). Around 300 private sector utilities, around half of which are licensed by the Ministry of Industry and Handicraft (MIH), have a market share of almost 50% of those with access to piped services, mostly situated in rural towns and agglomerations of settlements, with 750 to over 3000 household connections. Driven by demand for higher services, the private sector in Cambodia will be an important driver for increasing access to piped water supply, especially in the rapidly urbanizing rural growth centers of Cambodia. It is evident that the climate within which domestic private water providers operate needs to offer favorable public support and incentives to expand services, especially to the poor. Given the internal and external challenges that water operators face, and in order to optimize service delivery from the presence of such a thriving private sector, three critical bottlenecks need to be addressed:
i) Professionalizing water operations, ii) Enabling access to finance, and iii) Strengthening regulatory oversight and dialogue with the private sector.
This synthesis report documents the implementation process, results, and lessons learned under a three-year Technical Assistance (TA) program
1, and presents recommendations going forward. For comprehensiveness,
annexes are attached that include all supporting documentation and resources developed under this TA. What was the Technical Assistance trying to achieve? A decade ago, the private water sector was characterized by fragmented non-organized operators, often not recording any data or adhering to standard operation and maintenance procedures. Reforms on sector legislation and regulation, laid down in a draft Water Law (2005) were not moving ahead and there was dialogue between private and public sector. Building up capacities of water operators and the local institutions that could provide such support seemed to be a first necessary step and led to WSP’s earlier engagement with nine water operators (Chan, 2010). This TA aimed to scale up capacity building services and address a wider range of barriers for private sector growth. The development objective of the TA was to strengthen the capacity of domestic private water providers to deliver piped water supply services outside the service area of public water utilities in Cambodia.
1 Execution from January 2013 till 30 January 2016; overall budget was USD 1.6 million for including variable and fixed costs
8
The TA focused on strengthening institutions, so that industry-wide replication and policy change could be facilitated. Hence, both the MIH as regulator and policy maker, and the Cambodia Water Supply Association (CWA), a membership organization of licensed private water providers founded in 2012, were the primary audiences. Close synergies were sought with the Access-to-Finance program financed by AFD/EU, to optimize results. The TA tried to achieve the following:
i) Improving performance of private water operators by accessing Business Development Services (BDS)
ii) Mobilizing investments from local commercial banks through Access-to-Finance services (A2F) iii) Strengthening the regulatory framework and sector monitoring of domestic private water operators iv) Enhancing industry organization, dialogue and knowledge about private sector provision
What did the Technical Assistance cover and what was achieved?
The TA interventions covered a range of activities in support of CWA, as well as to MIH, summarized in Table 1.
Table 1 Summary of interventions
Interventions to support CWA Interventions to support MIH
Development of Business Development Services packages (training and coaching) for advanced and beginner water operators
Support to drafting and dissemination of Ministerial decree on Procedures for Issuing, Revising, Suspending and Revoking of Water Operations Permits
Delivery of Business Development Services (BDS) program hosted by CWA to 47 private water operators with payment for services
Support to economic regulation through drafting and dissemination of Ministerial decree on Review and Determination of Tariff
Delivery of Access to Finance (A2F) program hosted by CWA to 29 private water operators, with payment for services
Training for MIH staff, delivery of tariff models, test case of two public utilities, and user manual for applying tariff methodologies
Delivery of water operator software for billing and accounting, under license to CWA
Support to development of monitoring system for piped water suppliers (public and private)
Support to organizational development of CWA, e.g. strategic and operational planning and organizational learning support
Capacity building of national and provincial ministerial staff and operators for roll out of a Water Services Monitoring System (WSMS)
Knowledge exchange with The Philippines, including MIH, CWA and well as senior staff of Cambodian banks
Nationally representative study to quantify poor-inclusiveness of licensed private water operators, sensitivities of poor households to tariffs and fees, and characteristic of water expenses and consumption
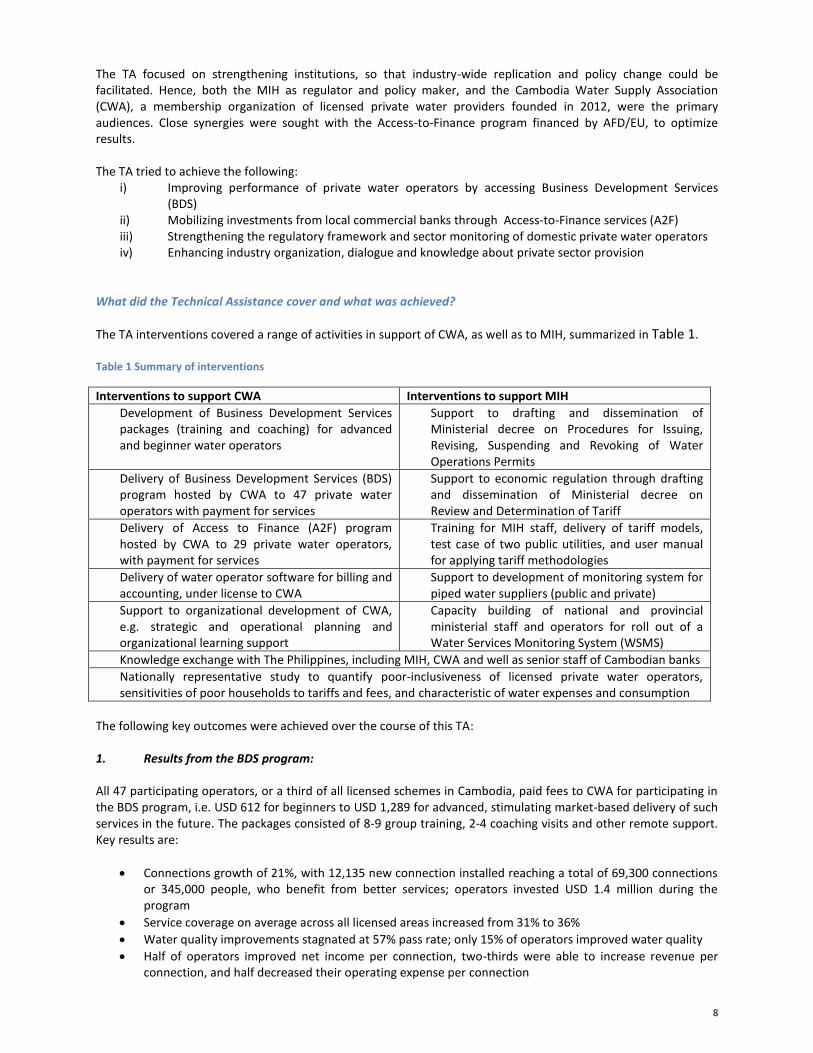
The following key outcomes were achieved over the course of this TA: 1. Results from the BDS program:
All 47 participating operators, or a third of all licensed schemes in Cambodia, paid fees to CWA for participating in the BDS program, i.e. USD 612 for beginners to USD 1,289 for advanced, stimulating market-based delivery of such services in the future. The packages consisted of 8-9 group training, 2-4 coaching visits and other remote support. Key results are:
Connections growth of 21%, with 12,135 new connection installed reaching a total of 69,300 connections or 345,000 people, who benefit from better services; operators invested USD 1.4 million during the program
Service coverage on average across all licensed areas increased from 31% to 36%
Water quality improvements stagnated at 57% pass rate; only 15% of operators improved water quality
Half of operators improved net income per connection, two-thirds were able to increase revenue per connection, and half decreased their operating expense per connection
9
Non-Revenue Water decreased from 15% to 9%; water pressure in network increased from 9 to 12 mH2O
Almost all (93%) now use software tools for billing, up from only 57% at the start of the program; expenses registration and technical monitoring have also improved
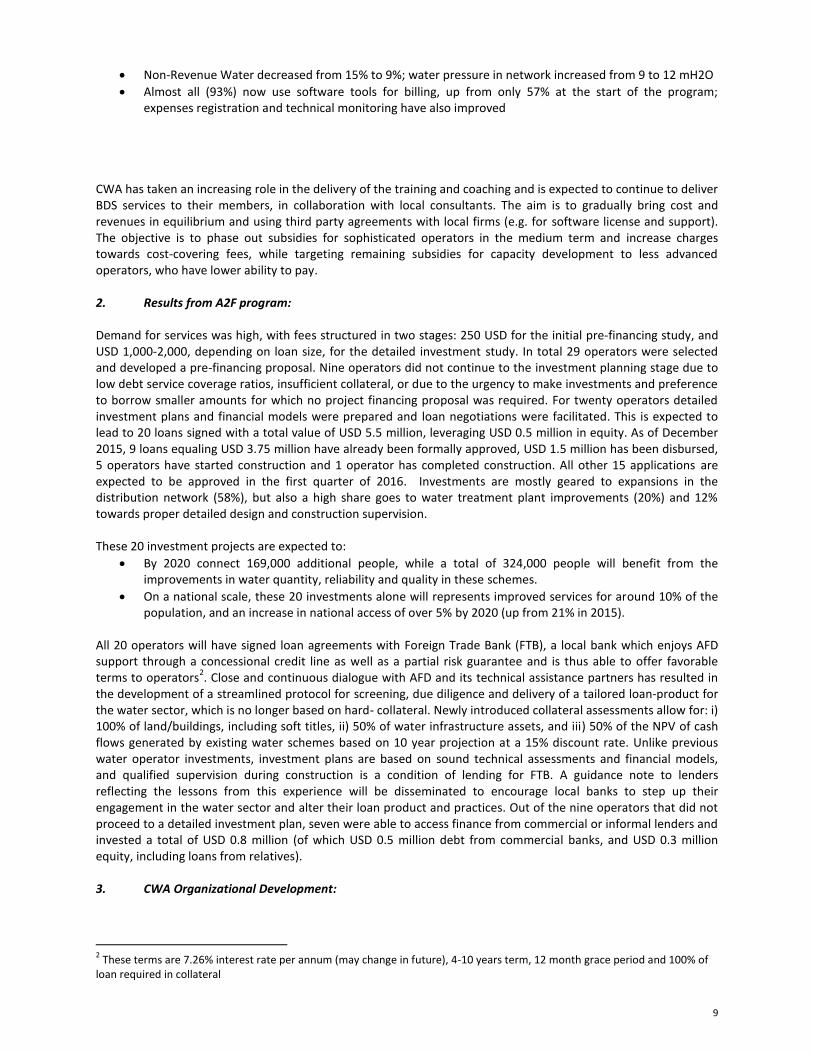
CWA has taken an increasing role in the delivery of the training and coaching and is expected to continue to deliver BDS services to their members, in collaboration with local consultants. The aim is to gradually bring cost and revenues in equilibrium and using third party agreements with local firms (e.g. for software license and support). The objective is to phase out subsidies for sophisticated operators in the medium term and increase charges towards cost-covering fees, while targeting remaining subsidies for capacity development to less advanced operators, who have lower ability to pay. 2. Results from A2F program:
Demand for services was high, with fees structured in two stages: 250 USD for the initial pre-financing study, and USD 1,000-2,000, depending on loan size, for the detailed investment study. In total 29 operators were selected and developed a pre-financing proposal. Nine operators did not continue to the investment planning stage due to low debt service coverage ratios, insufficient collateral, or due to the urgency to make investments and preference to borrow smaller amounts for which no project financing proposal was required. For twenty operators detailed investment plans and financial models were prepared and loan negotiations were facilitated. This is expected to lead to 20 loans signed with a total value of USD 5.5 million, leveraging USD 0.5 million in equity. As of December 2015, 9 loans equaling USD 3.75 million have already been formally approved, USD 1.5 million has been disbursed, 5 operators have started construction and 1 operator has completed construction. All other 15 applications are expected to be approved in the first quarter of 2016. Investments are mostly geared to expansions in the distribution network (58%), but also a high share goes to water treatment plant improvements (20%) and 12% towards proper detailed design and construction supervision. These 20 investment projects are expected to:
By 2020 connect 169,000 additional people, while a total of 324,000 people will benefit from the improvements in water quantity, reliability and quality in these schemes.
On a national scale, these 20 investments alone will represents improved services for around 10% of the population, and an increase in national access of over 5% by 2020 (up from 21% in 2015).
All 20 operators will have signed loan agreements with Foreign Trade Bank (FTB), a local bank which enjoys AFD support through a concessional credit line as well as a partial risk guarantee and is thus able to offer favorable terms to operators
2. Close and continuous dialogue with AFD and its technical assistance partners has resulted in
the development of a streamlined protocol for screening, due diligence and delivery of a tailored loan-product for the water sector, which is no longer based on hard- collateral. Newly introduced collateral assessments allow for: i) 100% of land/buildings, including soft titles, ii) 50% of water infrastructure assets, and iii) 50% of the NPV of cash flows generated by existing water schemes based on 10 year projection at a 15% discount rate. Unlike previous water operator investments, investment plans are based on sound technical assessments and financial models, and qualified supervision during construction is a condition of lending for FTB. A guidance note to lenders reflecting the lessons from this experience will be disseminated to encourage local banks to step up their engagement in the water sector and alter their loan product and practices. Out of the nine operators that did not proceed to a detailed investment plan, seven were able to access finance from commercial or informal lenders and invested a total of USD 0.8 million (of which USD 0.5 million debt from commercial banks, and USD 0.3 million equity, including loans from relatives). 3. CWA Organizational Development:
2 These terms are 7.26% interest rate per annum (may change in future), 4-10 years term, 12 month grace period and 100% of
loan required in collateral
10
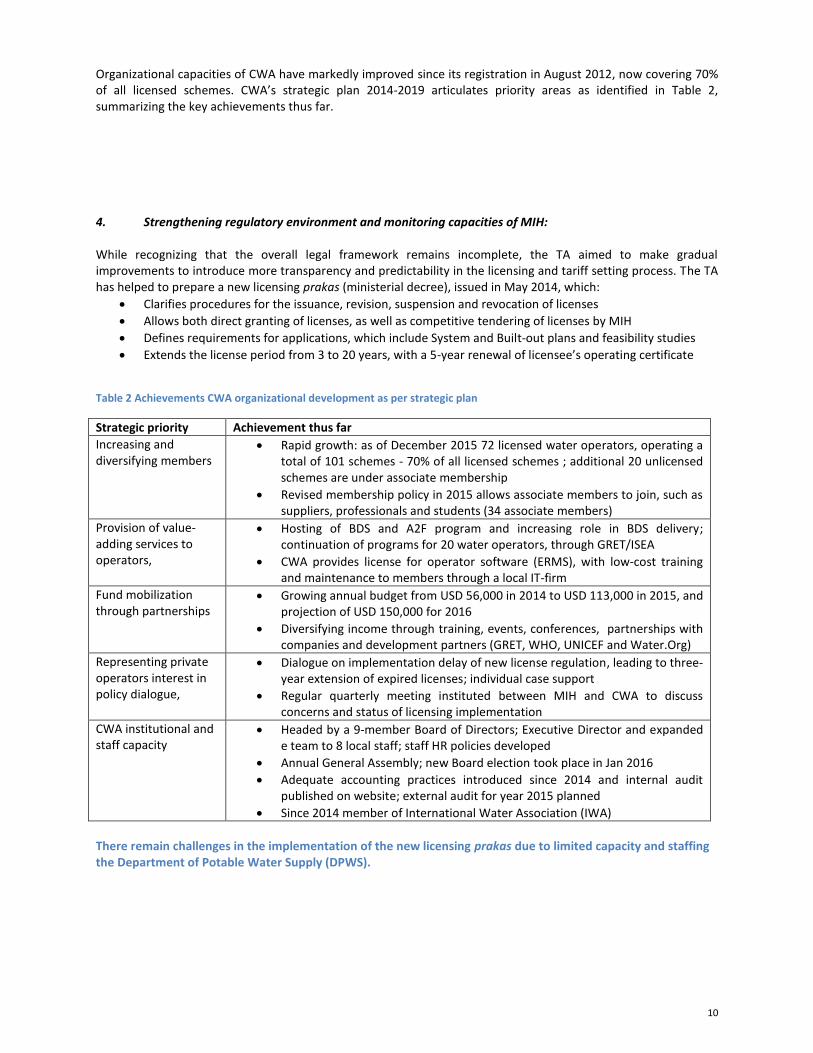
Organizational capacities of CWA have markedly improved since its registration in August 2012, now covering 70% of all licensed schemes. CWA’s strategic plan 2014-2019 articulates priority areas as identified in Table 2, summarizing the key achievements thus far.
4. Strengthening regulatory environment and monitoring capacities of MIH: While recognizing that the overall legal framework remains incomplete, the TA aimed to make gradual improvements to introduce more transparency and predictability in the licensing and tariff setting process. The TA has helped to prepare a new licensing prakas (ministerial decree), issued in May 2014, which:
Clarifies procedures for the issuance, revision, suspension and revocation of licenses
Allows both direct granting of licenses, as well as competitive tendering of licenses by MIH
Defines requirements for applications, which include System and Built-out plans and feasibility studies
Extends the license period from 3 to 20 years, with a 5-year renewal of licensee’s operating certificate
Table 2 Achievements CWA organizational development as per strategic plan
Strategic priority Achievement thus far
Increasing and diversifying members
Rapid growth: as of December 2015 72 licensed water operators, operating a total of 101 schemes - 70% of all licensed schemes ; additional 20 unlicensed schemes are under associate membership
Revised membership policy in 2015 allows associate members to join, such as suppliers, professionals and students (34 associate members)
Provision of value-adding services to operators,
Hosting of BDS and A2F program and increasing role in BDS delivery; continuation of programs for 20 water operators, through GRET/ISEA
CWA provides license for operator software (ERMS), with low-cost training and maintenance to members through a local IT-firm
Fund mobilization through partnerships
Growing annual budget from USD 56,000 in 2014 to USD 113,000 in 2015, and projection of USD 150,000 for 2016
Diversifying income through training, events, conferences, partnerships with companies and development partners (GRET, WHO, UNICEF and Water.Org)
Representing private operators interest in policy dialogue,
Dialogue on implementation delay of new license regulation, leading to three-year extension of expired licenses; individual case support
Regular quarterly meeting instituted between MIH and CWA to discuss concerns and status of licensing implementation
CWA institutional and staff capacity
Headed by a 9-member Board of Directors; Executive Director and expanded e team to 8 local staff; staff HR policies developed
Annual General Assembly; new Board election took place in Jan 2016
Adequate accounting practices introduced since 2014 and internal audit published on website; external audit for year 2015 planned
Since 2014 member of International Water Association (IWA)
There remain challenges in the implementation of the new licensing prakas due to limited capacity and staffing the Department of Potable Water Supply (DPWS).
11
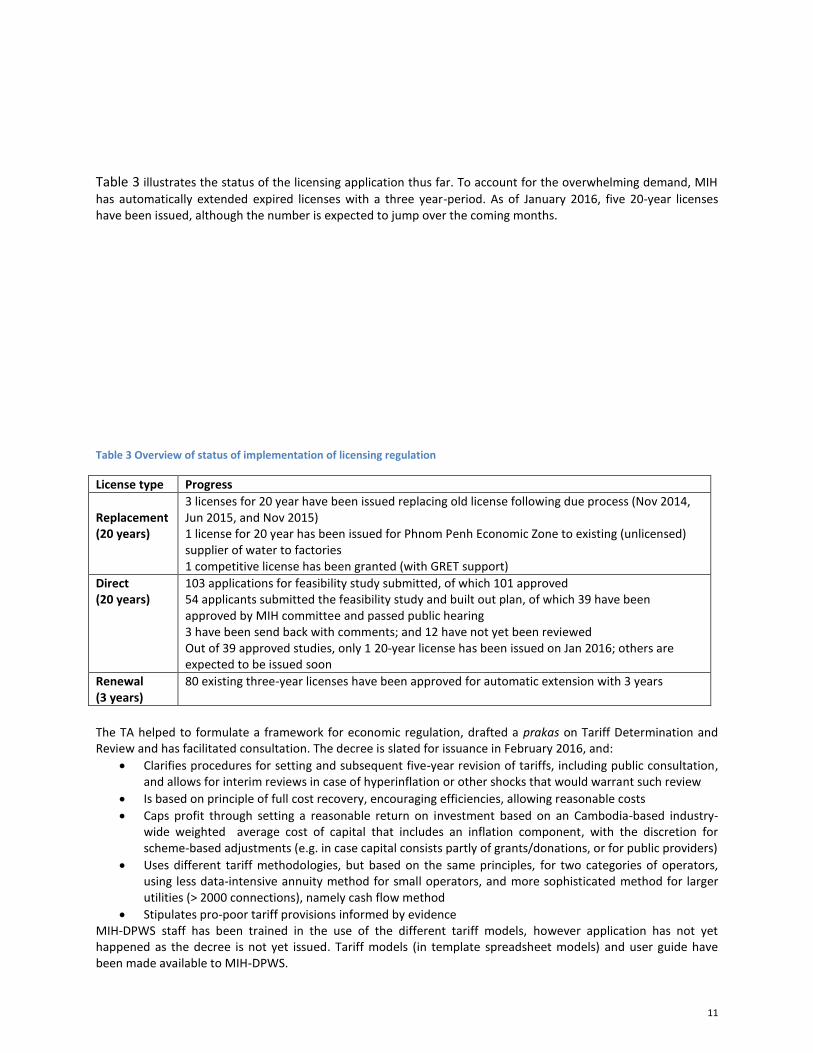
Table 3 illustrates the status of the licensing application thus far. To account for the overwhelming demand, MIH
has automatically extended expired licenses with a three year-period. As of January 2016, five 20-year licenses have been issued, although the number is expected to jump over the coming months.
Table 3 Overview of status of implementation of licensing regulation
License type Progress
Replacement (20 years)
3 licenses for 20 year have been issued replacing old license following due process (Nov 2014, Jun 2015, and Nov 2015) 1 license for 20 year has been issued for Phnom Penh Economic Zone to existing (unlicensed) supplier of water to factories 1 competitive license has been granted (with GRET support)
Direct (20 years)
103 applications for feasibility study submitted, of which 101 approved 54 applicants submitted the feasibility study and built out plan, of which 39 have been approved by MIH committee and passed public hearing 3 have been send back with comments; and 12 have not yet been reviewed Out of 39 approved studies, only 1 20-year license has been issued on Jan 2016; others are expected to be issued soon
Renewal (3 years)
80 existing three-year licenses have been approved for automatic extension with 3 years
The TA helped to formulate a framework for economic regulation, drafted a prakas on Tariff Determination and Review and has facilitated consultation. The decree is slated for issuance in February 2016, and:
Clarifies procedures for setting and subsequent five-year revision of tariffs, including public consultation, and allows for interim reviews in case of hyperinflation or other shocks that would warrant such review
Is based on principle of full cost recovery, encouraging efficiencies, allowing reasonable costs
Caps profit through setting a reasonable return on investment based on an Cambodia-based industry-wide weighted average cost of capital that includes an inflation component, with the discretion for scheme-based adjustments (e.g. in case capital consists partly of grants/donations, or for public providers)
Uses different tariff methodologies, but based on the same principles, for two categories of operators, using less data-intensive annuity method for small operators, and more sophisticated method for larger utilities (> 2000 connections), namely cash flow method
Stipulates pro-poor tariff provisions informed by evidence MIH-DPWS staff has been trained in the use of the different tariff models, however application has not yet happened as the decree is not yet issued. Tariff models (in template spreadsheet models) and user guide have been made available to MIH-DPWS.
12
Finally, achievements with respect to the establishment and capacity building of the Water Services Monitoring are the following, although follow-up assistance is required for consolidation:
Based on agreed monitoring framework for water providers, software package has successfully been developed and pilot-tested, with positive feedback from users (public and private)
MIH commitment and ownership illustrated as hosting and maintenance requirements for the system are financed MIH have assigned staff roles (although still limited)
Training has been delivered across 24 provinces to all departmental staff and two third of private licensed water operators has been reached
System has been formally launched in January 2016 (http://wsms.mih.gov.kh/) What have we learnt? A number of lessons have been learnt from this TA which will be important to inform future support to the Cambodian government. Most of these lessons have also global relevance, especially for countries with a fragmented water industry, characterized by hundreds of domestic private providers that form the backbone of service delivery outside public utility-served cities. Detailed lessons for each of the components of the TA are listed
in Box 8, Box 9 and Box 10, and some are summarized below:
Moving from firm to industry-wide capacities
Strengthening industry-wide capacities requires working towards a market-based approach for business development services using national platforms, such as industry association
Introducing fees for services gradually shift operators willingness-to-pay for services, opening opportunities for local BDS-providers
A harmonized approach by development partners is critical for delivery of market-based BDS, preventing dampening of future demand and spoiling of a nascent market
Content and price of BDS package needs to match ability-to-pay of different operator segments and willingness-to-pay for different services
Replication of business development services is not yet financially sustainable, and needs to develop a long-term phase-out strategy towards higher levels of cost recovery through:
i) Adjustment of package content and conditions to reduce costs, including outsourcing services with high willingness-to-pay (e.g. software support) to local firms/consultants,
ii) Differentiate BDS services with full cost recovery for sophisticated, larger operators, and allocate remaining subsidies to less advanced operators and less valued/in-demand services
Facilitating Access to Finance
Bank technical assistance and credit enhancement instruments are needed to introduce new collateral assessment practices: practices in FTB changed significantly to include water infrastructure assets and the NPV of future cash flows of existing schemes towards collateral, the latter being capped at half the collateral requirement.
Assumptions in the investment study, financial model and technical assessment need to be acceptable and closely aligned with the bank’s internal guidelines and procedures to ensure a smooth approval process;
Bank engagement activities and lender forums can stimulate interest in the sector and have led to a better understanding of water sector lending characteristics; however, additional instruments are needed for banks to shift from purely collateral-backed lending to project financing approaches, that would further expand loan tenures and grace period
Partnership with AFD’s program optimized the use of scarce technical assistance funds, and leveraged USD 5.5 million debt and USD 0.4 million equity investments
13
Enhancing public support for private sector provision
Improvements in the legal regulatory environment need to be accompanied with adequate consultation and dialogue with the private sector, but equally with medium term assistance to execute regulations and gain credibility
To comply with new license regulation, assistance is needed to help operators prepare applications and feasibility studies, and to the regulator (MIH-DPWS) in managing the license execution process in a transparent and speedy matter;
The consultation on the new tariff regulation has created heightened awareness among operators on i) service obligations – including to the poor - that come with a monopoly right, and ii) the necessity to substantiate submissions with proper data;
Building a sustainable sector monitoring system requires top-level support, alignment with human and financial resources and capacities of host and users; assistance post-handover is necessary to ensure sustainable usage and help with sector analytics
Strengthening CWA in executing its strategic priorities lead to growth and maturation, which in turn helped to prevent the association from being “captured” by other interests
Industry associations tend to be subject to mission creep in the quest to attract financial resources through partnership arrangements; focus is to be maintained by CWA on strategic priorities, while ensuring that sufficient income is secured through membership fees
Conclusion, recommendations and way forward This technical assistance has illustrated that incentives for private water operators to use business development services vary, e.g. i) pressures for compliance with regulation, ii) opportunities to access finance by better business plans, or ii) impacting the bottom line through more efficient business and operational practices and smarter investment decisions. Institutionalizing market-based BDS-programs within CWA as industry association can be a sustainable, scalable and effective alternative to “one-off” project-based capacity building to professionalize small water operators. Building a local market and demand for business development services requires the introduction of a transactional relationships between water operator and local BDS provider(s) gradually striving for cost recovery of fees. A long-term phase-out strategy for subsidies is needed, in which a differentiated approach would be used to allocate subsidies only to less advanced operators and for specific services that remain undervalued.
CWA has played an effective role as matchmaker to pool demand and promote efficient delivery of business development services. This resulted in positive changes in technical, business and financial performance, as well as changed skills, attitudes and operator practices, and as well as appreciation of the added value of BDS. National platforms, such as CWA, can also play an important role in the further professionalization of a fragmented water industry characterized by weak capacities, through i) stimulating professional and pro-poor business practices, ii) raising awareness and dialogue on sector developments, iii) offering support services to help operators comply with new regulations and iv) strengthening network with value chain actors, v) facilitating A2F programs of local banks in collaboration with development partners.
Close alignment with AFD/EU Access-to-Finance program allowed WSP’s modest technical assistance program to leverage commercial financing from local banks, estimated to be a total of USD 6.0 million
3, as well as USD 0.7
million4 in additional equity. This is projected to lead to a 5% increase in access to piped water by 2020, while
another group of 20 operators will be supported in the next 2-3 years to access finance with an expected volume of USD 5 million, using a similar processes.
3 USD 5.5 million from AFD concessional credit line (of which USD 3.4 million approved by Dec 2015); and USD 0.5 million
through other commercial banks; 4 USD 0.4 million equity from the 20 proposals that got financed through FTB, and USD 0.3 million from the 9 proposals that got
financed through other commercial banks.
14
Both professionalization and acceleration of services provision require complementary measures to address the regularity and enabling environment for operators. While the technical assistance has made important gains in this area, further reform and capacity building of MIH to execute the new regulations is paramount. Only with effective implementation of licensing and tariff decrees and related monitoring requirements, will BDS and A2F programs be fully effective. Other than capacity building, this may also require internal reforms within MIH, such as raising the Department of Potable Water Supply to the level of a General Directorate, including the necessary human and financial resources, followed by the establishment of an independent regulatory body in the medium to long term (requires a Water Law to be passed, slated for 2017).
Sector transition to inject public finance
The most attractive and viable investment sites are expected to be served over the next few years through equity and debt financing. However, to achieve the Sustainable Development Goals
5, Cambodia will need to transition to
a new era where subsidies are allocated to leverage private sector investments (equity and debt) in less viable new sites, e.g. through grants, concessional loans or domestic public transfers. This transition to serve poorer, more “rural” areas with piped services may also require that debt financing arrangements reflect longer tenures and grace period to reflect the longer recovery times and liquidity constraints in early years of operation from less dense urban sites. Such subsidies could be best allocated through a competitive licensing process, based on a longer-term master plan that would identify and prioritize investment sites, using commercial viability gap financing (VGF) and potentially subsidy payments to cover cash deficits in early years of scheme operation. Such process would require strong involvement of the Ministry of Industry and Handicraft and would contribute to higher transparency and better value for money for rural customers.
In the longer term, different business models for private sector involvement may need to be considered through bundling of sites, as well as through other PPP modalities than the existing full privatization under license.
In addition to green field investments and expansions into non-viable areas, “densification” is required, as connection rates in areas under network are 50% for the non-poor and only 20% for poor household
6. Private
water operators may require incentives such as output-based subsidies to close this equity gap, e.g. through a national “Water for all Facility” under stewardship of MIH, as foreseen in the National Strategic Development Plan 2014-2018.
The above sector transition will require a closer harmonization of development partners supporting the sector to arrive at a consistent and transparent policy and procedures for granting such subsidies. Preferably, this would lead in the long-term to harmonized arrangements and potentially a facility that would be able to leverage public funds from multiple sources. It would also require scaled-up access to local commercial finance. The ongoing AFD/EU Access-to-Finance program, which includes local commercial finance and limited amount of grants, as well as the investment project of DFAT, hosted with the Cambodian Development Council, provide opportunities for the government to achieve such transition. Moreover, leveraging grant financing in the medium-term from the World Bank’s Global Partnership for Output-Based Aid (GPOBA), will allow the government to pilot the Viability Gap Financing approach and gain valuable experience that can be replicated at scale through a potential future sector wide approach towards private sector provision.
Recommendations are for medium and long-term are summarized below.
Recommendations for Ministry of Industry and Handicraft Short to Medium-term:
Build capacity and expand assigned staff and resources of MIH-DPWS to execute its regulatory and monitoring mandate, transforming the Department into a General Directorate for Potable Water Supply;
Continue support to provincial DIHs for monitoring and encourage self-reporting by water operators for compliance; recognize DIHs for timely and complete data entry and develop field verification protocols for gradual improvement of data quality in the Water Services Monitoring System (WSMS)
5 Sustainable Development Goals (SDGs) have set a higher bar for service delivery than the MDGs (using “improved water
source”). The SDGs require 100% access to safely managed drinking water by 2030, which includes regulated water services at the premise, of reliable and sufficient quantity, and quality. 6 In Cambodia poor households are identified through a poor-identification system, which is based on a combination of asset screening and community assessments. The poor (also called ID-poor 1 and ID-poor 2) are given identification cards and herewith can access a number of services for free or at reduced cost.
15
Analyze and publicize data through WMWS-MIH website through an annual benchmarking exercise, covering increasingly more water operators
Expand the Water Services Monitoring System to include work flow monitoring of licensing and tariff review process, leading to timely execution and increased transparency (and less rent seeking behavior)
Mobilize resources for better water quality testing and act on non-compliance of water providers;
Implement competitive tendering for new license applications and potentially look at clustering of sites to increase economies of scale and viability;
Leverage available grants (e.g. GPOBA, DFAT 3i) for new investment sites to pilot commercial viability gap financing under competitive licensing; develop harmonized policy and procedures for the use of such grants
Implement pro-poor connection policies (pro-poor tariffs, capped connection fees) and set-up a “Water for All” connection facility, as incentives to private operators to connect poor households
Continue dialogue with CWA and foster linkages with well performing public utilities to support BDS provision;
Medium to Long-term:
Develop joint accreditation scheme with CWA for consultants to help operators prepare license applications and tariff submissions.
Gradually transition from a full equity approach to introducing public funding (from various sources, including grants, concessional finance, domestic resources) into private water sector provision to reach less-viable and poorer rural areas;
Develop a longer-term master plan for investment sites for private sector, through a market identification, screening and prioritization process; and work pro-actively with development partners to allocate funding
Develop a facility/financing structure to attract pooled financing from various sources/development partners to allocate public finance to new rural potable water schemes
Develop a guarantee-scheme for several local banks, or work with development partners to do so, in order to expand Access-to-Finance on more suitable terms (longer tenure, grace period, collateral)
Develop clear coordination and implementation mechanisms with the Ministry of Rural Development for piped water schemes that may receive finance through MRD
Improve legal and institutional environment through Water Law and prepare comprehensive legal framework for PPPs in water sector, articulating role of decentralized government
Recommendations to Cambodia Water Association
Short to Medium term
Carry out a mid-term review in 2016 to refocus role, key-functions, priorities of the associations, and review its current business model, including a strategy to reduce dependencies on large financiers
Continue to market and deliver break-even BDS-services, including software licensing and support services (ERMS), and potentially group trainings; differentiate and unbundle BDS package to attract more operators
Develop a network of external consultants for specialized services (taxation, legal services, and technical assessments) and market those on a cost recovery basis.
Continue to monitor member performance, gather and provide market information to stakeholders and business partners, and represent members’ interest in regular dialogue with MIH
Continue diversified partnerships with development partners in line with strategic plan. Medium to Long-term
Develop a phase-out strategy for subsidies through further differentiation of services and operator; strategically allocate reduced subsidies to less advanced operators for services that are undervalued
Develop new accredited services for members in collaboration with MIH through accreditation of consultants that can support, e.g. license application development and tariff submission preparation
16
Develop long-term relationships with local vocational training centers, local universities and MIH, to develop a skill-based training program for different job-positions within water utilities, as well as for utility management positions
Opportunities for further World Bank Group engagement
Opportunities to support the government in the implementation of the above recommendations exist now that the World Bank Group’s Country Engagement Note is being prepared. While detailed scoping will be required, the following ideas offer a way forward for increased World Bank Group engagement:
Collaborate with the Public Private Infrastructure Advisory Facility (PPIAF) and other interested development partners to intensify upstream support and capacity building for MIH in the following areas i) Master planning for potential new licensing sites, based on a mapping, screening and prioritization
process; and support to developing clear procedures for allocation of grants financing ii) Advisory services on tender preparation and project structuring, including investment studies for new
sites (possibly combining multiple sites) iii) Capacity building to MIH-DPWS in executing licensing and application of tariff methodology, and
enforcement of water quality standards iv) Capacity building for consolidation and use of WSMS system, including expansion to allow for license
management and support to sector analytics/benchmarking
Collaborate with the Global Partnership for Output-based Aid (GPOBA) and other development partners to leverage grant financing for: i) Commercial Viability Gap financing to support competitive tendering of new licenses and help to
establish procedures and structure for future scale-up ii) Output-based aid financing to connect poor households under existing schemes
7.
Collaborate with other development partners (such as AFD, IFC) to explore replication of Access to Finance through other local banks and seek opportunities to bring in IFC PPP transaction advisory services
Strategic technical assistance to CWA, especially in areas of: i) Institutional and organizational capacity development; review strategic operational plan and
business model ii) Help define phase-out strategy and further differentiate the approach for BDS so as to better
target remaining subsidies to least advanced operators iii) Support accreditation of local consultants – together with MIH – for BDS to comply with license
and tariff regulation
Longer-term engagement under the Country Partnership Framework is expected to build on the next two-year experience and lessons. Based on an assumed successful demonstration on how to best allocate more public funding into the private water sector, a potential IDA engagement may be foreseen.
7 Use this for demonstration purposes so as to demonstrate approach to other development partner and inform future
government lending.
17
1. Introduction and Global Context
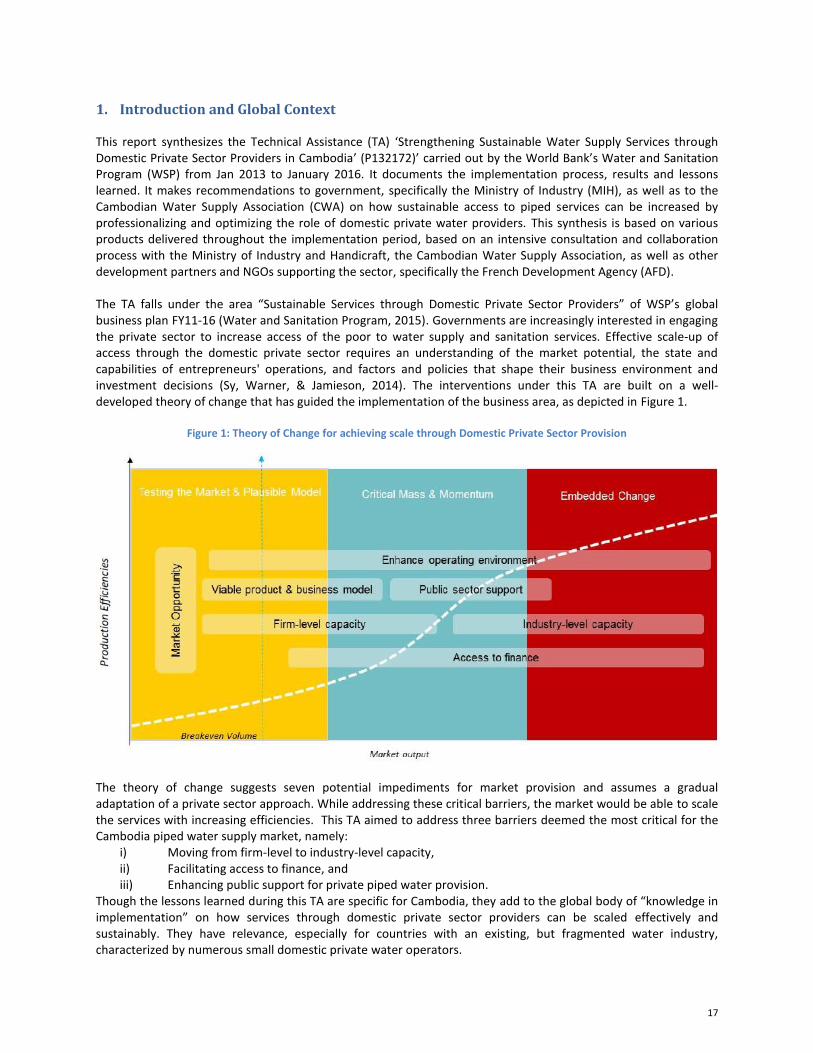
This report synthesizes the Technical Assistance (TA) ‘Strengthening Sustainable Water Supply Services through Domestic Private Sector Providers in Cambodia’ (P132172)’ carried out by the World Bank’s Water and Sanitation Program (WSP) from Jan 2013 to January 2016. It documents the implementation process, results and lessons learned. It makes recommendations to government, specifically the Ministry of Industry (MIH), as well as to the Cambodian Water Supply Association (CWA) on how sustainable access to piped services can be increased by professionalizing and optimizing the role of domestic private water providers. This synthesis is based on various products delivered throughout the implementation period, based on an intensive consultation and collaboration process with the Ministry of Industry and Handicraft, the Cambodian Water Supply Association, as well as other development partners and NGOs supporting the sector, specifically the French Development Agency (AFD). The TA falls under the area “Sustainable Services through Domestic Private Sector Providers” of WSP’s global business plan FY11-16 (Water and Sanitation Program, 2015). Governments are increasingly interested in engaging the private sector to increase access of the poor to water supply and sanitation services. Effective scale-up of access through the domestic private sector requires an understanding of the market potential, the state and capabilities of entrepreneurs' operations, and factors and policies that shape their business environment and investment decisions (Sy, Warner, & Jamieson, 2014). The interventions under this TA are built on a well-developed theory of change that has guided the implementation of the business area, as depicted in Figure 1.
Figure 1: Theory of Change for achieving scale through Domestic Private Sector Provision
The theory of change suggests seven potential impediments for market provision and assumes a gradual adaptation of a private sector approach. While addressing these critical barriers, the market would be able to scale the services with increasing efficiencies. This TA aimed to address three barriers deemed the most critical for the Cambodia piped water supply market, namely:
i) Moving from firm-level to industry-level capacity, ii) Facilitating access to finance, and iii) Enhancing public support for private piped water provision.
Though the lessons learned during this TA are specific for Cambodia, they add to the global body of “knowledge in implementation” on how services through domestic private sector providers can be scaled effectively and sustainably. They have relevance, especially for countries with an existing, but fragmented water industry, characterized by numerous small domestic private water operators.
18
2. Cambodia Country Context and Rationale
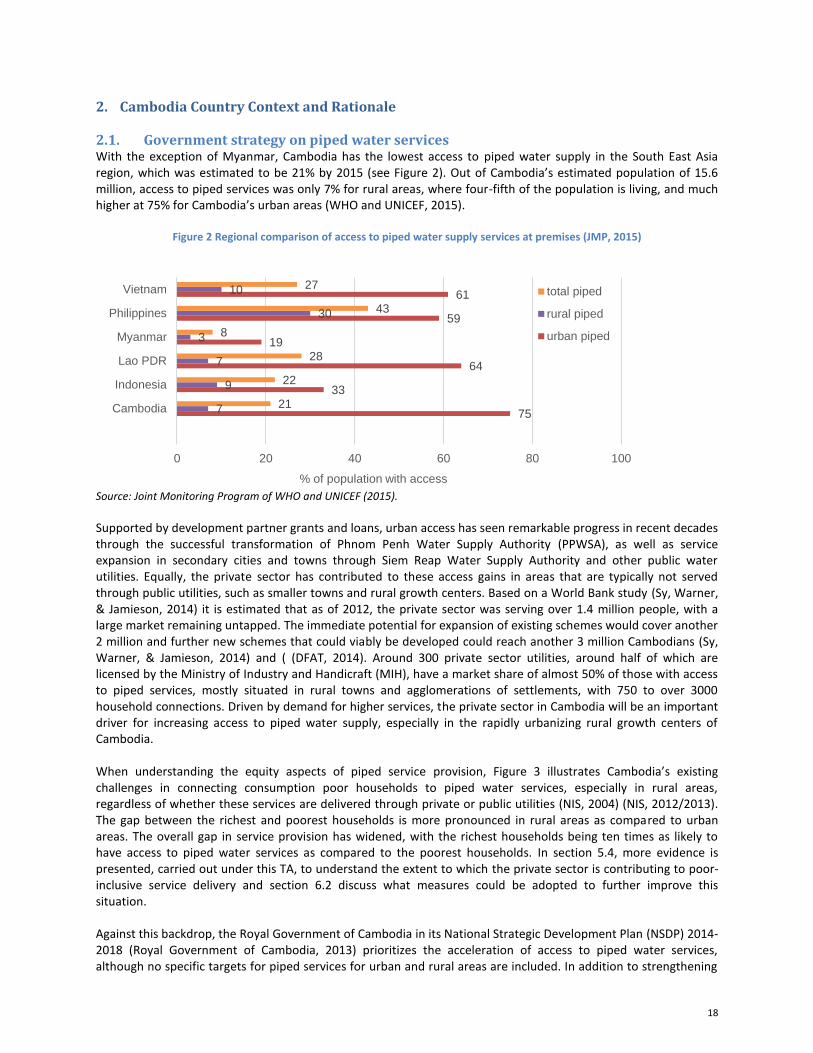
2.1. Government strategy on piped water services With the exception of Myanmar, Cambodia has the lowest access to piped water supply in the South East Asia region, which was estimated to be 21% by 2015 (see Figure 2). Out of Cambodia’s estimated population of 15.6 million, access to piped services was only 7% for rural areas, where four-fifth of the population is living, and much higher at 75% for Cambodia’s urban areas (WHO and UNICEF, 2015).
Figure 2 Regional comparison of access to piped water supply services at premises (JMP, 2015)
Source: Joint Monitoring Program of WHO and UNICEF (2015).
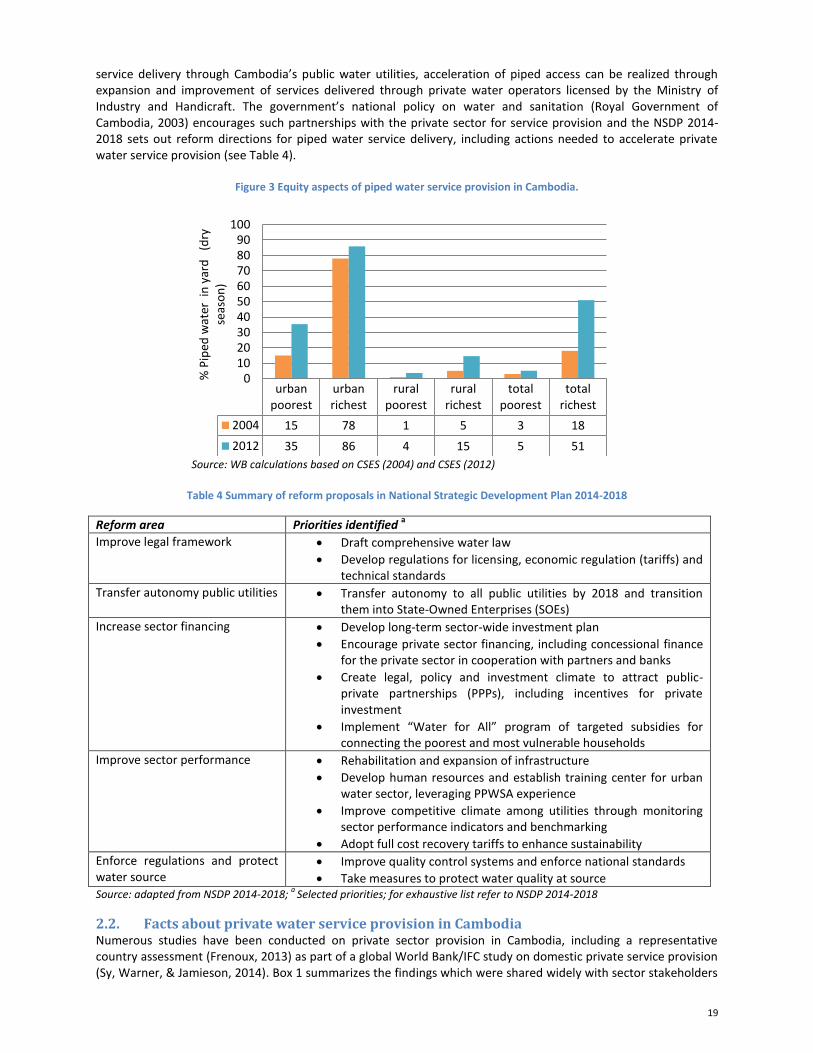
Supported by development partner grants and loans, urban access has seen remarkable progress in recent decades through the successful transformation of Phnom Penh Water Supply Authority (PPWSA), as well as service expansion in secondary cities and towns through Siem Reap Water Supply Authority and other public water utilities. Equally, the private sector has contributed to these access gains in areas that are typically not served through public utilities, such as smaller towns and rural growth centers. Based on a World Bank study (Sy, Warner, & Jamieson, 2014) it is estimated that as of 2012, the private sector was serving over 1.4 million people, with a large market remaining untapped. The immediate potential for expansion of existing schemes would cover another 2 million and further new schemes that could viably be developed could reach another 3 million Cambodians (Sy, Warner, & Jamieson, 2014) and ( (DFAT, 2014). Around 300 private sector utilities, around half of which are licensed by the Ministry of Industry and Handicraft (MIH), have a market share of almost 50% of those with access to piped services, mostly situated in rural towns and agglomerations of settlements, with 750 to over 3000 household connections. Driven by demand for higher services, the private sector in Cambodia will be an important driver for increasing access to piped water supply, especially in the rapidly urbanizing rural growth centers of Cambodia. When understanding the equity aspects of piped service provision, Figure 3 illustrates Cambodia’s existing challenges in connecting consumption poor households to piped water services, especially in rural areas, regardless of whether these services are delivered through private or public utilities (NIS, 2004) (NIS, 2012/2013). The gap between the richest and poorest households is more pronounced in rural areas as compared to urban areas. The overall gap in service provision has widened, with the richest households being ten times as likely to have access to piped water services as compared to the poorest households. In section 5.4, more evidence is presented, carried out under this TA, to understand the extent to which the private sector is contributing to poor-inclusive service delivery and section 6.2 discuss what measures could be adopted to further improve this situation. Against this backdrop, the Royal Government of Cambodia in its National Strategic Development Plan (NSDP) 2014-2018 (Royal Government of Cambodia, 2013) prioritizes the acceleration of access to piped water services, although no specific targets for piped services for urban and rural areas are included. In addition to strengthening
75
33
64
19
59
61
7
9
7
3
30
10
21
22
28
8
43
27
0 20 40 60 80 100
Cambodia
Indonesia
Lao PDR
Myanmar
Philippines
Vietnam
% of population with access
total piped
rural piped
urban piped
19
service delivery through Cambodia’s public water utilities, acceleration of piped access can be realized through expansion and improvement of services delivered through private water operators licensed by the Ministry of Industry and Handicraft. The government’s national policy on water and sanitation (Royal Government of Cambodia, 2003) encourages such partnerships with the private sector for service provision and the NSDP 2014-2018 sets out reform directions for piped water service delivery, including actions needed to accelerate private water service provision (see Table 4).
Figure 3 Equity aspects of piped water service provision in Cambodia.
Source: WB calculations based on CSES (2004) and CSES (2012)
Table 4 Summary of reform proposals in National Strategic Development Plan 2014-2018
Reform area Priorities identified a
Improve legal framework Draft comprehensive water law
Develop regulations for licensing, economic regulation (tariffs) and technical standards
Transfer autonomy public utilities Transfer autonomy to all public utilities by 2018 and transition them into State-Owned Enterprises (SOEs)
Increase sector financing Develop long-term sector-wide investment plan
Encourage private sector financing, including concessional finance for the private sector in cooperation with partners and banks
Create legal, policy and investment climate to attract public-private partnerships (PPPs), including incentives for private investment
Implement “Water for All” program of targeted subsidies for connecting the poorest and most vulnerable households
Improve sector performance Rehabilitation and expansion of infrastructure
Develop human resources and establish training center for urban water sector, leveraging PPWSA experience
Improve competitive climate among utilities through monitoring sector performance indicators and benchmarking
Adopt full cost recovery tariffs to enhance sustainability
Enforce regulations and protect water source
Improve quality control systems and enforce national standards
Take measures to protect water quality at source Source: adapted from NSDP 2014-2018;
a Selected priorities; for exhaustive list refer to NSDP 2014-2018
2.2. Facts about private water service provision in Cambodia Numerous studies have been conducted on private sector provision in Cambodia, including a representative country assessment (Frenoux, 2013) as part of a global World Bank/IFC study on domestic private service provision (Sy, Warner, & Jamieson, 2014). Box 1 summarizes the findings which were shared widely with sector stakeholders
urbanpoorest
urbanrichest
ruralpoorest
ruralrichest
totalpoorest
totalrichest
2004 15 78 1 5 3 18
2012 35 86 4 15 5 51
0102030405060708090
100
% P
iped
wat
er i
n y
ard
(d
ry
seas
on
)
20
through infographics (Supplementary documentation to this Synthesis Report is available upon request and categorized in the following annexes Annex 1).
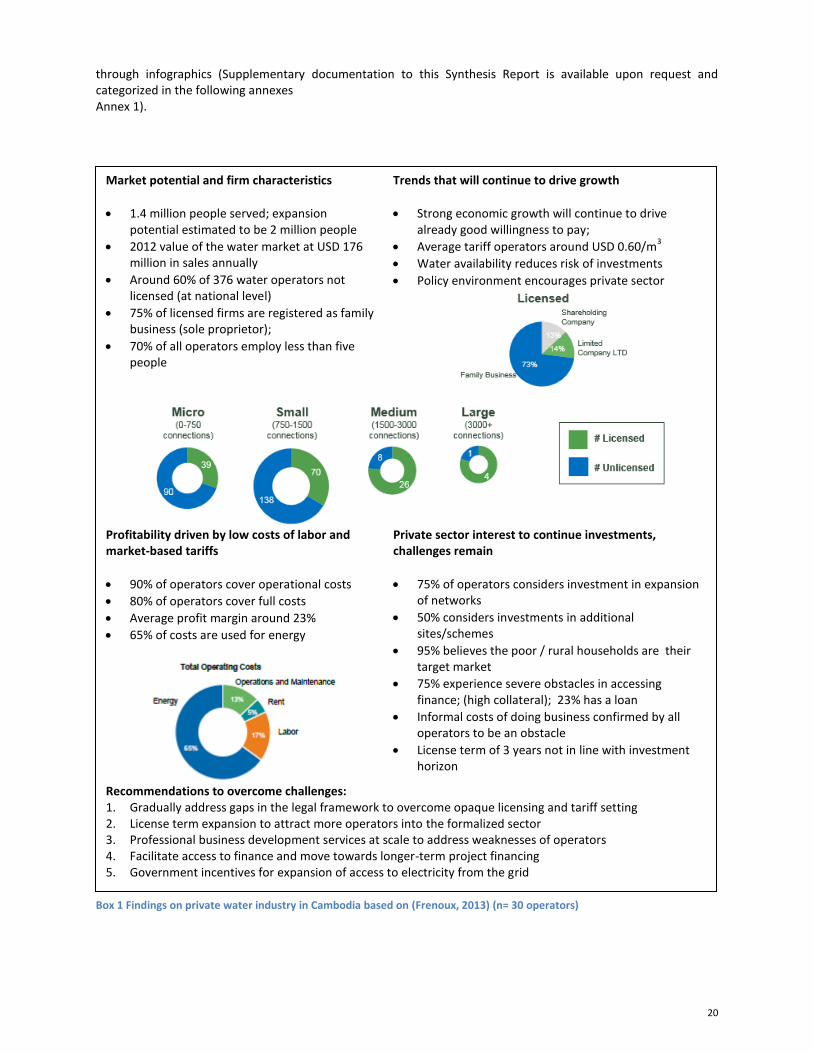
Box 1 Findings on private water industry in Cambodia based on (Frenoux, 2013) (n= 30 operators)
Market potential and firm characteristics
1.4 million people served; expansion potential estimated to be 2 million people
2012 value of the water market at USD 176 million in sales annually
Around 60% of 376 water operators not licensed (at national level)
75% of licensed firms are registered as family business (sole proprietor);
70% of all operators employ less than five people
Trends that will continue to drive growth
Strong economic growth will continue to drive already good willingness to pay;
Average tariff operators around USD 0.60/m3
Water availability reduces risk of investments
Policy environment encourages private sector
Profitability driven by low costs of labor and market-based tariffs
90% of operators cover operational costs
80% of operators cover full costs
Average profit margin around 23%
65% of costs are used for energy
Private sector interest to continue investments, challenges remain
75% of operators considers investment in expansion of networks
50% considers investments in additional sites/schemes
95% believes the poor / rural households are their target market
75% experience severe obstacles in accessing finance; (high collateral); 23% has a loan
Informal costs of doing business confirmed by all operators to be an obstacle
License term of 3 years not in line with investment horizon
Recommendations to overcome challenges: 1. Gradually address gaps in the legal framework to overcome opaque licensing and tariff setting 2. License term expansion to attract more operators into the formalized sector 3. Professional business development services at scale to address weaknesses of operators 4. Facilitate access to finance and move towards longer-term project financing 5. Government incentives for expansion of access to electricity from the grid
21
2.3. Engagement of Partners and Rationale Scarce domestic resources are currently channeled only to public utilities and development partner financing from donors as JICA, AFD, and ADB remains largely focused on the public sector. However, in 2013, at the start of this TA, AFD stated the design of a program to expand private sector service provision through extending a concessional credit line and guarantees to local banks in Cambodia. As a result of close coordination, this TA was designed to support synergies with AFD’s program and to optimize results, especially in the domain of Access to Finance (A2F). In May 2014 AFD launched the program with the signing of a concessional loan of USD 15 million to Foreign Trade Bank (FTB)
8, of which USD 5 million earmarked for the water sector, a partial (50%) risk guarantee
for loans above USD 400,000, and an accompanying Technical Assistance grant through EU support, including investments grant of around USD 1 million for water providers. The program formally started a year later in May 2015 (see also section 4.2). In 2013, the Australian Department for Foreign Aid and Trade (DFAT) initiated the design of an Investment Facility, coordinated through the Cambodia Development Council (CDC), to support expansion of services, using grants to leverage private investments from both water operators as well as social impact investors
9. This program started
its inception in September 2015. Cambodia’s market potential for private water supply provision is illustrated by the increasing interest of development partners in stimulating private sector provision. Given the low piped water access in Cambodia (21% national), the market potential to connect up to 5 million additional people through private operators within the next decade (bringing this to around 65%), and the fact that private operators already provide half of all piped services, provides a solid basis for focused assistance to the sector. For this acceleration to happen, it is evident that the climate within which domestic private water providers operate need to offer favorable public support and incentives to expand services, especially to the poor. Given the internal and external challenges that water operators face, and in order to optimize service delivery from the presence of such a thriving private sector, the TA focused on three main elements:
iv) Professionalizing water operations, v) Enabling access to finance, and vi) Strengthening regulatory oversight and dialogue with the private sector
As such as the clients of this TA have been two-fold: on the private sector side, the Cambodia Water Supply Association (CWA), a membership industry association, and on the public side, the Ministry of Industry and Handicraft, notably the Department of Potable Water Supply (MIH-DPWS) as the regulator and policy maker for private and public piped water suppliers in Cambodia.
Although the TA initially engaged with several local banks in the access-to-finance work, a targeted support package for one local bank (FTB) as part of the AFD/EU program started in the final year of this TA. To maximize results through close cooperation with the AFD program, this TA harmonized with the support program to FTB.
3. Technical Assistance Objectives and Summary Results
The project development objective of this technical assistance was to “strengthen the capacity of domestic private water providers to deliver piped water supply services outside the service area of public water utilities in Cambodia”. The focus of the TA was on agglomerations of small towns and rural growth centers. The TA has been
provided over a three year period from period January 2013 till January 2016. Table 5 shows the intermediate
outcome and target indicators, including a summary of achievements10
.
8 AFD considered supporting various local banks, and finally reached agreement with one candidate as a result. The program
also includes rural electricity providers 9 This program is called 3i: Investing In Infrastructure and not only focusses on the water sector, but also on electricity, solid
waste and potentially agriculture. 10
It should be noted that due to additional client demand, notably from the Ministry of Industry and Handicraft, and encouraging results in implementation, the technical assistance budget and timeframe was expanded (overall budget USD 1.6 including variable and fixed costs).

22
23
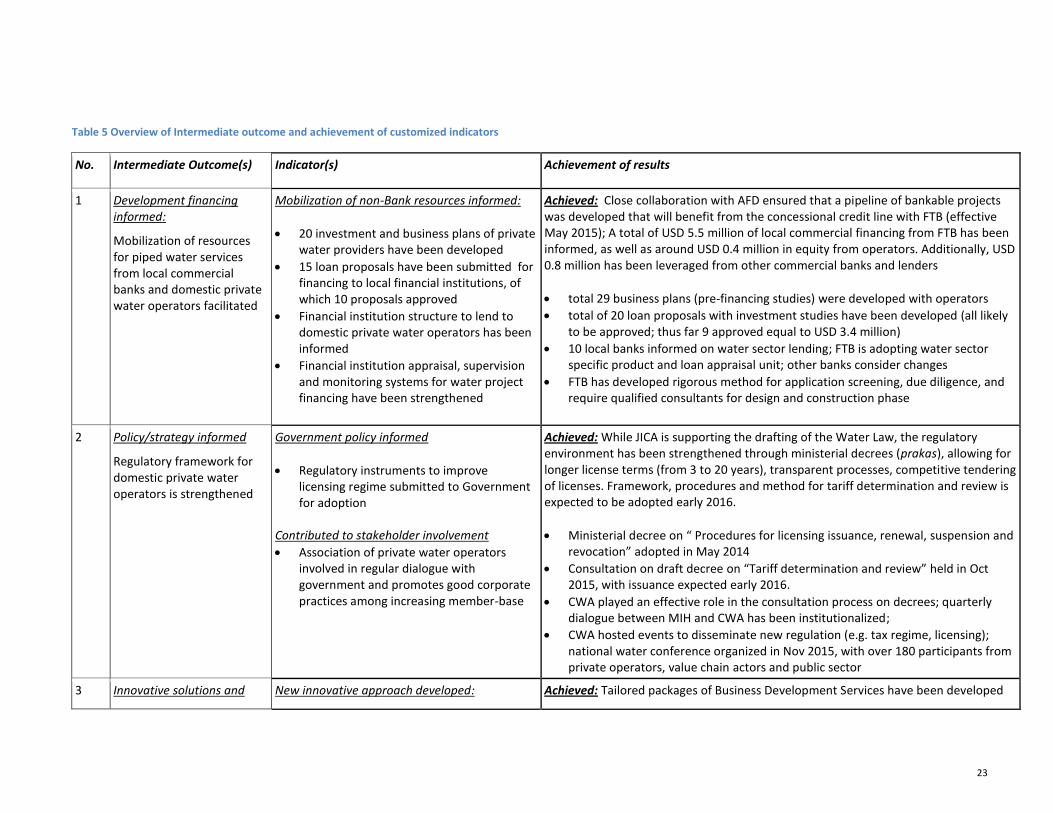
Table 5 Overview of Intermediate outcome and achievement of customized indicators
No. Intermediate Outcome(s) Indicator(s) Achievement of results
1 Development financing informed:
Mobilization of resources for piped water services from local commercial banks and domestic private water operators facilitated
Mobilization of non-Bank resources informed:
20 investment and business plans of private water providers have been developed
15 loan proposals have been submitted for financing to local financial institutions, of which 10 proposals approved
Financial institution structure to lend to domestic private water operators has been informed
Financial institution appraisal, supervision and monitoring systems for water project financing have been strengthened
Achieved: Close collaboration with AFD ensured that a pipeline of bankable projects was developed that will benefit from the concessional credit line with FTB (effective May 2015); A total of USD 5.5 million of local commercial financing from FTB has been informed, as well as around USD 0.4 million in equity from operators. Additionally, USD 0.8 million has been leveraged from other commercial banks and lenders
total 29 business plans (pre-financing studies) were developed with operators
total of 20 loan proposals with investment studies have been developed (all likely to be approved; thus far 9 approved equal to USD 3.4 million)
10 local banks informed on water sector lending; FTB is adopting water sector specific product and loan appraisal unit; other banks consider changes
FTB has developed rigorous method for application screening, due diligence, and require qualified consultants for design and construction phase
2 Policy/strategy informed
Regulatory framework for domestic private water operators is strengthened
Government policy informed
Regulatory instruments to improve licensing regime submitted to Government for adoption
Contributed to stakeholder involvement
Association of private water operators involved in regular dialogue with government and promotes good corporate practices among increasing member-base
Achieved: While JICA is supporting the drafting of the Water Law, the regulatory environment has been strengthened through ministerial decrees (prakas), allowing for longer license terms (from 3 to 20 years), transparent processes, competitive tendering of licenses. Framework, procedures and method for tariff determination and review is expected to be adopted early 2016.
Ministerial decree on “ Procedures for licensing issuance, renewal, suspension and revocation” adopted in May 2014
Consultation on draft decree on “Tariff determination and review” held in Oct 2015, with issuance expected early 2016.
CWA played an effective role in the consultation process on decrees; quarterly dialogue between MIH and CWA has been institutionalized;
CWA hosted events to disseminate new regulation (e.g. tax regime, licensing); national water conference organized in Nov 2015, with over 180 participants from private operators, value chain actors and public sector
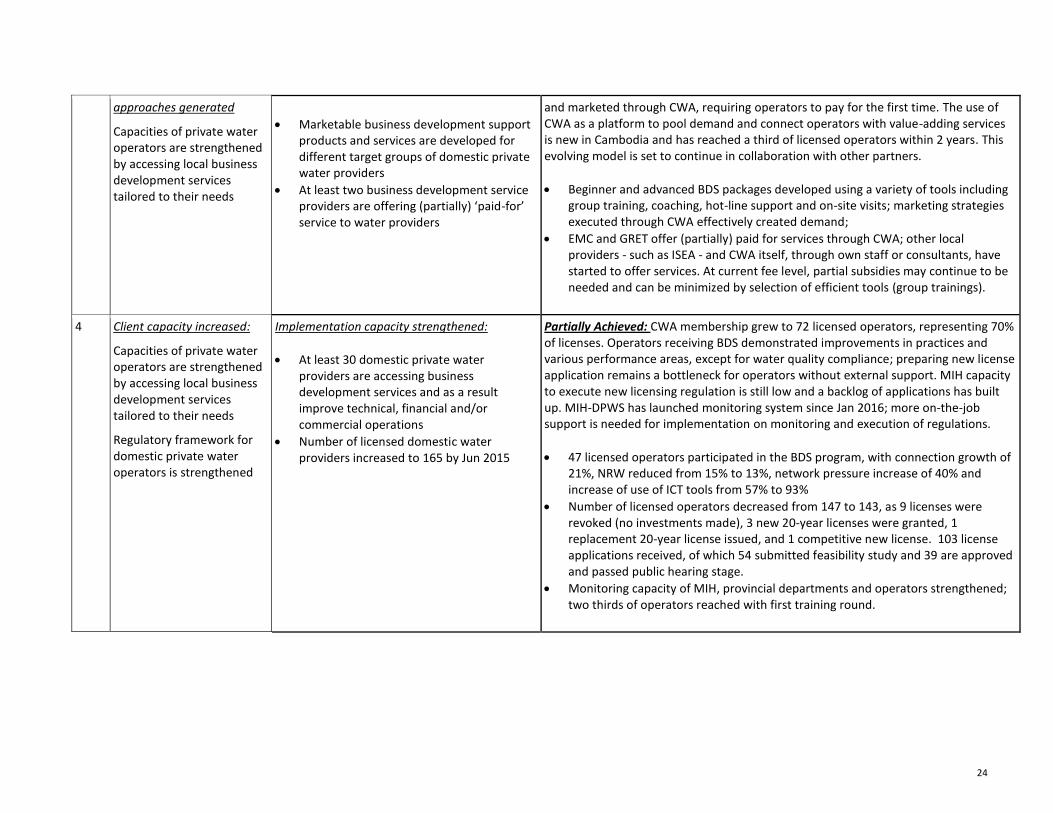
3 Innovative solutions and New innovative approach developed: Achieved: Tailored packages of Business Development Services have been developed
24
approaches generated
Capacities of private water operators are strengthened by accessing local business development services tailored to their needs
Marketable business development support products and services are developed for different target groups of domestic private water providers
At least two business development service providers are offering (partially) ‘paid-for’ service to water providers
and marketed through CWA, requiring operators to pay for the first time. The use of CWA as a platform to pool demand and connect operators with value-adding services is new in Cambodia and has reached a third of licensed operators within 2 years. This evolving model is set to continue in collaboration with other partners.
Beginner and advanced BDS packages developed using a variety of tools including group training, coaching, hot-line support and on-site visits; marketing strategies executed through CWA effectively created demand;
EMC and GRET offer (partially) paid for services through CWA; other local providers - such as ISEA - and CWA itself, through own staff or consultants, have started to offer services. At current fee level, partial subsidies may continue to be needed and can be minimized by selection of efficient tools (group trainings).
4 Client capacity increased:
Capacities of private water operators are strengthened by accessing local business development services tailored to their needs
Regulatory framework for domestic private water operators is strengthened
Implementation capacity strengthened:
At least 30 domestic private water providers are accessing business development services and as a result improve technical, financial and/or commercial operations
Number of licensed domestic water providers increased to 165 by Jun 2015
Partially Achieved: CWA membership grew to 72 licensed operators, representing 70% of licenses. Operators receiving BDS demonstrated improvements in practices and various performance areas, except for water quality compliance; preparing new license application remains a bottleneck for operators without external support. MIH capacity to execute new licensing regulation is still low and a backlog of applications has built up. MIH-DPWS has launched monitoring system since Jan 2016; more on-the-job support is needed for implementation on monitoring and execution of regulations.
47 licensed operators participated in the BDS program, with connection growth of 21%, NRW reduced from 15% to 13%, network pressure increase of 40% and increase of use of ICT tools from 57% to 93%
Number of licensed operators decreased from 147 to 143, as 9 licenses were revoked (no investments made), 3 new 20-year licenses were granted, 1 replacement 20-year license issued, and 1 competitive new license. 103 license applications received, of which 54 submitted feasibility study and 39 are approved and passed public hearing stage.
Monitoring capacity of MIH, provincial departments and operators strengthened; two thirds of operators reached with first training round.
25
4. Implementation Process
This TA has been implemented over a total period of three years and evolved over time, with increasing emphasis on strengthening the Ministry of Industry and Handicraft in response to their request
11. The expanding scope
included: i) Expanding Business Development Services from 30 to a target of 50 operators, ii) Access-to-Finance support from 20 to a new target of 26 operators
12,
iii) Increased assistance to MIH in terms of drafting tariff regulation framework and the establishment of a monitoring system for piped water utilities to strengthen regulatory oversight
The TA was implemented in close coordination with the Ministry of Industry and Handicraft
13, under overall
leadership of the Senior Minister Cham Prasidh, strategic guidance of Secretary of State Ek Sonn Chan, and in day-to-day consultation with staff of the Department of Potable Water Supply, under leadership of its Director(s). The arrangements for collaborating with CWA have been articulated in a letter of exchange. These included quarterly meetings and frequent interactions with CWA’s executive team to stimulate organizational learning, while keeping an arm’s length from decisions being made by CWA’s Board and director. The TA engaged experienced local and international consultants (firms and individuals). A consortium, consisting of GRET and EMC, was recruited to deliver the business development services, as well as the access-to-finance services. The consortium that implemented the support to MIH for the monitoring system was EMC, with Nokor as its local software developer. The following sections provides further description of the implementation process of all aspects of the TA.
4.1. Professionalizing water operators through Business Development Services In close coordination with CWA, a program was developed and implemented by EMC/GRET and CWA staff and was delivered in two phases
Phase A from June 2013 to August 2014: aimed at designing adapted BDS packages and effectively delivering these to 30 water operators ; this included diagnostic of operators and design of pricing
Phase B from September 2014 to November 2015: aimed at improving the delivery of the BDS packages through a better training agenda and extended coaching visits for 20 additional operators. This phase intended to consolidate and strengthen CWA’s role and responsibilities in the delivery process. The final report of the implementation of the BDS program, including tools, results and individual operator profiles is available upon request ( Annex 2)
Implementation followed distinct steps, as illustrated in Figure 4.
11
The Technical Assistance has been extended from June 2015 to December 2015 to accommodate these requests and scale-up results during implementation as additional budget was made available for this initiative 12
Targets for approved loan applications were raised from 10 to 18. 13
In September 2013, the Ministry of Industry, Mines and Energy was split into two: Ministry of Industry and Handicraft and Ministry of Energy and Mines, The water division was then hosted with MIH. While this opened new opportunities for the TA, it also naturally led to a period of instability and delay, which has resulted in some delays in implementation.
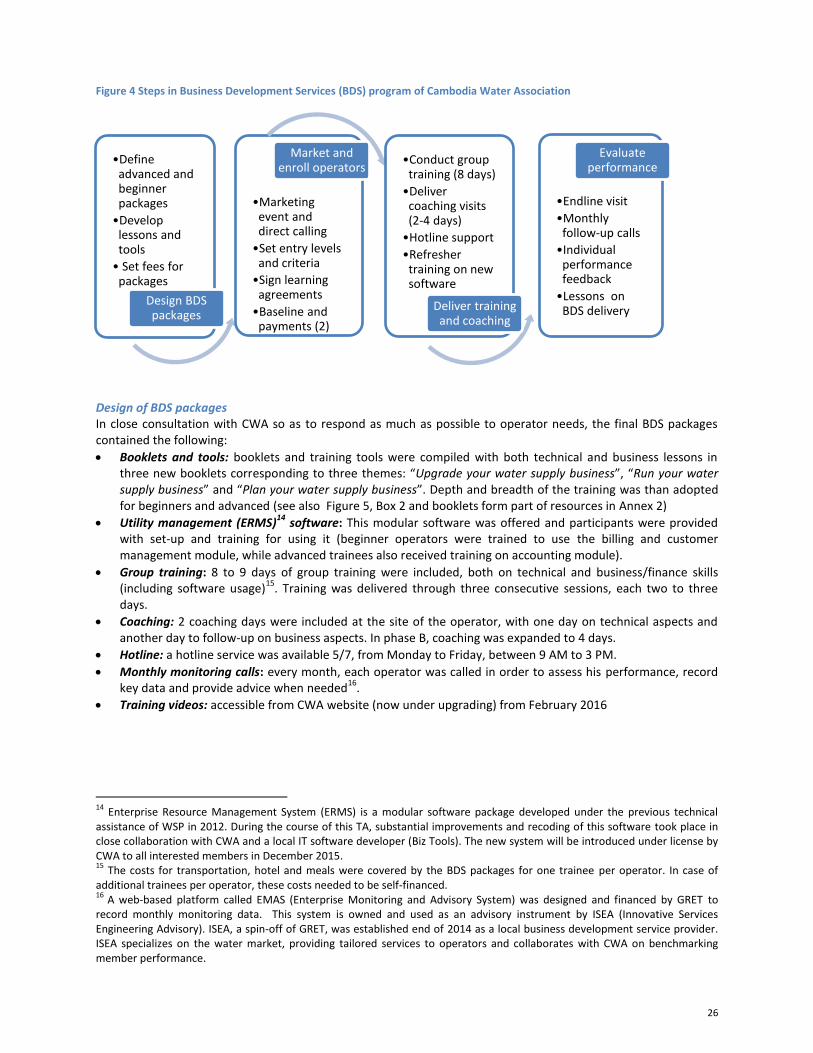
26
Figure 4 Steps in Business Development Services (BDS) program of Cambodia Water Association
Design of BDS packages In close consultation with CWA so as to respond as much as possible to operator needs, the final BDS packages contained the following:
Booklets and tools: booklets and training tools were compiled with both technical and business lessons in three new booklets corresponding to three themes: “Upgrade your water supply business”, “Run your water supply business” and “Plan your water supply business”. Depth and breadth of the training was than adopted for beginners and advanced (see also Figure 5, Box 2 and booklets form part of resources in Annex 2)
Utility management (ERMS)14
software: This modular software was offered and participants were provided with set-up and training for using it (beginner operators were trained to use the billing and customer management module, while advanced trainees also received training on accounting module).
Group training: 8 to 9 days of group training were included, both on technical and business/finance skills (including software usage)
15. Training was delivered through three consecutive sessions, each two to three
days.
Coaching: 2 coaching days were included at the site of the operator, with one day on technical aspects and another day to follow-up on business aspects. In phase B, coaching was expanded to 4 days.
Hotline: a hotline service was available 5/7, from Monday to Friday, between 9 AM to 3 PM.
Monthly monitoring calls: every month, each operator was called in order to assess his performance, record key data and provide advice when needed
16.
Training videos: accessible from CWA website (now under upgrading) from February 2016
14
Enterprise Resource Management System (ERMS) is a modular software package developed under the previous technical assistance of WSP in 2012. During the course of this TA, substantial improvements and recoding of this software took place in close collaboration with CWA and a local IT software developer (Biz Tools). The new system will be introduced under license by CWA to all interested members in December 2015. 15
The costs for transportation, hotel and meals were covered by the BDS packages for one trainee per operator. In case of additional trainees per operator, these costs needed to be self-financed. 16
A web-based platform called EMAS (Enterprise Monitoring and Advisory System) was designed and financed by GRET to record monthly monitoring data. This system is owned and used as an advisory instrument by ISEA (Innovative Services Engineering Advisory). ISEA, a spin-off of GRET, was established end of 2014 as a local business development service provider. ISEA specializes on the water market, providing tailored services to operators and collaborates with CWA on benchmarking member performance.
•Define advanced and beginner packages
•Develop lessons and tools
• Set fees for packages
Design BDS packages
•Marketing event and direct calling
•Set entry levels and criteria
•Sign learning agreements
•Baseline and payments (2)
Market and enroll operators
•Conduct group training (8 days)
•Deliver coaching visits (2-4 days)
•Hotline support
•Refresher training on new software
Deliver training and coaching
•Endline visit
•Monthly follow-up calls
•Individual performance feedback
•Lessons on BDS delivery
Evaluate performance
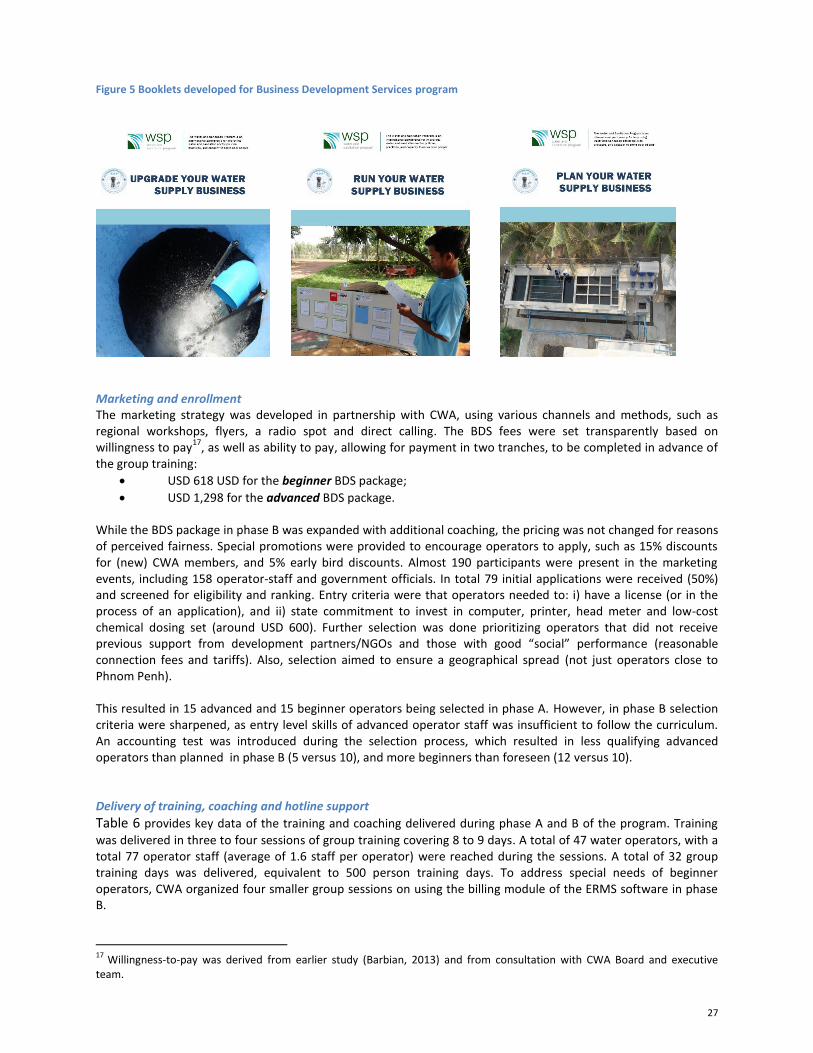
27
Figure 5 Booklets developed for Business Development Services program
Marketing and enrollment The marketing strategy was developed in partnership with CWA, using various channels and methods, such as regional workshops, flyers, a radio spot and direct calling. The BDS fees were set transparently based on willingness to pay
17, as well as ability to pay, allowing for payment in two tranches, to be completed in advance of
the group training:
USD 618 USD for the beginner BDS package;
USD 1,298 for the advanced BDS package. While the BDS package in phase B was expanded with additional coaching, the pricing was not changed for reasons of perceived fairness. Special promotions were provided to encourage operators to apply, such as 15% discounts for (new) CWA members, and 5% early bird discounts. Almost 190 participants were present in the marketing events, including 158 operator-staff and government officials. In total 79 initial applications were received (50%) and screened for eligibility and ranking. Entry criteria were that operators needed to: i) have a license (or in the process of an application), and ii) state commitment to invest in computer, printer, head meter and low-cost chemical dosing set (around USD 600). Further selection was done prioritizing operators that did not receive previous support from development partners/NGOs and those with good “social” performance (reasonable connection fees and tariffs). Also, selection aimed to ensure a geographical spread (not just operators close to Phnom Penh). This resulted in 15 advanced and 15 beginner operators being selected in phase A. However, in phase B selection criteria were sharpened, as entry level skills of advanced operator staff was insufficient to follow the curriculum. An accounting test was introduced during the selection process, which resulted in less qualifying advanced operators than planned in phase B (5 versus 10), and more beginners than foreseen (12 versus 10). Delivery of training, coaching and hotline support
Table 6 provides key data of the training and coaching delivered during phase A and B of the program. Training
was delivered in three to four sessions of group training covering 8 to 9 days. A total of 47 water operators, with a total 77 operator staff (average of 1.6 staff per operator) were reached during the sessions. A total of 32 group training days was delivered, equivalent to 500 person training days. To address special needs of beginner operators, CWA organized four smaller group sessions on using the billing module of the ERMS software in phase B.
17
Willingness-to-pay was derived from earlier study (Barbian, 2013) and from consultation with CWA Board and executive team.
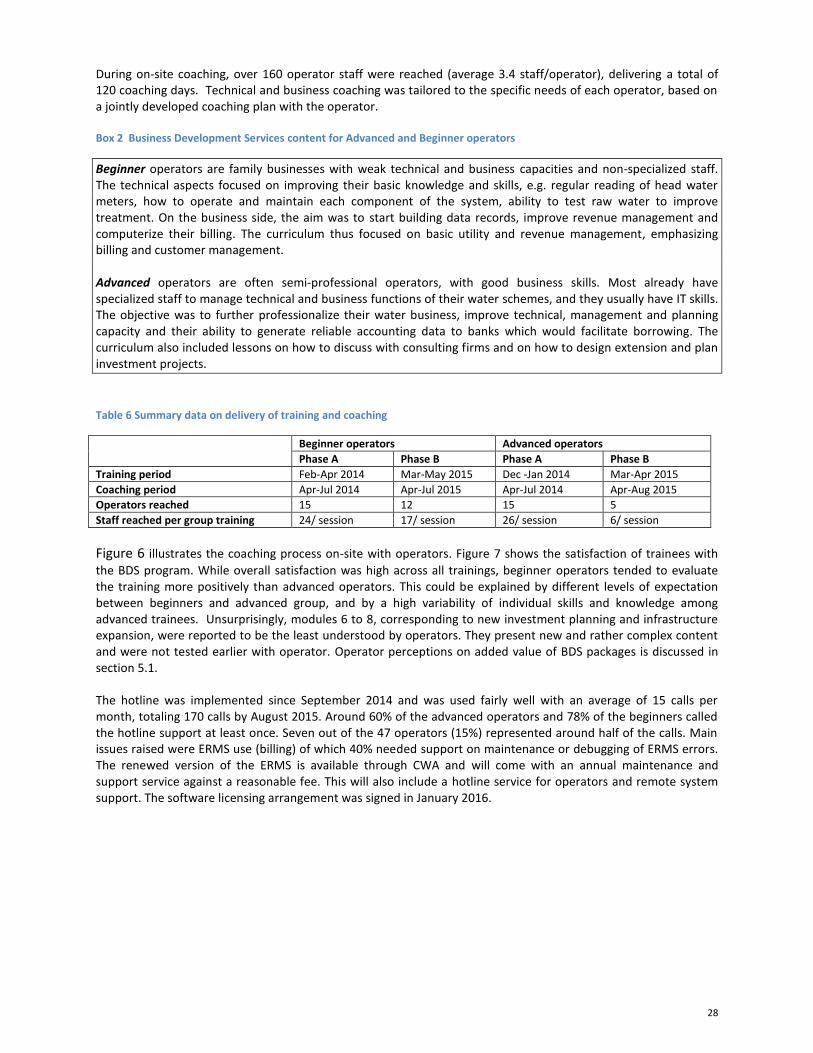
28
During on-site coaching, over 160 operator staff were reached (average 3.4 staff/operator), delivering a total of 120 coaching days. Technical and business coaching was tailored to the specific needs of each operator, based on a jointly developed coaching plan with the operator. Box 2 Business Development Services content for Advanced and Beginner operators
Beginner operators are family businesses with weak technical and business capacities and non-specialized staff. The technical aspects focused on improving their basic knowledge and skills, e.g. regular reading of head water meters, how to operate and maintain each component of the system, ability to test raw water to improve treatment. On the business side, the aim was to start building data records, improve revenue management and computerize their billing. The curriculum thus focused on basic utility and revenue management, emphasizing billing and customer management. Advanced operators are often semi-professional operators, with good business skills. Most already have specialized staff to manage technical and business functions of their water schemes, and they usually have IT skills. The objective was to further professionalize their water business, improve technical, management and planning capacity and their ability to generate reliable accounting data to banks which would facilitate borrowing. The curriculum also included lessons on how to discuss with consulting firms and on how to design extension and plan investment projects.
Table 6 Summary data on delivery of training and coaching
Beginner operators Advanced operators
Phase A Phase B Phase A Phase B
Training period Feb-Apr 2014 Mar-May 2015 Dec -Jan 2014 Mar-Apr 2015
Coaching period Apr-Jul 2014 Apr-Jul 2015 Apr-Jul 2014 Apr-Aug 2015
Operators reached 15 12 15 5
Staff reached per group training 24/ session 17/ session 26/ session 6/ session
Figure 6 illustrates the coaching process on-site with operators. Figure 7 shows the satisfaction of trainees with
the BDS program. While overall satisfaction was high across all trainings, beginner operators tended to evaluate the training more positively than advanced operators. This could be explained by different levels of expectation between beginners and advanced group, and by a high variability of individual skills and knowledge among advanced trainees. Unsurprisingly, modules 6 to 8, corresponding to new investment planning and infrastructure expansion, were reported to be the least understood by operators. They present new and rather complex content and were not tested earlier with operator. Operator perceptions on added value of BDS packages is discussed in section 5.1. The hotline was implemented since September 2014 and was used fairly well with an average of 15 calls per month, totaling 170 calls by August 2015. Around 60% of the advanced operators and 78% of the beginners called the hotline support at least once. Seven out of the 47 operators (15%) represented around half of the calls. Main issues raised were ERMS use (billing) of which 40% needed support on maintenance or debugging of ERMS errors. The renewed version of the ERMS is available through CWA and will come with an annual maintenance and support service against a reasonable fee. This will also include a hotline service for operators and remote system support. The software licensing arrangement was signed in January 2016.
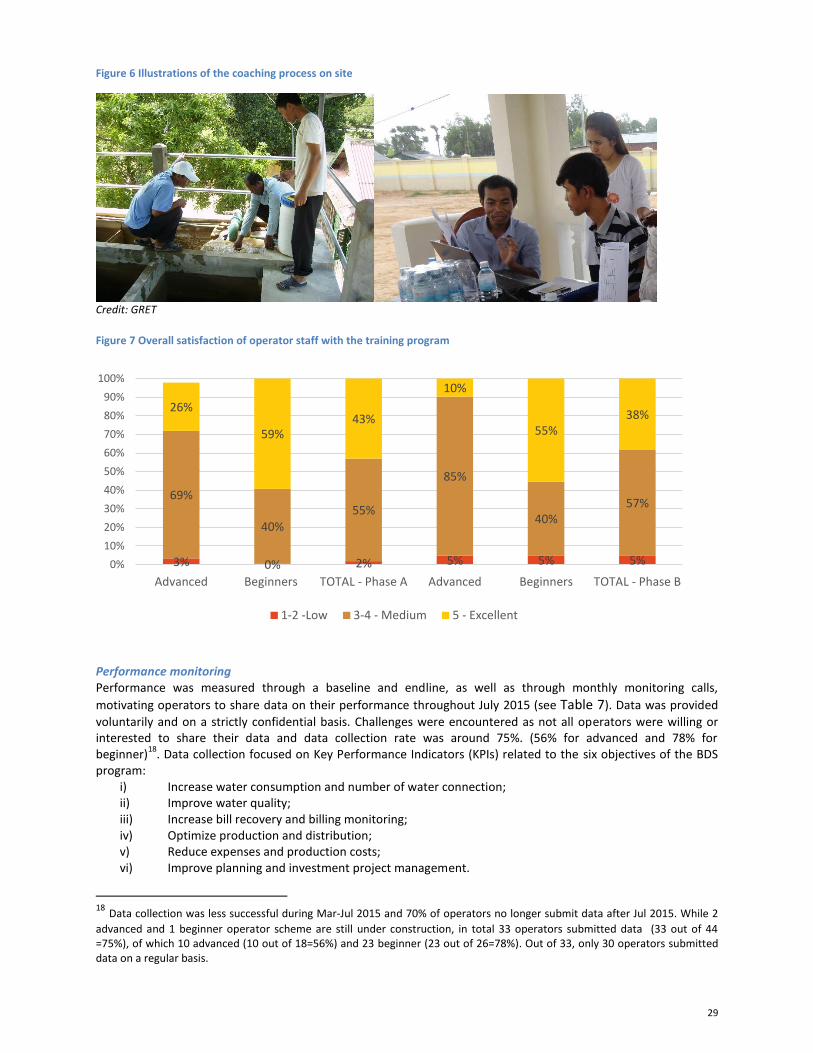
29
Figure 6 Illustrations of the coaching process on site
Credit: GRET
Figure 7 Overall satisfaction of operator staff with the training program
Performance monitoring Performance was measured through a baseline and endline, as well as through monthly monitoring calls,
motivating operators to share data on their performance throughout July 2015 (see Table 7). Data was provided
voluntarily and on a strictly confidential basis. Challenges were encountered as not all operators were willing or interested to share their data and data collection rate was around 75%. (56% for advanced and 78% for beginner)
18. Data collection focused on Key Performance Indicators (KPIs) related to the six objectives of the BDS
program: i) Increase water consumption and number of water connection; ii) Improve water quality; iii) Increase bill recovery and billing monitoring; iv) Optimize production and distribution; v) Reduce expenses and production costs; vi) Improve planning and investment project management.
18 Data collection was less successful during Mar-Jul 2015 and 70% of operators no longer submit data after Jul 2015. While 2
advanced and 1 beginner operator scheme are still under construction, in total 33 operators submitted data (33 out of 44 =75%), of which 10 advanced (10 out of 18=56%) and 23 beginner (23 out of 26=78%). Out of 33, only 30 operators submitted data on a regular basis.
3% 0% 2% 5% 5% 5%
69%
40% 55%
85%
40% 57%
26%
59% 43%
10%
55% 38%
0%
10%
20%
30%
40%
50%
60%
70%
80%
90%
100%
Advanced Beginners TOTAL - Phase A Advanced Beginners TOTAL - Phase B
1-2 -Low 3-4 - Medium 5 - Excellent
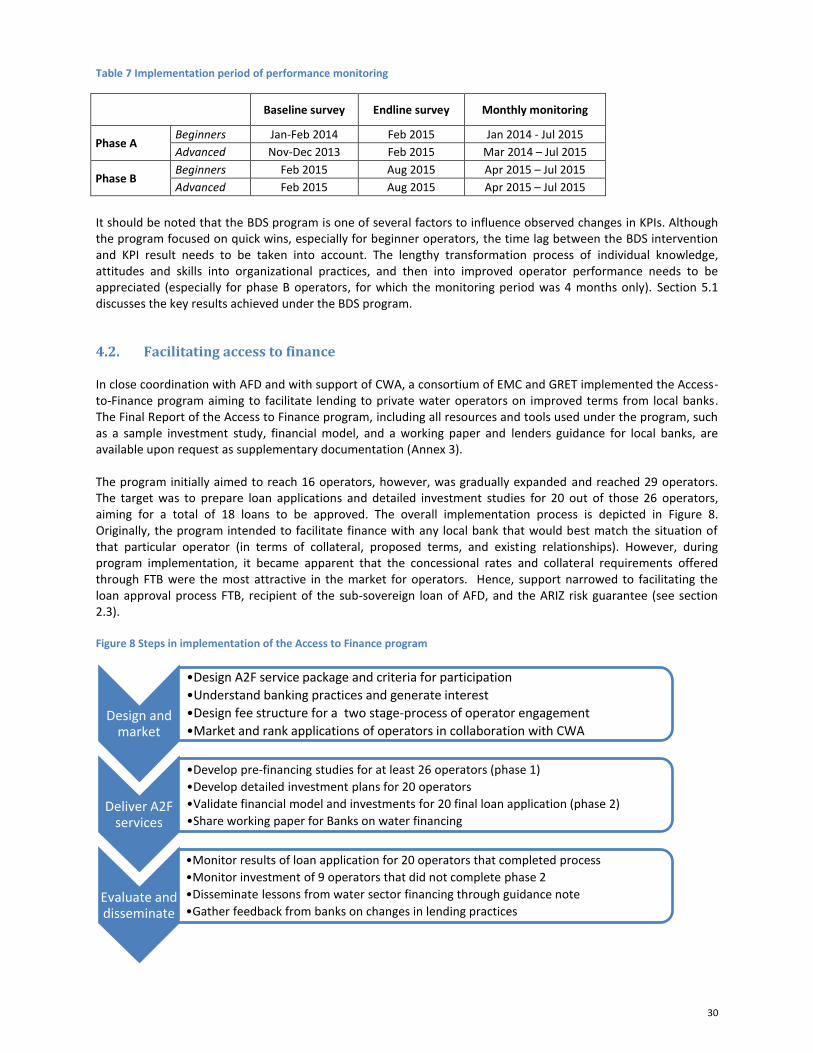
30
Table 7 Implementation period of performance monitoring
Baseline survey Endline survey Monthly monitoring
Phase A Beginners Jan-Feb 2014 Feb 2015 Jan 2014 - Jul 2015
Advanced Nov-Dec 2013 Feb 2015 Mar 2014 – Jul 2015
Phase B Beginners Feb 2015 Aug 2015 Apr 2015 – Jul 2015
Advanced Feb 2015 Aug 2015 Apr 2015 – Jul 2015
It should be noted that the BDS program is one of several factors to influence observed changes in KPIs. Although the program focused on quick wins, especially for beginner operators, the time lag between the BDS intervention and KPI result needs to be taken into account. The lengthy transformation process of individual knowledge, attitudes and skills into organizational practices, and then into improved operator performance needs to be appreciated (especially for phase B operators, for which the monitoring period was 4 months only). Section 5.1 discusses the key results achieved under the BDS program.
4.2. Facilitating access to finance In close coordination with AFD and with support of CWA, a consortium of EMC and GRET implemented the Access-to-Finance program aiming to facilitate lending to private water operators on improved terms from local banks. The Final Report of the Access to Finance program, including all resources and tools used under the program, such as a sample investment study, financial model, and a working paper and lenders guidance for local banks, are available upon request as supplementary documentation (Annex 3). The program initially aimed to reach 16 operators, however, was gradually expanded and reached 29 operators. The target was to prepare loan applications and detailed investment studies for 20 out of those 26 operators, aiming for a total of 18 loans to be approved. The overall implementation process is depicted in Figure 8. Originally, the program intended to facilitate finance with any local bank that would best match the situation of that particular operator (in terms of collateral, proposed terms, and existing relationships). However, during program implementation, it became apparent that the concessional rates and collateral requirements offered through FTB were the most attractive in the market for operators. Hence, support narrowed to facilitating the loan approval process FTB, recipient of the sub-sovereign loan of AFD, and the ARIZ risk guarantee (see section 2.3). Figure 8 Steps in implementation of the Access to Finance program
Design and market
•Design A2F service package and criteria for participation
•Understand banking practices and generate interest
•Design fee structure for a two stage-process of operator engagement
•Market and rank applications of operators in collaboration with CWA
Deliver A2F services
•Develop pre-financing studies for at least 26 operators (phase 1)
•Develop detailed investment plans for 20 operators
•Validate financial model and investments for 20 final loan application (phase 2)
•Share working paper for Banks on water financing
Evaluate and disseminate
•Monitor results of loan application for 20 operators that completed process
•Monitor investment of 9 operators that did not complete phase 2
•Disseminate lessons from water sector financing through guidance note
•Gather feedback from banks on changes in lending practices
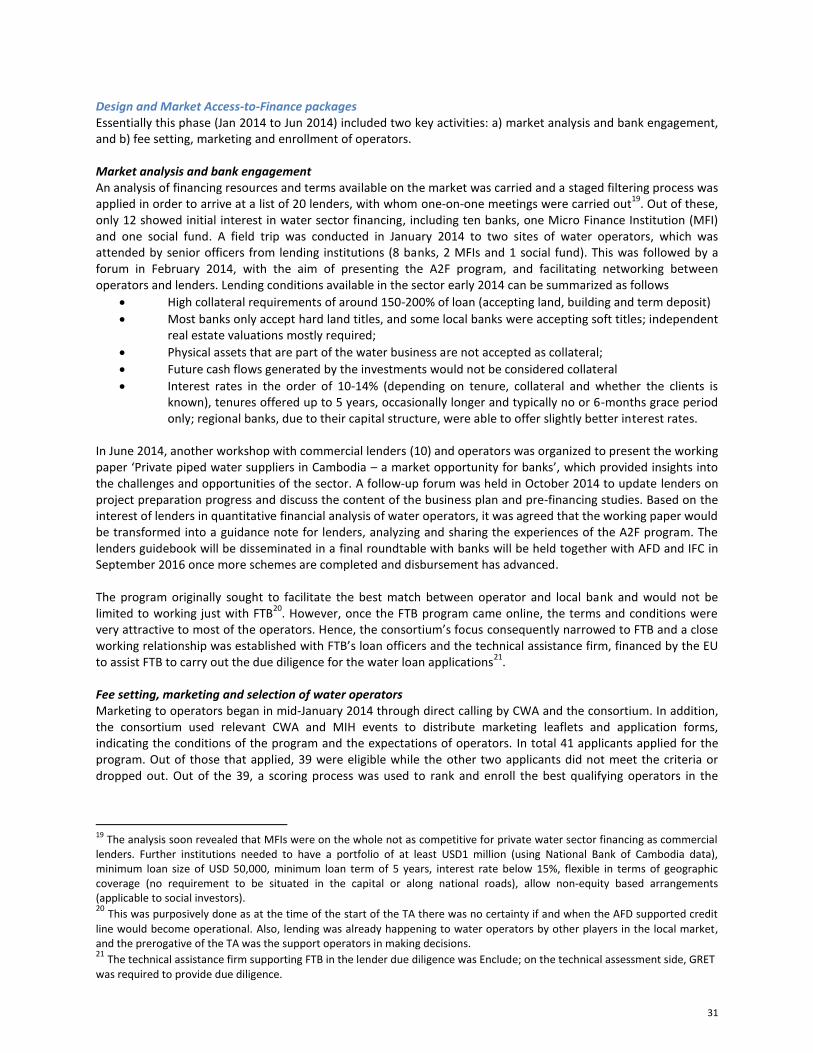
31
Design and Market Access-to-Finance packages Essentially this phase (Jan 2014 to Jun 2014) included two key activities: a) market analysis and bank engagement, and b) fee setting, marketing and enrollment of operators. Market analysis and bank engagement An analysis of financing resources and terms available on the market was carried and a staged filtering process was applied in order to arrive at a list of 20 lenders, with whom one-on-one meetings were carried out
19. Out of these,
only 12 showed initial interest in water sector financing, including ten banks, one Micro Finance Institution (MFI) and one social fund. A field trip was conducted in January 2014 to two sites of water operators, which was attended by senior officers from lending institutions (8 banks, 2 MFIs and 1 social fund). This was followed by a forum in February 2014, with the aim of presenting the A2F program, and facilitating networking between operators and lenders. Lending conditions available in the sector early 2014 can be summarized as follows
High collateral requirements of around 150-200% of loan (accepting land, building and term deposit)
Most banks only accept hard land titles, and some local banks were accepting soft titles; independent real estate valuations mostly required;
Physical assets that are part of the water business are not accepted as collateral;
Future cash flows generated by the investments would not be considered collateral
Interest rates in the order of 10-14% (depending on tenure, collateral and whether the clients is known), tenures offered up to 5 years, occasionally longer and typically no or 6-months grace period only; regional banks, due to their capital structure, were able to offer slightly better interest rates.
In June 2014, another workshop with commercial lenders (10) and operators was organized to present the working paper ‘Private piped water suppliers in Cambodia – a market opportunity for banks’, which provided insights into the challenges and opportunities of the sector. A follow-up forum was held in October 2014 to update lenders on project preparation progress and discuss the content of the business plan and pre-financing studies. Based on the interest of lenders in quantitative financial analysis of water operators, it was agreed that the working paper would be transformed into a guidance note for lenders, analyzing and sharing the experiences of the A2F program. The lenders guidebook will be disseminated in a final roundtable with banks will be held together with AFD and IFC in September 2016 once more schemes are completed and disbursement has advanced. The program originally sought to facilitate the best match between operator and local bank and would not be limited to working just with FTB
20. However, once the FTB program came online, the terms and conditions were
very attractive to most of the operators. Hence, the consortium’s focus consequently narrowed to FTB and a close working relationship was established with FTB’s loan officers and the technical assistance firm, financed by the EU to assist FTB to carry out the due diligence for the water loan applications
21.
Fee setting, marketing and selection of water operators Marketing to operators began in mid-January 2014 through direct calling by CWA and the consortium. In addition, the consortium used relevant CWA and MIH events to distribute marketing leaflets and application forms, indicating the conditions of the program and the expectations of operators. In total 41 applicants applied for the program. Out of those that applied, 39 were eligible while the other two applicants did not meet the criteria or dropped out. Out of the 39, a scoring process was used to rank and enroll the best qualifying operators in the
19
The analysis soon revealed that MFIs were on the whole not as competitive for private water sector financing as commercial lenders. Further institutions needed to have a portfolio of at least USD1 million (using National Bank of Cambodia data), minimum loan size of USD 50,000, minimum loan term of 5 years, interest rate below 15%, flexible in terms of geographic coverage (no requirement to be situated in the capital or along national roads), allow non-equity based arrangements (applicable to social investors). 20
This was purposively done as at the time of the start of the TA there was no certainty if and when the AFD supported credit
line would become operational. Also, lending was already happening to water operators by other players in the local market, and the prerogative of the TA was the support operators in making decisions. 21
The technical assistance firm supporting FTB in the lender due diligence was Enclude; on the technical assessment side, GRET was required to provide due diligence.
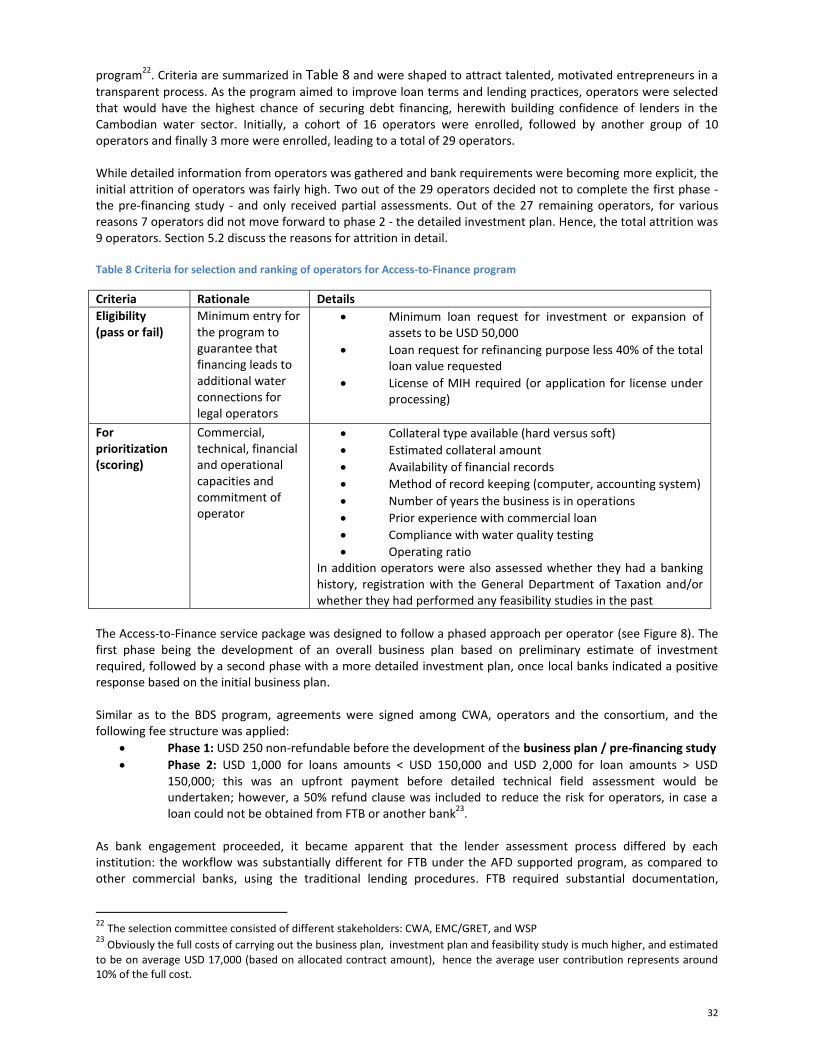
32
program22
. Criteria are summarized in Table 8 and were shaped to attract talented, motivated entrepreneurs in a
transparent process. As the program aimed to improve loan terms and lending practices, operators were selected that would have the highest chance of securing debt financing, herewith building confidence of lenders in the Cambodian water sector. Initially, a cohort of 16 operators were enrolled, followed by another group of 10 operators and finally 3 more were enrolled, leading to a total of 29 operators. While detailed information from operators was gathered and bank requirements were becoming more explicit, the initial attrition of operators was fairly high. Two out of the 29 operators decided not to complete the first phase - the pre-financing study - and only received partial assessments. Out of the 27 remaining operators, for various reasons 7 operators did not move forward to phase 2 - the detailed investment plan. Hence, the total attrition was 9 operators. Section 5.2 discuss the reasons for attrition in detail. Table 8 Criteria for selection and ranking of operators for Access-to-Finance program
Criteria Rationale Details
Eligibility (pass or fail)
Minimum entry for the program to guarantee that financing leads to additional water connections for legal operators
Minimum loan request for investment or expansion of assets to be USD 50,000
Loan request for refinancing purpose less 40% of the total loan value requested
License of MIH required (or application for license under processing)
For prioritization (scoring)
Commercial, technical, financial and operational capacities and commitment of operator
Collateral type available (hard versus soft)
Estimated collateral amount
Availability of financial records
Method of record keeping (computer, accounting system)
Number of years the business is in operations
Prior experience with commercial loan
Compliance with water quality testing
Operating ratio In addition operators were also assessed whether they had a banking history, registration with the General Department of Taxation and/or whether they had performed any feasibility studies in the past
The Access-to-Finance service package was designed to follow a phased approach per operator (see Figure 8). The first phase being the development of an overall business plan based on preliminary estimate of investment required, followed by a second phase with a more detailed investment plan, once local banks indicated a positive response based on the initial business plan. Similar as to the BDS program, agreements were signed among CWA, operators and the consortium, and the following fee structure was applied:
Phase 1: USD 250 non-refundable before the development of the business plan / pre-financing study
Phase 2: USD 1,000 for loans amounts < USD 150,000 and USD 2,000 for loan amounts > USD 150,000; this was an upfront payment before detailed technical field assessment would be undertaken; however, a 50% refund clause was included to reduce the risk for operators, in case a loan could not be obtained from FTB or another bank
23.
As bank engagement proceeded, it became apparent that the lender assessment process differed by each institution: the workflow was substantially different for FTB under the AFD supported program, as compared to other commercial banks, using the traditional lending procedures. FTB required substantial documentation,
22
The selection committee consisted of different stakeholders: CWA, EMC/GRET, and WSP 23
Obviously the full costs of carrying out the business plan, investment plan and feasibility study is much higher, and estimated
to be on average USD 17,000 (based on allocated contract amount), hence the average user contribution represents around 10% of the full cost.
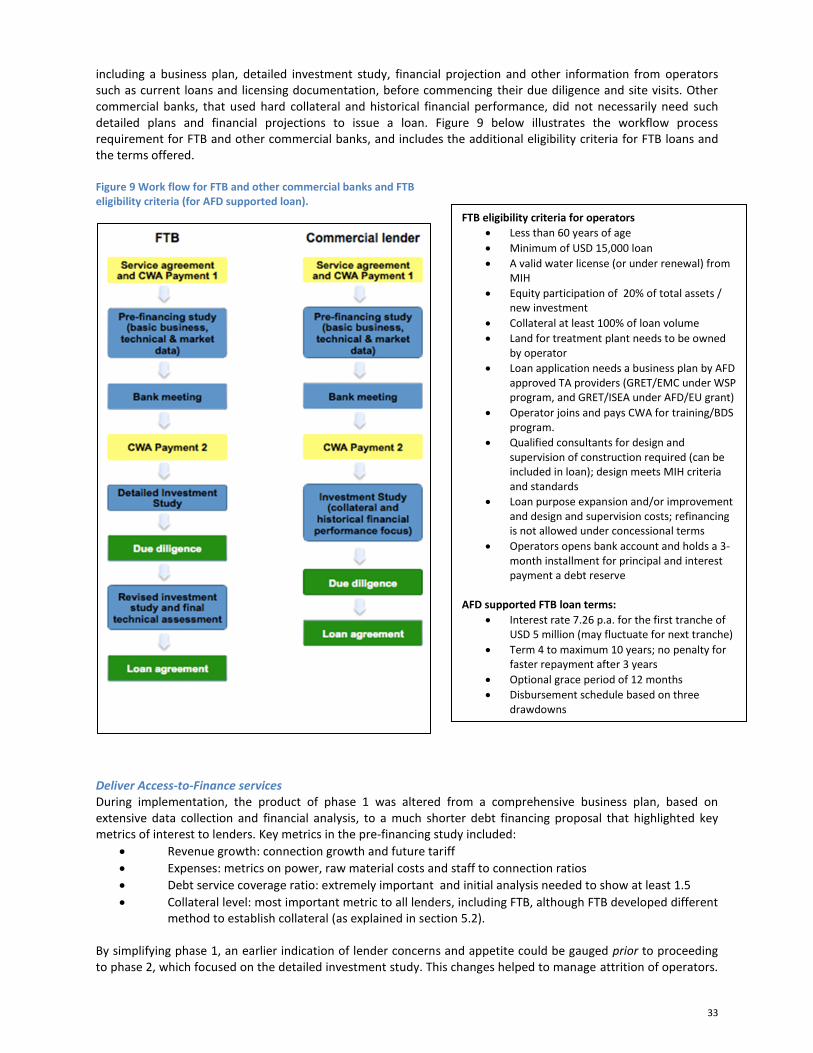
33
including a business plan, detailed investment study, financial projection and other information from operators such as current loans and licensing documentation, before commencing their due diligence and site visits. Other commercial banks, that used hard collateral and historical financial performance, did not necessarily need such detailed plans and financial projections to issue a loan. Figure 9 below illustrates the workflow process requirement for FTB and other commercial banks, and includes the additional eligibility criteria for FTB loans and the terms offered. Figure 9 Work flow for FTB and other commercial banks and FTB eligibility criteria (for AFD supported loan).
Deliver Access-to-Finance services During implementation, the product of phase 1 was altered from a comprehensive business plan, based on extensive data collection and financial analysis, to a much shorter debt financing proposal that highlighted key metrics of interest to lenders. Key metrics in the pre-financing study included:
Revenue growth: connection growth and future tariff
Expenses: metrics on power, raw material costs and staff to connection ratios
Debt service coverage ratio: extremely important and initial analysis needed to show at least 1.5
Collateral level: most important metric to all lenders, including FTB, although FTB developed different method to establish collateral (as explained in section 5.2).
By simplifying phase 1, an earlier indication of lender concerns and appetite could be gauged prior to proceeding to phase 2, which focused on the detailed investment study. This changes helped to manage attrition of operators.
FTB eligibility criteria for operators
Less than 60 years of age
Minimum of USD 15,000 loan
A valid water license (or under renewal) from MIH
Equity participation of 20% of total assets / new investment
Collateral at least 100% of loan volume
Land for treatment plant needs to be owned by operator
Loan application needs a business plan by AFD approved TA providers (GRET/EMC under WSP program, and GRET/ISEA under AFD/EU grant)
Operator joins and pays CWA for training/BDS program.
Qualified consultants for design and supervision of construction required (can be included in loan); design meets MIH criteria and standards
Loan purpose expansion and/or improvement and design and supervision costs; refinancing is not allowed under concessional terms
Operators opens bank account and holds a 3-month installment for principal and interest payment a debt reserve
AFD supported FTB loan terms:
Interest rate 7.26 p.a. for the first tranche of USD 5 million (may fluctuate for next tranche)
Term 4 to maximum 10 years; no penalty for faster repayment after 3 years
Optional grace period of 12 months
Disbursement schedule based on three drawdowns
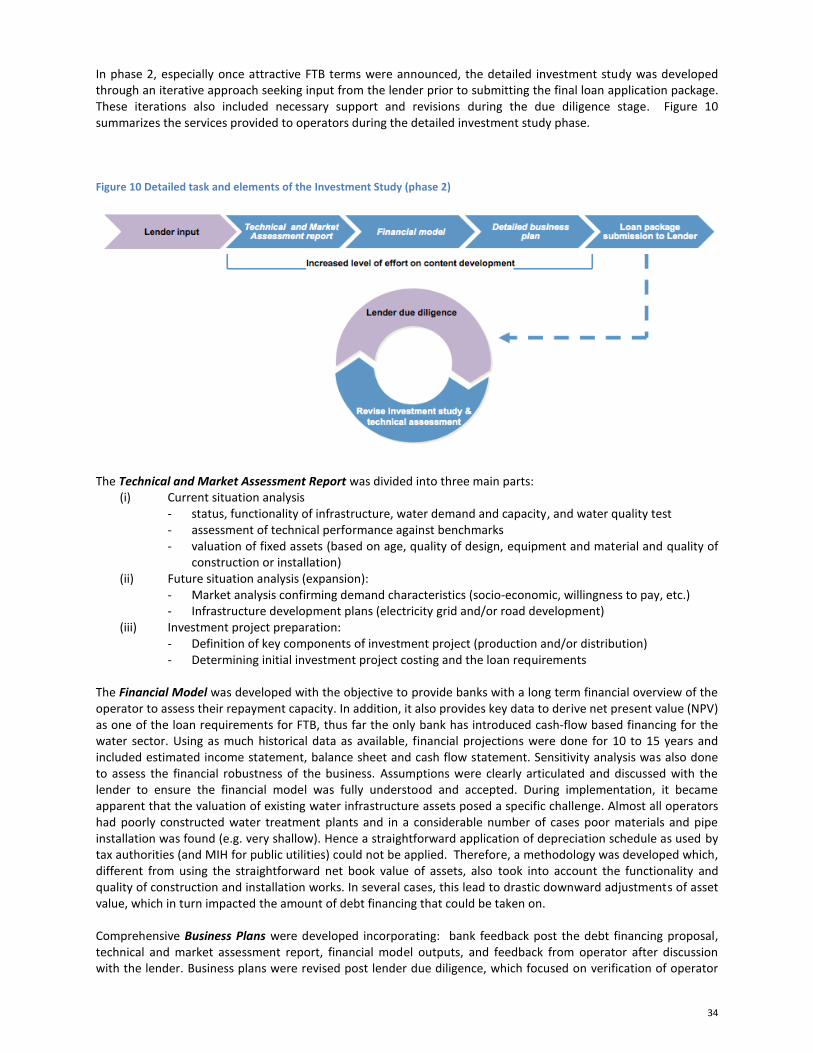
34
In phase 2, especially once attractive FTB terms were announced, the detailed investment study was developed through an iterative approach seeking input from the lender prior to submitting the final loan application package. These iterations also included necessary support and revisions during the due diligence stage. Figure 10 summarizes the services provided to operators during the detailed investment study phase. Figure 10 Detailed task and elements of the Investment Study (phase 2)
The Technical and Market Assessment Report was divided into three main parts:
(i) Current situation analysis - status, functionality of infrastructure, water demand and capacity, and water quality test - assessment of technical performance against benchmarks - valuation of fixed assets (based on age, quality of design, equipment and material and quality of
construction or installation) (ii) Future situation analysis (expansion):
- Market analysis confirming demand characteristics (socio-economic, willingness to pay, etc.) - Infrastructure development plans (electricity grid and/or road development)
(iii) Investment project preparation: - Definition of key components of investment project (production and/or distribution) - Determining initial investment project costing and the loan requirements
The Financial Model was developed with the objective to provide banks with a long term financial overview of the operator to assess their repayment capacity. In addition, it also provides key data to derive net present value (NPV) as one of the loan requirements for FTB, thus far the only bank has introduced cash-flow based financing for the water sector. Using as much historical data as available, financial projections were done for 10 to 15 years and included estimated income statement, balance sheet and cash flow statement. Sensitivity analysis was also done to assess the financial robustness of the business. Assumptions were clearly articulated and discussed with the lender to ensure the financial model was fully understood and accepted. During implementation, it became apparent that the valuation of existing water infrastructure assets posed a specific challenge. Almost all operators had poorly constructed water treatment plants and in a considerable number of cases poor materials and pipe installation was found (e.g. very shallow). Hence a straightforward application of depreciation schedule as used by tax authorities (and MIH for public utilities) could not be applied. Therefore, a methodology was developed which, different from using the straightforward net book value of assets, also took into account the functionality and quality of construction and installation works. In several cases, this lead to drastic downward adjustments of asset value, which in turn impacted the amount of debt financing that could be taken on. Comprehensive Business Plans were developed incorporating: bank feedback post the debt financing proposal, technical and market assessment report, financial model outputs, and feedback from operator after discussion with the lender. Business plans were revised post lender due diligence, which focused on verification of operator
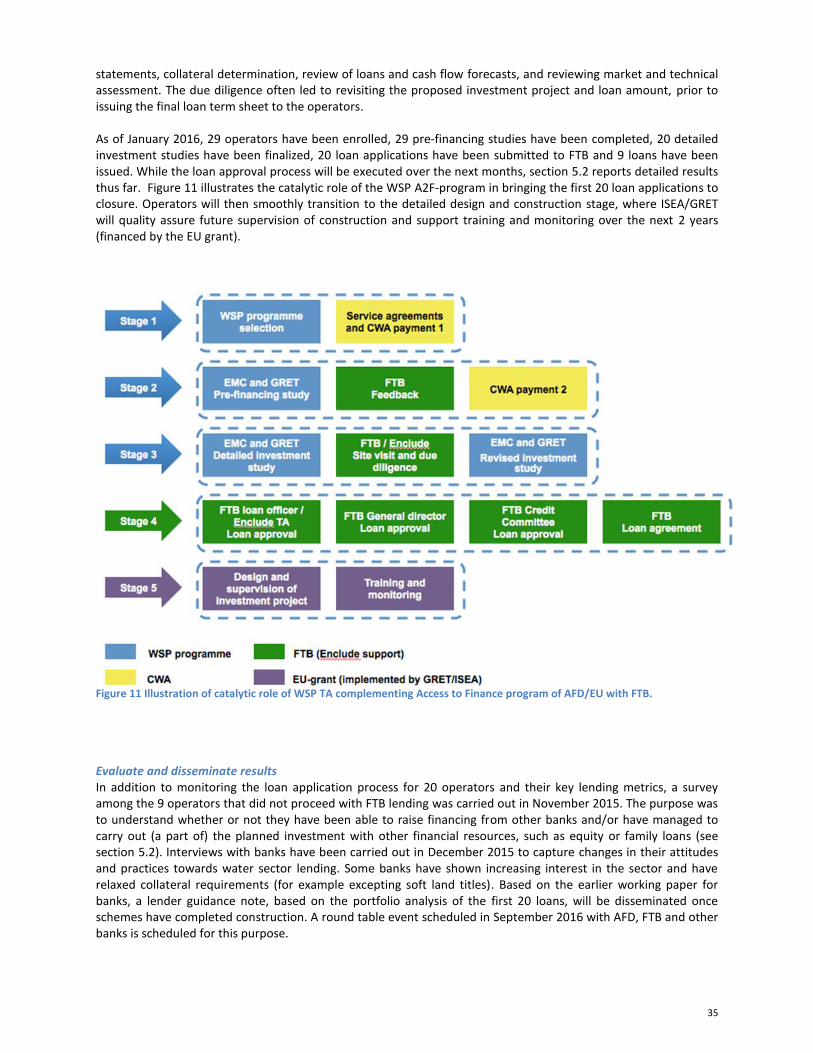
35
statements, collateral determination, review of loans and cash flow forecasts, and reviewing market and technical assessment. The due diligence often led to revisiting the proposed investment project and loan amount, prior to issuing the final loan term sheet to the operators. As of January 2016, 29 operators have been enrolled, 29 pre-financing studies have been completed, 20 detailed investment studies have been finalized, 20 loan applications have been submitted to FTB and 9 loans have been issued. While the loan approval process will be executed over the next months, section 5.2 reports detailed results thus far. Figure 11 illustrates the catalytic role of the WSP A2F-program in bringing the first 20 loan applications to closure. Operators will then smoothly transition to the detailed design and construction stage, where ISEA/GRET will quality assure future supervision of construction and support training and monitoring over the next 2 years (financed by the EU grant).
Figure 11 Illustration of catalytic role of WSP TA complementing Access to Finance program of AFD/EU with FTB.
Evaluate and disseminate results In addition to monitoring the loan application process for 20 operators and their key lending metrics, a survey among the 9 operators that did not proceed with FTB lending was carried out in November 2015. The purpose was to understand whether or not they have been able to raise financing from other banks and/or have managed to carry out (a part of) the planned investment with other financial resources, such as equity or family loans (see section 5.2). Interviews with banks have been carried out in December 2015 to capture changes in their attitudes and practices towards water sector lending. Some banks have shown increasing interest in the sector and have relaxed collateral requirements (for example excepting soft land titles). Based on the earlier working paper for banks, a lender guidance note, based on the portfolio analysis of the first 20 loans, will be disseminated once schemes have completed construction. A round table event scheduled in September 2016 with AFD, FTB and other banks is scheduled for this purpose.
36
4.3. Improving regulatory environment and monitoring The need for a comprehensive legal and institutional reform in the water sector has long been underscored in various sector documents (ADB, 2012) (World Bank, 2013) (Water and Sanitation Program, 2015) and is also articulated in the government’s own NSDP 2014-2018. After an unsuccessful attempt to formulate a comprehensive Water Law in 2005, MIH has recently restarted this long-term initiative with support of JICA. Based on discussions with MIH, the TA aimed to achieve gradual improvements that could be introduced under the mandate of MIH. Earlier identified bottlenecks for private sector service provision in Cambodia were prioritized and focused on three key issues:
(i) Support to drafting a ministerial decree on licensing (ii) Support to developing a framework for economic regulation, including drafting decree on tariff
(iii) Support to the establishment of and capacity building for a monitoring system for piped water services
Ministerial decree on licensing This first engagement of WSP started in early 2013 and built on previous efforts of the USAID Small and Medium Enterprise project to improve the licensing regime for water operators. Common frustrations expressed by private water operators related to the fact that:
licenses are only valid for 3 years, not aligned with the lumpy nature of water investments
issuance of licenses is complex with the need for multiple approvals at commune, district, provincial and ministerial level
lack of clarity and competition encourages non-transparent informal fees (or licenses being “bought” for speculative purposes, without investments being carried out)
lack of regulations stipulating the conditions for renewal, revocation or suspension of licenses On the other hand, the existing licensing regime allowed operators a lot of discretion, such as mostly determining their own tariff and connection fees (a sort of market negotiated rate with local communes). The license included minimum information on the service obligations of the operator, and de-facto remained largely unregulated. This resulted in operators not expanding their services to villages beyond the denser urban areas, little effort to connect poor households and low compliance with service standards in terms of pressure, water quality, etc. (Frenoux, 2013) (see section 5.4). A senior legal international consultant was mobilized to help draft a new licensing ministerial decree (from Mar-Jun 2013). A consultative workshop was organized under auspices of the then Ministry of Industry, Mines and Energy (MIME), inviting operators, public utilities and development partners to provide comments in the development process. A draft prakas was submitted to the Director of the Department of Potable Water Supply of MIME in July 2013. A new Senior Minister took office end of September 2013, and the Department of Potable Water Supply was placed under the General Directorate of Industry under MIH
24. To ensure consistencies with the
Cambodian legal framework, in April 2014, assistance was provided for a legal review of the draft decree, which was then further modified and finalized by MIH. On 29 of May 2014, the Minister of Industry and Handicraft issued the following decrees, of which an unofficially translated versions can be found in
Prakas on Procedures for Issuing, Revising, Suspending, and Revoking of Permits”, accompanied with,
Prakas on “Standard Conditions of the Permit” In August 2014, MIH organized a dissemination workshop on the new decree (or prakas), attended by over 100 private water operators. A summary of the key elements in the prakas in included in Box 3 . Results of the implementation of the prakas are discussed in section 5.3.
24
Delays occurred due to the July 2013 elections and its aftermath, in which MIME was split up into two ministries and a new Ministry of Industry and Handicraft was created.
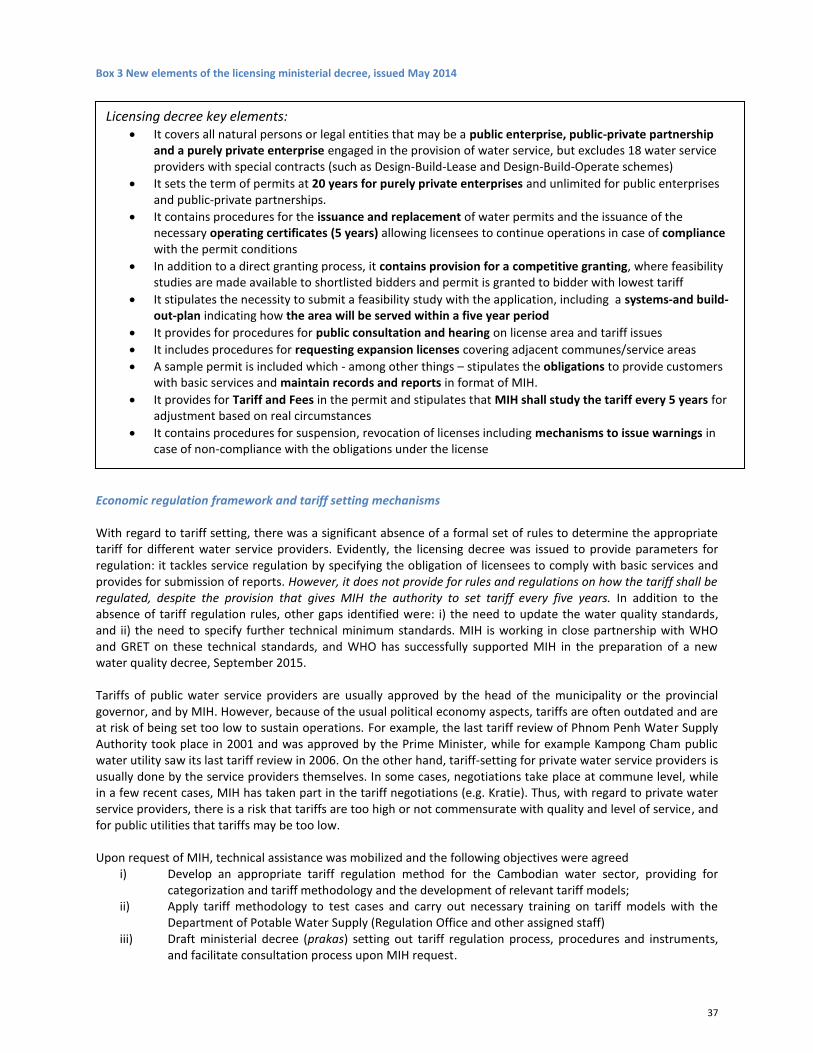
37
Box 3 New elements of the licensing ministerial decree, issued May 2014
Economic regulation framework and tariff setting mechanisms With regard to tariff setting, there was a significant absence of a formal set of rules to determine the appropriate tariff for different water service providers. Evidently, the licensing decree was issued to provide parameters for regulation: it tackles service regulation by specifying the obligation of licensees to comply with basic services and provides for submission of reports. However, it does not provide for rules and regulations on how the tariff shall be regulated, despite the provision that gives MIH the authority to set tariff every five years. In addition to the absence of tariff regulation rules, other gaps identified were: i) the need to update the water quality standards, and ii) the need to specify further technical minimum standards. MIH is working in close partnership with WHO and GRET on these technical standards, and WHO has successfully supported MIH in the preparation of a new water quality decree, September 2015. Tariffs of public water service providers are usually approved by the head of the municipality or the provincial governor, and by MIH. However, because of the usual political economy aspects, tariffs are often outdated and are at risk of being set too low to sustain operations. For example, the last tariff review of Phnom Penh Water Supply Authority took place in 2001 and was approved by the Prime Minister, while for example Kampong Cham public water utility saw its last tariff review in 2006. On the other hand, tariff-setting for private water service providers is usually done by the service providers themselves. In some cases, negotiations take place at commune level, while in a few recent cases, MIH has taken part in the tariff negotiations (e.g. Kratie). Thus, with regard to private water service providers, there is a risk that tariffs are too high or not commensurate with quality and level of service, and for public utilities that tariffs may be too low. Upon request of MIH, technical assistance was mobilized and the following objectives were agreed
i) Develop an appropriate tariff regulation method for the Cambodian water sector, providing for categorization and tariff methodology and the development of relevant tariff models;
ii) Apply tariff methodology to test cases and carry out necessary training on tariff models with the Department of Potable Water Supply (Regulation Office and other assigned staff)
iii) Draft ministerial decree (prakas) setting out tariff regulation process, procedures and instruments, and facilitate consultation process upon MIH request.
Licensing decree key elements: It covers all natural persons or legal entities that may be a public enterprise, public-private partnership
and a purely private enterprise engaged in the provision of water service, but excludes 18 water service providers with special contracts (such as Design-Build-Lease and Design-Build-Operate schemes)
It sets the term of permits at 20 years for purely private enterprises and unlimited for public enterprises and public-private partnerships.
It contains procedures for the issuance and replacement of water permits and the issuance of the necessary operating certificates (5 years) allowing licensees to continue operations in case of compliance with the permit conditions
In addition to a direct granting process, it contains provision for a competitive granting, where feasibility studies are made available to shortlisted bidders and permit is granted to bidder with lowest tariff
It stipulates the necessity to submit a feasibility study with the application, including a systems-and build-out-plan indicating how the area will be served within a five year period
It provides for procedures for public consultation and hearing on license area and tariff issues
It includes procedures for requesting expansion licenses covering adjacent communes/service areas
A sample permit is included which - among other things – stipulates the obligations to provide customers with basic services and maintain records and reports in format of MIH.
It provides for Tariff and Fees in the permit and stipulates that MIH shall study the tariff every 5 years for adjustment based on real circumstances
It contains procedures for suspension, revocation of licenses including mechanisms to issue warnings in case of non-compliance with the obligations under the license
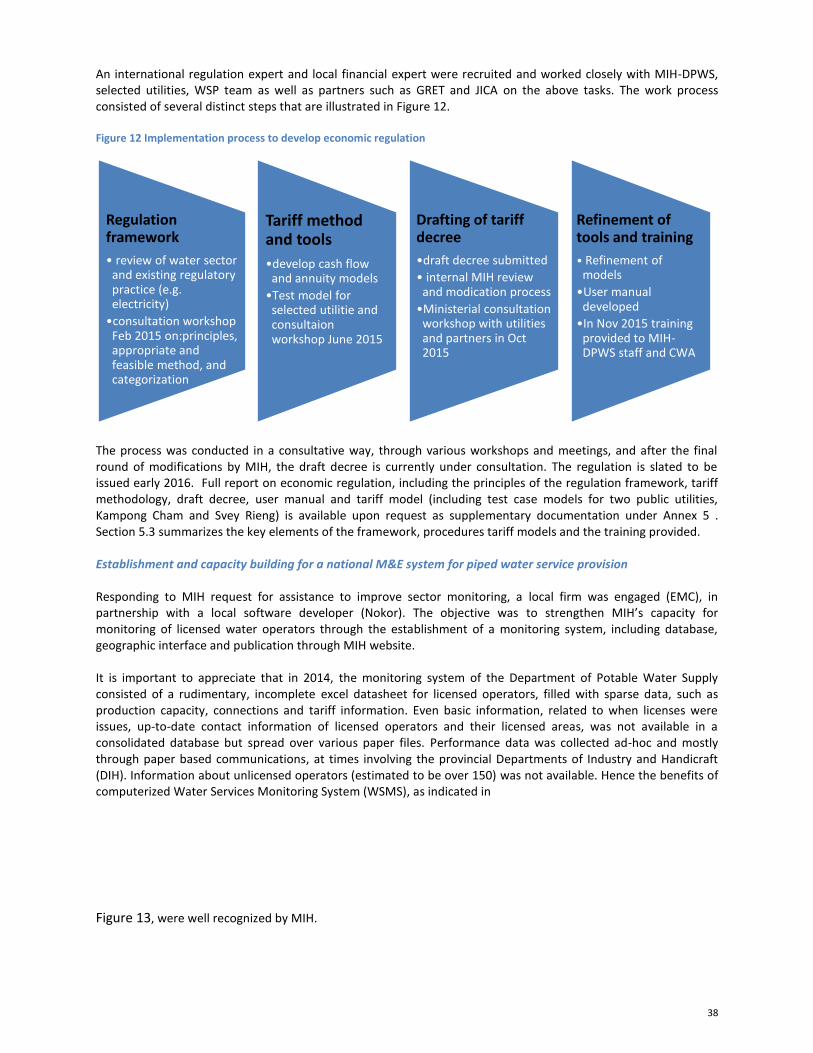
38
An international regulation expert and local financial expert were recruited and worked closely with MIH-DPWS, selected utilities, WSP team as well as partners such as GRET and JICA on the above tasks. The work process consisted of several distinct steps that are illustrated in Figure 12. Figure 12 Implementation process to develop economic regulation
The process was conducted in a consultative way, through various workshops and meetings, and after the final round of modifications by MIH, the draft decree is currently under consultation. The regulation is slated to be issued early 2016. Full report on economic regulation, including the principles of the regulation framework, tariff methodology, draft decree, user manual and tariff model (including test case models for two public utilities, Kampong Cham and Svey Rieng) is available upon request as supplementary documentation under Annex 5 . Section 5.3 summarizes the key elements of the framework, procedures tariff models and the training provided. Establishment and capacity building for a national M&E system for piped water service provision Responding to MIH request for assistance to improve sector monitoring, a local firm was engaged (EMC), in partnership with a local software developer (Nokor). The objective was to strengthen MIH’s capacity for monitoring of licensed water operators through the establishment of a monitoring system, including database, geographic interface and publication through MIH website. It is important to appreciate that in 2014, the monitoring system of the Department of Potable Water Supply consisted of a rudimentary, incomplete excel datasheet for licensed operators, filled with sparse data, such as production capacity, connections and tariff information. Even basic information, related to when licenses were issues, up-to-date contact information of licensed operators and their licensed areas, was not available in a consolidated database but spread over various paper files. Performance data was collected ad-hoc and mostly through paper based communications, at times involving the provincial Departments of Industry and Handicraft (DIH). Information about unlicensed operators (estimated to be over 150) was not available. Hence the benefits of computerized Water Services Monitoring System (WSMS), as indicated in
Figure 13, were well recognized by MIH.
Regulation framework
• review of water sector and existing regulatory practice (e.g. electricity)
•consultation workshop Feb 2015 on:principles, appropriate and feasible method, and categorization
Tariff method and tools
•develop cash flow and annuity models
•Test model for selected utilitie and consultaion workshop June 2015
Drafting of tariff decree
•draft decree submitted
• internal MIH review and modication process
•Ministerial consultation workshop with utilities and partners in Oct 2015
Refinement of tools and training
• Refinement of models
•User manual developed
•In Nov 2015 training provided to MIH-DPWS staff and CWA
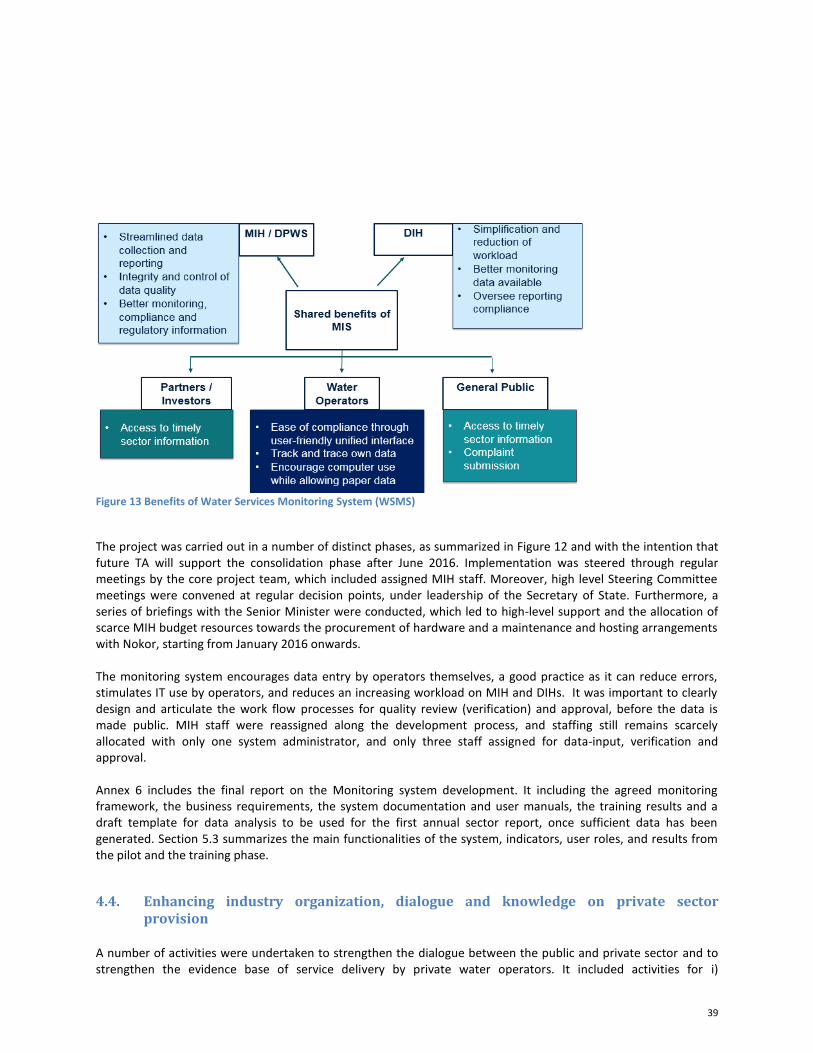
39
Figure 13 Benefits of Water Services Monitoring System (WSMS)
The project was carried out in a number of distinct phases, as summarized in Figure 12 and with the intention that future TA will support the consolidation phase after June 2016. Implementation was steered through regular meetings by the core project team, which included assigned MIH staff. Moreover, high level Steering Committee meetings were convened at regular decision points, under leadership of the Secretary of State. Furthermore, a series of briefings with the Senior Minister were conducted, which led to high-level support and the allocation of scarce MIH budget resources towards the procurement of hardware and a maintenance and hosting arrangements with Nokor, starting from January 2016 onwards. The monitoring system encourages data entry by operators themselves, a good practice as it can reduce errors, stimulates IT use by operators, and reduces an increasing workload on MIH and DIHs. It was important to clearly design and articulate the work flow processes for quality review (verification) and approval, before the data is made public. MIH staff were reassigned along the development process, and staffing still remains scarcely allocated with only one system administrator, and only three staff assigned for data-input, verification and approval. Annex 6 includes the final report on the Monitoring system development. It including the agreed monitoring framework, the business requirements, the system documentation and user manuals, the training results and a draft template for data analysis to be used for the first annual sector report, once sufficient data has been generated. Section 5.3 summarizes the main functionalities of the system, indicators, user roles, and results from the pilot and the training phase.
4.4. Enhancing industry organization, dialogue and knowledge on private sector provision
A number of activities were undertaken to strengthen the dialogue between the public and private sector and to strengthen the evidence base of service delivery by private water operators. It included activities for i)
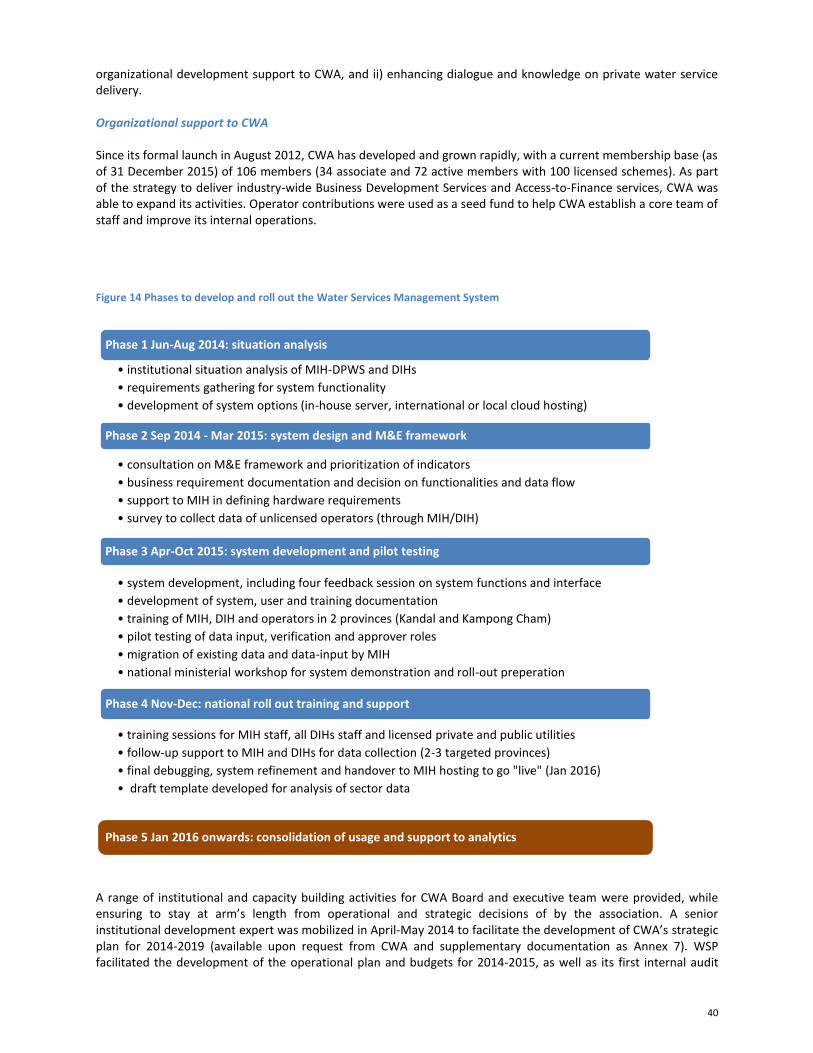
40
organizational development support to CWA, and ii) enhancing dialogue and knowledge on private water service delivery. Organizational support to CWA Since its formal launch in August 2012, CWA has developed and grown rapidly, with a current membership base (as of 31 December 2015) of 106 members (34 associate and 72 active members with 100 licensed schemes). As part of the strategy to deliver industry-wide Business Development Services and Access-to-Finance services, CWA was able to expand its activities. Operator contributions were used as a seed fund to help CWA establish a core team of staff and improve its internal operations.
Figure 14 Phases to develop and roll out the Water Services Management System
A range of institutional and capacity building activities for CWA Board and executive team were provided, while ensuring to stay at arm’s length from operational and strategic decisions of by the association. A senior institutional development expert was mobilized in April-May 2014 to facilitate the development of CWA’s strategic plan for 2014-2019 (available upon request from CWA and supplementary documentation as Annex 7). WSP facilitated the development of the operational plan and budgets for 2014-2015, as well as its first internal audit
Phase 1 Jun-Aug 2014: situation analysis
• institutional situation analysis of MIH-DPWS and DIHs
• requirements gathering for system functionality
• development of system options (in-house server, international or local cloud hosting)
Phase 2 Sep 2014 - Mar 2015: system design and M&E framework
• consultation on M&E framework and prioritization of indicators
• business requirement documentation and decision on functionalities and data flow
• support to MIH in defining hardware requirements
• survey to collect data of unlicensed operators (through MIH/DIH)
Phase 3 Apr-Oct 2015: system development and pilot testing
• system development, including four feedback session on system functions and interface
• development of system, user and training documentation
• training of MIH, DIH and operators in 2 provinces (Kandal and Kampong Cham)
• pilot testing of data input, verification and approver roles
• migration of existing data and data-input by MIH
• national ministerial workshop for system demonstration and roll-out preperation
Phase 4 Nov-Dec: national roll out training and support
• training sessions for MIH staff, all DIHs staff and licensed private and public utilities
• follow-up support to MIH and DIHs for data collection (2-3 targeted provinces)
• final debugging, system refinement and handover to MIH hosting to go "live" (Jan 2016)
• draft template developed for analysis of sector data
Phase 5 Jan 2016 onwards: consolidation of usage and support to analytics
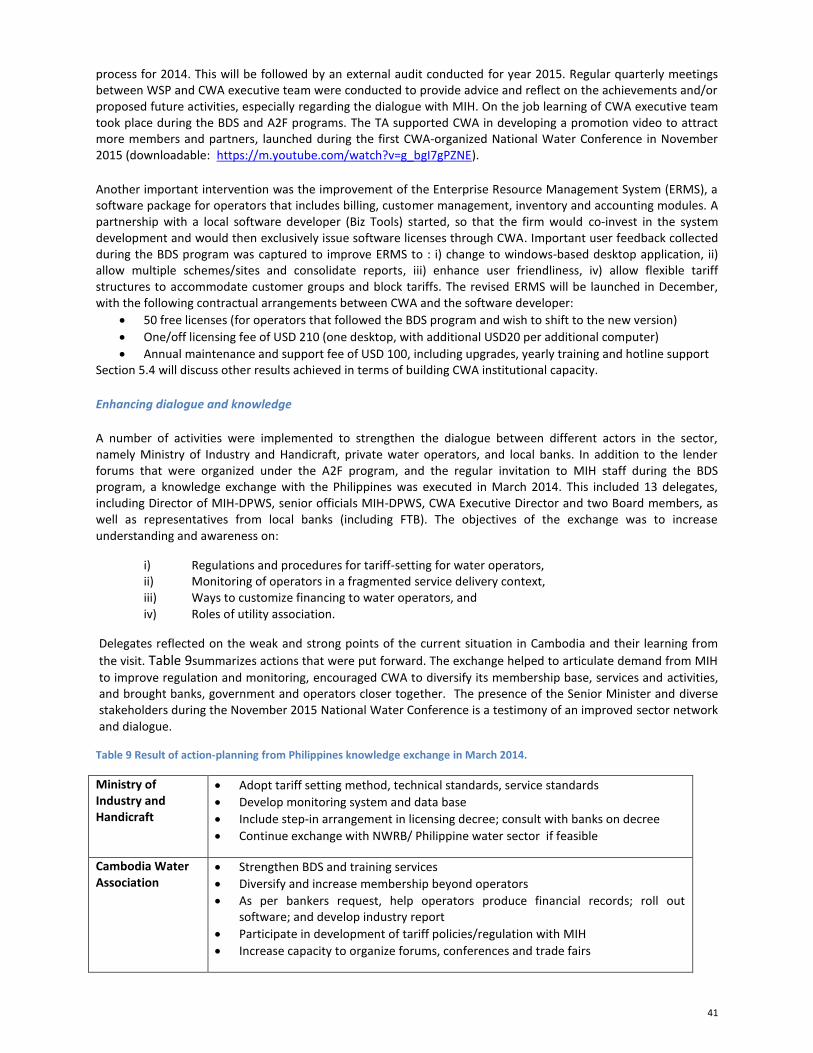
41
process for 2014. This will be followed by an external audit conducted for year 2015. Regular quarterly meetings between WSP and CWA executive team were conducted to provide advice and reflect on the achievements and/or proposed future activities, especially regarding the dialogue with MIH. On the job learning of CWA executive team took place during the BDS and A2F programs. The TA supported CWA in developing a promotion video to attract more members and partners, launched during the first CWA-organized National Water Conference in November 2015 (downloadable: https://m.youtube.com/watch?v=g_bgI7gPZNE).
Another important intervention was the improvement of the Enterprise Resource Management System (ERMS), a software package for operators that includes billing, customer management, inventory and accounting modules. A partnership with a local software developer (Biz Tools) started, so that the firm would co-invest in the system development and would then exclusively issue software licenses through CWA. Important user feedback collected during the BDS program was captured to improve ERMS to : i) change to windows-based desktop application, ii) allow multiple schemes/sites and consolidate reports, iii) enhance user friendliness, iv) allow flexible tariff structures to accommodate customer groups and block tariffs. The revised ERMS will be launched in December, with the following contractual arrangements between CWA and the software developer:
50 free licenses (for operators that followed the BDS program and wish to shift to the new version)
One/off licensing fee of USD 210 (one desktop, with additional USD20 per additional computer)
Annual maintenance and support fee of USD 100, including upgrades, yearly training and hotline support Section 5.4 will discuss other results achieved in terms of building CWA institutional capacity.
Enhancing dialogue and knowledge
A number of activities were implemented to strengthen the dialogue between different actors in the sector, namely Ministry of Industry and Handicraft, private water operators, and local banks. In addition to the lender forums that were organized under the A2F program, and the regular invitation to MIH staff during the BDS program, a knowledge exchange with the Philippines was executed in March 2014. This included 13 delegates, including Director of MIH-DPWS, senior officials MIH-DPWS, CWA Executive Director and two Board members, as well as representatives from local banks (including FTB). The objectives of the exchange was to increase understanding and awareness on:
i) Regulations and procedures for tariff-setting for water operators, ii) Monitoring of operators in a fragmented service delivery context, iii) Ways to customize financing to water operators, and iv) Roles of utility association.
Delegates reflected on the weak and strong points of the current situation in Cambodia and their learning from
the visit. Table 9summarizes actions that were put forward. The exchange helped to articulate demand from MIH
to improve regulation and monitoring, encouraged CWA to diversify its membership base, services and activities, and brought banks, government and operators closer together. The presence of the Senior Minister and diverse stakeholders during the November 2015 National Water Conference is a testimony of an improved sector network and dialogue.
Table 9 Result of action-planning from Philippines knowledge exchange in March 2014.
Ministry of Industry and Handicraft
Adopt tariff setting method, technical standards, service standards
Develop monitoring system and data base
Include step-in arrangement in licensing decree; consult with banks on decree
Continue exchange with NWRB/ Philippine water sector if feasible
Cambodia Water Association
Strengthen BDS and training services
Diversify and increase membership beyond operators
As per bankers request, help operators produce financial records; roll out software; and develop industry report
Participate in development of tariff policies/regulation with MIH
Increase capacity to organize forums, conferences and trade fairs

42
Local banks Seek closer cooperation with MIH and CWA to understand regulations
Seek financing opportunities with int’l organizations, such as guarantee schemes
Apply flexibility in loan packaging and tailor grace-period (6-12 months) and
repayment to cash flow of operators
Participate in further roundtable discussions on financing between banks and
water operators
43
Research on private operator service delivery and constraints on poor households
In the period Aug 2014 – Mar 2015 field research25
was conducted to understand to what extent private water operators are serving the population within their licensed areas, specifically the poor. The research consisted of two phases, with the first phase focused on mapping the connection rates of poor versus non-poor
26 households
across a representative sample of 39 private water operators. This also included operator interviews to understand their customer policies. The second phase – in collaboration with Water.Org
27 – focused on digging deeper in
understanding characteristics of different household segments (poor connected, poor non-connected and non-poor connected), such as water consumption, water expenditure, service satisfaction and tariff and fee perceptions. It also looked at opportunities for bringing in microfinance to help accelerate connection rates among the poor. Results of the research have been integrated in presentations during various forum and events, such as CWA General Assembly (December 2014), Ministerial briefing on private sector service provision (January 2015), National Water Conference (November 2015), and were used during economic regulation workshops. A Research Brief and article for publication are currently under development and will be finalized in March 2016. Section 5.4 elaborates the key results of the research and how it has contributed to the policy dialogue.
25
This research was done under the Harvard - Kennedy School of Government internship program 26
Poor households were defined through the government poor identification system as categories ID-poor 1 and ID-poor 2. See also http://www.mop.gov.kh/projects/idpoor/tabid/154/default.aspx 27
Water.Org is an international NGO that runs a specific program WaterCredit to help poor people gain access to water and sanitation services through using financial services (microfinance loans).
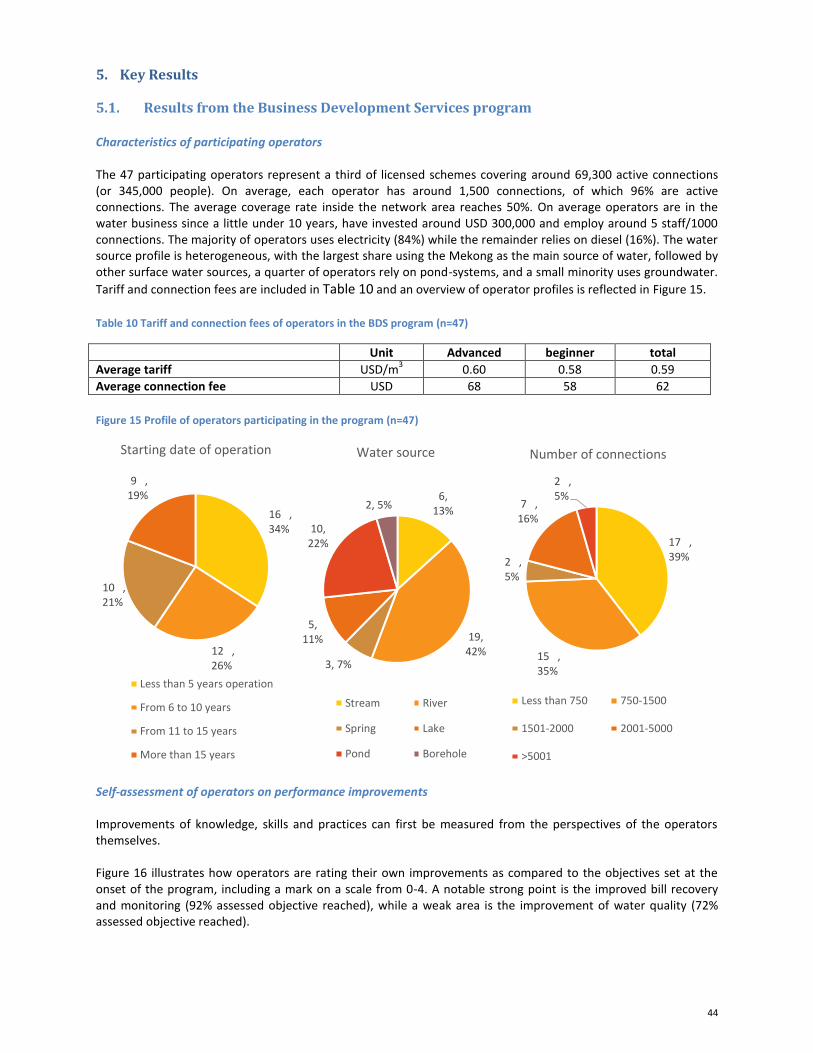
44
17 , 39%
15 , 35%
2 , 5%
7 , 16%
2 , 5%
Number of connections
Less than 750 750-1500
1501-2000 2001-5000
>5001
6, 13%
19, 42%
3, 7%
5, 11%
10, 22%
2, 5%
Water source
Stream River
Spring Lake
Pond Borehole
16 , 34%
12 , 26%
10 , 21%
9 , 19%
Starting date of operation
Less than 5 years operation
From 6 to 10 years
From 11 to 15 years
More than 15 years
5. Key Results
5.1. Results from the Business Development Services program Characteristics of participating operators The 47 participating operators represent a third of licensed schemes covering around 69,300 active connections (or 345,000 people). On average, each operator has around 1,500 connections, of which 96% are active connections. The average coverage rate inside the network area reaches 50%. On average operators are in the water business since a little under 10 years, have invested around USD 300,000 and employ around 5 staff/1000 connections. The majority of operators uses electricity (84%) while the remainder relies on diesel (16%). The water source profile is heterogeneous, with the largest share using the Mekong as the main source of water, followed by other surface water sources, a quarter of operators rely on pond-systems, and a small minority uses groundwater.
Tariff and connection fees are included in Table 10 and an overview of operator profiles is reflected in Figure 15.
Table 10 Tariff and connection fees of operators in the BDS program (n=47)
Unit Advanced beginner total
Average tariff USD/m3 0.60 0.58 0.59
Average connection fee USD 68 58 62
Figure 15 Profile of operators participating in the program (n=47)
Self-assessment of operators on performance improvements Improvements of knowledge, skills and practices can first be measured from the perspectives of the operators themselves. Figure 16 illustrates how operators are rating their own improvements as compared to the objectives set at the onset of the program, including a mark on a scale from 0-4. A notable strong point is the improved bill recovery and monitoring (92% assessed objective reached), while a weak area is the improvement of water quality (72% assessed objective reached).
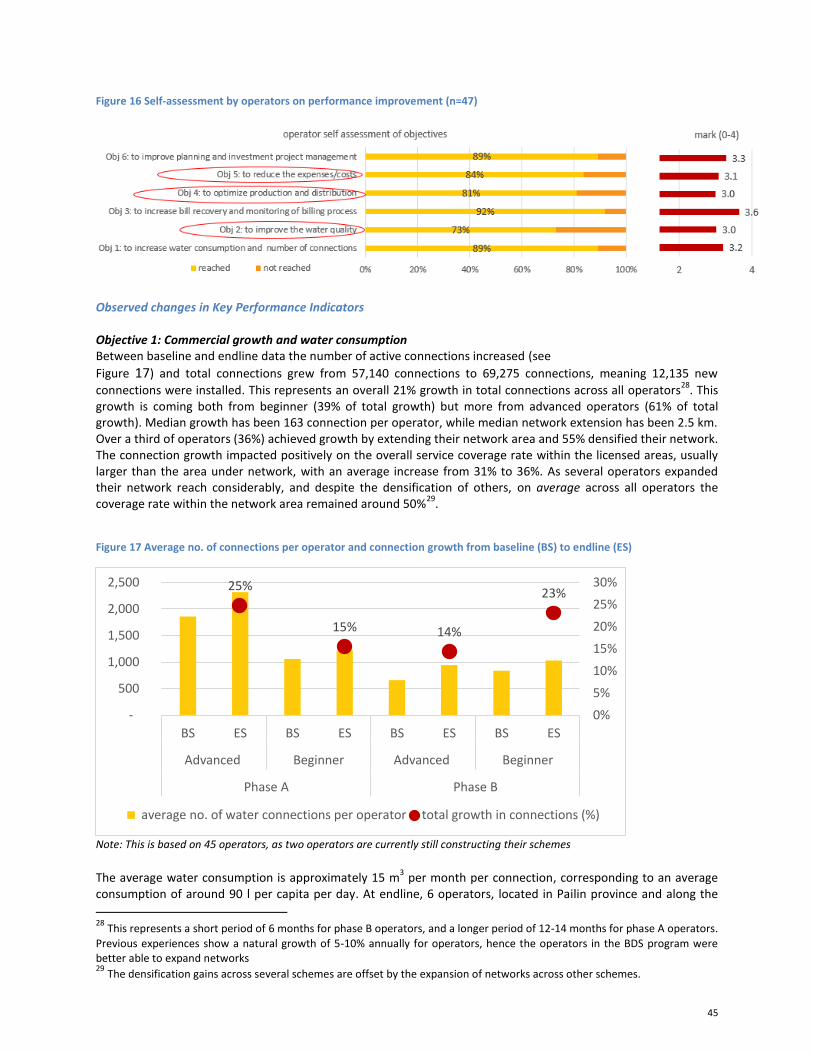
45
Figure 16 Self-assessment by operators on performance improvement (n=47)
Observed changes in Key Performance Indicators Objective 1: Commercial growth and water consumption Between baseline and endline data the number of active connections increased (see
Figure 17) and total connections grew from 57,140 connections to 69,275 connections, meaning 12,135 new
connections were installed. This represents an overall 21% growth in total connections across all operators28
. This growth is coming both from beginner (39% of total growth) but more from advanced operators (61% of total growth). Median growth has been 163 connection per operator, while median network extension has been 2.5 km. Over a third of operators (36%) achieved growth by extending their network area and 55% densified their network. The connection growth impacted positively on the overall service coverage rate within the licensed areas, usually larger than the area under network, with an average increase from 31% to 36%. As several operators expanded their network reach considerably, and despite the densification of others, on average across all operators the coverage rate within the network area remained around 50%
29.
Figure 17 Average no. of connections per operator and connection growth from baseline (BS) to endline (ES)
Note: This is based on 45 operators, as two operators are currently still constructing their schemes
The average water consumption is approximately 15 m
3 per month per connection, corresponding to an average
consumption of around 90 l per capita per day. At endline, 6 operators, located in Pailin province and along the
28
This represents a short period of 6 months for phase B operators, and a longer period of 12-14 months for phase A operators.
Previous experiences show a natural growth of 5-10% annually for operators, hence the operators in the BDS program were better able to expand networks 29
The densification gains across several schemes are offset by the expansion of networks across other schemes.
25%
15% 14%
23%
0%
5%
10%
15%
20%
25%
30%
-
500
1,000
1,500
2,000
2,500
BS ES BS ES BS ES BS ES
Advanced Beginner Advanced Beginner
Phase A Phase B
average no. of water connections per operator total growth in connections (%)
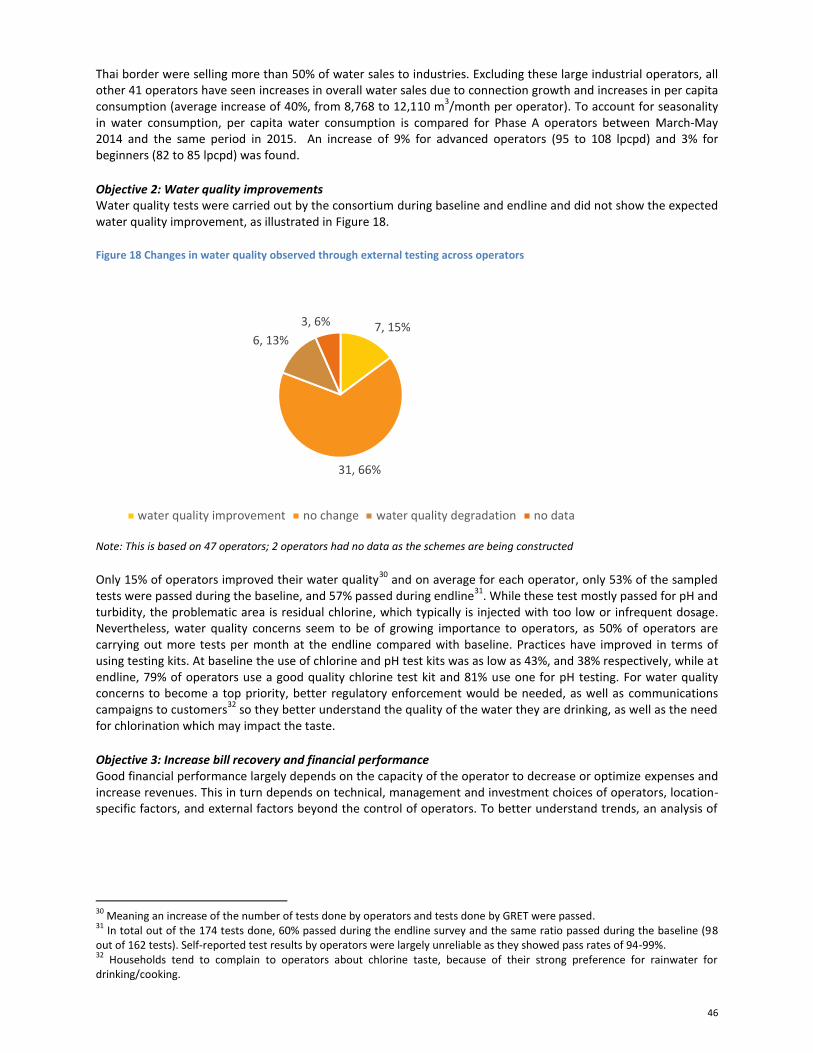
46
Thai border were selling more than 50% of water sales to industries. Excluding these large industrial operators, all other 41 operators have seen increases in overall water sales due to connection growth and increases in per capita consumption (average increase of 40%, from 8,768 to 12,110 m
3/month per operator). To account for seasonality
in water consumption, per capita water consumption is compared for Phase A operators between March-May 2014 and the same period in 2015. An increase of 9% for advanced operators (95 to 108 lpcpd) and 3% for beginners (82 to 85 lpcpd) was found.
Objective 2: Water quality improvements Water quality tests were carried out by the consortium during baseline and endline and did not show the expected water quality improvement, as illustrated in Figure 18.
Figure 18 Changes in water quality observed through external testing across operators
Note: This is based on 47 operators; 2 operators had no data as the schemes are being constructed
Only 15% of operators improved their water quality
30 and on average for each operator, only 53% of the sampled
tests were passed during the baseline, and 57% passed during endline31
. While these test mostly passed for pH and turbidity, the problematic area is residual chlorine, which typically is injected with too low or infrequent dosage. Nevertheless, water quality concerns seem to be of growing importance to operators, as 50% of operators are carrying out more tests per month at the endline compared with baseline. Practices have improved in terms of using testing kits. At baseline the use of chlorine and pH test kits was as low as 43%, and 38% respectively, while at endline, 79% of operators use a good quality chlorine test kit and 81% use one for pH testing. For water quality concerns to become a top priority, better regulatory enforcement would be needed, as well as communications campaigns to customers
32 so they better understand the quality of the water they are drinking, as well as the need
for chlorination which may impact the taste.
Objective 3: Increase bill recovery and financial performance Good financial performance largely depends on the capacity of the operator to decrease or optimize expenses and increase revenues. This in turn depends on technical, management and investment choices of operators, location-specific factors, and external factors beyond the control of operators. To better understand trends, an analysis of
30
Meaning an increase of the number of tests done by operators and tests done by GRET were passed. 31
In total out of the 174 tests done, 60% passed during the endline survey and the same ratio passed during the baseline (98 out of 162 tests). Self-reported test results by operators were largely unreliable as they showed pass rates of 94-99%. 32
Households tend to complain to operators about chlorine taste, because of their strong preference for rainwater for drinking/cooking.
7, 15%
31, 66%
6, 13%
3, 6%
water quality improvement no change water quality degradation no data
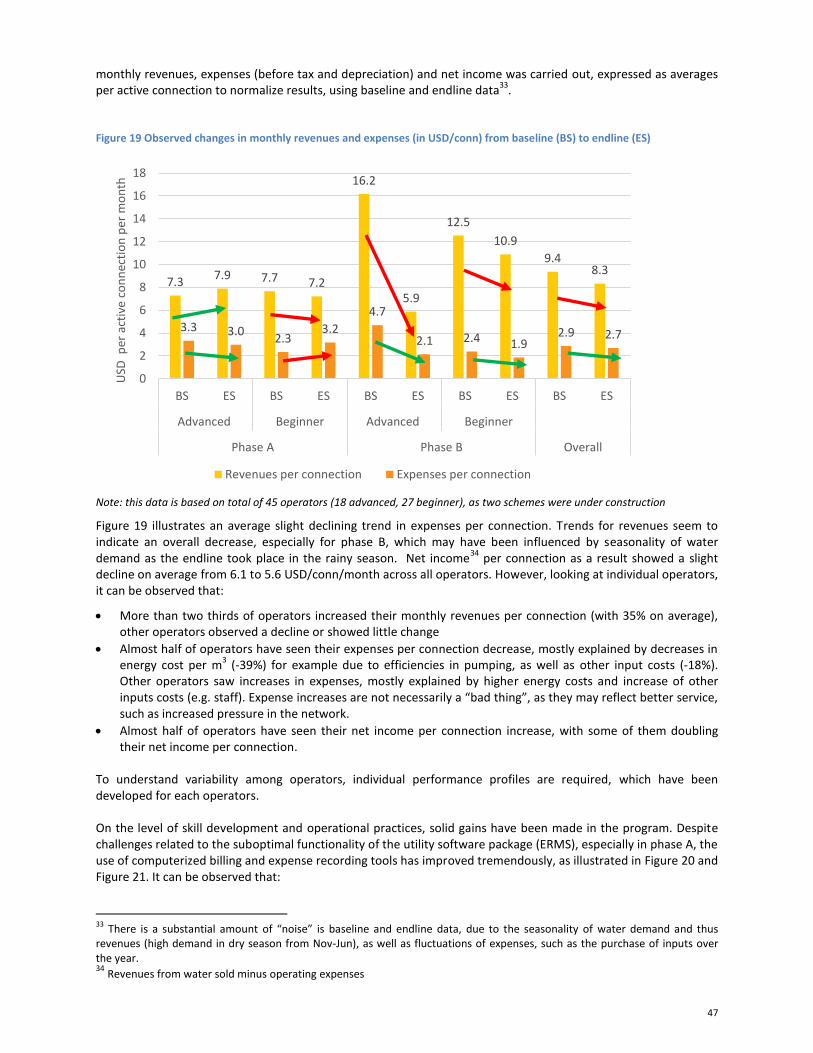
47
monthly revenues, expenses (before tax and depreciation) and net income was carried out, expressed as averages per active connection to normalize results, using baseline and endline data
33.
Figure 19 Observed changes in monthly revenues and expenses (in USD/conn) from baseline (BS) to endline (ES)
Note: this data is based on total of 45 operators (18 advanced, 27 beginner), as two schemes were under construction
Figure 19 illustrates an average slight declining trend in expenses per connection. Trends for revenues seem to indicate an overall decrease, especially for phase B, which may have been influenced by seasonality of water demand as the endline took place in the rainy season. Net income
34 per connection as a result showed a slight
decline on average from 6.1 to 5.6 USD/conn/month across all operators. However, looking at individual operators, it can be observed that:
More than two thirds of operators increased their monthly revenues per connection (with 35% on average), other operators observed a decline or showed little change
Almost half of operators have seen their expenses per connection decrease, mostly explained by decreases in energy cost per m
3 (-39%) for example due to efficiencies in pumping, as well as other input costs (-18%).
Other operators saw increases in expenses, mostly explained by higher energy costs and increase of other inputs costs (e.g. staff). Expense increases are not necessarily a “bad thing”, as they may reflect better service, such as increased pressure in the network.
Almost half of operators have seen their net income per connection increase, with some of them doubling their net income per connection.
To understand variability among operators, individual performance profiles are required, which have been developed for each operators. On the level of skill development and operational practices, solid gains have been made in the program. Despite challenges related to the suboptimal functionality of the utility software package (ERMS), especially in phase A, the use of computerized billing and expense recording tools has improved tremendously, as illustrated in Figure 20 and Figure 21. It can be observed that:
33
There is a substantial amount of “noise” is baseline and endline data, due to the seasonality of water demand and thus revenues (high demand in dry season from Nov-Jun), as well as fluctuations of expenses, such as the purchase of inputs over the year. 34
Revenues from water sold minus operating expenses
7.3 7.9 7.7 7.2
16.2
5.9
12.5
10.9
9.4 8.3
3.3 3.0 2.3
3.2
4.7
2.1 2.4 1.9 2.9 2.7
0
2
4
6
8
10
12
14
16
18
BS ES BS ES BS ES BS ES BS ES
Advanced Beginner Advanced Beginner
Phase A Phase B Overall
USD
per
act
ive
con
nec
tio
n p
er m
on
th
Revenues per connection Expenses per connection
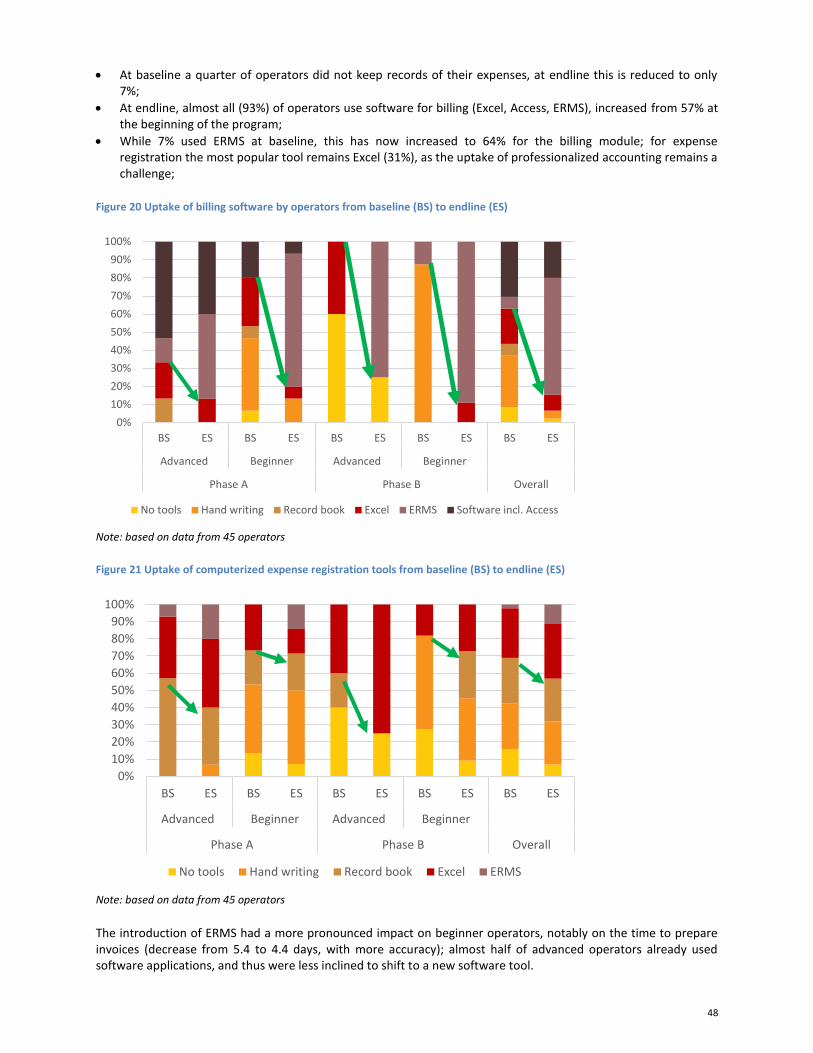
48
At baseline a quarter of operators did not keep records of their expenses, at endline this is reduced to only 7%;
At endline, almost all (93%) of operators use software for billing (Excel, Access, ERMS), increased from 57% at the beginning of the program;
While 7% used ERMS at baseline, this has now increased to 64% for the billing module; for expense registration the most popular tool remains Excel (31%), as the uptake of professionalized accounting remains a challenge;
Figure 20 Uptake of billing software by operators from baseline (BS) to endline (ES)
Note: based on data from 45 operators
Figure 21 Uptake of computerized expense registration tools from baseline (BS) to endline (ES)
Note: based on data from 45 operators
The introduction of ERMS had a more pronounced impact on beginner operators, notably on the time to prepare invoices (decrease from 5.4 to 4.4 days, with more accuracy); almost half of advanced operators already used software applications, and thus were less inclined to shift to a new software tool.
0%
10%
20%
30%
40%
50%
60%
70%
80%
90%
100%
BS ES BS ES BS ES BS ES BS ES
Advanced Beginner Advanced Beginner
Phase A Phase B Overall
No tools Hand writing Record book Excel ERMS
0%
10%
20%
30%
40%
50%
60%
70%
80%
90%
100%
BS ES BS ES BS ES BS ES BS ES
Advanced Beginner Advanced Beginner
Phase A Phase B Overall
No tools Hand writing Record book Excel ERMS Software incl. Access
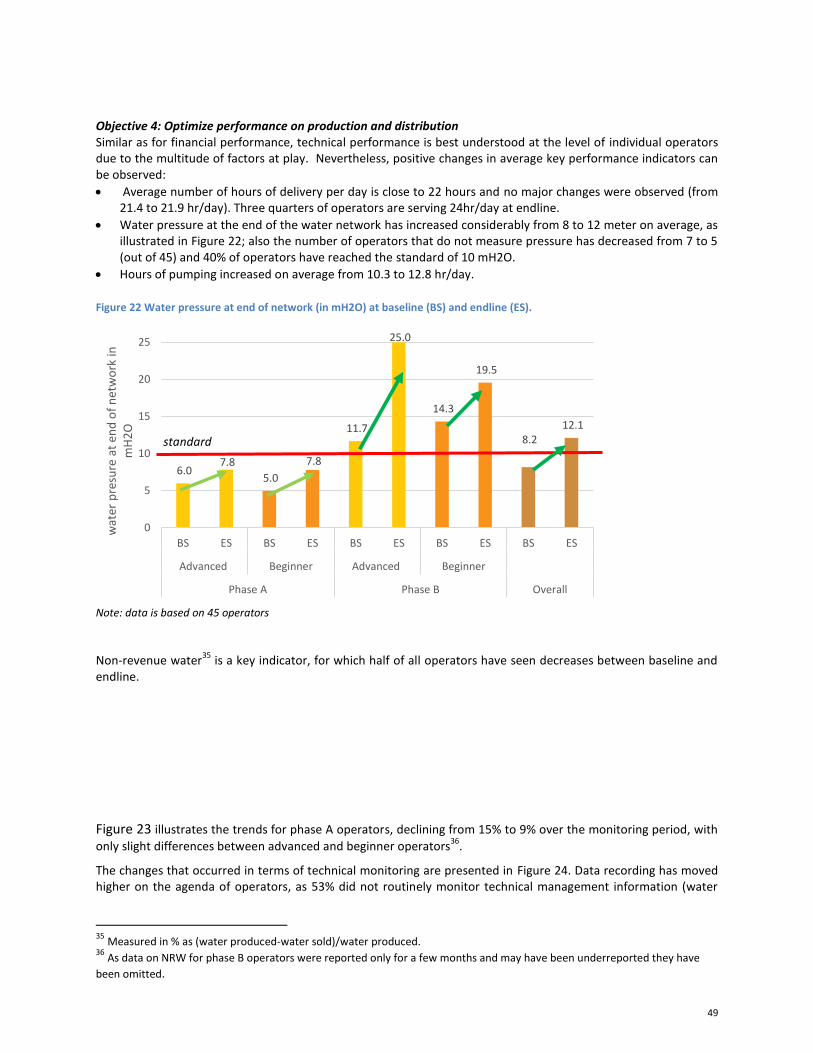
49
Objective 4: Optimize performance on production and distribution Similar as for financial performance, technical performance is best understood at the level of individual operators due to the multitude of factors at play. Nevertheless, positive changes in average key performance indicators can be observed:
Average number of hours of delivery per day is close to 22 hours and no major changes were observed (from 21.4 to 21.9 hr/day). Three quarters of operators are serving 24hr/day at endline.
Water pressure at the end of the water network has increased considerably from 8 to 12 meter on average, as illustrated in Figure 22; also the number of operators that do not measure pressure has decreased from 7 to 5 (out of 45) and 40% of operators have reached the standard of 10 mH2O.
Hours of pumping increased on average from 10.3 to 12.8 hr/day.
Figure 22 Water pressure at end of network (in mH2O) at baseline (BS) and endline (ES).
Note: data is based on 45 operators
Non-revenue water35
is a key indicator, for which half of all operators have seen decreases between baseline and endline.
Figure 23 illustrates the trends for phase A operators, declining from 15% to 9% over the monitoring period, with
only slight differences between advanced and beginner operators36
.
The changes that occurred in terms of technical monitoring are presented in Figure 24. Data recording has moved higher on the agenda of operators, as 53% did not routinely monitor technical management information (water
35
Measured in % as (water produced-water sold)/water produced. 36
As data on NRW for phase B operators were reported only for a few months and may have been underreported they have
been omitted.
6.0 7.8
5.0
7.8
11.7
25.0
14.3
19.5
8.2 12.1
0
5
10
15
20
25
BS ES BS ES BS ES BS ES BS ES
Advanced Beginner Advanced Beginner
Phase A Phase B Overall
wat
er p
resu
re a
t en
d o
f n
etw
ork
in
mH
2O
standard
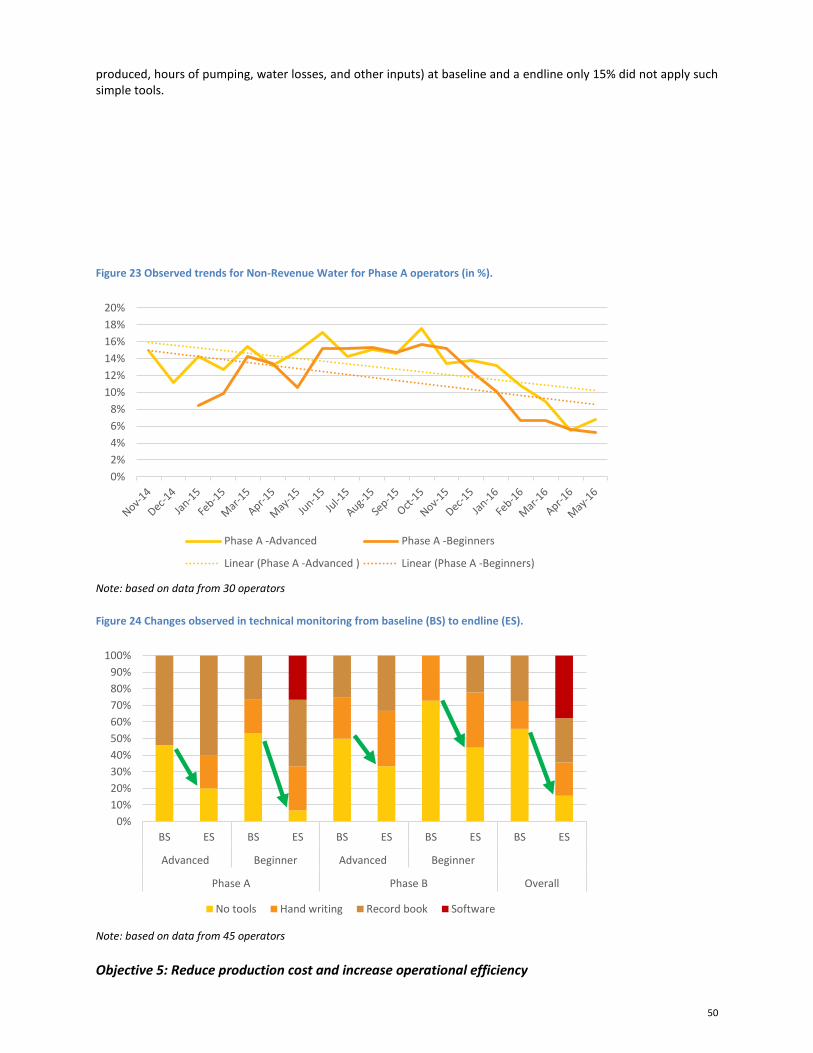
50
produced, hours of pumping, water losses, and other inputs) at baseline and a endline only 15% did not apply such simple tools.
Figure 23 Observed trends for Non-Revenue Water for Phase A operators (in %).
Note: based on data from 30 operators
Figure 24 Changes observed in technical monitoring from baseline (BS) to endline (ES).
Note: based on data from 45 operators
Objective 5: Reduce production cost and increase operational efficiency
0%
2%
4%
6%
8%
10%
12%
14%
16%
18%
20%
Phase A -Advanced Phase A -Beginners
Linear (Phase A -Advanced ) Linear (Phase A -Beginners)
0%
10%
20%
30%
40%
50%
60%
70%
80%
90%
100%
BS ES BS ES BS ES BS ES BS ES
Advanced Beginner Advanced Beginner
Phase A Phase B Overall
No tools Hand writing Record book Software
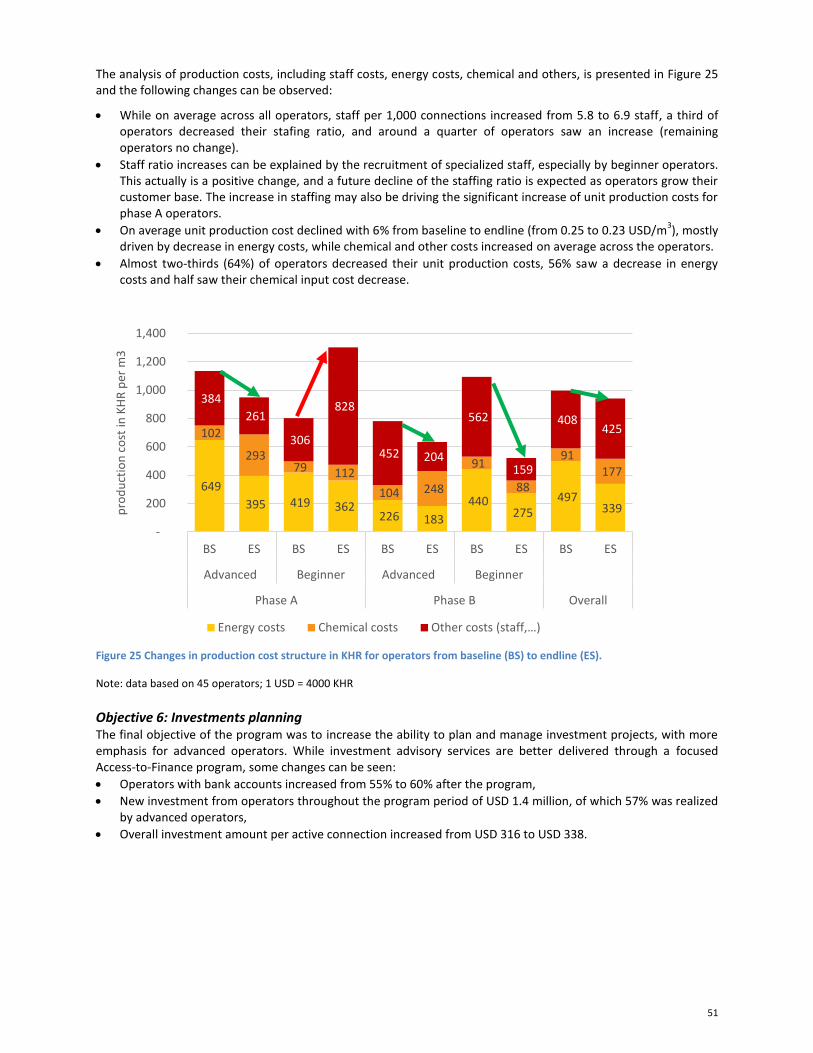
51
The analysis of production costs, including staff costs, energy costs, chemical and others, is presented in Figure 25 and the following changes can be observed:
While on average across all operators, staff per 1,000 connections increased from 5.8 to 6.9 staff, a third of operators decreased their stafing ratio, and around a quarter of operators saw an increase (remaining operators no change).
Staff ratio increases can be explained by the recruitment of specialized staff, especially by beginner operators. This actually is a positive change, and a future decline of the staffing ratio is expected as operators grow their customer base. The increase in staffing may also be driving the significant increase of unit production costs for phase A operators.
On average unit production cost declined with 6% from baseline to endline (from 0.25 to 0.23 USD/m3), mostly
driven by decrease in energy costs, while chemical and other costs increased on average across the operators.
Almost two-thirds (64%) of operators decreased their unit production costs, 56% saw a decrease in energy costs and half saw their chemical input cost decrease.
Figure 25 Changes in production cost structure in KHR for operators from baseline (BS) to endline (ES).
Note: data based on 45 operators; 1 USD = 4000 KHR
Objective 6: Investments planning The final objective of the program was to increase the ability to plan and manage investment projects, with more emphasis for advanced operators. While investment advisory services are better delivered through a focused Access-to-Finance program, some changes can be seen:
Operators with bank accounts increased from 55% to 60% after the program,
New investment from operators throughout the program period of USD 1.4 million, of which 57% was realized by advanced operators,
Overall investment amount per active connection increased from USD 316 to USD 338.
649
395 419 362 226 183
440 275
497 339
102
293 79 112
104 248
91
88
91 177
384
261
306
828
452 204
562
159
408 425
-
200
400
600
800
1,000
1,200
1,400
BS ES BS ES BS ES BS ES BS ES
Advanced Beginner Advanced Beginner
Phase A Phase B Overall
pro
du
ctio
n c
ost
in K
HR
per
m3
Energy costs Chemical costs Other costs (staff,…)
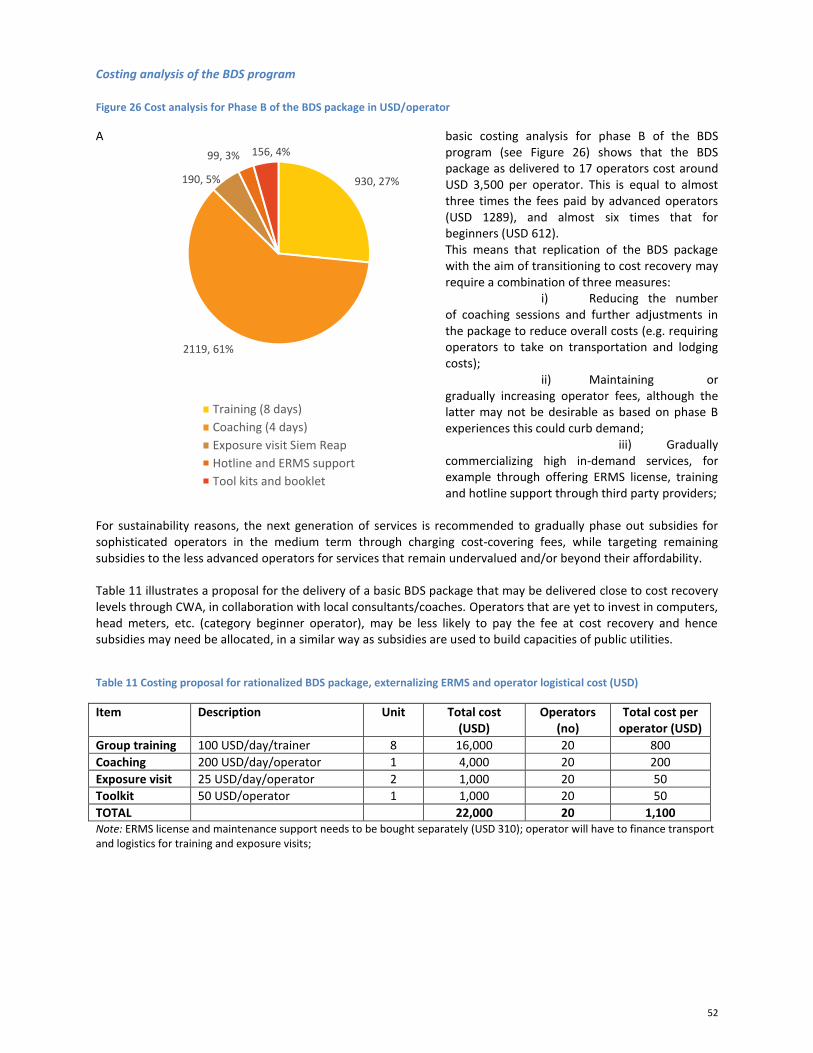
52
930, 27%
2119, 61%
190, 5%
99, 3% 156, 4%
Training (8 days)
Coaching (4 days)
Exposure visit Siem Reap
Hotline and ERMS support
Tool kits and booklet
Costing analysis of the BDS program
Figure 26 Cost analysis for Phase B of the BDS package in USD/operator
A basic costing analysis for phase B of the BDS program (see Figure 26) shows that the BDS package as delivered to 17 operators cost around USD 3,500 per operator. This is equal to almost three times the fees paid by advanced operators (USD 1289), and almost six times that for beginners (USD 612). This means that replication of the BDS package with the aim of transitioning to cost recovery may require a combination of three measures:
i) Reducing the number of coaching sessions and further adjustments in the package to reduce overall costs (e.g. requiring operators to take on transportation and lodging costs);
ii) Maintaining or gradually increasing operator fees, although the latter may not be desirable as based on phase B experiences this could curb demand;
iii) Gradually commercializing high in-demand services, for example through offering ERMS license, training and hotline support through third party providers;
For sustainability reasons, the next generation of services is recommended to gradually phase out subsidies for sophisticated operators in the medium term through charging cost-covering fees, while targeting remaining subsidies to the less advanced operators for services that remain undervalued and/or beyond their affordability. Table 11 illustrates a proposal for the delivery of a basic BDS package that may be delivered close to cost recovery levels through CWA, in collaboration with local consultants/coaches. Operators that are yet to invest in computers, head meters, etc. (category beginner operator), may be less likely to pay the fee at cost recovery and hence subsidies may need be allocated, in a similar way as subsidies are used to build capacities of public utilities.
Table 11 Costing proposal for rationalized BDS package, externalizing ERMS and operator logistical cost (USD)
Item Description Unit Total cost (USD)
Operators (no)
Total cost per operator (USD)
Group training 100 USD/day/trainer 8 16,000 20 800
Coaching 200 USD/day/operator 1 4,000 20 200
Exposure visit 25 USD/day/operator 2 1,000 20 50
Toolkit 50 USD/operator 1 1,000 20 50
TOTAL 22,000 20 1,100 Note: ERMS license and maintenance support needs to be bought separately (USD 310); operator will have to finance transport and logistics for training and exposure visits;
53
5.2. Results of the Access to Finance program Overall progress to date (December 2015)
Table 12 presents the results achieved thus far, recognizing that all of the operators that moved to the detailed
investment stage prefer to submit their applications to FTB, although the consortium has also supported some of the operators in their applications to other banks.
Table 12 Progress to date in processing loan applications
Preparation process stages Target (#)
Current (#)
Value loan (USD)
Data Collection 26 29
Paid CWA payment #1 26 29
Pre-financing study completed 26 27
Paid CWA Payment #2 20 20
Investment Study completed and application submitted to FTB 20 20 5,457,732
Loan approval stages
Application under review by Credit Officer/ FTB TA firm 20 11 2,087,732
Loan Signed by operators and FTB 18 9 3, 370,000
Loan Rejected after due diligence 2 0
Loan amount disbursed till 31 December 2015 1,500,000
Operator attrition and resulting non-FTB financed investments Operator attrition rate was initially higher than expected, as out of the original 26 operators recruited, nine dropped out and three new operators were recruited to achieve the target of 20 loan applications. Box 4 summarizes the key reasons why operators left the program, and decided to not pursue the second phase of the detailed investment study, for which a considerable self-contribution was required. In many cases, operators were nevertheless able to use the pre-financing study to develop new investments, acquiring finance from other banks, sale of land, or loans from family. As explained in section 4.2 those commercial banks did not necessarily need the investment studies and were comfortable to issue loans based on collateral, previous financial performance and/or an existing relationship with the operator.
Table 13 provides interesting insights on the sort of financing that could be obtained by these operators, which totals USD 855,000, of which USD 505,000 from commercial banks. Since early 2015, an estimated number of 1,600 new piped connections have been installed. This number is expected to grow as a result of densification over time, as well as due to continuation of network expansion.
Box 4 Key reasons for attrition of operators in the A2F program
A wide variety of reasons was found why operators did not continue in the program, such as:
Not meeting collateral requirements of FTB; reluctance to pay higher interest rate of other banks
Not meeting age requirements of FTB-lending, and complications to transfer business to son
Preference to use equity (sales of land) or family loans on better terms than commercial banks
Slow process in 2015 to get FTB loans approved and urgency to invest before rainy season (Jun 2015)
Infrastructure belonged to local government, and could not be pledged as collateral unless contract was altered; not sufficient personal collateral to secure loan
Two operators were discontinued from moving to the next stage of the program due to:
Unwillingness to invest in improvement of water treatment to ensure proper water quality standard
Lack of timely cooperation to deliver data at well announced deadlines; opportunity given to others
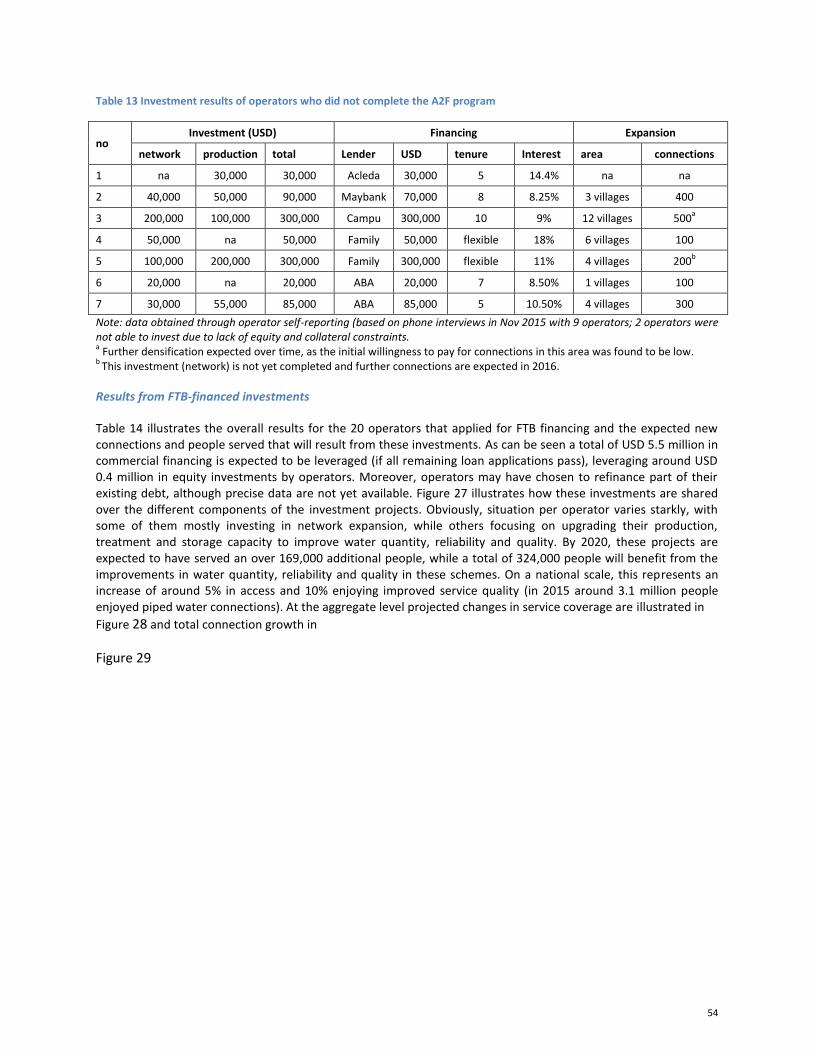
54
Table 13 Investment results of operators who did not complete the A2F program
no Investment (USD) Financing Expansion
network production total Lender USD tenure Interest area connections
1 na 30,000 30,000 Acleda 30,000 5 14.4% na na
2 40,000 50,000 90,000 Maybank 70,000 8 8.25% 3 villages 400
3 200,000 100,000 300,000 Campu 300,000 10 9% 12 villages 500a
4 50,000 na 50,000 Family 50,000 flexible 18% 6 villages 100
5 100,000 200,000 300,000 Family 300,000 flexible 11% 4 villages 200b
6 20,000 na 20,000 ABA 20,000 7 8.50% 1 villages 100
7 30,000 55,000 85,000 ABA 85,000 5 10.50% 4 villages 300
Note: data obtained through operator self-reporting (based on phone interviews in Nov 2015 with 9 operators; 2 operators were not able to invest due to lack of equity and collateral constraints. a Further densification expected over time, as the initial willingness to pay for connections in this area was found to be low.
b This investment (network) is not yet completed and further connections are expected in 2016.
Results from FTB-financed investments
Table 14 illustrates the overall results for the 20 operators that applied for FTB financing and the expected new connections and people served that will result from these investments. As can be seen a total of USD 5.5 million in commercial financing is expected to be leveraged (if all remaining loan applications pass), leveraging around USD 0.4 million in equity investments by operators. Moreover, operators may have chosen to refinance part of their existing debt, although precise data are not yet available. Figure 27 illustrates how these investments are shared over the different components of the investment projects. Obviously, situation per operator varies starkly, with some of them mostly investing in network expansion, while others focusing on upgrading their production, treatment and storage capacity to improve water quantity, reliability and quality. By 2020, these projects are expected to have served an over 169,000 additional people, while a total of 324,000 people will benefit from the improvements in water quantity, reliability and quality in these schemes. On a national scale, this represents an increase of around 5% in access and 10% enjoying improved service quality (in 2015 around 3.1 million people enjoyed piped water connections). At the aggregate level projected changes in service coverage are illustrated in
Figure 28 and total connection growth in
Figure 29
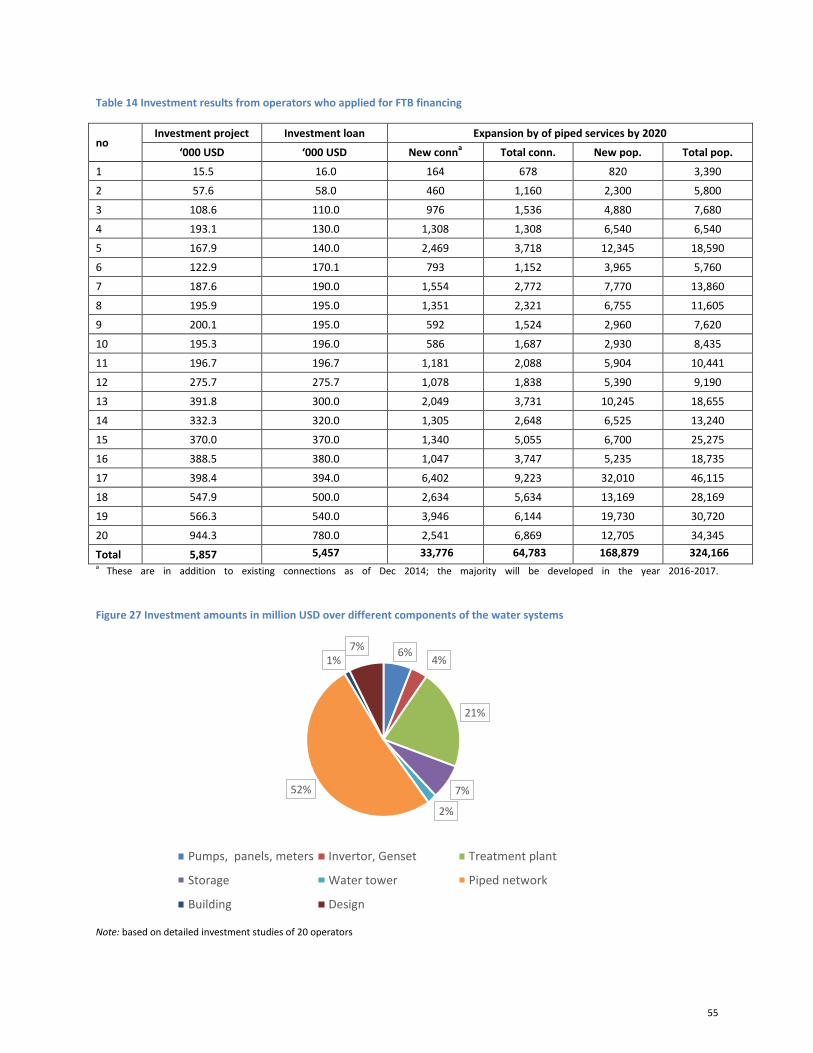
55
Table 14 Investment results from operators who applied for FTB financing
no Investment project Investment loan Expansion by of piped services by 2020
‘000 USD ‘000 USD New conna Total conn. New pop. Total pop.
1 15.5 16.0 164 678 820 3,390
2 57.6 58.0 460 1,160 2,300 5,800
3 108.6 110.0 976 1,536 4,880
7,680
4 193.1 130.0 1,308 1,308 6,540 6,540
5 167.9 140.0 2,469 3,718 12,345
18,590
6 122.9 170.1 793 1,152 3,965 5,760
7 187.6 190.0 1,554 2,772 7,770 13,860
8 195.9 195.0 1,351 2,321 6,755 11,605
9 200.1 195.0 592 1,524 2,960 7,620
10 195.3 196.0 586 1,687 2,930 8,435
11 196.7 196.7 1,181 2,088 5,904 10,441
12 275.7 275.7 1,078 1,838 5,390 9,190
13 391.8 300.0 2,049 3,731 10,245 18,655
14 332.3 320.0 1,305 2,648 6,525 13,240
15 370.0 370.0 1,340 5,055 6,700 25,275
16 388.5 380.0 1,047 3,747 5,235 18,735
17 398.4 394.0 6,402 9,223 32,010 46,115
18 547.9 500.0 2,634 5,634 13,169 28,169
19 566.3 540.0 3,946 6,144 19,730 30,720
20 944.3 780.0 2,541 6,869 12,705 34,345
Total
5,857 5,457 33,776 64,783 168,879 324,166 a These are in addition to existing connections as of Dec 2014; the majority will be developed in the year 2016-2017.
Figure 27 Investment amounts in million USD over different components of the water systems
Note: based on detailed investment studies of 20 operators
6% 4%
21%
7%
2%
52%
1% 7%
Pumps, panels, meters Invertor, Genset Treatment plant
Storage Water tower Piped network
Building Design
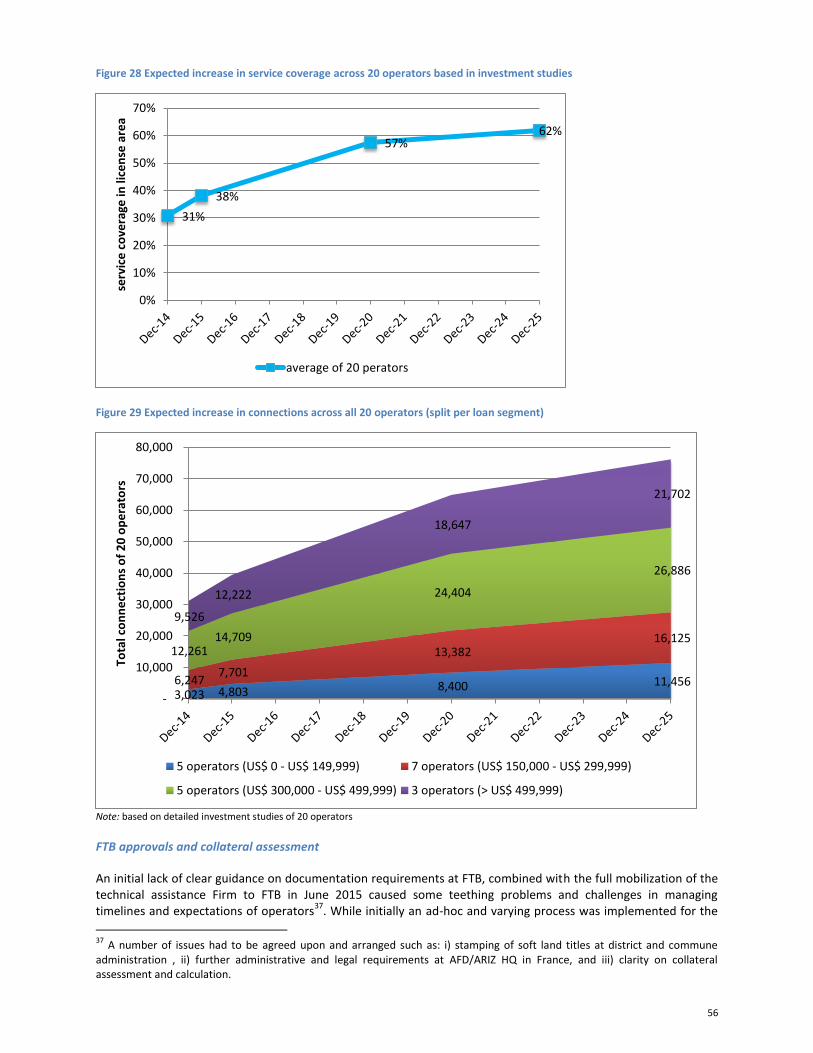
56
Figure 28 Expected increase in service coverage across 20 operators based in investment studies
Figure 29 Expected increase in connections across all 20 operators (split per loan segment)
Note: based on detailed investment studies of 20 operators
FTB approvals and collateral assessment
An initial lack of clear guidance on documentation requirements at FTB, combined with the full mobilization of the technical assistance Firm to FTB in June 2015 caused some teething problems and challenges in managing timelines and expectations of operators
37. While initially an ad-hoc and varying process was implemented for the
37
A number of issues had to be agreed upon and arranged such as: i) stamping of soft land titles at district and commune administration , ii) further administrative and legal requirements at AFD/ARIZ HQ in France, and iii) clarity on collateral assessment and calculation.
31%
38%
57% 62%
0%
10%
20%
30%
40%
50%
60%
70%se
rvic
e c
ove
rage
in li
cen
se a
rea
average of 20 perators
3,023 4,803 8,400 11,456 6,247 7,701
13,382 16,125
12,261 14,709
24,404
26,886
9,526
12,222
18,647
21,702
-
10,000
20,000
30,000
40,000
50,000
60,000
70,000
80,000
Tota
l co
nn
ect
ion
s o
f 2
0 o
pe
rato
rs
5 operators (US$ 0 - US$ 149,999) 7 operators (US$ 150,000 - US$ 299,999)
5 operators (US$ 300,000 - US$ 499,999) 3 operators (> US$ 499,999)
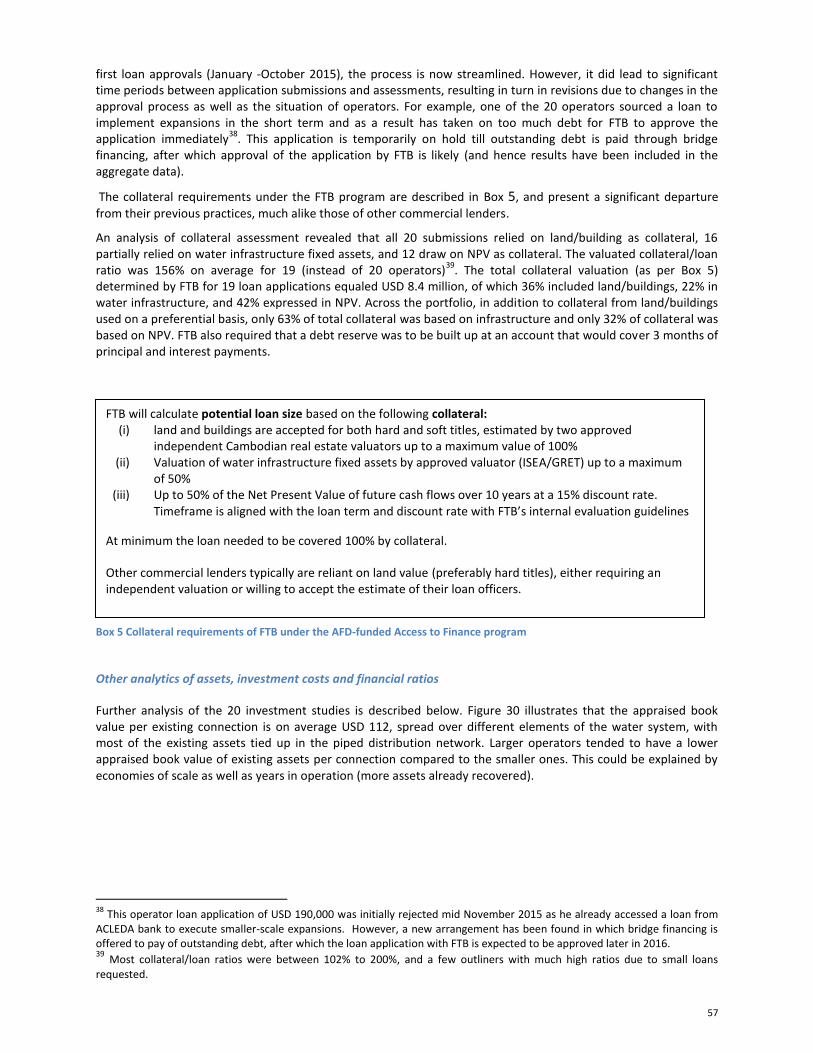
57
first loan approvals (January -October 2015), the process is now streamlined. However, it did lead to significant time periods between application submissions and assessments, resulting in turn in revisions due to changes in the approval process as well as the situation of operators. For example, one of the 20 operators sourced a loan to implement expansions in the short term and as a result has taken on too much debt for FTB to approve the application immediately
38. This application is temporarily on hold till outstanding debt is paid through bridge
financing, after which approval of the application by FTB is likely (and hence results have been included in the aggregate data).
The collateral requirements under the FTB program are described in Box 5, and present a significant departure
from their previous practices, much alike those of other commercial lenders.
An analysis of collateral assessment revealed that all 20 submissions relied on land/building as collateral, 16 partially relied on water infrastructure fixed assets, and 12 draw on NPV as collateral. The valuated collateral/loan ratio was 156% on average for 19 (instead of 20 operators)
39. The total collateral valuation (as per Box 5)
determined by FTB for 19 loan applications equaled USD 8.4 million, of which 36% included land/buildings, 22% in water infrastructure, and 42% expressed in NPV. Across the portfolio, in addition to collateral from land/buildings used on a preferential basis, only 63% of total collateral was based on infrastructure and only 32% of collateral was based on NPV. FTB also required that a debt reserve was to be built up at an account that would cover 3 months of principal and interest payments.
Box 5 Collateral requirements of FTB under the AFD-funded Access to Finance program
Other analytics of assets, investment costs and financial ratios
Further analysis of the 20 investment studies is described below. Figure 30 illustrates that the appraised book value per existing connection is on average USD 112, spread over different elements of the water system, with most of the existing assets tied up in the piped distribution network. Larger operators tended to have a lower appraised book value of existing assets per connection compared to the smaller ones. This could be explained by economies of scale as well as years in operation (more assets already recovered).
38
This operator loan application of USD 190,000 was initially rejected mid November 2015 as he already accessed a loan from ACLEDA bank to execute smaller-scale expansions. However, a new arrangement has been found in which bridge financing is offered to pay of outstanding debt, after which the loan application with FTB is expected to be approved later in 2016. 39
Most collateral/loan ratios were between 102% to 200%, and a few outliners with much high ratios due to small loans requested.
FTB will calculate potential loan size based on the following collateral: (i) land and buildings are accepted for both hard and soft titles, estimated by two approved
independent Cambodian real estate valuators up to a maximum value of 100% (ii) Valuation of water infrastructure fixed assets by approved valuator (ISEA/GRET) up to a maximum
of 50% (iii) Up to 50% of the Net Present Value of future cash flows over 10 years at a 15% discount rate.
Timeframe is aligned with the loan term and discount rate with FTB’s internal evaluation guidelines
At minimum the loan needed to be covered 100% by collateral.
Other commercial lenders typically are reliant on land value (preferably hard titles), either requiring an independent valuation or willing to accept the estimate of their loan officers.
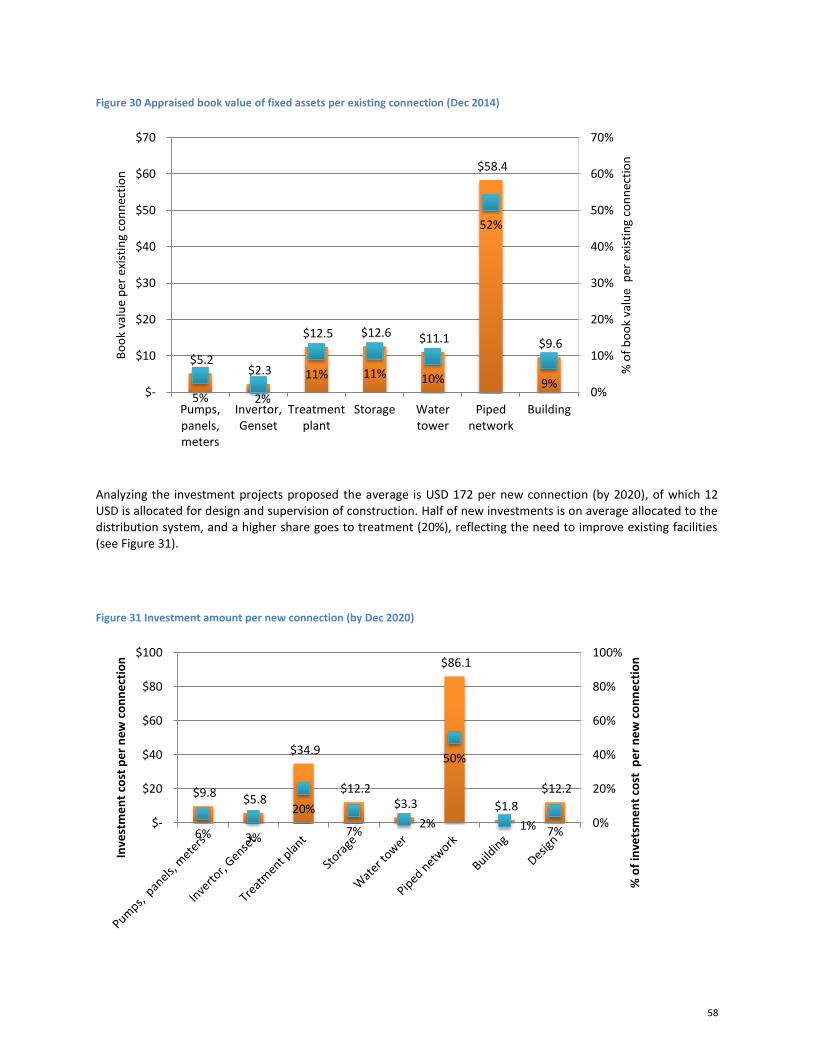
58
Figure 30 Appraised book value of fixed assets per existing connection (Dec 2014)
Analyzing the investment projects proposed the average is USD 172 per new connection (by 2020), of which 12 USD is allocated for design and supervision of construction. Half of new investments is on average allocated to the distribution system, and a higher share goes to treatment (20%), reflecting the need to improve existing facilities (see Figure 31).
Figure 31 Investment amount per new connection (by Dec 2020)
$5.2 $2.3
$12.5 $12.6 $11.1
$58.4
$9.6
5% 2%
11% 11% 10%
52%
9% 0%
10%
20%
30%
40%
50%
60%
70%
$-
$10
$20
$30
$40
$50
$60
$70
Pumps,panels,meters
Invertor,Genset
Treatmentplant
Storage Watertower
Pipednetwork
Building
% o
f b
oo
k va
lue
per
exi
stin
g co
nn
ecti
on
Bo
ok
valu
e p
er e
xist
ing
con
nec
tio
n
$9.8 $5.8
$34.9
$12.2 $3.3
$86.1
$1.8
$12.2
6% 3%
20%
7% 2%
50%
1% 7% 0%
20%
40%
60%
80%
100%
$-
$20
$40
$60
$80
$100
% o
f in
vets
me
nt
cost
pe
r n
ew
co
nn
ect
ion
Inve
stm
en
t co
st p
er
ne
w c
on
ne
ctio
n
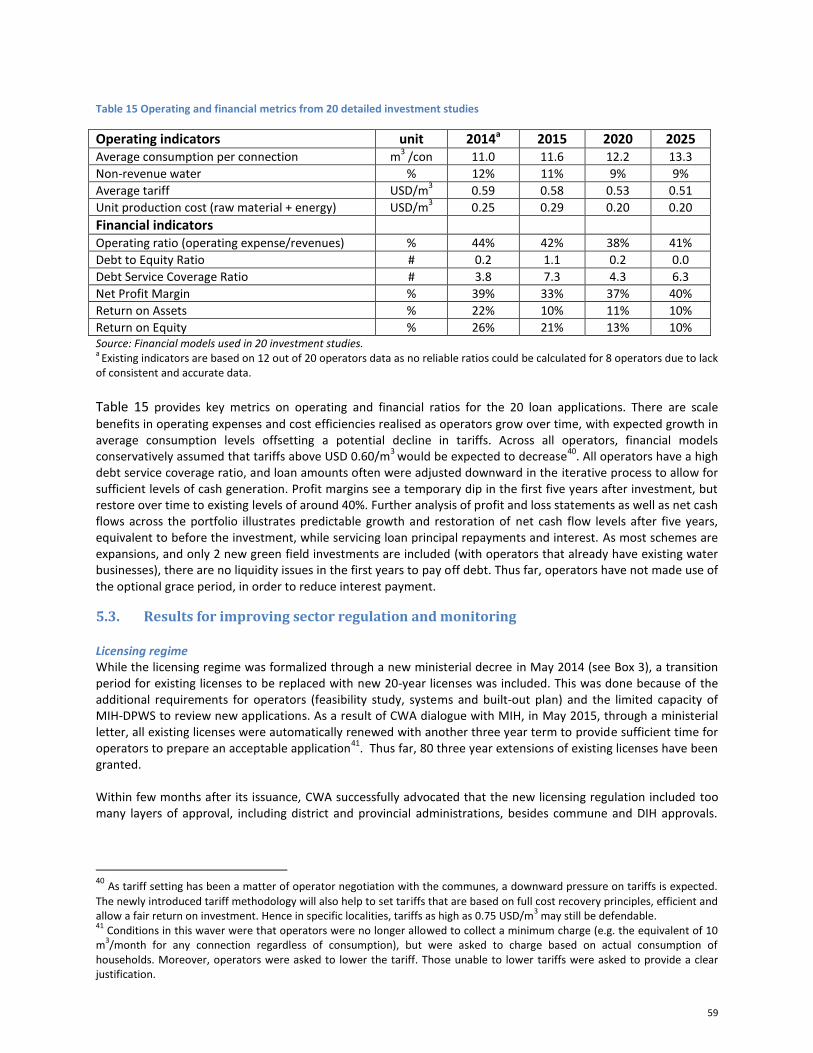
59
Table 15 Operating and financial metrics from 20 detailed investment studies
Operating indicators unit 2014a 2015 2020 2025 Average consumption per connection m
3 /con 11.0 11.6 12.2 13.3
Non-revenue water % 12% 11% 9% 9% Average tariff USD/m
3 0.59 0.58 0.53 0.51
Unit production cost (raw material + energy) USD/m3
0.25 0.29 0.20 0.20 Financial indicators Operating ratio (operating expense/revenues) % 44% 42% 38% 41% Debt to Equity Ratio # 0.2 1.1 0.2 0.0 Debt Service Coverage Ratio # 3.8 7.3 4.3 6.3 Net Profit Margin % 39% 33% 37% 40% Return on Assets % 22% 10% 11% 10% Return on Equity % 26% 21% 13% 10% Source: Financial models used in 20 investment studies. a
Existing indicators are based on 12 out of 20 operators data as no reliable ratios could be calculated for 8 operators due to lack of consistent and accurate data.
Table 15 provides key metrics on operating and financial ratios for the 20 loan applications. There are scale
benefits in operating expenses and cost efficiencies realised as operators grow over time, with expected growth in average consumption levels offsetting a potential decline in tariffs. Across all operators, financial models conservatively assumed that tariffs above USD 0.60/m
3 would be expected to decrease
40. All operators have a high
debt service coverage ratio, and loan amounts often were adjusted downward in the iterative process to allow for sufficient levels of cash generation. Profit margins see a temporary dip in the first five years after investment, but restore over time to existing levels of around 40%. Further analysis of profit and loss statements as well as net cash flows across the portfolio illustrates predictable growth and restoration of net cash flow levels after five years, equivalent to before the investment, while servicing loan principal repayments and interest. As most schemes are expansions, and only 2 new green field investments are included (with operators that already have existing water businesses), there are no liquidity issues in the first years to pay off debt. Thus far, operators have not made use of the optional grace period, in order to reduce interest payment.
5.3. Results for improving sector regulation and monitoring Licensing regime While the licensing regime was formalized through a new ministerial decree in May 2014 (see Box 3), a transition period for existing licenses to be replaced with new 20-year licenses was included. This was done because of the additional requirements for operators (feasibility study, systems and built-out plan) and the limited capacity of MIH-DPWS to review new applications. As a result of CWA dialogue with MIH, in May 2015, through a ministerial letter, all existing licenses were automatically renewed with another three year term to provide sufficient time for operators to prepare an acceptable application
41. Thus far, 80 three year extensions of existing licenses have been
granted. Within few months after its issuance, CWA successfully advocated that the new licensing regulation included too many layers of approval, including district and provincial administrations, besides commune and DIH approvals.
40
As tariff setting has been a matter of operator negotiation with the communes, a downward pressure on tariffs is expected.
The newly introduced tariff methodology will also help to set tariffs that are based on full cost recovery principles, efficient and allow a fair return on investment. Hence in specific localities, tariffs as high as 0.75 USD/m
3 may still be defendable.
41 Conditions in this waver were that operators were no longer allowed to collect a minimum charge (e.g. the equivalent of 10
m3/month for any connection regardless of consumption), but were asked to charge based on actual consumption of
households. Moreover, operators were asked to lower the tariff. Those unable to lower tariffs were asked to provide a clear justification.
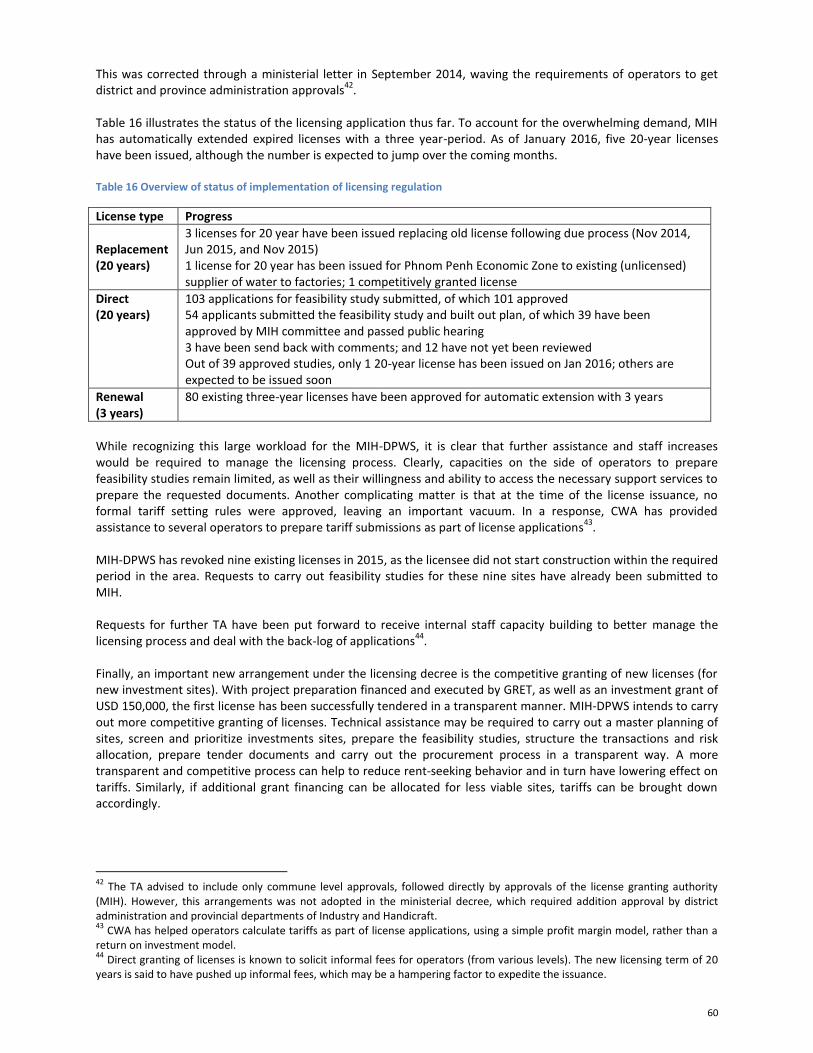
60
This was corrected through a ministerial letter in September 2014, waving the requirements of operators to get district and province administration approvals
42.
Table 16 illustrates the status of the licensing application thus far. To account for the overwhelming demand, MIH has automatically extended expired licenses with a three year-period. As of January 2016, five 20-year licenses have been issued, although the number is expected to jump over the coming months. Table 16 Overview of status of implementation of licensing regulation
License type Progress
Replacement (20 years)
3 licenses for 20 year have been issued replacing old license following due process (Nov 2014, Jun 2015, and Nov 2015) 1 license for 20 year has been issued for Phnom Penh Economic Zone to existing (unlicensed) supplier of water to factories; 1 competitively granted license
Direct (20 years)
103 applications for feasibility study submitted, of which 101 approved 54 applicants submitted the feasibility study and built out plan, of which 39 have been approved by MIH committee and passed public hearing 3 have been send back with comments; and 12 have not yet been reviewed Out of 39 approved studies, only 1 20-year license has been issued on Jan 2016; others are expected to be issued soon
Renewal (3 years)
80 existing three-year licenses have been approved for automatic extension with 3 years
While recognizing this large workload for the MIH-DPWS, it is clear that further assistance and staff increases would be required to manage the licensing process. Clearly, capacities on the side of operators to prepare feasibility studies remain limited, as well as their willingness and ability to access the necessary support services to prepare the requested documents. Another complicating matter is that at the time of the license issuance, no formal tariff setting rules were approved, leaving an important vacuum. In a response, CWA has provided assistance to several operators to prepare tariff submissions as part of license applications
43.
MIH-DPWS has revoked nine existing licenses in 2015, as the licensee did not start construction within the required period in the area. Requests to carry out feasibility studies for these nine sites have already been submitted to MIH. Requests for further TA have been put forward to receive internal staff capacity building to better manage the licensing process and deal with the back-log of applications
44.
Finally, an important new arrangement under the licensing decree is the competitive granting of new licenses (for new investment sites). With project preparation financed and executed by GRET, as well as an investment grant of USD 150,000, the first license has been successfully tendered in a transparent manner. MIH-DPWS intends to carry out more competitive granting of licenses. Technical assistance may be required to carry out a master planning of sites, screen and prioritize investments sites, prepare the feasibility studies, structure the transactions and risk allocation, prepare tender documents and carry out the procurement process in a transparent way. A more transparent and competitive process can help to reduce rent-seeking behavior and in turn have lowering effect on tariffs. Similarly, if additional grant financing can be allocated for less viable sites, tariffs can be brought down accordingly.
42
The TA advised to include only commune level approvals, followed directly by approvals of the license granting authority (MIH). However, this arrangements was not adopted in the ministerial decree, which required addition approval by district administration and provincial departments of Industry and Handicraft. 43
CWA has helped operators calculate tariffs as part of license applications, using a simple profit margin model, rather than a return on investment model. 44
Direct granting of licenses is known to solicit informal fees for operators (from various levels). The new licensing term of 20 years is said to have pushed up informal fees, which may be a hampering factor to expedite the issuance.
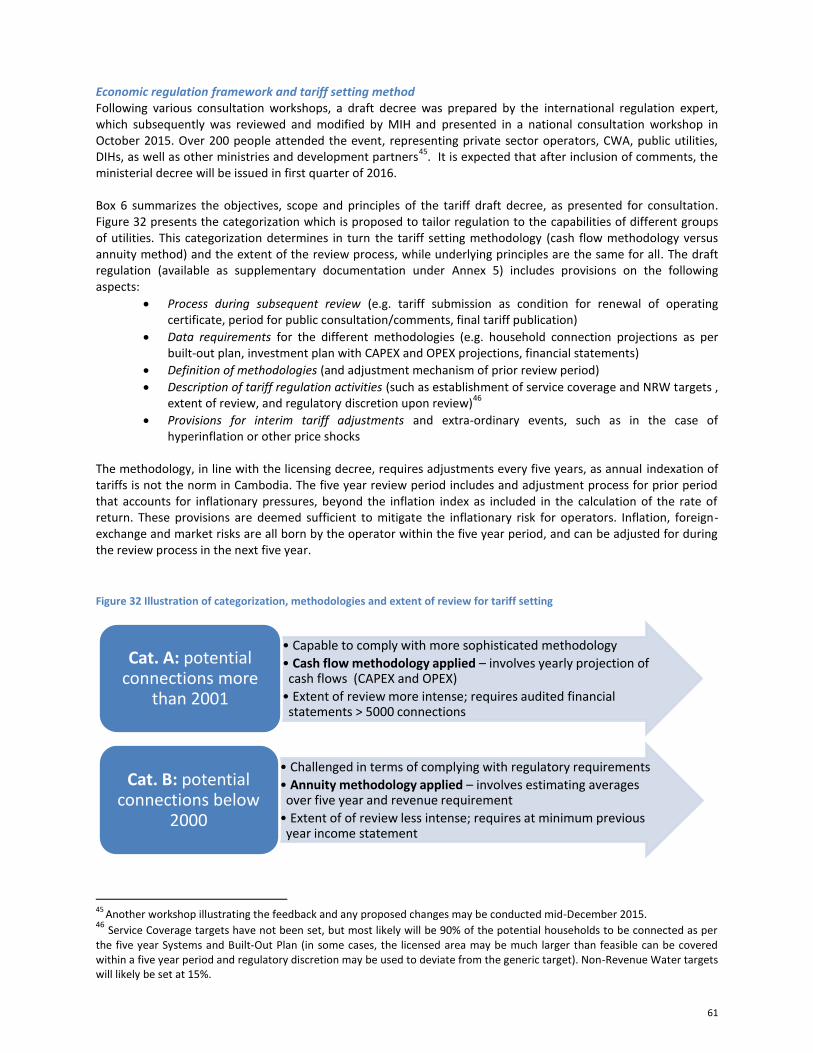
61
Economic regulation framework and tariff setting method Following various consultation workshops, a draft decree was prepared by the international regulation expert, which subsequently was reviewed and modified by MIH and presented in a national consultation workshop in October 2015. Over 200 people attended the event, representing private sector operators, CWA, public utilities, DIHs, as well as other ministries and development partners
45. It is expected that after inclusion of comments, the
ministerial decree will be issued in first quarter of 2016. Box 6 summarizes the objectives, scope and principles of the tariff draft decree, as presented for consultation. Figure 32 presents the categorization which is proposed to tailor regulation to the capabilities of different groups of utilities. This categorization determines in turn the tariff setting methodology (cash flow methodology versus annuity method) and the extent of the review process, while underlying principles are the same for all. The draft regulation (available as supplementary documentation under Annex 5) includes provisions on the following aspects:
Process during subsequent review (e.g. tariff submission as condition for renewal of operating certificate, period for public consultation/comments, final tariff publication)
Data requirements for the different methodologies (e.g. household connection projections as per built-out plan, investment plan with CAPEX and OPEX projections, financial statements)
Definition of methodologies (and adjustment mechanism of prior review period)
Description of tariff regulation activities (such as establishment of service coverage and NRW targets , extent of review, and regulatory discretion upon review)
46
Provisions for interim tariff adjustments and extra-ordinary events, such as in the case of hyperinflation or other price shocks
The methodology, in line with the licensing decree, requires adjustments every five years, as annual indexation of tariffs is not the norm in Cambodia. The five year review period includes and adjustment process for prior period that accounts for inflationary pressures, beyond the inflation index as included in the calculation of the rate of return. These provisions are deemed sufficient to mitigate the inflationary risk for operators. Inflation, foreign-exchange and market risks are all born by the operator within the five year period, and can be adjusted for during the review process in the next five year.
Figure 32 Illustration of categorization, methodologies and extent of review for tariff setting
45
Another workshop illustrating the feedback and any proposed changes may be conducted mid-December 2015. 46
Service Coverage targets have not been set, but most likely will be 90% of the potential households to be connected as per the five year Systems and Built-Out Plan (in some cases, the licensed area may be much larger than feasible can be covered within a five year period and regulatory discretion may be used to deviate from the generic target). Non-Revenue Water targets will likely be set at 15%.
• Capable to comply with more sophisticated methodology
• Cash flow methodology applied – involves yearly projection of cash flows (CAPEX and OPEX)
• Extent of review more intense; requires audited financial statements > 5000 connections
Cat. A: potential connections more
than 2001
• Challenged in terms of complying with regulatory requirements
• Annuity methodology applied – involves estimating averages over five year and revenue requirement
• Extent of of review less intense; requires at minimum previous year income statement
Cat. B: potential connections below
2000
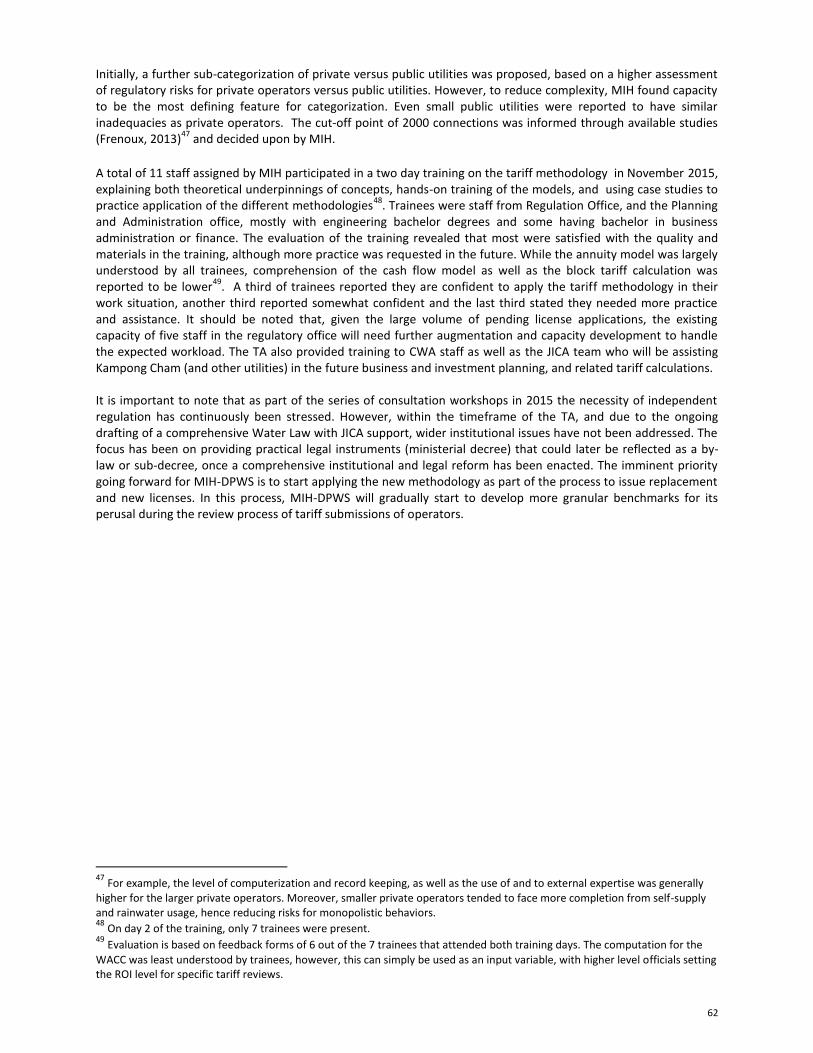
62
Initially, a further sub-categorization of private versus public utilities was proposed, based on a higher assessment of regulatory risks for private operators versus public utilities. However, to reduce complexity, MIH found capacity to be the most defining feature for categorization. Even small public utilities were reported to have similar inadequacies as private operators. The cut-off point of 2000 connections was informed through available studies (Frenoux, 2013)
47 and decided upon by MIH.
A total of 11 staff assigned by MIH participated in a two day training on the tariff methodology in November 2015, explaining both theoretical underpinnings of concepts, hands-on training of the models, and using case studies to practice application of the different methodologies
48. Trainees were staff from Regulation Office, and the Planning
and Administration office, mostly with engineering bachelor degrees and some having bachelor in business administration or finance. The evaluation of the training revealed that most were satisfied with the quality and materials in the training, although more practice was requested in the future. While the annuity model was largely understood by all trainees, comprehension of the cash flow model as well as the block tariff calculation was reported to be lower
49. A third of trainees reported they are confident to apply the tariff methodology in their
work situation, another third reported somewhat confident and the last third stated they needed more practice and assistance. It should be noted that, given the large volume of pending license applications, the existing capacity of five staff in the regulatory office will need further augmentation and capacity development to handle the expected workload. The TA also provided training to CWA staff as well as the JICA team who will be assisting Kampong Cham (and other utilities) in the future business and investment planning, and related tariff calculations. It is important to note that as part of the series of consultation workshops in 2015 the necessity of independent regulation has continuously been stressed. However, within the timeframe of the TA, and due to the ongoing drafting of a comprehensive Water Law with JICA support, wider institutional issues have not been addressed. The focus has been on providing practical legal instruments (ministerial decree) that could later be reflected as a by-law or sub-decree, once a comprehensive institutional and legal reform has been enacted. The imminent priority going forward for MIH-DPWS is to start applying the new methodology as part of the process to issue replacement and new licenses. In this process, MIH-DPWS will gradually start to develop more granular benchmarks for its perusal during the review process of tariff submissions of operators.
47
For example, the level of computerization and record keeping, as well as the use of and to external expertise was generally higher for the larger private operators. Moreover, smaller private operators tended to face more completion from self-supply and rainwater usage, hence reducing risks for monopolistic behaviors. 48
On day 2 of the training, only 7 trainees were present. 49
Evaluation is based on feedback forms of 6 out of the 7 trainees that attended both training days. The computation for the
WACC was least understood by trainees, however, this can simply be used as an input variable, with higher level officials setting the ROI level for specific tariff reviews.
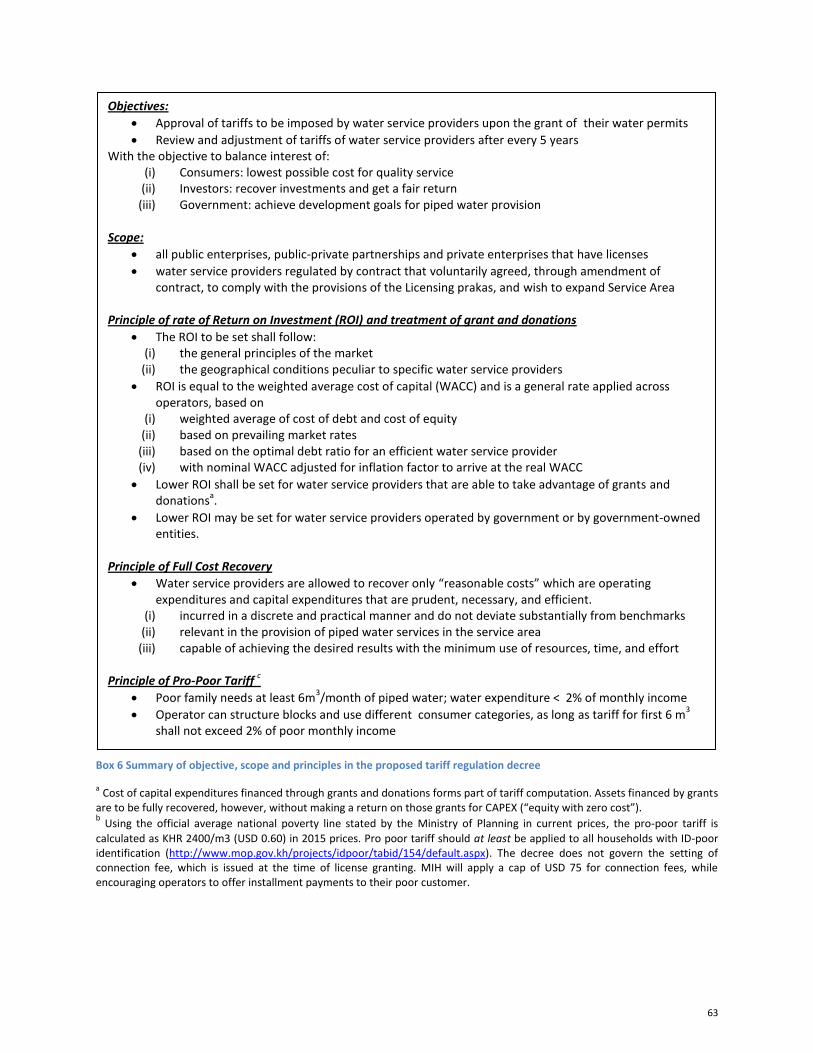
63
Box 6 Summary of objective, scope and principles in the proposed tariff regulation decree
a Cost of capital expenditures financed through grants and donations forms part of tariff computation. Assets financed by grants are to be fully recovered, however, without making a return on those grants for CAPEX (“equity with zero cost”). b Using the official average national poverty line stated by the Ministry of Planning in current prices, the pro-poor tariff is
calculated as KHR 2400/m3 (USD 0.60) in 2015 prices. Pro poor tariff should at least be applied to all households with ID-poor identification (http://www.mop.gov.kh/projects/idpoor/tabid/154/default.aspx). The decree does not govern the setting of connection fee, which is issued at the time of license granting. MIH will apply a cap of USD 75 for connection fees, while encouraging operators to offer installment payments to their poor customer.
Objectives:
Approval of tariffs to be imposed by water service providers upon the grant of their water permits
Review and adjustment of tariffs of water service providers after every 5 years With the objective to balance interest of:
(i) Consumers: lowest possible cost for quality service (ii) Investors: recover investments and get a fair return
(iii) Government: achieve development goals for piped water provision Scope:
all public enterprises, public-private partnerships and private enterprises that have licenses
water service providers regulated by contract that voluntarily agreed, through amendment of contract, to comply with the provisions of the Licensing prakas, and wish to expand Service Area
Principle of rate of Return on Investment (ROI) and treatment of grant and donations
The ROI to be set shall follow: (i) the general principles of the market
(ii) the geographical conditions peculiar to specific water service providers
ROI is equal to the weighted average cost of capital (WACC) and is a general rate applied across operators, based on
(i) weighted average of cost of debt and cost of equity (ii) based on prevailing market rates
(iii) based on the optimal debt ratio for an efficient water service provider (iv) with nominal WACC adjusted for inflation factor to arrive at the real WACC
Lower ROI shall be set for water service providers that are able to take advantage of grants and donations
a.
Lower ROI may be set for water service providers operated by government or by government-owned entities.
Principle of Full Cost Recovery
Water service providers are allowed to recover only “reasonable costs” which are operating expenditures and capital expenditures that are prudent, necessary, and efficient.
(i) incurred in a discrete and practical manner and do not deviate substantially from benchmarks (ii) relevant in the provision of piped water services in the service area
(iii) capable of achieving the desired results with the minimum use of resources, time, and effort Principle of Pro-Poor Tariff
c
Poor family needs at least 6m3/month of piped water; water expenditure < 2% of monthly income
Operator can structure blocks and use different consumer categories, as long as tariff for first 6 m3
shall not exceed 2% of poor monthly income
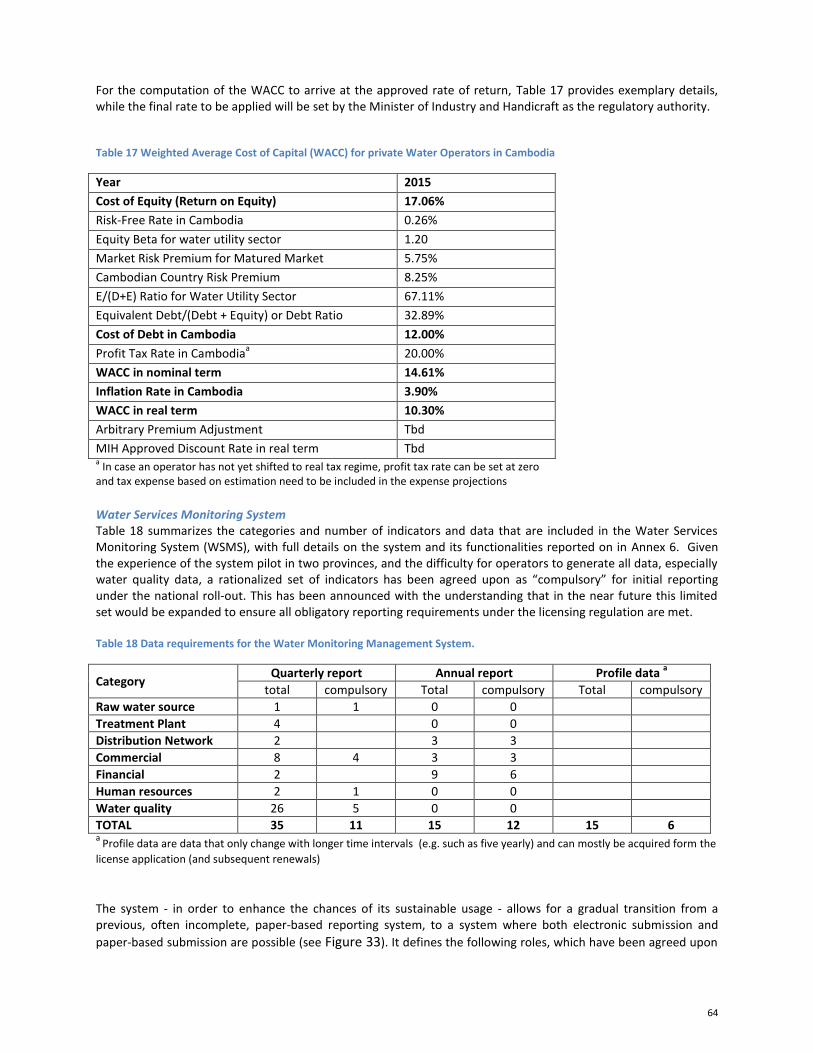
64
For the computation of the WACC to arrive at the approved rate of return, Table 17 provides exemplary details, while the final rate to be applied will be set by the Minister of Industry and Handicraft as the regulatory authority.
Table 17 Weighted Average Cost of Capital (WACC) for private Water Operators in Cambodia
Year 2015
Cost of Equity (Return on Equity) 17.06%
Risk-Free Rate in Cambodia 0.26%
Equity Beta for water utility sector 1.20
Market Risk Premium for Matured Market 5.75%
Cambodian Country Risk Premium 8.25%
E/(D+E) Ratio for Water Utility Sector 67.11%
Equivalent Debt/(Debt + Equity) or Debt Ratio 32.89%
Cost of Debt in Cambodia 12.00%
Profit Tax Rate in Cambodiaa
20.00%
WACC in nominal term 14.61%
Inflation Rate in Cambodia 3.90%
WACC in real term 10.30%
Arbitrary Premium Adjustment Tbd
MIH Approved Discount Rate in real term Tbd a In case an operator has not yet shifted to real tax regime, profit tax rate can be set at zero
and tax expense based on estimation need to be included in the expense projections
Water Services Monitoring System Table 18 summarizes the categories and number of indicators and data that are included in the Water Services Monitoring System (WSMS), with full details on the system and its functionalities reported on in Annex 6. Given the experience of the system pilot in two provinces, and the difficulty for operators to generate all data, especially water quality data, a rationalized set of indicators has been agreed upon as “compulsory” for initial reporting under the national roll-out. This has been announced with the understanding that in the near future this limited set would be expanded to ensure all obligatory reporting requirements under the licensing regulation are met. Table 18 Data requirements for the Water Monitoring Management System.
Category Quarterly report Annual report Profile data
a
total compulsory Total compulsory Total compulsory
Raw water source 1 1 0 0
Treatment Plant 4 0 0
Distribution Network 2 3 3
Commercial 8 4 3 3
Financial 2 9 6
Human resources 2 1 0 0
Water quality 26 5 0 0
TOTAL 35 11 15 12 15 6 a
Profile data are data that only change with longer time intervals (e.g. such as five yearly) and can mostly be acquired form the
license application (and subsequent renewals) The system - in order to enhance the chances of its sustainable usage - allows for a gradual transition from a previous, often incomplete, paper-based reporting system, to a system where both electronic submission and
paper-based submission are possible (see Figure 33). It defines the following roles, which have been agreed upon
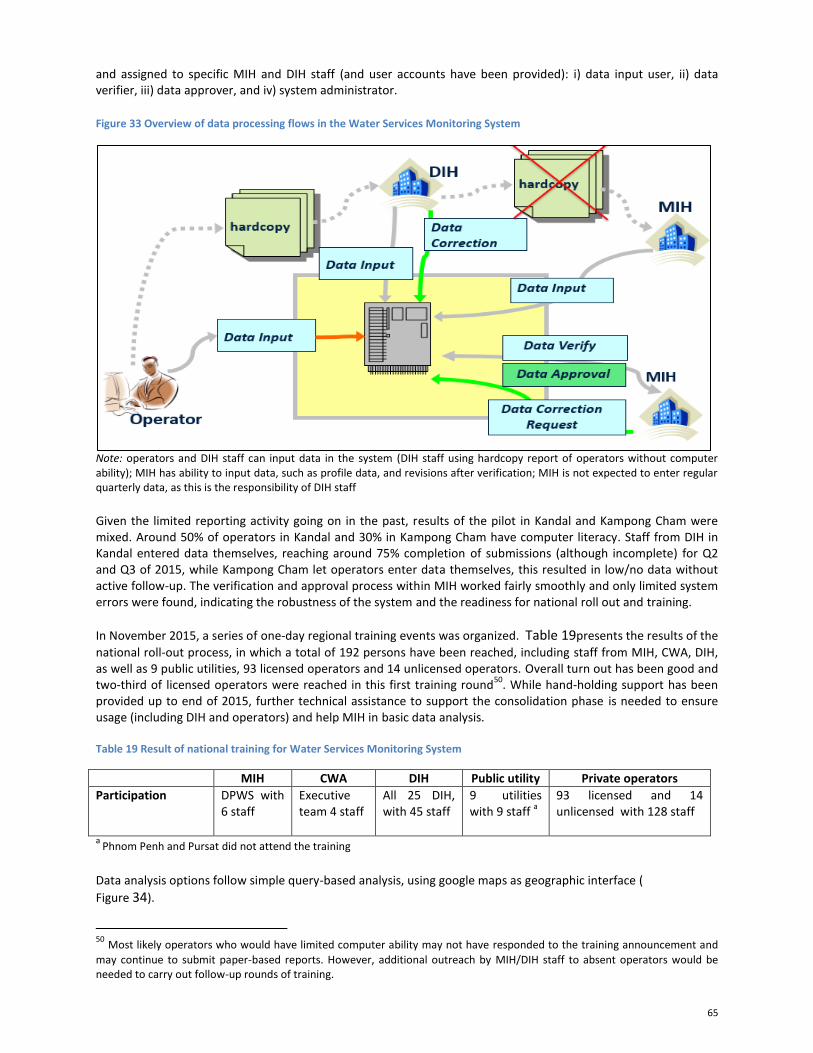
65
and assigned to specific MIH and DIH staff (and user accounts have been provided): i) data input user, ii) data verifier, iii) data approver, and iv) system administrator.
Figure 33 Overview of data processing flows in the Water Services Monitoring System
Note: operators and DIH staff can input data in the system (DIH staff using hardcopy report of operators without computer ability); MIH has ability to input data, such as profile data, and revisions after verification; MIH is not expected to enter regular quarterly data, as this is the responsibility of DIH staff
Given the limited reporting activity going on in the past, results of the pilot in Kandal and Kampong Cham were mixed. Around 50% of operators in Kandal and 30% in Kampong Cham have computer literacy. Staff from DIH in Kandal entered data themselves, reaching around 75% completion of submissions (although incomplete) for Q2 and Q3 of 2015, while Kampong Cham let operators enter data themselves, this resulted in low/no data without active follow-up. The verification and approval process within MIH worked fairly smoothly and only limited system errors were found, indicating the robustness of the system and the readiness for national roll out and training.
In November 2015, a series of one-day regional training events was organized. Table 19presents the results of the
national roll-out process, in which a total of 192 persons have been reached, including staff from MIH, CWA, DIH, as well as 9 public utilities, 93 licensed operators and 14 unlicensed operators. Overall turn out has been good and two-third of licensed operators were reached in this first training round
50. While hand-holding support has been
provided up to end of 2015, further technical assistance to support the consolidation phase is needed to ensure usage (including DIH and operators) and help MIH in basic data analysis. Table 19 Result of national training for Water Services Monitoring System
MIH CWA DIH Public utility
Private operators
Participation DPWS with 6 staff
Executive team 4 staff
All 25 DIH, with 45 staff
9 utilities with 9 staff
a
93 licensed and 14 unlicensed with 128 staff
a Phnom Penh and Pursat did not attend the training
Data analysis options follow simple query-based analysis, using google maps as geographic interface (
Figure 34).
50
Most likely operators who would have limited computer ability may not have responded to the training announcement and
may continue to submit paper-based reports. However, additional outreach by MIH/DIH staff to absent operators would be needed to carry out follow-up rounds of training.
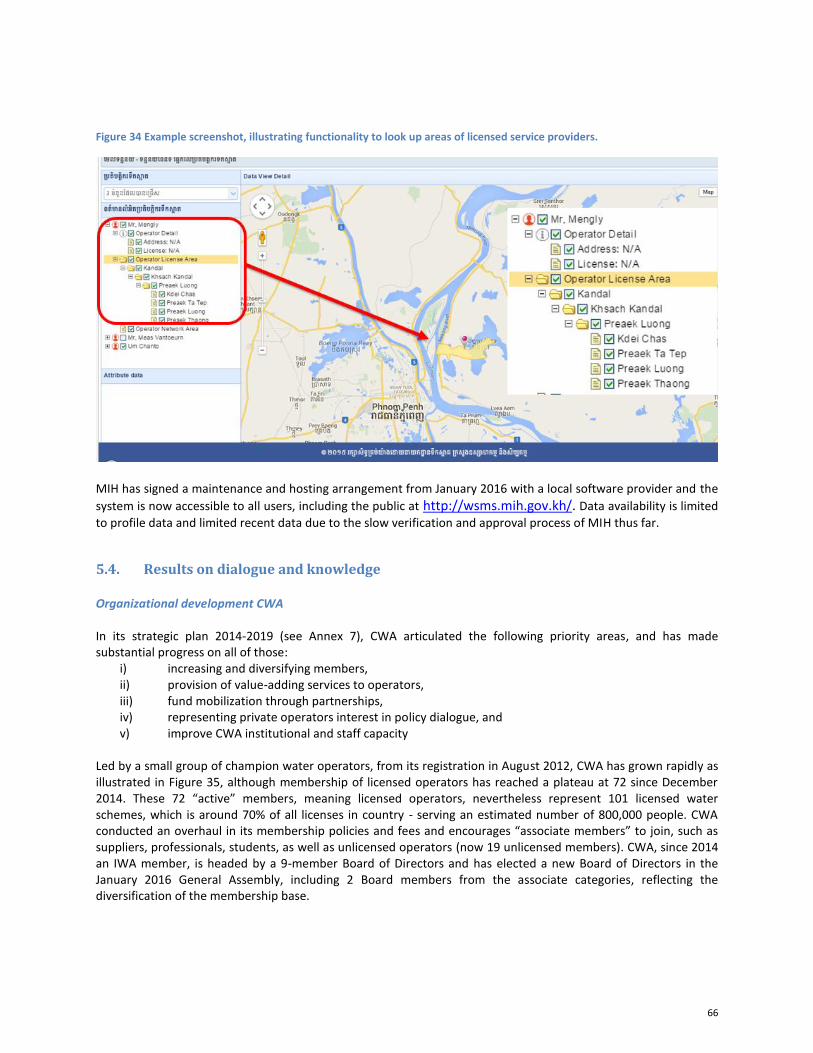
66
Figure 34 Example screenshot, illustrating functionality to look up areas of licensed service providers.
MIH has signed a maintenance and hosting arrangement from January 2016 with a local software provider and the
system is now accessible to all users, including the public at http://wsms.mih.gov.kh/. Data availability is limited
to profile data and limited recent data due to the slow verification and approval process of MIH thus far.
5.4. Results on dialogue and knowledge Organizational development CWA In its strategic plan 2014-2019 (see Annex 7), CWA articulated the following priority areas, and has made substantial progress on all of those:
i) increasing and diversifying members, ii) provision of value-adding services to operators, iii) fund mobilization through partnerships, iv) representing private operators interest in policy dialogue, and v) improve CWA institutional and staff capacity
Led by a small group of champion water operators, from its registration in August 2012, CWA has grown rapidly as illustrated in Figure 35, although membership of licensed operators has reached a plateau at 72 since December 2014. These 72 “active” members, meaning licensed operators, nevertheless represent 101 licensed water schemes, which is around 70% of all licenses in country - serving an estimated number of 800,000 people. CWA conducted an overhaul in its membership policies and fees and encourages “associate members” to join, such as suppliers, professionals, students, as well as unlicensed operators (now 19 unlicensed members). CWA, since 2014 an IWA member, is headed by a 9-member Board of Directors and has elected a new Board of Directors in the January 2016 General Assembly, including 2 Board members from the associate categories, reflecting the diversification of the membership base.
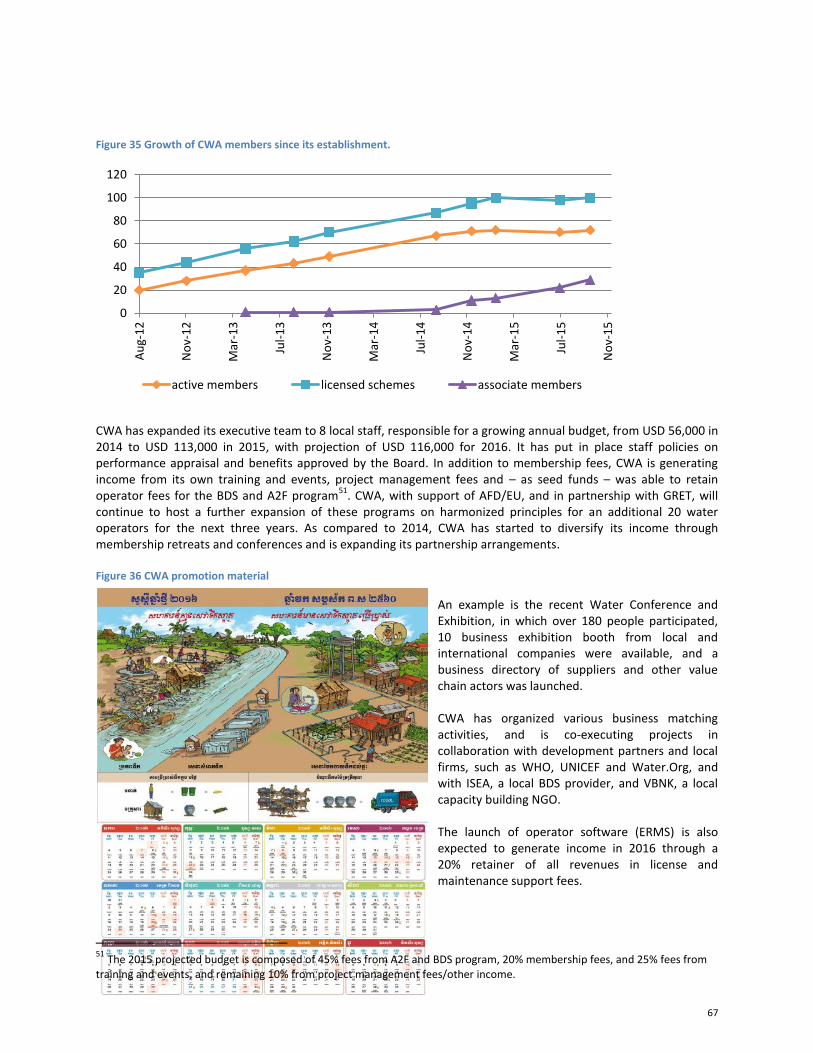
67
Figure 35 Growth of CWA members since its establishment.
CWA has expanded its executive team to 8 local staff, responsible for a growing annual budget, from USD 56,000 in 2014 to USD 113,000 in 2015, with projection of USD 116,000 for 2016. It has put in place staff policies on performance appraisal and benefits approved by the Board. In addition to membership fees, CWA is generating income from its own training and events, project management fees and – as seed funds – was able to retain operator fees for the BDS and A2F program
51. CWA, with support of AFD/EU, and in partnership with GRET, will
continue to host a further expansion of these programs on harmonized principles for an additional 20 water operators for the next three years. As compared to 2014, CWA has started to diversify its income through membership retreats and conferences and is expanding its partnership arrangements. Figure 36 CWA promotion material
An example is the recent Water Conference and Exhibition, in which over 180 people participated, 10 business exhibition booth from local and international companies were available, and a business directory of suppliers and other value chain actors was launched. CWA has organized various business matching activities, and is co-executing projects in collaboration with development partners and local firms, such as WHO, UNICEF and Water.Org, and with ISEA, a local BDS provider, and VBNK, a local capacity building NGO. The launch of operator software (ERMS) is also expected to generate income in 2016 through a 20% retainer of all revenues in license and maintenance support fees.
51
The 2015 projected budget is composed of 45% fees from A2F and BDS program, 20% membership fees, and 25% fees from training and events, and remaining 10% from project management fees/other income.
0
20
40
60
80
100
120
Au
g-1
2
No
v-1
2
Mar
-13
Jul-
13
No
v-1
3
Mar
-14
Jul-
14
No
v-1
4
Mar
-15
Jul-
15
No
v-1
5
active members licensed schemes associate members
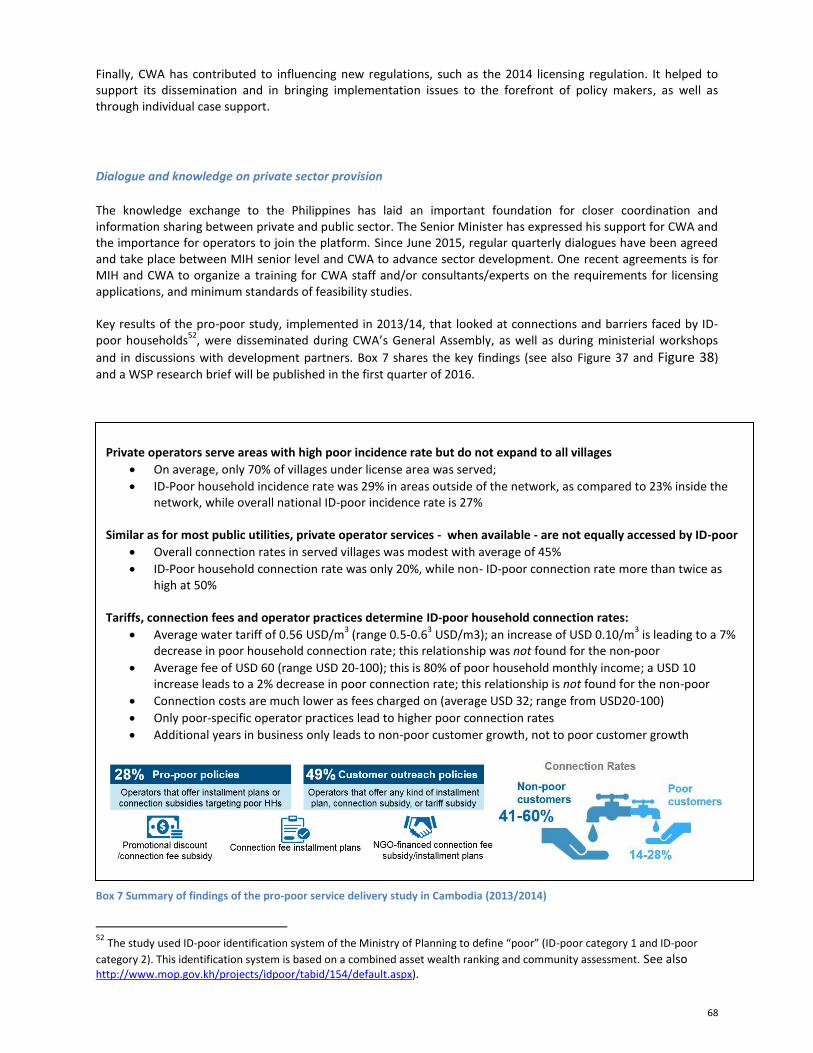
68
Finally, CWA has contributed to influencing new regulations, such as the 2014 licensing regulation. It helped to support its dissemination and in bringing implementation issues to the forefront of policy makers, as well as through individual case support.
Dialogue and knowledge on private sector provision
The knowledge exchange to the Philippines has laid an important foundation for closer coordination and information sharing between private and public sector. The Senior Minister has expressed his support for CWA and the importance for operators to join the platform. Since June 2015, regular quarterly dialogues have been agreed and take place between MIH senior level and CWA to advance sector development. One recent agreements is for MIH and CWA to organize a training for CWA staff and/or consultants/experts on the requirements for licensing applications, and minimum standards of feasibility studies. Key results of the pro-poor study, implemented in 2013/14, that looked at connections and barriers faced by ID-poor households
52, were disseminated during CWA’s General Assembly, as well as during ministerial workshops
and in discussions with development partners. Box 7 shares the key findings (see also Figure 37 and Figure 38)
and a WSP research brief will be published in the first quarter of 2016.
Box 7 Summary of findings of the pro-poor service delivery study in Cambodia (2013/2014)
52
The study used ID-poor identification system of the Ministry of Planning to define “poor” (ID-poor category 1 and ID-poor
category 2). This identification system is based on a combined asset wealth ranking and community assessment. See also http://www.mop.gov.kh/projects/idpoor/tabid/154/default.aspx).
Private operators serve areas with high poor incidence rate but do not expand to all villages
On average, only 70% of villages under license area was served;
ID-Poor household incidence rate was 29% in areas outside of the network, as compared to 23% inside the network, while overall national ID-poor incidence rate is 27%
Similar as for most public utilities, private operator services - when available - are not equally accessed by ID-poor
Overall connection rates in served villages was modest with average of 45%
ID-Poor household connection rate was only 20%, while non- ID-poor connection rate more than twice as high at 50%
Tariffs, connection fees and operator practices determine ID-poor household connection rates:
Average water tariff of 0.56 USD/m3 (range 0.5-0.6
3 USD/m3); an increase of USD 0.10/m
3 is leading to a 7%
decrease in poor household connection rate; this relationship was not found for the non-poor
Average fee of USD 60 (range USD 20-100); this is 80% of poor household monthly income; a USD 10 increase leads to a 2% decrease in poor connection rate; this relationship is not found for the non-poor
Connection costs are much lower as fees charged on (average USD 32; range from USD20-100)
Only poor-specific operator practices lead to higher poor connection rates
Additional years in business only leads to non-poor customer growth, not to poor customer growth
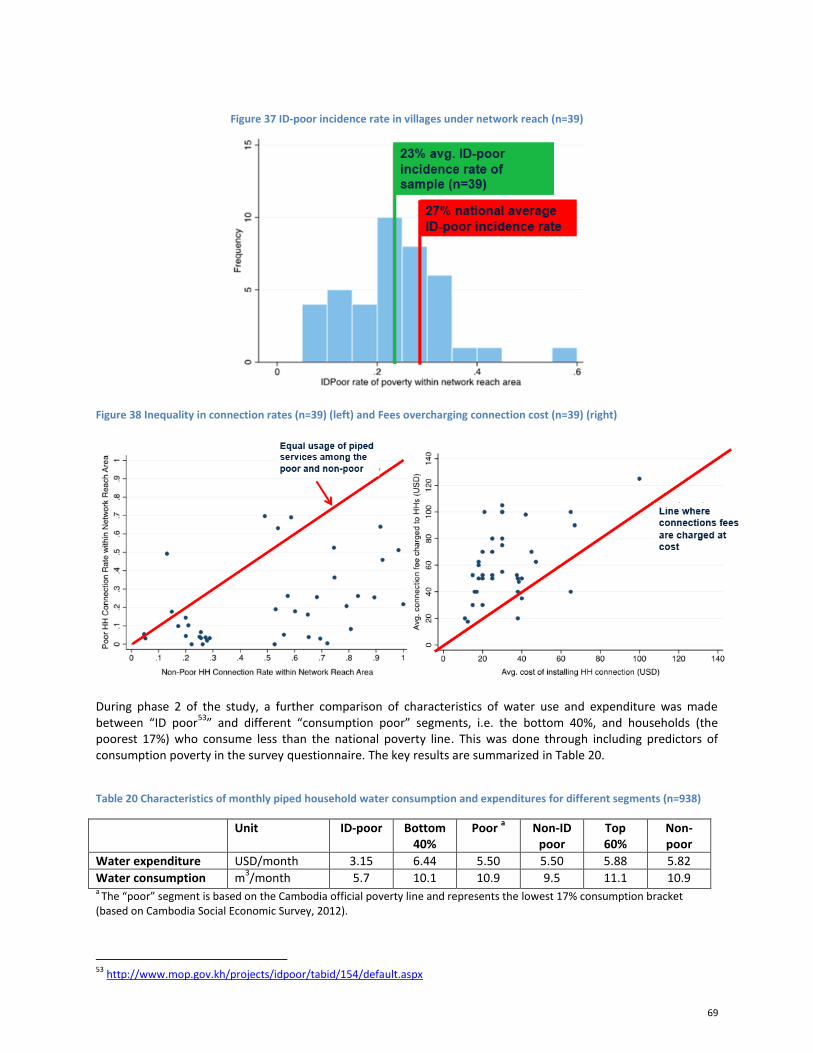
69
Figure 37 ID-poor incidence rate in villages under network reach (n=39)
Figure 38 Inequality in connection rates (n=39) (left) and Fees overcharging connection cost (n=39) (right)
During phase 2 of the study, a further comparison of characteristics of water use and expenditure was made between “ID poor
53” and different “consumption poor” segments, i.e. the bottom 40%, and households (the
poorest 17%) who consume less than the national poverty line. This was done through including predictors of consumption poverty in the survey questionnaire. The key results are summarized in Table 20.
Table 20 Characteristics of monthly piped household water consumption and expenditures for different segments (n=938)
Unit ID-poor
Bottom 40%
Poor
a Non-ID
poor Top 60%
Non-poor
Water expenditure USD/month 3.15 6.44 5.50 5.50 5.88 5.82
Water consumption m3/month 5.7 10.1 10.9 9.5 11.1 10.9
a The “poor” segment is based on the Cambodia official poverty line and represents the lowest 17% consumption bracket
(based on Cambodia Social Economic Survey, 2012).
53
http://www.mop.gov.kh/projects/idpoor/tabid/154/default.aspx
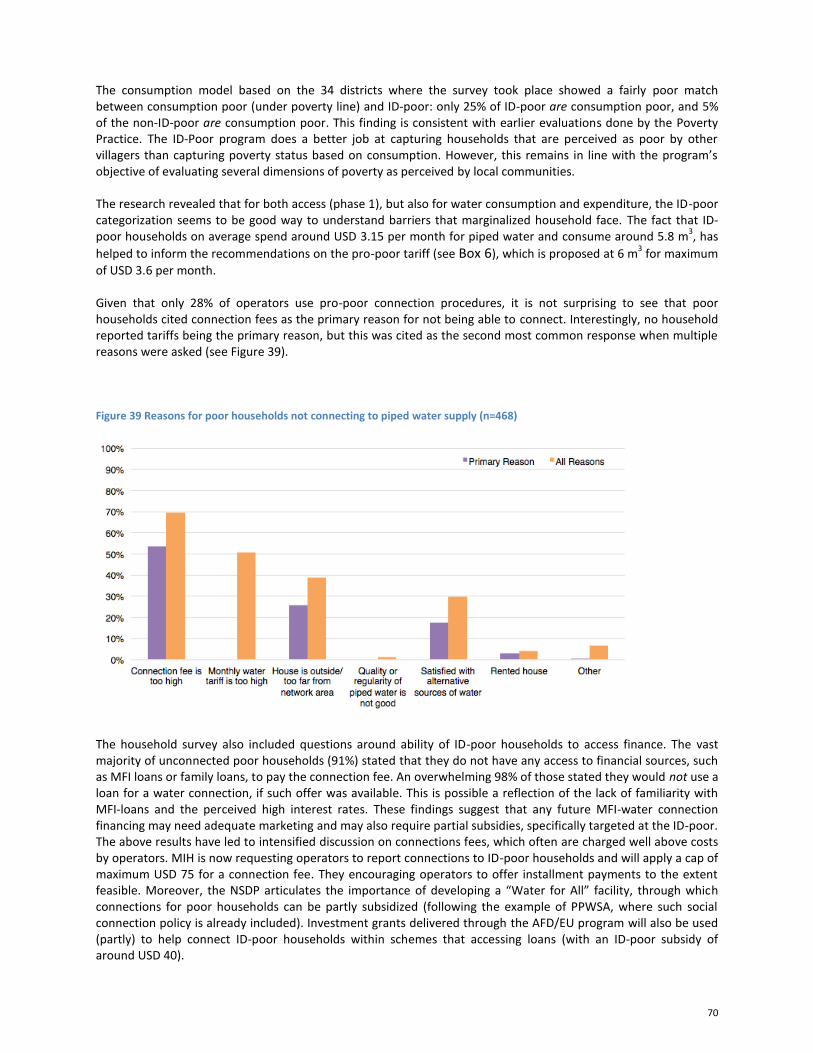
70
The consumption model based on the 34 districts where the survey took place showed a fairly poor match between consumption poor (under poverty line) and ID-poor: only 25% of ID-poor are consumption poor, and 5% of the non-ID-poor are consumption poor. This finding is consistent with earlier evaluations done by the Poverty Practice. The ID-Poor program does a better job at capturing households that are perceived as poor by other villagers than capturing poverty status based on consumption. However, this remains in line with the program’s objective of evaluating several dimensions of poverty as perceived by local communities. The research revealed that for both access (phase 1), but also for water consumption and expenditure, the ID-poor categorization seems to be good way to understand barriers that marginalized household face. The fact that ID-poor households on average spend around USD 3.15 per month for piped water and consume around 5.8 m
3, has
helped to inform the recommendations on the pro-poor tariff (see Box 6), which is proposed at 6 m3 for maximum
of USD 3.6 per month. Given that only 28% of operators use pro-poor connection procedures, it is not surprising to see that poor households cited connection fees as the primary reason for not being able to connect. Interestingly, no household reported tariffs being the primary reason, but this was cited as the second most common response when multiple reasons were asked (see Figure 39). Figure 39 Reasons for poor households not connecting to piped water supply (n=468)
The household survey also included questions around ability of ID-poor households to access finance. The vast majority of unconnected poor households (91%) stated that they do not have any access to financial sources, such as MFI loans or family loans, to pay the connection fee. An overwhelming 98% of those stated they would not use a loan for a water connection, if such offer was available. This is possible a reflection of the lack of familiarity with MFI-loans and the perceived high interest rates. These findings suggest that any future MFI-water connection financing may need adequate marketing and may also require partial subsidies, specifically targeted at the ID-poor. The above results have led to intensified discussion on connections fees, which often are charged well above costs by operators. MIH is now requesting operators to report connections to ID-poor households and will apply a cap of maximum USD 75 for a connection fee. They encouraging operators to offer installment payments to the extent feasible. Moreover, the NSDP articulates the importance of developing a “Water for All” facility, through which connections for poor households can be partly subsidized (following the example of PPWSA, where such social connection policy is already included). Investment grants delivered through the AFD/EU program will also be used (partly) to help connect ID-poor households within schemes that accessing loans (with an ID-poor subsidy of around USD 40).
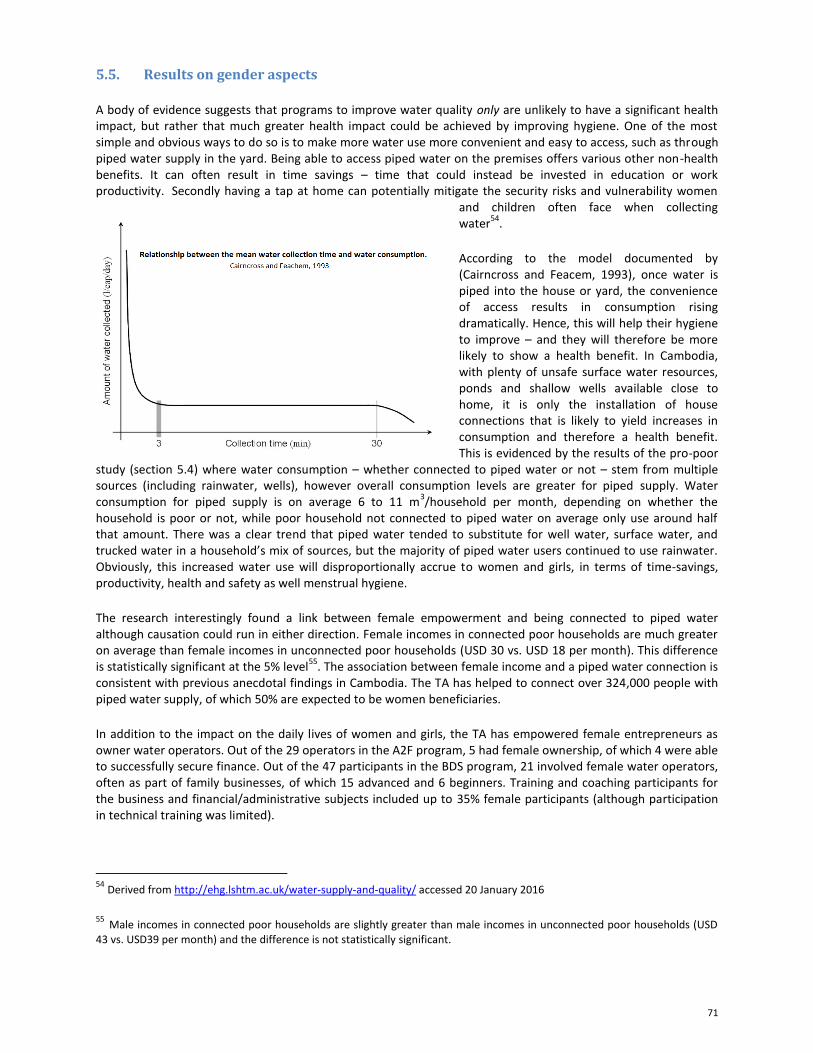
71
5.5. Results on gender aspects
A body of evidence suggests that programs to improve water quality only are unlikely to have a significant health impact, but rather that much greater health impact could be achieved by improving hygiene. One of the most simple and obvious ways to do so is to make more water use more convenient and easy to access, such as through piped water supply in the yard. Being able to access piped water on the premises offers various other non-health benefits. It can often result in time savings – time that could instead be invested in education or work productivity. Secondly having a tap at home can potentially mitigate the security risks and vulnerability women
and children often face when collecting water
54.
According to the model documented by (Cairncross and Feacem, 1993), once water is piped into the house or yard, the convenience of access results in consumption rising dramatically. Hence, this will help their hygiene to improve – and they will therefore be more likely to show a health benefit. In Cambodia, with plenty of unsafe surface water resources, ponds and shallow wells available close to home, it is only the installation of house connections that is likely to yield increases in consumption and therefore a health benefit. This is evidenced by the results of the pro-poor
study (section 5.4) where water consumption – whether connected to piped water or not – stem from multiple sources (including rainwater, wells), however overall consumption levels are greater for piped supply. Water consumption for piped supply is on average 6 to 11 m
3/household per month, depending on whether the
household is poor or not, while poor household not connected to piped water on average only use around half that amount. There was a clear trend that piped water tended to substitute for well water, surface water, and trucked water in a household’s mix of sources, but the majority of piped water users continued to use rainwater. Obviously, this increased water use will disproportionally accrue to women and girls, in terms of time-savings, productivity, health and safety as well menstrual hygiene.
The research interestingly found a link between female empowerment and being connected to piped water although causation could run in either direction. Female incomes in connected poor households are much greater on average than female incomes in unconnected poor households (USD 30 vs. USD 18 per month). This difference is statistically significant at the 5% level
55. The association between female income and a piped water connection is
consistent with previous anecdotal findings in Cambodia. The TA has helped to connect over 324,000 people with piped water supply, of which 50% are expected to be women beneficiaries.
In addition to the impact on the daily lives of women and girls, the TA has empowered female entrepreneurs as owner water operators. Out of the 29 operators in the A2F program, 5 had female ownership, of which 4 were able to successfully secure finance. Out of the 47 participants in the BDS program, 21 involved female water operators, often as part of family businesses, of which 15 advanced and 6 beginners. Training and coaching participants for the business and financial/administrative subjects included up to 35% female participants (although participation in technical training was limited).
54
Derived from http://ehg.lshtm.ac.uk/water-supply-and-quality/ accessed 20 January 2016
55 Male incomes in connected poor households are slightly greater than male incomes in unconnected poor households (USD 43 vs. USD39 per month) and the difference is not statistically significant.
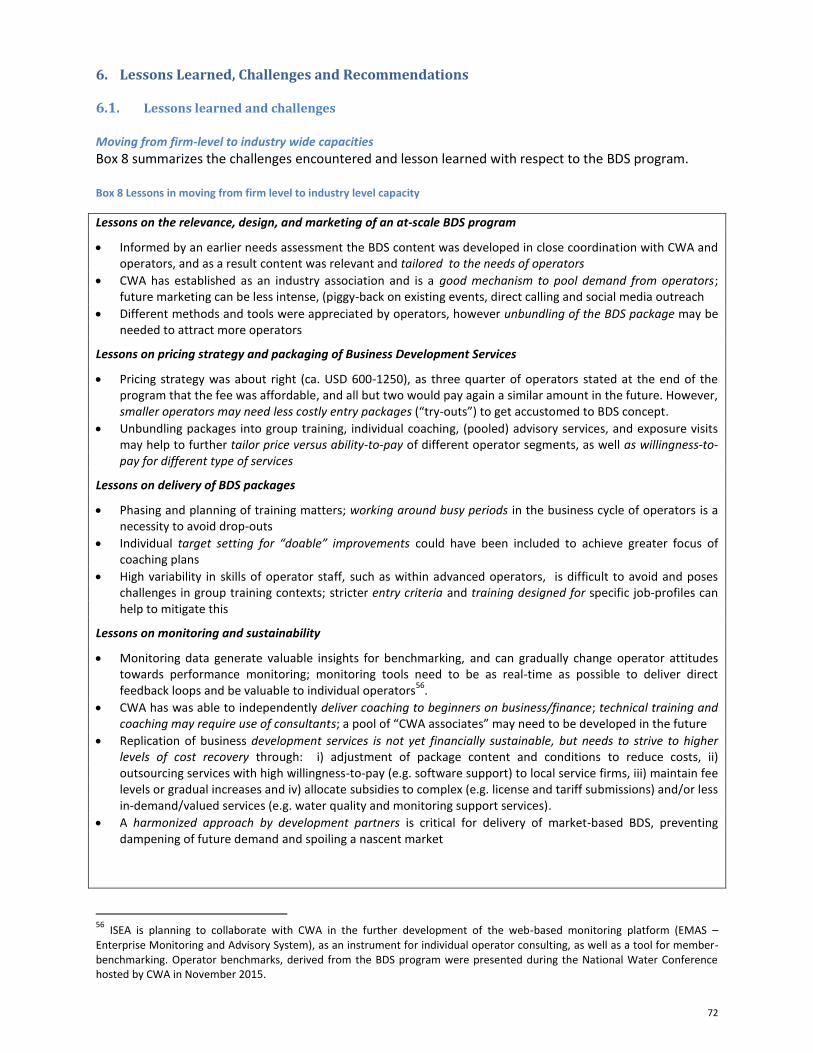
72
6. Lessons Learned, Challenges and Recommendations
6.1. Lessons learned and challenges
Moving from firm-level to industry wide capacities
Box 8 summarizes the challenges encountered and lesson learned with respect to the BDS program. Box 8 Lessons in moving from firm level to industry level capacity
Lessons on the relevance, design, and marketing of an at-scale BDS program
Informed by an earlier needs assessment the BDS content was developed in close coordination with CWA and operators, and as a result content was relevant and tailored to the needs of operators
CWA has established as an industry association and is a good mechanism to pool demand from operators; future marketing can be less intense, (piggy-back on existing events, direct calling and social media outreach
Different methods and tools were appreciated by operators, however unbundling of the BDS package may be needed to attract more operators
Lessons on pricing strategy and packaging of Business Development Services
Pricing strategy was about right (ca. USD 600-1250), as three quarter of operators stated at the end of the program that the fee was affordable, and all but two would pay again a similar amount in the future. However, smaller operators may need less costly entry packages (“try-outs”) to get accustomed to BDS concept.
Unbundling packages into group training, individual coaching, (pooled) advisory services, and exposure visits may help to further tailor price versus ability-to-pay of different operator segments, as well as willingness-to-pay for different type of services
Lessons on delivery of BDS packages
Phasing and planning of training matters; working around busy periods in the business cycle of operators is a necessity to avoid drop-outs
Individual target setting for “doable” improvements could have been included to achieve greater focus of coaching plans
High variability in skills of operator staff, such as within advanced operators, is difficult to avoid and poses challenges in group training contexts; stricter entry criteria and training designed for specific job-profiles can help to mitigate this
Lessons on monitoring and sustainability
Monitoring data generate valuable insights for benchmarking, and can gradually change operator attitudes towards performance monitoring; monitoring tools need to be as real-time as possible to deliver direct feedback loops and be valuable to individual operators
56.
CWA has was able to independently deliver coaching to beginners on business/finance; technical training and coaching may require use of consultants; a pool of “CWA associates” may need to be developed in the future
Replication of business development services is not yet financially sustainable, but needs to strive to higher levels of cost recovery through: i) adjustment of package content and conditions to reduce costs, ii) outsourcing services with high willingness-to-pay (e.g. software support) to local service firms, iii) maintain fee levels or gradual increases and iv) allocate subsidies to complex (e.g. license and tariff submissions) and/or less in-demand/valued services (e.g. water quality and monitoring support services).
A harmonized approach by development partners is critical for delivery of market-based BDS, preventing dampening of future demand and spoiling a nascent market
56
ISEA is planning to collaborate with CWA in the further development of the web-based monitoring platform (EMAS – Enterprise Monitoring and Advisory System), as an instrument for individual operator consulting, as well as a tool for member-benchmarking. Operator benchmarks, derived from the BDS program were presented during the National Water Conference hosted by CWA in November 2015.
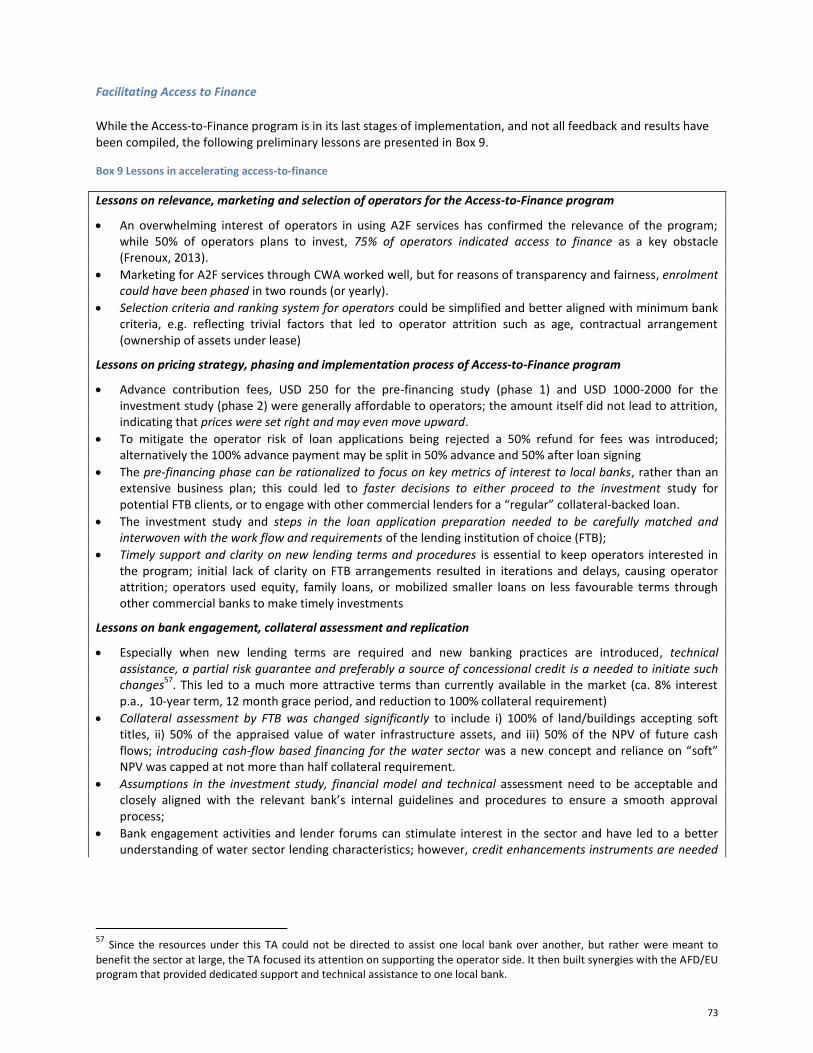
73
Facilitating Access to Finance
While the Access-to-Finance program is in its last stages of implementation, and not all feedback and results have been compiled, the following preliminary lessons are presented in Box 9.
Box 9 Lessons in accelerating access-to-finance
Lessons on relevance, marketing and selection of operators for the Access-to-Finance program
An overwhelming interest of operators in using A2F services has confirmed the relevance of the program; while 50% of operators plans to invest, 75% of operators indicated access to finance as a key obstacle (Frenoux, 2013).
Marketing for A2F services through CWA worked well, but for reasons of transparency and fairness, enrolment could have been phased in two rounds (or yearly).
Selection criteria and ranking system for operators could be simplified and better aligned with minimum bank criteria, e.g. reflecting trivial factors that led to operator attrition such as age, contractual arrangement (ownership of assets under lease)
Lessons on pricing strategy, phasing and implementation process of Access-to-Finance program
Advance contribution fees, USD 250 for the pre-financing study (phase 1) and USD 1000-2000 for the investment study (phase 2) were generally affordable to operators; the amount itself did not lead to attrition, indicating that prices were set right and may even move upward.
To mitigate the operator risk of loan applications being rejected a 50% refund for fees was introduced; alternatively the 100% advance payment may be split in 50% advance and 50% after loan signing
The pre-financing phase can be rationalized to focus on key metrics of interest to local banks, rather than an extensive business plan; this could led to faster decisions to either proceed to the investment study for potential FTB clients, or to engage with other commercial lenders for a “regular” collateral-backed loan.
The investment study and steps in the loan application preparation needed to be carefully matched and interwoven with the work flow and requirements of the lending institution of choice (FTB);
Timely support and clarity on new lending terms and procedures is essential to keep operators interested in the program; initial lack of clarity on FTB arrangements resulted in iterations and delays, causing operator attrition; operators used equity, family loans, or mobilized smaller loans on less favourable terms through other commercial banks to make timely investments
Lessons on bank engagement, collateral assessment and replication
Especially when new lending terms are required and new banking practices are introduced, technical assistance, a partial risk guarantee and preferably a source of concessional credit is a needed to initiate such changes
57. This led to a much more attractive terms than currently available in the market (ca. 8% interest
p.a., 10-year term, 12 month grace period, and reduction to 100% collateral requirement)
Collateral assessment by FTB was changed significantly to include i) 100% of land/buildings accepting soft titles, ii) 50% of the appraised value of water infrastructure assets, and iii) 50% of the NPV of future cash flows; introducing cash-flow based financing for the water sector was a new concept and reliance on “soft” NPV was capped at not more than half collateral requirement.
Assumptions in the investment study, financial model and technical assessment need to be acceptable and closely aligned with the relevant bank’s internal guidelines and procedures to ensure a smooth approval process;
Bank engagement activities and lender forums can stimulate interest in the sector and have led to a better understanding of water sector lending characteristics; however, credit enhancements instruments are needed
57
Since the resources under this TA could not be directed to assist one local bank over another, but rather were meant to
benefit the sector at large, the TA focused its attention on supporting the operator side. It then built synergies with the AFD/EU program that provided dedicated support and technical assistance to one local bank.
74
for other banks to adjust their terms (extend tenure, lower interest rate) and move away from purely collateral-backed lending to project financing approaches (NPV- based collateral)
Enhancing public sector support Box 10 summarizes learning from the interventions that focussed on building more public support and a better environment for private sector provision.
Box 10 Lessons on enhancing public sector support
Lessons on licensing, tariff regulation and pro-poor service delivery
Rather than starting with a comprehensive overhaul of legal and institutional arrangements through a Water Law, a gradual pragmatic approach towards improving the regulatory environment has been instrumental in creating a better enabling environment for private sector water service provision;
Working with multiple stakeholders has allowed the MIH to see the breadth of tools and partners it has to implement regulation; it created understanding of the benefits of formalization among operators; this reflects a growing social contract between the state and private sector
As evidenced by the large amount of new licensing applications, the issuance of the new licensing decree has provided impetus for an increased level of formalization and for attracting future investments, especially by extending the license term to 20 years and allowing a competitive granting process
To comply with new regulations, assistance is needed to help operators prepare adequate license applications and feasibility studies, and to the regulator (MIH-DPWS) in managing the license execution process in a transparent and speedy matter;
Lack of transparency in the execution of the license regulation remains an issue, leaving room for rent-seeking behaviour; scaling-up the competitive granting of licenses, as already successfully piloted in 2015 with support of GRET, may help to mitigate these risks
Although not yet passed, the consultation process around the new tariff regulation has created heightened awareness among operators on i) service obligations – including to the poor - that come with a monopoly right, and ii) the necessity to substantiate tariff submissions with proper data;
Evidence on private sector service delivery to the poor has allowed the inclusion of for pro-poor policies in the tariff regulation, while protecting the business interest of the private sector;
Evidence indicates that using microfinance for water connection could potentially help increase access rate, but ID-poor households may need partial subsidies to pay connection fees or qualify for such microfinance loan
58
Lesson on creating better sector oversight and monitoring
Although challenging, the development process of the monitoring system has successfully engaged high-level and professional staff in all important decisions related to the system; this resulted in ownership and resource-allocation for operational cost
Monitoring framework, functionality, processes and system design have been aligned with available financial and human resources within MIH, DIH as well as the capacities of various users, including water operators;
Involvement of a local software firm from the start of the project has led to sustainable maintenance arrangements after the software is handed over and “goes live” in January 2016.
Building a sustainable sector monitoring system requires top-level support and clear instructions to all levels of users; external assistance post-handover is necessary to ensure sustainable usage and help with sector analytics
Lessons on strengthening a platform for sector dialogue
58
Water.org has carried out additional market research among operators and households which confirmed the potential
market for water connection financing (under publication); results were presented at the national Cambodian Water Conference in November 2015.
75
Strengthening the nascent industry association in executing its various strategic priorities, including its advocacy role, has helped to institutionalize a public-private dialogue between CWA and MIH; the growth and maturation of CWA has helped to prevent the association from being “captured” by other interests
While CWA has seen a positive diversification of its income sources, the association tends to show mission creep in its quest to attract financial resources from partners; focus should be maintained on its evolving strategic priorities, while ensuring that an adequate percentage of its budgets is secured through membership fees (currently only 20%)
6.2. Recommendations going forward
This technical assistance has illustrated that incentives for private water operators to use business development services vary, e.g. i) pressures for compliance with regulation, ii) opportunities to access finance by better business plans, or ii) impacting the bottom line through more efficient business and operational practices and smarter investment decisions. Institutionalizing market-based BDS-programs within CWA as industry association can be a sustainable, scalable and effective alternative to “one-off” project-based capacity building to professionalize small water operators. Building a local market and demand for business development services requires the introduction of a transactional relationships between water operator and local BDS provider(s) gradually striving for cost recovery of fees. A long-term phase-out strategy for subsidies is needed, in which a differentiated approach would be used to allocate subsidies only to less advanced operators and for specific services that remain undervalued.
CWA has played an effective role as matchmaker to pool demand and promote efficient delivery of business development services. This resulted in positive changes in technical, business and financial performance, as well as changed skills, attitudes and operator practices, and as well as appreciation of the added value of BDS. National platforms, such as CWA, can also play an important role in the further professionalization of a fragmented water industry characterized by weak capacities, through i) stimulating professional and pro-poor business practices, ii) raising awareness and dialogue on sector developments, iii) offering support services to help operators comply with new regulations and iv) strengthening network with value chain actors, v) facilitating A2F programs of local banks in collaboration with development partners.
Close alignment with AFD/EU Access-to-Finance program allowed WSP’s modest technical assistance program to leverage commercial financing from local banks, equaling a total of USD 6.0 million
59, as well as USD 0.7 million
60 in
additional equity. This is projected to lead to a 5% increase in access to piped water by 2020, while another group of 20 operators will be supported in the next 2-3 years to access finance with an expected volume of USD 5 million, using a similar processes.
Both professionalization and acceleration of services provision require complementary measures to address the regularity and enabling environment for operators. While the technical assistance has made important gains in this area, further reform and capacity building of MIH to execute the new regulations is paramount. Only with effective implementation of licensing and tariff decrees and related monitoring requirements, will BDS and A2F programs be fully effective. Other than capacity building, this may also require internal reforms within MIH, such as raising the Department of Potable Water Supply to the level of a General Directorate, including the necessary human and financial resources, followed by the establishment of an independent regulatory body in the medium to long term (requires a Water Law to be passed).
Sector transition to inject public finance
The most attractive and viable investment sites are expected to be served over the next few years through equity and debt financing. However, to achieve the Sustainable Development Goals
61, Cambodia will need to transition to
a new era where subsidies are allocated to leverage private sector investments (equity and debt) in less viable new sites, e.g. through grants, concessional loans or domestic public transfers. This transition to serve poorer, more “rural” areas with piped services may also require that debt financing arrangements reflect longer tenures and grace period to reflect the longer recovery times and liquidity constraints in early years of operation from less
59
USD 5.5 million from AFD concessional credit line; and USD 0.5 million through other commercial banks; 60
USD 0.4 million equity from the 20 proposals that will get financed through FTB, and USD 0.3 million from the 9 proposals
that got financed through other commercial banks. 61
Sustainable Development Goals (SDGs) have set a higher bar for service delivery than the MDGs (using “improved water source”). The SDGs require 100% access to safely managed drinking water by 2030, which includes regulated water services at the premise, of reliable and sufficient quantity, and quality.
76
dense urban sites. Such subsidies could be best allocated through a competitive licensing process, based on a longer-term master plan that would identify and prioritize investment sites, using commercial viability gap financing (VGF) and potentially subsidy payments to cover cash deficits in early years of scheme operation. Such process would require strong involvement of the Ministry of Industry and Handicraft and would contribute to higher transparency and better value for money for rural customers.
In the longer term, different business models for private sector involvement may need to be considered through bundling of sites, as well as through other PPP modalities than the existing full privatization under license.
In addition to green field investments and expansions into non-viable areas, “densification” is required, as connection rates in areas under network are 50% for the non-poor and only 20% for poor household
62. Private
water operators may require incentives such as output-based subsidies to close this equity gap, e.g. through a national “Water for all Facility” under stewardship of MIH, as foreseen in the National Strategic Development Plan 2014-2018.
The above sector transition will require a closer harmonization of development partners supporting the sector to arrive at a consistent and transparent policy and procedures for granting such subsidies. Preferably, this would lead in the long-term to harmonized arrangements and potentially a facility that would be able to leverage public funds from multiple sources. It would also require scaled-up access to local commercial finance. The ongoing AFD/EU Access-to-Finance program, which includes local commercial finance and limited amount of grants, as well as the investment project of DFAT, hosted with the Cambodian Development Council, provide opportunities for the government to achieve such transition. Moreover, leveraging grant financing in the medium-term from the World Bank’s Global Partnership for Output-Based Aid (GPOBA), will allow the government to pilot the Viability Gap Financing approach and gain valuable experience that can be replicated at scale through a potential future sector wide approach towards private sector provision.
Recommendations are for medium and long-term are summarized below so as to help improve access to piped water service provision in partnership with the private sector
63.
Recommendations for Ministry of Industry and Handicraft Short to Medium-term:
Build capacity and expand assigned staff and resources of MIH-DPWS to execute its regulatory and monitoring mandate, transforming the Department into a General Directorate for Potable Water Supply;
Continue support to provincial DIHs for monitoring and encourage self-reporting by water operators for compliance; recognize DIHs for timely and complete data entry and develop field verification protocols for gradual improvement of data quality in the Water Services Monitoring System (WSMS)
Analyze and publicize data through WMWS-MIH website through an annual benchmarking exercise, covering increasingly more water operators
Expand the Water Services Monitoring System to include work flow monitoring of licensing and tariff review process, leading to timely execution and increased transparency (and less rent seeking behavior)
Mobilize resources for better water quality testing and act on non-compliance of water providers;
Implement competitive tendering for new license applications and potentially look at clustering of sites to increase economies of scale and viability;
Leverage available grants (e.g. GPOBA, DFAT 3i) for new investment sites to pilot commercial viability gap financing under competitive licensing; develop harmonized policy and procedures for the use of such grants
Implement pro-poor connection policies (pro-poor tariffs, capped connection fees) and set-up a “Water for All” connection facility, as incentives to private operators to connect poor households
Continue dialogue with CWA and foster linkages with well performing public utilities to support BDS provision;
62
In Cambodia poor households are identified through a poor-identification system, which is based on a combination of asset screening and community assessments. The poor (also called ID-poor 1 and ID-poor 2) are given identification cards and herewith can access a number of services for free / at reduced cost. 63
Wider sector recommendations for MIH, have recently been laid out in the Service Delivery Assessment for Water Supply and Sanitation (see WSP (2015)). The above recommendations relate specifically to this TA on private sector involvement
77
Medium to Long-term:
Develop joint accreditation scheme with CWA for consultants to help operators prepare license applications and tariff submissions.
Gradually transition from a full equity approach to introducing public funding (from various sources, including grants, concessional finance, domestic resources) into private water sector provision to reach less-viable and poorer rural areas;
Develop a longer-term master plan for investment sites for private sector, through a market identification, screening and prioritization process; and work pro-actively with development partners to allocate funding
Develop a facility/financing structure to attract pooled financing from various sources/development partners to allocate public finance to new rural potable water schemes
Develop a guarantee-scheme for several local banks, or work with development partners to do so, in order to expand Access-to-Finance on more suitable terms (longer tenure, grace period, collateral)
Develop clear coordination and implementation mechanisms with the Ministry of Rural Development for piped water schemes that may receive finance through MRD
Improve legal and institutional environment through Water Law and prepare comprehensive legal framework for PPPs in water sector, articulating role of decentralized government
Recommendations to Cambodia Water Association
Short to Medium term
Carry out a mid-term review in 2016 to refocus role, key-functions, priorities of the associations, and review its current business model, including a strategy to reduce dependencies on large financiers
Continue to market and deliver break-even BDS-services, including software licensing and support services (ERMS), and potentially group trainings; differentiate and unbundle BDS package to attract more operators
Develop a network of external consultants for specialized services (taxation, legal services, and technical assessments) and market those on a cost recovery basis.
Continue to monitor member performance, gather and provide market information to stakeholders and business partners, and represent members’ interest in regular dialogue with MIH
Continue diversified partnerships with development partners in line with strategic plan. Medium to Long-term
Develop a phase-out strategy for subsidies through further differentiation of services and operator; strategically allocate reduced subsidies to less advanced operators for services that are undervalued
Develop new accredited services for members in collaboration with MIH through accreditation of consultants that can support, e.g. license application development and tariff submission preparation
Develop long-term relationships with local vocational training centers, local universities and MIH, to develop a skill-based training program for different job-positions within water utilities, as well as for utility management positions
Opportunities for further World Bank Group engagement
Opportunities to support the government in the implementation of the above recommendations exist now that the World Bank Group’s Country Engagement Note is being prepared. While detailed scoping will be required, the following ideas offer a way forward for increased World Bank Group engagement:
Collaborate with the Public Private Infrastructure Advisory Facility (PPIAF) and other interested development partners to intensify upstream support and capacity building for MIH in the following areas v) Master planning for potential new licensing sites, based on a mapping, screening and prioritization
process; and support to developing clear procedures for allocation of grants financing vi) Advisory services on tender preparation and project structuring, including investment studies for new
sites (possibly combining multiple sites) vii) Capacity building to MIH-DPWS in executing licensing and application of tariff methodology, and
enforcement of water quality standards
78
viii) Capacity building for consolidation and use of WSMS system, including expansion to allow for license management and support to sector analytics/benchmarking
Collaborate with the Global Partnership for Output-based Aid (GPOBA) and other development partners to leverage grant financing for: iii) Commercial Viability Gap financing to support competitive tendering of new licenses and help to
establish procedures and structure for future scale-up iv) Output-based aid financing to connect poor households under existing schemes
64.
Collaborate with other development partners (such as AFD, IFC) to explore replication of Access to Finance through other local banks and seek opportunities to bring in IFC PPP transaction advisory services
Strategic technical assistance to CWA, especially in areas of: iv) Institutional and organizational capacity development; review strategic operational plan and
business model v) Help define phase-out strategy and further differentiate the approach for BDS so as to better
target remaining subsidies to least advanced operators vi) Support accreditation of local consultants – together with MIH – for BDS to comply with license
and tariff regulation
Longer-term engagement under the Country Partnership Framework is expected to build on the next two-year experience and lessons. Based on an assumed successful demonstration on how to best allocate more public funding into the private water sector, a potential IDA engagement may be foreseen.
64
Use this for demonstration purposes so as to influence other development partner initiatives or future government lending.
79
Annexes
Supplementary documentation to this Synthesis Report is available upon request and categorized in the following annexes
Annex 1 Infographic Tapping the Market Cambodia
Annex 2 Final report and annexes on Business Development Services program
Annex 3 Final report and annexes on Access-to-Finance program
Annex 4 Ministerial decrees on Licensing
Annex 5 Final report and annexes on Economic Regulation
Annex 6 Final report and annexes on Water Management Monitoring System
Annex 7 Strategic Plan CWA 2014-2019
References
ADB. (2012). Cambodia Water and Sanitation Sector Assessment, Strategy and Roadmap. Manilla: Asian Development Bank.
Barbian, D. a. (2013). Market Study on Business Development Services for Domestic Private Sector Providers of Water Services. . Phnom Penh: unpublished, available from Water and Sanitation Program .
Chan. (2010). The enterprise resource management system for water service providers in Cambodia. In IFC Smart Lesson. Washington DC: World bank.
DFAT. (2014). Investing in Infrastructure; Program Design Document Cambodia. Frenoux, C. e. (2013). Cambodia Country Report - Global Study for the Expansion of Domestic Private
Sector Participation in the Water and Sanitation Market – Cambodia . Phnom Penh, Cambodia: unpublished; available upon request from WSP Cambodia.
NIS. (2004). Cambodia Socio-Economic Survey . Phnom Penh: National Institute of Statistics. NIS. (2012/2013). Cambodia Socio-Economic Survey. Phnom Penh: National Institute of Statistics. Royal Government of Cambodia. (2003). National Policy on water Supply and Sanitation. Phnom Penh. Royal Government of Cambodia. (2013). National Strategic Development Plan 2014-2018. Phnom Penh. Royal Government of Cambodia. (2014). National Strategic Plan for Rural Water Supply, Sanitation and
Hygiene 2014-2025. Phnom Penh: Ministry of Rural Development. Sy, J., Warner, R., & Jamieson, J. (2014). Tapping the Markets: Opportunities for domestic investments in
water and sanitation for the poor. The World Bank. Water and Sanitation Program. (2015). Service Delivery Assessment for Water Supply and Sanitation in
Cambodia. Washington: World Bank. Water and Sanitation Program. (2015). Sustainable Services Through Domestic Private Sector Provision.
Annual Report 2014. Washington: World Bank. WHO and UNICEF. (2015). Progress on Sanitation and Drinking Water – 2015 update and MDG
assessment. . Geneva: WHO and UNICEF - Joint Monitoring Program. World Bank. (2013). Cambodia Water and Sanitation Sector Review . Washington DC: World Bank .