Report No. 6981-ZIM Zimbabwe A Strategy for Sustained Growth...
90
Report No. 6981-ZIM Zimbabwe A Strategy forSustained Growth (InTwoVolumes) VolumeII:Annexes November 9,1987 Southern Africa Department Africa Region FOR OFFICIAL USE ONLY Document of theWorldBank This report has a restricted distribution and may beused byrecipients onlyin theperformance of theiroSficial duties. Its contents may not otlierwise bedisclosed withoutWorld Bank authorization. Public Disclosure Authorized Public Disclosure Authorized Public Disclosure Authorized Public Disclosure Authorized
Transcript of Report No. 6981-ZIM Zimbabwe A Strategy for Sustained Growth...

Report No. 6981-ZIM
ZimbabweA Strategy for Sustained Growth(In Two Volumes) Volume II: AnnexesNovember 9,1987
Southern Africa DepartmentAfrica Region
FOR OFFICIAL USE ONLY
Document of the World Bank
This report has a restricted distribution and may be used by recipientsonly in the performance of their oSficial duties. Its contents may not otlierwisebe disclosed without World Bank authorization.
Pub
lic D
iscl
osur
e A
utho
rized
Pub
lic D
iscl
osur
e A
utho
rized
Pub
lic D
iscl
osur
e A
utho
rized
Pub
lic D
iscl
osur
e A
utho
rized

CURRENCY EQUIVALENTS
Annual Averages
1980 US$1.00 = Z$ 0.6431981 US$1.00 = Z$ 0.6891982 US$1.00 = Z$ 0.7571983 US$1.00 = Z$ 1.0111984 US$1.00 = Z$ 1.2441985 US$1.00 = Z$ 1.6141986 US$1.00 = Z$ 1.665
FISCAL YEAP.
The Government operates on a July to June fiscal year.
ABBREVIATIONS AND ACRONYMS
AMA = Agricultural Marketing AuthorityAFC = Agricultural Finance CorporationAZC = Air Zimbabwe CorporationCMB = Cotton Marketing BoardCPI = Consumer Price IndexCSC = Cold Storage CommissionCSO = Central Statistical OfficeCZI = Confederation of Zimbabwe IndustryDMB = Dairy Marketing BoardGMB G Grain Marketing BoardIDC = Industrial Development Corporation
NOCZIM = National Oil Corporation of ZimbabweNRZ = National Railways of ZimbabwePOSB = Post Office Savings BankPTC = Post and Telecommunications AuthorityRBZ = Reserve Bank of ZimbabweUDI = Unilateral Declaration of IndependenceZDB = Zimbabwe Development BankZESA = Zimbabwe Electricity Supply Authority
ZISCO Zimbabwe Iron and Steel CompanyZMDC = Zimbabwe Mining Development Corporation

FOR OMCIuL USE ONLY
ZIMBABWE
COUNTRY ECONOMIC MEMORANDUM
VOLUME II - ANNEXES
Table of Contents
.°age No.
Annex 1 The Labor Market in Zimbabwe: Historical Trendsand Pclicy Analysis 1
A, Overview of the Labor Market 1B. Formal Sector Employment 3
Sectoral Trends 3The Quality of the Formal Sector Labor Force 4
C. Wage Trends and Differentials 5Institutional Background 5Changes in Wages Over Time 6Wage Differentials by Race 8
D. The Non-Formal Sector 8Communal Areas 9The Urban Informal Sector 10
E. Labor Market Interventions 12Minimum Wages 13Policy Towards Wage Differentials 14Wage and Employment Effects of Income Policies 15Job Security Regulation 16Policy Conclusions 18
Annex 2 Prospects for Zimbabwe's Main Commodity Exports 30
Background 30Assumptions Underlying the Export Prospects 31Prospects for the Main Commodity Exports 32
Tobacco 32Cotton Lint 35Sugar 37Beef ZTea 41Coffee 43Gold 46Ferro-Alloys 47Asbestos 49
This document has a restricted distribution and may be used by recipients only in the performanceof their official duties. Its contents Fmay not otherwise be disclosed without World Bank authorization.

- ii -
Page No.
Annex 3 Actual and Projected Finances for the CentralGovernment and Principal Parastatals 54
Table 1 Central Government: Actual and Projected Finances 55Table 2 Central Government: Actual and Projected Finances 56Table 3 Central Government: Wage Bill e7Table 4 Central Government: Education Expenditures 58Table 5 Summary of Operating Position and Overall Deficit of
Parastatals and Local Authorities 59Table 6 Grain Marketing Board: Maize Operations 60Table 7 Grain Marketing Board: Wheat Operations 61Table 8 Grain Marketing Board: Summary of Operations 62Table 9 Cold Storage Commission: Summary of Operations 63Table 10 Dairy Marketing Board: Summary of Operations 64Table 11 Cotton Marketing Board: Summary of Operations 65Table 12 National Railways of Zimbabwe: Summary of Operations 66Table 13 National Oil Company of Zimbabwe: Summary of Operations 67Table 14 Zimbabwe Steel Corporation: Summary of Operations 68Table 15 Electricity Supply Commission: Summary of Operations 69Table 16 Air Zimbabwe Corporation: Summary of Operations 70
Annex 4 Selected Analytical Results 71
1. The Relationship between Inflation, Moneyand the Exchange Rate 72
2. A Note of the Impact of Wage Adjustment upon Foreign ExchangeDepreciation in Zimbabwe 74
3. The Impact of Exchange Rate Changes on Public Finances 774. Statistics on Public Medium and Long-term Debt 79

ANNEX 1Page 1 of 19
The Labor Market in Zimbabwe:Historical Trends and Policy Analysis
A. Overview of the Labor Market.
1. The labor force aged 15 years or more in Zimbabwe was around threemillion persons in mid-1987 out of an estimated total population of ninemillion. Although non-adult labor accounted for more than 3% of the laborforce in the 1970's, workers aged under 15 years have since become much rarerdue to the subsequent expansion of the educational system. The population ispredominantly African (97.5%) with persons of European descent making up aboutfour fifths of the remainder. The European labor force is of disproportionateimportance, however, given ;ts much higher level of training and managerialskills. The female labor force participation rate among those fifteen years ofage and above is quite high at around 50% although the overall participationrate is unremarkable at 35%, as roughly half of the population are of lessthan working age. The female participation rate is higher in rural than inurban areas, (52% and 37% respectively). This is the usual pattern indeveloping countries and relates to the more domestic nature of non-wage turalactivities as compared to formal wage employment.
2. Employment is allocated across three broad areas of the economy:formal wage employment - which subdivides further between commercialagriculture and non-agricultural wage activities; employment in subsistenceagriculture on the communal lands; and a rather undeveloped informal sector.Although Zimbabwe is a predominantly agrarian country with 72% of its laborforce in rural areas, this proportion is lower than in most other sub-SaharanAfrican countries as formal non-agricultural wage activities account for anunusually high proportion of total employment. Sectoral breakdowns ofemployment in 1969 and 1982 are given in Table 1. The formal wage sector wasmarginally the largest in 1982, although its increased share is entirely dueto rapid growth in the first half of the 1970's. The relative importance ofboth commercial and communal agriculture has fallen over the period, while theinformal sector (both rural and urban) has almost tripled in relative size.Formal sector employment as a whole has virtually stagnated since 1982 andthis would indicate that rapid informal sector growth has continued.
3. Historically, the main intersectoral linkage has been via theoutmigration of Africans from the communal areas to the non-agriculturalformal wage sectors, although a minor proportion of labor employed incommercial farms is supplied by seasonal migrants and residents of neighboringcommunal lands. The formal wage sector is a relatively well integrated labormarket, although, as explained further below, demographic pressures and slowwage employment growth are cortributing to a serious and growing unemploymentproblem. The 1982 Population census estimated an open unemployment rate of10.8% for the labor force as a whole, and one of 18.5% when communal farmerswere excluded. A person was here defined as being unemployed if he or she haddone no work but had been looking for work in the previous week. The 1982estimates represent a huge increase in unemployment when compared with the

ANNEX 1- 2 - Page 2 of 19
results of che 1969 census which, under a similar definition of unemrloyment,found that of the African adult labor force, 4.12% of males and 0.4% offemales were unemployed. There is no reason to believe that unemployment hassince fallen and government officials informally estimate the currentunemployment rate at between 15% and 25%.
4. As the census estimates given in Table 2 show, the incidence ofunemployment tended to decline with both age and education, but unemploymentrates were still absolutely quite high at all educational levels. In most lessdeveloped countries, unemployment rates tend to peak at upper primary or lowersecondary levels. This was not the case in Zimbabwe, probably because, unlikeother African countries, primary enrollment rates fell through the 1970'swhile secondary rates stagnated. As will be discussed later, minimum wageswere at a maximum in reaL terms during 1982 and this would have placeduneducated jobseekers at a serious disadvantage relative to those with primaryschooling. Male and female unemployment rates were broadly similar and thisindicates a lack of labor market discrimination in this respect. Theconcentration of unemployment among the younger age groups is a commonphenomenon in both developed and less developed countries and reflects theinitial search period following labor market entry and a greater movementbetween jobs by younger workers.
5. Concern about the considerable relative educational disadvantage ofthe African population has led the government since independence to initiate apolicy of universal education at both primary and secondary levels. This hasbeen strongly reflected in first year secondary enrollments which rose from22,201 in 1980 to 82,262 in 1981, and had reached 153,439 by 1985. The averagelevel of schooling of new labor market entrants has thereby increaseddramatically very recently. For example, whereas 81% of those in the laborforce in 1982 aged 15 to 19 years had only received primary education or less,the majority of new labor market entrants during 1987 will have receivedbetween four and six years of secondary education. One anticipates theeducational expansion to have two effects. The first is that labor marketentry that would have been taking place during the early to mid 1980's hasbeen postponed until roughly 1986 onwards, while the small fall in labor forceparticipation that one would expect to follow secondary educational expansionis likely to be offset by higher female participation related to betteraverage qualifications. The strain of increasing labor supply is thus beingfelt more severely from the present onwards. The second effect that is likelyto occur is that there will be a shift in labor supply towards non-manual jobsin the formal wage sector. Here, any slowness in adjustment arising fromsticky wage differentials or initially inflated job expectations is likely toexacerbate the unemployment situation for some years to come.
6. The broad picture that emerges below is that population growth incommunal areas and in earlier years, African immigration from other countries,resulted in a relatively elastic supply of unskilled African labor to theformal sector. Legal restrictions on urban residency and a lack of governmentintervention to support formal sector wages were not conducive to the growthof an urban informal sector or urban unemployment, Any labor surplus wouldthus have been invisibly concentrated in communal areas. To some limited

-3- ANNEX 1
Page 3 of '9
extent, these conditions have been reversed since independence, which hasassisted the growth of visible unemployment and informal activities in thetowns. The overall African labor surplus in both town and country has beengrowing over the past decade or so, givsen stagnation in formal sectoremployment and rapid labor force growth. Skilled labor is not, however, inexcess supply given the net emigration of skilled Europeans during the UDIperiod and the early years of independence.
B. Formal Sector Employment
7. Sectoral Trends. There were an estimated 1.06 million formal sectorwage employees in June 1985. The coverage of the quarterly wage surveycarried out by the C.S.O. in Zimbabwe is very wide and excludes only wageemployment in small agricultural establishments and casual work in the urbaninformal sector. Temporary and contract workers are included. Thedistribution by sector for 1985 as given in Table 3 shows clearly thatcommercial agriculture is still by far the largest employer, followed bymanufacturing, domestic servants and public administration. Primaryproduction accounts for 30% of employment, industry for 21% and the tertiarysectors for the remaining 49%. The public sector, i.e. public administration,education and health, now employs 19% of all wage employees, while somewherearound a further 5% are employed by parastatals. Over three quarters of allwage employees are therefore employed in privately owned establishments.
8. The overall long-term pattern that one observes between 1955 and1985 is that agriculture and domestic servants have consistently grown moreslowly than total employment; the public services, financial services andother services have consistently grown more quickly; while the growthperformance of other sectors has been rather uneven over different timeperiods. Essentially the long-term employment performance of any given sectorreflects a mixture of different effects including: (i) the natural tendencyfor that sector to rise or fall as a share in GDP as the economy develops;(ii) the rate of labor productivity increase due to technical progress; and(iii) the ease with which non-labor inputs can be substituted for labor asreal product wages rise. Shorter term changes in employment growth overdifferent periods can be further related to the sensitivity of the sector togeneral domestic cyclical fluctuations and to the timing of internal andexternal disturbances. In addition to all of these, policies that affectproduct and factor prices will further influence the sectoral composition ofoutput and the choice of technique within each given sector, while othergovernment policies will directly determine the behavior of employment in thepublic services. The observed sectoral pattern of employment growth inZimbabwe arises from a complicated mixture of all of these effects.
9. Taking overall trends first, the long term decline in agriculture ispartly due to a natural tendency for the share of that sector's output inG.D.P. to fall as development proceeds and to the introduction of newtechnique. Agriculture is also a sector in which factor substitution isrelatively easy so that farmers have adopted less labor intensive techniquesgiven higher wages. Similarly, the growth of financial services, otherservices, wholesale and retail trade, and to some extent transport and

4 ANNEX 1Page 4 of 19
communications, reflects the high income elasticity of demand that is normallyassociated with these sectors. The expansion of public services reflects bothgrowing demand for education and health services and deliberate governmentpolicy. The unevenness of employment growth in mining, reflects changingmarket conditions while that of construction and manufacturing reflects inpart the sensitivity of these sectors to domestic cyclical fluctuations.
10. The decade following UDI in 1965 was essentially one of unusuallyhigh employment growth, generated initially thrcugh import substitutionencouraged by sanctions. This led in turn to a decade of rapid output andexpansion, particularly in manufacturing and in construction. Theintensification of the war of liberation between 1975 and 1979 gave rise,however, to a period of overall employment decline, partly compensated inemployment terms by a rapid expansion in public administration due to armyrecruitment, with direct disruptive effects in the agricultural sector. Moredisturbingly, however, employment growth has continued to be rather slow sinceindependence, in spite of rapid growth in the number of school teachersaccompanying educational expansion. If public sector services are excluded,then total employment actually fell at an average of 0.5% per year between1980 and 1985. The basic pattern has been that employment growth in the twolargest sectors - commercial agriculture and manufacturing - has beendisappointing when compared with the 1965 to 1975 period, public sectoremployment has grown very rapidly, while the private service employmentsectors - wholesale and retail trade, financial services, and transport andcommunication - have expanded at their earlier rates of growth. Together,liowever, these latter sectors only account for 13% of total employment asopposed to the 42% of agriculture and manufacturing. In wage employment termstherefore, Zimbabwe is becoming an increasingly service oriented country witha corresponding decline in the relotive importance of the tradable goodssectors.
11. The Quality of the Formal Se?ctor Labor Force. The majority of thelabor force are unskilled, although, as Table 4 shows, the skill distributionvaries considerably across sectors. The public services and, to a lesserextent, financial services, are the sectors with the highest educationalcontent; the private service sectors have proportionately the most skilled andsemi-skilled white collar staff; mining, manufacturing, and electricity andgas are the most intensive in skilled manual workers, while agriculture andconstruction are the most unskilled activities. There are extreme differencesin the skill distributions between African and non-African wage employees.For example, using data on skill distributions from the 1981 Manpower Surveyand projecting the 1978 CSO estimate forward to 1981 for total numbers ofAfrican and non-African workers, one finds that, including domestic servants,1.7% of African employees were professionals, 6.2% were skilled, 17.8% weresemi-skilled and 74.4% were unskilled; while among non-Africans, thecorresponding percentages were 21.6%, 34.8%, 19.5% and 24% respectively. Thistremendous difference in skill distribution reflects the disadvantagedposition of Africans in terms of access to education and training prior toindependence. This very striking difference in skill levels runs across allthe production sectors with non-Africans occupying a disproportionate numberof posts in those sectors with a high skill content. For example, in 1981,

5 ~~~~~ANNEX I
Page 5 of 19
there were more non-Africans than Africans employed in the financial services,public administration and education sectors. Non-Africans also accounted fora much larger share of formal sector employment (10.1%) than the labor forceas a whole.
12. The emigration of skilled whites has almost certainly led to adecline in the overall quality of the formal sector labor force. Zimbabwefirst became a net emigrant nation in 1976, shortly after the intensificationof the war of liberation. From the beginning of 1980 to the end of 1985almost 99,000 emigrants were officially recorded as opposed to 40,000immigrants. These figures almost certainly understate the true size of netemigration as some residents who stayed away permanently or for a periodexceeding one year (the qualifying period of absence for an emigrant) haddeclared themselves to be leaving for a shorter period. The volume of netmigration declined sharply in 1985 and Zimbabwe became a net immigrant countryagain in 1986. It is noticeable that the number of residents returning fromvisits to other countries also increased by 21% in 1985.
13. The skill loss associated with emigration was proportionately mostsevere with respect to the white collar occupations. For example in 1981,29.3% of economically active emigrants had held professional, technical oradministrative posts as compared with 4.4% in the formal labor force as awhole. Emigration in 1981 alone created a loss in these categories equivalentto as much as 5% of higher level formal sector manpower. In skilled bluecollar occupations the el - were less acute: partly because emigrants wereless relatively concentratea in this group relative to the resident laborforce; and partly because discriminatory attitudes prior to independence hadtended to classify some African workers as semi-skilled who have since provedthemselves to be worthy of a higaer classification. The Government has sinceencouraged this process, both by allowing semi-skilled workers to graduateupwards by passing trade tests and by improving skill levels in the VocationalTraining Centers. The expansion of the skill base has, however, been impededby a falling number of indentured apprenticeships offered by employers.
C. Wage Trends and Differentials
14. Institutional Background. Wages in Zimbabwe have been subject to avarying range of institutional influences over time. These include (i)government appointed wage setting bodies, (ii) minimum wage laws and, (iii)government prescribed limits to wage increases. In the private sector, thewages of a growing proportion of workers have been set either by Boards -government appointed bodies made up of employers and appointed workerrepresentatives, or by Councils - government appointed bodies made up ofemployers and trade union representatives. Boards are bodies created by theGovernment within which trade unions are either absent on insufficientlyorganized, while Councils are the forum for the determination of collectivebargaining agreements. The system of Boards and Councils was established bythe Industrial Conciliation Act (1959) although some Labour Boards had existedbefore that time. The system has continued since Independence, although theirtitles were changed from Industrial Boards and Councils to Employment Boardsand Councils under the Labour Relations Act (1985). Both sets of bodies are

-6- ANNEXtiPage 6 of 19
covered on an industry as opposed to a craft basis, although coverage has notalways been complete. In some induscries there is duplication with both Boardregulations and Council agreements existing in different undertakings. Boardsare not a forum for negotiation and simply recommend wage increases to theGovernment. Collective bargaining agreements are also currently subject togovernment approval. In 1979, 14.7% of formal sector workers were covered byBoards and a further 15.7% received wages set by Council agreements. At thistime, agricultural workers, domestic servants and other private sectoremployees accounting for a further 12% of formal employment remaineduncovered. The Industrial Board for the Agricultural Industry has recommendedregulations for agricultural workers since the beginning of 1980, whilecoverage has since increased throughout the rest of the private sector. Atpresent there are 70 Employment Boards and 20 Employment Councils in operationas opposed to 67 and 21 respectively in 1979. Wages in public administration,education and health are determined by the Public Services Commission.
15. Although European workers in some skills and industries may havebenefited in the past from a reasonably well developed trade unionorganization, the state of African unionization was extremely weak atindependence. This reflected in part the deliberate use of the IndustrialConciliation Act as a means of controlling the registration and activities ofAfrican unions. Some sectors such as agriculture and domestic servants wereentirely non-unionized. It was felt therefore that collective bargainingcould not be relied upon to improve African wages and to reduce the huge gapbetween African and European workers. The Government therefore introduced twofurther policy measures. The first was the setting of a number of nationalminimum wages in 1980 which covered the entire formal sector and which havesince been periodically revised, while the second was to directly constrainwage increases as recommended by Boards or awarded by Councils. All workers,including domestic servants are therefore now covered by a minimum wageregulation, and virtually all workers are subject to a maximum wageincrease. In 1986/7 the annual Review of Wages and Salaries took the degreeof control one step further by imposing stipulated increases according toincome range. Policy since 1980 has thus been consistently one of compressingsalary differentials. Although the minimum wage was used during the early1980s in an attempt to raise unskilled African wages, this role seems to havebeen abandoned in later years. The effects of recent wage policies arereviewed later in this Annex.
16. Changes in Wages Over Time. The overall trends in real consumptionwages are summarized in Table 5 for agriculture and three other salectedsectors. There are three striking features: (i) African real wages grew bymuch less and at a steadier rate in both commercial agriculture and domesticservice thatn in other sectors; (ii) African real wages grew more slowlyduring the boom decade 1965/75 than in the previous decade, while non-Africanreal wage growth reveals an exactly opposite pattern; (iii) African realwage growth did fall further during the slump years of 1975/8, but a much morepronounced drop in the growth rate took place among non-African workers.

ANNEX 1- 7 - Page 7 of 19
17. The broad conclusion that emerges is that Afri n real consumptionwagen are much less cyclical than those of non-Africans.- This would suggestthat nuc only has African labor aupply been growing at a faster rate, but thatit is also more wage elastic. The very low growth rates observed in bothagriculture and domestic service are consistent with the proposition that thesupply price of unskilled African labor has remained virtually constant overtime. This fits in with the presence of a 'labor reserve' in the communalareas and the availability of unskilled labor from Malawi, Mozambique andelsewhere in the earlier periods. The rather high observed growth rates inAfrican wages during the 1955-65 period in manufacturing and construction mayindicate an improvement in the general skills of the African work force inthese sectors, and a growing need in the manufacturing sector for employers tooffset labor turnover and its associated replacement training costs with wagepremia. There is also likely to have been some segmentation in the labormarket between agriculture and mining on the one hand, and the industrialsectors on the other; given the much heavier use of foreign labor inagriculture and mining, and the seasonality of agricultural employment. Thegenerally slower growth in African wages during the decade of 1965-75 may bepartly due to a slightly higher rate of growth in labor supply thanpreviously. However, the much less cyclical pattern in African wages observedover the period 1965 to 1978 as a whole, would also indicate that the Africanlabor supply was more elastic than that of non-Africans. This is furthersupported by a higher observed degree of cyclicality in African employmertbefore 1978.
18. The role of pre-independence institutional wage determination isless clear. Excluding agriculture and domestic servants, a significant andrising proportion of formal sector workers would have been subject to wageregulation from 1959 onwards. African wages would be subject to more controlthan those of Europeans who would have disproportionately enjoyed any benefitsfrom collective bargaining. The institutional explanation for differingcyclical wage behavior would then be that African wages were fixed accordingto a simple inflation formula, while those of non-Africans were less regulatedand fluctuated accordingly. If this were true, then one would have expectedshortages of African labor to appear during the growth period of 1965 to 1975,when wage growth was much less than during the previous decade if institu-tional intervention were holding real African wages below market clearinglevels. There is, however, no evidence of African labor shortage during thisperiod. Similarly, one would have expected institutional intervention to haveheld African wage growth down during the war and the consequent rise ininflation between 1975 and 1980. Yet although African real consumption wagesdid fall slightly during this period, Europeans suffered even greater
1! This conclusion is further supported by the following statistical test,Fitting an autocorrelation corrected regression of the logarithm of the realconsumption wage on a quadratic time trend and a cyclical variable - heremeasured as the deviations of real GDP about its own quadratic trend, onefinds that the coefficient on the cyclicai variable is positive andstatistically significant in most sectors for Europeans. For Africans,however, the cyclical effect is only positive and significant for domesticservants and is negative in most other sectors.

ANNEX 1-8 - Page 8 of 19
decreases in their real wages, thus generating the rather unlikely conclusionthat policy at this time was to help African wage earners relative toEuropeans. There seems to be no reason to suppose that the Industrial Boardsystem did much more than to simply recommend wage rates than would have beenpaid anyway, although the system may have played a role in equalizing Africanwages both within and across different sectors.
19. Wage Differentials by Race. The average non-African/African wagedifferential was very large at Independence. In commercial agriculture, forexample, non-Africans earned 24 times the African wage, while in other sectorsthe ratio was typically closer to the 7.3 observed in manufacturing, but wasas low as 3.5 in financial services. Differentials tended to be largest insector with the lowest skill content and were relatively stable within givensectors over time.
20. To get an idea of to what extent the overall wage differential wasdue to the inferior skill level of the African labor force, theEuropean/African wage ratio is presented for a number of occupational groupsin Table 6. The broad picture is that, excluding financial services, theEuropean/African wage ratio is roughly around one half of the overall ratioand much less than this in agriculture. Of course, even within the definedgroups, African wages may have been less than those of European because ofdisproportionate concentration of Africans within more lowly rated sub-occupations and because Africans were generally less experienced. The ratiosthus overstate any purely discriminatory wage differentials that may haveexisted. A rough idea of the extent of pure wage discrimination may beobtained if one assumes that wages in public adnministration in 1981 were setentirely according to grade and experience, and by then comparingdifferentials in public administration with those in other sectors. Thismethod is inaccurate insofar as skill distributions within observed occupationdiffer across sectors. In general, however, differentials in other sectorsare rather similar to those in public administration with the noticeableexception of skilled and semi-skilled production workers in agriculture. Itseems therefore, that African/non-African wage differentials at independencewere mainly due to the immense skill disadvantage of African workers (much ofthis being due to discrimination with respect to access to training andeducation), as opposed to discriminatory wage differentials existing betweenidentical workers.
D. The Non-Formal Sector.
21. Most of Zimbabwe's labor force is now outside the formal wagesector: either on communal lands, in the non-agricultural informal sector orsimply unemployed. Communal farming is still by far the largest of thesealternatives and employs around 1.4 persons or 40% of the total labor force atthe current time, while non-formal activities taken as a whole employ at least50%. Not only are non-formal activities a major source of labor income, butthey constitute the prime source of unskilled African labor supply to theformal sector and given limits to the rate of growth of the latter, will haveto act as a major source of labor absorption in the future if rapid growth inunemployment is to be avoided.

ANNEX 1- 9 - Page 9 of 19
22. Communal Areas. The communal areas are a combination of theReserves of Southern Rhodesia, that were set aside for exclusive Africaoccupation between 1890 and 1923, and further lands termed Special NativeAreas that have been similarly allocated since then. At independence, it wasestimated that 700,000 peasant households farmed 16.3 million hectares ofcommunal land. The figure now is probably much closer to 800,000. The mainfood crops grown are maize, groundouts, cotton and millets, while extensivecattle and goat rearing is also practised. Although cultivation techniquesutilize hybrid seeds and modern inputs such as fertilizers and pesticides,yields per hectare are generally much lower than in commercial areas. In1980, gross output per hectare orn eommercial farms was roughly four times thatof communal areas. However, in value added terms, the ratio was only 2.4,thus reflecting greater intermediate input use in commercial agriculture.Communal farms are also generally more labor intensive in the sense that laborinput use per hectare is generally higher. Although techniques have beenimproving in communal lands in recent years, there are serious problems ofsoil erosion in cultivated areas and of overgrazing in pdstoral areas.
23. Communal areas have always been a major source of labor supply tothe formal sector. This takes three forms: (i) seasonal migration tocommercial farms during the cotton picking season; (ii) local supply aspermanent wcrkers to commercial farms from adjoining areas, and; (iii) longerterm circular migration to urban and mining areas. Of these (iii) is clearlythe most important and this is shown by the high proportions of households incommunal areas with long term absentee members. Out of twelve regionalstudies carried out between 1977 and 1982, nine estimated that over 50% ofcommunal households had one or more members currently absent an I earningwages, while another two surveys put this fig45e at around 35%.-/ A morerecent survey carried out in 1983 by Bonnevie' in a ward of Morewa-Kabatanadistrict in Mashonaland East found that 47% of village households were headedby a migrant. Equally significantly, 89% of all non-migrant household headshad worked as migrants in the past. This would suggest that almost allhouseholds experience out-migration at the same time or other. The importanceof male migration is further reflected in disproportionate number of femalecommunal farmers - 56.3% according to the 1982 Census. This proportion isunusually high by international standards.
24. The ties between a migrant and his communal household are verystrong. Migrants usually visit their families quite often and remit
21 Evidence surveyed in Zimbabwe Agricultural Sector Study. Annex II, WorldBank. December 1983.
3/ Henriette Bonnevie. The Effects of Migration of Heads of Households.Mimeo. 1987.

ANNEX 1- 10 - Page 10 of 19
substantial sums home. The Zimbabwe National Household Survey (1983/4)4/estimated that over six major provinces, the proportion of communal householdsreceiving remittances varied between a low of 31% in Mashonaland Central to ahigh of 48% in Mashonaland West. There seems to be some question, however, asto the importance of remittances relative to household incomes. Bonnevie's1983 survey put remittances at 52% of household income in the rather limitedareas sampled. In contrast, the World Bank (1983) study reported thatremittances accounted for only 11%, although among those households thatreceive remittances, this proportion is believed to be much higher. It shouldbe noted, however, that these figures understate the contribution thatmigration makes to household income as a whole, in that remittances are likelyto be less than the net gain accruing to migration.
25. Agriculture is not the only activity Jithin communal areas.Manufacturing activities include beer brewing (including chibuku),handicrafts, furniture-making and knitwear, while there is also a growingwholesale and retail trade network. It is also clear that households incommunal areas are often engaged in a number of virtually simultaneousactivities. The National Household Surveys tried to classify personsaccording to whether they had jobs, whether they were working or not in theprevious week, whether or not they were housewives, etc. It is obvious fromthe huge disparity in results from the various surveys, that many individualsfell under more than one heading, so that, for example, a person could have ajob, be looking for work, be a housewife and attending an educationalinstitution all at once. The overlap between school attendance and working orseeking work was particularly obvious and this reflects a high proportion ofyoung people among the economically active.
26. The internal labor market works in a familiar fashion. Essentiallyhouseholds with low endowment ratios of livestock, equipment and land relativeto labor tend to supply themselves to those with higher endowment ratios.Ownership of livestock and e4uipment is very unequal in communal areas. Forexample, the National Household Surveys found that the proportions of house-holds without cattle varied between 39% and 55% over the provinces examined,while only 2 or 3% had equipment su,.h as a tractor, a truck, a car or a waterpump. In spite of this, off-farm wage employment is not a major feature ofcommunal areas, although labor exchange arrangements across households arebelieved to be commonplace. Access to land is, moreover, more evenlydistributed than asset ownership with around 80% of household farming two ormore acres. There is also equal access to grazing land. Relative equality ofland access would tend to limit the need for an internal labor market.
27. The Urban Informal Sector. The general picture is that migrationseems to have increased in relative importance over time with a possible fall-off in more recent years. There may have been two opposing forces in
4/ Zimbabwe National Household Survey Capability Programme. reports onDemographic Socio-Economic Survey, 1983/4. No.'s 1 to 6. C.S.O., Harare,1984.

ANNEX 1- 11 - Page 11 of 19
operation. One would be that increasing population pressure has made thereturns to labor in communal areas less attractive relative to labor incomeselsewhere. There are no data on communal wages, but the rather fragmentaryevidence on real per capita incomes does not suggest any clear trend ovartime. The other force which would dampen migration is the reduction in urbanjob-finding prospects arising from the stagnation of formal wage employmentover the past decade. Bonnevie, for example, draws upon earlier surveys ofMusami ward in Murewa-Kubatana district which indicate that the proportions ofmen aged 15 to 55 years absent due to employment elsewhere went from 24.1% in1948, to 46.4% in 1958 and to 67.4% by 1968. Migration may, however, havedecreased in more recent years, as her own study found only 31% of single menover 17 years of age absent.
28. Much recent analysis of labor markets in developing countries hasfocused upon the duality in urban area between a high wage restricted entryformal sector on the one hand and a market wage, free entry informal sector onthe other. Prospective migrants from rural areas are perceived as viewing theinformal sector as an alternative source of income while searching or queuingfor a formal sector job. Higher formal sector wages or worsening ruralincomes would then have the joint effect of both increasing labor supply tothe formal sector and expanding the numbers in the informal sector at lowerwages. In such analyses, the informal sector is thus seen as an alternativeto open unemployment for those who have not as yet found formal sector jobs.
29. Historically, it is clear that the informal sector did not play thisrole in the Zimbabwe labor markets for two reasons: legislative interventionregarding urban settlement and lack of supportive intervention regardingformal sector wages. Before independence, restrictions on urban residenceprevented Africans ft m working in town unless they had both legal residenceand proof of a job, the more recent restricting statutes being the African(Registration and Identification) Amendment Act and the Vagrancy AmendmentAct, both passed in 1973. The informal sector could not then act as a refugefor migrant job-seekers, while the growth of open urban unemployment wasrestricted by the same regulations. The growth of urban areas thereforedepended largely on non-agricultural formal sector growth, while informalactivities were relatively more common in small African touwnships in communalareas. The other important feature in Zimbabwe was that prior to indepen-dence, there was no direct attempt by government to support African formalsector wages. This lack of institutional wage support would have limited theamount of excess labor supply to the formal sector and the role that theinformal sector would have played may have played in their absorption.
30. The Informal Sector Survey ' of 1983 illustrated the following keyfeatures regarding the informal sector in Zimbabwe: (i) informal sectorparticipants were predominately self-employed and 90% had ownership rights;(ii) informal activities were more heavily concentrated in manufacturing and
5/ N. P. Moyo, R. J. Davies, G.C.Z. Mhone, L. Pakkiri, The Informal Sector inZimbabwe, Dept. of Economics. University of Zimbabwe. February 1984.

ANNEX 1- 12 - Page 12 of 19
repair activities (70%) than in wholesale and retail trade; (iii) mostinformal sector participants appeared to have entered the sector after losinga formal sector job - only 16% gave rural work or rural unemployment as theirprevious occupation, while only 13% had been previous unemployed in an urbanarea; (iv) the average wage of those other than the self-employed was Z$71.5per month which was almost identical to the contemporary wage of domesticservants. The 6 edian wage was, however, substantially lower. A more recentstudy by Horn 6t found that net incomes among market vendors were, afteradjusting for hours worked, about half the minimum industrial wage.
31. The Informal Sector Study seemed to broadly indicate that inZimbabwe, not only does the informal sector have a different activity mix thanin other countries, with less emphasis on trading; but that, as a result ofpast and present regulations, the sector is more concentrated in fixedpremises. The sector was not heavily composed of aspirants to formal sectorjobs with the possible exception of a minority of wage earners. Mostparticipants in the survey indicated that they would not accept formal sectoremployment at Z$300 a month or less.
32. The nature of the urban informal sector may nevertheless have beenchanging over the last four years given a relaxation in some of the earlieturban residency restrictions. It should be pjinted out, however, that someconstraints continue to exist as the Government has generally blocked theestablishment of shanty towns near urban areas, and continues to enforce thevagrancy laws. Current indications are that informal activities are expandingas they absorb rural migrants and are probably becoming a closer substitutefor open unemployment. This process is taking place, however, at the cost ofincreased overcrowding in permanent dwellings and is liable therefore tonatural limitations.
E. Labor Market Interventions
33. 'here are two broad labor market areas in which the Government hasadopted an interventionist approach since independence: the determination ofwages and the provision of worker job security. Essentially the Government isconcerned about the existence of wide wage differentials in the formal sectorand low standards of living among those at the bottom of the wage ladder. Itsobjectives in introducing an incomes policy were to: (i) narrow incomedifferentials; (ii) raise the income levels and standards of living of thoseat the bottom; and (iii) contain inflationary pressures. The incomes policyhas operated through two main instruments: the introduction and subsequentrevision of minimum wages; and direct control or limits upon wage increasesaccording to income level. Initially the main policy objective was that ofgreater equity, although in recent years the other objective of restrictinginflation has also been given explicit emphasis. Fears that minimum wage
6/ Nancy E. Horn. The Informal Fruit and Vegetable Market in GreaterHarare. Working Paper 4186. Dept. of Land Management. University ofZimbabwe. April 1986.

ANNEX 1- 13 - Page 13 of 19
policy would lead to employment reduction led the government to restrictemployers' rights to retrench workers in a series of measures enacted from1980 onwards. Job security regulations thus initially arose as an antidote tothe expected effects of wages policy.
34. Minimum Wages. lhe evolution of minimum wage rates over time isshown in both nominal and real terms in Table 7. Essentially the minimum wagepolicy was at its most aggressive in all sectors at the beginning of 1982 butrates were allowed to fall sharpl. at the revisions of September 1983.Subsequent revisions have pegged real minimum rates in agriculture anddomestic service at a level still substantially above that when minimum rateswere introduced in July 1980, while the real industrial minimum rate has beenkept near to its introductory rate. The path taken by real minimum wages isvery different from that originally envisaged by the Riddell Commission intheir report of June 1981 in which the real industrial minimum was recommendedto rise in gradual stages to Z$115 in 1980 prices by July 1984. It appearsthat the Riddell Commission's recommendations were followed closely up to andincluding January 1982, as the Commission had set a target rate at 1980 pricesof Z$91 for January 1982, which compares closely with the actual rate ofZ$90. Clearly the policy was thrown off course by the economic crisis inZimbabwe which deepened during late 1982.
35, The initial aim of the policy was to raise minimum wages to providean improved living standard for low paid workers as calculated from thepoverty datum line (PDL). Apart from purely humanitarian considerations, theCommission believed that higher wages could actually be in the interests ofemployees given increased productivity, reduced absenteeism, etc. Why suchhigher efficiency wages would not naturallv arise in the unregulated sectorsin the absence of such a policy remained, however, unclear, although it ispossible that Industrial Boards may have previously set unskilled Africanwages according to implicit market clearing criteria rather than according toefficiency wage considerations.
36. The negative effects of an effective minimum wage policy are wellknown: (i) reduced employment within individual production sectors andcorrespondingly increased surplus labor and unemployment; (ii) a potentialdiversion of production from labor intensive to capital intensive sectors,from sectors facing price elastic product demand conditions to sectors facingmore inelastic conditions and, given price controls, from rigidly administeredsectors to sectors with cost-based price regulation such as manufacturing;(iii) a disproportionate fall in employment among young persons.
37. For minimum wage policy to have induced any of the above effects, itwould first have had to influence wages actually paid. This is furtheranalyzed below in the general context of government wages policy. However,young, inexperienced worker constitute the group most likely to be affected byminimum wage legislation. This is particularly worrying in the case ofZimbabwe as open unemployment is most heavily concentrated among young,relatively less educated persons. Indeed, it may be no coincidence that thedisproportionate incidence of unemployment in this group was observed at atime (August 1982) shortly after real minimum wages were &t their peak. More

ANNEX 1- 14 - Page 14 of 19
direct evidence is provided by the declining number of indenturedapprenticeships offered by private industry. Clearly an effective minimumwage makes it less attractive for employers to provide training to youngworkers as there is less room for the worker to pay some of the training costsvia lower wages, and it is less worthwhile for the employer to offer a risingwage scale to workers to induce q lower quit rate. Although the number ofAfrican apprentices indentured has risen from 770 in 1981 to 1009 in 1985, thetotal number indentured has fallen from 2044 to 1197 over the same period.Thus although the racial imbalance in apprentice intake has been correctedsince independence, it may well be that during a period when the Governmentwas trying to expand the stock of trained manpower, its own labor marketpolicies may have been a significant obstacle to achieving this objective.
38. Policy Towards Wage Differentials. Following the publication of theRiddell report, the Government introduced a graduated scale of permitted ratesof wage increase as of January 1, 1982, which allowed larger percentage payraises for those towards the bottom of the wage ladder. Any increase grantedto a given category of employees was also to be granted to those on lowerwages in the ratio of the stipulated maximum increases. The maximum increasespermitted ranged from 23.5% for those earning less than Z$100 per month downto 1% per annum for those earning Z$1666 per month and above. A wage freezewas then in force until September 1983. Further adjustments included a Z$10per month award to those earning Z$300 or less per month in 1983, followingthe removal of food subsidies in the same year; and a further discretionaryaward of up to 10% for those at the bottom of the scale in July 1984. Thewage and salary review of 1985 introduced a new set of permitted maximumincreases ranging fro.m 15% at the bottom to 2% at the top. A more rigidpolicy phase has been applied during 1986/7 in which stipulated increases havebeen imposed. The anti-inflationary aspect of incomes policy has been givenclear emphasis recently, with average pay raises set equal to half theexpected rate of inflation. The Government can of course alter this formulaby suitably changing its inflation forecast. Exceptions are allowed atindividual firm level, but block applications are discouil;ged. Zimbabwe isexpected to adopt a formal incomes policy with an ongoing incomes board in thenear future.
39. Table 8 gives some roughly comparable information on monthly wagesin October of 1982 and 1985 with corresponding annual average wage increasesfor some selected occupations in the private sector and in publicadmini3tration. Although there is some indication of mild salary compressionin the public services, this does not appear to have been the case in theprivate sector. Given that the consumer price index rose at an average rateof 16.1% per year over these years, public service salaries generally declinedin real terms, while of the occupations illustrated, only semi-skilledworkers, technicians and, rather surprisingly, inexperienced clerks enjoyedreal wage advancement. There is no doubt that collective bargainingagreements and the recommendations of Industrial Boards as accepted by theGovernment did impose wage compression by broad grades of workers. Theconclusion must be therefore that in the private sector, firms have grantedless than the maximum increases to non-scarce groups of workers such as theunskilled and copy typists, while regrading workers in scarce supply so as to

ANNEX 1- 15 - Page 15 of 19
avoid the regulations. It may well be therefore, that although the poaicy maynot have done very well in achieving its aims of greater wage equity, it alsodid not contribute greatly to skill shortages in the private sector. Here theevidence is rather thin. However, the vacancy rates as calculated in the 1985Annual Survey of Occupations are only near 10% or above in a few high leveloccupations such as architects, sales managers and veterinary workers. All ofthese are occupations within which the supply of skilled persons would havefallen due to white emigration. The great majority of private sectoroccupation do not seem to be in a shortage situation as indicated by highvacancy rates. The more rigid policy stance taken in the last year or so is,however, believed to have exercised a greater influence upon private sectorwage differentials, but the effects of this are not yet apparent.
40. The effects of recent wages policy upon the public services may,however, have been more serious. Private/public pay differentials now seem toexist from typists upwards and to widen as one moves up the skill ladder.There are two worrying implicatiot.s of this. One is that the quality of thepublic service workforce may be impaired. Here warning might be served by thepoor state of the civil services in other African countries that have alreadytrodden further down the path of real public service pay reductions.Fortunately, Zimbabwe is still a long way from this position. The otherproblem is that shortages of certain key skills are sure to develop. This isalready clearly evident with respect to some occupations such as computerprogrammers, and was reflected in significant 1985 vacancy rates amonglegislative officers (13X) and government executive officers (10%).
41. Wage and Employment Effects of Incomes Policies. To examine the neteffects of different wage policies, average wage rates for the years 1980 to1985 were compared with those as predicted from earlier real wage behaviorduring the years 1955 to 1979. The impact of minimum wages should be seenmost clearly in sectors with the highest unskilled labor content during theyears 1981 and 1982 when minimum rates were at their relative peak. Theeffects of wage restraint and salary compression should, however, show up inlater years, particularly in the more highly skilled sectors.
42. This basic pattern is confirmed rather strongly in the results givenin Table 9. In almost all sectors, wages were highest relative to predictedlevels in 1981 and 1982, but fell from 1983 onwards. In sectors with thelowest skill content such as agriculture and domestic service, the minimumwage effect was particularly strong in 1982 and the minimum rate may still beeffective in agriculture at the present time. The fact that the wages ofdomestic servants were below predicted levels in 1984 and 1985 may indicatethat wage restraint is now the controlling factor in this sector. Incontrast, as one would expect, the minimum wage appear to have no discernibleeffect upon the average wage in the high level manpower intensive financialservices sector. Here salary compression and pay restraint have dominatedfrom 1982 onwards.
43. In other sectors, one observes a mixture of policy effects. Minimumwage effects in construction appear to have been negligible even in 1982.However, average wage rates in construction are highly pro-cyclical and would

ANNEX 1-16 - Page 16 of 19
normally have risen relative to those other sectors during the 1981/2 boom,thus reducing the potential impact of an all-industry minimum wage rate. Inmining, manufacturing, wholesale and retail, and transport and communication,minimum wage effects seem to have dominated through 1982 while other policieshave become more important since. The net effect of the two sets of policieswas to increase the average formal sector wage by 17% in 1982, although atpresent government policies have a wage restraining effect.
44. Some indication of employment effects that minimum wage legislationmight have had, can be inferred from some of the results presented in Table10. In agriculture, the elasticity of employment with respect to the realproduct wage is estimated at -0.44. Assuming given output and intermediateinput prices in this sector would then suggest that a 40% increase inagricultural wages due to minimum wage legislation would in turn lead to an18% fall in agricultural employment. The results also suggest that thisreduction would be spread over several years. This result is broadlyconsistent with the actual behavior of agricultural employment in that thenumber of workers employed in the sector fell by 20% between 1980 and 1983.In other sectors there seems to be little reason to believe that minimum wagelegislation had much overall effect either, because there is no reason tobelieve that average wages were increased, or because, as in the case ofmanufacturing, the wage elasticity was near zero. In the formal sector as awhole, the maximum wage raising effect of 17% only translates into anemployment reduction of around 4%, given a real product wage elasticity of -0.46 and assuming that one half of nominal wage increases would be passed onin higher product prices.
45. Job Security Regulation. From 1980 onwards, the Government hasintroduced regulations to restrict the layL_g off and firing of workers. Themotivation here has been the preservation of as high an employment level aspossible, particularly in view of the potential employment reducingconsequences of minimum wages. The key questions are therefore whether or notthese restrictions are likely to meet this objective and whether otherundesirable side effects are likely to be incurred.
46. In general there are three aspects of job security regulation: (i)the period of notice required; (ii) the formula by which compensation fornon-disciplinary dismissal is determined; and (iii) government permissionrequirements. The essential feature of the regulations in Zimbabwe is thatthey revolve almost entirely around the need to obtain government approval.The period of notice is between one day and one month depending on the payinterval and the length of service, while the only legislated compensation ispay for the period of notice for immediate non-disciplinary dismissal. Byinternational standards these last conditions are hardly severe. For example,in Sudan, legal compensation is six months pay plus tine month's paid notice;while in India, compensation is fifteen days pay for each year of service. Itshould be noted, however, that more generous compensation and longer periodsof notice may be recommended by Employment Boards or arise from collectivebargaining in Employment Councils.

ANNEX 1- 17 - Page 17 of 19
47. The requirement that employers require government permission priorto laying-off or retrenching employees first appeared under the Employment Actof 1980 and has since been clarified and extended in three further statutoryinstruments which appeared in 1981, 1982 and 1985. The essentialmodifications introduced in these later instruments have largely served tolist acceptable reasons for disciplinary dismissal, to define penalties forunapproved, wrongful dismissals - currently reinstatement with back pay forthe employee and a fine not exceeding Z$2000 and/or up to twelve monthssimprisonment for the employer; and to regularly reaffirm the permissionrequirement. The regulations apply to every undertaking, industry, trade oroccupation except officers of parliament, unpaid work for a charitableinstitution and university students undertaking required employment as part oftheir curricula. Fixed term contract workers are also fully covered prior tothe expiration of their contracts. Permission is not, however, required ifboth parties agree in writing to the termination of employment.
48. Applications to lay off, retrench and to put workers on short-termworking are dealt with by the Retrenchments Committee in the Ministry ofLabor. After hearing evidence from the parties concerned including worker ortrade union representatives, the Committee makes its recommendations to theMinister. The indications are that applications for retrenchments are rarelygranted, although the Committee may recommend interim measures such as short-term working and temporary unpaid leave. The procedure cdn therefore be alengthy one and some applications may be considered over a period as long asone year.
49. Apart from any short-term employment preservation effects, thejustification for government intervention would be that in the absence of suchregulations, contracts voluntarily struck between workers and employers wouldimply excessive employment instability. Essentially the argument is that inan optimal contract, risk averse workers would voluntarily accept lower wagesin return for guaranteed employment in a time of recession. In practice,however, workers may not be willing to accept such contracts for fear thatsome employees will break their word when downturns actually occur.Imposition of additional job security by government could then be seen as acorrection for a labor market imperfection arising from non-enforceability ofcontracts. Two of the preconditions of this argument do not, however, applyin Zimbabwe. Labour contracts are enforceable through appeals to the relevantEmployment Board or Council while there is also a well developed legalsystem. Concern about non-enforceability could then be averted through somereinforcement of these institutions. The other point is that the system ofadministered wages and, in particular, that of minimum wages, may preventemployers from offsetting the expected costs of retaining an excessiveworkforce in times of recession by offering lower average wages over the cycleas a whole. A more aggressive minimum wage policy would thus increase thecosts imposed on employers by job security legislation.
50. The effects of job security regulations are twofold: to raise theimplicit cost of labor input and to retard adjustments in the labor force.Diminished labor productivity is likely to result from inability to dismissless productive workers and from increased labor shirking. In addition,

ANNEX 1- 18 - Page 18 of 19
however, firms face the increased costs of either paying excess labor duringperiods of contraction in labor demand, or of paying workers to volunEarilyquit or retire. This last practice seems to be commonplace throughout theformal wage sector with typical compensation running at around eight monthspay.
51. Employers will, of course, try to substitute temporary for permanentworkers. However, this process is likely to be limited for two reasons.Firstly, casual labor has to be paid at twice the legal minimum rate andcannot be used for more than six weeks in any three month period, whilecontractors are subject to the same job security legislation as everyone elseand their use seems therefore to be rather limited. Secondly, temporary laboris generally likely to be of inferior quality to permanent staff, which, giventhe same or higher wage rates, increases the current cost per unit laborinput. The only direct evidence available on this is drawn from commercialagriculture, within which 73% of all employees held permanent status in 1980as compared with 70% in 1984. The combination of minimum wages and imposedjob security legislation appears then to have had only a limited substitutioneffect of permanent for temporary employees in this sector.
52. The longer term effects of a continued imposition of the governmentpermission requirement are likely to be that: given higher expected employmentcosts, firms will adopt more capital intensive techniques; they will adjusthours worked subject to cost and institutional constraints over the cyclerather than employment; and they will become less responsive to improvedmarket conditions such as an increase in export demand. Two adverse macro-economic consequences would then follow. The overall growth in labor demandwill be more limited than otherwise and this will be especially serious inview of Zimbabwe's current and projected unemployment problem; while on theproduct market side, the ability of the formal sector to structually adjust tointernal and external conditions will be impeded.
53. Policy Conclusions. A major focus of government policy has been toreduce the striking wage differentials that existed at independence. One ofthe motivations here was to improve the severely disadvantaged position oftheAfrican population. However, not only has tha deliberate policy of compres-sing wage differentials by government decree had apparently limited success inthe private sector, but it has widened private/public sector wage differ-entials, particularly at higher levels. Given that further applications ofthis approach might exacerbate existing shortages of high level manpower andreduce the efficiency of the public services, the policy should now be dis-continued. Furthermore, as the major source of African wage disadvantage isthe much lower skill levels of this section of the population, the govern-ment's other strategy of expanding and freeing access to education andtraining seems entirely appropriate. The expansion of technical education andvocational training should, however, be governed by market criteria.
54. Caution is needed in setting future minimum wage levels particularlywith respect to the agricultural sector. The Government should consider theintroduction of a lower minimum rate for younger workers aged less thaneighteen years. This would seem particularly appropriate given dispropor-

ANNEX 1- 19 - Page 19 of 19
tionately high unemployment rates among young, less educated persons andrecent reductions in the number of apprenticesnips offered by employers. Thelower minimum rate should continue to apply to apprentices until the end ofthe indenture period.
55. The government permission requirement prior to retrenching or layingoff workers produces bureaucratic delays and costs, and imposes uncertaintyupon employers. If the Government is determined to maintain job securitylaws, then it would be preferable to introduce a legal compensation formulabased upon years of completed service. This would both serve an equityobjective in that longer serving workers would be more fully protected, whilefirms would find it less costly to dismiss relatively inefficient employees.

ANNEX 1- 20 - Table I
Employment by Broad Sector:1969 and 1982
1969 1982%
Formal wage employment 44.6 47.2of which:
Commercial Agriculture 16.1 12.4Non-Agriculture 27.8 34.8
Small Scale Farms 0.7 0.7
Communal Farmers 53.4 46.9
Informal 2.1 5.9
100 100
Total No. (000's) 1604.7 2215.9
Sources: Census of Population 1969. C.S.O., Harare 1976.Main Demographic Features of the Population of Zimbabwe: An
Advance Report Based on a Ten Percent Sample. C.S.0., Harare 1985.Quarterly Digest of Statistics, C.S.O., Harare June 1986.
Note: (i) Employment here refers only to persons 15 years or above. In1969, younger workers accounted for 4.3% of the total labor force.This figure should have fallen considerably during the 1980s.
(ii) Small scale farms are African owned. These are usually treatedseparately from commercial agriculture.

21 - ~~~~~ANNEX[ I- 21 - Table 2
Unemployment Rates by Age, Sex an Education in August 1982
All No Primary SecondaryEducation Education Education
Males 15-19 12.9 23.4 12.9 9.520-24 15.9 18.4 17.5 10.7Total 10.9 11.6 11.7 7.0
Females 15-19 17.0 22.7 16.9 13.220.24 15.8 13.7 17.0 13.4Total 10.7 8.8 11.6 105
Persons 15-19 15.0 22.9 14.9 11.120-24 15.8 15.7 17.3 11.6Total 10.8 10.3 11.6 8.1
Total No. 268,100 54,640 183,340 30,120
Source: Main Demographic Features of the Population of Zimbabwe: An AdvanceReport Based on a Ten Percent Sample. C.S.O., Harare, June 1985.

ANNEX 1- 22 - Table 3
Distribution and Growth Rates of Wage Employment by Sector
1985 1955-65 1965-75 1975-80 1980-85
Agriculture, Forestry, etc. 0.26 0.6 2.1 -2.1 -3.3Mining and Quarrying 0.05 -2.9 5.7 2.9 -4.0Manufacturing 0.16 1.4 6.6 0.4 1.4Electricity, Gas, etc. 0.01 -0.1 3.4 -0.6 3.0Construction 0.04 -5.7 8.0 -7.3 1.6Wholesale and Retail 0.07 1.6 2.4 -1.9 2.3Financial Services 0.01 7.1 4.3 0.7 4.3Transport and Communication 0.05 1.6 2.5 0.1 5.1Public Administration 0.09 3.6 4.9 7.5 5.1Education 0.08 5.9 2.1 3.0 15.1Health 0.02 6.3 3.9 2.4 5.3Domestic Servants 0.09 1.8 2.7 -2.8 -1.9Other Services 0.06 4.4 5.3 0.4 6.0
Total 1.0 1.3 3.4 -0.8 1.0
Sources: Quarterly Digest o.f Statistics: June 1986Monthly Digest of Statistics, June 1965 and 1965Data for 1985 supplied by C.S.0., Harare.
Note: The armed services are shown under public administration.

- 23 - ~~~~ANNEX 1- 23 - Table 4
Percentage Skill Distribution by Sector (1981)
Professional Skilled Semi-Skilled Unskilled
Agriculture, Forestry, etc. 1 5 13 81Mining & Quarrying 3 12 26 59Manufacturing 4 13 26 57Electricity 5 15 31 49Construction 2 17 11 71Wholesale & Retail 7 16 31 45Financial Services 17 16 39 38Transpcrt & Communication 7 16 39 38Public Administration 12 11 25 52Education 53 33 4 10Health 34 6 22 38Other Services
Total 8 12 20 60
Source: National Manpower Survey 1981. Ministry of Manpower, Planning andDevelopment.
Notes: (1) Domestic Servants are omitted(2) A slightly different industrial classification was used from thatgiven in the annual employment survey.'Other services' is incomparable with Table 4,(3) Professional - occupations for which a tertiary levelqualification or equivalent experience is required.
Skilled - as designated under National Industrial Councilagreements and includes all artisans, skilled manual workers, etc.(Clerical and sales workers with diplomas or doing jobs requiringsecondary qualifications are also included.
Semi-skilled - also as designated under National IndustrialCouncil agreements and includes all assistants and a wide range ofoperators who have accumulated experience on the job.
Unskilled - no experience or training required.

- 24 - ~~~~ANNEX 1- 24 - Table 5
Average Annual Percentage Increase in RealConsumption Wage by Sector
1955-65 1965-75 1975-78 1980-85
AgricultureAfrican 0.3 0.7Non-African 1.9 1.5Total 0.8 0.9 - 8.7
MiningAfrican 2.4 1.9 1.2Non-African 0.9 3.5 -0.5Total 1.8 2.7 0.3 1.7
ManufacturingAfrican 7.2 2.1 -0.1Non-African 0.8 3.8 -3.4Total 3.5 3.1 -2.0 -0.4
ConstructionAfrican 5.7 3.2 -0.3Non-African 1.7 3.8 -4.2Total 3.3 3.6 -2.6 -0.8
Domestic ServantsAfrican 1.1 0.5 -0.2
All employeesAfrican 5.3 2.9Non-African 0.6 3.1Total 2.5 3.0 - -0.6
Source: Calculated from employment, earnings, low income CPI and high incomeCPI data available from various issues of the Quarterly Digest of Statisticsand the Monthly Digest of Statistics.
Notes: (1) Data on African and non-African employees are only availableseparately up to 1978.
(2) African earnings were calculated at 1980 constant prices usingthe low income CPI, while the high income CPI combined earnings were deflatedby a weighted average of the two price indices.

ANNEX 1- 25 - Table 6
European/African Wage Differentials
Professional Clerical Skilled Semi-skilled Overall& Technical (males) Produc. Production (Persons)(males 1981 1981 (males) (males 1981) 1978
Agriculture 3.7 4.8 8.5 8.2 24.5Manufacturing 2.3 3.1 3.9 4.O 7.3Financial Services 2.3 1.7 3.5 - 3.5Public Administration 2.3 2.3 3.1 3.4 7.0All Sectors 2.7 2.8 4.2 3.9 10.4
Sources: Monthly Digest of Statistics. January 1979.National Manpower Summary 1981. Vol. III
Notes: The National Manpower Survey defined three broad groups:professional, skilled and semi-skilled. Each group was then further brokendown by the standard ISCO classification. The groups above are: professional- professional and technical, skilled-clerical, skilled-production workers andsemi-skilled production workers.

- 26 - ANNEX 1Table 7
Minimum Wage Rates (1980-1986)(Z$ per month)
Agriculture Industrialand Domestic and Mining
current 1980 current 1980prices prices prices prices
July 1, 1980 30 30 70 71
Jan. 1, 1981 30 29 85 83
Jan. 1, 1982 50 43 i05 90
Sept. 1, 1983 55 32 115 68
July 1, 1984 65 35 125 68
July 1, 1985 75 33 143 73
July 1, 1986 85 37 158 68
Notes: (1) Agriculture and Domestic Servants minimum wage is here given asthe minimum cash wage. Additional rates specifying minimum total wage rateswere: Jan. 1, 1982 -m Z$62 for domestics; September 1, 1983 - Z$67 fordomestics and Z$65 for agricultural workers.
(2) Industrial and Mining rates are inclusive of all benefits.Separate minimum rates for cash wages in mining were also set in 1980.Industrial rates apply to all wages paid outside agriculture other thandomestic servants.

-27- ANNEX 1~~~ ~~~ ~Table 8
Monthly Wages and their Rates of Change(1982-85)
(Z$)
Private Sector Public Sector1982 1985 X Change 1982 1985 %Change
Unskilleda 129 175 10.7 119 181 15
Copy typistb 385 533 11.5 280 361 8.8
ClerkC (no experiece) 266 493 22.8 217 309 12.5
Semi-skilledd (Grade 1) 152- 248 17.7
Semi-skilledd (Grade 4) 267 411 15.5
Boilerman/Platerd 973 1184 4.3
Techniciane(Diploma - 3 yrs. exper.) 841 1606 24.1 450 537 6.1
Graduatea 582 837 12.9 536 640 6.1
Deputy Secretaryf 1919 2595 10.1
Sources: Zimbabwe National Salary Survey. General Staff. PE ConsultingGroup 1983 and 1986. Public Service data kindly supplied biy thePublic Service Commission, Harare.
Footnotes:(1) a - starting salaries.
b - average for lowest grade in private sector; threeyears experience in public service.
c - average for lowest grade in private sector; startingsalary in public service.
d - average for grade.e - 3 years experience both sectors.f - fixed salary 1982, center point of short scale in 1985.
(2) Wages and salaries are as of October 1, 1982 and 1985.(3) Private sector wages include estimated average bonus -
typically 8 to 10%. Fringe benefits are unimportant in thepublic services.

ANNEX 1-28 - Table 9
Percentage Difference between Actual and PredictedAverage Wage Rates t1980-85)
1980 1981 1982 1983 1984 1985
Agriculture 0 38 42 31 18 -
Mining 10 23 27 13 8 3
Manufacturing 10 18 19 13 8 7
Construction 0 1 5 1 -4 -13
Wholesale & Retail 8 15 15 7 -2 0
Financial Services 2 -4 -10 -19 -26 -30
Transportation and Communication 14 17 17 2 -7 -6
Domestic Servants 11 13 26 9 -8 -12
All Sectors 9 14 17 4 -5 -
Notes: Predicted wage is average annual wage as forecast from an
autocorrelation corrected regression of the form:
log (W/p) 5 a + at + a2t2 + a CYCt o 1 2 3 t
where w/p - real annual consumption waget - time trend
CYCt - deviations of logarithm of GDP at constant pricesabout its own quadratic trend
For further details see text.

-29 - ANNEX 1Table 10
Estimated Real Product Wage and Output Elasticitiesof Labor Demand by Sector
Real Output CoefficientProduct Elasticity of Lagged
Wage Elasticity Dependent Variable
Agriculture -0.44 - 0.55
Mining - --
Manufacturing - 0.81 0.38
Electricity, Gas, etc. -0.57 0.79 0.84
Construction -0.37 0.68 0.40
Wholesale & Retail - 0.37 0.46
Financial Services -0.66 0.79 0.36
Transport and Communication - 0.82 0.84
Other Services -0.14 0.93 -
All non-government -0.46 0.72 0.56
Footnotes:(1) Estimated from a log-linear regression of the form:
log L a, a2log Wit /Pit a2g Qit a3t + aogLit
where L.t - employment, W. - annual money wage, P. - value addeddeflator, Q. - real value laded, and i and t denote thi ith sector and time
itrespectively. Estimation in sectors other than agriculture was byautocorrelation corrected ordinary least squares under assumptions of pre-determined or intermediate input restrained output. In agriculture both thewage and output were treated as endogenous and estimation was byautocorrelation corrected two stage least squares. The time trend and laggeddependent variable were omitted if insignificant. Coefficients are notpresented where insignificant.
(2) The coefficient of the lagged dependent variable may be interpreted asthe proportion of total desired employment adjustment not completed in oneperiod.
(3) Due to lack of sectoral value added deflators, the equations were onlyestimated for the years 1969 to 1985.

- 30 -ANNEX 2Page 1 of 24
Prospects for Zimbabwe's Main Commodity Exports
Background
1. Following a period of fairly good export performance between 1970and 1975, when export volume increased by 5.7 percent per annum, Zimbabwe'slong-term export growth has been poor. Domestic exports, (excluding goldexports), declined by 2.8 percent per annum on average between 1975 and1980, and recovered somewhat increasing by 0.6 percent annually between1980 and 1985; the 1975-85 decade taken as a whole, saw domestic exportsfall at an average annual rate of 1.1 percent in real terms. This weaknessin export growth was spread over all three major export sectors,agriculture, mining and manufacturing with real export growths of 1.8percent, -5.3 percent (excluding gold exports) and -0.4 percent per annumon average respectively over this period. There was, however, markedvariability between individual products and at a subsector level inmanufacturing. There have also been sharp variations from year to year.Adverse weather conditions influenced agricultural exports, inadequateavailability of imported raw materials and intermediate goods affectedexport volume in manufacturing, and weak international prices contributedto negative growth in mineral exports. Historical growth rates and sharesof the world market for selected products are given in Tables 2 and 3 atthe end of this Annex.
2. Underlying these sector-specific factors was a depressed worldmarket for almost all of Zimbabwe's major exports with weak prices andsluggish demand. Record-low real prices for non-fuel primary commoditieswas clearly in evidence in 1985, when all commodity groups were adverselyaffected. The World Bank index for the 33 non-fuel commodities exhibited asharp fall of 12 percent in 1985 reaching its lowest level in eight years.In recent years, short-term movements in commodity prices have beenincreasingly influenced by changes in monetary and financial conditionswith exchange rates and interest rates coming to play an important role.Large variations in these rates and the relative inelasticity of demand andsupply of export commodities in the short term have led to large pricemovements.
3. In Zimbabwe, additional critical factors led to a sharp reductionin export competitiveness. Prior to 1982, these included a realappreciation of the exchange rate of 20 percent, domestic inflation ofabout 14 percent, and high wage and power costs. The Government rapidlydevalued its currency, but this difficult situation continued even after1982, when commodity prices for many of Zimbabwe's exports weakened.Between 1983 and 1985, significant cuts in foreign exchange allocations

ANNEX 2- 31 - Page 1 of 24
took place, that reduced the export competitiveness of some mining andagricultural exports, although manufacturing exports have adequate foreignexchange from the Export Revolving Fund. More recently, however, the realdepreciation of the exchange rate-especially against the OECDcountries--has contributed to some recovery in export competitiveness.Yet, imports remain constrained and debt servicing as a percent of exportearnings, high; the latter averaging 31 percent over the period 1983-86.
Assumptions Underlying the Export Prospects
4. Before discussing the individual commodity export prospects forZimbabwe, which is done in the next section, it is useful to review theglobal assumptions under which these are likely over the short to mediumterm, Broadly, a relatively stable world economy is assumed through theyear 1995, with continued moderate growth for the industrially developedcountries, low inflation in terms of local currencies, and little increasein real dollar interest rates. Specific growth rates describing this mostlikely scenario are given in Table 1.
Table 1: Projected Growth Rates Underlyng Commodity Price Prospects
1987 1987-90 1990-1995
Real GDP growth a/ 2.0 3.4 3.4MUV Index for UK LDCs b/ 5.8 3.5 1.2MUV Index using LDC Weights for Zimbabwe c/ -6.1 4.8 0.7US Short-term Interest Rate d/ 8.2 8.5 7.0US Real Interest Rate e/ 3.5 3.5 3.0Price Index all Commodities f/ -3.8 4.9 3.9Price Index Agriculture -10.0 5.8 3.8Price Index Metals and Minerals 7.7 3.3 4.8Prict Index Petroleum 25.2 3.7 5.6
a! Weighted average for France, Germany, Japan, UK and USA.b/ Using LDC weights.c/ Using weights based on Zimbabwe's trading pattern.dt/ Six-month LIBOR.e/ US short-term interest rate, as an index, deflated by the index of
change of the US GNP deflator.f/ Excluding energy.
Source: Macro and Financial Assumptions and Half-Yearly Revision ofCommodity Price Forecasts, February 5, 1987.

ANNEX 2- 32 - Page 3 of 24
5. Crucial to reducing Zimbabwe's dependence on traditional primaryexports in agriculture and mining, and to increasing the overallcompetitiveness of existing and potential exports as the world economyslowly recovers from depressed demand antd prices, would be the process oftrade liberalization and real exchange rate depreciation, appropriatelysupported by macroeconomic policies, discussed in the text of the reporteThis would be instrumental in providing the needed incentives torestructure the economy and prepare it for higher and sustained economicgrowth. Maintaining a competitive exchange rate and gradually freeing theeconomy from price controls and formal foreign exchange allocations wouldgreatly assist in restoring competitiveness and profitability of Zimbabwe'sexports. Close monitoring of monetary policy, inflation, wage policy, andtransportation costs and arrangements, would be critical to an efficientcost structure underlying production, particularly export-orientedproduction. In addition, appropriate sector policies to overcome specificobstacles in each of the three sectors, agriculture, mining andmanufacturing would also be essential if each sector's full potential is tobe tapped. Any recovery in export growth would, therefore, hinge on therestoration of competitiveness of Zimbabwe's exports in the world economyand on the guaranteed safety of its trade and transport routes.
Prospects for the Main Commodity Exports
Agriculture
Tobacco
6. Production and Marketing: Tobacco is Zimbabwe's leading export,accounting for over 20 percent of merchandise exports, and 25 percent ifgold exports are excluded. Cultivated on relatively large and efficientcommercial farms, output was, till 1985, tightly controlled through anadministrative allocation system. Now, with production being freed fromsuch quota restrictions, larger crops can be expected primarily throughinctiase in area planted, rather than through further improvements inyieldu which are already high and which have levelled off on the commercialfarms.l/ While the Government is encouraging tobacco cultivation on smallfarms, small scale farmers are not moving into tobacco production asrapidly as expected on account of unfamiliarity with the technology andlack of facilities for curing tobacco. The Tobacco Research Board andGovernment have been actively involved in the development of a trainingscheme with a view to overcoming this problem.
7. Despite the diverse and pivotal role played by the tobaccoindustry not only in generating export earnings, but also in its direct andindirect contribution to value added, employment and excise tax revenue, ithas no special access to foreign exchange for its machinery and spare partsimport requirements through the foreign exchange allocation system. Inrecent years, the amount of foreign exchange allocated has been
I/ These have averaged 2,000 kg per hectare since 1981, having risen about40 percent since the mid 1970s.

ANNEX 2- 33 Page 4 of 24
insufficient to maintain machinery and equipment in efficient workingcondition, and in some instances good equipment is lying idle due to lackof spare parts some of which are fairly simple and inexpensive. -In fact,the problem of foreign exchange availability has become particularly acutewith respect to spare parts imports, and, if not alleviated quickly, couldprove to be a serious disincentive to increased tobacco production asoverhead costs continue to mount. The scope for increasing effl ' ncy byother means, such as reducing labor costs (the largest input costaccounting for 40 percent of total costs in tobacco production) isextremely limited, and may even increase given the current labor securityregulations. Other input costs that need to be closely watched relate tomaterials for packaging and shipping tobacco and fuel costs.
8. The world tobacco market, a buyer's market, plays a key role indetermining planned increases in output. Zimbabwe produces good qualitytobacco which by international standards fetches acceptable prices on theauction floor2 /. Marketing in Zimbabwe is handled by about 24 privatetobacco merchants, some of whom are licensed buyers on the auction floor,and is regulated to meet government standards by the Tobacco MarketingBoard, a statutory body set up in 1977. On the international market, tradein tobacco is highly concentrated in the hands of as few as three or fourmultinational leaf buyers. Price administering is common and efforts tominimize threats of competition from existing and new entrants arevigorously pursued.
9. Exports. A major reduction in tobacco exports occurred at UDI.Export volume fell more than four-fold, from 121 thousand tons to27 thousand tons, that is by more than 75 percent. During the UDI periodtaken as a whole, tobacco exports declined at an average annual rate of 2.4percent. However, there were marked fluctuations both on an annual basisand in terms of sub-periods. For instance, export volume declined by 7.8percent per annum between 1965 and 1975, but improved significantly during1975-80 growing rapidly by 9.4 percent annually. Since independence,tobacco exports have slowed considerably, partly on account of the drought,rising by only 3.4 percent per year. In terms of world market share,Zimbabwe's export volume more than doubled from 4 percent in 1970 to 8.1percent in 1981, and has since averaged around 6.1 percent. This compareswith 12.5 percent in 1965, before the imposition of sanctions. While thisshare may be difficult to reach in the near future, it is felt thatZimbabwe could increase its share to at least 7.2 percent by 1995 in theBase Case and to about 8.3 percent in the Policy Reform Case. With worldexports projected to grow at only 2.5 percent year between now and 1995,and real prices by only 1.4 percent per year, such shares would imply thatZimbabwe's tobacco exports increase by 3.2 percent and 4.9 percent perannum on average in the two scenarios respectively.
2/ At the auction opening March 31, 1987, low prices were offered for aleaf considered drought damaged. However, far better priced wereexpected as leaves higher up on the tobacco plant were to be broughtforward for auction. Yet, even with improved prices for better leaftobacco, prices in 1987 are expected to,decline by as much as 20percent to 250c per kg. If this happens, incomes in the industry wouldfall 10 percent this year, and the downturn in agricuture wouldintensify, instead of it making up for the maize sector's heavy revenuelosses.

ANNEX 2Page 5 of 24
- 34 -
10. A strategy that emphasizes a gradual increase in market sharewould be more appropriate than one that involves too sharp an increase asin 1981 which resulted in a price decline. Favorable prices in the early1980s had led to a good production response, but at a time whenconsumption, due in large part to health concerns, had begun declining inEurope, a major market for most tobacco exporting countries. As a result,surplus global stocks of lower stalk tobacco emerged and prices areexpected to recover only gradually. Given declining world consumption,competition between tobacco producers is likely to be stiff. Moreso, whenboth Brazil and Zimbabwe have increased tobacco production by at least 20percent, and the US, too, is releasing extra supplies of low-priced tobaccointo the market from its stockpile. Zimbabwe will also have to contendwith that portion of its initial output that has suffered drought damage ata time when, for four years consecutively, Brazil has been enjoying goodleaf quality.
11. Yet, Zimbabwe has certain advantages which it should continue tobenefit from. Among these are its potential for continuing to produce highquality tobacco, and duty free access to the European Community forflue-cured tobacco under its membership of the Lome III Convention andclassification as an African Caribbean and Pacific (ACP) state3/. Itmight also try to regain its recent decline in share of the EC market,attributed partly to a supply constraint caused by the quota controlrestrictions which operated within Zimbabwe, but which have now beenremoved. Furthermore, it could look into the possibility of capturing partof the European market share freed up by the US and Canada, on account oflarge increases in the landed price of their tobacco, even though thesecountries themselves are likely to recover some of it. To what extent theysucceed will depend on the success of the "tobacco program" in the US whichhas reduced the cost of US tobacco to exporters and placed the country on amore competitive footing, and the introduction, in 1986, of the low exportincentive price for tobacco in Canada. As regards finding new markets,Zimbabwe should vigorously pursue the tobacco importers in developing andcentrally planned economies where the adverse impact of tobacco on healthhas not yet become a major factor in inhibiting tobacco consumption in theshort run.
12. Ultimately, however, whether Zimbabwe can increase or evenmaintain its share in world tobacco exports depends on whether it can meetits export deliveries on schedule and whether it can meet them without anacceleration in costs. With a continuation of exchange rate movement andcontrol over wage and other cost factors, Zimbabwean tobacco can continueto be highly competitive. However, meeting export deliveries will dependon the continuation of smooth and secure transport arrangements throughMaputo, since Beira will be unable to handle the large export volume shouldpolitical instability in the region lead to disruption in transportarrangements in Mozambique.
3/ This is a strong advantage compared to other tobacco exporters whooperate under the GSP or the GATT trade arrangements.

ANNEX 2- 35 _ Page 6 of 24
Cotton Lint
13. Production and Marketing: Zimbabwe produces high quality cotton,70-75 percent of which is usually exported as lint and the remainderretained for the local spinning industry. Western Europe, Japan and SouthAfrica are the main importers of Zimbabwean cotton lint, with the lattercomprising mDre than 30 percent of Zimbabwe's export market. Untilrecently, about 60 percent of output originated in the large-scalecommercial farming sector. Over the last few years cotton, because of itsdrought-resistant qualities, has increasingly proved to be a good cash cropfor the communal farming sector as well, whose share in output rose to 55percent at the end of the last season, and may reach 60 percent in thecoming years. Much of the expansion in the future is likely to come fromthis sector. In fact, next to maize, it is the other main commoditymarketed in communal areas. During sanctions, cotton lint was a valuableforeign exchange earner, and even today, being the third largest exportcommodity, it remains important to the economy not only in this regard, butalso in providing employment to as many as 450,000-500,000 people.Accordingly, the Government looks upon cotton cultivation favorably, andhas pursued a price policy, through the Cotton Marketing Board (CMB), thathas been considered reasonably fair 4 /. However, the financial situationof CMB itself, the exclusive buyer of cotton in Zimbabwe, has, in the firsthalf of the 1980s, suffered from weak international prices. In the lasttwo years prices fell by 30 percent in real terms. As a result, CMB'straditional surplus turned into a deficit in 1983/86 and 1986/87. Itsfinancial health is vital, if it is to ensure price stability to producersto enable them to make rational planting decisions with respect to the nextcrop.
14. Since independence, the volume of crop sales to the CMB hasincreased by over 60 percent. While the prolonged drought has had someadverse effects on cotton output, other factors, too, have contributed, tofull potential not being realized. These have to do with the recent laborsecurity regulations and the foreign exchange shortage. Handpicked cottongreatly enhances its quality and commands a high premium in Europeanmarkets, particularly in Switzerland, Germany and Italy. Rapid expansionin cotton cultivation in the communal areas has reduced the availability ofcotton-pickers, especially for top grades of cotton, to the commercialfarming areas. Furthermore, the labor security regulations have made it
4/ Irrespective of international prices which have been weak, theGovernment guarantees a relatively fair price to the producer. Yet,the price differential between different grades of cotton, especiallybetween grade A and B, has been insufficient to encourage farmers togrow grade A cotton which fetches a high premiuim in the EEC market. Itwas not until April this year that a five percent per kg increase wasannounced for grade A and A(SS) seed cotton; this is expected toimprove the quality of cotton delivered to the CMB. Increases inproducer prices of all grades may be instituted at some future date tobenefit the small-scale commercial farmer and the communal farmer.

ANNEX 2- 36 - Page 7 of 24
difficult to lay-off relatively less efficient workers5/. The net resultof an inability to both reduce labor costs very much, or to exercisenecessary control over productivity, is fast proving to be a disincentivefor commercial farmers and could have negative effects on cottoncultivation by them unless the noted drawbacks are removed6/. An addedconstraint is the shortage or untimely availability of chemicals andpesticides caused by the foreign exchange difficulties. Given the pestcontrol problem, this is holding back yield improvements, particularly incommunal areas.
15. Exports. Zimbabwe's cotton lint exports made great headwayduring the period 1965-80, when average annual growth averaged 26 percent.A drastic reduction in export growth took plate between 1980 and 1984,mainly on account of drought conditions, when average annual growthaveraged only 0.3 percent. The 1984/85 season, produced a record crop andexport growth soared by 33 percent in 1985. This, however, was short-livedas poor rainfall once again slowed down the export growth rate, which isexpected to show a decline of 2.6 percent in 1987. As a proportion ofworld trade in cotton lint, Zimbabwe has steadily increased its share from0.8 percent in 1970 to 1.8 percent in 1986. With Zimbabwe's export volumeprojected to grow by 3.5 perc.nt per annum on average between now and 1995,while world cotton lint exports are expected to increase by only 0.8percent annually, Zimbabwe's share can easily rise to at least 2.0 percentby 1995. This seems very likely given the recent price recovery which hasbeen started by the shortfall of cotton production in the major producingcountries, and expected sharp decline in the world cotton stocks,especially the medium staple variety held by China and the United States.It is this staple which is increasingly exported from Zimbabwe;international competition init remaias intense. However, new spinningtechniques being developed in Western Europe require stronger and longerstaples. Consequeatly, Zimbabwean farmers, with the help of CMB andresearch institutes, may have to switch to producing the longer staple. Itis crucial then that Zimbabwe retain its well earned position as a qualityproducer in the European market while continuing to compete successfullyfor newer markets.
16. Although the current costs of cotton processing are apparentlylow, upgrading ginning operations is at present a priority. Existing ginsare in urgent need of replacement and foreign exchange difficulties havedelayed purchase of new ones. Unless this problem is resolved in the very
5/ Considerable productivity losses can occur if top pickers areunavailable. A top picker can pick about 100 kg of cotton per daycompared to an average picker who picks about 20 to 25 kg per day. Asthe situation exists at present, an average picker will normally pickonly the quantity equivalent to the cotton picking rate set along thelines of the Government's minimum agricultural wage. Most commercialfarmers have, therefore, adopted a bonus system to get largerquantities picked.
6/ The bulk of future expansion in cotton is likely, under the existingcircumstances, to come from communal farms. Government is encouragingthese farmers to increase production not only through its price policy,but also through a training center and related facilities.

ANNEX 237 Page8of 24
near future, the Plan target of 460,000 tonnes may become impossible tomeet given a lack of facilities for storing unginned cotton in the rainyseason. 'wo other problems that need to be resolved if competitiveness isto be maintained have to do with packing Second, even though the cottonlint is there ready to be moved, the railway is facing problems intransporting it. This situation, if not settled, could interfere withmeeting export delivery schedules and could, in the process, reducecompetitiveness. Given the fact that very limited scope remains forreducing labor costs, as discussed earlier, maintaining efficiency andquality control, and ensuring prompt export deliveries remains all the morecritical for Zimbabwe's export competitiveness.
Sugar
17. Production and Marketing: Sugar is a major contributor toagricultural output and raw sugar is significant as a foreign exchangeearner. Within Zimbabwe, increase in consumption demand (six percent lastyear) and plans to expand sugar-based ethanol production in response to arise in internal fuel consumption needs have rendered it increasinglyimportant domestically. However, since all existing water is being fullyutilized and the industry cannot rely on rainfall, particularly in thelowveld (the main sugar producing area in the country), any increase insugar production will necessitate large investments in irrigation. Yet,Zimbabwe's sugar industry enjoys high crop yields and benefits fromtechnical expertise, but any expansion of sugar cultivation, in view ofenhanced irrigation, would hinge on the improvement in the pricesituation 7 /.
18. The local market price has been insufficient to cover the cost ofproduction and to provide a return on the capital employed in producingsugar for the local market. AccorAingly, since 1983, severalrepresentations have been made to the Government to agree to a realisticdomestic price policy, and, despite delays, two price increases weregranted in January 1984 and August 1985 respectively, but for less than thefull amount requested. A third and substantial price increase request ispresently under consideration. With the capital in the sugar industryvirtually written off, the price increase requests were based on farmers'escalating input costs brought about by a combination of factors. Giventhe fairly labor intensive nature of the sugar industry, the minimum wagechanges hit the industry fairly hard, and more so, since there was littlescope to further reduce employment in the two main sugar producingcompanies. Furthermore, with the difficult foreign exchange situation, andgiven that the industry is a big user of fertilizer, fertilizer costs haverisen. While the mills themselves are in reasonably good'condition on the
7/ The Chisumbanje Experimental Station, (in connection with the proposeddevelopment of 40,000 ha under both flood and overhead irrigation atChisumbanje in the low veld), through its tests on a variety of cropsand cultural practices obtained exceptionally high yields of cotton,wheat and sugar-cane. At the present weak international marketsituation in sugar, it is uncertain as to how much sugar cultivationwould expand, if at all, in spite of the proven potential.

ANIEX 2- 38 - Page 9 of 24
two main sugar producing estates, the foreign exchange scarcity hasresulted in a problem of replacing tractors whose domestic price hassky-rocketed. The April legislation this year8/, reducing the mark-upsallowed to importers for agricultural machinery, implements and spares,should assist farmers in reducing their input costs somewhat. Whether thisactually happens depends on the effect of the level of foreign currencyallocations for the second half of this year, which could adversely affectthe availability of the necessary items.
19. Exports: After reaching a peak of US$632 per ton in 1980, theworld market sugar price plummetted to US$61 per ton in June 1985.Zimbabwe, with its access to preferential markets, did fairly well, underthe circumstances in terms of growth of sugar exports. Between 1980 and1985, sugar exports increased by 4.7 percent annually on average, afterhaving risen by only 0.5 percent per annum between 1965 and 1980. Worldgross exports are projected to grow at about 4 percent per annum from nowthrough 1990, but Zimbabwe's exports are likely, at best, to increase byonly about 2 percent, and may, in the absence of any policy change, notgrow at all. This is quite probable, in view of current problems linked toprofitability considerations and rapid growth of the domestic market. Inany event, Zimbabwe's share in world trade which reached its highest at onepercent in 1986, may fall to 0.6 percent in the Base Case or to 0.7 percentin the Policy Reform Case by 1995.
20. The extent to which Zimbabwe can continue to obtain maximum pricebenefits from access to preferential markets remains to be seen. The USquota for Zimbabwe set at 38,000 tons in 1982 has now been reduced to only9,500 tons as a consequence of the US domestic price support program.Also, given the establis-ed popularity of synthetic sweeteners and therapidly growing market for High Fructose Corn Syrup, even this small quotamay disappear by 1990 depending again on the US domestic price supports.It is estimated that the present reduction in quota could cost the Zimbabwesugar industry as much as Z$13 million per year. The ACP quota of 1.3million tons per year, with 30,000 tons for Zimbabwe, negotiated under theold Commonwealth arrangement, is fairly fixed and is not negotiable. Theeffects of the US quota cuts and the EEC's policy to protect its ownagricultural interests is being studied.
21. In the medium term, it seems clear that Zimbabwe will have todiversify further its sugar export outlets to regional and non-regionalmarkets. It has already had some success in finding adjacent exportmarkets, even in the face of tough competition from other efficientregional sugar producers such as Mauritius and Swaziland. On the overseasnon-preference markets, in the immediate short-run, Zimbabwe could exportto Cuba which has not yet fully recovered from last year's drought, toBrazil which is trying to roll forward some of its commitments, toAustralia where the sugar industry is experiencing financial difficultiesand pessimistic long-term prospects, and to the USSR where growth and
8/ The announcement made by Government on April 15, 1987.

ANNEX 2- 39 - Page lO of 24
productivity are lagging in the face of rising demand. World Bankforecasts for now through 1990, project a world free market sugar price, onaverage at least 30 percent less than the EEC/Loma price and 50 percentless than the US market stabilization price, with the gap narrowing as theyear 2000 approaches. The world sugar market will also be influenced bythe Cuba-USSR sugar protocol, the probability of a renewed InternationalSugar Agreement, the prospects for which in the near future look bleak, andpotential developments under the Caribbean Basin Initiative. One factor,in the world sugar trade outlook, that could be of significance toZimbabwe, is that trade in raw sugar in particular is expected to slow downwith the improvement in production techniques that enhance thecompetitiveness of plantation white sugar with refined beet sugar. Thecountry should seriously consider increasing its production and export ofwhite sugar, and take advantage of the situation in some adjacentcountries, and possibly the central African countries, that have norefining capacity of their own. The Governmpnt is already encouragingsteps in this direction by its export incentive for white sugar amountingat present to nine percent of the f.o.b. price.
22. Finally, there remains the problem of transporting sugar forexport in the event of sanctions. The direct railway line to Maputo hasbeen closed since June 1984, and, although, the line is beingrehabilitated, a major security problem remains. In addition, using thediverted route to Maputo via South Africa has resulted in substantiallyhigher costs to the industry. Using the port of Beira is a possibility,but not without major difficulties, since it has no bulk sugar loadingterminal9/. With the imposition of sanctions, the sugar would have to beshipped north to Harare and then to Beira. Given the present state ofsugar priees, sugar would not be given any priority in terms of shippingarrangements. Moreover, all the additional loading and unloading, packingin bags, etc., would imply a precipituous rise in costs for the sugarindustry and would tnost likely contribute to serious delays as well.
Beef
23. Production and Marketing: Zimbabwe has a sophisticated andintegrated beef industry that occupies a unique position in the country'seconomy. It generates almost 20 percent of gross agricultural output, is asignificant earner of foreign exchange, provides a variety of raw materialsfor manufacturing industry and employs about 70,000 people. More than 60percent of the beef produced is regarded as being suitable for export tovarious overseas markets, According to the 1982/83 Census, the nationalbeef herd was estimated at 5.6 million head and valued at about Z$1.2billion, with 39 percent cf the herd held by commercial farmers and 61percent by the communal farmers. Estimates show that the country couldcarry 6.5 million head of cattle on a sustained basis, and with theapplication of known technology, annual production could reach over 900,000head. Efforts are being made by Government to improve research, extensionand veterinary services for communal farmers, and as a means of encouraging
9/ lMaputo has storage capacity amounting to 50,000 tons,

ANNEX 2
- 40 - Page 11 of 24
communal farmers to bring their cattle for slaughter, the Government isconsidering requiring them to dip their cattle themselves rather than itundertaking the dip for them.
24. The severe and prolonged drought of the 1980s has proved to be asetback for the beef industry. Through being forced to sell immaturecattle, the commercial farmers have experienced heavy financial losses,while the communal farmers have suffered large losses in terms of numbersof cattle. Slaughterings exceeded 500,000 head annually between 1982 and1984. Herd rebuilding on a national scale is now a priority, since, beingsignificantly understocked, beef production is limited. When fullystocked, about 22 percent of the herd is normally slaughtered. At themoment, it is surmised that commercial cattle owners are retaining fivepercent of their herd and slaughtering about 17 percent.
25. The Cold Storage Commission (CSC), functions under the umbrellaof the Agricultural Marketing Authority (AMA), and is responsible forpurchasing, processing and marketing the country's beef. It operatesabattoirs and cold storage works, has an annual turnover of about Z$250million and employs about 5,000 people. The total slaughtering capacity ofits factories is 600,000 head of beef cattle per annum. It has sufferedoperating deficits since 1981/82 on account of a flawed government pricepolicy that virtually ignored the seasonal aspects of the beef industry andwhich eventually led to a 30 percent reduction in domestic sales. Combinedwith the effects of drought, exports, too, have been threatened by such adomestic price policy. Beef prices were set at a level that discouragedcattle owners from bringing their cattle to the CSC for slaughter,resulting in a deficit situation at the CSC. Selling to private abattoirs,that paid about 30 percent more than the CSC, became a preferred option forlivestock producers during periods of seasonally reduced supply. With theCSC's pr,iqgs, both those offered producers and.tH-Ise charged retailers,firmly controlled and fixed, it was unable to compete with privateabbatoirs that, in spite of nominal price controls, were able to pass oncost increases to retailers, and it finally ended up in a deficitsituation. Consequently, in end 1986 and early 1987 the Government took anumber of steps in its efforts to improve the CSC's financial situation.It conferred legal monopoly rights on the CSC for all livestock purchases,it restricted sales to private abattoirs and it made the CSC roller-mark oncattle compulsory in at least 19 towns.
26. Following frequent and strong representations by the beefindustry for a price increase for beef, the Government finally gave a 30percent increase in the producer price for beef cattle announced on April15, 1987. For the success and efficiency of the beef industry, it isimportant that these current real producer prices for beef cattle, whichseem to be at a reasonable level now, be examined and revised upwards asand when the beef market confirms that this is necessary. Maintaining aprice policy for beef that continues to restore and increase confidenceamong cattle owners is essential to rebuilding the national herd, toZimbabwe fulfilling its export commitments, particularly those to thelucrative EEC market, and in providing the domestic market with a regularsupply of beef.

ANNEX 2- 41 - Page 12 of 24
27. Exports: Between 1965 and 1977, Zimbabwe's beef export volumerose by 10 percent per annum on average, but fell drastically in 1981 and1982 to negligible amounts. Export performance has since recoveredsignificantly, with export growth averaging 30 percent per year between1982 and 1986. Future beef exports from Zimbabwe are expected to expand asthe herd is gradually rebuilt, and are likely to grow at about sevenpercent per annum from now through 1995. Over the same period, world tradeis projected to grow by only 3.4 percent per year on average. Zimbabwe'sshare in world trade, is unlikely to match the proportions achieved duringthe 1970s when its share averaged 1.7 percent. It is, however, expected toincrease marginally from the 1986 share of 0.1 to 0.2 for the remainder ofthe 1980s, and to 0.3 percent by 1995. The medium and longer-termprospects for beef price recovery in the world market remain weak withproduction projected to outstrip demand. Under the circumstances, it isvital for Zimbabwe to meet its EEC quota of 8,100 tons under LomA III, ontime, and to, thereby, maximize its benefits from this lucrativemarket10/.
28. According to very recent reports, it appears that the EEC andother Zimbabwean beef importers have reduced the approved offtake area toMashonaland, Charter and Makoni districts, due to a new outbreak of footand mouth disease in certain parts of Matabelelandl/. An earlieroutbreak had occurred in late 1985 delaying shipments to the EEC lastyear. Fortunately, the present outbreak of foot and mouth disease has beenquickly controlled and the prescribed. EEC veterinary health standards arebeing strictly maintained, so that beef exports may not suffer in anysignificant way.
29. Transportation difficulties in the event of sanctions couldbecome a real problem for beef exports. The port of Beira has no coldstorage capacity for beef and, in any event, the EEC has strongreservations about beef being transited and rehandled in Mozambique.Alternative arrangements such as using air transport, or packing the beefin refrigerated trucks or containers that could then be shipped from Beirawithout rehandling and reloading it there, could add greatly to transportand investment costs at a time of projected weak price recovery for beef inthe world market. Under these circumstances, continuing to exploreregional markets for its beef exports, particularly in neighboringcountries, seems crucial for Zimbabwe.
Tea
30. Production and Marketing: Tea has been gaining significance bothin terms of production and exports starting since well beforeindependence. The decade 1975-85 is particularly noteworthy withproduction growing at the rate of almost eight percent per annum onaverage12/. Zimbabwe's national average yield in kg/ha was double the
10/ Zimbabwe gets special beef export cpncessions under the Lome trade andaid agreement between EEC and ACP countries.
11/ The Herald (Zimbabwe) May 8, 1987.
12/ The effects of the drought were not as severe for tea production, since59 percent of the total national tea area in Zimbabwe is underirrigation, and in the case of the largest tea producer, 100 percent ofits tea plantations are irrigated.

ANNEX 2Page 13 of 24- 42-
average of its nearest six international competitors in 198613/. After1984, which was the best year ever for tea prices as quoted at the LondonAuction (the average price received for all teas was 346c/kg), tea priceshave been weak and have not yet recovered from the collapse in 1985 whenthey plunged almost 43 percent to 198c/kg. A sub-group of tea exportersconcluded that a surplus of low quality teas produced and exported during1983 when prices peaked, was a major factor in the collapse of tea pricesfrom 1985 to 1986. Moreover, despite lower crop yields in 1986, and aftera slight recovery at the end of that year, prices for black tea had fallendrastically by early 1987. Together with a sharp escalation in productioncosts, particularly wage costs,4/, which have spiralled sinceindependence, Zimbabwe's tea industry became extremely fragile, and is nowstruggling to regain its financial strength aided in part by the slightimprovement in tea prices. Zimbabwe's tea plantation workers are paidminimum daily wages close to 85 percent higher than its nearest competitorKenya, and five times higher than Malawi, its second closest Africancompetitor. Negotiating a reasonable domestic tea price with Governmentcould be important for restoring the viability of some of these financiallyweak estates. Such negotiations are, of course, inapplicable to estatesthat produce for export and whose prices are determined at the Londonauction; these latter estates are, in a senee, thus, far more vulnerable.Wage costs account for approximately half of the production costs of thetea industry in Zimbabwe. The increase in wages for agro-industrialworkers enacted in the last two years posed a stringent test for the teaindustry with regard to labor relations, but one, which, at least, thelargest and most successful tea producers, a couple of which are verticallyintegrated and diversified, were able to pass without too much disruption.Combined with the job security regulations the smaller and less efficientproducers, though, were seriously affected and did suffer much largerfinancial losses; no outright assistance for their financial recovery isknown to have ocr.rrtwd,
31. In spite of weak prices and escalating production costs in recentyears, Zimbabwe's tea industry remains one of the most productive byinternational standards. It has managed to maintain this positionprimarily through diligently continuing to work on raising its already highyields. There is a problem, however, that the country's tea industryshares with the rest of the agro-industrial economy, namely that of theexisting scarcity of foreign exchange for importing equipment and sparesessential for both replacement and new fixed investment. An addeddifficulty relates to the rapid inflation associated with the cost andmaintenance, especially through spares requirements, of the tractor fleet,the latter being indispensable to the functioning of the tea industry. Theimpact on the price of equipment in general, and for fertilizer, inparticular, has been said to be extremely severe. It is hoped that theoverall foreign exchange situation improves and prices rise; but, in the
13/ Compare Zimbabwe's 1986 national average yield of 2918 kg/ha with theaverage of 1363 kg/ha of Malawi, Kenya, India, Indonesia, Sri Lanka andMozambique taken together.
14/ The agro-industrial wage is higher than the agricultural wage by atleast $10 per month; the latter has risen by as much as 250 percentsince 1978/79.

ANNEX 2- 43 Page 14 of 24
meantime, the government directive reducing mark-ups on agriculturalmachinery, equipment and spares should ease the cost situation somewhat forthe tea industry as it is expected to do so for other industries as well,Given the limited scope for reducing labor costs, the industry, in order toremain competitive, will have to look into the possibility of reducingother costs as much as possible, and to going ahead with its plans toexpand and improve its irrigation systems among other things.
32. Exports: Zimbabwe's export performance in tea has been impressivesince independence with annual growth averaging 9.2 percent between 1980-86compared to 4.8 percent in the second half of the 1970s8 Its share inworld trade, too, has been particularly noteworthy. Over the period 1980to 1984, it more than doubled rising from 0.6 percent to 1.2 percent.Since then, however, this share has stagnated and the prospects for itrising much higher are dim. From now through 1995, world tea exports areprojected to rise by about 1.8 percent annually on average, and prices inthis same period by about 4 perce,ut per annum. Zimbabwe's tea exports, itis estimated, will probably grow by approximately 2 percent annually inwhich case a very slight increase in share from 1.20 to 1.22 percent mayoccur. If the more optimistic growth of about 3 percent is considered,Zimbabwe's share would rise to 1.3 percent by 1995. This slim possibilitycould exist, in view of the changes that have been occurring in the worldtea market since the 1970s. At that time, India and Sri Lanka held abouttwo-thirds of the world export market; their combined share now is lessthan one-half. China, Indonesia, Kenya and Argentina have doubled theirmarket shares, and Africa, as a whole, has impressively increased itsmarket share from 10 percent in the early 1960s to the present 25 percent.It is this latter development in the face of sluggish world supply andrising demand projected for the 1990s, that could tap Zimbabwe's potentialfor becoming even a stronger international competitor.
33. The quality of Zimbabwe tea is high and this factor could greatlyenhance her pesition in the international market, since low quality teaexports are facing increased difficulty in entering the world market.There are also plans by some of the larger Zimbabwean prcducers to protectthemselves from the uncertainties of the international bulk tea commoditymarket by securing export markets for tea in packet form. An InternationalTea Agreement is unlikely in the near future, and, in any case, it wouldnot be critical for Zimbabwe at the moment with its very small share in theworld market, Transportation of tea, in the event of sanctions, couldbecome a problem. Compared to other far more highly valued exports such astobacco and cotton, tea would probably be assigned a relatively lower levelof priority on the Beira line.
Coffee
34. Production and Marketing: Seven percent of Zimbabwe's totalagricultural exports is accounted for !y coffee, which is fast becoming animportant export crop. Domestically, it is fourth in importance in labouremployed and ninth in terms of foreign exchange earned. Zimbabwe produceshigh quality coffee, 97 percent of which is arabica and the remainder

ANNEX 244 Page 15 of 24
robusta. Its high acidity contributes to its popularity and it is verymuch in demand both domestically and abroad. Zimbabwe is one of the fewcountries in the world where coffee is grown largely under irrigation. Itis cultivated on the Eastern Highlands primarily by large scale commercialfarmers and also by the Agricultural and Rural Development Authority.Coffee yields on the large coffee estates are among the highest in theworld and the potential to expand coffee cultivation is strong in view ofno obvious shortage of land, labour and water15/. Government isincreasingly encouraging communal farmers to grow coffee, but has yet toprovide them with the essential advisory service or the necessary financialassistancel6/. The gestation period of the first crop is usually aboutthree years, and from the fifth year onwards a major crop can be expected.It takes about five to ten years to break-even, provided other factors suchas weather etc., are favorable.
35. Zimbabwe's current coffee production is estimated at 200,000 bagswith approximately 85 percent of output being exported. Marketing ishandled by a statutory board that functions under the purview of theAgricultural Marketing Authority. Coffee is a controlled commodity withthe Grain Marketing Board paying the producer an intermediate price,usually an average between the quota and non-quota price. On theinternational market, the free market price has in the past been about 60percent below the International Coffee Agreement (ICA) member price.Government's recommendation that coffee output be doubled within the nextfive to ten years has caused some concern domestically due to theuncertainty regarding future trends in international price and size ofmarket for Zimbabwe's coffee. ICA quota's were suspended in February 1986,and, as of April 1987 had not been reintroduced by the 75-nation ICA. TheApril talks failed primarily on account of disagreement between USA andBrazil on the share-out of a global export quota. The USA officiallycriticized Brazil's refusal to concede a cut in its historic share of theInternational Coffee Organizaton's (ICO) quota, despite its falling shareof the world export market.
Exports
36. Zimbabwe's coffee exports grew phenomenally between 1970 and 1975at an average annual rate of 54 percent, reaching 3,500 tonnes in 1975.After declining by three percent per year in the five years prior to
independence, export volume picked up again rapidly over the next five,rising at an average annual rate of 32 percent. In fact, during 1980-85,coffee exports almost quadrupled to close to 12,000 tons. From now through1995, it is estimated that Zimbabwe's coffee exports could grow at anaverage annual rate of 4.5 percent in the Policy Reform Case and at 2.4percent in the Base Case. With world exports projected to grow at only 1.7percent per annum on average, Zimbabwe's share in world trade could rise alittle from the present 0.32 percent to 0.39 percent if policy change takes
15/ The current high yield of 1.7 tons per hectare, almost double that ofKenya's 0.9 per hectare, can be improved even further.
16/ In Kenya, 70 percent of the coffee crop is grown by smallholders.

ANNEX 245 Page 16 of 24
place, and in the absence of policy change, would rise very marginally to0.34 percent. Given that demand is likely to increase relatively fasterfor the kind of arabica coffee produced by Zimbabwe, than for the arabicaand robusta offered by Brazil and other competitors, strengthens thelikelihood of Zimbabwe's increase in share, even though, under the presentinternational marketing arrangements, it would be very small.
37, The broad scenario described above depends on the priceprojections for coffee. These projections are governed by assumptions madeabout future operations of the ICA which at present remain uncertain. Themost recent February 1986 suspension of quotas under the ICA was triggeredby the high prices of coffee brought about by the drought in Brazil in thelatter half of 1985. By early 1986, arabica and robusta prices were 56percent and 35 percent higher than the 1985 average. The ICA CompositeIndicator Price (CIP), 15-day moving average, remained above 1SOc/lb forthe necessary 45-day period resulting in the suspension of quotas.According to the Agreement, quotas will be re-imposed if the CIP declinesto 135c/lb and the quota price range remains unchanged. This is not likelyto happen until after mid 1987 under present forecasts, but when it does,several unresolved problems will surface again. Primary among these willbe the problem of quota allocations, export under-shipments and sales tonon-quota markets.
38. Brazil's dominance in the world coffee economy remainsuncontested, due to its large market share and in spite of its decliningshare of the world market since 1980. Wide fluctuations in its output, andthe repercussions on international coffee prices will be an importantfactor in any discussions on export quota reimposition. Countries withexport quotas, under the suspended agreement, lower than their existingproduction capacities are expected to argue either for a reduction inBraz.V quota or for an increase in the global quota and, consequently, anincrease in their own quotas, should Brazil's quota remain unchanged. Ineither event, Zimbabwe, could, on the basis of both its present productionand potential output, argue for a higher quota.
39. It is felt that Zimbabwe's current quota of 90,000 bags out ofcurrent estimated production of 200,000 bags, that is 45 percent of cropoutput, should be increased to at least 67 percent of total production.There is also a view that as far as quotas for Africa are concerned, WestAfrican countries, particularly Nigeria and Ghana, benefit the most. Thus,the concern that even if the African quota is increased in a renegotiatedICA, Zimbabwe may not necessarily stand to gain. However, there is somescope for optimism given the high probability that the USA would insist onfairer quota allocations should renegotiations for a new ICA materialize.
40. Given the likelihood of tough negotiations, a new ICA may play aweaker price-supporting role in the future compared to the period 1980-85.It may also impose severe penalties on countries offering attractivediscounts on large export quantities and on those that resort toundershipment or postponement of their quarterly quotas in the expectationof profiteering from higher expected prices later in the coffee year. Such

ANNEX 2- 46 - Page 17 of 24
close monitoring of the international coffee market is expected to benefitthe relatively efficient coffee producers such as Zimbabwe, which enjoyhigh yields and produce quality coffee. Ensuring prompt delivery ofexports to importing countries is an important factor that would furtherstrengthen Zimbabwe's competitive position.
Mining Products
Gold
41. Production and Marketing: Gold is Zimbabwe's primary mineralexport and the second most important export commodity, accounting for onaverage 38 percent of all mineral export earnings, 35 to 40 percent ofthe mining sector's value of output, and about 40 percent of all laboremployed in the sector. The country has a long history of gold mining withproduction concentrated primarily in small gold mines. Up to 90 percent ofgold output is exported, and, since last year, there has been some drawdownof accumulated gold stocks as well. Depending on the quality of the oregrade and complexity of the prevailing geological conditions in each mine,operating costs can vary greatly between mines. The weak gold prices in1981, 1982 and 1983, when value per ounce declined significantly, provedfinancially difficult for many gold mines, especially the very smallmines. As a consequence, in November 1984, the Reserve Bank of Zimbabwe(RBZ) began operating a floor-price scheme. Through this, producersreceived $500 an ounce for their gold, and when the official gold priceexceeded this, the RBZ recouped its advances by taking 25 percent of theenhanced price until disbursements were paid. Effective January this year,a new support price of $650 per ounce was introduced. The gold pricesupport program has further boosted gold mining, which in any event offersthe best prospects in the mining industry in Zimbabwe, Small scaleoperations, however, are assisted at present, only to a very limited extentby the Ministry of Mines, through equipment leasing, loans, technicalassistance and ore treatment. If such assistance is expanded and theGovernment's price support fund continued, further new discoveries andlarger production from reopened gold mines may be more readilyforthcoming. All bullion is purchased by the RBZ and until recently, allgold was refined by South Africa Rand Refineries. For the past year, ithas been refined at greater cost in Australia. The Government's emphasison a new refinery plant based at the RBZ's Fidelity Printers has raisedquestions regarding the economics of this step, on the grounds of thepresent volume levels being too low; these, however, are expected to besupplemented by gold ore from Mozambique and Tanzania, and to a lesserextent from Botswana and Zambia.
42, Exports: Hardly any price projections are available for gold,but it is expected that the price of gold will range from $450-$500 perounce for the remainder of the year. According to the British based MiningJournal's latest Gold service quarterly, gold production is expected toreach an all-time high this year, worldwide, while prices are expected totouch levels between US$525 and US$550 within the next nine months; thesehigh levels will, however, be unsustainable for any prolonged period oftime. From now through 1995, Zimbabwe's gold exports could rise by about

ANNEX 2- 47 - Page 18 of 24
four percent per annum (considerabl, lower than the 14 percent annualaverage growth since independence), if the price remains strong andgovernment policies encourage production; if not, they cotuld be as low as1.4 percent per annum. World mine production is likely to fall short offilling primary gold demand through year 2000 by about 25 percent, eventhough world reserves and resources could cover more than twice theforecast estimates of about 700 million ounces. The shortfall of about 200million ounces would most likely be made up by the sale of bullion reserveassets to pay off international debts, some dishoarding such as that whichoccurred during the rapid price escalation in late 1979 and early 1980, aresumption of bullion auctions similar to those held earlier by the IMF andUS Treasury, and some newly mined gold from centrally planned economiesentering the market as payment for grain or other commodities. The rate ofproduction in the RSA is expected to be lower by the year 2000 as presentlymined ore bodies are depleted, unless the intensive ongoing exploration inthe Witwatersrand basin produces additional goldfields. The USSR,accounting for over one fifth of world gold output is likely to gainfurther in importance. New discoveries have also been made along theentire Pacific Rim, and along the west coasts of South America and theUSA. The trade pattern is expected to remain roughly the same as it hasbeen, barring unforeseen developments such as the large demand for gold inJapan four years ago and, the substantiil replenishments of gold stocks bymajor banks in 1985.
43. The growing potential for economic and political instability inthe RSA with its labor unrest, high costs associated with deep mining,shortages of capital and skilled labor, and high capital costs associatedwith initiating the development of new mines, may further reduce the supplyof gold, and spur new gold exploration, mining and recovery techniquesworldwide from countries other than the RSA. If sanctions materialize,Zimbabwe could conceivably step in and capture a portion of the worldmarket vacated, provided its production continues to grow17/. Under thecircumstances, it might also consider speeding the setting-up of and/orexpanding its gold refining capacity, but only if the Government ensuresthe cost-effectiveness of such a move.
Ferro-Alloys
44. Production and Marketing. During 1981-83 ferrochrome accountedfor 8.7 percent of Zimbabwe's merchandise exports. Next to RSA andYugoslavia, Zimbabwe is the third most important source of ferrochromiumfor the USA, the world's largest consumer. Of the 36 billion tons ofshipping-grade chromite resources, 99 percent are located in southernAfrica, 72 percent in the RSA and 30 percent in Zimbabwe. While world mineproduction of chromium grew by 1.3 per annum on average between 1976 and1984, that in Zimbabwe declined by 7.2 percent. An impressive 10.5 percentrise in production was recorded in 1985, but the volume was still 40
17/ There are strong indications already that as far as gold coins areconcerned, sales of the RSA'S Kruggerand are increasingly beingreplaced by demand for the Canadian Maple Leaf, the USA's AmericanEagle and even Japan's gold coin to commemorate the sixtieth year ofEmperor Hirohito's reign.

ANNEX 2- 48 - Page 19 of 24
percent below the peak 1975 level. During this last year, production grewat a much slower rate of 4.9 percent; in the short term capacity toincrease production furthercwill not be forthcoming. Production is greatlyconstrained by smelting capacity. Moreover, any large expansion in outputis unlikely unless the price strengthens considerably and profitability ofthe mines is restored. The possibility of any large price improvements inthe next few years is slim given the poor world prospects for manyminerals. This reduces the hope of any quick restoration of profitabilityin the ferrochrome industry in Zimbabwe, which has in recent years, alsosuffered from high wage costs, a significant factor, since mining methodshere are basically labor-intensive. Electricity costs, too, have soared.In fact, when compared to the RSA, total costs of production are double inthe Zimbabwe mines along the Great Dyke. However, in the podiform depositsalong both sides of the Dyke, where a large number of chrome bodies exist,costs of mining are about one-third the costs of the Dyke deposits, and,thus, offer some scope for more profitable production. The immediateprospects for production lie in producing low carbon ferrochrome.
45. Exports: Ferroalloys exports grew at an impressive rate of 10.5percent per annum on average during the 1970s. This was followed by adecline of five percent per year on average from 1980 through 1986. Thedemand for ferrochrome has remained consistently strong reflecting acontinued high level of activity in the stainless steel industry. Globalconsumption of stainless steel (used as a proxy) is estimated to rise byabout 3.5 percent per annum for the next three years18/* However, evenunder a relatively optimistic scenario, that is, under the Policy ReformCase, it would be difficult to envisage Zimbabwe's ferro alloys exportsexceeding 2.1 percent per year; the pessimistic scenario or Base Case,would show no growth at all owing to supply constraints. In either case,in the immediate future, it is more than likely that Zimbabwe would losesome market share. Over the medium to long term, however, if the prospectsfor price recovery brighten and foreign exchange to import miningequipment, implements and spare parts both for replacement capital and newinvestment, is more readily forthcoming, Zimbabwe may be able to regain,and even improve, its market share. Meanwhile, barter deals have beenmentioned for ferrochrome, one possibly with General Motors Corporation ofthe USA in exchange for a motor assembly plant to be located inZimb%bwe19/. This latter deal is understood to be only at the discussionstage at present, and is dependent largely on the guarantee of smooth andtimely tra:asport arrangements to ship the product to the USA. Such aguarantee could prove difficult, given that Beira cannot accept chrome inbulk. Should sanctions be imposed, Zimbabwe might, therefore, not be ableso quickly and easily to avail of the vacuum left by RSA exports to theUSA.
18/ Some interest has also been expressed in Zimbabwe setting up its ownstainless steel plant.
19/ There has been some indication that barter deals have, in a fewinstances, proved to be expensive, in that the items and equipmentdelivered to Zimbabwe have turned out to be of the wrong type andspecification.

ANNEX 2- 49 Page 2 of 24
Asbestos
46. Production and Marketing: Relative to Canada, RSA and otherexporting countries, Zimbabwe has a strong comparative advantage in theproduction of asbestos. Its reserves of high quality asbestos are quitelarge and mining conditions are favorable. Despite the potential toincrease output, any large increase in production is being held back at themoment by the shortage of lubricants and spare parts due to the foreignexchange difficulties. But, even more serious than this is that the demandfor Zimbabwe's second largest mineral, in terms of foreign exchange earned,continues to be constrained by health-related fears in West Europe andNorth America. Ironically, Zimbabwe produces chrysotile considered lessdangerous to health than other types of asbestos. Although production isin the hands of UK's Turner and Newall, marketing, as is the case with allmining products including iron and steel, is handled by the MMCZ. With thenumerous grades and strains of asbestos that are mined, marketing of thismineral is particularly complex.
47, Exports: Zimbabwe's asbestos exports grew by 3.2 percent peryear on average during the 1970s, but declined by eight percent annuallybetween 1980 and 1986 due to health concerns in OECD countries. There areindications that the base has already been reached in terms of the worldprice for asLestos. Given a contracting world market in asbestos, at best,Zimbabwe's exports may rise by 1.1 percent annually through 1990, but mayfall to only 0.3 percent annual growth thereafter through 1995. In themeantime, for the purpose of getting as much foreign exchange as possibleunder the circumstances, a number of barter deals have been concluded inthe past 18 uvnths2 O/. One of these involves the sale of some 9,000 tonsof asbestos to the Minerals and Metals Trading Corporation of India (MMTC)on a 60 percent barter - 40 percent cash basis. This, and other barterdeals, however, will account for only about 17,000 to 20,000 tons out of atotal production of over 170,000 tons. Being a bulk commodity, shippingarrangements for asbestos to fulfill these deals will certainly become aproblem in the event of sanctions, especially from Beira with its presentoverload and inability to handle such exports.
20/ This is in addition to increased penetration of the Japanese market.

- 50 - ANNEX 25Page 21 of 24
Table 2: Growth Rate of Main Exports(percent)
1966 1966-75 1975-80 1980 1981 1982 1983 1984 1985 1986
AgricultureMeat 53.4 3.9 -20.2 -70.9 -79.9 -7.4 248.0 111.5 -13.6 -70.4Maize -60.2 19.3 -40.5 -71.4 280.2 46.2 41.6 -100.0 n.a. 211.6Coffee n.a. 11.1 1.1 -28.6 76.7 37.7 -1.4 33.3 27.1 -13.1Sugar -60.2 7.9 9.4 -32.2 3.7 28.1 -8.1 4.2 3.3 3.0Tobacco -77.6 47.5 -1.9 16.5 42.5 -33.0 9.6 -1.4 -2.1 -0.5Cotton Lint 175.0 25.7 9.4 9.1 -0.6 -11.8 2.5 12.6 15.6 22.5Tea 120.0 18.1 4.8 -20.5 3.2 12.5 13.9 20.7 2.0 17.8Other 14.5 7.2 40.9 -27.6 -19.6 -54.3 3.6 2.9 101.8 -18.8
Total Agriculture -58.1 11.4 -2.3 -21.0 19.8 -12.9 11.0 -8.7 12.7 8.1
Metals and Minerals
Gold -5.7 -0.4 -9.8 -7.3 -18.3 104.5 -50.3 46.1 9.5 78.6Asbestos -15.2 7.8 -0.3 -3.8 -27.5 -15.1 -4.6 -3.5 2.1 5.9Ferro-Alloys n.s. 65.6 6.6 50.6 -14.3 -17.2 35.1 -15.0 -11.5 14.0Copper 1455.6 11.3 -9.2 -14.7 -21.1 26.8 9.7 -13.7 -18.5 23.3Nickel -66.7 64.0 10.2 3.6 -18.8 2.6 35.0 -30.2 26.5 -23.1Other 194.1 -3.7 -22.5 6.4 -30.4 -14.5 21.8 12.1 -15.2 -14.6
Total Metals and Minerals 31.0 0.3 -5.5 2.5 -19.0 32.8 -8.1 21.5 23.6 39.4
ManufacturesIron and Steel n.a. -8.9 27.2 13.9 -40.6 -1.9 29.1 -35.3 20.6 -6.8Other n.a. -0.5 -8.9 -8.2 4.2 -29.7 11.1 84.2 -7.3 -0.5
Total Manufactures n.a. -2.2 -0.2 0.7 -16.1 -20.8 18.3 32.3 -0.9 -2.3
Domestic Exports -6.0 3.6 -2.8 1.6 -4.0 -13.2 15.5 -2.7 4.8 3.5
a/ Preliminary.
Source: Zimbabwe Monthly Digest of Statistics.

ANNEX 2Page 22 of 24
- 51 -
Table 3: Shares in World Trade of Major Agricultural Exports(percent)
1961 1965 1970 1975 1980 1981 1982 1983 1984 1985 1986
Meat 0.9 11 1.7 1.7 0.4 0.1 0.1 0.2 0.4 0.3 0.1Course Grains 1.9 0.03 0.9 1.6 0.1 0.3 0.5 0.7 0,0 0.3 0.4Coffee - - - 0.1 0.1 0.1 0.2 0.2 0.2 0.3 0.3Cotton Lint n.a. 0.03 0.8 0.9 1.1 1.3 1,1 1.1 1.3 1.7 1.8Sugar 0.1 1.3 0.6 0.7 0.6 0.6 0.7 0.7 0.7 0.7 1.0Tobacco 8.7 12.5 4.0 4.3 6.2 8.1 5,7 6.5 5.6 6.6 6.3
Note: - Signifies negligible share.
Source: World Bank and Zimbabwe Monthly Digest of Statistics.

ANNEX 2
- 52 - Page 23 of 24
Tabla 4: Price Premai for Main Exports a/
1966 1975 1980 1981 1982 1983 1984 1985 1986
AgricultureMeat 0.70 0.87 0.79 1.85 1.57 0.83 0.71 0.58 1.18Maize 0.80 0.82 1.48 1.61 1.38 0.60 - 0.64 0.92Coffee 1.27 1.16 1.04 0.96 0.86 0.91 0.79 0.79 0.84Sugar 1.72 1.09 0.71 1.23 1.68 1.36 2.00 1.90 1.17Tobacco 1.10 1.56 0.99 1.16 1.33 1.17 1.35 1.20 1.36Cotton Lint 0.84 0.80 0.82 0.90 0.92 0.83 0.95 1.03 1.03Tea 0.83 0.65 0.70 0.66 0.57 0.52 0.60 0.95 0.89
Metals/MineralsGold 1.00 1.00 1.00 1.00 1.00 1.00 1.00 1.00 1.00Copper 0.85 1.14 0.78 0.87 0.85 0.84 0.85 1.01 1.00Nickel 0.00 0.88 0.88 0.97 1.03 0.89 0.95 0.90 0.85
a/ Ratio of Zimbabwe's fob export price to international price used by World Bank In Itscommodity analysis.
Source: World Bank Staff Estimates.

ANNEX 2- 53 - Page 24 of 24
Table 5: Relative Price Indices for Exports a/
(1980 - 100)
1966 1975 1980 1981 1982 1983 1984 1985 1986
AgricultureMeat 87.9 77.9 100.0 200.7 160.4 97.8 86,1 77.3 138.7Maize 69.0 77.8 100.0 108.7 75.9 46.1 - 52.3 53.7Coffee 88.4 68.0 100,0 71.9 69.0 76.9 80.9 94.7 122*9Sugar 41.0 160e9 100.0 98.2 65.1 59.7 59.4 51.3 42.5Tobacco 114.4 151.0 100,0 112.8 130.0 119.8 135.6 134.7 138,4Cotton Lint 80.1 84.7 100.0 93.4 81,1 94.7 116,9 108.5 79.6Tea 180.1 126.4 100.0 81.1 66.2 82.1 154,2 161.9 134.7Other 917.71 433.3 100.0 103.8 173.1 157.3 63.3 44.0 43.1Total Agriculture 106.6 113.1 100,0 105,7 98.9 91.0 107.5 99.7 93.8
Metals/MineralsGold 13.9 43.6 100.0 66.6 48.5 46.2 35.6 27.5 31.2Asbestos 47.2 99.1 100.0 115.1 96.7 96.5 97.3 98.1 78.1Ferro-alloys 976.3 83.1 100.0 92.7 96.7 91.1 128.8 191,4 142.0Copper 204.8 121.5 100.0 83.1 69.0 82.5 79.5 113.0 99.7Nickel 0.0 102.4 100.0 96.1 81.0 75.6 90,8 103.2 70.4Other 27.6 27.0 100.0 116.2 117.0 111.1 95.7 93.8 73.3Total Metals/Minerals 31.0 61.6 100.0 90,5 69.3 73.4 66.3 63.6 47.4
ManufacturesIron & Steel 32.5 112.3 100.0 94.1 79.0 73.1 95.0 108.2 115.4Other b/ 83.5 85.5 100.0 91.9 92,5 95.3 90.5 97.9 104.4Total Manufactures 70.4 89.1 100.0 92.6 87,1 85.7 91.5 100,7 106.2
Total Exports 52.9 82.7 100.0 96.8 81.9 81.4 82.9 80.0 66.5
Domestic Exports 65.2 90.5 100.0 101.7 94.5 89.1 101.2 106.1 95.7
8/ The ratio of the export price index to the index of the implicit GDP deflator: anincrease in the index indicates a rise in profitability, other things equal.
b/ This has been adjusted for the export incentive.
Source: World Bank Staff Estimates.

- 54 -
ANNEX 3
Actual and Projected Financesfor the Central Government and Principal Parastatals
Table 1 Central Government: Actual and Projected FinancesTable 2 Central Government: Actual and Projected FinancesTable 3 Central Government: Wage BillTable 4 Central Government: Education ExpendituresTable 5 Summary of Operating Position and Overall Deficit of Parastatals
and Local AuthoritiesTable 6 Grain Marketing Board: Maize OperationsTable 7 Grain Marketing Board: Wheat OperationsTable 8 Grain Marketing Board: Summary of OperationsTable 9 Cold Storage Commission: Summary of OperationsTable 10 Dairy Marketing Board: Summary of OperationsTable 11 Cotton Marketing Board: Summary of OperationsTable 12 National Railways of Zimbabwe: Summary of OperationsTable 13 National Oil Company of Zimbabwe: Summary of OperationsTable 14 Zimbabwe Steel Corporation: Summary of OperationsTable 15 Electricity Supply Commission: Summary of OperationsTable 16 air Zimbabwe Corporation: Summary of Operations
(The source of these tables are the Ministry of Finance, variousparastatals and mission estimates)

Table 1: Central Government; Actual and Projected Finances
(In Z$ Million)
Cootral Go,rewott -19?W3S 1960111 1881182 1982181 1933184 1084185 1185135 198D10? t930191 1891192 1992133 l932194 1994195iacoot Yet 315 9 437 5 638 2 702 0 801 0 902 0 106 6 t351 8 1585.0 1894.1 2223.2 2560.3 2040.4 2281.7 2842.2 4S01.7Castots Duties 22 2 S9 6 140 1 228 a 291 0 321 a 399 6 432 ( 497 e 652 S 828.0 182.6 1175.8 1383.8 I77.2 1910.2taoist Duties 42 3 83 0 130 1 162 0 166 0 234 e 268.7 207.9 3070 399.0 4U4 7 533.3 805.7 090.3 707.0 318.5Salos at 171 1 180.4 280 7 374 0 481 0 405 e 482.4 498.4 530.0 433 4 742.5 859.1 083.2 1124.1 1208.8 1460.5Other loots 10 2 I? 2 IS 3 24 0 24.0 40.2 48.4 53.0 58.5 73.2 80.2 09.5 112.6 123.8 143.3 119.4
total lae 51a7 7 7 1207.4 15300 1743.0 1902 2 2245.1 2637.0 2377.5 3652 6 4343.6 583.8 5317.1 6678.7 765.1 3783.4doatit; Peeoios 113 172 0 120.2 184 0 201 0 228.0 271 5 317 a 492.5 471. 507.0 571.3 783.8 870.0 108l.5 1149.1TOTAt C6 2EVENUIES 974.8 05 6 1333 6 1764 0 1344 0 2M31 2 2157.6 2954.t 3470.6 4121.3 4910.7 5735.1 6080.1 7549.23 651.0 9917.5
oter. Aid 6raits 0 0 S 8 20 8 24 2 55.0 81.1 98.5 102.3 158.0 144.6 156.1 135 S 282.9 21.9 242.6 245.2TOTAL REVEAE AND INT AIl 68RUtt 674 0 59 4 1354 4 17ma 2 2000 9 2212.3 2617 1 3t58 5 3128 0 4269 1 S507.3 5020.9 G883.1 7771.2 a894.2 1i662.8
Salriets and cages 315 8 374.6 473 3 558 5 621 4 581.6 824 6 W97.0 1505.2 1725.0 1985.0 2251.6 2520.3 2842.4 31).4 3597.6Goods and Services 282 9 240 0 280.0 352.0 434 3 430.2 521.5 6.1 773 2 022.7 1108.1 251.6 1622.4 1627.7 1371.8 213.5latgre,t Paygets 70 4 100 2 142.3 200.0 271.2 355 5 423 6 521.4 6S2 0 695 2 640 0 361A. 1867.0 116.3 1311.6 1490.6
Etternal 55 3 90.0 128 0 88 0 128.3 18.4 190 4 134.8 207.5 250.8 321.5 326 0 423.0 402.5 563.1 81.5lsteroal 112 0 142.9 187.2 238.2 326.5 444.5 444.5 531.4 504.2 643.7 804.2 743.4 3.1
Ttansler Pgvgeots 210 7 32) 5 403 a 542 0 647 3 672.9 816.4 32.6 570.3 605.7 72.4 01.6 805.9 1023.2 1)35.5 1265.1Peosioss 75G 0 73.9 I1. 94.3 100.5 114.0 131.8 154.7 178.8 284.6 134.0 216.4 285.4Grants to priate stcools 230 0 279 1 306.5 317 1 436.0 62.0 78.1 92 8 167.3 122 0 140.4 183.4 182.4Otber transfers 228 0 314.3 284.0 335 1 410 1 394.8 334.1 454.0 5)5.5 576.5 644.8 727.7 816.1
1OTA: CS C00lEB7 ERPEUOIT3RES 885 8 1036 3 1299 4 1652 5 1993 9 2140 3 2501 1 3141 0 3501.2 3904 I 4611.4 5265.0 5935.0 H61.) ?352tr.3 8S52.7Subsidies to Pub E)t 84 6 105 7 13t B 156 5 245 5 299 9 313.5 402.0 465.6 339.1 225.4 144.1 105.3 76.1 64.8 44..?
ActcaOlt Dar tAothsit; 29 6 35 7 43.1 t4 5 122 S 135.7 f40 0 Ila 0 2)0.1 125.5 85.7 34.8 7.6 0.0 0.0 0.9Atr 1iabuObe 0 0 9.0 0 0 0 0 0.0 1s 0 12.0 45.0 48.0 177 13.2 0.3 7.4 4.8 5.2 5.3
ailcavs 31 38 0 40.7 28.0 24.0 31 3 50.0 800 100.0 I0 6 42.6 24.7 31.2 26.1 21.2 18.2Z15D D.0 0 0 1o 0 0 0 52 0 108.8 60 0 82.0 180.0 98.3 73.3 55.3 40.2 35.2 26.3 14.6Ot2er 24.0 34.0 44 0 54 0 47.0 4.0 41.6 30.0 7.5 19.0 10 10.0 16.0 10.9 10.0 18.9
TOTAL COO EIP PLUS SUBS 970 4 1142 0 1437.2 1889.0 2238.4 2440.2 2904.1 3552.0 396se. 4207.8 4326.8 5410.1 684).) 6767.2 759,1 8377.4CotUct Sllt653 BEFORE Su8 -211 0 -85.7 34.2 111.5 -49 3 -3.1 -73.5 -184.3 -1.2 t75.7 239.2 469.2 60.4 858.2 )t.3 IM8.5CUOfBET SAVIIEBS AFTtr SUBS -4 6 -191.4 -103 0 -45 0 -285.4 -283.0 -.33.l -50. -496.8 -103.2 73.8 325.0 $55.8 782.1 1061.5 1240A.
CS CAPITAL EtP 79 4 155.8 271 2 427 5 368.0 404.5 401.0 522.7 086.7 871.4 1168.6 1420.4 I7l2.B 2114.9 2456.1 2826.5t60S 54.8 07 3 107 2 191 9 203.7 202.2 221.2 270 1 458.6 580 3 785.2 972.5 12512.6 17.8 1353.2 2252.4ronostfrs 24 5 48. 114.0 235 5 179 3 201.3 179.8 252.6 223.1 22.0 327.4 466.8 060.1 53.4 406.7 574.1
blat es oonilereit1049 I MI9A.6 17T8 4 2236.5 2627.4 2844.6 2305.7 4074J. 4635.5 5)59.2 6003.5 6341.4 7753.9 U A.1 11140.2 11402.0GOotalt CS Deflcit -375 0 -338 4 -354 0 -448 3 -526.5 -832.4 -68.6 -1018.1 -1025.5 -800.1 -928.2 -323.5 -910.7 -11108. -1146.0 -1221.1tEoclodiaq traosltrs) -265.9 -103 0 -123 0 -SO 4 -258.6 -212.2 -284.7 -4155. -483.1 -413.0 -489.0 -513.4 -58..3 -11.3 -82t.0 -047.8
0
rtODi
o .
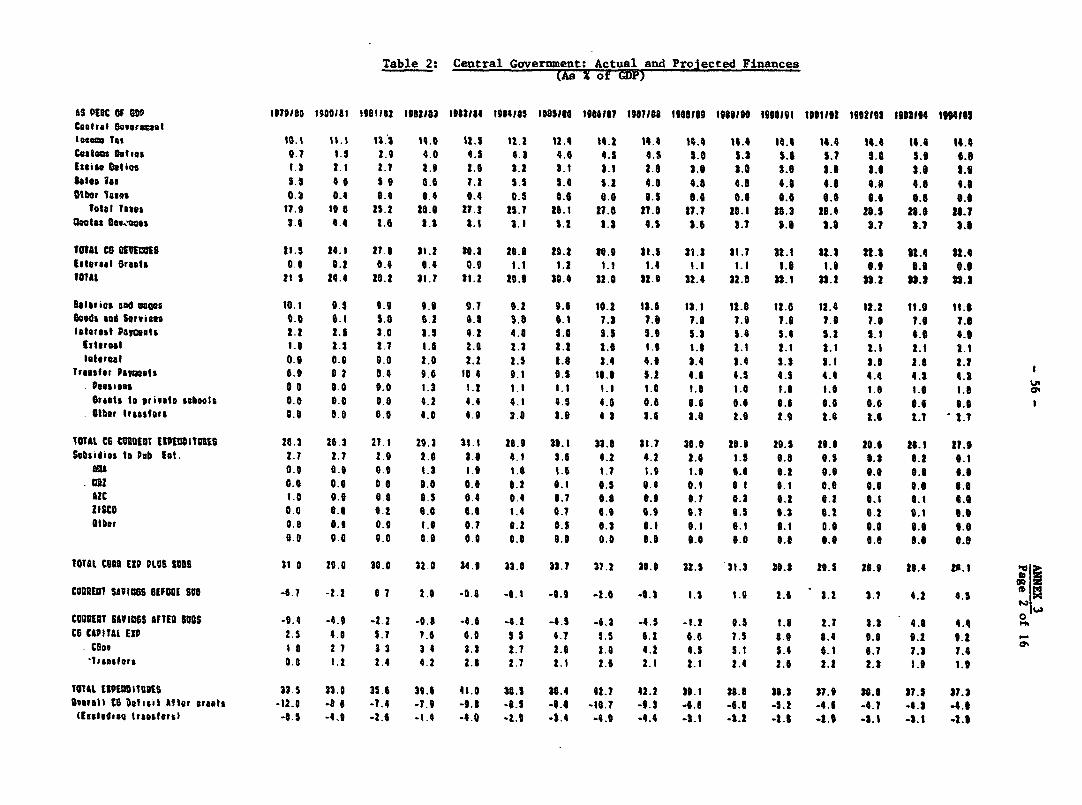
Table 2: Central Covernment: Actual and Projected Finances(As Z of GMP)
AS PtIC OF GOP 1379180 1900131 1311132 1982133 1,33134 1984135 1033530 1038137 IWTIN1 1933330 l939100 1993391 1931942 1912193 1133194 11991l35
CaornIal Soworacoslosome t4t 16.1 11.1 13.3 14.3 3. 12331. 2. 4 14.2 14.4 14.4 14.4 14.4 14.4 14.4 14.4 14.4Cosign Miss, 0.1 1.5 2.9 4.0 4.1 4.3 4.5 4.1 4.5 5.0 1.3 5.6 5.7 5.0 5.9 6.0Issuse Waits 1.3 2.l 2.7 2.9 2.9 3.2 8,1 3.1 2.8 2. 3.0 . 3.0 3.1 3.3 3.3 2.9
sales las 5.5 0 0 5.9 0.0 1.2 5.5 1.0 5.2 4.0 4.8 4.3 4.3 4.3 4.9 4.0 9.8oSb.i Tom, 0.3 0.4 3.0 01.4 0.4 0.1 0.6 0.0 .3. 0.0 0.0 0.0 .6. 6.6 3.6 0.4
total Taves l7. 0 It 3 25.2 20.0 2M. 25.1 2 6.1I 21.0 27.0 27.7 20.1 28.3 23.4 23.5 23.6 28.?
Osota: Uh,,oo 3.3 4.4 2.0 3.3 3.1 3.1 3.2 3.3 4.5 3.6 3.7 3.6 3.6 3.1 3.7 3.6
TOTAL co siwwis II.$ 14.1 27.0 31.2 30.3 26.3 29.2 130.91 It.$ 31.3 31.7 32.1 3 2.3 22.3 32.4 21.4
tisersal Greets 0.0 0.2 0.4 3.4 0.9 1.1 1.2 1.1 1.4 1.1 1.1 1.3 1.3 0.9 0.9 0.0
TOTAL It 5 20.4 25.2 31.7 31.2 20.9 30.4 32.0 32.9 32.6 32.0 33. 33n.2 33.2 33.3 33.3
Suiauiu$ Bad npas 10.1 9.5 3.9 9.9 9I.7 9.2 9.0 10.2 1.1 13. 1 I2.) 12. 6 12.0 12. 2 11. 0 1 11. 6 I0Goods act Sutisias 9.0 6.! 5.8 4.2 0.3 5.0 4.1 7.3 1.3 7.3 7.9 7.0 7.3 7.3 7.6 7.6
lsatesga Paiwat, 2.! 2.1 3.0 2.1 4.2 4.0 1.0 5.5 5.3 5.3 5.4 5.4 5.2 5.1 4.9 4.3
fisereal 1.0 2.3 2.1 1.0 2.0 2.3 2.2 2.0 1.9 1.6 2.1 2.1 2.1 2.1 2.1 2.1
iotrieral 0 3 0.0 0.0 2,0 2.2 2.5 2.0 3.4 4.3 3.4 3.4 3.3 3.1 3.3 2.3 2.7
Troosfor Pamgats 0.9 a 2 0.4 9.4 10.4 9.1 9.5 10.9 5.2 4.6 4.5 4.5 4.4 4.4 4.2 4.3peaa'*as 0 0 0.0 0.0 1.3 1.2 1.1 1.1 1.1 1.0 1.3 1.0 1.0 1.8 1.6 1.0 I.e
Greett to $rivate schools 0.0 0.0 0.0 4.2 4.4 4.1 4.5 4.0 0.3 0.6 0.0 3.6 0.6 8.4 3.4 0.6*Other Irsassfers 0.9 5.0 8.0 0.0 4.0 2.0 3.9 4 3 3.6 3.0 2.9 2.9 2.6 2.1 2.7 3.7
ltOTL CB CUSUCUT fIofUtiTuits 28.3 26.3 M1. 29.3 31.1 28.3 33.1 33.3 31.7 33.0 20.3 29.5 29.9 28.6 23.1 27.9
subsidies to Pub let. 2.7 2.7 2.9 2.0 3.3 4.1 3.0 4.2 4.2 2.0 1.5 3.8 0.5 3.3 9.2 3.1An8 0.5 6.3 0.0 1.3 1.9 1.6 1.4 1.1 1.9 1.0 4.6 0.2 0.3 0.0 0.0 6.3
032 0.3 0.0 0.0 0.0 0.0 0.2 6.1 0.5 0.4 0.1 3 I 0.1 0.6 0.6 3.0 3.0
Ale 1.0 0.9 068 0.5 0.4 0.4 6.1 0.8 0.3 0.7 0.2 0.2 0.2 3.1 3.1 .4.
ZIICo 0.0 0.0 0.2 4.0 0.3 1.4 0.1 0.0 0.9 3.1 3.5 0.3 0.2 0.2 0.1 3.9
Other 0 3 0.3 0.0 1.0 0.7 6.2 0.5 0.3 0.1 3.1 6.1 6.1 0.9 0.0 .0. 4.9
9 0 DI0 0.0 6.0 0.0 0.3 8.0 0.D 3.3 3.0 3.0 0.0 3.4, 0.0 6.6 0.6
TOTAL CUSS tip PLUS SUBSI it0 29.0 10.0 32.0 34.3 33.0 2331 37.2 33.3 32.1 '31.3 30.3 29.5 23.9 28.4 28.1 '"
CUUUEDI 541130S UEFOOK SID -6.7 -2.2 0 7 2.0 -0.41 -0.1 -0.9 -2.0 -0.3 1.5 1.9 2.6 3.2 3.7 4.2 4.5
CUOMAT SAVIVGS AFIElD SOBS -9.4 -4.9 -2.2 -0.8 -4.6 -4.2 -4.5 -6.3 -4.5 -1.2 3.5 1.3 2.1 3.3 4.6 4.4
co COPITAL lIP 2.5 4.0 .1. 7.6 6.0 5 5 4.7 1.5 6.2 0.6 7.5 8.9 81.4 0.6 9.2 9.2COo, IS8 27 3S3 3 4 3. 2. 7 I 2.3 2.0 4.2 4.5 1.1 1.4 6.1 6.7 7.3 7.4
-liansters D'o~0. 1.2 2.4 4.2 2.3 2.7 2.1 2.6 2.1 2.1 2.4 2.6 2.2 2.2 1.3 1.9
TOTAL IIPEA5ITUIIS 33.5 23.0 35.6 33.6 41.0 U3. 36.6 42.7 42.2 33.1 35.8 33.3 37.9, 30.3 37.1 31.3
overal) to oulsili Aflte greets -12.3 -34I -7.4 -. 1.9 -3. -.3 -9.5 0. -10.7 -9.3 -6.3 -6.0 -5.2 -6.6 -4.7 -6.3 -4.0tfcEgsIsos trasslersl -0.5 -4.31 -2.4 .1.4 -4.0 -. 3. -3.4 -4.9 -4.4 -3.1 -3.2 -2.3 -2.9 -3.1 -3.1 .2.6

Table 3: Central Government: Wage Bill(In Z$ Million)
A!E BILL 197s1960 1e6c 19182 1962182 113134 1968185 138599 12161? 1907166 19031 3l 8 19990 19 M191 1931192 1193U3 1V2194 1914995foher of posts so leb OudooItstabliheC 10595.6 1695C.0 22049 5 25241.e 26567.0 2C12.0 29686 e 26446.0 31569.0Otber 49300.6 42065.5 1032.6 55446.0 56476.6 608961.6 6449.0 65602.0 68296.6Tolal 6349S.0 6203S.0 72328.0 80767.e 66245.6 87003.0 92129.0 90464.0 9916.0
bucbar of Posls to seritteEstabli bed 10265.0 t1575.6 1026.3 22185.8 23506.6 23520.9 2390t1. 20631.0 2?750.6 2?500.6 2765.6 26225.? 28578.2 21.S 9254.5 295T7.?ClOut 45608.2 30252.9 46211.2 50099 4 5400.S 55062.5 57322.0 60222.4 62?90.1 6279G 1 62523.9 "327.7 65100.1 65677.4 6664.7 61420.6total 62073.2 56127.6 05497.3 73065.2 78101.4 794652.5 63226.0 6653 5 90244.6 90344.0 91408.5 9256.2 93679.2 94786.6 958.6 07026.6
Chaqne in Publie Ewsloeoet M1istahlatbed t.9 16.4 14.9 0.6 0.2 10.2 2.6 3.5 6. 1.2 1.2 1.2 1.2 1.2 1.2Othet -13.7 10.0 10.1 7.3 2.4 2.5 5.0 4.2 0.0 1.2 1.2 1.2 1.2 1.2 1.2totel -9.4 16.7 1.6 6.9 1.7 6.6 4.2 4.6 6.6 1.2 1.3 1.2 1.2 1.2 1.2
4.9Salaries. aaoo soC alluaoses 42S oilTotal IVit2eoal *sw l,aebors) 215 6 374.6 472.3 556.5 611.4 661.6 624.6 979.0 1103.6 1263.7 1472.2 1696.4 1920.6 2179.1 24?2.4 2865.3Solari onu l,eae,os 0.6 461.5 461.3 5126 501.2 60.6 04.4 714.1 732.2100t1 311.6 374.9 473.2 556.5 421.4 031.4 324.6 579.0 1505.2 1725.3 1359 2251.6 2I29.9 214.4 3213.4 231n.6Ateva;o f(fomisal) 53 7.5 C74.0 225.0 7643.0 7956.4 8579.9 9963.5 11271.5 12216.1 1296.4 16116.1 18262.2 16425.9 22989.4 25731.6 25014.5Aetrae (coal) 5087.5 5927.2 5626.7 5161.0 4791.2 4001.5 4723.6 4775.0 4580.7 458.7 4676.6 4706.4 u44.9 6846.6 5057.4 5156.2Chauaos to IVa Use Bill 4O1lcsrease o don Vape Bill 10.6 26.3 18. t.2 9.7 21.0 16.7 52.8 14.0 1s.1 12.4 12.4 12.4 12.1 12.9Imflalmeg 15.5 12.0 14 0 14.7 12.8 12.2 12.4 12.6 13.0 14.5 12.0 11.6 16.6 10.C 10.6 16.6Real lereatse 0.6 12.3 3.2 -15 -2.6 6.6 4.1 40.3 6.1 2.1 2.4 2.4 2.6 2.1 2.9
Changes to Overage noass l?4s)loleaso to aon Ao ltorago aes 31.2 1.3 5.3 4 1 7.6 15.4 13.3 3.4 14.5 15.2 12.3 12.2 12.2 12.1 12.2lefatlloo 15.5 12.6 14.0 14.7 12.8 12.2 12.4 12.6 13.0 14.5 11.1 11.6 10.0 13.0 16.8 10.0Qout Inoseu 10.6 -S.4 -6.0 -6.1 -4.4 2.6 1.2 -4.6 0.0 2.1 2.2 2.1 2.2 2.1 2.2sage bill as C of 00 10.1 9.5 9.9 9.9 *.7 3.2 9.6 10.2 13.6 13.1 1. 12.6 12.4 12.2 11.9 11.8
C10Mi

I la~~~~~~~~~~
- W C O -oto$to:r------- ---
-- a--C- --- W--- --- a- ---- a --a --P - ---- ---- a ---
a. a-. a a.- -- a a a-..----. -------- a----
- -- - - - - - - - - - - -. . - -; ----
sC~ ~ - a - _r S n -
en a ~ ~ - --- - - - -- ----- - a--- - ---
-. S C - -S '- - - - -
o_ - ----- ---- ----- - -___ --- --
an- -- -- - - -- - - - - - - -- - - - - - - - --- ---
a. . a a - a~~~~~~~~~- a - as. ---- - - - -- -
-a C - - anna~~~~~~~~~ -- - a --- --
- o - a -M- - - - -- - -- -- - -- - -- -a
_ _ - _ - -C _
- a ~ ~ ~ ~ ~- -- - - - -- - - --
-- a.……a-~-- -- - --...
-z aflalailse .d,.
e a~~~ … … … a. *4CC,.. .- 4. . .
X ~~~~* a -- *ooss=so~_1
__ - - -! _'I - - _ - _ _ O____ __ _____-~ _ O- _-
OS: ~~~ __- -_ -. _ a~ _r _ S ,___ ~~ __
xam~~~~~~~~~~~~~~~~~~~~~~~~~~~~~~~~~~~~~~~~~~~~~~a
.. _ _ o__ S__a - a. -a _,~ e _ ___oI_o__o__ww_ci
_~~~.4. a * ~_"_~¢°g_S~!::tX3 5__S -a .4..-da_. ea
a____i *_-_- ____e. -_~ __ s __ _ _ __ _ __aa_ , _ _ __ O _s
_~~~~~ ~ ~ _. _4 -
-_- a___ i -- i_- #.n-.s- -ea.e Ca*a a Auh*S is_ t _-D aaC af _ _.4<00
an -2.i C -_ _. _lC - fl *0o4 N S0SS~_ aae.# __i - a..i ____ __ _ ^_ _ _ - _ * _ __ _ _ ace aa-…
a c$ S _ S 5 l …… °e ea i.. __S …S eaCe-- _ - __O_
.ai*S* Oa-o_ -…c___C 55i.ccec O_ _,O_ _a..e__CO_ _~ _ _ - -
=S=_~~~~~~~~~~~~~~~~ - a '_ _fl_Z aSS C,: 2-X -- fl-a-.__o .5- ea-eS O - a i-_o…c e _ * _ ~_ __ _ _ _ -* eo o s @ @w _* o w _ _c m . , a __ a._ _ o o_ - -w
91~~~~~~~~~~~~~ ~ .° . *4@'a-a-t 2 f C C C ClD

Table 5: Summary of Operating Position and OverallDeficit of Parastatals and Local Authorities
(In Z$ Million)
lle*ailso results -2 IC -?I..14 .167. 12 .261.01 -211.52 -249.45 4166.99 -182.92 -174.9 -12,15 II?.10 226.49 229.6? 272.92 400.06 614.19agriaaltuala br1eotial Lulbaritias in3 7.92 -29.55 -99.29 -127.9? -129.71 -92.12 -191.79 -191.7n -21.-9 -81.99 -26.75 -7.96 28.12 64.44 Ill.5T 172.41Brala flarbatlag Beard -27.71 -9.52 -29.99 4IS 40 -29. 21 -29. 16 -54.99 -114.923 -1 .34 41.46 ..19.62 .14.41 .2.67 9.92 19.71 94.21Colt Itsorage Ceo essiae -14.50 .22.20 -49.26 -65.7 -47.99 435.91 -56.41 -28.69 -19.62 -16.22 .12.21 -11.99 .2.71 9.00 24.22 42.9944irj flar&a1Ie9 Board 12.09 -19.90 -18.99 4-2561 -26.69 -41.27 -47.131 -99.19 -16.22 -27.92 -12.95 -9.21 2. 12 4.15 4.70 1.29tattoo lariatleGO Scald 26.67 232.2 1.79 1.79 2.71 56.92 -11.17 4.22 1.66 1.92 9.12 it."2 20.69 44.51 61.92 09.4
Ostloose aisiwais of ZImbasse (097) -44.10 -52.?9 -19.63 -7 1.24 -651.2 -68.21 -97.29f -199.74 -97.59 -42.92 .16.71 -31.10 -26.07 -21.17 -14.21 -9.14Air Zimbabw Cerseratlee -9.923 0.94 -6424 -16 .28 -10.1 .29.65 -22.27 -28.91 -17.79 -1321? -9.153 -7.26 -4.91 -2.29o -. 1.2 -6.690Atlratalr 6.09 9.99 10s 9.99 0.99 9.9 0.99 6.69 6.00 6.99 .0.9 0.90 9.49 6.99 S." O.99OaI,eeal Oil Cerparetlee of zimkbab I 1.12 1.26 I.491 .J4 0.6? -57.26 -2.990 77.40 H4.16 196.1 126.61 I51.79 167.91 222.18 2111.99 122.71Zimba1ie Steel Cateroeatia. 11106) 0.09 9.90 -64.99 -964.9 -74.9 -56. 20 -61.95 -96.647 -192.14 -99.29 -72.94 -55.2 s 49.19 -15.29 -20.21 -14.92Teorise Seoartimea (Octal.) 6.80 0.99. I.1K1 909 9.99 9.6#0 0.91 9.91 9.90 G."9 9.00 9.90 9.99 .0.9 B." 0.99post sad Telasom. Corsorstise 5.19 2.59o 11.26 12.99 2.20 -2.18 2.51 I10.9 14.26 19.17 16.5 29.54 22.56 24.61 27.36 20.0TeIee.maieatieos Oaeretioas 5." 1.79 12.69 15.29 7.26 4.991 5.51 16.99 II3 11.2 2.94 16.02 16.21 17.65129.94 I1.00 23.76Peait Oaesatieal .9.46 -2.29 -2.26 -2.40 - -4.19 -7.461 -2.90 0.99 2.99 1.44 I.99 6.21 6.74 1.2 1.7 6.32lis*abeo Breadeaaiag corpoartism, 9.09 0.90 0.99 9.99 -0.613 -1.90 -2.69 -1.91 9.99 0.99 0.99 0.99 .0.9 0.99 9.99 9.91Ilaetuiestw 9epsll Ceiis,iee O.99 1.94 6.22 S.9is 27.99 1.19 62.63S 124.12 26.76 57.91 92.92 0. 72 114.69t4 5. 4S6.3t1476.11Nomahwe Elgois c've..Isgt te. 9.09 0.99s 0.9 80.9 -9.51 9.10 0.56 9.61 9.721 9.82 0.93 I 1.91 1.11 .4 2.1 .1.5ke6io4aI 55tt@ Atbetity 0.60 0.00 .0.9 0.91 9.59 0.94 0.61 .71 6.99 9.91 1.02 1.11 1.2$ 1.29 2.92 1.69touta Aotbeuitias 7.56 2.22 11.99 26.52 16.21 1.11S 22.77 251.45129.21 25.07 41.29 47.61 54.12 92.92 1t.16 91.41total e-aeetrl-26.92 -41.59 -731.98 -229.94 492.1, -191.91 -99.01 22.9 -40.42 71.11 1352.29 232.90 262.24 399.48 267.26 92.09
,other* 5.56 2.19 21.26 21.41 2.70 -2.9* 9.70 10.26 11.92 WI.T 2s.99 22.71 26.991 27.66 26.22 22.21
Am9 0.26 -0.59 -1.0 -2.39 -1.09 -0.9 41.9 -2.69 -2.29 -9.71 -6.29 9.66 9.19 9.11 0.6%9 .0.6Gife-Agrieulteral -1.99 -.2.2 -1.09 -2.19 .2.49 2.1 S 2.11 0.29 4.69s 0.69 1.619 2.39 2.5 2.89 1.69 1.69 Total -0.7 -2.911 -2.51 -4.11 .2.29 -1.66 -2.29 -1.69 -1.99 -0.29 9.96 2.29 2.69 1.011 1.91 2.2
059081 06626220 F0 1VP -26J9.711-2.19 -520.29 -41.99 -214.21 417.49 -922.27 -562.21 442.41 -792.18 -491.28 -519.08 -21191.39 -2691.59 -69.96 -999.190A9riseltoral Rkrbetiao Aatbe;tieis (0 -51.14 -64.12 -140.48 -109.26 -159.5? -99. 27 -421.49 -262.27 -2M."1 -297.63 -125".61-9.69 -57.67 -16.12 21.26 -22.92orals flarlietiol Bemr$ -41.12 -22.48 -159.03 -57.1? -62.11 -41.69 -277.41 -11.24 -226.286 -711 4.11 -2129 -4.42 2.72 22.21 68.12 -$7.99Cold start"e ;.MiSasi -20.72 -49.37 420.9 -59.J7 -690.49 -29.91 -46.19 -99.2 11. 75- T -12.171 -431.8 -64.22 -37.91 -29.91 -26.99 -9.7Deaft Marbetiog oard 2.76 -26.24 -29.99 -69.4 -51.91 -49.26 -49.21 -60.79 -28.26 -29.99 -26.26 -2.19 2.96 61.99 1.22 6.1)Cettasi flarkotiegq Board 22.09 27.64 0.41 4.42 -6.72 21.69O -59.29 -26.22 -42.49 -49.62 -44.29 -26.54 -27.29 253.2 1.74 26.4tolat,, Selleaws of Zimbabwe (092 -62.29 -73.10 41.62 -09.59 -78.22 -69.29 -951.46 -229.29 -292.59 -69.42 -49.21 -26.56 -26.26 -24.77 -15.99 4.17
Ai Zimbabwe Corseratlee -22.94 2.92 -29.29 -24.64 -47.79 -69.41 -40.92 -29."9 -67.2 -60.77 -72.92 -79.69 41.62 -99.97 -41.96 -292.67AtIuta,ri 9.99 0.80 0.1 9.99l 6.9 - G.96 9.80 9.99 9.99 0."0 0."9 O."9 9.91 0.99 9.9 9.89Satiosal Oil corpeareties alZimbabw 2 1.22 -12.72 -5.12 _1-25.2 -49.27 :40.99 -42.47 22.99 0.94 -2.22 27.9 48.21 99.92 1IA 21.17 222 22.65Zimbabw Steal Corseraties IZlICO) 1.26 9.92 -27.00 -69.01 -102.69 -52.27 -56.92 -96.92t -94.79 -122.61 -292.69 -299.99 6.96 21.24 44.61 62.71?"finlig esertsmeats astotls) 0.99 0.89 0.06 0.90 9.69 .0.9 0.99 9.991 6.80 9."9 9.99 .0.9 9.119 9.99 6.99 9.99post aea Isloactla. totporstioo 2.29 -9.P0 8.21 2.69 -29.21 -46.69s -62.29 -42.41 -42.66 -591.29 -56.72 .62.96 -69.26 -76.28 -81.69C -92.26Tolemoseaeieatioes Sasratioms 20.11 2W.U 26.42 29.50 21.2 12.95 24.9 26.32 22.91 29.28 29.69 32.94 15. 26 29.98 4.7 99.26plata Operatioma -9.22 -2.99s -1.1 -2.92 -2 72 -6.5$3 -2.47 9.59 3.67 4.29 6.75 5.27 1.80o 6.13 1.42 7.7)
Ziebabwet ovsdgsaaiao Corperatlee 0.00 0.99 9.96 0.00 -214.75 -19.79 -23.12 -22.9? -21.62 -29.22 -331.4 -26.79 -46.46 -64.51 -41.96 -12.81Iileotiuiitp gossip Cocassfoo -22.164 -22.22 -325.62 -259.06 -11.1-0 -24ts.00o -29.2 I? 268.02 76.69 -26.29 -2.04 42.14 22.94 -26.19 -431.01 -496.57?Zimbaske lesieg Oteelopaeat Ce. 9.90 9.09 0.90 1.99 -0.14 -42.62 -4.8.0 -52.69 -59.54 -68.26S -77.644 -95.52 -94.67 -292.87 -221.92 -1221.290IellswoI Water Atborlip 9.20 0.11 0.22 9.7 -. 9.4 -0.64s -9.65 -0.91 -.0.9 6.6?1 -0.06 -9.99 -9.29 -9.22 -9.22 -0.1210.11 Aatberites -9.97? -20.29 -22.923 -26.22 -42.22 -29.21 -41.61 -12.92 -62.94 -79.423 --92. -92.99 -91.27 28? -211.92 -21428.9 'JTtatlseaqeetrl -128.19 -232.901 -210.92 -417.52 -475. 69 -120.2 -400 96 -349.96 -172.523 -499.214 -520.72 -491.27 -292.22 -232.47 -029.25 -8201.40
*olbor, 3.22 -1.34 6.24 2.27? -2.57 -120.22 -122.16 -217.90 -229.060 -2147.77? -166.66 -281.251 -292.90 -224.27 -266.70 -271.27 As S GeVARA 29 2.6 1. 29 11 2.869 2.59s 1.21 4.99 I is 2.49 2.69 0.091 9.St 0.2" 0 19 -9.29% 9.1 ll
Uee-aorieeltassl 3~~~~~~.09 2.49 9.29s 5.5 7.69 7.0% 4.71 2.09 2 49 2.09 7.49 2.09 2.49 I tO 2 49 2.619I*t.I 5~~~~~~~~~~~~.69 S.6 to 21.29 11.2 9.99 9.29 9.59 5.29 5661 S.St 4I.29 2.31 1. 7 2.19 2.216 2.194

Table 6: Grain Marketing Board: Maize Operations(In Z$ Million)
bilas1910180 10601 IIOU ID620 106I6 I416U IS662160 1606 167 1SWIS IMI8B 1"1156 13615t1 1t6110 196212 16516611 13566
1tss 106 tees) 906.26 06661 9616. 1116 SC I1I5.6 656.6 VA. S 1207.81 111l.U2 9.41 imA1.1 6.67 667 SIG? 6Z697.2 1136.14 114.14
1tsert 161.1? 16.22 3011.6 766.1 113.111. 01 2.1M. 04.16 666.66 166.65 366.66 166.66 19.tO 3N6. W . WA.6I_ptlA 16 2.2 664.U1 616.66 1272.06 166e.664 161.11 71.21 M.62 016.41 726.12 A.6 7 "4 7.66 123. 11.61
Bol h isergo- row ttlitse 70.114 52t. 133.01 WAS0 43.66 174. 210. 14 266.7 214.60 21.2" 167.46 W16.4 44.49 6 14 14 106 O 4.15fowl l5.41 132.61 1211.43 117.72 614.14 6.60 M07.? 157.11 112.n 3 M.60 254.1 11 2AS 284.22 m.7 2.4 4172.22easutleh62.0 60.66 137.0 1t,1.42 111.42 174.11 221.61 2.7 227.14 21t1.00 2 l.l 161.114 1.lIt 6.04 41.62 611.2
Awoap Psratsse Sties iltitl 6.16 61.6 126.06 In.1 in2.1t SO2." Om7.1 1M." 11.S1 m.n 7.62 26.7 o1.4" 2.6 .n 469.6
Ows Mt 1111foeol I'.72 16.11 26.64 30.41 so.19 44.21 75. 76.71 70.71 2.4 46.67 66.4 s6.7 t6.11 610.42 1tt1.37
0rsitIOstlsit tells 11) -I.12 4..4 -14.21 -42.16 -7.4 -42.62 -46.26 41.11 -64.76 -26.75 -16.66 -21.06 -16.22 40. 10.16 26.42Orsit Oslistil a1t16q its F1 h sl -1.12 -6.4 -14.21 -4.69 -11.6 -.4. 47.11 41.111 64.17 -26.71 -41.6 -261.0 -61.21 4.00 6.66 2.4lot *riee - UBlIem 654.60 21t.60 621.66 16.66 126.41 616.66 112.66 Wil.6 00.66 161.64 6.1 112.6 111S.U 11.141 121.01 121.29let Dries - Kl1s.o 16.s6 02.2t 94.72 14.2S 11.2t 664.36 12.6 U.7N 1n.27 2.6 2." 46 297.1 21.25 m.7 422.2 471.2Stos t1600 TNO) 6." IS10.1 I l.7 6.7 It2.6 461.66 6425.66 666 11.07 I162.61 Sm.6 6S2.66 t6.62 6126.81162I.12 "2I.61 167.4ftassa t('66t1w.) - 1a1 111.02 114.62 20te.76 1451.66 2.11 611 t.6t 616.66 766.66 146S.6 1666.66 66.6 66.6 6I6.66 16t.66 66." t26.6
- wertt 164.66 61.60 6." 6.6 0.66 266.64 6.6 . 0. 6G 6.66 6.66 S."6 6.6 0.66 6.61 6.66Val"of Stoct (Dill go) 1.14 p3.43 144.22 128.2 11.25 1N.66 let." 176.15 E1. t21.6? 267.6 14.6.1 11.42 361.64 111.61 452.41Faosessil Csll of tol6 6.660 t. 166 61.07 t.1t 6.2 6.16 22.1S 2A.0 6.4 36.62 27.64 21.42 31.2 6.65 32. 41.t2 s.Tolal Ovesbeid Cost D el ilI) 16.51 62.06 2?.76 47.i5 *6.34 26.62 62.61 02.6e16.1 2.1 3.16 0".A 22 16.24 l1l.12 12.7J 116.2 0Fisansil Cost o ft1ut0 la as of Oel 7.S1 Si.m2 2I.6m 2.0n 5 2.2 616 21t .76 1.24 21.10o 44.66 26.16 25.7 1." 6.2 1.67 2.72Stes Ballis 4%)E oertl6eatis 144.61 14.61 92.01 64. 6 0.66 62." 06.12 17.04 77.6? 7t.1? 71.6?7 11.t1 7 111 t1.171 ".?Asoreg Ulalhrukit 116.4 110.214 Itl.64 16.21 t14.66 14.74 ISS.AS16. 6.7 126.7 I 1 2i .2 1n.0? 2.22 61.6 122.6 t3.nflsOttIit Dils. 160.60 66.61 624.12 122.16 66.62 6.66 11I . Is 67.2 166 t.66 I6." 166.66 666.60 IN." I6.6 6." I6."
Seal frise (lOlllitsslglsses g41 puc 76.14. 62.22 164.34 U.6. 46.62 6.46 62.22 6.7 66.50 62.62 ..1 6 I6.6 WA.1 016.11 162.42ltsit 66.66 116.25 96.23 76.05 82.1 6.6 IS.62 60.1' 641.91 6.72 72.41 7.66 "..12 go." 6.6? 64.71e:ssli, 63.66 76.64 6n." 66 6." It.1 62.40 6II." 6 6.6 66.07 M.7 69.26 666. 1462.66 166.071 16T.26 196.62
Persks 66.S 7s.46 6.4 1 S n.6 0.1 94.tt U.6? 73.11 u.H 8.6 7.6 74.61 74.60 4.66 74.Zlliots elsl 1979050 t06l61 6666102 6662162 1661644 t41S 6 16M2 I5 0I7 6t 616 6I60t1 I9N 16656 106112 6662e02 tI60626 t1Sale oils. ftasop) 17.54 62.71 In." 129.621 142.64 174. 11 216.51 2014.1 214.69 212.20 167.46 2"6." 466.46 414.66 1164.6 S17.IS
elgOrt 66.66 12.is t27.43 2 i1.7 6.1U 6.6 67n.77 m 2.2 29.66 24.6 2 m7.6 4.t23 25.N 422.2 67.22Dmatis 62.66 6.66 W S W S2.43 t1.42 174.11 226.61 27.16 22.16 276.6t. 226.11 362.14 42.12 44.6 147.412 6S.U
porass trie 60.10 81.66 126. 121.1 615.16 162.2 167.511 1611.1? 119S.1 26.72 22n. a 20.7 ̀11.47 367.02 211.n 6191.69,regs, satislissltilt 616.4 61.7t 62.00 4.64 60.74 -6.67 16.62 6.22 16.62 62.14 72.41 72.61 62.6t 616.67 1? I.62 17i.s D
Overhed o asts 66.7) 66.66 26." 0.642 20.66 44.26 n.716 76.71 76.76 63.444 6.11I 4.45 e8.76 666.6? 116.4 t31.2t7 a
(St ublti fimasisl oset of atss" 6.60 1.U0 11.67 20.12 6.62 6.* 22.71 20.6 26.64 14.62 17.64 25.42 25.27 26.f6 U." 46.2 jght rse@I. oar toi. -6.6 -7.41 -66.61 -26.2 -11.41 -12.67 -6.66f -1.46 -17.1 -26.60 -60.12 -26.04 -6.66 -6.66 0." 21.69 1
Slint 5of gtratioss got teol is l6 -Sale oil t(us ") r1.54 63.22 164.24 69.02 66.I2 2.40 112.22 611.77 ? 0.16 62.46 6f .11 64.66 l6.61 66.6 669.26 1t6.42 C'
Escort 62.6 168. 11 .2 .01 62.16 1.96 ". 13 16.7 64.97 6.72 12.61 77.?. 76.23 61.0 02.07 04.12Sestic 43.00 16.64 16.6 94.69 16.16 6.4" 101.41 166.65 601.6? 6.67 61.26 16.46 161.69 661.67 11.31 161.62
Pousiso otis 66.10 71.46 02.41 01.29 71.22 . 2.S6 ".s SI.47 72.32 60.46 0.6 74.06 74.68 74.6 74.66 74.61,6iess, selpasslaicl 66.614 t.72 10.66 2.74 11.26 -1.16 9.62 2.01 7.17 64.26 26.42 16.22 21.13 22.22 25." 27.5
Iweibsad oats 11.73 14.35 22.20 26.60 18.10 UJ.71 S.6 2.0 2.76 27.32 2.S6 24.6 22.42 2.43 22.62 U.4tsf stict fleasseill ssi of stocting 6.66 1.10 6l.6 14.67 S.61 2." t6.6 1tt.2t1 16.66 62.66 60.76 6.2 6.2 7. 7.6 7.1?
ist result u riso -1.66 -6.62 -11.4t -17.t I4.66 -26.69 -t16.6 -.2.16 -26.119 ..2.6 -1.54 -1.44 -2.16 4.10 1.66 4.*2

Table 7: Grain Karketing Board: 'Wheat Operations(In ZS Million)
Vk#&I 19791pl isooSll 19111 1162183 1180384 I16456S t11g611 1686587 1617116 166"1 1861161 M9I31 1115192 t"12113 1n1lgi 1914145Stes ('666 tees) 177.H 21t.66 224.00 24. 17 227.64 219.66 246.96 256.69 26t5.4 2#1.0 26.81 316.4 M5.1 351 6 7-is MA.6purchases ('04 teas) IS.66 155." 216.96 241.15 117.66 262.66 2e 2.96 24.316 269.S 316.26 366.16 222.1 342.215 32 215 7M 66."Legal 1116.0 162.7 261.06 212.75 124.09 S1SI 216.66 246.46 2S11.5 2t641 2t4.66 22.? it3." N 216N 2U4 1 2.51topels 6.66 3.96 J7. 26. 26 5I.5. 164. ISt 6. 51." 1376 22.48 21.10 46.21 46.11 6 66U 718 6213.42
tl Prige Zsitoee) 129.61 134.96 156.64 164.64 268.4 272.67 362." 338 .#10 M 335 U6.22 721.6 646.01 *22.011 1i66." 1166.6 1191.22Pe.,hu.s Prie. (Zlitoec) 124.66 131649 d8UU2 161.61 241.62 276.65 209:47 212.32 2216 " 494.9 627.16 721.65 361.4 P74.47 652.76 1641.66iees 124.4 16.0 457 9 2 191.24 224.15 2S5.9 213.63 266.61 4.617 49.65 624.5s7 74.56 614.36 6960.21 137.65 4664.22OlDtl 6.66 6.96 267 ." 106.51 276.44 26.962 2.22 37.17 242.62 441.6 *.5 S 56 466176 727.12 M.63 18.6 656.M2.
Sworbeed cost (11Iteeeless) 11.73 14. 3 22.26 1.76 16.67 ISA47 21.6 2.32 36.61 2.91 SI61 6.91 36.01 36 61 3661 31.61Swerbeed cost 4DIteaol 11 .3 16.16 26.64 U .2 32 .6 28t. 44.U 76.7n 82.42 64t. 1in." S.2 136. 1S4.22 1 4, 5 n -itnPrctfil Ii 126 mill) -2.6? -32.2 -13.41 -13.11 -14.31 -7.4 -71.5 -12 36 -6.51 -5.71 -2.74 -2.54 -.36 4.20 -54.7 4.66Stock V666 teas) I7.0" 6 12.6 123.62 126.14 76512 40.11 I#6 S 2.7.1 16.2 112." 119.35, 126.79 134.36 142.36 1561.96 In6."Value of Stuck (21 Bill$ 21.62 17.74 232.1 24.60 18.49 16?7 36.25 32.21 25.6S 1.72 71.01 63.21 07.67 124.0 142.12 16.32fimlas l sest cf SItlial (2s Bill) 3.219 2.49 2.86 1.69 2.7 2. 7 3.48 4.50 4.41 6.62 6.St 6.21 161.4 11.1 16.42 11.52lsterateiieal prie l("Stlea) 11." 191.96 166.96 9.66 I7.6 16.0 1713.6 161.0 13.6 l1.60 16.6 I76.6 17.6 476.6n 117.6 11 .66lalnOeatismal Prte (RItD1ica .126.3t 127.15 14172 147.32 161.4 231.61 263.63 26647 242.44 U t." 462.22 472.53 116.26 564.26 616.77 674.62Total Owerbead Cost (Hs ill) 2.68 2.19 6.42 6.2 7.41 6.14 10.2 46.16 15.62 6.4 21I.8 21.49 U47.12 56. U 5.4 0.31lmeosla.l Cost of $test as S of Oelrfbad 162.65 n3.45 4.64 26.44 2 1 14.13 31.62 2I.2 26.12 24. 21.6 24.6 22 227 2.n1." 22
laciesto sales (1) 1.64 6.67 S4.54 -2.06 -2.6 12.71 1.17 6.." 6.0 6.66 6.66 6." .0. 9.6 6.66price fall$& Is$vIlosletfchse 67?.1 I. 63.25 6.6 66.27 .7 1 16 7." It." 6 1.66 l1.00 5I5.* 115 I.66 I4s. " 11.61 16.6"salestielteratlaal 1.14 0165.3 110.74 11I.Vt 166.1 11.62 467. 14 It.9" 18.29 17.5 179.43 176.62 111.61 176.22 177.4 1"77.4hPersescllalerntloal " 8. Il.lt 40.3 122.62 119.6 12.6 1.6 66 1.7n 427. 15 5. 15.6 15.6 1m5 S5m 15.6 14.22ibr lmotet. snrglcsless) -12.1 6.43 -2.6 -1.6 -54 1.5 -1U -u.2 2.06 4.6 5.6 19.66 1.66 12.16 42.2 IS."U
01

Table 8: Grain Marketing Board: Summarv of Operations(In Z$ Million)
Sua la of Operli, of1 mm 19791D 0 loleJIt lDsil2 li218t 1903184 1604135 t19iiii 198416? IteliS 1358108 163910 1 69SI9 1901139 16Uu,3 tsnie 1354105I.it: -1.52 -6.04 -14.21 -435s -17. 44 -42.42 -44.21 -81.51 -64.70 -3.15 -19.6 41.n -1. -2.66 16.06 26.41Wbot -2.67 -3.92 -13.49 -13.11 -14.65 -t.6 4.2 5 -13.65 -. $5 -$5.? -3.74 -2.54 -3.20 -4.29 -5. 4? -4.6other -13.57 1.4e -2.66 -1.40 -5.U4 10.55 -1.22 -20.27 2.60 4.00 5.06 1e.0o Ii.00 12.16 13.31 14.64101T1 -171.5 -9.52 -30.e6 -4845 -38.25 -36.14 -54.84 -114.03 -71.34 -41.48 -15.62 -14.43 -2.6? 6.62 18.71 34.21
pefigilSurpluas '% S1 6of G 1* 0oaiza -0.05 -0.15 -0.30 -0.77 -0.27 -0.58 -3.54 -e.35 -0.56 -e.30 -6.13 -e.12 -0.e5 6.00 0.64 O."0Wbeat -40. -0.10 -0.23 -0.23 -0.2) -0.1e -c.69 -6.14 -0.08 -6.04 -0.62 -6.1 -4.32 -6.e2 -6.02 -3.02Other -e43 0.0 -0.05 -e4.0 -0.09 0.14 -3.01 -6.21 .02 .023 6.63 0.04 6.65 e.05 0.65 *05 aTOTAL -0.5e -0.24 -0.04 -1.0I -0.66 -6.53 -0.44 -1.20 -6.65 -0.31 -0.12 -6.63 -0.01 0.03 6.0? e.11
0

Table 9: Cold Storagte Commisin: Summay oprain(In Z$ Mlllion,)
Cold Slottce CeotDIslFO 197s190 1003 i S1 ts1ts9 ts82183 19t3ttt 4tsattss 19851)0t 1U0617 IIII/fl 1001 0 tssita tsgts 1t9O191 1991/92 t9§2193 t9113191 t99t/95
WowE ('00O tool) ItS t't 72 99 93 18 05 O't S 12 83 40 68 9t t5 oe 05 oe so 45 93 86 IT 6e 10e.1 Xt r 21 to .4 113.26
Domestic Macrket tt 03 70Q 17 Bs 25 5 87 68 9 6 B7 90 61 70 15 00 70 eo 75 eo 77 is ll ll U4 49 87 e2 e1.25 941 t
EtDOrt Matrket 11 it Z 12 4 03 9 Ir l? 36 1 51 Sl 20 It of 1s oo is *s 15 91t oT 31 16 so I? n9 17 el 1e 4s
Sale Prtg. t21ttopol 631 32 123 12 103?7t3 1209 t3 11114 13 1472 73 1069 12 23st 13 2177 tO 3301 79 3Slt11 4t 241 65 4?34 20 s24s IS S91l 91 61554 25Ocesticlc Matrkt 421 20 ?82 70 too? 40 11tS 8ti 1490 19 1594 lO Itle 70 2052 oo 2563 07 2s34 tt 1310 22 3U81 01 4e49 11 1Z54.02 4t9§ 42 5319 15
E£ 70rl "tX¢t 75t 14 1027 a4 1709 43 1est 69 1313 92 2e16 se 41!T 30 *sel se 4246 91 5003 13 6225 12 70l9 31 e112 It e50ts 76 11076 16 12sn D5b
Total Sale& of Goal (tS Gill) SS 33 50 0e 96 79 114 U8 t2s 2 139 St 135 80 I?9 It 244 62 291 *5 357 71 413 o0 47g 93 $56.47 Us.4 U 4 If r
Ooetic tJarkl 4r 01 54 02 B9 Of10IO 23 103 21 10B 24 106 is 134 03 1?9.41 220 It 259 49 291 93 342 12 291 15 4U7.06 511 eo
El7Dtt ttciket 8 *2 5 te o Of 13 7S 22 Sl 31 27 29 tl 43 Ot 65 20 7S Sl 99 22 IIS os t3T tl l'cS 31 II1IS U028 Itl
2 Hide &ad ST 9rodlcs-e Iota)l2 tl lD) 9 53 7 42 12 SS 15 11 24 75 25 so la is 28 sl 31 9t 49 71 St 19 65 39 77 97 90.ss t05 03 121 37
Cites 5 9l t so 7 90 9 35 14 65 I? 02 t3 tl5 2t to to Is 3{ 92 41 Z2 ri 1 t ST2I 67 Zs ?S GI toS 1
T411., 2 72 I 65 3 os 4 53 24 re e7 2 es 4 67 a5 I 14 1t S3 to I?7 i2 n7 14.4 U. t 19 t1dea &a $stBottecal e Is o 55 t iS 1 el 2 23 1 82 1 28 1 95 2 73 3 o0 3 go 4 54 5 14 A 20 t 19 8 32
Btoosdatt o 2^ o 43 o *9 o 54 e 61 o se o 47 0 71 1 00 1 21 145 I U6 I is 2 t6 2.62 1 04
3 O}tt{r IsCOD (tR Gill) le OO 3tt cO 11 3t 9 99 15 84 20 07 22 9? S$ 96 28 82 31 70 34 17 aTt 3t 42 It
1OYt8 OSC IocllC E (ZS Gi{ll) 5S IS C' SO 10s 3S 16e 0s 14 t 1 7s 37 14 44 223 46 304 61 37t 33 441 86 509 i $99 60s 6S1 12 78B 83 st2 g2 1
COSTfS rICostl of beltrtan cittlo 71 el, 77 I2 125 *s 157 7s 1t9 30 ISO reo t40 lS 7s 44 l25 67 271 1s 125 25 377 12 432 S4 496 37 SD9 0B bS2 *s
Bell 73 S2 ?7 12 125 4s 129 os 133 4' 131 61 121 sB 152 1S itfs 75 23f s5 2a2 14 327 12 VS 5 4 30 56 *93 63 5t5 96
Catle aidt cafl oo 0| o G0 oco 0 o0 oo ? 7e 35 83 7 99 IS3 so 23 20 20 92 36 41 43 12 so to 57 to dSs tl is 45 is 512 Olthe Costs 6 53 7 47 13 1s to 1D 63 t7 75 60 7B ss B6 91 a ts )113 40 tZlit t44 01 4 15§ 49 176 58 19.53 5l 1t655
saltrles and wtades 16 to 19 go 24 10 27 os 30 38 34 ?2 40 B? 47 22 33 73 se 54 se 16 te 74 86 3
lipterest Pad 6 53 t 47 13 15 t8 tG i2 17 22 30 22 315 lS 11 28 12 21 92 35 75 It 32 42 Is U5 72 5o 93 5s 51olthe o4 TO le to 29 20 ZS ZS 31 412 3s so *o o5 *S 941 st 9 16 eg 61 7e 67.67 T4l s
NotI hoD[JIICt Pt(ICZIIt {Z ,11) *14 so -33 2o o6 75 3 -45 765 -47 60 -35 X33 -54 43 -3S es .19 tl -1B l3 -12 31 -11 toD -2 73 196 24 22 43 8Nett Capita' 9B t5 1:; 0 It ? Zl 2 10B 96 133 43 170 BS Z0B 20 244 13 2S1U7 321 95 167 SG 419 47 571 77
Operallot PDW:Di! *fc t as t Df Ntei Cap tla ERR -27 Bs -20 76 -1I 5t -29 49 -It J2 s to 6 57 o 10 t ?l 12 *7 15 Is ti 9l it 76
(olorotiloca Ptice oV beeft (lOSItote ) l760 oo 2750 oo 2400 oo 2390 oo 2440 eo 2270 eD 2150 Dt 2090 DD 2240 oo t320 oo 2540 DO 2D50 of 2B2s t7 3021 15 3221 06 3446 10zc
toterfaltiolal Price, of beef tl11rtOle1 1825 03 1837 3S 1793 Is ltl2 64 275v 93 32441t 11352193 3tlS os 1109 B0 4l790 80 6e4s 20 7e35 n Btftl 62 9570 s7 iliBi 76 13C60 7t t Pto-Fasittt 0yteof bee paid byl CSC 7flS5ot B36 4G 10s6 5o 1344 go t3sT ?0 155Z 30 l57l oo 1764 40 2029 otb 1302 18 264S 43 300S t7 335116 be 703 51 *ts2 45 *522 AS 49t6 Of tD -tV
Prits gatios i '00r
E1DOtl P1199114IV411110611 DtXCZ tl 16a 99 tB 95 13 7G 9t 47 T7 4 S 15 116 el1 29 SS slls 41 105 it 10) 14 Os 77 90 47 99 24 *l D0 0 9fS4 t
DDT"wsIC Pricel*F w, 34 os 42 60 56s 18 35 Be 34 44 49 14 dte 76 5§17 iT 3 92 it z2 S6 $40 2 32 41134 46 49 43 82 41 26
Domlestic DlirC*/Eipit price tt2 79 t2 82 59 93 7G of It4 V: 70 es 4t 71 t5 t4 lo is IT 73 Is it S2tl 44 9 so 4 6 8 44 23 tl 75°
Poo P,ces¢ 119t8ttI/oass
Stle PrIce of 0ee( 1538 32 T3l Ol s0B 10 Ot2 56 879 18 197 12 Olt 40 1011 19 1079 It 10S1 29 l110 so 1107 t5 1122 69 ll41 2a llSO J8 1179 s1
OciatWtt 52t o0 695 tl 7t4 4e soe 6o so2 20 Sss oo %It0 oo 73 70 94 5l eo 1 9s es 1 495e 11 o 1 oile 161 eB 151 Os 961 It
Eloort TSI (11 1623 31 133t tg i017 Bl MT 23 1081 5 124 lt 3 191ff 12 1620 97 155* 15 1007 oe 1S32 SI 1#2t SO 2DsI 15 21?2 71 23e2 167athri3st ot,ce
sect flttoto' B35 4O 938 l9 1047 31 9t2 (t5 931 17 146 31 S41 Be E50 Ts S53 55 857 32 III 871 16 StS Ot 8t9 06 80? 05 IB 07 891 Ittztilt and ctttle bee e goe o oo e 00 19 *1 21 S8 4 29 1 67 t eS it122 11 ise 12 5e 13 os 13.42 14 20 14.80 IS.43
coieEtld fowlsTotal 6 j3l 6 63 10 24 13 35 38 04 40 55 37 30 36 82 36 B8 37 1 4 37 36 7't 1 n7 to 3B 1 0 31 36 3e 6t
Wallis and Wages 0 as 0 oel a OD 10 93 1198o 12 13 12 13 1 2 87 I3 t2 13 37 1 3 II 1 403 1 4 37 t 4 t is es IS 41'.terest Paid I 53 6 *3 1 024 12 *3 13 SI 19§ to .5 10 l 61 10.55 10 *5 is n5 1e 27 10 I? to es of e toVWt e oe o 00 0 so I 91 12 53 15 tb6 IS 93 13 31 13 31 13.31 13.31 13 3t 13 tl 13.31 13 3t Is 31

Table 10: Dairy Marketing Board: Summary of Operations(In Z$ Million)
DAIRY UARAETISG BOARD 1979180 198019? 1981292 19821631 1831114 t984285 1095186 1981187 18871`88 1918109 1989110 1999101 1991192 1H92193 1993194 1994) 95
TolAt Sales t0,flioa liters elluivaloat) III 20 145 50 1SO 70 t72 50 101 10 1S? 90 202 12 7,26 37 220 90 233 21 233.21 242.97 252 80 252 75 273.01 293 68Itelvd products (milii,, liters) 110 90 120 40 136 70 175 00 150 20 142 20 144 00 149 40 1112 39 153.91 153 31 160.35 106 84 173.41 ISO 16 107.223.ouf,ct prod to gill of porcb gtilt (Inc ct 40 30 20 t0 14 00 3? 50 30 80 45 70 58 9Z Ti lT T8 St 79 30 79 30 82 12 85 96 89.34 92.93 36 46
Soles price C ic per OORCIIASIO liter or kq 23 as 27 la 30 92 72 24 39 47f 43 09 48049 55 39 01.64 73 14 96 31 99 11 109.76 120.76 132.84 145.12Llqai4 products 5? 64 55 41 64 67 TO 97 84 61 10009s 116 09 i29 86 141 75 155.92 I71 51Uaaotactured products 15006 32 03 37 38 44 10 50.50 59 S9 if 14 12.76 90.03 98.04 90.94
1ctal Sales 17$ mill cal 30 10 40 40 46 90 55 01 72 49 62 to 90 42 125 38 142 78 170 58 201 29 240 86 277.53 317 30 362.55 414 52Liquid producti 74605 790 g 96 it 108 IS 130 53 154 03 186 15 214.99 245.80 280.93 321.01liauut.clared progects 7 25 la662 2t677 34613 40 04 47 25 54064 62 54 71.50 II 72 93 41
Our chases13illi0a liters 151 20 140 50 t5O 70 272 50 201 14 IS? 90 202 12 226 37 130 90 233 21 233 21 242 97 212 80 262.75 273.01 263 5ezcooltsll b 15 54 19 95 25 22 30 30 33 43 38 I! 40 96 40 96 40 96 44685 48 44 SI 35 55.97 61 56 67.72 74 40Total Purchase (Zs aillias) 23 So 29 23 36 02 52 41 60 S4 71 63 62 m9 92 72 94 58 104 60 112 97 124 76 141 4 1 61 78 194 89 211 329140? Cost of Parchas fiSgill1) 14 94 20 63 27 96 18 17 23 5? 23 49 25 43 27 32 30.74 34.64 39.49 45.18 St 74Cost of SAJtS (it aulf 5I 7 35 '7 37 89 51 100 96 116 24 118 06 130 02 140 28 135 49 175 12 201 25 230.05 203 00
Oa-r, Overhead CostTotal (ZS Witco.0 17 77 22 22 24 61 29 22 35 86 395$0 43 69 47 18 54 56 52045 71 40 8110o 93 27Pet PUJRCHASED liter (ZcIltter) 10 36 12 27 23 20 24 72 25 84 17 11 197?3 20 23 22 45 24 70 27 17 29 89 32 88
General Ultotseeaet EtptnutsTotal (IS gillios, 6 20 20 50 13 35 IS 55 19 45 21 43 24 78 21 77 30 95 353 4 0 4.50 41.,29 52.911Per PROIICISED liter (ttcliter) 3 53 510t 7 10 7 99 6 59 9 26 10 63 It 46 12274 14.01 IS 41 is 96 toIs 05
OEFICITISORPLOS (I1 gtilloil 12060 -20 00 -16 00 -25 60 -38 60 -45 37 -47 31 -45 18 -36 22 -27 92 -12 95 -0 21 3 53 4 is 4 70 5 28price, and cciS! Zcesttllt UMuute(Sale price 23 88 27 58 30 92 32 24 39 47 43 so 48 59 55 39 81 84 73214 86 31 It912 109.71 120 76 132 84 146.12Cast 25 54 19 15 25 22 39 04 42 72 47 54 49 95 51 35 51.13 55 71 60.15 64 00 69.67 76.59 84 27 92.73Gross retura 8 34 7 63 5 70 -6680 -3 25 -3 94 -126Z 4 04 10 70 17 39 25.11 35.11 40.11 44 17 48.57 S3.30DOqrbe&d tcst 0 00 a t0 0 00 10 30 It227 13 10 14.72 Is 84 17211 18.73 20 23 21.46 24.70 27.17 19.89 32.88Boweel Uaoaq Espeuses 060o 0 00 000o 3 53 500o 7 10 7.99 I5St 9.29 10653 11 48 12.74 24.02 15.41 10.66 18.65MI vrls(eut 8 34 7 63 5 70 -20 64 -21 31 -24 1S -23.67 -20 40 -13 59 -Il 97 -5 55 -0 09 0.40 1.58 1.72 1861
Prices a4d costs in r*al t9iOZifIitSale orsat 23808 24 49 24 01 2189t 23 77 23 43 23 23 23.87 23.119 23695 23 01 25.88 26.86 H6.0 20.06 26.80Cost 15 54 177?2 29 64 20 63 2013S 20 44 19514 IT736 15.36 14 69 24.04 13.41 03 28 13.28 13298 13.21Gross ratters 8 34 6 77 4 44 I 26 3 64 2 99 3 59 6.11 7 63 9 27 to g8 12 47 12.77 12 77 12 77 IZ.77
oserbtei tost 0 00 0 00 0 00 7 08 7 39 7 02 7 02 6.71 5.41 8 13 5 8e 5.86 5.86 5.96 5.85 5 86General lIseag Esgeoses 0 00 0 00 000e 2 40 3 49 389t 3.81 3 64 3 48 3 48 3 33 3.33 3313 3 33 3.33 3.33lot asrplastdefgc,t 8 34 6 77 4 44 -8 14 - 24 -7.5 -7.115 -4 24 -2.07 -0 35 2.79 3.28 3.56 3 58 3.58 3.58 0Cleso Items Oepreaiatias 0 71 0.88 2 03 1 t0 2 03 2 40 3 38 4 26 4 it 5 68 6.42 7.43 8.50 9.72 II It 12 To (
Istertat 2 09 2 39 2 78 3.26 7 26 9.20 10.07 9 82 itis1 12 II 13.54 Is 07 16.91 19.34 22.11 25.25tovestaoat 9 63 It 02 12 83 25 03 IS 28 6 36 5 38 6.76 7 Is 7.44 7.74 8.40 9.09 9 82 10.60 11.45 i.

48 it Is 49 it It It U K 11 CZ LI U It Is It IS CZ te 61 tt tt U a sionitsellU' 11 St It It of It is 24 it k 62 et'O It Ss IL 0 It to 16 iL to 16 go 0 16 91 CL tL 00 0 clit itsi 4'iIt IU It SU 4t tit 00 *61 LI LIZ Si It? 94 ti; 91 III it M 21 ltt It Ott 61 III 00 0 gt 16 VI to 40 0 $Wose 11
18146s to 64 lose 641.1jossti'tt ti'tt O' tt 04 u It It is It go CZ 14 it " St Cs It 41 It it U Cs tt L; it ti It 16 tt (11jilessl 4.1101 pass ms# J86004:644 Ltt CL Ut "'Ott Is tit 99 Lol St cot of Cs It 16 40 141 St 101 Lt Ul It LOI it IC It Lot II oil to III j*4111401) le'l 141163 wso ails
$10161 ' UJII ItOs It 18311dto 00 96'tt ts tt at ot to el It 4 96 1 It I iz t at II- tt It It t it it it 9 tr ti to ot 118335 III140 H 4 Cs 4 Do 0 go 0 Go I co 0 so 0 00 a to $ 41 Cc ti I 00 I co 0 co 0 co 0 sites Jo Mosel 1041014 "I ot lot tt tot U ezi It itt tt H A to cc 01 16'es it tt Lt it zt 11 00 0 so St 0 Is go 6 1426* tolivisceCS 64t to It? 69 tit is 691 41 iti it got 06 So 41 It #9 K 40 $1 41 At Li it 41 It ti ts of St to ot sliessi atiltioge 11044$6 itOt It 991 49 ttl tl 1#1 It Sao It ilt It tot 06 Ki 11 LOI ZI Oil 09 ttt 01 ti 06 $I of to It Cs ot 6t #61103 plas Io "03is titt to 101 tt Ste ts CZA is 149 It tot LI tot U ZAZ St toz U oil tf 141 to #11 94 es 11 to kg 62 Li 9L $$Its
(wesIlle 6zi Jkif m Sto "I do 041 lb 441 00 ask 40 lot 44 04t so got 00 cot lo oil %I itt St Ott to ti ot NI. vt tit 16 16 kt Zs 1%) #I!jd 141140844jo.vit 901 It OIL Of kit Of 119 St 161 it tit ?I tit 16 0I It Si? Li M $0 881 18 IOZ CS t9l It til $1 CZ) It Sti I 011100032) 4041d )VI611244al6latit 04 eel OD 161 so lot 00 tit go 491 40 ltt co zol 40 991 00 got Os ztl 00 $11 00 cot go Ott co tol co tot I 611stI83641 assid 1*081telielai
114 St ti'tt it to ot it to 0 it 6 Z61 It t 11 b ti Ik- to is ti t 64 11 IL I tt tz to iz 1,3'Jac tolitilsto0 of 0 of 0 40'0 00 0 00 0 to 0 Do 0 do 0 to I 44 ct Li S ISOI so no$*$ A%j0kgI 91 I ti't " t 46 I le I it I ts 1. it I OW I ol I is 0 El 0 6; 0 99 0 61 a 681111masoit ts 61 go to 09 tt ot It at it It el it 61 %I it cl It it co 6 to 0 Do 0 to t Si t IL z Iseselif 41144 Is16 041 SI tot es tot it sti ti III tt to If to tt Os to Os 11 tt Lt ot it II of it to zi 0WIlls lzi 11143 colitsese
#4 glit StAtS 59119 10 909 It $91 12 SLE it IGZ ti 099 It JAZ 16 061 It LEI It 91 so St 19 to of H ot 61 ISOllits IZ) 941103 OfIS 14 1163 ltistto tit to $I1, tt'Ztt It Cs* it sit 91 lot St age N tzt St m it 961 tt 191 So lit it tit WE CLI it Ott tt'Oti lesel of) sastqaiod 144163 Paqto LO? to tit to ltt git to oil of it of ot OT tL to Lo is We Is is ct 611 to It 65 It it it 46 ot (61IS18831 063400 goes 40 solid *&*seal
tz 9 ti I is & U I 19 t 61 t 11 $ 0It 61 ik It If it to I to It LI It ol ot 3ES 6% OL Is It 91 A tL it St SI If It ts 8ik $I St It Os 14 16 LI IS Is tt tt Le Cc lssiv pot v
Os Is of tk Oa it co it 60 St go tz el CZ 0as tt et cc to It 40 et 09 et 04 te 49 19 3OS3$ as to to as 00 Os et St 00 it to cc IOs It Os ot go 1; to it es 6c 04 it bo WE (Sellco to 00 is Os 19 of ts 00 co Os tt DC It 1
44 lszt U 124i et tis ot tit Is age it'lot Li 0t It tit tt TH Zs Ott C6 161 )*q Ivillso III so 001 ti Zs 09 Of It It #9 tt Ot It 91 LI so H zt'it at It .0814144ill-socil mlLa to t SL t t ts I 0 1 it I 61 t 66 4 It 4 It I to 4 %I 0 St a #eel belloildSs cot 24,491 vi tit it tot 69 bi it is of IS it'it It Lt U it Is 14 to,o tt I It a it 0 ot 9 ofas collso 1111jeclo,03to Kot le %to at Sol et got oi tit is lot Zs lit 26 ltt St tit Is got is 191 it 0 Slices#to gel to ask of lit St M We'll 61 So It is It St IL ti it of Is tt It WI liselit tit) to feet 98 Us to see U its to tso L6 lot ot at ik Os? to got 91 tit et 201 to Os Ot 28 tt 80 16 U lull 16114313,914i to toll Lt'lis 011#1 GI tto is izt it itt it lit to Ha tt IC? to tit Le 601 91 It zi Go t, it It St (06111se IZI falls Ivillis 91 11,94 of is 81 to tz it Ze'tt 99 St ot'st to St ot tz 91 U ti 0 so ti Si 91 St ti te ti 911% 18414*ldU'll go #9 tt'll 10,00 li'tt to It 61,1z te'ti is U tt U 1$'41 LS'ti co of 161 Lo 6 Is I 041400 lessio�3It tts it lit li'tto of its St lit to OLC H kit H Sol ti tiz U' liz IC Ur 96,111 sliodsoSt pit 00'ttt to tit co tit Li lit le'll? It sit el'sis el'Sit of lot Os ask It M 11321ot'lot It sit es Ott ot lot It lit 14 in St it? ti'ttt it HI 16 tit 19 "I LS'Ul 11 itt tz ati of izi ts lit loll 061143
Sten to see 11642
sloillititoo sales
411 so I It's it's 16 t to I tt I lt'i a t LO'S 10 L it 9 91 t it 9 Is t to z sollooldLL'ott Or Lot st'Kt it 611 "' el? ti III 14,009 19'all ti lit 19'sti Ol'tis 0 tot LI to St ttt it'll St If 441418J3tt't It t S14 0 1 fl't ti t is c If z I$,? it I VI I Li'l It $1 Is c SO'L tl'g positselsOt'Ut St'Gic ts'est ti'tti tt'itt of tti &UR? el'Ul 11,691 tt'ttt 0 #91 Zs tot 0 $11 19 all 04,011 Os Sol to" 191MU'lit 11 I't 64.411 il'Oll It 101 01 141 00449 0 0 0 IL It'IL lt'IS 11 0 tt'gg It 19 *1 tt It IC 181431O' It is Ilt te'tt Of It If 11 IS'll It It LI St 1114Z ti'ti St'll so 0 to'U IL'It st'it to ot 1"41It'49t tt tti U'461 It'ttt "'Lgi il'iti Ol'itt LI'FAI $6'U 44'06 tt'st Cs le It ot "' tg as of 91 ts toll 0081143
level oil SellststtM tattol Mrot isitut 1610441. "IMI UMN 1111141 tollift ooit"i stinst tittell C111141 tolless tolisol UNM OIM niij$M 001103
(Useo-110-10 lo Ai P'N"'WW7.1"nwN .. mu

.able 12- National Railways of Zimbabwe: Summnary of Operations'In Z$ Million)
tAitt Al0^ RItLWAYSt OF ZtIt8*ArW 19?tfoo lt6010t 1981182 1e982163 1983t84 1se4El8s 1ees318o et98618 198s88J"a 18 Ist t Os ioto 10s01s1 1e2112 1§9211" 1093114 n119s12
InDcomet
ltet lOcaDe tile ittes B064 6311 6tsQ o2es 04t2 6202 osta 5230 $537 5530 s7e7, s7ot 5751 s31e s381B $940$agosig coBt[t ct losa as -68tt -`TS0 -962 -1ess 3t822 32437 34120 44731 32087 70532 71ss3 10970 98t?19 108t372 111542 l1ifllTotal frltgt fescueit (ll ol(lioo) -4 i9 -5 2a -e 02 -0 91 7I0 t6 207 30 22e 33 23tl 9$ 2rs S7 JOD 53 454 07 Vcf. la $Ss tts 02e If ?t e2 783.12V(t$$@"tirsPassengers crttred toillit:3) O go Iis6 1 01 2 as 2 2t 2 47 2 70 1 is 2 20 2 17 2 34 2 14 2 37 2 so 2.4. 2 U4Ifille analog kilout trts (milion) 19 19 17 go 17 5t is 6 ti oI la 18 oo IS 3e lt tt 14 09 15 47 IS 04 Is 93 Is 02 1o 25 10 43 1 el1htsesonetrstfirvt eBttlFt tot 5 to a8 1 0 3e 1o gt 11: t0 13 Go 14 71 14 71 14 71 14 71 14 71 14 71 14 71 14.1 14.t1 14 71ttDorto par °^sseogor 3 el 4 07 t 64 3t 1`4 6 12 S go 61 it is tt .lt 9.29 1o so tl.35 t2 12 14 IC 15.51 17 astelst oesselote locamitt (Zl itbilloo) a O 00 1 0 °t O at 01 13 so 14 ol 17 E2 15 42 17 t9 21 13 2t GI tt 22 30 32 33 og 17.45 41 STntlttellgtost 4 112 52 6t 19 7 09 7 11 8 95 .°24 to 41 11 tt 13 J7 13 22 t6 I9 t 185 20 44 22.40 t4 73*otrt locoutt Dtail Strr tl1 oill) 0 13 0i 05 o7 o 1i 231 14 231 13 250 79 2ss 7? 309 22 425 16 493 89 5s1 44 014.45 6it9 oe 762 e6 3sQ U2
Erorted tttresop. rw)tt Eliprad per trato eaqioQ k(a 0 07 7 49 6 73 9 2? ID 07 to 76 It 83 is St 17.3 1 o5g3 Zi so 24 21 to o3 29 21 32,03 3S Itlet&[ EtD{te Ga.il Serv 1 t l ) DR0 o o0 oo o0 oo o OQ 3 96 124 21 217 24 ZZT 59 260 s5 302 07 347 42 31¢6 52 42 39 4 74 10 526 22 sa3.23
OOQrsIIl SOrOIrstOoftelt tiUl Seri (ZS *oil# e 13 0i15 0 17 o 19 I? a3 35 75 33 5s 32 Ot Z 40 I 122 31 145 47 164 *2 loo oo 209 8D 230 `14 266.1)tl2*4d 0010o Services
Itiloowtres rag tooo*s) 4?13 00 5t17 00 5303 oo 518800 o 5002 oo 3752 oo 3045 so 38J2 33 300B i 1 595 90 4e33 St 4111 Of 4te1.t7 4194 It0 43T,07 44 ^3.0elotcrae Der kwrel oo 5t 00 1957 oo 11?2 oo 132t oo 1440 12 1563 7e t§se U8 1926 40 2224.es 2547 6t 2578186131195 47 351S t2 3t65 g2 4253.18 46?8.49Total taotem fteo road seri ces (ZS t rzIloo) 3 to 50 Zo 22 S09 ee 21 s 837 7 05 ? 30 a el o00 et 1 61 13 It 14.1` 16 56 1818S 2e BsEtond.ture per toa rolt 018 00 It$ 0 UO 00 142oo 0it 00 1619 33 2002 67 2231 21 2534 S? 2844 40 3279 T4 3704 1o 4112 78 4525.1% 4977 47 341`3 44 6122.exTotal ispta*ditere (Zi attilGoo) 5 13 5 7? 0f 47 7 *1 a *o 7 51 t e7 I ?I1 i 104 12 97 14 25 16 04 19.ol 21 32 13 it 14, eOperating SurplusDtesficit load Seri llf roil$ -1 15 -O 47 -O 25 -0 32 - le1 -I 05 -t 03 -2 t3 -2 t? -2 to -1 34 -t.?8 -4 24 -4 76 -5 34 -5 ee
a) Oltboe ocaue-Itat froma properties (ZS rxtlil I 5Z I96 2 II 2 ol 3 35 3 52 3aTo 4 23 4 is s 40 6 If I S? 7 54 0 31 0 15 10. UOther fspood lere Q1 aill) 44 70 54 43 O1 89 73 73 9$ 85 10t 05 123 §U3 134 ?2 148.114 18?.3 st8 0ex Of 11 213 45 134 11 Z54 TO tr .Xl
*daIllstratixQ god General 41 *? It 77 sa os o6 32 13 To 57 TO 7t 17 60 02 It 46 113 092 3 SIB it142 15 157 13 172 15 1tt 13 200 t4toterest 3 28 2 5$ 3 83 7 41 32 03 39 17 45 50 *§ 70 4109 53.a2 55 36 $4.35 ,30 32 61.1 7 64.95 70 46
DonXe.l | 33 67 34.11 35 1s 34 11 31 91 30 61 3e0l $I ale tI 1lotereatioozt 13 03 14 Is I? 86 21 25 14 *5 2? St 30 26 33.84 19.65
roTOL SUOeLUSIDEFICIT tZi *til) -44 10 -52 ?6 -50 43 -71 24 -43 12 -60 3 3 -07 1e -100 74 -97 St -42 62 -34 73 -31 It -25 G7 21 I? -14 23 -154Otprecatioo (ZS e)lliteDI O 06 9o it 11 5 1 151 15 42 14 TS 13 S? ISt5 *s 9.0o 1121 37 52 tl 65 45 11 seA SSAS 4 6t lillerestteent (ZI oileD}p 10 sS# 30 it 35l ? 41 IT 48 oo t4 ?I it 74 43 00 35 Of 39.oo 43 oo 4T of so Go 54 co s7 se 1 tolcereast to frei4bt -3 69 -5 14 a so I go -3 20 5g99 -20 *4 2 03 3 t7 3 as 04 09 I r1; I e4 I C6 1l1loat and sEcaod in roll torus 12t9001o
Fagg=r ar toJ cot too" 8 0l31 i -708 54 -1`49 32 -745 I? 19705 n? 17933 04 16Z9?JT 1 soe3 It 19531 0o 230n8.28 2ies TO 13221 20 23310 ST 1333413 l344e 42 23ses 91locove oar oasstoeer 3 el 3 ot 3 GI 2 sr 3 69 J 2t 1 .04 3 04 3 o t3 04 3 e4 3 e4 3.0 304 3 o4 3 t 0D :Espeodit trt per Iraia *o5toeke t3 C T S6 ts e se to tf t2 5 77 35t5 6 to 6 sz t 41 6.3t t 34 6.32 630 6 iS 6 21 co )*cm ca tot ro trott service) 845 0o 93s t3 0l12 67 90t Bfl se7 65 838f 64 ee2 oe e16 25 Of34 31 034 31 0134 31 03t 31 ff3 31 tl34.31 It3431 6f4.31 t
Espe.d atr. ver to rou frDEd fterical 1es 04 !021 33 I 904 Ot 9 It 1411 1e 1B 4?4 07 Uo74 e7 1074 07 117`4 0t17 4 Io7 4 07 o o 1074 07 tO74.e7 11e741 104 07 1 e77^4 1 71t.01oTaei Espaeaditurc (total) 44 70f B 34 48 12 50 07 I1 To 57 3e st 01 57 e3 $5JO7 54.06 $3 34 52 o1 s1 14 $e62 40 St 49.8 Q
Staff 1971,5 20328t ole1s 19370 itaig 1e551 19t51 19651 19454 ls26e ts9fs7 lt877 It6fft 11501 1t316 1d316fTotal waor3 tfli (IS olill 16 $1 tlX 10 f34 ?I 1s I? 14s n2 152 62 174.49 180.0Q 2110.t I4I.8 m7` 21 3e1 33 331.42 3f3s 36 402 u6 4 11. 3S4;srj19qr per staff 41t1 24 5113 t6 6i71 6Z 7492 90 r653 se r7e6 47 0IfX35 94 q8 30 Ie7ss 55 12148 15 143294 o15963 e7 17?3 13 19?48 31 219730 02 42t6 32
lots, vaal bitl tlittO lScitit 16 53 104 9t 104 90 9t t5 S? ?5 el as 83 l5 7t t4 7i3 . 79 15 TO79 II 711 67 It5 67 71 a4 Jt 95 79.33Ret. *t# avrage tSf1 24 5113 1zf FIs6 92 5o0f3 42 450tf t 4165 31 4236 49 4011 88 4e4s 52 410.34 4151 58 416r xfO 4200 42 4161 23 431f- 2n 4330 93f1ltSf bill as t of loful #Deadt 1#3 92 tod 33 ti7 cof t7 04 so 56 40 <2 st o 50 soe se oo so oel so 00 go to so of so ee 500 ee se-ee

Table 13: .National Oil Companv of Zimbabwe: INOCZIM): Summary of Operations
(In Z$ Million)
6i.i?IAt OIL :OgPAaf Of ZIOASOVE R0CllN; 1t79I80 1i93018 1981182 t9S21g3 1913184 1984105 1985186 l9811f? 1987187 1988109 1989190 t900/9I 1991102 I192193 1193394 194195Sales tofula rm.1 at tttees) 235 80 236 30 257 00 261 00 273.12 285 40 296 81 309 02 321 52 334.19 347 22 360.80Sales alsiuto tslul of baleeh) 148 149 1 52 I t 1 ?2 1 79 18 7 1 94 2.0 2 t10 2 i8 2 27S4Iee (Zs *'ilsctl 255 07 269 32 348 10 398 50 490.44 591 22 708 17 56U.79 tW43.02 1251.88 t501.9? 1303.37Colt [Zs a,tIlan) 267 10 382 90 404 00 373 20 459 30 553 69 683 21 813.64 976 81 1172 40 1405.61 1666.80
lsWor) Coat$ 000 0 0o 0c0 0 00 191 00 250 70 286 50 233 00 268.75 345 8t 414 06 597 98 680.85 731.98 ?87.19 1054.42
G9t8q%sg Cost Si 1t 89 50 117 00 121 70 140 15 167 68 191 53 227 74 260.84 293.80 340.59 389.30
1o041lct Costs 27 00 42 70 20 50 1 50 ll 30 25 49 29.94 34.62 39.62 45.30 51.77 59.18
Of bi;tb 0Doreclat'oo (23 sCtIou9 D 00 0 00 0 o 0 00 0 0o 0 05 0 08 0 ? 0 08o 009 0 11 0.13 0 5 5.17 0.A9 0.22
otIereost z2 Ci onl) 4 8o 5 50 640 7 49 8 59 11 48 14 48 11 29 1I 40 21.07 23 S 26 43 29 *7 31 9 35.18 38.70
:Iati iat ls d 0 00 0 00 000 o ' DO 30 70 32 80 40 30 10 00 53 00 68 63 818 5 100 63 120.81 t41 70 173.52 208.23Olstr locoloo I 12 1 l8 1 49 1 74 2 0o 3 40 2 20 2 10 060 0 *0 0 00 0 00 0.00 0 0o 0.00 0.o0
ttot Proltilots 1 12 1 28 A 49 1 74 0 67 -57 38 -13 40 77 40 84 14 106 17 121 81 155 78 187 03 223.1S 288 6t 322.731oeoslgeot. - S1oa 150c0ist 20 00 3000 404 9 -8 37 28 03 37 79 507 3 8.09 41 50 54.66 59 16 108 19 45.97 100.29
. Fttatta 00 O 0 co 0 00 0 0$ o 55 004 0 1t 16 Of 265 5 41 30 47 60 53 1I 29.00 0 00 e.00 0.60
;o0al FicatcItI R9e4a.,oeast -40 37 -49 05 -41.53 22 93 656 -1 22 3? 71 48.03 98.817 15.0O 222.91 222.43steroat0ona! 01 price (lSlbatrell 30 50 34 S0 31 00 28 10 t . so 26 70 13 60 16 00 18 0o 18 0o Is 00 19 00 20.07 21 20 22 40 23.84
!oeWcalo-nal oi1 price (Iliborret) 20 17 22 83 22 41 24 8t 31 00 38 16 22 30 28 6B 32 22 37 17 42.04 50 45 58 21 s6.22 77.61 89.08
Sale Irce ert tlre (71 I co 1 22 1 35 1 49 10O 2 07 2 39 2 of 3.24 3.75 4.33 s.00Sale Price iot 1dm. fin I979:8C 2t 0 65 066 0 65 0 63 067 0 8B 0 69 0.73 0 77 0.11 0.85 0.89
Ie t.
0

rable 14: Zimbabwe Steel Corporation (ZISCO): Sunmnary of Operations(In Z$ Million)
Z101A6W STEEL COltOR9T007 (ZlSCC1 079it80. 198or83 19/s';2 t982183 1983114 1984183 1985186 1980187 19671tS 1988189 t989190 1990091 199tl02 IID2193 1993194 1994195Sales (26 0l0iot0) 93 00 t06 00 1)3 00 137.34 157 t6 171 e2 191 52 239.97 205.92 352.64 307.90 469.30 539.77 593.74CoOt of Salos (t 2 Swil,a, 94 0o ttI co I32 00 9t 00 95 33 114 01 121 79 140 29 158.26 196.30 215.03 261.28 300.47 313.99Gtoss Prof.fttosses (iS aslloa 7 00 0 co -l 0o -12 00 -18 00 41 34 62 33 57 Cl 59 13 98.68 126 78 IS1.34 171.97 208.09 2U930 2?7.71Ocerocad Costs 12t *ill,oal 44 00 54 00 57 00 19 60 124.28 153 48 171 88 186 96 206 70 211.11 221.18 243.21 217.61 294.37other iscatoX (Zs 0a11t0 1g00 200 I 00 -2 00 0.00 00 9.00 0.00 0.00 0.09 0.09 3.09 0.09 0.00ProfilhOoftclt (Zt a lio,) a go0 00 -44 00 -64 00 -74 00 -S0 25 -01.95 -96 47 -102.14 -56.28 -73.94 -55.30 -49 12 -35.120 -2.31 -14.41
0awa Ihr IZi I)Iaioo )D�orecsattoo 9 7I 11 27 13 00 13 00 12 00 14 22 8.96 20.09 11 30 13 17 17.49 29.50 50.16 60.97 73.9 89.02gtto0r9ct to 52 12 03 14 00 1 00 29 00 20 32 22.03 19 95 27.92 19.40 31.45 55.36 70.60 75.52 77.44 16.13lavesIcest 4 51 5 16 6 0O i 00 40 00 1 32 1 93 9.15 3 14 37 34 138.14 162.25 0.53 0.53 6.76 6.76Sale to fes! prices 125 05 125 10 III 25 122.00 130.72 124 80 124.80 138 69 244.00 120.00 160.00 17m.00 184.06 184.08Coal to feal *rieastar, ble 127 21 139 26 137 09 89 47 76 04 83 20 79 36 79 04 80.18 89.07 69.07 97.0? 101.43 17.31III toortbeodl 59 54 63 73 59 65 83.51 203.04 112.00 112.00 106.40 101O.0 09.03 91.22 91.22 91.22 91.2,1a41u ot prodotlioa 98 32 97 73 92 39 100 00 210.00 201.04 102 W9 102 17 103.26 103 60 104 85 205.39 106.85 267.22Expert 78 66 76 19 73 92 9o e0 80.00 80.00 80 00 80.00 e0.80 80.00 00.00 80.00 60.00 80.09ounust'c 29 66 19 55 le 48 20 00 21 00 22 05 23 15 24.31 25.53 27.06 28.69 30.40 32.23 34.18
Cost per cost of prodoot,oO o 'atlable 172 15 104 30 121 46 83.39 75 26 82 34 77 73 78.14 77 01 85.92 64.95 03.04 9N.10 90.064I.: (otorbedi 60 56 85 21 .4 57 83 51 (02.02 110 65 109.71 104.14 0767 i2.64 87.01 86 4 85.59 85.17
0%

Table 15: Electricity Supply Commission(In Z$ Million)
ElE;TO CITY SoPLLY C05tSStt t1979180 191ot81 :981182 1982183 1983lt4 1984385 1985186 1986187 1987188 1988189 1989190 1990191 1191192 1992193 1093194 1094195
tSinct 1938 Z1SA)
Eloctt citv Saits IZ5 atltiol) 70 04 79 71 1"2 00 117 11 191 25 392 22 412 25 106 91 470.82 530 4* 583 28 849.24 872 01 158.00 117.91
OtLIC1Iaa@OUs Qt,#a 778 DIlioan' 241 2 90 3 00 5 59 7 31 0 e1 0 82 0.81 0.94 1 07 1.17 1.30 1.34 1.53 1.15
Iota! tUa, t Q8 mil3i0l 0 tC 7: 45 S2 60 115 00 192 76 198 55 393 03 *13 08 407 72 471 76 537 50 584 45 50 14 673.35 759.59 879.60
0oer&tioa Costs '21 oiu aou 67 41 78 38 110 00 16508 195 46 259 12 214 48 288 14 340 84 34 61 418.f6 472 83 538.98 615.02 764.12
let 2peratioq lrocigc (21 collson) O 00 5 04 4 23 5 00 27 69 3 10 133 It 18 80 121 53 131 12 152 95 165 49 I7?.9t 134 37 153 38 175.54
Gtbtr Et3eoaes and Ioeautes 0 O 0 00 G 00 0 00 0 00 0 00 7' 28 74 08 82.81 73 27 7t 13 65.77 63 23 77 23 88.27 100.t9
Net Iacono 0 0C 504 4 23 5 00 7 69 3 ¶0 62 63 124 52 38 74 57 t5 61 82 09 72 114 68 57 14 65.3$ 74.65
non; !teas 131 atHi ogOo;rec-atio 5 S4 6 34 7 0t 00 1' 6T 24 32 71 08 70 75 78 e9 97 54 105 19 116 33 128.16 145 41 146 48 lit 19
'elIa-ves! 6 01 6 87 8 t8 10 00 080 1 7 5.1 71 76 36 81 17 69 62 63 78 57.84 52.28 63.18 70.27 77 20
;eVesta3luts38 10 4359 12690 S 7?3 CO 861 t5 1(' 0 '53 g8 6f 68 3280 $62 92 181 40 162 77 209 07 20919 842.70 645.50
0nea t 4vrpIsifDeftwc -30 tO -38 S5 -:27 67 -258 00 -124 17 -t73 92 -91 35 59 84 5 94 -105 07 -99 59 -63 05 -94.39 -152 75 -577 39 -570.85
2ES4 Cw alt 525 46 502 53 570 81 C 2 26 690 18 771 85 857 70 953 42 1029 83 1131 52 1228 42 1337.35
S pro.tabli' Etg Egg E0e ERR 5 27 0 62 23 46 32 44 17 i2 15 i9 17 83 17 36 17 28 11 to 12.50 13.12
It I
o
ON

Table 16: Air Zirbabwe Corporation: Sunmary of Operations(In Z$ Mill3ion)
'ag 7ro31Dwt CPC9Ob0tC13 97901D 1980':s' 190,82 1982:83 9103100 '984:05 t9DS1?36 '9834t37 ¶087:80 t;u,ooioo:o I986'9 1 go7 1991182 t§9219 1993194 ¶994:85Prodcticl 0
T)aa "O ea - Ieorf t'9:6 150l1 765 I I'70O 16430 10649 15082 14 40 17000 JT00lO lOOO 17O0 ?O00 17000 11,000 1700
Ava.lable Cia Dl: v - Toroe IDs SCVCO 4 860 75480 100025 '14780 1'of37 120372 1?2657 122501 110037 t13037 116037 11063? 7 11637 t16137 110037 1111370al0alol PSiSRAqw C4Dciltt loco's 802?70 701054 802800 1021296 941534 993129 1009093 1002011 10028I1 10021 t lO2SII 1021 1002 811 t10021 1002011 1002111
!r41fic stat''0 C!
5.sstacr,s C4rr,e8 3S517! 402'4`? 44741t W549 430135 451807 t55?05 515900 491590 491061 491061 491061 491061 4M1OO1 40106t 401061
Oasseouors a- ed -pl. ts -(DCs' )5BG405 431309 5430C5 515110 543376 650503 650950 677089 5:0342 620342 020342 620342 626142 620342 620342 620342Daoetgot .oad ft:lo - 0 64 61 61 50 58 56 t5 68 02 02 02 0l 62 62 62 62
imtoatl Lee# CifroO - tovo;e la C1000' 24290 42217 55426 5425 lt?77 68000 68'55 p'5to " 0507 68534 60534 68150 36 653 4 1165341 I0534
Cav1lI Load F0ctor 50 5 5sol6 I s 5' ! 55 50 59 59 59 50 5S 59 590u,ecaq 1Zs a,''
Pasener 't 4*0 0! *4 51 62 79 t8 102 111 12I 141 ISO II let01a¢e s 2 4 4 4 4 5 5 0 7 8 9 10 11 12 It
C'tQo 5 7 7 5 8 7 14 13 14 1I i8 19 21 24 26 2t
TOTAt 27 41 50 50 50 42 81 9? 108 125 141 157 173 IS0 209 230ttc;ert (ueratgl
cOscoager pter *,sce;tr1l 57 34 70 30 08 85 97 65 102 59 113 08 130 17 153 13 179 16 201 72 235 8t 201 80 267 90 311 78 340 46 303.31
Cargo (Per 1O0O s.tried toaeto Osi 52 24 50 33 03 29 70 55 63 50 54 03 7o 93 74 05 91 09 104.29 11? 85 13081 143.00 15829 1t?4.11 101.53CtWtr t(Pr Pasvmoqerl 13 IT iS B5 15 9 s t7 t2 t? 86 14 03 30 75 24 43 27 61 31.61 35 72 9.615 43.6 47.8 52.76 58 05TOTAL (Per Posseaurit 74 09 101 00 12 05 123 48 129 16 137 65 177 54 I87 20 218 94 254.89 288.03 3109t1 3516B 38t6.15 425.54 469.0t
Total Eipooditeuro 48 tlgl,onl 27 13 40 02 54 83 72 58 14 13 91 65 103 10 125 20 125 33 130 34 150.79 164.30 177.51 595326 214.18 216.26
Avortgt Euoodmlfore0Dc pIssewU0# 74 17 tOO 97 122 56 159 20 172 34 202 82 220 44 242 80 t54 94 281711 30? 06 334.70 361.47 3117.2 437.38 088.12per door Fltge 2276 79 240 08 3122 Z5 4006 54 AM10 83 5504 84 0035.01 5803 79 7372 08 S137 3 8809.75 O9668.03 1044147 11405.62 12634.18 11397.60
RE? PSOTITILOSS -0 03 0 04 -4 43 -16 28 -tI 58 -29 45 -22.27 -24 65 -17 70 -13.17 -9 3S -7 36 -4.81 -5.20 -S.82 -0.40
Qterestataoo I 29 1 47 t 71 2 01 2 02 7 '5 2 22 3 19 4 01 5 35 e.08 4t 10.15 12.32 14.98 1t.3lola,.,, 303 4 *5 4 83 5 04 6 T0 7 t0 I n1 '- 11 11 12 5e 14 38 1 25 18 04 19.84 21.02 24 01 20 41
Revenean d Coolto1 rg&l torust
ossioeqrr toot pussuug2ut 57 34 09 54 0l 91 40 32 01 84 00 d5 44 97 44 88 67.11 08.35 18.35 08.35 0835 48.35 08 35 68.35Coato (pot tO0D aart;eG tlon IimI 52 24 50 03 49 29 47 91 38 29 34 e0 33 84 31 38 34 IS 34 15 34.15 14.15 34.15 34.15 34.15 34.15Otltr (par Ueviogett 13 27 14 9b 12 43 it 83 10 76 7 95 14 07 10 35 10 35 10.35 10.35 II 35 10.35 10.35 18.35 10.35TOTAL (Por Das,t; ottl T4 09 89 75 87 72 83 80 77 78 7382 84 70 79.34 82 10 03.47 U3.47 8t.4T S347 03. 47 63.47 3 83.47
4oerage Eaueeiuitepot talasostr 74 17 89 e7 95 44 10S 12 103 78 108 77 106 04 102.S8 f5.59 92.26 58.9! 87.39 85.89 85.80 815.0 85 8fger Rout fle 2276 79 2310 04 2431 38 2775 30 2716 39 2952.35 3201.40 3683 70 2704.32 2054.80 250T 54 2524.13 2410.t3 14780.3 2470.33 2N1.33

- 71 -
ANNEX 4
Selected Analytical Results
1. The Relationship between Inflation, Money and the Exchange Rate
2. A Note on the Impact of Wage Adjustment upon Foreign ExchangeDepreciation in Zimbabwe
3. The Impact of Exchange Rate Changes on Public Finances
4, Statistics on Public Medium and Long-term Debt

-72 - ANNEX 4
Page i of 15
Relationship Between Inflation, Money and Exchange Rate
This note examines empirically the relationship between money supplyand rate of inflation in the Zimbabwean economy over the past decade and ahalf. The basic equation to be estimated is derived by combining the internaland external components of inflationary process, where the internal componentis formulated to depend on excess supply of real money balances, and theexteinal component is related to exchange rate and import price changes.Thus, the equation in reduced form can be written as
>0 <0
ar = a0+ al ln(M/p)t-I + a2 lnyt (1)
>0 >0 >0+ 3 ln(l + r ) + a A(ln e ) + a A(ln Pm) + u
3 ~~t 4 t 5 t t
where
nt = rate of inflation in average consumer price indexM = money supply, M2 equal to currency plus demand deposit plus
near moneyPt = average of lower and upper income consumer price indecesYt = real GDP, measured at constant 1980 pricesrt = interest rate on one-year certificates of depositset = nominal effective exchange rate defined as foreign currency
price of Zimbabwean dollarPmt = price index for imports of goods and non-factor servicesu is an error term with means zero and finite varianceI is the difference operater defined as Axt = xt - xt 1'
Equation (1) was estimated by OLS, using annual data from 1971 to 1986. Basedon the statistical properties of estimation results, several alternativespecification of equation (1) was tried and the main results are shown inTable 1. The estimation results improved significantly after including thelagged value of Iny , i.e. Iny as can be seen from equations (2), (3) and(4) in Table 1. Equations (2) and (3) eliminate variables which were notstatistically significant and the final outcome is represented by equation(4). Judging by its goodness of fit and the estimated sign of coefficientsthis equation provides a reasonably satisfactory explanation of inflationaryprocess in Zimbabwe, as can be seen from the following chart which comparesthe fitted and actual values for rate of inflation for period 1971-1986. Itis interesting to note that the model traces the behaviour of inflation verysatisfactorily particularly during the 1980s. It shows the acceleration ofinflation from 1980 to 1983, but underestimates the rate of inflation duringthe deflationary period 1983-1984, and overestimates the rate of inflation inthe last two years.

- 73 - ANNEX4
Page 2 of 15
Zimbabwet Estimates of Reduced Form Equation for Rate of Inflation
Explanatory Equation Equation Equation Equationvariables and (1) (2) (3) (4)statistic
Explanatory variablesa/
ln(Mtp) t-I 0.171 0.143 0.141 0.142(3.5) (3.0) (3.13) (3.2)
*nyt -0.074 -0.253 -0.29 -0.271t (0.84) (1.9) (3.2) (3.4)
lny t-1 -- 0.171 0.179 0.161(1.70) (1.94) (1.9)
ln(l(r ) 0.415 0.85 0.97 0.86t (0.909) (1.73) (3.2) (4.1)
A(lne ) 0.104 0.112 0.117 0.114e (1.35) (1.57) (1.82) (1.8)
A(Ipnm) -0CA141 0.0348 0.028 --t (0.24) (0.43) (0.52)
Constant -0.458 -0.202 -- --
Coefficient (0.737) (0.34)
Statistic
R2 0.81 0.86 0.86 0.85
12 073 0.77 0.79 0.80
Darbin-Watsonk/ 2.55 2.36 2.38 2.44
a/ See text for explanation of symbols. Numbers in parentheses are t-statistics.
b/ Test of existence of auto correlation could not be accepted atconventional confidence levels.

- 74 -
ANNEX 4Page 3 of 15
A note on the impact of wage adjustment upon foreign exchange ratedepreciation in Zimbabwe.
The effects of a change in the exchange rate can be divided into two parts:the initial impact upon the structure of relative prices in the economy; andthe consquent resource shifts, changes in the production structure and furtherconsequent shifts in both relative factor and product prices. The purpose ofthis note is to obtain some preliminary estimates of the initial price raisingeffects of an given exchange rate depreciation under different assumptionsregarding the behavior of the real wage, taking the initial productionstructure as given, and assuming that cost increases in the non-tradeablessectors are passed on in terms of higher product prices. It should be stressedthat these estimates do not represent differential price effects that wouldactually be observed, as resource shifts, and particularly those between foodand export crops in the agricultural sector, would take place simultaneouslyas price signals were made.
The short run model consists of four basic equations each expressed forconvenience in first differences where D is used as the first differenceoperator. Let the gross output price of food, non-tradeables and tradeables bePFI PN, and PT respectively and the corresponding value added prices be PVF'PVNIand PV. The real wage, w, is defined as the ratio of the money wage, W,to the CPI. The nominal asset rental is R. Setting gross output prices, theasset rental and the money wage rate equal to unity thus gives for a givenproportion of wage indexation, c, the wage equation:
DW = c( 0.55DPF + 0.28DPN + O.17DPT ) (1)
where the weights are taken from the base year CPI.
The three price equations with their estimated initial input - outputcoefficients are:
DPF = 0.162DR + 0.378DW + 0.23DPN + 0.23DPT (2)
DPN = 0.21DR + 0.49DW + 0.3DPT (3)
DPVT = 0.57DPT - 0. 3 DPN
Finally the domestic price of tradables is linked to the border price,PT. by:
DPT = DPT' + 0. 2 3 DPN
This last equation is then substituted into equations (1) through (4) to yieldthe final empirical model. It should be noted that in the food sector, wagesare interpreted so as to include the operating surplus of unincorporatedenterprises, i.e. communal farm incomes, under the assumption that thelatter mainly represent returns to labor.

- 75 -
ANNEX 4Page 4 of 15
In the results presented below in Table 1, an exchange rate depreciation of20% is considered on the assumption of a fixed gross profit margin. Given zeroshort run substitution between inputs, this would imply in a competitive modelthat physical capital is revalued at the same rate as output. Although thefixed proportions assumption implicit in a linear model is an unrealistic one,substitution elasticities between inputs as inferred from estimated labordemand functions do not appear to be very high in Zimbabwe (typically in the 0to 0.5 range), while substitution in consumption between broad groups ofcommodities is also likely to be limited among low income earners. Theinaccuracies introduced by employing a linear model should thus be relativelyminor.
If all input and output prices were proportional to one another then it isobvious that all relative prices would be invariant to exchange ratemovements. However, given the widespread labor surplus in Zimbabwe, it isunlikely that normal labor market pressures would maintain the real wagefollowing an exchange rate depreciation. Government wage policies also have animportant role to play here in ensuring moderation in administered payincreases. The effectiveness of a given devaluation will then depend upon thesensitivity of nominal wages to changing domestic prices. To get a feel forthis relationship, the model was solved under alternative assumptions settingthe indexation parameter, c, equal to 0.5, 0.7, and 0.9 respectively.
The degree of effective devaluation is measured by the proportionate change inthe ratios of the price of value added in tradeables production relative tothat in food and other non-tradeables. However, as these turn out to bevirtually identical given the closeness of gross output price change in thetwo sectors and the assumption regarding the rate of change in asset rentals,only one ratio is presented. The main conclusion that emerges from Table 1. isthat whereas a 50% rate of wage indexation is consistent with an effectivedevaluation only slightly less than the assumed nominal exchange ratedepreciation of 20%, the rate of effective devaluation drops markedly as theindexation rate is increased. However, 70% wage indexation for price movementsarising from a devaluation leading to a 4% drop in real wages would becompatible with 70% of a given nominal depreciation being passed oneffectively. Thus a useful guideline for wage policy would be to adjust wageincreases following exchange rate depreciation at no more than the expectedrate of inflation expected prior to the devalation plus a little under a halfef the rate of depreciation itself over the expected period of priceadjustment. Econometric estimates made in other countries suggest that thisperiod lies between nine and fifteen months so that a year could be used as asensible estimate.

- 76 -
ANNEX 4Page 5 of 15
Table 1.
Percentage Price And Wage Changes Associated With A 201 Exchange RateDepreciation.
c = 0.5 c = 0.7 c u 0.9
Gross Output PricesNon-tradeables 10.3 13.0 17.1Tradeables 17.8 18.4 19.3
Values Added PricesNon-tradeables 7.2 10.7 16.1Tradeables 26.0 24.4 23.2
Unit ProfitabilityTradeables 10.3 13.0 17.1Non-tradeables 73.3 58.6 40.7
Nominal Wage rate 5.8 9.8 15.7
CPI 11.6 13.9 17.5
Real wage -5.8 -4.1 -1.7
Effective rate of depreciation 18.8 13.7 7.1
NoteThe parameter, c, is the proportion of wage indexation associated with priceincreases arising from the devaluation.

- 77 - ~~~ANNEX 4Page 6 of 15
5' The Impact of Exchange Rate Changes on Public Finances
1. Will the public sector gain or lose with real depreciation of theexchange rate? Other things equal, we have concluded that the publicsector would, as a whole, benefit from depreciation. This is based onassessing the first-round effects of depreciation--the full effects woulddepend on both other policies and the response of the economy. Forexample, a real devaluation of 10 percent would result in an initialreduction of the public sector deficit of about 0.6 to 0.7 percent pointsof GDP. The results are summarized in Table 1; the main elementsunderlying these are:
(a) the Central Government deficit would be reduced by about 0.2 percentof GDP. Interest payments on international debt would rise, but theywould be more than offset by the increase in customs duties;
(b) the combined operating deficit of the parastatals would be reduced by0.4 to 0.5 percent of GDP. Export-oriented companies, such as theGrain Marketing Board, Cold Storage Commission, ZISCO, and,especially, the Cotton Marketing Board, would enjoy benefits from adevaluation. The National Railways would lose somewhat because of theinterest payments on the external debt. An importer like NOCZIM wouldneed to pass on the increased costs of its imports in higher domesticprices in order to keep its sound financial situation. Otherparastatals, such as the Dairy Marketing Board, would not feel anysignificant impact.
2. This analysis is a reasonable reflection of the immediate impacton flows, but does not take into account the negative impact resulting fromthe revaluation of the existing external debt. A real depreciation of 10percent would mean that the public sector's external debt, now around 16percent of the GDP, would increase to 17.6 percent. Overnight, lossesresulting from the revaluation of the external debt would account foraround 1.6 percent of GDP. Therefore, the cost in terms of debtrevaluation would be covered by only two years of perpetual stream of gainsin terms of reduction in the public sector deficit-/.
I/ This could be viewed as a project which has as a cost (C) the impactof debt revaluation and as an annual/continuous/permanent benefit (b)the decline in the deficit of the public sector. If a discount rateof 10 percent is used in this "project", then
C = 1.6% of GDPb = 0.6% of GDPB = Total Present Benefit
B = 0.6 + 0.6 + 0.6 + ........ + 0.6 + 0.1 (0,102 (-O.I)n
B - 0.6 6% of GDP0.1
Hence:B - 6% of GDP 1.6% of GDP
(B is underestimated because b is an annual percentage of an increasingGDP; this reinforces the conclusion.)

- 78 - ANNEA 4
Page 7 of 15
Table 1. Public finances under different exchange rate assumptions
(as percent of GDP)
Scenario 1: with 20% Exchange Rate Depreciation
1986/87 1987/88 1988/89Government
Revenues 29.8 30.5 31.3(of which customs duties) (4.4) (4.8) (5.5)
Current Expendituresa/ 31.5 30.7 29.9(of which external interest) (2.1) (2.2) (2.4)
Parastatals Operating Deficits
Cotton Marketing Board -0.7 -0.1 -0.0Grain Marketing Board -1.1 -0.6 -0.3Cold Storage Commission -0.4 -0.1 -0.0ZISCO -0.8 -0.5 -0.3Railways -0.5 -0.4 -0.3Others 0.3 0.2 0.6
Total -3.3 -1.4 -0.2
Scenario 2: With 10% Exchange Rate Depreciation (10% less than inScenario 1D/)
1986/87 1987/88 1988/89Government
Revenues 29.8 29.9 30.7(of which customs duties) (4.4) (4.3) (5.0)
Current expenditures a/ 31.7 30.5 29.7(of which external interest) (2.1) (2.0) (2.2)
Parastatals Operating Deficit s
Cotton Marketing Board -0.7 -0.4 -0.2Grain Marketi.ag Board -1.1 -0.7 -0.4Cold Storage Commission -0.4 -0.1 -0.1ZISCO -0.8 -0.5 -0.3Railways -0.5 -0.3 -0,3Others -0.3 0.3 0.6
Total -3.3 -1.8 -0.7
a/ Excluding subsidies to parastatals.b/ All other assumptions are the same for the two scenarios.

RXD TABLE 2 - ZIMBABWE 65SERVICE PAYMENTS. COMMITMENTS. DISBURSEMENTS AND OUTSTANDING AMOUNTS OF EXTERNAL PUBLIC DEBT 10/13/87
?ROJECTIONS BASED ON OEBT OUTSTANDING INCLUDING UNDISBURSED AS OF DEC 31, 1986 14:36:11INCLUDES ONLV DEBT COMMITTED 000000 - DEC 31, 1986
DEBT REPAYABLE IN FOREIGN CURRENCV AND GOODS(IN THOUSANDS OF U.S. DOLLARS)
* * 0 TABLE TOTAL 4 * 9
DATE DEBT OUTSTANDING AT T R A N S A C T I O N S D U R I N G P E R I OD t OTHER CHANGES: END OF PERIOD
…__________ --------------------------- ---------------- ------------------------------------------- -----------------------
: DISBURSED : INCLUDING COMMIT- : DISBURSE- s S E R V I C E P A Y M E N T S CANCEL- : ADJUST-: ONLY : UNDISBURSEQ : MENTS : MENTS :-------- :-----------:----------- LATIONS * : MENT 4
: PRINCIPAL : INTEREST : TOTAL
: (1t (2) (3) (4) (5) (6) (7) : (8) (9)
197912 523.847 571,606 142.132 99,747 7,442 7.356 14.798 - -198012 697.099 782,671 168.519 130.058 34,274 9.829 44,103 12,794 89.614198112 793,160 1.615.943 1,096.831 330.394 39.442 30.802 70,244 101 -224,016198212 1,182,291 2,130,337 715.368 517.888 47,644 91,981 139.625 - -153,330198312 1.538.562 2,368,435 726,178 778.299 333,411 107.252 440,663 6,068 -150.601198412 1.412,244 2.151,478 199,515 204.873 150.570 120.88 271,451 - -263.902198512 1,545,124 2.306,067 167.661 220.308 191,834 115,286 307,120 - 178,762198612 1.711,629 2,421,221 199,682 287,196 221,445 117,114 338,559 1.737 138.654
° * * THE FOLLOWING FIGURES ARE PROJECTED e * *
198712 1,653.337 2,134.222 - 228,716 286.724 116.691 403,415 - -275198812 1.577,007 1,877.376 - 180.514 256.838 104.787 361.625 - -8198912 1.505,572 1,687.981 - 117,959 189.393 94,049 283.442 - -2199012 1,406,865 1,513,900 - 75.372 174.081 84.687 258.768 - -199112 1.299,243 1,360,879 - 45,403 153,020 75,540 228,560 - -1199212 1,160.129 1,195.142 - 26,624 165.741 67.170 232,911 - 4199312 1,047,094 1,063,617 - 18,492 131,528 58,444 189.972 - 3199412 950.386 957,582 - 9.330 106.029 50,961 156.990 - -619c9512 845,019 850,118 - 2,097 107,465 44,083 151.548 - 1199612 761.129 766,228 - - 83,886 37.633 121,519 - -4
00
* Pro'ected amounts in this column are amounts excluded from projections because of unknown terms.
*0 This column shows the amount of arithmetic imbalance in the amount outstanding including undisbursed from one period to Uthe next. The most common causes of imbalances are changes in exchange rates and transfers of debts from one categoryto another In the table.
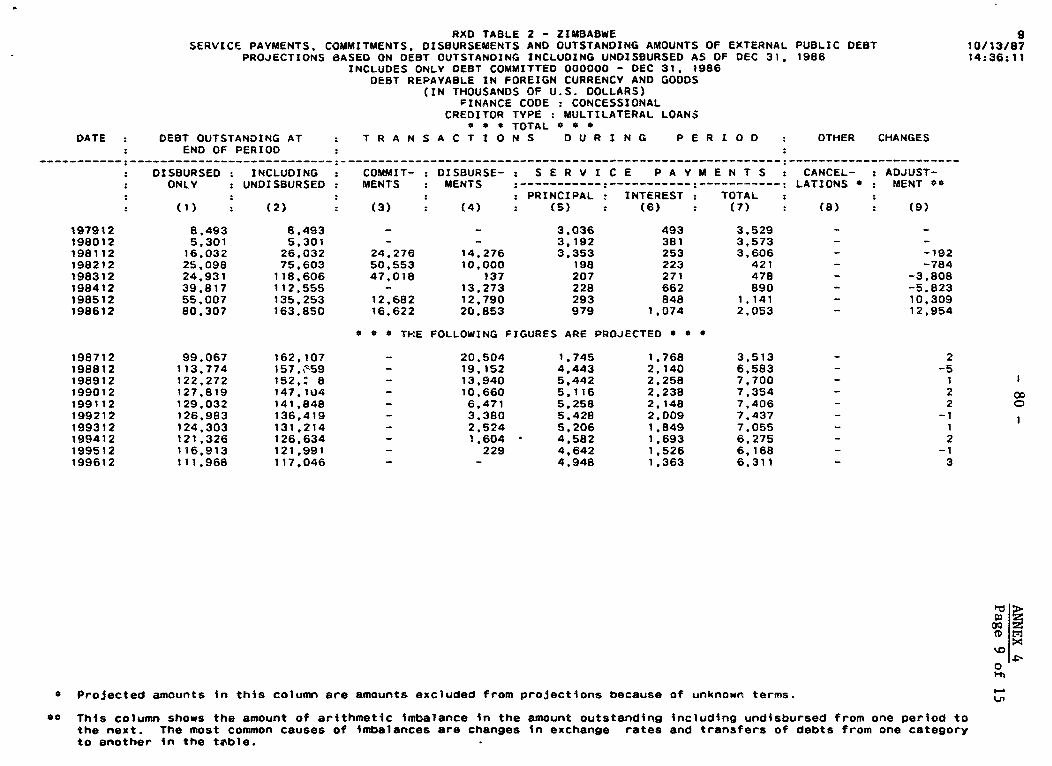
RXD TABLE 2 - ZIMBABWE 9SERVtCE PAYMENTS, COMMITMENTS. DISBURSEMENTS AND OUTSTANDING AMOUNTS OF EXTERNAL PUBLIC DEST 10/13/87
PROJECTIONS aASED ON DEBT OUTSTANDING INCLUDING UNDISBURSED AS OF DEC 31, 19B6 14:36;11INCLUDES ONLY DEBT COMMITTED 000000 - DEC 31, 1986
DEBT REPAYABLE IN FOREIGN CURRENCY AND GOODS(IN THOUSANDS OF U.S. DOLLARS)
FINANCE CODE : CONCESSIONALCREDITOR TYPE : MULTILATERAL LOANS
e * * TOTAL 0 * *
DATE DEBT OUTSTANDING AT T R A N S A C T I 0 N S D U R I N G P E R I 0 D OTHER CHANGES: END OF PERIOD
: DISBURSED : INCLUDING COMMIT- DISBURSE- : S E R V I C E P A Y M E N T S CANCEL- : ADJUST-: ONLY : UNDISBURSED MENTS MENTS :-----------:-----------:----------- LATIONS ° : MENT ¢*
: PRINCIPAL INTEREST TOTAL: (1) (2) (3) (4) (5) (6) (7) (8) (9)
197912 8,493 8,493 - - 3.036 493 3.529 - -198012 5.301 5,301 - - 3,192 381 3,573 - -198112 16,032 26,032 24.276 14.276 3,353 253 3,606 - -192198212 25.098 75.603 50,553 10.000 198 223 421 - -784198312 24.931 118.606 47.018 137 207 271 478 - -3,808198412 39.817 112,555 - 13.273 228 662 890 - -5,823198512 55,007 135,253 12,682 12.790 293 848 1,141 - 10.309198612 80.307 163.850 16.622 20,853 979 1.074 2.053 - 12.954
* e * THE FOLLOWING FIGURES ARE PROJECTED * * *
198712 99,067 162.107 - 20.504 1.745 1.768 3,513 - 2198812 113,774 157,!959 - 19,152 4,443 2,140 6,583 - -5198912 122,272 152, : - 13,940 5,442 2,258 7,700 - 1 1199012 127,819 147,1U4 - 10,660 5,116 2,238 7,354 - 2 X
199112 129,032 141.848 - 6.471 5,258 2,148 7,406 - 2 0199212 126,983 136,419 - 3.380 5.428 2,009 7,437 - -1 1199312 124,303 131,214 - 2,524 5,206 1.849 7.055 - 1199412 121,326 126,634 - 1,604 4,582 1,693 6.275 - 2199512 116,913 121,991 - 229 4,642 1.526 6.168 - -1199612 111.968 117,046 - - 4,948 1.363 6,311 - 3
oQl>o
* Projected amounts in this column are amounts excluded from projections because of unknown terms.
*° This column shows the amount of arithmetic imbalance in the amount outstanding including undisbursed from one period tothe next. The most common causes of imbalances are changes in exchange rates and transfers of debts from one categoryto another in the tagble.

RXD TABLE £ - ZIMBABWE 27SERVICE PAVMENTS, COMMITMENTS. OISBURSEMENTS AND OUTSTANDING AMOUNTS OF EXTERNAL PUBLIC DEBT 10/13/87
PROJECTIONS BASED ON DEBT OUTSTANDING INCLUDING UNDISBURSED AS OF DEC 31. 1986 14;36:11INCLUDES ONLY DEBT COMMITTED 000000 - DEC 31. 1986
DEBT REPAYABLE IN FOREIGN CURRENCY AND GOODS(IN THOUSANDS OF U.S. DOLLARS)
FINANCE CODE : CONCESSIONALCREDITOR TVPE : aILATERAL LOANS
* * * TOTAL * * eDATE DE8T OUTSTANDING AT T R A N S A C T I O N S D U R I N G P E R I OD OTHER CHANGES
END OF PERIOD…__________ ___________- ______________ - ------- - _______________________________________________- _______________________
DISBURSED INCLUDING COMMIT- : DISBURSE- ; S E R V I C E P A Y M E N T S CANCEL- : ADJUST-ONLY UNDISBURSED MENTS : MENTS :-----------:-----------:-----------: LATIONS 0 : MENT #0
: : : : PRINCIPAL : INTEREST : TOTAL(1) (2) (3) (4) (5) (6) (7) (8) (9)
197912 30.079 30,079 - - 1,669 136 1.805 - -198012 15,240 74,787 63,345 775 2.166 1,039 3,205 12,794 -3,677198112 41.805 186,065 125.929 30,967 718 1,053 1,771 - -13,933?98212 114,571 305,794 136,662 78,321 441 1,896 2,337 - -16,492198312 165.314 346,144 68.410 63,199 413 3.926 4,339 - -27,647198412 201.749 338.625 45.240 62,144 363 4,651 5,014 - -52,396198512 295.444 435,523 44.536 53.419 1.976 6.377 8.353 - 54.338196612 398.789 533,686 46,586 6l.481 2,790 9,543 12.333 1,443 55,810
* * * THE FOLLOWING FIGURES ARE PROJECTED c * *
198712 445.565 528,964 - 51.504 4.730 8,573 13,303 - 8198812 476,237 521.529 - 38.109 7,436 9.053 16.489 - 1198912 490,923 511.248 - 24.964 10.278 9.324 19.602 - -3 o199012 488,173 495,880 - 12.619 15.370 9.361 24,731 - 2199112 476,508 479.434 - 4.783 16.446 9.108 25.554 - -199212 457,557 458.709 - 1,773 20,728 8.746 29,474 - 3199312 433.845 434.130 - 870 24.581 8,332 32,913 - 2199412 408.927 408,941 - 271 25.182 7.835 33,017 - -7199512 380.497 380.511 - - 28,432 7.299 35,731 - 2199612 351.774 351,788 - - 28,721 6.729 35.450 - -2
O m0
* Projected amounts in this column are amounts excluded from projections because of unknown terms. V
U,** This column shows the amount of arithmetic imbalance in the amount outstanding including undisbursed from one period to
the next. The most common causes of imbalances are changes in exchange rates and transfers of debts from one categoryto another in the table.

RXD TABLE 2 - ZIMBABWE 33SERVICE PAYMENTS. COMMITMENTS. OISBURSEMENTS AND OUTSTANDING AMOUNTS OF EXTERNAL PUBLIC DEBT 10/13/87
PROJECTIONS BASED ON DEBT OUTSTANDING INCLUDING UNDISBURSED AS OF DEC 31, 1986 14:36:11INCLUDES ONLV DEBT COMMITTED 000000 - DEC 31, 1986
DEBT REPAYABLE IN FOREIGN CURRENCY AND GOODS(IN THOUSANDS OF U.S. DOLLARS)
FINANCE CODE : NON-CONCESSIONALCREDITOR TYPE : MULTILATERAL LOANS
* e e TOTAL * e *DATE : DEBT OUTSTANDING AT : T R A N S A C T I O N S O U R I N G P E R I O D : OTHER CHANGES
: END OF PERIOD
DISBURSED : INCLUDING : COMMIT- : DISBURSE- : S E R V I C E P A Y M E N T S : CANCEL- : ADJUST-ONLY : UNDISBURSED MENTS ; MENTS :-----------:----------- ----------- : LATIONS * : MENT **
: : : : PRINCIPAL : INTEREST : TOTAL: (t) : ~(2) : (3) : (4) : (5) : (6) : (7) : () : (9)
197912 - - - - - -198012 - - - - - -198112 41.928 92.000 92,000 41,928 - 149 149 - -198212 55,469 115,496 23,521 13.539 - 4.383 4,383 - -25198312 96.289 389.811 276.486 40.820 - 6.616 6.616 - -2.171198412 147.842 436.473 50,177 51,579 - 13.048 13,048 - -3.515198512 197.762 507.425 60.810 48,864 - 16.965 16,965 - 10.142198612 239.294 526.762 10.000 41.287 1.665 26.485 28.150 - 11.002
* * * THE FOLLOWING FIGURES APE PROJECTED * * *
198712 290,316 519.579 - 58.206 7,185 27,312 34,497 - 2198812 335,727 504.583 - 60.404 14,993 31.622 46.615 - -3198912 359.374 477,241 - 50.990 27.344 34,331 61.675 - 2199012 371.566 447.576 - 41,856 29,662 35,441 65,103 - -3 0199112 366,294 412,187 - 30,117 35.389 35,455 70.844 - -199212 351,324 375.748 - 21,471 36,441 34,220 70,661 - 2199312 329.254 338.580 - 15,098 37,169 32,315 69.484 - 1199412 299.387 301.260 - 7,455 37,320 29,769 67,089 - -
199512 263,771 263.777 - 1.868 37.485 26,652 64,137 - 2199612 226.109 226.115 - - 37.660 23.290 60.950 - -2
SDX
e Projected amounts in this column are amounts excluded from projections because of unknown terms.
@ This column shows the amount of arithmetic imbalance in the amount outstanding inciuding undisbursed from one period to Utthe next. The nost common causes of imbalances are changes in exchange rates and transfers of debts from one categoryto another in the table.

RXD TABLE 2 - ZIMBABWE 40SERVICE PAVMENTS, COMMITMENTS, DISBURSEMENTS AND OUTSTANDING AMOUNTS OF EXTERNAL PUBLIC DEBT 10/13/07
PROJECTIONS OASED ON DEBT OUTSTANDING INCLUDING UNDISBURSED AS OF DEC 31, 1986 14:36:11INCLUDES ONLY DEBT COMMITTED 000000 - DEC 31, 1986
DEBT REPAYABLE IN FOREIGN CURRENCY AND GOODS(IN THOUSANDS OF U.S. DOLLARS)
FINANCE CODE : NON-CONCESSIONALCREDITOR TVPE : BILATERAL LOANS
e* * TOTAL 0 0DATE : DEBT OUTSTANDING AT T R A N S A C T I O N S D U R I N G P E R I O D : OTHER CHANGES
END OF PERIOD
D DISBURSED : INCLUDING COMMIT- s DISBURSE- : S E R V I C E P A V M E N T S CANCEL- : ADJUST-: ONLV : UNDISBURSED : MENTS : MENTS :-----------…:----------------------: LATIONS 0 : MENT *
: PRINCIPAL : INTEREST : TOTAL(1) : (2) (3) : (4) (5) : (6) : (7) (8) (9)
197912 - - - - - - - - -198012 82.680 82.680 76.574 76.574 116 170 286 - 6.222198112 67.439 125.467 61.082 1,389 - 5.875 5.875 101 -18,194198212 107.766 147.198 40.335 55.161 4.978 8.283 13,261 - -13.626198312 115,260 129.046 - 21.815 8.8S4 9.275 18,129 - -9.298198412 101.962 126,406 17.385 3.107 8,312 10.454 18.766 - -11,713198512 103,724 127,631 - 5,922 12.566 10,048 22,614 - 13,791198612 99.147 185.932 66,771 9.306 17,385 9,122 26,507 - 8.915
0 * * THE FOLLOWING FIGURES ARE PROJECTED * * *
198712 101.809 166,193 - 22.402 19.739 9,039 28,778 - -
198812 110,103 141,977 - 32,511 24,216 9.791 34.007 - -
198912 103.915 117.761 - 18,028 24,216 9,381 33,597 - -
199012 92.522 96,555 - 9,812 21.205 8,280 29,485 - -1199112 83,717 83,718 - 4,032 12,835 7.250 20.085 - -2199212 71,044 71.045 - - 12.673 6.273 18.946 - -
199312 61.937 61,938 - - 9,105 5.365 14,470 - -2199412 52,831 52.832 - - 9,105 4,661 13,766 - -1199512 43.724 43.725 - - 9.105 3.955 13.060 - -2199612 36.914 36.915 - - 6.807 3.292 10.099 - -3
4-.
0* Projected amounts in this column are amounts excluded from projections because of unknown terms.
*8 This column shows the amount of arithmetic Imbalance in the amount outstanding including undisbursed from one period tothe next. The most common causes of imbalances are changes in exchange rates and transfers of debts from one categoryto another in the table.

RXD TABLE 2 - ZIMBABWE 45
SERVICE PAvMENTS, COMMITMENTS, DISBURSEMENTS AND OUTSTANDING AMOUNTS OF EXTERNAL PUBLIC DEBT 10/13/87
PROJECTIONS BASED ON DEBT OUTSTANDING INCLUDING UNDIS8URSED AS OF DEC 31. 1986 14:36:11
INCLUDES ONLY DEBT COMMITTED 000000 - DEC 31, 1986
DEBT REPAYABLE IN FOREIGN CURRENCY AND GOODS(IN THOUSANDS OF U.S. DOLLARS)
FINANCE CODE : PRIVATE FINANCINGCREDITOR TYPE : SUPPLIERS CREDITS
e * * TOTAL e e e
DATE : DEBT OUTSTANDING AT : T R A N S A C T I O N S D U R I N G P E R I O D : OTER CHANGES
END OF PERIOO… ---- - -- ------ --- --- --- --- -- ---- --- ---- --- ---- ----- - ----- --- -- -- -- -- -- ---- ----- ----- - -- ----- ------- -- ----- ----
DISBURSED : INCLUDING COMMIT- : DISBURSE- : S E R V I C E P A V M E N T S : CANCEL- : ADJUST-
ONLY : UNDISOURSED MENTS : MENTS ------------ ---- :------ ------ : LATIONS * MENT e0
PRINCIPAL : INTEREST : TOTAL
: (1) : (2) (3) : (4) (5) : (6) (7) : (8) (9)
197912 - - - - -
198012 - - -
198112 - 36,787 36,949 - - - - - -162
198212 24,068 52,500 19.590 25.274 - 314 314 - -3,877
198312 38,384 43,696 - 20.763 2.65S - 2.333 4,991 - -6,146
198412 17.972 22.293 - 43 1(,288 2.833 19,121 _ -5,115
198512 23,574 48,207 24.633 4.465 3.829 1.415 5,244 - 5,110
198612 47,265 50,352 3.464 25.326 7,174 3.398 10.572 - 5.855
e e e THE FOLLOWING FIGUREb ARE PROJECTED 0 * S
198712 38.739 40,823 - 1.004 9,531 4,010 13,541 - 2
198812 30,216 31,374 - 926 9,448 3,216 12,664 - -1
198912 21,566 21.991 - 733 9.383 2,434 11,817 - -
199012 12,607 12,607 - 425 9,383 1,644 11,027 - -1
199112 5,684 5.684 - - 6,923 833 7,756 - -
199212 1.226 1,226 - - 4,458 356 4,814 - -
199312 - - - - 1,226 67 1,293 - -
199412 - - - - - -
199512 - -
199612 - -
>14
* Projected amounts in this column are amounts excluded from projections because of unknown terms.
** This column shows the amount of arithmetic imbalance in the amount outstanding including undisbursed from one period to n
the next. The most common causes of imbalances are changes in exchange rates and transfers of debts from one category
to another in the table.

RXD TABLE 2 - ZIMBABWE 59SERVICE PAVMENTS. COMMITMENTS. OISBURSEMENTS AND OUTSTANDING AMOUNTS OF EXTERNAL OUBLIC DEST 10/13/87PROJECTIONS BASED ON DEBT OUTSTANDING INCLUDING UNDISBURSED AS OF DEC 31, 1986 14:36:11
INCLUDES ONLV DEBT COMMITTED 000000 - DEC 31, 1986DEBT REPAVABLE IN FOREIGN CURRENCY AND GOODS
(IN THOUSANDS OF U.S. DOLLARS)FINANCE CODE : PRIVATE FINANCING
CREDITOR TYPE : FINANCIAL INSTITUTIONS* * * TOTAL * * *
DATE : DEBT OUTSTANDING AT : T R A N S A C T I O N S D U R I N G P E R I O : OTHER CHANGES: END OF PERIOD
* DISBURSED : INCLUDING * COMMIT- : DISBURSE- : S E R V I C E P A V M E N T S CANCEL- : ADJUST-: ONLV : UNDISBURSED MENTS : MENTS :------------:-----------:----------- LATIONS 0 : MENT 0*
: PRINCIPAL : INTEREST : TOTAL: (1) : (2) (3) : (4) : (5) (6) : (7) (8) : (9)
197912 15.103 15,103 - 4,992 - 895 895 --198012 7,575 33,600 28,600 2,575 10.000 900 10,900 - -103198112 241.549 765,185 756.595 241.834 5,001 4.315 9.316 - -20,009198212 549,711 1,128,138 444,707 335,593 9,393 55.763 65.156 - -72,361198312 818.560 1,059.308 297,019 594,320 294,946 75.396 370,342 6,068 -64.835198412 728.640 940,864 86,713 74,727 111,631 81.217 192,848 - -93,5261t8512 738.588 921.003 25.000 94.848 144,645 72,627 217.272 - 99.784198612 725.175 838,987 56,239 128,943 167,267 61.286 228,553 294 29,306
e S * THE FOLLOWING FIGURES ARE PROJECTED * * *
198712 582,420 621.135 - 75.096 217.563 61.470 279.033 - -289198812 443,031 452,335 - 29,412 168,799 46,003 214,802 - -1198912 353.725 353.725 - 9.301 98.608 34,679 133,287 - -2 00199012 274,502 214,502 - - 79.223 26.363 105,586 -199112 212,454 212,454 - - 62.047 19,668 81.715 - -1199212 151,995 151.995 - - 60,459 15,027 75,486 - -199312 97,755 97.755 - - 54,241 10.516 64.757 - 1199412 67,915 67,915 - - 29.840 7,003 36.843 - -199512 40,114 40,114 - - 27,801 4.651 32,452 - -199612 34,364 34.364 - - 5,750 2,959 8,709 - -
0
* Projected amounts in this column are amounts excluded from projections because of unknown terms.
* This column shows the amount of arithmetic imbalance in the amount outstanding including undisbursed from one period tothe next. The most common causes of imbalances are changes in exchange rates and transfers of debts from one categoryto another in the table.

RXD TABLE 2 - ZIMBABWE 63SERVICE PAYMENTS. COMMITMENTS, DISBURSEMENTS AND OUTSTANDING AMOUNTS OF EXTERNAL PUBLIC DEBT 10/1387
PROJECTIONS BASED ON DEBT OUTSTANDING INCLUDING UNDISOURSED AS OF DEC 31. 1986 14:36:11INCLUDES ONLY DEBT COMMITTED 000000 - DEC 31. 1986
DEBT REPAYABLE IN FOREIGN CURRENCY AND GOODS(IN THOUSANDS OF U.S. DOLLARS)
FINANCE CODE : PRIVATE FINANCINGCREDITOR TYPE BONDS
e * e TOTAL e * *DATE OEBT OUTSTANDING AT : T R A N S A C T I O N S D U R I N G P E R I O D OTHER CHANGES
: END OF PERIOD
: DISBURSED : INCLUDING : COMMIT- : DISBURSE- S E R V I C E P A V M E N T S CANCEL- : ADJUST-: ONLY : LINDISBURSED MENTS : MENTS :--………-------:---------:------------ LATIONS : MENT
PRINCIPAL : INTEREST : TOTAL(1) (2) (3) (4) : (5) (6) : (7) : (8) : (9)
197912 470,172 517.931 142,132 94,755 2,737 5.832 8,569 --
198012 586.303 586.303 - 50,134 18,800 7.339 26.139 - 87,172198112 384.407 384.407 - - 30,370 19.157 49,527 - -171,526198212 305,608 305.608 - - 32.634 21,119 53.753 - -46,165198312 279,824 279,824 37,245 37,245 26.333 9,435 35,768 - -36,696198412 174,262 174.262 - - 13,748 8,016 21.764 - -91,814198512 131,025 131.025 - - 28,525 7,006 35,531 - -14.712198612 121.652 121,652 - - 24,185 6,206 30.391 - 14.812
e * * THE FOLLOWING FIGLlES ARE PROJECTED * * *
198712 95,421 95.421 - - 26,231 4,519 30.750 --
198812 67.919 67,919 - - 27.503 2.962 30.465 _ 1198912 53.797 53.797 - - 14.122 1,642 15,764 - OD199012 39,676 39.676 - - 14,122 1,360 15,482 - 1199112 25,554 25,554 - - 14,122 1.078 15,200 -
199212 - - - - 25,554 539 26.093 - I199312 - - - - - -199412 - - - - - - - -
199512 - -199612 - - - - - - - -
OI-
00 Projected amounts in this column are amounts excluded from projections because of unknown terms.
0 This column shows the amount of arithmetic imbalance in the amount outstanding including undisbursed from one period to Unthe next. The most common causes of imbalances are changes in exchange rates and transfers of debts from one categoryto another in the table.