Report No. 19411 -MK FormerYugoslav Republic of Macedonia ...€¦ · FormerYugoslav Republic of...
96
ReportNo. 19411-MK FormerYugoslav Republic of Macedonia Focusingon the Poor (In Two Volumes) Volume 1:Main Report june11, 1999 HumanDevelopment Sector Unit CountryDepartment IV Europe andCentral Asia Region Document o the World 1o* Public Disclosure Authorized Public Disclosure Authorized Public Disclosure Authorized Public Disclosure Authorized
Transcript of Report No. 19411 -MK FormerYugoslav Republic of Macedonia ...€¦ · FormerYugoslav Republic of...
Report No. 19411 -MK
FormerYugoslav Republic of MacedoniaFocusing on the Poor(In Two Volumes) Volume 1: Main Report
june11, 1999
Human Development Sector UnitCountry Department IVEurope and Central Asia Region
Document o the World 1o*
Pub
lic D
iscl
osur
e A
utho
rized
Pub
lic D
iscl
osur
e A
utho
rized
Pub
lic D
iscl
osur
e A
utho
rized
Pub
lic D
iscl
osur
e A
utho
rized
CURRENCY EQUIVALENTS(as of June, 1999)
Currency Unit = DenarsUSSI = 56.94 Denars
AVERAGE EXCHANGE RATESDenars per USSI(Period Average)
1996 1997 199839.9 49.7 54.5
WEIGHTS AND MEASURESMetric System
FORMER YUGOSLAV REPUBLIC OF MACEDONIA FISCAL YEAR
January 1-December 31
Vice President: Johannes LinnCountry Director: Ajay Chhibber
Sector Director: Christopher LovelaceSector Leader: Michal Rutkowski
Task Team Leader: Mansoora Rashid
FORMER YUGOSLAV REPUBLIC OF MACEDONIA
FOCUSING ON THE POOR
(In Two Volumes)
Volume I: Main Report
June 1999
Human Development Sector UnitCountry Department VI
Europe and Central Asia Region

Th Mac|tfgedonian Poet Asesmn S was prepared jonly Miby0 aX Mace1donian anWorl Ban Tem TheMaeona l0 team particiaed4 in bot the quantiatve and0
qualitative aspecs of the PovetyAssessmnt.$ For th qulttv wor the Macedonian team
was led by Jord Jakimoai(Intiut 2of Socioogical andPoitialLealResearch andBlagic &kvk ag (the St l of Maceoni). It c.omprised team leaer Mai
Anica Dragovic, Mhjan PopovsaBorota, Slivana.Mojsova Eloor erfmosa(lrnJanev an ftian Boiskova were th proec j jasscate jof this team ;orth
quntitaivwok,theMacedonian team cmrised Blagica Nokoska Stttistca fc),LiliijaaTensv SatLj istoe>icOfe)MirWa Alesosk: a ;(Miniatof Labo an oii-Social#
Policy). Te World Bank Tea comprsed M;ansoora; Rhid (gTas }Team Leder;Penios/Educto),; Lionel Demery (Euctin) No Dudick (Quliaive Assessmnt),
KapaaMer (oety Profle) Jan Rutkowsk}i (LaorMarkts) CatheineSxtlank(Qualitatve Assesmet) Kaidiubarao CashTransfes), ndNcol LaB br whpulled' ain(to-,< thiet shp :'theS- final version.ii
Alilison,E; as wellgjXi''%:;S'' as Aja Chiber MaiKln Brcnl,' Ele Goldtei, Grgr
Kisunko, Mauree Lewis,Rin [Cemrk,l Ereto Cuaa fo hepfh coment andsu g sin s.; , 0 \:i!; ,,,t4E1 ) ii0p"SWfBS dt:t f?i$.00 0, ff.ftdfXL:AW0,,,0,ikt."ipi00
FORMER YUGOSLAVIA REPUBLIC OF MACEDONIAFOCUSING ON THE POOR
Table of Contents
Executive Summary ............................................................. i
Chapter I. POVERTY CHARACTERISTICS AND TRENDS ........................................... 1A. Defining the Poor ............................................................ 1lB. The Evolution of Poverty Over the Transition .....................................................2C. The Characteristics of the Poor, 1996 ............................................................. 6D. Rural and Urban Poverty ............................................................ 11
Chapter II. THE LABOR MARKET AND POVERTY ....................................................... 19A. The Labor Market: Background ........................................................... 19B. Recent Labor Market Developments ........................................................... 20C. The Working Poor .22D. Informal Sector Workers: Seasonal and Occasional Work .................................. 26E. The Unemployed ........................................................... 29F. Looking for Work ........................................................... 31G. Labor Market Policies and Poverty Reduction .................................................... 32
Chapter III. POVERTY ALLEVIATION PROGRAMS AND POLICIES ... 35A. The Education System ........................................................... 37B. The Public Cash Transfer System ........................................... 49
1. The Pension System ........................................................... 502. The Unemployment Insurance Program ................................................... 583. The Social Assistance Program ........................................................... 604. The Child Allowance Program ........................................................... 66
C. Private Transfers ........................................................... 67D. The Comparative Efficiency and Effectiveness of Poverty Alleviation
Programs ........................................................... 70E. Institutional vs. Locally Based Care .......................................... 71
Volume II:
Annex I: DATA AND MEASUREMENT
Annex II: STATISTICAL ANNEX
LIST OF TABLES, FIGURES, AND BOXES
TABLES
Table 1.1 Change in the Level of Real Household Income and Consumption ..............4
Table 1.2 Change in the Composition of Income and Consumption, 1990-1995 ..........4
Table 1.3 Poverty and Inequality Indicators, 1996 ................................................... 7
Table 3.1 Household and Government Spending on Public Schooling ......................... 43
Table 3.2 Ratio of Mean Per-Enrollment Cost and Expenditure Per Capita ................. 44
Table 3.3 The Poverty Impact of the Public Cash Transfer System .............................. 49
Table 3.4 The Average Amount of Pensions by Gender and Type ............................... 51
Table 3.5 Social Assistance: Inclusion and Exclusion Errors ........................................ 62
Table 3.6 The Distribution of Remittances by Share and Location ............................... 68
FIGURES
Figure 1.1 Growth in Poverty Rates, 1993-1996 ................................................... 2
Figure 1.2 Changing Composition of the Poor, 1990-1996 ............................................5
Figure 1.3 Changes in Poverty Rates by Occupational Status, 1993-1996 .....................6
Figure 14 Poverty and Occupation ................................................... 8
Figure 1.5 Children in Poverty 18 Years and Less ................................................... 9
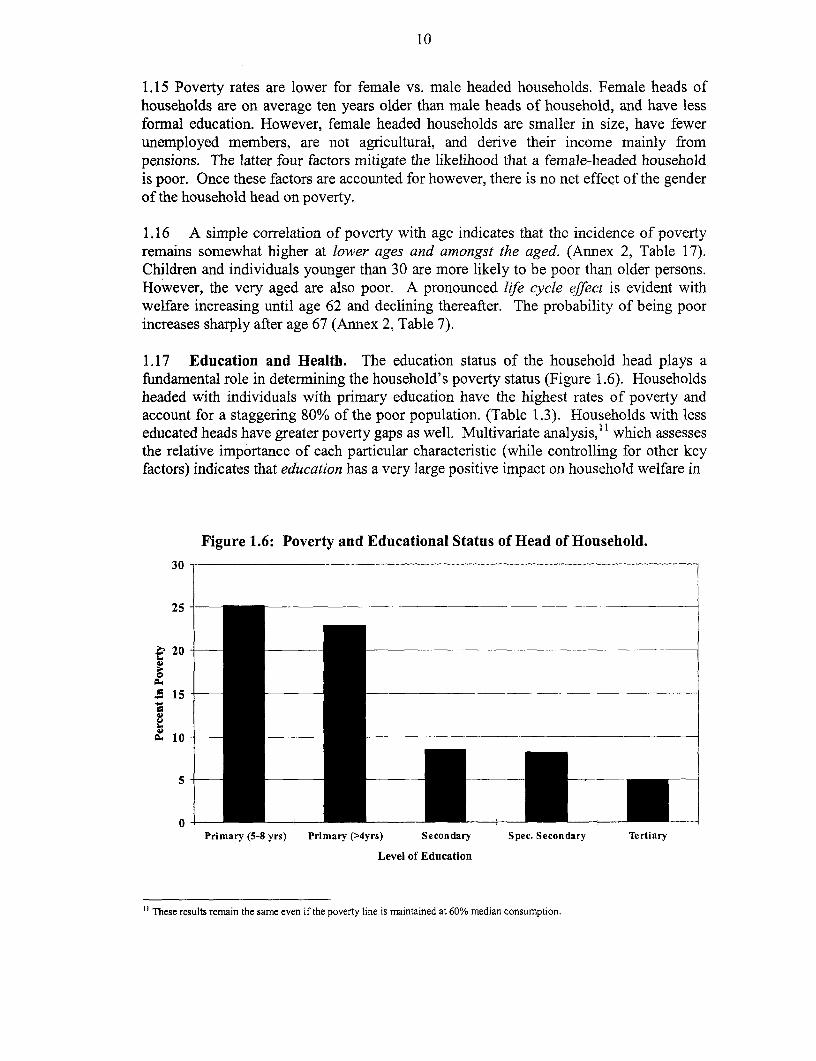
Figure 1.6 Poverty and Educational Status of Head of Household ................................. 10
Figure 1.7 Health and Poverty ................................................... 11
Figure 1.8 Assets by Decile .................................................. 12
Figure 1.9 Household Amenities by Income Decile .................................................. 12
Figure 1.10 Living Conditions: Urban vs. Rural .................................................. 16
Figure 1.11 Education Status of the Head of Household by Location .............................. 16
Figure 2.1 The Composition of the Labor Force .................................................. 20
Figure 2.2 The Composition of Employment .................................................. 21
Figure 2.3 Trends in the Level and Distribution of Wages ............................................. 21
Figure 2.4 Changes in the Relative Position of Top/Low Paid Workers ........................ 22
Figure 2.5 Incidence of Low Pay .................................................. 23
Figure 2.5A Wage Distribution: Private vs. Public Sector ................................................ 24
Figure 2.7 Explaining Wage Inequality .................................................. 25

Figure 2.8 Incidence of Layoffs by Socio-Economic Factors ......................................... 26
Figure 2.9 Unemployment and Poverty .29
Figure 2.10 New Hires in the Private Sector .31
Figure 3.1 Trends in Social Expenditures .35
Figure 3.2 The Changing Composition of Social Expenditures, 1991-1996 .36
Figure 3.3 Gross and Net Enrollment Rates, 1996 .37
Figure 3.4 Highest Educational Level Completed by Age .38
Figure 3.5 Educational Attainment by Population Income Quintile and Region . 39
Figure 3.6A Net Enrollment by Education Level - Primary School .40
Figure 3.6B Net Enrollment by Education Level - Secondary School .40
Figure 3.6C Net Enrollment by Education Level - Tertiary Education .40
Figure 3.6D Net Enrollment by Education Level - Pre-School .41
Figure 3.7A Education Subsidy Per Capita - All .45
Figure 3.7B Education Subsidy Per Capita - Pre-School .45
Figure 3.7C Education Subsidy Per Capita - Primary School .45
Figure 3.7D Education Subsidy Per Capita - Secondary School .46
Figure 3.7E Education Subsidy Per Capita - Tertiary Education .46
Figure 3.8 The Distribution of Public Spending on Education .47
Figure 3.9 The Coverage of the Pension System by Gender and Age .50
Figure 3.10 The Composition of Pensions by Type .51
Figure 3.1 1A Poverty Among Male Pensioners and Non-Pensioners by Age .52
Figure 3.1 1B Poverty Among Female Pensioners and Non-Pensioners by Age .52
Figure 3.12A Average Pensions and Poverty Rates for Male Pensioners by Age .53
Figure 3.12B Average Pensions and Poverty Rates for Female Pensioners by Age . 53
Figure 3.13 Per Capita Old-Age Pension Benefits .54
Figure 3.14 Per Capita Disability Pension Benefits .54
Figure 3.15 The Distribution of Public Spending in Pensions .55
Figure 3.16 Per Capita Unemployment Benefits .58
Figure 3.17 Distribution of Public Spending on Unemployment Benefits .59
Figure 3.18 The Distribution of Public Cash Transfers .............................. 61
Figure 3.19 Per Capita Social Assistance Benefits .61
Figure 3.20 Per Capita Child Allowance Benefits .66
Figure 3.21 Per Capita Remittances .67
Figure 3.22 Comparative Effectiveness in Reaching the Poor Transfer Subsidy Income
as Share of Consumption .69
Figure 3.23 Comparative Efficiency of Targeting Share of Total Public Spending
Received by thne Poor................. .... 70
BOXES
Box 1.1 Perceptions of Poverty ...................... 2
Box 1.2 Poverty and Youth ...................... 9
Box 1.3 Living Conditions of the Poor ..................... 13
Box 1.4 Gypsies ..................... 14
Box 1.5 Rural Poverty ..................... 16
Box 2.1 A Private Enterprise ..................... 28
Box 3.1 Education ..................... 42
Box 3.2 The Elderly ..................... 57
Box 3.3 Social Transfers............ ......... 63
Box 3.4 Institutional Care ..................... 72

THE KOSOVO CRISIS AND POVERTY
The Kosovo crisis has inflicted a severe strain on the Macedonian economy.' Trade withand through the Federal Republic of Yugoslavia has been cut off and the country has been forcedto absorb a large and growing population of refugees from neighboring Kosovo into thie northernpart of the country. These recent events have severely undercut economic recovery, threatenmacro-economic stability, strained social expenditures, will likely increase poverty over theduration of the crisis, and have the potential to rent the multi-cultural fabric of the country.
Due to the blockage of the main trade routes and the closure of its second largest exportniarket in FR Yugoslavia, The Gross Domestic Product (GD?) is expected to contract by 4%/o(against an anticipated 5% growth prior to the conflict). Industrial activity is expected to beseveirly affected; Investment is likely to collapse from a decline in consumer confidence; andper-capita consumption, a key determinant of poverty, is likely to decline because of the increasein the population due to refugees.
The increase in poverty occasioned by the contraction of economic activity and the declinelin per-capita consumption is likely to aggravate and deepen poverty amongst the groups Of pooridentified in this report. However, the basic linkages and determinants of poverty found in thisreport low-wage poor, less educated, unemployed, rural areas, agricultural households familieswith many children are liely to remain the same.
o The contraction in economie activity will bave direct implications for the welfare of:woorkers. Worker incomes are expected to decline sharply, and unemployment is expected to rise,as enterprises are likely to shed workers. Wage arrears are likely to worsen, and; many moreemployees are likely to be put on paid leave- New jobs in the formal sector have been difficult tofmd (see Chapter 2 of this report) even during better economic Limes last year, and this. trend islikely to continue. Agriculture, the main source of new jobs in the past is hard hit by the closureof its main market in Kosovo. Even during the last year, the bumper crop plus the Kosovofighting led to a 23% decline in agricultural prices. Prospects for this year are far worse.
Preliminary estimates indicate that an additional 2-3 / population may fall into poverty,adng to the 18% of the population that is already poor according to his report The depth ofpoverty may increase as well particularly amongst the unemployed, and low-wage workers,already an importat group of poor in 1996, whose income may fall because of wage arrears and,forced leave. The Kosovo conflict may also have a larger impact on rral poverty, where--manyhouseholds have absorbed refugees, and where the fall in agricultural income is likely to impactagricultural households, which are one of the most vulnerable groups of poor.
The rise in unemployment and poverty, coupled with additional expenditures associatedwith refugees will impose a strain on the budget, particularly on social expenditures such ashealth, education, unemployment benefi s, and social assistance, rendering the protection of poordifficult at a stage when economic conditions-are at their worse point. To this end, care will haveto be. aken-through better targeting of program- to protect the poorest and most vulnerablegroups from falling into abject poverty.
' This section draws heavily on the World Bank Report, "Former Yugoslav Republic of Macedonia: Economric Impactof the Kosovo Crisis." The poverty estimates were estimated based on the data used in this Poverty report.

EXECUTIVE SUMMARY
I. Introduction
i. The objective of this poverty assessment report is to inform policies and programsthat focus on the poor. To this end, the report traces the evolution of poverty between1990-96, evaluates the characteristics and determinants of poverty status in 1996, andevaluates the effectiveness of public poverty alleviation programs in 1997 (first half) inachieving their stated objectives. The report relies on both quantitative data (HouseholdBudget Surveys 1990-95; a special add on module of the 1996 Household BudgetSurvey)2 and a Qualitative or Social Assessment (1998) to evaluate poverty.
ii. The important link between labor market status, education, cash transfers andpoverty has focused this report on three key themes: (i) poverty trends and in-depthcharacteristics; (ii) labor markets and poverty; and (iii) poverty alleviation programs andpolicies (the education system and the cash transfer programs). These themes also serveto organize the chapters of this report. Two annexes support this report: Annex 1 Dataand Measurement, discusses data, sources and limitations, and the basic measures ofwelfare used in this report; and Annex 2: the Statistical Appendix.
iii. A description of poverty requires a definition of the poor. In most poverty studies, apoverty line, or a particular threshold level of consumption, is used to define poverty.Consistent with OECD norms, the Macedonian Government has chosen a relative povertyline to define poverty in the country. According to this definition of poverty, individualswith consumption below 60% of median annual 1996 adult equivalent consumption-or33061 Denars per year (2755 Denars--about $50--per month)--are defined as poor (Annex1). The report uses this official poverty line to profile the poor and evaluate thedeterminants of poverty. 3
-I. Poverty Trends and Characteristics
iv. Poverty is not a new phenomenon in the country. Prior to 1990, the formerYugoslav Republic of Macedonia was one of the poorest Yugoslav Republics heavilysubsidized by transfers from Belgrade, and greatly reliant on internal markets for trade.4
Although literacy was almost universal (94% according to the 1994 Census) and lifeexpectancy (72 years) at par with many higher income transition economies, infantmortality rates compared unfavorably with Central and Eastern Europe norms, and were
2 An additional module comprising socio-economic characteristics of households was added to the last quarter of the1996 annual Household Budget Survey. Most of the results of this report, particularly on socio-economiccharacteristics are from this additional module of the survey.
3In a small section of this report, which deals with poverty trends, a slightly higher poverty line--70% of median adultequivalent consumption--is used to evaluate changes in the level and composition of poverty over time. This is a resultof the small sample of households in the 1990-95 data, which do not allow robust results for socio economic groups, atthe official poverty line. However, the report evaluates the sensitivity of poverty rates to alternate specifications ofpoverty lines (Annex I/Chapter I).
4Former Yugoslav Republic of Yugoslavia: An Introductory Economic Report. World Bank, 1995.
ii
particularly high in rural areas and for ethnic minorities.5 The poorest households weremainly rural and derived their income primarily from agricultural sources.6 A cradle tograve protection system was also in place with the intention of providing individuals withfull protection against income loss and other lifetime risks. The system providedguaranteed employment, child allowances, free education and health care, and pensionsupon retirement. However, open unemployment was high compared to regional norms,and concentrated amongst new entrants to the labor force. The socialist workermanagement system gave the employed (or insiders) extensive powers to push up wages,restrict hiring and termination practices, and keep out younger and less skilled workers.
v. The transition exacerbated the poverty situation in the country. Independence fromYugoslavia, the loss of federal transfers, the external conflict amongst its neighbors, andthe economic transformation from a socialist system to a market economy, led to a sharpeconomic contraction. Inflation rates soared, real wages declined and unemploymentincreased. Not surprisingly, poverty increased from 4% of the population in 1991 toapproximately 20% in 1996. The increase in poverty was not uniform. Poverty ratesremained largely unchanged between 1990-91, but increased sharply between 1993-95.The main reason for the increase in poverty was a major decline in real consumption. Theinequality in consumption grew, but contributed far less to poverty growth.
vi. In 1996, the country overcame the deep recession of the early 1990s and realized asmall positive growth rate (1%) for the first time since independence. However, theincidence of poverty increased further between 1995-96. As real consumption remainedroughly constant over this period, the main reason for poverty growth was a growinginequality in the distribution of income.7 The modest growth realized in 1997 and 1998may have reduced poverty over 1996 estimates, but these gains may well be eroded, atleast over the short term, by the contraction of economic activity resulting from theKosovo crisis. (See Box: The Kosovo Crisis and Poverty)
vii. The diverse characteristics of poverty. In 1996, according to the official povertyline, approximately 20% of the population was poor. An overwhelming share (two thirds)of the poor lived in rural areas. About 60% of the poor lived in households headed byindividuals who worked.8 Of these, almost two thirds were wage/seasonal workers, andthe rest were farmers. The remaining non-working poor were roughly evenly dividedbetween pensioners and the unemployed/transfer recipients. The report identifies threedistinct groups of poor:
* The traditional poor. Rural, agricultural households with more than three children, asearlier, have amongst the highest incidence of poverty in the country. Thesehouseholds are larger in size (with many children) and are characterized by the very
5 The Joint Country Assistance Strategy, Memorandum of the President, World Bank, July, 1998.
6 The 1990 Household Budget Survey.
7Consistent with this trend, the poverty gap, an indicator of the depth of poverty, remained constantbetween 1993-95, but deepened between 1995-96.
8 The high number of employed poor is a result of the large population of employed in the population. The incidence ofpoverty amongst the employed is however far less than that of unemployed and other groups.
iii
low education status of household heads and, particularly, of female householdmembers. The poorest are those that survive exclusively on agricultural income.
* The new poor. The transition has changed the face of poverty in the country. Povertyremains a rural phenomenon, with nearly two thirds of the poor living in rural areas.However, non-agricultural households (now two thirds of all poor) have replacedagricultural households as the largest group of poor. Amongst socio-economic groups,the unemployed/transfer recipients have emerged as the new group of poor and havethe highest incidence of poverty, followed by farmers, and wage earners. Pensionerheaded households have the lowest poverty rates overall.
* The chronic poor. The elderly poor, particularly non-pensioners, the disabled, agedfarm households without pension or other fixed income, and individuals not inhouseholds (institutionalized elderly, disabled, orphans) emerge as the mostdisadvantaged groups in society. These groups are least capable of work and aretherefore the least likely to benefit directly from economic growth.
viii. The common characteristics of the poor. In 1996, the common characteristics ofpoverty include limited asset ownership (durables, and land), a large household size, anda high share of food in total consumption. However, low education attainment, laborforce status, poor living conditions and low health status are also closely linked topoverty. While ethnicity is likely an important dimension of poverty, the sources of datafor the report were not adequate to explore this important issue.9
* Low levels of education: Nearly 80% of the poor live in households headed byindividuals with primary education or less. Rural household heads report a muchlower education status compared to urban households. Most worrisome, poverty ratesare much higher in households with non-attending children (25%) vs. those withchildren attending school (10%). This means that poverty amongst these householdsmay persist in the future.
* Labor force status. Unemployment, low-wage share, and lack of enterprise ownershipare the main labor market determinants of poverty. Low-wage share, indicative oflow-wage jobs, is an important indicator of welfare in FYR of Macedonia in bothrural and urban areas. However, unemployment is a strong poverty marker only inurban areas. In contrast, remittances and the ownership of a household enterprisereduce the chances of being poor in rural, but not urban areas.
* Poor living conditions. Living conditions (very poor sanitation, lack of water supply)are a hallmark of poverty in FYR of Macedonia. These conditions are particularlyworse for the rural poor but are also difficult for peri-urban residents. Electricity isuniversally available in both rural and urban areas, but the poor often cannot afford topay for this service.
* Low health status. Low education levels (particularly for women) coupled with poorliving conditions contribute to the low health status of the poor. The higher infant and
9 The qualitative assessment of poverty sheds some light on the ethnic dimensions of poverty. (See Box 3.1 in Chapter3, for example).
iv
maternal mortality rates in rural vs. urban areas indicates that this problem is moresevere in rural areas.
III. Labor Markets and Poverty
ix. Recent labor market developments have been at the root of growing poverty and thechanging composition of the poor in FYR of Macedonia. The report finds that, in 1996,particular labor force participants have been harder hit than others over the transition to amarket economy.
x. The working poor. The decline in real wages is the main reason for growingpoverty amongst low-wage workers. Wage disparity has increased, mainly as a result ofprivate sector growth, but has contributed far less to the increase in poverty. However,wage dispersion remains amongst the lowest in CEE countries. Wage uncertainty has alsoincreased, as many employed do not receive their wages on time, or not at all, reducingworker welfare.
* Low-wage less educated workers have lost in both relative and absolute termsduring the transition. The returns to education are high in the country. Well educatedand top paid workers have gained in both absolute and relative terms over lesseducated and less paid workers.
* Private sector growth has helped employ a large number of the low-wage poor. Theprivate sector has grown mostly in trade, services, and in agriculture. Over half oflow-paid jobs are in the private sector.10 The private sector also employs the top paidworkers in the country.
* Poor informal sector workers complain of the occasional and seasonal nature ofwork, the inability to get wages on time, the problems of surviving the winter, and thedifficulties of starting up small enterprises (fees, limited collateral, and high interestrates). Seasonal workers have the highest poverty rates amongst all workers.
xi. The unemployed. In 1996, unemployment affected a large number of poor. Nearlyhalf of all poor live in households with one or more unemployed worker.
* The majority of the unemployed are new entrants to the labor force. Unlike manycountries in the region, layoffs comprise a small proportion of the unemployedindicating that limited entry, not exit is the reason for unemployment.
* The duration of unemployment is extremely high (relative to other countries in theregion). Unemploymnent of long duration discourages labor force participation,depreciates labor force skills, and signals a "less productive worker" to the employer.
'0 These results are from the 1996 Household Budget Survey (additional modules).
v
* New private sector hires match the characteristics of the unemployed. These are lesseducated, less skilled, and mainly urban workers. The only exception are women,who are least likely to be hired by the private sector. Women are also more likely toreceive lower wages for the same work, particularly in the private sector. I'
IV. Public Poverty Alleviation Programs: Does Public Spending Reach the Poor?
xii. The main social programs include: (i) the public health care system; (ii) the publiceducation system; and (iii) a cash transfer system, including a pay as you go publicpension system; means tested child allowances for the employed and two new programs-an unemployment insurance system, and a means tested social assistance systemestablished to combat increasing joblessness over the transition.
xiii. Real spending on social programs declined between 1990-96, as the economycontracted. The decline was not uniform across social programs. Real spending on health,education, and pensions fell sharply, but real spending on social assistance andunemployment insurance increased over the same period.'2 The composition of socialexpenditures has changed over the transition. The share of current social spending--unemployment benefits, pensions and social assistance programs increased--while theshare of investment spending on (mainly) health and education has declined. In 1996, theGovernment spent roughly 70% of total budget (30% of GDP) on these programs. Of thisthe largest share was spent on pensions (44%), followed by education (21%) and health(22%). Child allowances (1%), social assistance (4%), and unemployment benefits (8%)comprised only a small share of public outlays.
xiv. Education. The country has made significant gains in raising the education statusof the population. Younger cohorts-regardless of income, gender or rural/urban statusare much better educated than older persons. The gender gap has been virtuallyeliminated at all levels of the education system in both rural and urban areas. Moreover,in 1996, rural/urban and income differences have been virtually overcome in attendancein compulsory basic education. The main findings for 1996, are as follows:
xv. Quality of the education system. The quality of the education system, or itscontribution to learning, has not been formally assessed, either internally, or relative tointernational standards. Few students report being repeaters or dropouts and some schoolage children do not attend school because of failure and expulsion. This meritsconsiderable concern and bears further investigation.
xvi. Low enrollment rates of the poor. In 1996, enrollment rates-at all levels of theeducation system are lower than regional norms, but are the lowest for the rural poor,
" The Law on Labor Relations mandates equal pay for equal work. This problem is far less severe in the public sector.
12 An increase in real benefits and number of beneficiaries in both newly created programs explains this trend. Thedecline in real resources has also often caused benefit payment delays in all public transfers, compromising the povertyalleviation objectives of all cash transfer programs. Real declines in pension spending are a result of a fall in realbenefits; the number of pensioners increased over this period as a result of early retirement policies that were used tofacilitate large scale layoffs.
vi
particularly in secondary and higher education. The reasons for non-participation in theeducation system are diverse and include:
* Indirect costs: The need to earn a living to support their families is an importantreason for not participating in the secondary education system for the rural poor.Some secondary age children work. This is more characteristic of rural areas thanurban areas.' 3
* Direct costs: The cost of attending school is another reason for lack of participation inthe school system. The poor spend more on education per enrolled child (relative totheir income) than the rich. Books and supplies are the most important components ofprivate costs in primary and pre-school education. Transportation costs dominateprivate spending at the secondary and post-secondary levels, while admission fees areimportant at the tertiary level.
xxvii. Public spending on education is overall very effective and egalitarian, but thisresult varies across programs.
* Primary education is the most effective14 public program. Public spending on theprogram is also egalitarian. Primary education subsidies comprise nearly 13% oftotal consumption of the poor. The poor receive a share of education spending that isroughly equal to their share in the population.
* Secondary and higher education spending is less effective than primary educationspending,; it is also strongly non-poor. The top 20% of the population receives nearlyhalf of all spending on higher education and scholarships; and over 20% of totalspending on secondary education. The low effectiveness and efficiency of publicspending on education for the poor merits considerable concern.
xviii. Cash transfers. The four major cash transfer programs (pensions, social assistance,child allowances, unemployment benefits), taken together, have an important povertyalleviation impact. All else being equal, in the absence of public transfer programs theincidence of poverty would have been more than double the current level. The povertygap would be almost five times as high and the severity of poverty would be even moregreatly affected. (This analysis is based on first quarter 1997 household data).
xix. Pensions are extremely effective but very inefficient in targeting the poor. Thisis not surprising as pension benefits are linked to an individual's past wages. However,the pension system has the largest poverty alleviation impact of any cash transferprogram.
13 However, unemployment rates are high for this group as a whole. Result is from the Household Budget Survey,Additional Module, 1996.
'4 Effectiveness is measured as the share of public transfers or subsidies in household consumption. The higher thisshare the more effective the program. Efficiency is defined in terms of the share of public spending accruing to thepoor. Highly, or extremely efficient programs are those in which the share of public spending accruing to the poor ishigher than their share in total population. Egalitarian programs are those where the share of public spending on thepoor is equal to the share in total population Programs that are moderately efficient are those where the share inspending accruing to the poor is higher than their share in total consumption, but less than their share in totalpopulation. Inefficient programs are those where the share of public resources going to the poor are less than theirshare of total consumption.
vii
* The pension system has protected pensioners against poverty. Poverty rates areamongst the lowest for pensioners compared to other population groups. However,many elderly women are not covered by the pension system, and therefore have highpoverty rates. This is mainly the result of low labor force participation of women inthe past, which means that they do not receive pensions.
* The protection of pensioners against poverty has come at a very high fiscal costimposing a large tax burden on current workers. This decline in the number ofcontributors due to early retirement and growing unemployment and a very generouspension system (relative to other countries in the region) is the source of currentfinancial problems of the system. In the future, an aging population will lead toincreasing pension fund deficits.
xx. The means tested social assistance system, the only poverty alleviationprogram, is efficient and effective in reducing the incidence and depth of poverty. Inrecent years, the Government has made many changes to the program that have improvedits efficiency. In 1998, the Social Assistance Decree was revised to target benefits tohouseholds with incomes less than 60% of the poverty line. (Targeting all households upto the poverty line is not affordable for the Government.) Complicated adult/childequivalence scales were revised and work incentives introduced. In addition,administrative problems including an influx of beneficiaries on the same day, and fixedmonitoring of claims were addressed. However, problems that still plague the programinclude:
* Benefits have often not been paid on time. There are often two to three month delaysin benefit payments to the poor.
e The new decree may have reduced inclusion errors (many ineligible householdsreceiving assistance) which, in 1996, were found mainly in urban areas. Income isdifficult to measure in a transition economy, where income sources are variable andrecords and registration procedures are in a nascent form. As a result, the newprogram may have to be fine-tuned to adjust any remaining problems. The reportfinds that the exclusion errors (eligible households who do not receive assistance) ofthe social assistance program are very small.
* Information difficulties constrain delivery of benefits (to clients) and verification ofclaims (for social welfare officers). Social assistance recipients claim that lack ofinformation about the program, delayed benefits, and onerous documentationrequirements limit the program effectiveness. Social workers also relate difficulties inmonitoring and penalizing false claims.
xxi. Child allowance benefits are neither effective nor efficiently targeted to thepoor. Child allowances are a very small share of household income and they are not welltargeted to the poor.
xxii. Unemployment benefits are neither effective nor efficiently targeted to thepoor. Unemployment insurance benefits are progressive and do reduce poverty, thoughtheir impact is quite marginal. It should be noted that the primary purpose ofunemployment benefits is to replace income. The program is not intended to be pro-poor.

viii
xxiii. Institutional care. Some poor or disadvantaged groups are without families andare under the care of institutions. These groups, marginalized from traditional familystructures are perhaps the most disadvantaged groups in the population.
* A growing number of (mainly Macedonian) elderly are becoming institutionalized asfamily structures break down either due to financial problems or as a result of themigration of younger family members from rural to urban areas.
* Disabled children and adults are institutionalized under poor conditions and receivelimited care and attention. Their education possibilities are limited.
* Orphans are also a vulnerable group. There is a growing problem with olderinstitutionalized children (18 or so) who are having difficulty integrating into society,particularly given the lack of jobs. On the positive side, there appears to be somedemand for adoptive children in FYR of Macedonia. However, adoptive parents arenot screened properly and post-adoptive monitoring is limited.
* Disability allowances for children and foster care allowances have often beendelayed due to budgetary constraints.
VI. Policy Implications
xxiv. The profile of the poor suggests that medium to long term poverty alleviationprograms and policies should focus on six basic elements:
* The promotion of economic growth that increases employment and real wages tohelp alleviate poverty amongst the new poor. Easing rigidities in financial, land, andlabor markets would help ease constraints for the promotion of small and mediumenterprises.
* Investment in human capital (both its quality and availability), particularly of therural poor, to promote economic growth and alleviate long term poverty;
* Well targeted, financially viable cash transfers (with adequate work incentives),for the short term unemployed
* Investment in community infrastructure (water, sanitation, electricity), particularlyin rural areas, to improve living standards. This investment in physical infrastructuretogether with investment in education and health sector reform,15 would help improvethe health status of the population.
* Community-based care (and cash/in-kind transfers), based on an assessment of thefinancial and economic feasibility of these programs, for the chronic poor. Suchprograms could potentially focus on children at risk, disabled, and on non-pensionedelderly.
* Continuous poverty monitoring to identify changing poverty patterns and to assessthe impact of the Government's poverty alleviation programs.
Each element of this strategy is discussed in detail below.
15 Health reform issues are outside the scope of this report.
ix
xxv. Promote economic growth The decline in real income and wages, and growingjoblessness, are the main reasons for increasing poverty in the country, earlier and also asa result of the recent crisis. Thus, particularly once the Kosovo crisis has abated, and tradeis no longer constrained, efforts to promote economic growth that raise real wages andincrease employment will be essential for poverty reduction. Two positive trends can benoted by the report in this regard. First, private transfers, in the form of remittances, havebeen very important in improving household welfare and reducing poverty particularly inrural areas. Second, and more importantly, private sector growth has been concentrated inless skill intensive industries-agriculture and trade. This is a striking difference betweenFYR of Macedonia and other economies where the private sector has generated demandfor. highly skilled workers. As such, private sector growth has helped employ a large shareof the low-wage workers, particularly in rural agricultural jobs. Without thisdevelopment, the unemployment and rural poverty problems in the country would havebeen far worse. Growth in the private sector that is skewed towards the creation of lessskilled jobs should help reduce the depth of poverty amongst the unemployed.
xxvi. Measures to spur economic growth led by the private sector will need to focus onincreasing labor market flexibility. Labor market restrictions and a weak financial sectorcontinue to curtail robust economic activity. Labor turnover remains low and theunemployment rate had increased to over 30% by 1998. Despite privatization, laboradjustment remains incomplete. Many enterprises remain insolvent and over-staffed,supported through the accumulation of wage arrears and soft loans from banks. And,despite real declines in wages, labor costs (gross wages/GDP as well hiring/firingrestrictions, etc.) remain higher than in neighboring countries with similar levels ofincome. Efforts are also required to promote the development of efficient financialmarkets that would help lower the cost of capital to small entrepreneurs, and institutingland titling procedures that would allow individuals to use land as collateral for loans, andeasing fees and other restrictions on registration of small enterprises. Creating off farmemployment, and agricultural sector reforms that ease rigidities in the pricing, sales, andmarketing of agricultural products, and ensure that extension services and informationservices reach the poorest farmers.
xxvii. There are five caveats. First, the poor are concentrated along the poverty line. Thus,small changes in economic growth will have a large impact on poverty. However, it willtake considerable, sustained economic growth to reduce poverty completely. Second, thecreation of low-paid jobs will not reduce 'poverty' amongst workers. Given the large poolof unemployed and the potential for further layoffs, it will require a significant growth inreal wages of less skilled workers to reduce poverty amongst the employed. Third, privatesector growth may further increase disparities amongst workers. The worsening of thedistribution of income, even as the decline in consumption has leveled off, should bemonitored carefully. If recent trends are any guide, less educated individuals are the mostvulnerable to this process; Fourth, the resumption of growth will require an aggressiverestructuring of insolvent and overstaffed enterprises. While this will help improveeconomic performance over the long run, poverty amongst affected workers may actuallyincrease over the short term. Fifth, many poor, particularly those not capable of work,may not benefit directly from economic growth.
x
xxviii. Reduce labor market restrictions. Reducing labor market restrictions (wagerigidities, hiring/firing costs, high minimum mandatory benefits) that constrain theemployment of less skilled workers most vulnerable to the restructuring process will becritical for reducing poverty. Four measures are recommended:
* Reduce high labor costs. The Government has to take important steps in this regard:e.g. Hiring restrictions and excessive termination restrictions on small entrepreneursshould be reduced, and the court review of the rationale for small scale terminationsshould be severely curtailed.
* Reduce remaining labor market rigidities and adverse work incentives. Theseinclude: (i) eliminating or significantly reducing special benefits to unemployed with25 years of contributions. (ii) further reducing the duration of unemployment benefits.
* Reduce high payroll tax rates and contain the growing informalization of theeconomy by reforming the social insurance systems (health, pensions, andunemployment insurance). Arresting the informalization of the economy would helpimprove tax compliance, and allow an enforcement of (less restrictive) labor contracts(including addressing discrimination against women); promote timely payment ofwages in the private sector,
* Minimum wages, if introduced, should be kept low as possible. There is no publicminimum wage in the country and this policy should continue, given the high level ofunemployment of unskilled workers. Minimum wages tend to discriminate against thehiring of less skilled, poorer workers and perpetuate poverty amongst this group.However, if such public minimum wages are introduced, they should be kept as lowas possible.
xxix. Investment in human capital. Education has a high rate of return in FYR ofMacedonia. Investment in human capital is likely to be the most important longer-termpoverty alleviation and growth strategy for the country. The Government is in the processof developing an education sector strategy to improve the quality, efficiency, and equityof the education system. The strategy should also focus on improving the participation ofthe poor in the education system:
* Increase participation of the poor in the education system The participation of poorstudents at all levels of the education system should be increased, but efforts shouldfocus on the rural poor, and on secondary and higher education. Efforts should alsofocus on integrating minority populations (e.g., gypsies), and those with disabilities(cost effectively) into the education progran. While qualitative reports point to apotential cultural, security constraint to the participation of Albanian girls insecondary education, it was difficult to assess ethnic differences using available data.
* Reduce the direct costs of the education system. Reducing the costs of education forthe poor is one way of increasing their participation in the education system. Thedirect costs are essentially textbooks and books/supplies at the primary school level,transportation/boarding for the poor at secondary and higher education levels, andfees at the tertiary level. Introducing merit and needs based scholarships and re-
xi
directing boarding subsidies towards the poor might be considered for increasing theenrollment rates of poor students.
Improve efficiency of education spending, including targeting the poor. Realspending on education should not be reduced. However, there is scope for (i) shiftingpublic spending on education from non-poor to poor through greater cost recovery insecondary and higher education; (iii) shifting public spending over time away fromfinancing wage costs to non-wage investment costs; (iv) shifting social spending fromcurrent benefits (mainly, pensions) towards spending on education.
xxx. Investment in community infrastructure. Investment in water supply andsewerage availability will be essential, particularly in rural and peri-urban areas. Alongwith investment in education, this type of community-based investment would helpimprove the living standards and the health status of the poor. Lifeline electricity ratesthat provide a subsidized rate for the first few kilowatt hours used might be considered tohelp defray electricity costs for the poor.
xxxi. Well targeted cash transfers. Cash transfers, particularly pensions, help alleviatepoverty but at considerable costs. Spending on pensions should be reduced, while othercash benefits should be better targeted and include incentives to work.
xxxii. Reduce scope of public system and introduce private pensions. Alleviatingpoverty in old-age, in a fiscally sustainable way, requires major pension reform that willreduce the scope of the public system, and allow individuals to save in well regulatedprivately managed schemes. This reform would help reduce high payroll tax rates andshould help reduce poverty amongst the young without any adverse impact on pensioners.Over time, greater provision of private life and disability insurance would allowindividuals to obtain greater coverage against disability and loss of life of the earningmember.
xxxiii. Fine tune and monitor social assistance reforms. The program has been recentlyreformed, based in part on the findings of this report. The reform has eliminatedunjustified rural/urban differences in benefits levels, simplified a complex benefit scale,introduced work incentives, and improved benefits administration.
* Reduce Disincentives to Work. The level of the social assistance benefit isestablished on the basis of fiscal considerations with the poverty line as a point ofreference. However, minimum benefits also need to coordinated with wagedevelopments. Currently the minimum income for a single person household is 17%of average wage, but for a four person household (the average family size) theminimum income guarantee is 40% of wages. Given the growth in low-wage jobs,this level of benefit (almost equal to the minimum pension) reduces incentives towork. This benefit scale reflects recent reductions, but will have to be adjusteddownward in the future if it constrains the beneficiary outflow from the system. Inaddition, while the recent changes in the decree may have reduced inclusion errors,further tightening of eligibility conditions may be required to further reduce falseclaimants from gaining access to the system.
xii
* Work incentives may be difficult to administer and should be monitored carefully.The introduction of a term limit to social assistance of four years, and a gradualreduction in benefit over this time, may be difficult to enforce and administer. Theability of this incentive to keep individuals off social assistance rolls will have to bemonitored carefully and fine tuned over time.
* Pilot proxy means test approach to social assistance benefits This approach targetssocial assistance to the poor based on simple, identifiable characteristics of poverty,reducing the administrative burden of the social assistance system. Empiricalestimates indicate that such a program could help identify the bulk of the poor in thecountry, but an assessment of its fiscal costs and targeting efficiency vis. a vis. thecurrent program and potential implementation issues would require further work anda pilot test.
xxxiv. Phase out child allowance program. Targeting the small amount of childallowances to households with two or three or more children will not have a large impacton poverty reduction. In any case, the social assistance is fairly effective in reaching poorhouseholds with many children. One possibility will be to use the number of children asan indicator for poverty in a proxy means test for the social assistance system.
xxxv. Develop community-based approach to alleviate chronic poverty.Institutionalized care is costly, and removing individuals from their own communitiesreduces the welfare of the chronic poor. Developing a community-based care program,focusing on poverty alleviation for children at risk, disabled, and non-pensioned elderly,with NGO involvement and support could be the focal point, along with cash transfers, ofpoverty alleviation efforts for the chronic poor. To de-institutionalize vulnerable groups,foster and adoption programs might be publicized, and the screening and monitoring offoster and adoptive parents could be improved. A full evaluation of the costs andassociated benefits of this approach should be undertaken. Further child disabilityallowances, and allowances for foster parents, often delayed in the past, should beadequately budgeted and paid on time.
xxxvi. Improve poverty monitoring capacity. The Government has taken considerableinterest in understanding the nature of poverty in the country. The Poverty MonitoringGroup, comprised of members of the Ministry of Labor and Social Policy and the StatisticalOffice of FYR of Macedonia, has been active in participating in the development of thePoverty Report-both quantitative and qualitative aspects. The Group has expanded toinclude the Macedonian research community to evaluate the qualitative aspects of poverty.The poverty monitoring capacity of the Government could be improved through thefollowing measures:
* Monitor poverty incidence and the effectiveness and efficiency of cash transferprograms. The incidence of poverty, program effectiveness and efficiency measures,based on the Household Budget Survey, should be investigated on a regular basis.Periodic sampling of client concerns in all programs through a social assessment ofpoverty should be instituted for all main social programs. This social or client basedassessment could be carried out by the Ministry of Labor and Social Policy, with theinvolvement of other ministries, and with the assistance research institutes and the
xiii
Statistical Office. It could also be investigated through an add-on questionnaire alongwith the Household Budget Survey.
i Improvements in Household Survey sampling efficiency and measurement. Measuresinclude: improvements in the sampling efficiency of the survey, the measurement ofconsumption (less detailed), separation of the consumption and income modules, toreduce under-reporting of income.
I. POVERTY: CHARACTERISTICS AND TRENDS
1.01 The objective of this Poverty Assessment Report is to inform policies andprograms to address poverty in the forrner Yugoslav Republic of Macedonia. To this end,the report traces the evolution and characteristics of poverty; and evaluates theeffectiveness of public poverty alleviation programs in achieving their stated objectives.The important link between labor market status, education, cash transfers and povertyfound by the report has focused the Poverty Assessment on three key themes: (i) povertytrends and in-depth characteristics; (ii) labor markets and poverty; and (iii) povertyalleviation programs and policies (the education system and the cash transfer programs).These themes also serve to organize the chapters of this report. Two annexes support thisreport: Annex 1 Data and Measurement, discusses data, sources and limitations, and thebasic measures of welfare used in this report; and Annex 2: the Statistical Appendix.
1.02 The objective of the first chapter is to identify characteristics of the poor and thedetermninants of poverty. The first part of this chapter describes the development ofpoverty during the early years of the transition: 1990-96. This analysis is based on theHousehold Budget Survey carried out annually by the Statistical Office of Macedonia.The second part of the chapter describes poverty and its determinants in 1996. The resultspresented in this section are based on an 'add on' survey which increased the sample sizeand scope of the Household Budget Survey data collected in the final quarter of 1996.This was done in order to provide an in-depth review of the socio-economiccharacteristics of poverty. This entire chapter, and the chapters that follow, also rely on asocial assessment of poverty, based on in-depth interviews with the poor, thatcomplements the quantitative review of poverty. This social assessment was carried outin early 1998 by the Institute for Sociological and Political Research, in Skopje, incollaboration with academics and representatives of the Statistical Office and theMinistry of Labor and Social Policy.
1.03 The impact of the Kosovo crisis on poverty is described in a separate Box, "TheKosovo Crisis and Poverty" in the beginning of this report. As noted there, the conflictand ensuring economic disruption are likely to increase poverty by 3-4% and deepen itseffect on the vulnerable groups of poor identified in this report: the unemployed, low-wage workers, agricultural and rural households. The basic determinants of poverty,education and labor force status, and the concentration of poverty in rural areas are likelyto remain the same.
A. Defining the Poor
1.04 Describing poverty requires a definition of the poor. Consistent with OECDnorms, the Govermment of the former Yugoslav Republic of Macedonia has chosen arelative poverty line to define poverty in the country. According to this definition ofpoverty, individuals with an income (consumption) below 60% of median monthly 1996consumption -- or 33,061 Denars per year and 2755 Denars per month -- are defined aspoor (Annex 1). This official relative poverty line (approximately $50.00 per month or
2
Box 1.1 Perceptions of Poverty.
Hoqwpoor Maceonians xliin and experience poverty is inlencedby ir previous socio econonic staus. Thsose who were relatvly poor before consider poverty the minaility tO eet minimalneeds for food, cooking a tig fuel, shelter, and meia care. For bothfura and rura families,hunger is the worst aspect of poverty. A. villager sumnarized povety as thefct thtshe and herhusband eat only once a day so their children have enough to eat. Poor households "pray that they willnot become ill," consideriingillness "a death sentence" because they know they will not be able tomanage the many expenses that even insured households must pay. Peol who ihought of themselvespreviously ast middle fclass define poverty more broadly as the loss of social statuis, ihe impossibility ofbuying ;clothestfor their hildren, and the inability to enjoy cultural events or celebrate holidays, withfriends. Particularly urban households, which rely more than rual households oin electricity for heatingVand cooking.describe gettingtheir aelectricity cut as,a very humiliating sign of poverty IAn urbanwomanua explained: "Povetisthe fact they cut our electricity; this has already happened twvo timeslCan you imagine lif 0wioelecii the middle ofa city?"
"I was a common worker in a textile factory. When I worked, I was able to buy an apartmentanrd fumis it usini credits fon the factory "ere I worked and, fro the banks. Two years ago, whuenI had to buy a hearing aid, my ruest fr wasey f reuse thewh e hadworked my whole lifei ai where1lly lost my hearing."
Respondeits feel that the Goermethuld be vg a pams and opening factores toemploy people. Poor people. Theyose atories andMaleft he pepwtubad." Manyresponde,nts thoughtthat entpris m librately ran enterprises poorly so they col by: themcheaper during privatizarion: "Wh ewoiligforsstomnt yamanager who never wored inX our comany - lef1 75ple witut work." Rpdent who hnot been part of the skld abor fn pet o t owa ofeducation and work ualifications. Th 0 wh -used to w abroa 6blad ot couties foreffectivelyclosing Macoian bores by reusngtoissue vss. X: ; :: :S: : - I
$1.7 per day) to construct the poverty profile and evaluate the determinants of poverty inthis report. However, a slightly higher poverty line (70% of the 1995 median adultequivalent consumption) is used to profile changes in the level and composition ofpoverty over time.' This is because the small sample size of the Household BudgetSurvey (600 households) does not yield very sound results on the composition of the poorat the low level of consumption represented by the official poverty line. 2
1.05 The measurement of poverty is based on a few key indicators. The poverty rate(the incidence of poverty) is the proportion of poor in a particular group. Groups withhigh poverty rates may be small in relation to the total poor population. The proportionof a particular group in the total poor population is therefore important for identifyingthe size of the poverty problem. The expenditure gap ratio (hereafter referred to as thePoverty Gap)3 captures the difference between the average consumption of the poor andthe poverty line as a proportion of the poverty line. The greater this measure, the lowerinequality of income or consumption. The higher this measure, the greater the inequality
i The 1995 median adult equivalent consumption was used to construct the poverty line used for over-time analysis because this studywas completed before 1996 data became available. The 1996 data were later added to this analysis.
2 However, the report provides an assessment of changes in the poverty rates (national, rural, and urban) over the entire range ofpossible poverty lines (including the official poverty line).
The Poverty Gap differs from the Poverty Gap Index. [ See Annex 1]
3
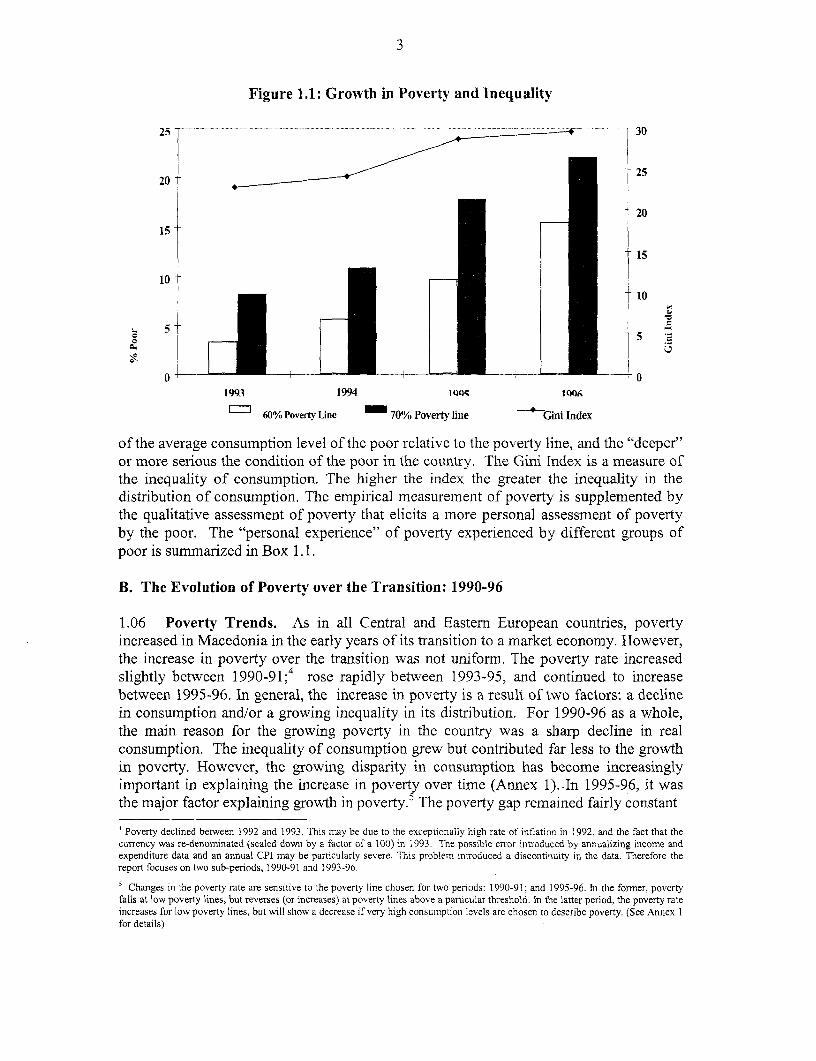
Figure 1.1: Growth in Poverty and Inequality
25 .T 30
20
20
15
15
1010
L. 5o ~~ ~~~~~~~~~~~~~~~~~~~~~~~5 ~
0 01993 1994 1 oo1 Q
60% Povertv Line - 70% Poverty line 'Gini Index
of the average consumption level of the poor relative to the poverty line, and the "deeper"or more serious the condition of the poor in the country. The Gini Index is a measure ofthe inequality of consumption. The higher the index the greater the inequality in thedistribution of consumption. The empirical measurement of poverty is supplemented bythe qualitative assessment of poverty that elicits a more personal assessment of povertyby the poor. The "personal experience" of poverty experienced by different groups ofpoor is summarized in Box 1. 1.
B. The Evolution of Poverty over the Transition: 1990-96
1.06 Poverty Trends. As in all Central and Eastern European countries, povertyincreased in Macedonia in the early years of its transition to a market economy. However,the increase in poverty over the transition was not uniform. The poverty rate increasedslightly between 1990-91;4 rose rapidly between 1993-95, and continued to increasebetween 1995-96. In general, the increase in poverty is a result of two factors: a declinein consumption and/or a growing inequality in its distribution. For 1990-96 as a whole,the main reason for the growing poverty in the country was a sharp decline in realconsumption. The inequality of consumption grew but contributed far less to the growthin poverty. However, the growing disparity in consumption has become increasinglyimportant in explaining the increase in poverty over time (Annex 1). -In 1995-96, it wasthe major factor explaining growth in poverty.5 The poverty gap remained fairly constant
4 Poverty declined between 1992 and 1993. This may be due to the exceptionally high rate of inflation in 1992, and the fact that thecurrency was re-denominated (scaled down by a factor of a 100) in 1993. The possible error introduced by annualizing income andexpenditure data and an annual CPI may be particularly severe. This problem introduced a discontinuity in the data. Therefore thereport focuses on two sub-periods, 1990-91 and 1993-96.
5 Changes in the poverty rate are sensitive to the poverty line chosen for two periods: 1990-91; and 1995-96. In the former, povertyfalls at low poverty lines, but reverses (or increases) at poverty lines above a particular threshold. In the latter period, the poverty rateincreases for low poverty lines, but will show a decrease if very high consumption levels are chosen to describe poverty. (See Annex Ifor details)
4
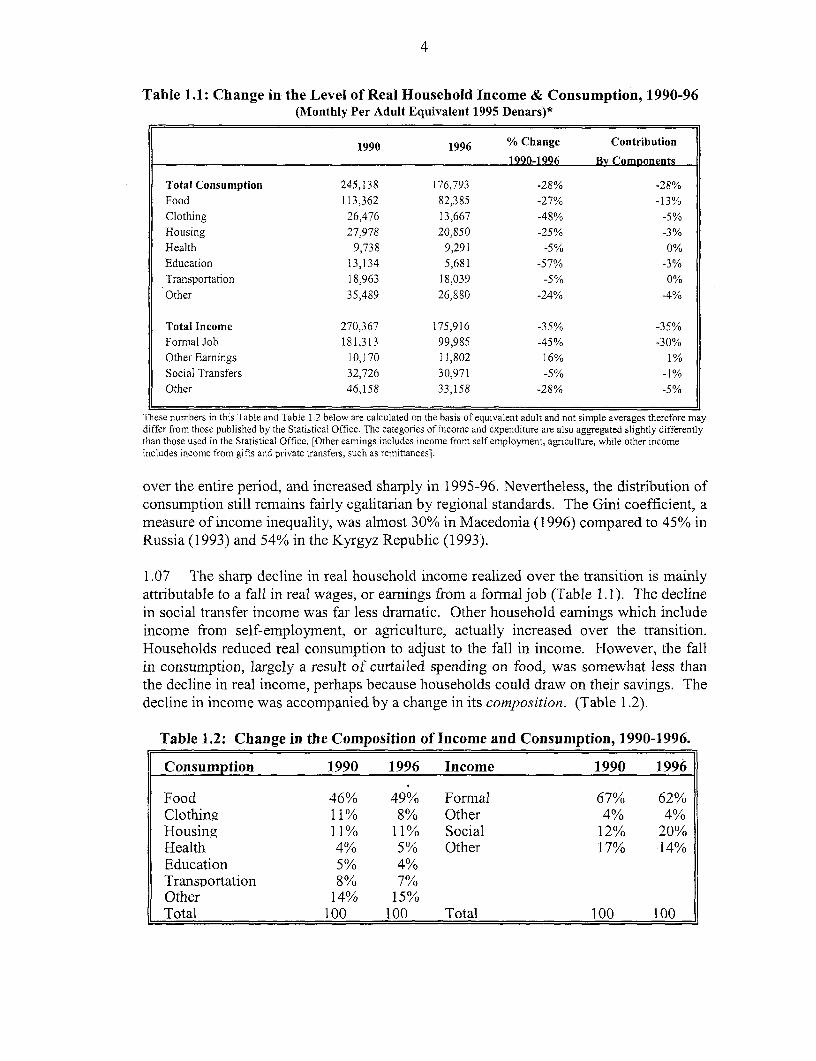
Table 1.1: Change in the Level of Real Household Income & Consumption, 1990-96(Monthly Per Adult Equivalent 1995 Denars)*
1990 1996 % Change Contribution1990-1996 By Components
Total Consumption 245,138 176,793 -28% -28%/oFood 113,362 82,385 -27% -13%Clothing 26,476 13,667 -48% -5%Housing 27,978 20,850 -25% -3%Health 9,738 9,291 -5% 0%Education 13,134 5,681 -57% -3%Transportation 18,963 18,039 -5% 0%Other 35,489 26,880 -24% -4%
Total Income 270,367 175,916 -35% -35%Formal Job 181,313 99,985 -45% -30%Other Earnings 10,170 11,802 16% 1%Social Transfers 32,726 30,971 -5% -1%Other 46,158 33,158 -28% -5%
Tihese numbers in this Table and Table 1.2 below are calculated on the basis of equivalent adult and not simple averages therefore maydiffer from those published by the Statistcal Office. The categories of income and expenditure are also aggregated slightly differentlythan those used in the Statistical Office. [Other eamings includes income from self employment, agriculture, while other incomeincludes income from gifts and private transfers, such as remittances].
over the entire period, and increased sharply in 1995-96. Nevertheless, the distribution ofconsumption still remains fairly egalitarian by regional standards. The Gini coefficient, ameasure of income inequality, was almost 30% in Macedonia (1996) compared to 45% inRussia (1993) and 54% in the Kyrgyz Republic (1993).
1.07 The sharp decline in real household income realized over the transition is mainlyattributable to a fall in real wages, or earnings from a formal job (Table 1.1). The declinein social transfer income was far less dramatic. Other household earnings which includeincome from self-employment, or agriculture, actually increased over the transition.Households reduced real consumption to adjust to the fall in income. However, the fallin consumption, largely a result of curtailed spending on food, was somewhat less thanthe decline in real income, perhaps because households could draw on their savings. Thedecline in income was accompanied by a change in its composition. (Table 1.2).
Table 1.2: Change in the Composition of Income and Consumption, 1990-1996.
Consumption 1990 1996 Income 1990 1996
Food 46% 49% Formal 67% 62%Clothing 11% 8% Other 4% 4%Housing 11% 11% Social 12% 20%Health 4% 5% Other 17% 14%Education 5% 4%Transportation 8% 7%Other 14% 15%Total 100 100 Total 100 100
5
Figure 1.2: Changing Composition of the Poor, 1990-1996.
Agriculture Agricultire
Non-agrlculture25% io-urculture
66%
iixed27%
43%
1990 1996
The share of income from a formal sector job declined, while the share of income fromsocial transfers increased commensurately. The composition of consumption did notchange greatly over this period. There was an increase in the share of a household'sspending on food and health, matched by small declines in the budget shares of clothing,transportation and education. Food remains the important consumption item, with atypical household spending roughly half of all expenditures on food (Table 1.2).
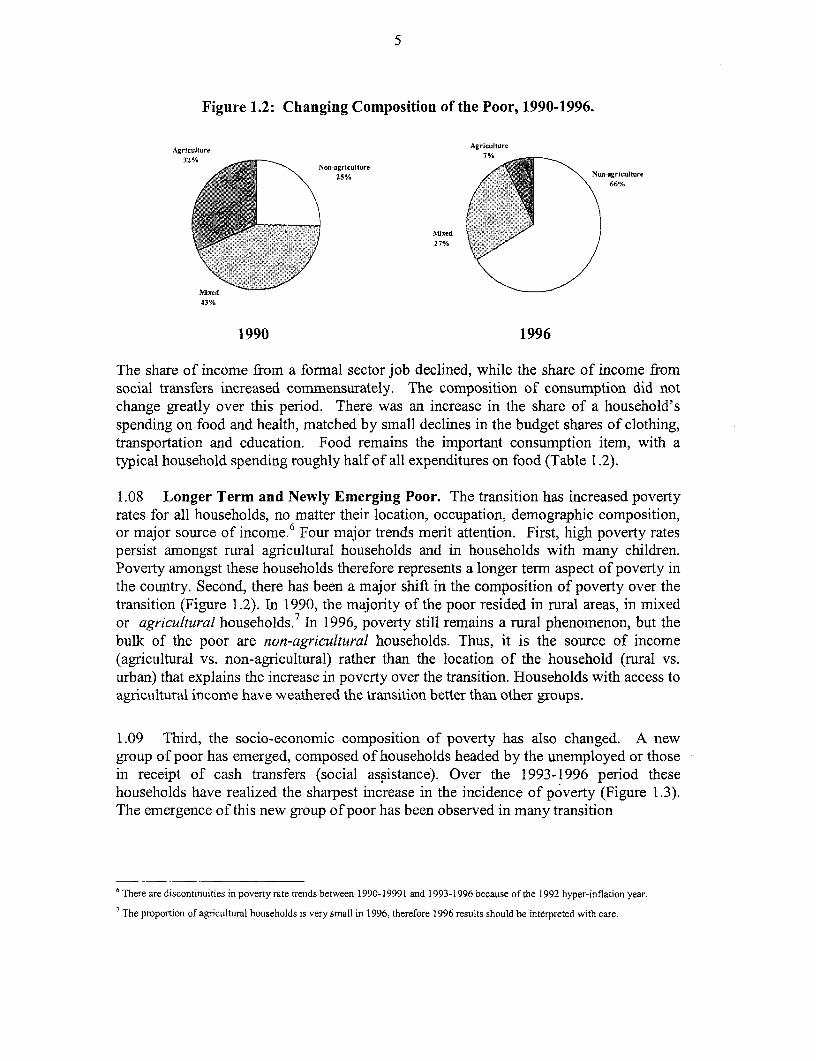
1.08 Longer Term and Newly Emerging Poor. The transition has increased povertyrates for all households, no matter their location, occupation, demographic composition,or major source of income.6 Four major trends merit attention. First, high poverty ratespersist amongst rural agricultural households and in households with many children.Poverty amongst these households therefore represents a longer term aspect of poverty inthe country. Second, there has been a major shift in the composition of poverty over thetransition (Figure 1.2). In 1990, the majority of the poor resided in rural areas, in mixedor agricultural households.7 In 1996, poverty still remains a rural phenomenon, but thebulk of the poor are non-agricultural households. Thus, it is the source of income(agricultural vs. non-agricultural) rather than the location of the household (rural vs.urban) that explains the increase in poverty over the transition. Households with access toagricultural income have weathered the transition better than other groups.
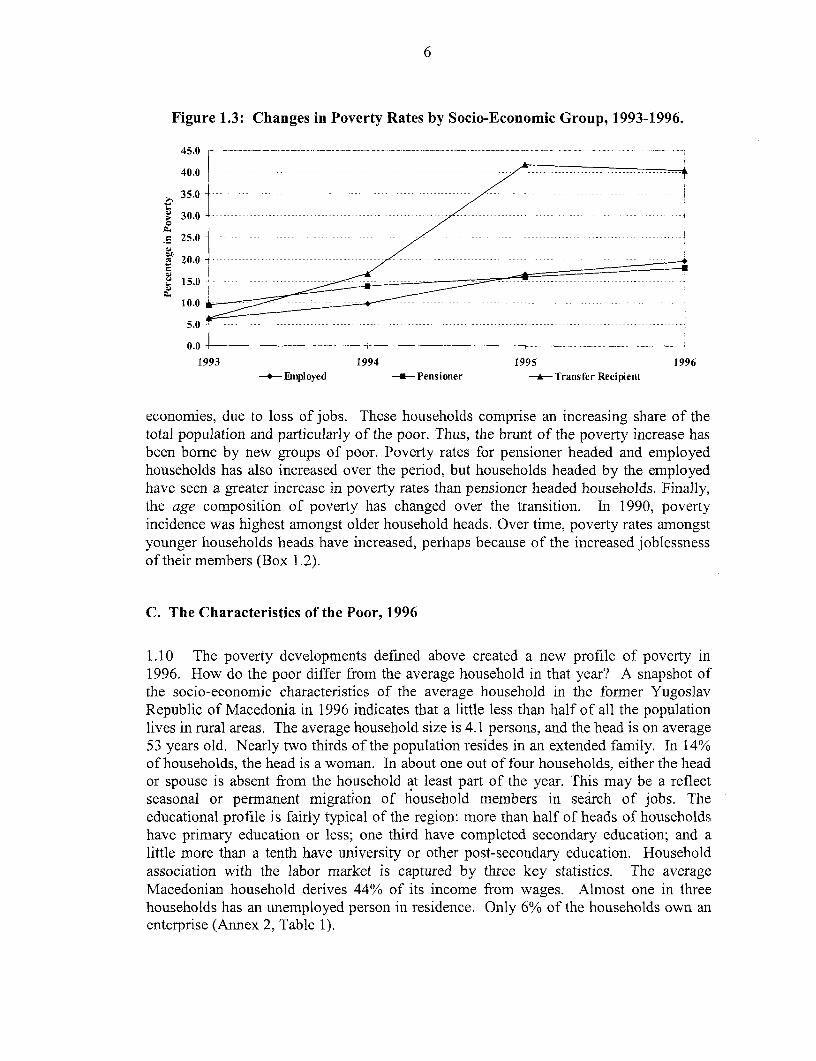
1.09 Third, the socio-economic composition of poverty has also changed. A newgroup of poor has emerged, composed of households headed by the unemployed or thosein receipt of cash transfers (social assistance). Over the 1993-1996 period thesehouseholds have realized the sharpest increase in the incidence of poverty (Figure 1.3).The emergence of this new group of poor has been observed in many transition
6 There are discontinuities in poverty rate trends between 1990-19991 and 1993-1996 because of the 1992 hyper-inflation year.
7 The proportion of agricultural households is very small in 1996, therefore 1996 results should be interpreted with care.
6
Figure 1.3: Changes in Poverty Rates by Socio-Economic Group, 1993-1996.
45.0 -~
4 0 .0 - - -- - - - -- - - - - - - - - - - -- - - -- - - - - - - - - - -- - - - - - - -- -- - - - - - -- -
> 3 5 .0 - - - -- - - - - - - - - - - - -- - - - - - -- - - - - -- - - - - - - - - - - - - - - - - - -
3 0 .0 - - - - - - - - - - - - - - - - - - - - - - -- - - - - - - - - - - - - - - - -2 50 - - - - - - - - - - - - - - - - - - - - - -- - - -- - - -
10.0
1993 1994 1995 1996-*-Ernployed -uPensioner -- Transfer Recipient
economies, due to loss of jobs. These households comprise an increasing share of thetotal population and particularly of the poor. Thus, the brunt of the poverty increase hasbeen borne by new groups of poor. Poverty rates for pensioner headed and employedhouseholds has also increased over the period, but households headed by the employedhave seen a greater increase in poverty rates than pensioner headed households. Finally,the age composition of poverty has changed over the transition. In 1990, povertyincidence was highest amongst older household heads. Over time, poverty rates amongstyounger households heads have increased, perhaps because of the increased joblessnessof their members (Box 1.2).
C. The Characteristics of the Poor, 1996
1.10 The poverty developments defined above created a new profile of poverty in1996. How do the poor differ from the average household in that year? A snapshot ofthe socio-economic characteristics of the average household in the former YugoslavRepublic of Macedonia in 1996 indicates that a little less than half of all the populationlives in rural areas. The average household size is 4.1 persons, and the head is on average53 years old. Nearly two thirds of the population resides in an extended family. In 14%of households, the head is a woman. In about one out of four households, either the heador spouse is absent from the household at least part of the year. This may be a reflectseasonal or permanent migration of household members in sea-rch of jobs. Theeducational profile is fairly typical of the region: more than half of heads of householdshave primary education or less; one third have completed secondary education; and alittle more than a tenth have university or other post-secondary education. Householdassociation with the labor market is captured by three key statistics. The averageMacedonian household derives 44% of its income from wages. Almost one in threehouseholds has an unemployed person in residence. Only 6% of the households own anenterprise (Annex 2, Table 1).
7
Table 1.3: Poverty and Inequality Indicators, 1996.
Poverty Gap Pove'ty Comrposition of Composition ofPoverty Rate Index Severity Index Poverty Gap Poor Population
Type of SettlementTotal 18.1 3.9 1.3Urban 10.2 1.9 0.6 18.6 32.1 54.5Rural 25.7 5.8 2.0 22.6 67.9 45.5
RegionNorthwest 18.4 5.2 1.9 28.3 21.6 20.2Northeast 23.5 5.2 1.8 22.1 36.7 26.9Southwest 13.9 2.0 0.5 14.4 15.0 18.5Southeast 6.8 1.2 0.3 17.6 4.6 11.5
Socio-economic CategoryAgricultural 25.3 4.1 1.0 16.2 10.8 7.3Mixed 15.2 4.3 1.6 28.3 23.4 26.6Non-agricultural 17.2 3.4 1.1 19.8 65.9 66.1
Children < 18years0 9.1 2.0 0.7 22.0 14.1 26.61 11.7 2.3 0.6 19.7 13.5 20.02 14.6 2.5 0.8 17.1 28.6 33.8>3 38.6 9.5 3.4 24.6 43.8 19.6
Gender ofMembersMale 17.7 3.9 1.3 22.0 51.6 50.2Female 16.8 3.5 1.2 20.8 48.4 49.8
Age of Members0 to 5 22.3 4.7 1.6 21.2 10.0 7.86 to 18 20.9 4.5 1.5 21.5 26.8 22.119to29 20.6 4.8 1.7 23.3 20.0 16.730 to 39 17.0 3.5 1.2 20.6 14.3 14.540 to 49 12.4 2.7 0.8 21.8 9.9 13.850to59 11.0 2.5 1.0 22.7 6.7 10.6>60 14.5 2.8 0.8 19.3 12.2 14.6
Education of HeadPrimary(<4years) 22.9 5.4 2.0 23.6 36.8 27.7Primary(5-8 years) 25.1 5.7 1.9 22.7 44.4 30.5Specialized Secondary 8.2 1.2 0.3 14.6 14.6 30.5High School 8.5 1.1 0.2 12.9 2.6 5.3University 4.9 0.7 0.1 14.3 1.6 5.5
Socio-economicStatus of HeadEmployed (non-Farm) 15.4 3.1 1.0 20.1 33.9 37.9Farmer 28.4 5.3 1.4 18.7 15.9 9.6Unemployed 31.2 7.7 2.5 24.7 12.7 7.0Pensioner 12.7 2.2 0.7 17.3 16.5 22.4Employed(Farmer) 8.8 2.7 1.1 30.7 5.1 10.1Pensioner(Farmer) 13.4 4.7 2.1 35.1 6.1 7.8Seasonal Worker 27.5 3.9 1.0 14.2 4.0 2.5Other 37.5 9.8 4.5 26.1 5.8 2.7
8
Figure 1.4: Poverty and Socio-Economic Status
Transfer Recipient _l l l l l ' t ~~~~~~~~~~~37S 5
Unemployed 31.2
Farmer 28 4
Seasonal Worker 27.5
Employed (non-farmers) 15.4
Pensioner (farmer) 13.4
Pensioner 12.7
Employed (farmer) 8 8 __. .l ._____ _ _. _ _ _.
0 5 10 15 20 25 30 35 40
Percent Poor
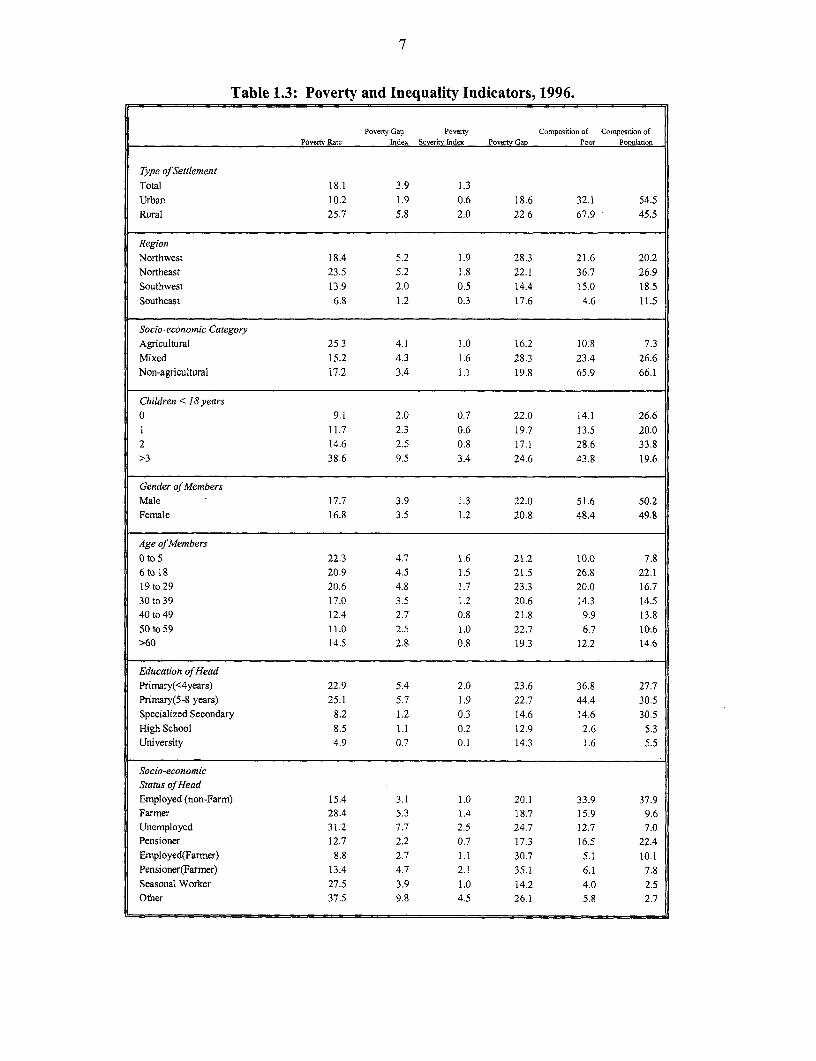
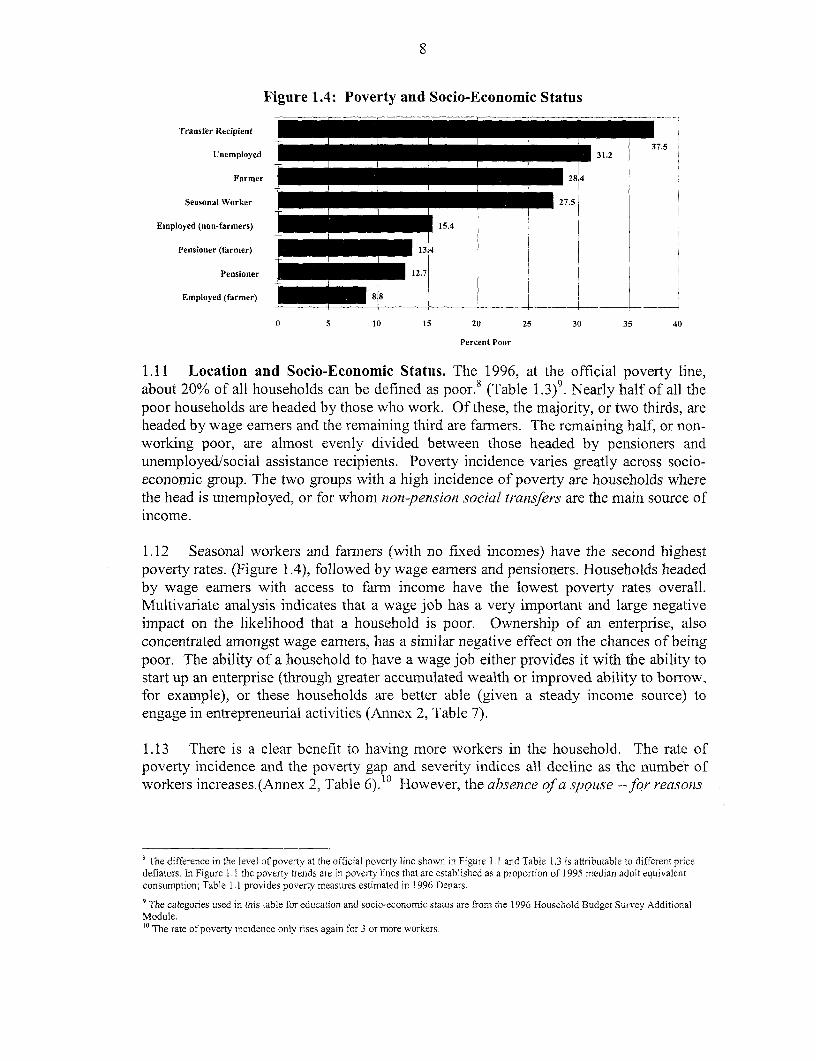
1.11 Location and Socio-Economic Status. The 1996, at the official poverty line,about 20% of all households can be defined as poor.8 (Table 1.3)9. Nearly half of all thepoor households are headed by those who work. Of these, the majority, or two thirds, areheaded by wage earners and the remaining third are farmers. The remaining half, or non-working poor, are almost evenly divided between those headed by pensioners andunemployed/social assistance recipients. Poverty incidence varies greatly across socio-economic group. The two groups with a high incidence of poverty are households wherethe head is unemployed, or for whom non-pension social transfers are the main source ofincome.
1.12 Seasonal workers and farners (with no fixed incomes) have the second highestpoverty rates. (Figure 1.4), followed by wage earners and pensioners. Households headedby wage earners with access to farm income have the lowest poverty rates overall.Multivariate analysis indicates that a wage job has a very important and large negativeimpact on the likelihood that a household is poor. Ownership of an enterprise, alsoconcentrated amongst wage earners, has a similar negative effect on the chances of beingpoor. The ability of a household to have a wage job either provides it with the ability tostart up an enterprise (through greater accumulated wealth or improved ability to borrow,for example), or these households are better able (given a steady income source) toengage in entrepreneurial activities (Annex 2, Table 7).
1.13 There is a clear benefit to having more workers in the household. The rate ofpoverty incidence and the poverty gap and severity indices all decline as the number ofworkers increases.(Annex 2, Table 6).10 However, the absence of a spouse --for reasons
The difference in the level of poverty at the official poverty line shown in Figure 1. 1 and Table 1.3 is attributable to different pricedeflators. In Figure 1. I the poverty trends are in poverty lines that are established as a proportion of 1995 median adult equivalentconsumption; Table 1.1 provides poverty measures estimated in 1996 Denars.
9 The categories used in this table for education and socio-economic status are from the 1996 Household Budget Survey AdditionalModule.1' The rate of poverty incidence only rises again for 3 or more workers.
9
Box 1.2 Poverty and Youth.
Poor respondents concurred that the economic situation is hardest on youth. Parents regretted thattheir children would never have the opportunities they had enjoyed. Most of the jobless youthinterviewed expressed disappointment and pessimism about their future. Alen explained that hewondered "whether it's better to work or not to work. If I could get a job and receive the averageMacedonian salary. I would only have enough money to eat a bit better, and a whole life would not belong enough for me to save enough money to buy mnyself an apartment or a car."
Young Macedonians feel socially isolated and saw their unemployment as the main reason. Theyavoid associating with people their own age because they could not afford to socialize (which inMacedonia mneans gathering in bars and cafes), Vasil, 20, told us, "I feel useless in this society. I amlooking for a job and can't find one. I don't want to ask my parents for money because I know they don'thave it. I avoid girls because I am ashamed of finding myself in a situation where I couldn't at least payfor my own drink."
of work -- actually increases household welfare and reduces the likelihood of being poor.At least 2/3 of the cases with this characteristic are female heads of household and inmost cases the reason for absence is migrant labor. These households likely have accessto remittances which may help explain their low rate of poverty. Finally, being a recentmigrant also reduces the likelihood of poverty, but labor mobility appears limited -- thereare only 2% of all households that report having migrated.
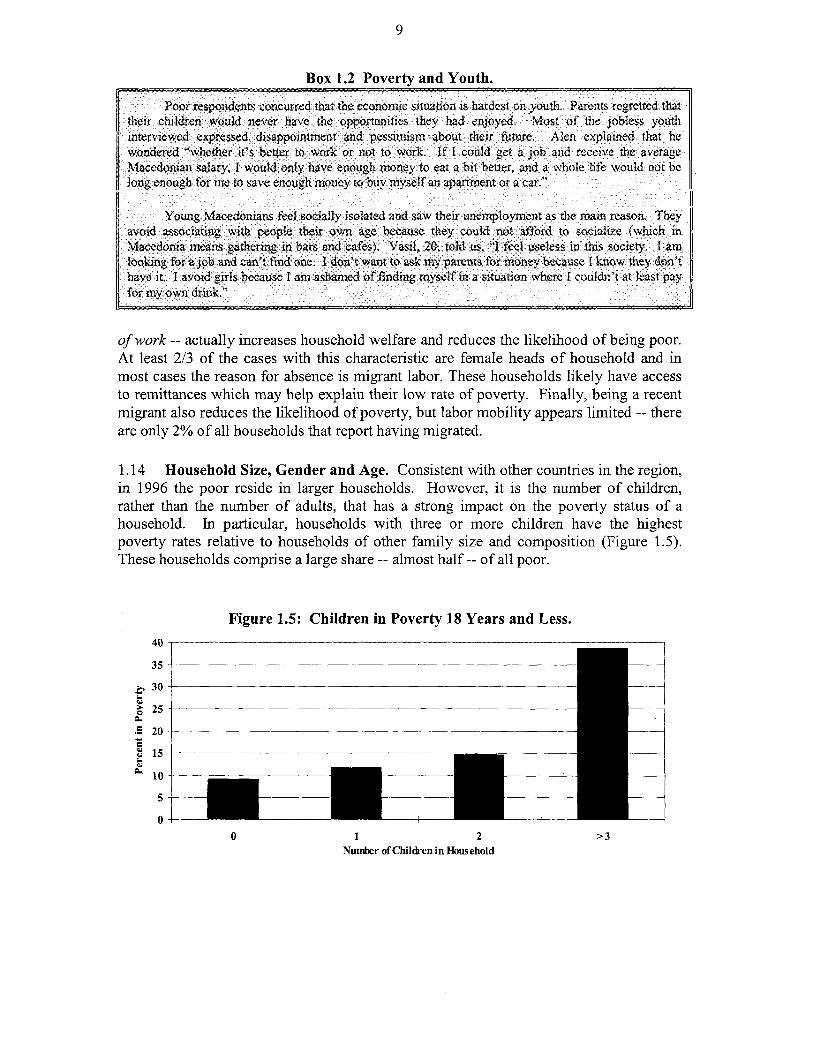
1.14 Household Size, Gender and Age. Consistent with other countries in the region,in 1996 the poor reside in larger households. However, it is the number of children,rather than the number of adults, that has a strong impact on the poverty status of ahousehold. In particular, households with three or more children have the highestpoverty rates relative to households of other family size and composition (Figure 1.5).These households comprise a large share -- almost half -- of all poor.
Figure 1.5: Children in Poverty 18 Years and Less.
40 -
35-
.S 20
15
10
5-
0-
0 1 2 >3Numner of Children in Household
10
1.15 Poverty rates are lower for female vs. male headed households. Female heads ofhouseholds are on average ten years older than male heads of household, and have lessformal education. However, female headed households are smaller in size, have fewerunemployed members, are not agricultural, and derive their income mainly frompensions. The latter four factors mitigate the likelihood that a female-headed householdis poor. Once these factors are accounted for however, there is no net effect of the genderof the household head on poverty.
1.16 A simple correlation of poverty with age indicates that the incidence of povertyremains somewhat higher at lower ages and amongst the aged. (Annex 2, Table 17).Children and individuals younger than 30 are more likely to be poor than older persons.However, the very aged are also poor. A pronounced life cycle effect is evident withwelfare increasing until age 62 and declining thereafter. The probability of being poorincreases sharply after age 67 (Annex 2, Table 7).
1.17 Education and Health. The education status of the household head plays afundamental role in determining the household's poverty status (Figure 1.6). Householdsheaded with individuals with primary education have the highest rates of poverty andaccount for a staggering 80% of the poor population. (Table 1.3). Households with lesseducated heads have greater poverty gaps as well. Multivariate analysis,1 I which assessesthe relative importance of each particular characteristic (while controlling for other keyfactors) indicates that education has a very large positive impact on household welfare in
Figure 1.6: Poverty and Educational Status of Head of Household.30-
25
t20-
15
10
Primary (5-8 yrs) Primary (>4yrs) Secondary Spec. Secondary Tertiary
Level of Education
These results remain the same even if the poverty line is maintained at 60% median consumption.

11
Figure 1.7: Health and Poverty.
35 5.0
34' 25 _ _ __ ___ __ ____=_
30 ~ ~ ~ ~ ~ ~ .
C 20 2. 0
15 ~~~~~~~~~~~~~~~~~2.0
510 1.5U
0 0.0-Poor Non-Poor Poor Non-Poor
Macedonia. (Annex 2, Table 7). This is both good and bad news from the point of viewof poverty alleviation. The good news is that younger people are better educated thancurrent heads of household, so that over time this will lead to higher welfare and lowerpoverty. The bad news is that current poor households with heads who have primaryeducation or less, and who form the bulk of the poor, have an average age of 53.5 years,and may not realize real gains in income to escape poverty in the near future. (Annex 2,Table 1).
1.18 Poor health status is also associated with low-income households. Slightly morepoor vs. non-poor household members report having health problems. Poor householdsalso report more sick days per year and more work days lost due to illness (Figure 1.7).However, these average tendencies do not appear to translate into a strong correlationbetween poverty and health problems. More days ill and more work days lost due toillness are not associated with greater poverty rates. In fact, the number of work days lostis negatively associated with poverty, suggesting that these households are coping inother ways, such as through social transfers. The exception is the presence of disabledmembers who contribute to higher incidence of poverty (Annex 2, Table 8).
1.19 Consumption, Assets, and Living Conditions. In 1996, the consumption of thepoorest decile was less than one-sixth of the level of consumption of the richesthouseholds (Annex 2: Table 2). As in other countries, food comprises a greater share ofexpenditures of the poor (54%) relative to the non-poor (46%). (Annex 2, Table 25). Theshare of in-kind food in total food expenditures is also much higher for the poor. Theownership of assets, durable goods, and basic amenities, also increases with the level ofhousehold wealth12 . Most poor own far less land than the rich.
12 The measure of consumption used does not include income flows from durables and housing. However, the consumption variable soconstructed is closely correlated to ownership of land, durables and living conditions, and therefore paints an accurate picture ofwealth.

12
Figure 1.8: Ownership of Assets
90 -
80
70 -
60
O 50
40
20
10
0
1 2 3 4 5 Decile 6 7 8 9 10
~ Car -0 Phone Land
Moreover, the ownership of cars and phones are far more concentrated amongst the richthan the poor (Figure 1.8). The largest disparities amongst household amenities occur forindoor water supply, central heating, and sewage systems (Figure 1.9). The availabilityof electricity is almost universal amongst Macedonian households. However, poorerMacedonians have considerable difficulty in meeting electricity payments (Box 1.3). Theliving conditions of Gypsy families are particularly abysmal (Box 1.4).
Figure 1.9: Household Amenities.
100
90
Pe 80rcent 70 -
e 60With 50Ame 40
nit 30y
20
10
0
1 2 3 4 5 Decile 6 7 8 9 10
Water Supply 1Sewer System + Electricity Central Heating
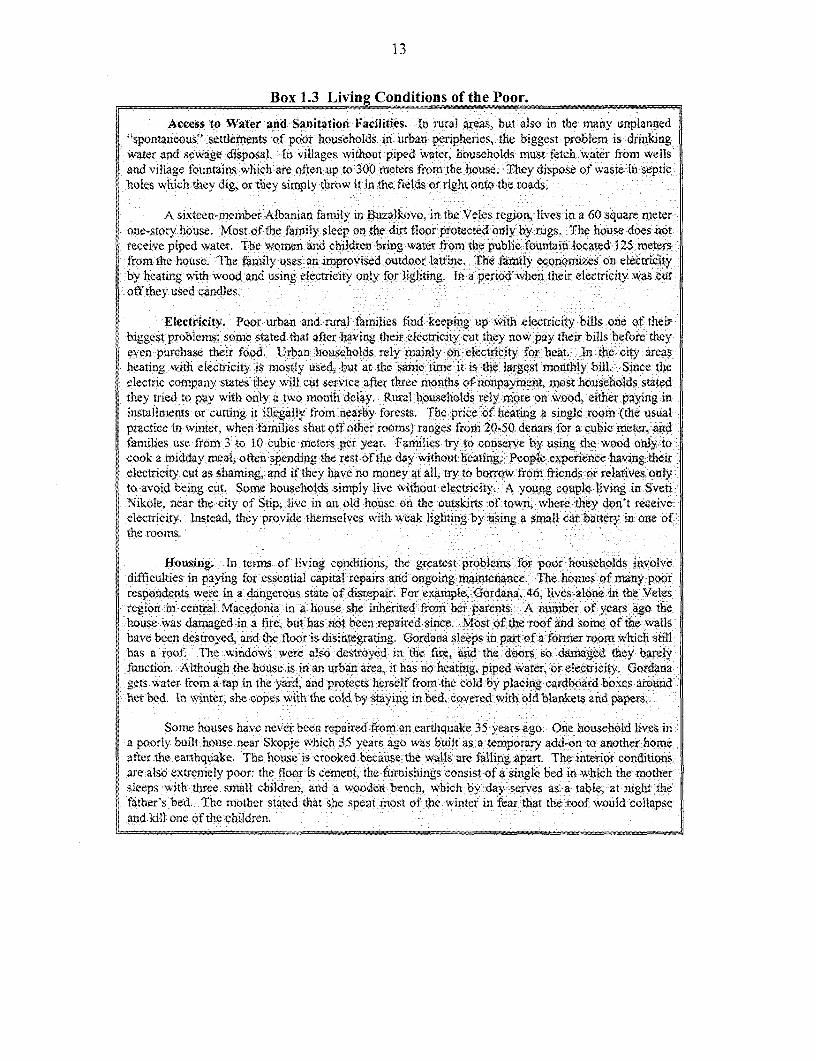
13
Box 1.3 Living Conditions of the Poor.
Access to Water and Sanitation Facilities. In rural areas, but also in the many unplanned'*spontaneous" settlements of poor households in urban peripheries, the biggest problem is drinkingwater and sewage disposal. In villages without piped water, households must fetch water from wellsand village fountains which are often up to 300 meters from the house. They dispose of waste in septicholes which they dig, or they simply throw it in the fields or right onto the roads.
A sixteen-member Albanian fanmily in Buzalkovo, in the Veles region, lives in a 60 square meterone-story house. Most of the family sleep on the dirt floor protected only by rugs. The house does notreceive piped water. The women and children bring water from the public fountain located 125 metersfrom the house. The family uses an improvised outdoor latrine. The family economizes on electricityby heating with wood and using electricity only for lighting. In a period when their electricity was cutoff they used candles.
Electricity. Poor urban and rural farnilies find keeping up with electricity bills one of theirbiggest problems; some stated that after having their electricity cut they now pay their bills before theyeven purchase their food. Urban households rcly mainly on electricity for heat. In the city areasbeating with electricity is mostly used, but at the same time it is the largest monthly bill. Since theelectric company states they will cut service after three months of nonpayment, most households statedthey tried to pay with only a two month delay. Rural households rely more on wood, either paying ininstallments or cutting it illegally from nearby forests. The price of hearing a single room (the usualpractice in winter, when families shut off other rooms) ranges from 20-50 denars for a cubic meter, andfamilies use from 3 to 10 cubic meters per year. Families try to conserve by using the wood only tocook a midday meal. often spending the rest of the day without heating. People experience having theirelectricity cut as shaming. and if they have no money at all, try to borrow from friends or relatives onlyto avoid being cut. Some households simnply live without electricity. A young couple living in SvetiNikole, near the city of Stip, live in an old house on the outskirts of town, where they don't receiveelectricity. Instead, they provide themselves with weak lighting by using a small car battery in one ofthe rooms.
Housing. In terms of living conditions, the greatest problems for poor households involvedifficulties in paying for essential capital repairs and ongoing maintenance. The homes of many poorrespondenits were in a dangerous state of disrepair. For example, Gordana, 46, lives alone in the Velesregion in central Macedonia in a house she inherited from her parents. A number of years ago thehouse was damaged in a fire, but has not been repaired since. Most of the roof and some of the wallshave been destroyed, and the floor is disintegrating. Gordana sleeps in part of a former room which stillhas a roof. The windows were also destroyed in the fire, and the doors so damaged they barelyfunction. Although the house is in an urban area, it has no heating, piped water, or electricity. Gordanagets water from a tap in the yard, and protects herself from the cold by placing cardboard boxes aroundher bed. In winter, she copes with the cold by staying in bed, covered with old blankets and papers,
Some houses have ncver been repaired from an earthquake 35 years ago. One household lives ina poorly built house near Skopje which 35 years ago was built as a temporary add-on to another homeafter the earthquake. The house is crooked because the walls are falling apart. The interior conditionsare also extremely poor: the floor is cement, the furnishings consist of a single bed in which the mothersleeps with three small children, and a wooden bench, which by day servcs as. a table, at night thefather's bed. The mother stated that she spent most of the winter in fear that the roof would collapseand kill one of the children.
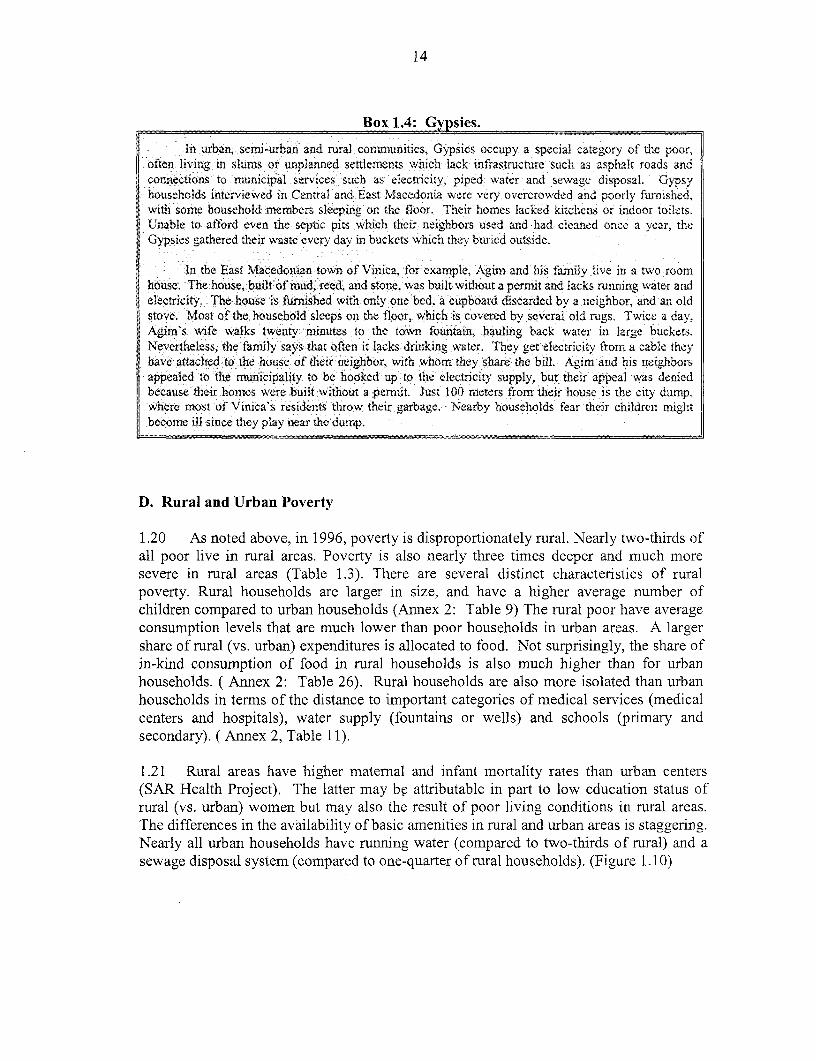
14
Box 1.4: Gypsies.
In urban, semi-urban and rural comnunities, Gypsies occupy a special category of the poor,often living in slums or unplannied settlements which lack infrastructure such as asphalt roads andconnections to municipal services such as, electricity, piped water and sewage disposal. Gypsyhouseholds interviewed in Central and East Macedonia were very overcrowded and poorly furnished,with some household members sleeping on the floor. Their homes lacked kitchens or indoor toilets.Unable to afford even the septic pits which their neighbors used and had cleaned once a year, theGypsies gathered their waste every day in buckets which they buiried outside.
In the East Macedonian town of Vinica, for example, Agim and his family live in a two roomhouse. The house, built of miid, reed, and stone, was built without a perrnit and lacks running water andelectricity. The house is Rnished with only one bed. a cupboard discarded by a neighbor, and an oldstove. Most of the household sleeps on the floor, which is covered by several old rugs. Twice a day,Agim's wife walks twenty nminutes to the town fountain, hauling back water in large buckets.Nevertheless, the family says that often it lacks drinking water. They get electricity from a cable theyhave attached to the house of their neighbor, with whom they share the bill. Agim and his neighborsappealed to the municipality to be hooked up to the electricity supply but their appeal was deniedbecause their homes were built without a permit. Just 100 meters from their house is the city dump,where most of Vinica's residents throw their garbage. Nearby households fear their children mightbecome ill since they play near the dump.
D. Rural and Urban Poverty
1.20 As noted above, in 1996, poverty is disproportionately rural. Nearly two-thirds ofall poor live in rural areas. Poverty is also nearly three times deeper and much moresevere in rural areas (Table 1.3). There are several distinct characteristics of ruralpoverty. Rural households are larger in size, and have a higher average number ofchildren compared to urban households (Annex 2: Table 9) The rural poor have averageconsumption levels that are much lower than poor households in urban areas. A largershare of rural (vs. urban) expenditures is allocated to food. Not surprisingly, the share ofin-kind consumption of food in rural households is also much higher than for urbanhouseholds. ( Annex 2: Table 26). Rural households are also more isolated than urbanhouseholds in terms of the distance to important categories of medical services (medicalcenters and hospitals), water supply (fountains or wells) and schools (primary andsecondary). ( Annex 2, Table 11).
1.21 Rural areas have higher maternal and infant mortality rates than urban centers(SAR Health Project). The latter may be attributable in part to low education status ofrural (vs. urban) women but may also the result of poor living conditions in rural areas.The differences in the availability of basic amenities in rural and urban areas is staggering.Nearly all urban households have running water (compared to two-thirds of rural) and asewage disposal system (compared to one-quarter of rural households). (Figure 1. 10)
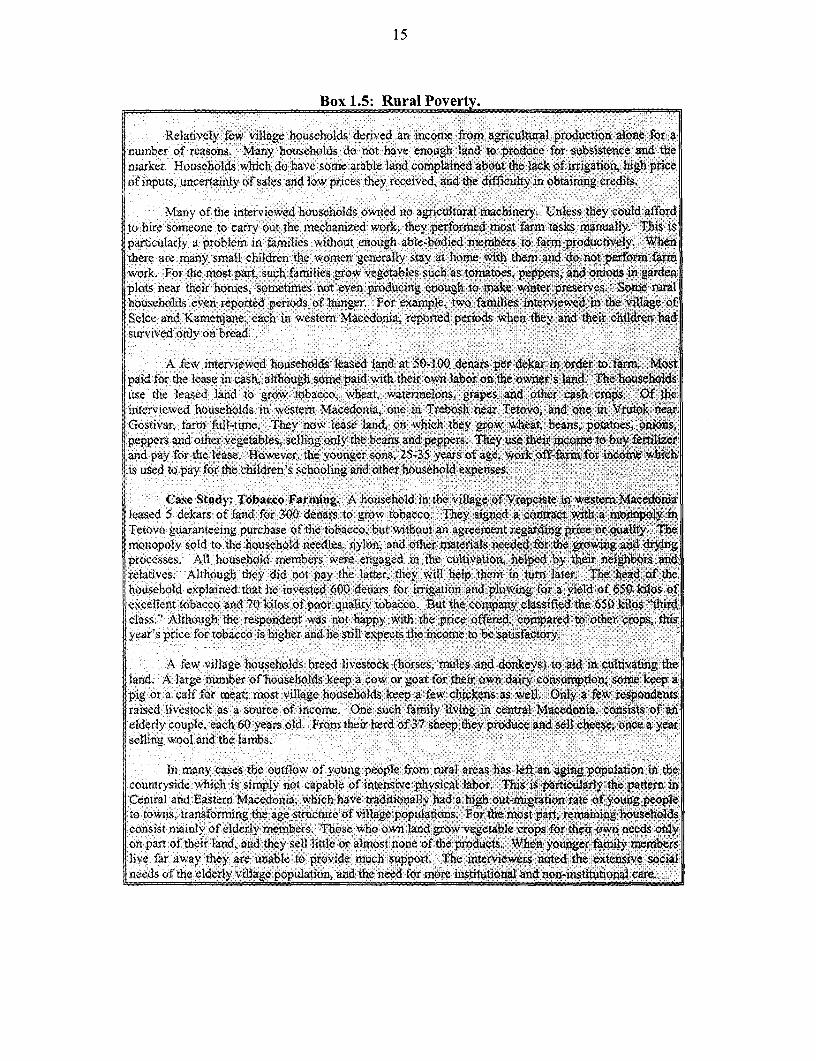
15
Box 1.5: Rural Poverty.
Relatively few village households derived an income from agricultural production alone for anumber of reasons. Many households do not have enough land to produce for subsistence and themarket. Households which do have some arable land complained about the lack of irrigation, high priceof inputs, uncertainly of sales and low prices they received, and the difficulty in obtaining credits.
Many of the interviewed households owned no agricultural machinery. Unless they could affordto hire someone to carry out the mechanized work, they performed most farm tasks manually. This isparticularly a problem in families without enough able-bodied members to farm productively. Whenthere are many small children the women generally stay at home with themn and do not perform famrwork. For the most part, such faniilies grow vegetables such as tomatoes, peppers, and onions in gardenplots near their homes, sometimes not even producing enough to make winter preserves. Some ruralhouseholds even reported periods of hunger. For example, two families interviewed in the vilage ofSelce and Kamenjane, each in western Macedonia, reported periods when they and their children hadsurvived only on bread.
A few interviewed households leased land at 50-100 denars per dekar in order to farnm Mostpaid for the lease in cash, although some paid with their own labor on the owner's land. The householdsuse the leased land to grow tobacco, wheat, watermelons, grapes and other cash crops. Of theinterviewed households in western Macedonia, one in Trebosh near Tetovo, and one in Vrutok nearlGostivar, farm full-time. They now lease land, on which they grow wheat, beans, potatoes, onions,peppers and other vegetables, selling only the beans and peppers. They use their income to buy fertilizerand pay for the lease, However, the younger sons, 25-35 years of age, work off-farm for income whichis used to pay for the children's schooling and other household expenses.
Case Study: Tobacco Farming. A household in the village of Vrapciste in western Macedonialeased 5 dekars of land for 300 denars to grow tobacco. They signed a contract with a monopoly inTetovo guaranteeing purchase of the tobacco, but without an agreement regarding price or quality. Themonopoly sold to the household needles, nylon, and other materials needed for the growing and dryingprocesses. All household members were engaged in the cultivation, helped by their neighbors andrelatives. Although they did not pay the latter, they will help them in turn later, The head of thehousehold explained that he invested 600 denars for irrigation and plowing for a yield of 650 kllos ofexcellent tobacco and 70 kilos of poor quality tobacco. But the company classified the 650 kilos "thirdclass." Although the respondent was not happy with the price offered, compared to other crops, thisyear's price for tobacco is higher and he still expects the income to be satisfactory.
A few village households breed livestock (horses, mules and donkeys) to aid in cultivating theland. A large number of households keep a cow or goat for their own dairy consumnption; some keep apig or a calf for meat; most village households keep a few chickens as well. Only a few respondentsraised livestock as a source of income. One such farnily living in ceral Macedonia. consists of anelderly couple, each 60 years old. From their herd of 37 sheep they produce and sell cheese, once a yearselling wool and the lambs.
In many cases the outflow of young people from rural areas has left an aging population in the.countryside which is simply not capable of intensive physical labor. This is particularly the pattern inCentral and Eastem Macedonia, which have traditionally had a high out-migration rate of young peopleto towns, transforming the age structure of village populations. For the most part, remaining householdsconsist mainly of elderly members. Those who own land grow vegetable crops for their own needs onlyon part of their land, and they sell little or almost none of the products. When younger funily memberslive far away they are unable to provide much support. The interviewers noted the extensive socialneeds of the elderly village population, and the need for more institutional and non-institutional care.
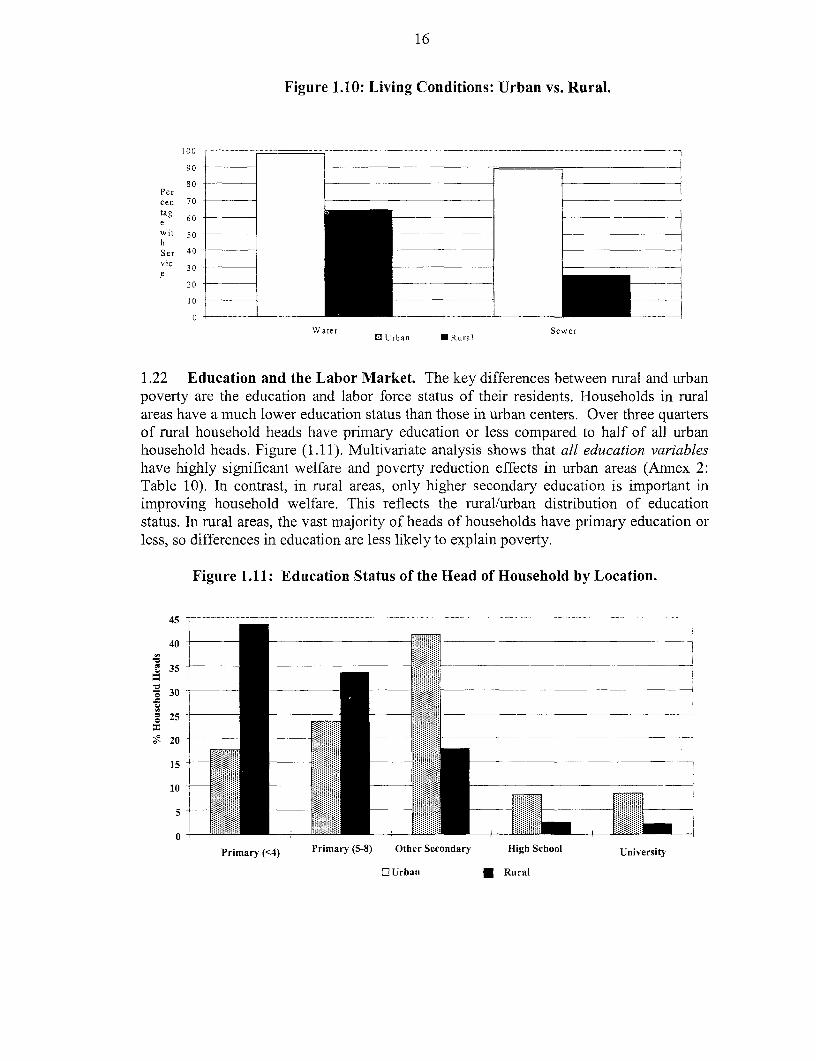
16
Figure 1.10: Living Conditions: Urban vs. Rural.
90 - __ _
Per 80
cen 70
tag 60ewit 50 _
Ser 4 0
vic 3 _____
100
Water Sewer0 U rban E Rural
1.22 Education and the Labor Market. The key differences between rural and urbanpoverty are the education and labor force status of their residents. Households in ruralareas have a much lower education status than those in urban centers. Over three quartersof rural household heads have primary education or less compared to half of all urbanhousehold heads. Figure (1.11). Multivariate analysis shows that all education variableshave highly significant welfare and poverty reduction effects in urban areas (Annex 2:Table 10). In contrast, in rural areas, only higher secondary education is important inimproving household welfare. This reflects the rural/urban distribution of educationstatus. In rural areas, the vast majority of heads of households have primary education orless, so differences in education are less likely to explain poverty.
Figure 1.11: Education Status of the Head of Household by Location.
404 35 _ ._ __ ......_ _._ .. ...._ . .. ._ ._ ._ ___._ ... _ _ _ _......
3 5
3 0
15
10
5
0 Primary (<4) Primary (5-8) Other Secondary High School University
a Urban * Rural
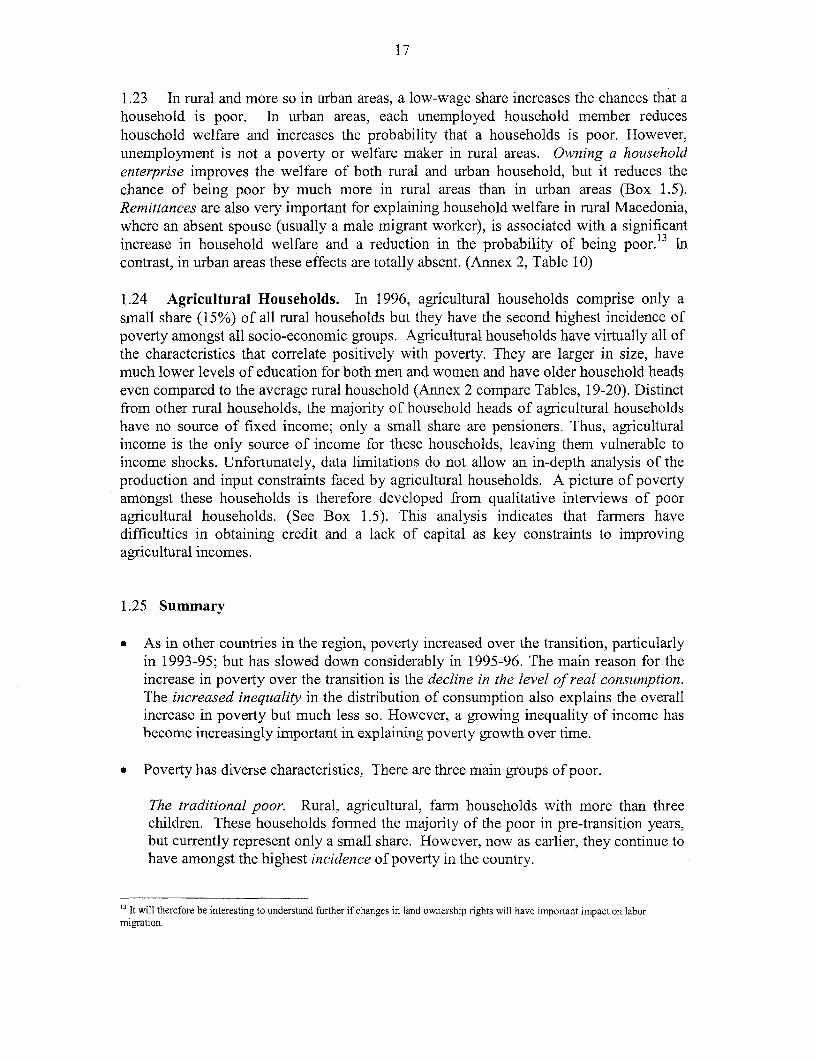
17
1.23 In rural and more so in urban areas, a low-wage share increases the chances that ahousehold is poor. In urban areas, each unemployed household member reduceshousehold welfare and increases the probability that a households is poor. However,unemployment is not a poverty or welfare maker in rural areas. Owning a householdenterprise improves the welfare of both rural and urban household, but it reduces thechance of being poor by much more in rural areas than in urban areas (Box 1.5).Remittances are also very important for explaining household welfare in rural Macedonia,where an absent spouse (usually a male migrant worker), is associated with a significantincrease in household welfare and a reduction in the probability of being poor. 3 Incontrast, in urban areas these effects are totally absent. (Annex 2, Table 10)
1.24 Agricultural Households. In 1996, agricultural households comprise only asmall share (15%) of all rural households but they have the second highest incidence ofpoverty amongst all socio-economic groups. Agricultural households have virtually all ofthe characteristics that correlate positively with poverty. They are larger in size, havemuch lower levels of education for both men and women and have older household headseven compared to the average rural household (Annex 2 compare Tables, 19-20). Distinctfrom other rural households, the majority of household heads of agricultural householdshave no source of fixed income; only a small share are pensioners. Thus, agriculturalincome is the only source of income for these households, leaving them vulnerable toincome shocks. Unfortunately, data limitations do not allow an in-depth analysis of theproduction and input constraints faced by agricultural households. A picture of povertyamongst these households is therefore developed from qualitative interviews of pooragricultural households. (See Box 1.5). This analysis indicates that farmers havedifficulties in obtaining credit and a lack of capital as key constraints to improvingagricultural incomes.
1.25 Summary
* As in other countries in the region, poverty increased over the transition, particularlyin 1993-95; but has slowed down considerably in 1995-96. The main reason for theincrease in poverty over the transition is the decline in the level of real consumption.The increased inequality in the distribution of consumption also explains the overallincrease in poverty but much less so. However, a growing inequality of income hasbecome increasingly important in explaining poverty growth over time.
* Poverty has diverse characteristics. There are three main groups of poor.
The traditional poor. Rural, agricultural, farm households with more than threechildren. These households formed the majority of the poor in pre-transition years,but currently represent only a small share. However, now as earlier, they continue tohave amongst the highest incidence of poverty in the country.
" It will therefore be interesting to understand further if changes in land ownership rights will have important impact on labormigration.
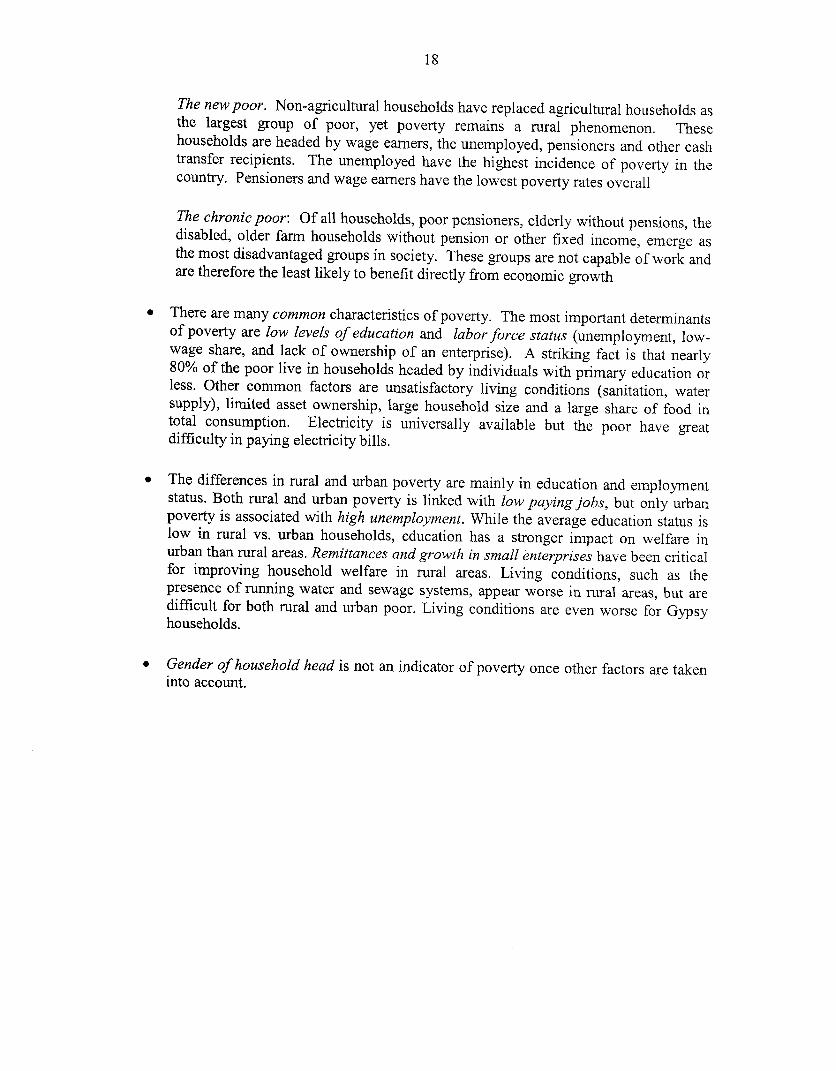
18
The new poor. Non-agricultural households have replaced agricultural households asthe largest group of poor, yet poverty remains a rural phenomenon. Thesehouseholds are headed by wage earners, the unemployed, pensioners and other cashtransfer recipients. The unemployed have the highest incidence of poverty in thecountry. Pensioners and wage earners have the lowest poverty rates overall
The chronic poor: Of all households, poor pensioners, elderly without pensions, thedisabled, older farm households without pension or other fixed income, emerge asthe most disadvantaged groups in society. These groups are not capable of work andare therefore the least likely to benefit directly from economic growth
* There are many common characteristics of poverty. The most important determinantsof poverty are low levels of education and labor force status (unemploymnent, low-wage share, and lack of ownership of an enterprise). A striking fact is that nearly80% of the poor live in households headed by individuals with primary education orless. Other common factors are unsatisfactory living conditions (sanitation, watersupply), limited asset ownership, large household size and a large share of food intotal consumption. Electricity is universally available but the poor have greatdifficulty in paying electricity bills.
- The differences in rural and urban poverty are mainly in education and employmentstatus. Both rural and urban poverty is linked with low paying jobs, but only urbanpoverty is associated with high unemployment. While the average education status islow in rural vs. urban households, education has a stronger impact on welfare inurban than rural areas. Remittances and growth in small enterprises have been criticalfor improving household welfare in rural areas. Living conditions, such as thepresence of running water and sewage systems, appear worse in rural areas, but aredifficult for both rural and urban poor. Living conditions are even worse for Gypsyhouseholds.
* Gender of household head is not an indicator of poverty once other factors are takeninto account.
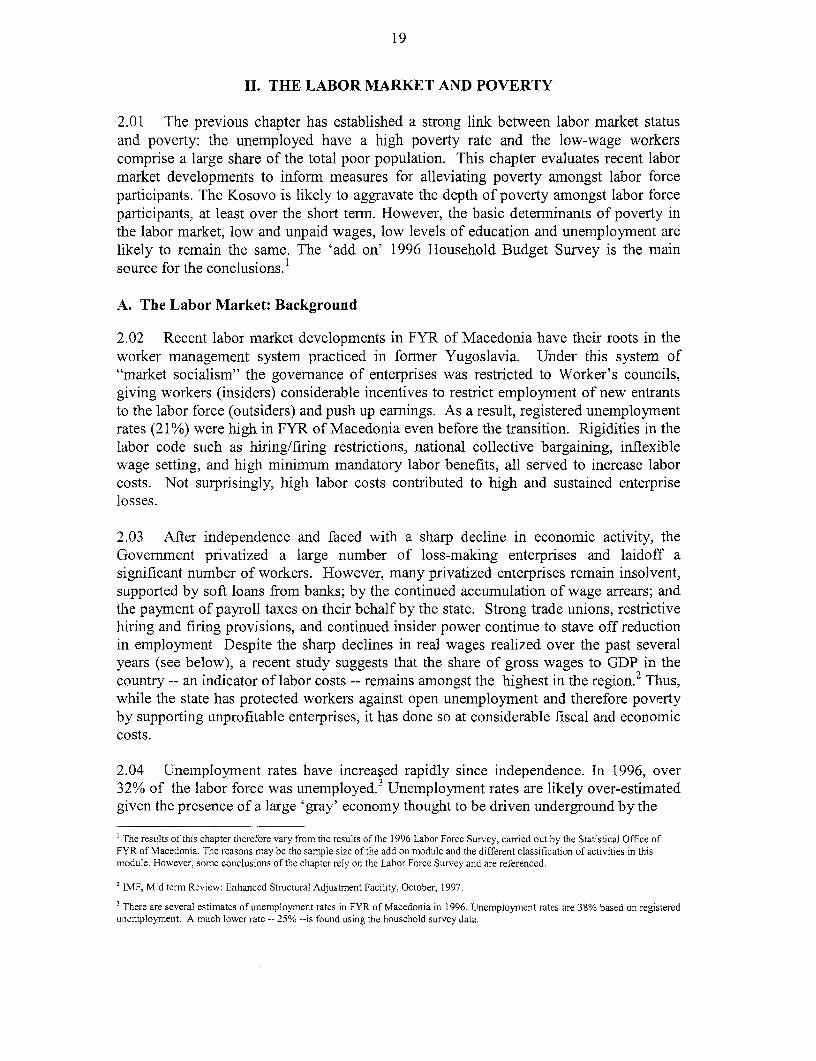
19
II. THE LABOR MARKET AND POVERTY
2.01 The previous chapter has established a strong link between labor market statusand poverty: the unemployed have a high poverty rate and the low-wage workerscomprise a large share of the total poor population. This chapter evaluates recent labormarket developments to inform measures for alleviating poverty amongst labor forceparticipants. The Kosovo is likely to aggravate the depth of poverty amongst labor forceparticipants, at least over the short term. However, the basic determinants of poverty inthe labor market, low and unpaid wages, low levels of education and unemployment arelikely to remain the same. The 'add on' 1996 Household Budget Survey is the mainsource for the conclusions.
A. The Labor Market: Background
2.02 Recent labor market developments in FYR of Macedonia have their roots in theworker management system practiced in former Yugoslavia. Under this system of"market socialism" the governance of enterprises was restricted to Worker's councils,giving workers (insiders) considerable incentives to restrict employment of new entrantsto the labor force (outsiders) and push up earnings. As a result, registered unemploymentrates (21%) were high in FYR of Macedonia even before the transition. Rigidities in thelabor code such as hiring/firing restrictions, national collective bargaining, inflexiblewage setting, and high minimum mandatory labor benefits, all served to increase laborcosts. Not surprisingly, high labor costs contributed to high and sustained enterpriselosses.
2.03 After independence and faced with a sharp decline in economic activity, theGovernment privatized a large number of loss-making enterprises and laidoff asignificant number of workers. However, many privatized enterprises remain insolvent,supported by soft loans from banks; by the continued accumulation of wage arrears; andthe payment of payroll taxes on their behalf by the state. Strong trade unions, restrictivehiring and firing provisions, and continued insider power continue to stave off reductionin employment Despite the sharp declines in real wages realized over the past severalyears (see below), a recent study suggests that the share of gross wages to GDP in thecountry -- an indicator of labor costs -- remains amongst the highest in the region.2 Thus,while the state has protected workers against open unemployment and therefore povertyby supporting unprofitable enterprises, it has done so at considerable fiscal and economiccosts.
2.04 Unemployment rates have increased rapidly since independence. In 1996, over32% of the labor force was unemployed.3 Unemployment rates are likely over-estimatedgiven the presence of a large 'gray' economy thought to be driven underground by the
The results of this chapter therefore vary from the results of the 1996 Labor Force Survey, carried out by the Statistical Office ofFYR of Macedonia. The reasons may be the sample size of the add on module and the different classification of activities in thismodule. However, some conclusions of the chapter rely on the Labor Force Survey and are referenced.
2 IMF, Mid term Review: Enhanced Structural Adjustment Facility, October, 1997.
3There are several estimates of unemployment rates in FYR of Macedonia in 1996. Unemployment rates are 38% based on registeredunemployment. A much lower rate -- 25% --is found using the household survey data.
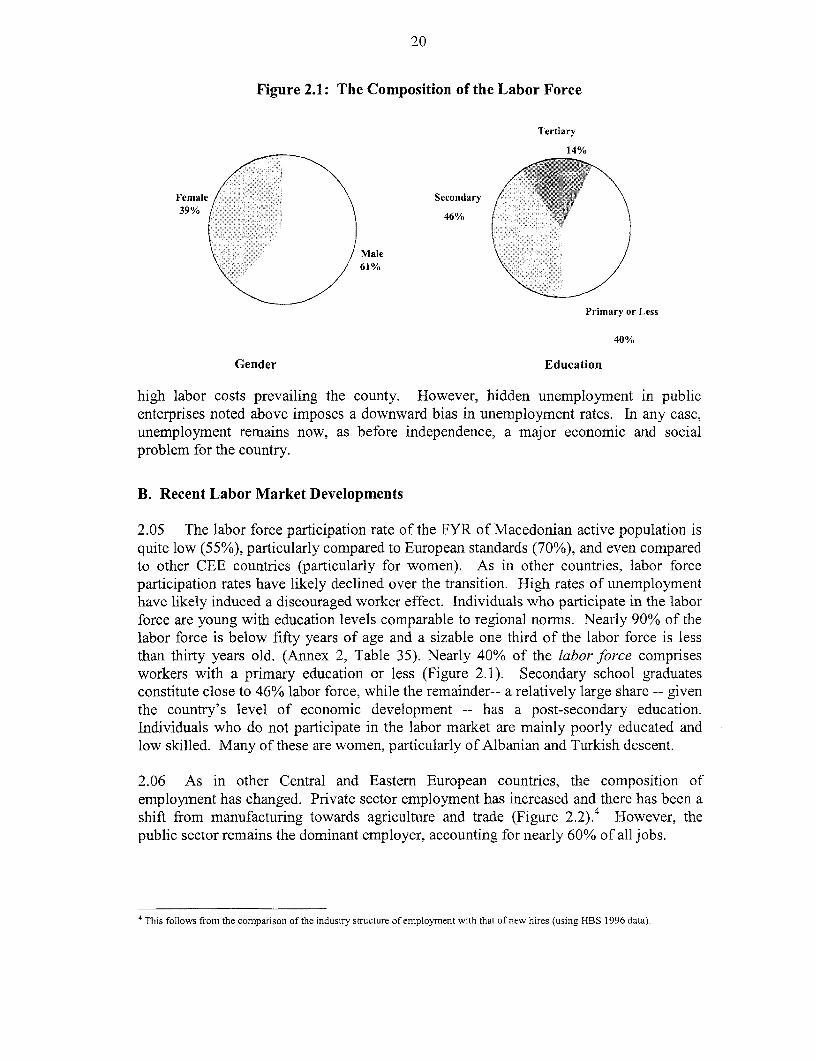
20
Figure 2.1: The Composition of the Labor Force
Tertiary
14%
Female Secondary39%46
Male61%
Primary or Less
40%
Gender Education
high labor costs prevailing the county. However, hidden unemployment in publicenterprises noted above imposes a downward bias in unemployment rates. In any case,unemployment remains now, as before independence, a major economic and socialproblem for the country.
B. Recent Labor Market Developments
2.05 The labor force participation rate of the FYR of Macedonian active population isquite low (55%), particularly compared to European standards (70%), and even comparedto other CEE countries (particularly for women). As in other countries, labor forceparticipation rates have likely declined over the transition. High rates of unemploymenthave likely induced a discouraged worker effect. Individuals who participate in the laborforce are young with education levels comparable to regional norms. Nearly 90% of thelabor force is below fifty years of age and a sizable one third of the labor force is lessthan thirty years old. (Annex 2, Table 35). Nearly 40% of the labor force comprisesworkers with a primary education or less (Figure 2.1). Secondary school graduatesconstitute close to 46% labor force, while the remainder-- a relatively large share -- giventhe country's level of economic development -- has a post-secondary education.Individuals who do not participate in the labor market are mainly poorly educated andlow skilled. Many of these are women, particularly of Albanian and Turkish descent.
2.06 As in other Central and Eastern European countries, the composition ofemployment has changed. Private sector employment has increased and there has been ashift from manufacturing towards agriculture and trade (Figure 2.2).4 However, thepublic sector remains the dominant employer, accounting for nearly 60% of all jobs.
4This follows from the comparison of the industry structure of employment with that of new hires (using HBS 1996 data).
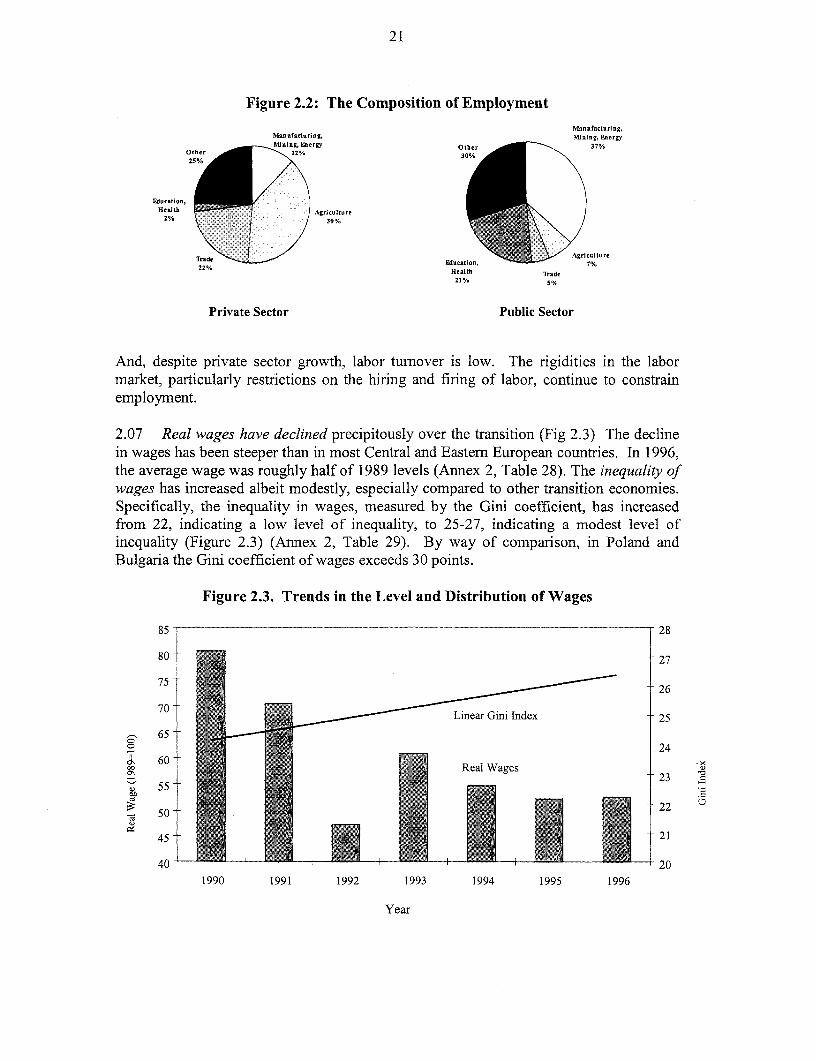
21
Figure 2.2: The Composition of Employment
Manufacturing,MUUDUfUdtUag, NMiDig, ergy
-- ig - OthEer 37gOtbh- 30%
Educ-tion,Health AgrHc.ltu-e
2% 39%
22% Health Tlade
21% 5%
Private Sector Public Sector
And, despite private sector growth, labor turnover is low. The rigidities in the labormarket, particularly restrictions on the hiring and firing of labor, continue to constrainemployment.
2.07 Real wages have declined precipitously over the transition (Fig 2.3) The declinein wages has been steeper than in most Central and Eastern European countries. In 1996,the average wage was roughly half of 1989 levels (Annex 2, Table 28). The inequality ofwages has increased albeit modestly, especially compared to other transition economies.Specifically, the inequality in wages, measured by the Gini coefficient, has increasedfrom 22, indicating a low level of inequality, to 25-27, indicating a modest level ofinequality (Figure 2.3) (Annex 2, Table 29). By way of comparison, in Poland andBulgaria the Gini coefficient of wages exceeds 30 points.
Figure 2.3. Trends in the Level and Distribution of Wages
85 28
80- i | 27
75 26
70 i ___ =zLinear Gini Index 25
C> ~~~~~~~~~~~~~~~~~~~~~~~24Yer Real Wages
5525~~~~~~~~~~~~~~~~~~~~~~~2
50
45 2
40 201990 1991 1992 1993 1994 1995 1996
Year
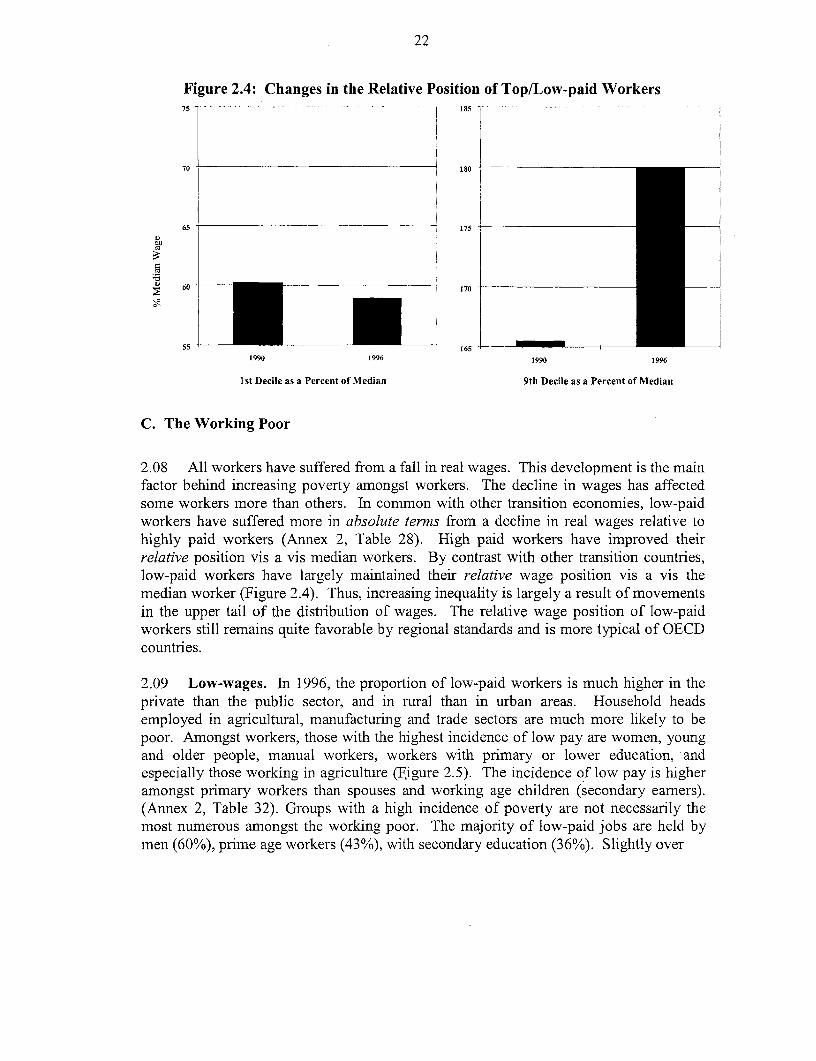
22
Figure 2.4: Changes in the Relative Position of Top/Low-paid Workers,s- ....... -- - 185
70 180
65 175
60 170
55 1651990 1996 1990 1996
1st Decile as a Percent of Median 9th Decile as a Percent of Median
C. The Working Poor
2.08 All workers have suffered from a fall in real wages. This development is the mainfactor behind increasing poverty amongst workers. The decline in wages has affectedsome workers more than others. In common with other transition economies, low-paidworkers have suffered more in absolute terms from a decline in real wages relative tohighly paid workers (Annex 2, Table 28). High paid workers have improved theirrelative position vis a vis median workers. By contrast with other transition countries,low-paid workers have largely maintained their relative wage position vis a vis themedian worker (Figure 2.4). Thus, increasing inequality is largely a result of movementsin the upper tail of the distribution of wages. The relative wage position of low-paidworkers still remains quite favorable by regional standards and is more typical of OECDcountries.
2.09 Low-wages. In 1996, the proportion of low-paid workers is much higher in theprivate than the public sector, and in rural than in urban areas. Household headsemployed in agricultural, manufacturing and trade sectors are much more likely to bepoor. Amongst workers, those with the highest incidence of low pay are women, youngand older people, manual workers, workers with primary or lower education, andespecially those working in agriculture (Figure 2.5). The incidence of low pay is higheramongst primary workers than spouses and working age children (secondary earners).(Annex 2, Table 32). Groups with a high incidence of poverty are not necessarily themost numerous amongst the working poor. The majority of low-paid jobs are held bymen (60%), prime age workers (43%), with secondary education (36%). Slightly over
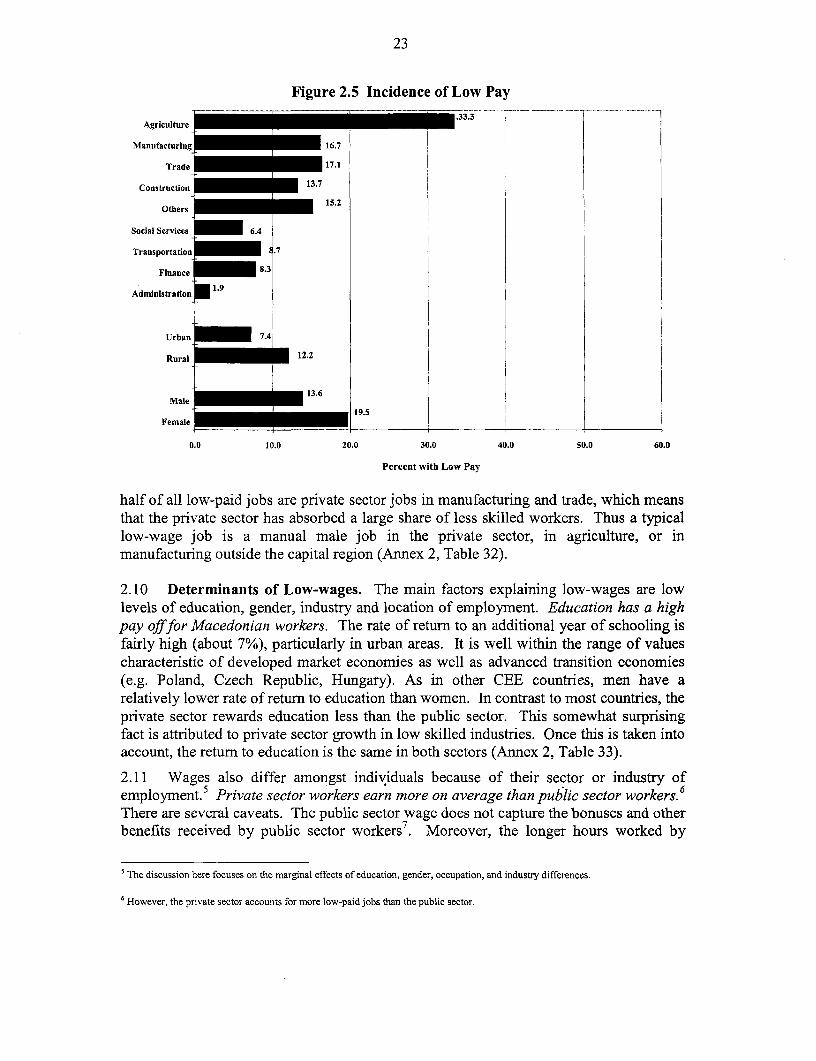
23
Figure 2.5 Incidence of Low Pay
Agriculture
Manufacturing 16.7
Trade 17.1
Construction 13.7
Others 15.2
Social Services 6.4
Transportation .7
Finance 8.3
Administration 1.9
Urban 7.4
Rural 12.2
~~~~~13~~1.6Male 1.
Female l t
0.0 10.0 20.0 30.0 40.0 50.0 60.0
Percent with Low Pay
half of all low-paid jobs are private sector jobs in manufacturing and trade, which meansthat the private sector has absorbed a large share of less skilled workers. Thus a typicallow-wage job is a manual male job in the private sector, in agriculture, or inmanufacturing outside the capital region (Annex 2, Table 32).
2.10 Determinants of Low-wages. The main factors explaining low-wages are lowlevels of education, gender, industry and location of employment. Education has a highpay offfor Macedonian workers. The rate of return to an additional year of schooling isfairly high (about 7%), particularly in urban areas. It is well within the range of valuescharacteristic of developed market economies as well as advanced transition economies(e.g. Poland, Czech Republic, Hungary). As in other CEE countries, men have arelatively lower rate of return to education than women. In contrast to most countries, theprivate sector rewards education less than the public sector. This somewhat surprisingfact is attributed to private sector growth in low skilled industries. Once this is taken intoaccount, the return to education is the same in both sectors (Annex 2, Table 33).
2.11 Wages also differ amongst individuals because of their sector or industry ofemployment.5 Private sector workers earn more on average than public sector workers.6
There are several caveats. The public sector wage does not capture the bonuses and otherbenefits received by public sector workers7 . Moreover, the longer hours worked by
s The discussion here focuses on the marginal effects of education, gender, occupation, and industry differences.
6However, the private sector accounts for more low-paid jobs than the public sector.
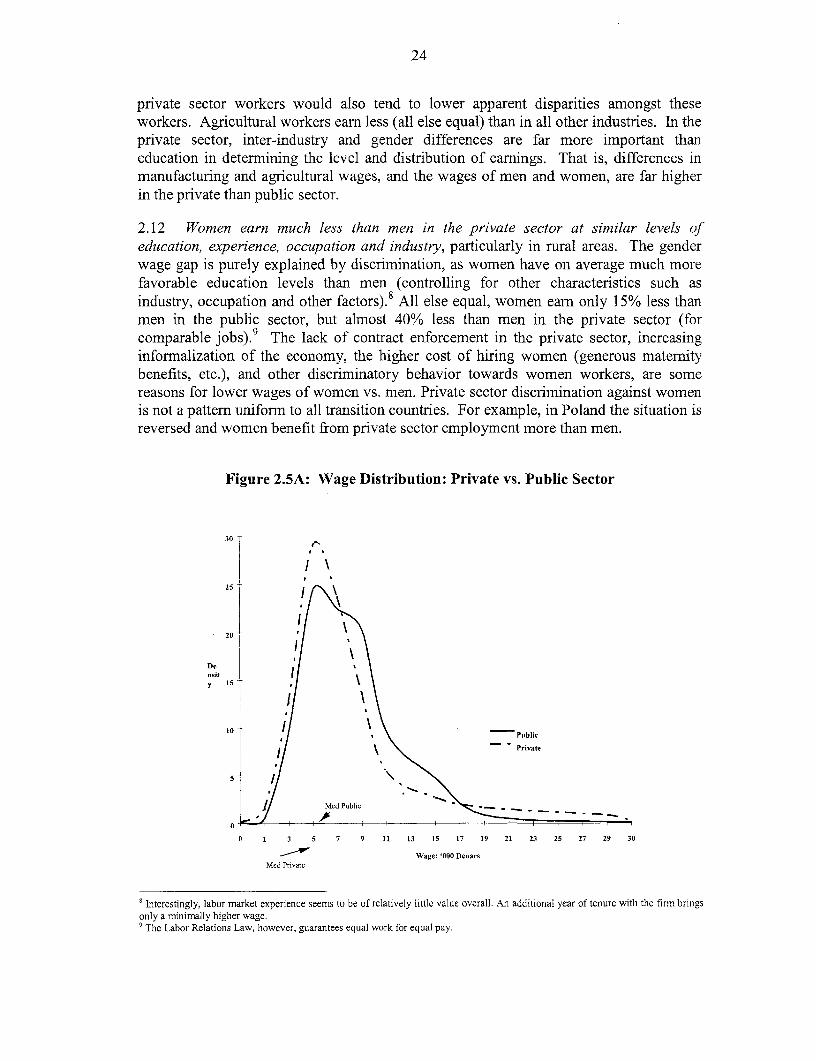
24
private sector workers would also tend to lower apparent disparities amongst theseworkers. Agricultural workers earn less (all else equal) than in all other industries. In theprivate sector, inter-industry and gender differences are far more important thaneducation in determining the level and distribution of earnings. That is, differences inmanufacturing and agricultural wages, and the wages of men and women, are far higherin the private than public sector.
2.12 Women earn much less than men in the private sector at similar levels ofeducation, experience, occupation and industry, particularly in rural areas. The genderwage gap is purely explained by discrimination, as women have on average much morefavorable education levels than men (controlling for other characteristics such asindustry, occupation and other factors).8 All else equal, women earn only 15% less thanmen in the public sector, but almost 40% less than men in the private sector (forcomparable jobs).9 The lack of contract enforcement in the private sector, increasinginformalization of the economy, the higher cost of hiring women (generous maternitybenefits, etc.), and other discriminatory behavior towards women workers, are somereasons for lower wages of women vs. men. Private sector discrimination against womenis not a pattern uniform to all transition countries. For example, in Poland the situation isreversed and women benefit from private sector employment more than men.
Figure 2.5A: Wage Distribution: Private vs. Public Sector
30
I \I S
25- ,
20 T
De.sSit
yDSi 15_ |\
10- 1 z \ Public
Private
5 I
|/ MedPublic
0 1 1 I
0 1 3 5 7 9 11 13 15 17 19 21 23 25 27 29 30
Wage: '000 DenarsMed Private
Interestingly, labor market experience seems to be of relatively little value overall. An additional year of tenure with the firm bringsonly a minimally higher wage.9 The Labor Relations Law, however, guarantees equal work for equal pay.
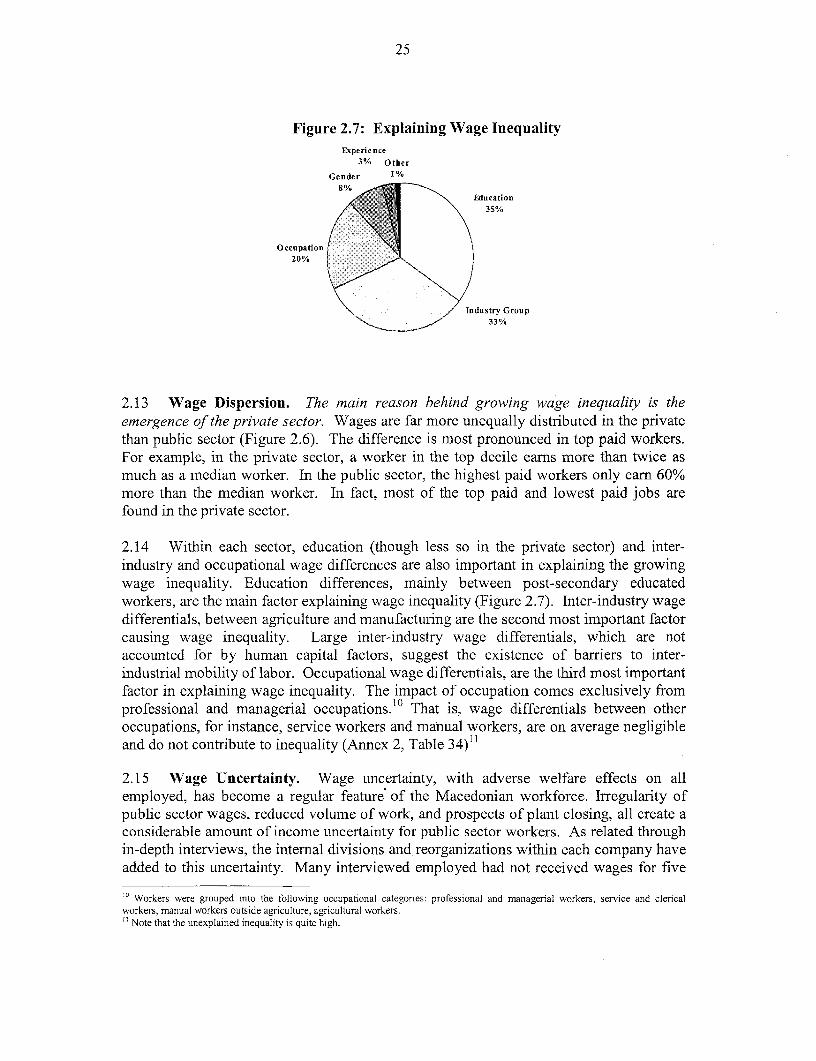
25
Figure 2.7: Explaining Wage InequalityExperience
3% Other
Gender 1%8% Education
35%
Occupation20%
Industry Group33%
2.13 Wage Dispersion. The main reason behind growing wage inequality is theemergence of the private sector. Wages are far more unequally distributed in the privatethan public sector (Figure 2.6). The difference is most pronounced in top paid workers.For example, in the private sector, a worker in the top decile earns more than twice asmuch as a median worker. In the public sector, the highest paid workers only earn 60%more than the median worker. In fact, most of the top paid and lowest paid jobs arefound in the private sector.
2.14 Within each sector, education (though less so in the private sector) and inter-industry and occupational wage differences are also important in explaining the growingwage inequality. Education differences, mainly between post-secondary educatedworkers, are the main factor explaining wage inequality (Figure 2.7). Inter-industry wagedifferentials, between agriculture and manufacturing are the second most important factorcausing wage inequality. Large inter-industry wage differentials, which are notaccounted for by human capital factors, suggest the existence of barriers to inter-industrial mobility of labor. Occupational wage differentials, are the third most importantfactor in explaining wage inequality. The impact of occupation comes exclusively fromprofessional and managerial occupations.10 That is, wage differentials between otheroccupations, for instance, service workers and manual workers, are on average negligibleand do not contribute to inequality (Annex 2, Table 34)11
2.15 Wage Uncertainty. Wage uncertainty, with adverse welfare effects on allemployed, has become a regular feature of the Macedonian workforce. Irregularity ofpublic sector wages, reduced volume of work, and prospects of plant closing, all create aconsiderable amount of income uncertainty for public sector workers. As related throughin-depth interviews, the internal divisions and reorganizations within each company haveadded to this uncertainty. Many interviewed employed had not received wages for five
'° Workers were grouped into the following occupational categories: professional and managerial workers, service and clericalworkers, manual workers outside agriculture, agricultural workers." Note that the unexplained inequality is quite high.

26
or six months, and many companies in which they work do not pay contributions forpension and health insurance on their behalf. Some of the interviewed have recently beensent on forced vacations of up to 7-8 months in a year. The most adversely affected bythis phenomenon are workers with low pay and with limited savings and assets. Theperceived difficulty of obtaining another job, ensuring and augmenting pension benefits,keeping information ties to the work force, and the expectation that they will receive theiroverdue wages if they continue to work, induces workers to go to work every day forseveral hours, even to register, when the company is liquidated.
2.16 The imposition of hard budget constraints and the subsequent restructuring ofenterprises may well increase the pool of open unemployment, at least in the short run.While some older workers may withdraw from the labor force, others will have toattempt to find another job. Recent layoffs have hit mostly women, middle aged workers(35-54), and workers with a secondary education (Figure 2.8). The expectation that itwill be difficult to find another job once laidoff is very real. A majority (60%) of laid-offworkers do try to find a new job, although a substantial fraction of the laid-off (largelyolder workers) withdraw entirely from the labor force. Other, mainly younger workers,continue to search for work and join the ranks of the unemployed (Annex 2, Table 37).
D. Informal Sector Workers: Seasonal and Occasional Work'2
2.17 Regardless of age or gender, most individuals who are not in regular formal sectorjobs related in the qualitative assessment that they were engaged in some kind of informalpersonal contacts, usually friends and relatives. As noted in the previous chapter,seasonal workers have amongst the highest incidence of poverty in the country.
Figure 2.8: Incidence of Layoffs by Socio-Economic Factors
Primary 7.6
Secondary 9.8
Higher 3.6
15-24 Years 2.5
25-34 Years 7.0
35-44 Years 10.1
45-54 Years 9.5
55+ Years _ 5.7
Male 6.1 11.7
Female _ _
0.0 2.0 4.0 6.0 8.0 10.0 12.0
Percent
12 This section is based on interviews of the poor and not on empirical data. As a result the conclusions cannot be generalized to thepopulation.
27
2.18 Many urban individuals work as salespersons, bartenders, seamstresses, and taxidrivers. Men usually perform hard physical work. They are most frequently masons,painters, tile-layers, and loaders of goods. A small number of interviewed women wereengaged in skilled work, knitting sweaters, weaving, or in making traditional garments(mostly in the western region) at home. Some women work in the informal sector asseamstresses. Women in urban areas most often work as cleaning ladies in buildings andapartments. In many households from the urban areas, prostitution was mentioned as away of survival. In rural areas, poor people work as day laborers on other people's land(cutting, digging, sawing and similar) or mind cattle, mainly during the summer months.Some individuals supplement the family budget by collecting moss, mushrooms, variousherbs, and wood during one or two months out of the year. Women in rural areas workmainly in agriculture. For example, they grow tobacco on rented land, after obtaining anadvance payment to buy inputs from the tobacco combinats.
2.19 The informal work described in household interviews is arduous, seasonal oroccasional in nature, requires a long search period, and is often available only during thesummer months. Wages are low and even if close to the average wage, can only beobtained for a few months of the year. Households find it difficult to save for leanseasons. Winter months, when savings have been depleted and work is not easy to findwere cited as particularly difficult. Competition from laid-off workers and, in thewestern region, illegal Albanian workers, were also often mentioned as having drivendown wages and reduced the standard of living in recent years. Women sellingtraditional garments also cited reduced demand for their work as a result of increasedcompetition from workers from Albania. Many women said that it was easier to findwork a few years ago. They related that even seasonal work opportunities, for example,the extraction of sugar turnip, picking apples, sour cherries and other fruit in orchards, orwork at hotels, are now few and far between.
2.20 Many households have tried to improve their living standards by working abroad.Working abroad, even temporarily, was considered by most poor households as animportant source of income. Interviewed households narrated numerous instances ofpeople who have tried to find employment abroad. Younger people (mostly Albanian)have frequently undertaken illegal work in Italy, Switzerland, and Slovenia. This work isarduous physical work and seasonal, lasting about 5-6 months. The reported pay is lowrelative to legal work of the same nature in these countries, but it still provides animportant source of income for the household.
2.21 Starting a small business was cited by some households as a way to escapepoverty. A small number of poor households related that they had attempted to, or wouldlike to, start their own business. The mainf reason cited by individuals-for not being
28
Box 2.1: A Private Enterprise
Informal Sector.: Miki is a lawyer of fifty who previously worked in the constructiondindustry. Whenhis enterprise went bankrupt five years ago he registered as unemployed. His wife works as anadministrator in a bank. After two years of looking for work Miki decided to use the severance payfrom his firrm (the equivalent of 2 years' salary, it came to about 7,000 denars), as well as some of themoney he gained from the sale of a small apartment for 25X000 denars, to start a pizza restaurant. Therestaurant did so badly Miki ended up closing it, selling what he could, and invested his remainingmoney in importing items, including furniture, from the Far East. The shop consists of a modestlyequipped and relatively small space, 20 square meters, where Miki has displayed a range of handmadecrafts, ranging from inexpensive items sold for 10-20 denars, to higher priced firniture which he sellsfor up to 1,000 denars. 4Miki ha hoped that their hig uality, and0 the fact that they would beconsidered "exotic" would attract buyers. After a year and a Whaf, Miki found that his prfits weremuch lower than expected. He blames the unifvorable government policies toward small businesses:"The new act on trading companies and the zreglitions concerning financial performance will cause allthe smniar shops to close down in the next few imonths." He put forth as the example the requirementof paying a 10_000 denars deposit and 350 denars ri6stration fee to register an enterpnrse, which manysmall businesses would findimpossible. NMoreover, ht noted the prevalence of corruion: "You'reexpected to put money in the poce}t of any inspector who comes to you. You just can't do anythingwithout facing the need for bribery. Whenever an inspeetor appears, all the shops close immediately."According to Miki, it is much easier fbr small groceries shops to bribe inspectors. Several times, he hasnoticed grocery shop owners filling the mruks of the ispectors' cars with goods. "I cannot pay 100-200 denars each time they show their faces." The main reason he has decided to close down hisbusiness is that he is being required to pay tax on the inventory he kieps in his shop, even thouh, heclaims, he is unlikely to sell much of it. "If they specified the? total amount I should pay at the end ofthe year. in three or four installm:ents, I would stop and think aboutt it. Buti I cannot pay in cash anarbitrary amount for unsold merchandise, even if I wanted to. I've already invested the money; I couldpay after earning something. Now, they are to come and confiscate my goods and even My car!" Mikihas already received a list of his goods that will be confiscated, listing his car and registration number.He was terrified a few days earlier, when he witnessed tax inspectors arriving accompanied by 6 policeofficers and a dozen workers to confiscate goods from a nearby pharmacy. iHe fels that the officialattitude treats business people like himself as criminals even when they try to meet their legalobligations. As a result, he hopes to sell all his property and emigrate from the country.
engaged in a private business is the lack of capital. Most of the interviewed householdssaid that it is not possible for them to obtain loans to start a small business because theycannot obtain a mortgage at affordable rates given the poor condition of their property.Most unemployed do have a lot of ideas about what they would do (open cattle breedingfarms, craft workshops, or in marketing products) if they could obtain credit on favorableterms.
2.22 A small number of interviewed households engage in illegal or semi-legal trade asa means to make ends meet. The activity is often the resale of agricultural, textile, orfood products. A similar small share of interviewed households with a small amount ofcapital (savings from "better times," loans from friends or relatives), deal in smugglinggoods. They buy goods, food, textile products, jewelry, alcohol, or cigarettes from theduty-free shops from Bulgaria and Turkey and sell them in the markets, on the streets, orto companies.
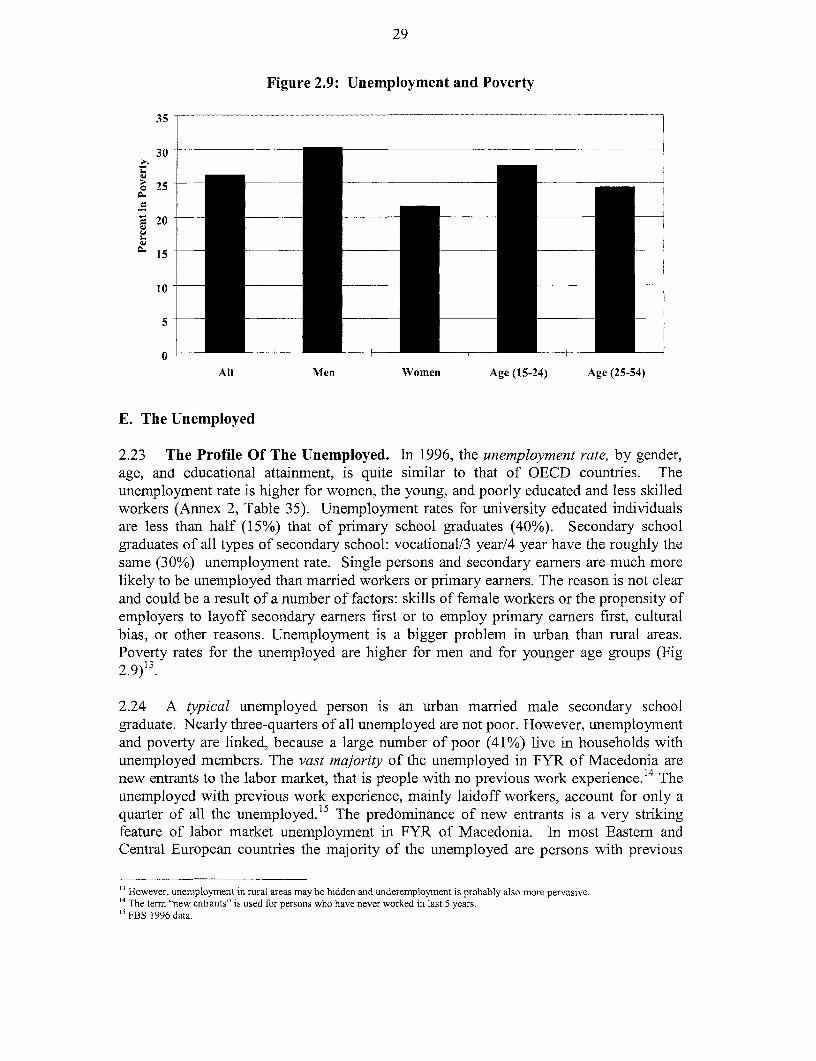
29
Figure 2.9: Unemployment and Poverty
35
30____ _ _ _ _ _ _ _ _ __ _ _
25
20
; 15
10
5
0All Men Women Age (15-24) Age (25-54)
E. The Unemployed
2.23 The Profile Of The Unemployed. In 1996, the unemployment rate, by gender,age, and educational attainment, is quite similar to that of OECD countries. Theunemployment rate is higher for women, the young, and poorly educated and less skilledworkers (Annex 2, Table 35). Unemployment rates for university educated individualsare less than half (15%) that of primary school graduates (40%). Secondary schoolgraduates of all types of secondary school: vocational/3 year/4 year have the roughly thesame (30%) unemployment rate. Single persons and secondary earners are much morelikely to be unemployed than married workers or primary earners. The reason is not clearand could be a result of a number of factors: skills of female workers or the propensity ofemployers to layoff secondary earners first or to employ primary earners first, culturalbias, or other reasons. Unemployment is a bigger problem in urban than rural areas.Poverty rates for the unemployed are higher for men and for younger age groups (Fig2.9)13.
2.24 A typical unemployed person is an urban married male secondary schoolgraduate. Nearly three-quarters of all unemployed are not poor. However, unemploymentand poverty are linked, because a large number of poor (41%) live in households withunemployed members. The vast majority of the unemployed in FYR of Macedonia arenew entrants to the labor market, that is people with no previous work experience. 14 Theunemployed with previous work experience, mainly laidoff workers, account for only aquarter of all the unemployed.15 The predominance of new entrants is a very strikingfeature of labor market unemployment in FYR of Macedonia. In most Eastern andCentral European countries the majority of the unemployed are persons with previous
" However, unemployment in rural areas may be hidden and underemployment is probably also more pervasive.4 The term "new entrants" is used for persons who have never worked in last 5 years.5 FBS 1996 data.

30
work experience. For example, in Poland the unemployed with previous work experienceaccount for over 80% of all the unemployed -- a proportion more than three times higherthan in FYR of Macedonia.
2.25 These results reinforce the earlier statement that the main reason for highunemployment and associated poverty in FYR of Macedonia is that of limited entry to thelabor market, rather than layoffs.16 Thus, policies to reduce costs of hiring and firing,somewhat paradoxically, are likely -o be critical for reducing unemployment in thecountry.
2.26 The Long Duration Of Unemployment. The flow into the pool ofunemployment is quite low (1%). The main reason for high unemployment is the longduration of unemployment. As much as 80% of all unemployed are long-termunemployed. These values are far beyond the range observed in OECD countries and inother transition economies of Central and Eastern Europe. For instance, in Poland theunemployment rate peaked at 16% and the share of long-term unemployed has notexceeded 50%. The incidence of long-term unemployment is remarkably similar acrosssocio-economic groups. In virtually each age group the share of long-term unemployedis around 80%, except very young workers in which case it accounts for 50%. This is incontrast to a typical situation whereby the incidence of long tern unemploymentincreases with age (Annex 2, Table 35).
2.27 Long term unemploymnent has discouraged workers. A large number of workersindicate that they have ceased a job search when it has proved futile. While the averagejob search duration is long for virtually every socio-demographic category of workers, itvaries notably between groups. (Annex 2, Table 36) Men tend to look for a job longerthan women. Less educated workers have a longer search period compared to bettereducated workers. Workers with low education also have the lowest labor forceparticipation rate. Thus, the less educated seldom work. This explains in part the highincidence of poverty amongst the .iess educated found in the previous chapter. Incontrast, the majority of workers with a post-secondary education are a part of the laborforce and are relatively seldom unemployed.
2.28 The capacity of the labor market to reintegrate a large number of the unemployed,into gainful and productive employment and thereby reduce poverty will be particularlydifficult while unemployment is of such long duration. International experiencedemonstrates that unemployment tends to be more persistent when its rise is associatedwith the spread of long-terrn unemployment. Exit rates from unemployment fall asduration of unemployment increases. Re-.employment rates are much lower for the long-term unemployed owing to the loss of skills and declining morale, and because employerstend to use the length of unemployment as a screening device (they equate long term
16 Labor Force Survey (1996). Unemployment may well be attributable to the limited supply of qualified workers, and unemploymentrates amongst the less educated are quite high relative to Jniversity graduates. However, this assertion is difficult to prove. Data oneducation requirements and length of job vacancies would be required to address this issue.
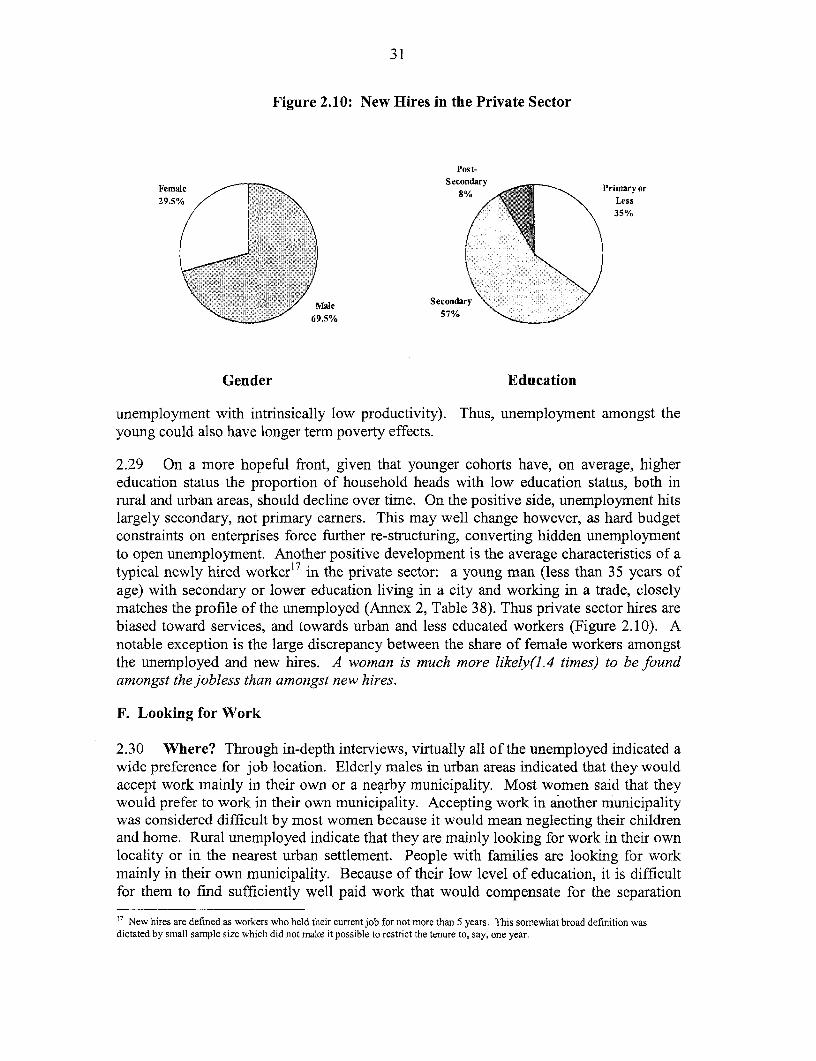
31
Figure 2.10: New Hires in the Private Sector
Post-
Feme Secondar Primarvor29.5%Ls
35%
Male Secon69.5% 5
Gender Education
unemployment with intrinsically low productivity). Thus, unemployment amongst theyoung could also have longer term poverty effects.
2.29 On a more hopeful front, given that younger cohorts have, on average, highereducation status the proportion of household heads with low education status, both inrural and urban areas, should decline over time. On the positive side, unemployment hitslargely secondary, not primary earners. This may well change however, as hard budgetconstraints on enterprises force further re-structuring, converting hidden unemploymentto open unemployment. Another positive development is the average characteristics of atypical newly hired worker17 in the private sector: a young man (less than 35 years ofage) with secondary or lower education living in a city and working in a trade, closelymatches the profile of the unemployed (Annex 2, Table 38). Thus private sector hires arebiased toward services, and towards urban and less educated workers (Figure 2.10). Anotable exception is the large discrepancy between the share of female workers amongstthe unemployed and new hires. A woman is much more likely(l.4 times) to be foundamongst the jobless than amongst new hires.
F. Looking for Work
2.30 Where? Through in-depth interviews, virtually all of the unemployed indicated awide preference for job location. Elderly males in urban areas indicated that they wouldaccept work mainly in their own or a nearby municipality. Most women said that theywould prefer to work in their own municipality. Accepting work in another municipalitywas considered difficult by most women because it would mean neglecting their childrenand home. Rural unemployed indicate that they are mainly looking for work in their ownlocality or in the nearest urban settlement. People with families are looking for workmainly in their own municipality. Because of their low level of education, it is difficultfor them to find sufficiently well paid work that would compensate for the separation
17 New hires are defined as workers who held their current job for not more than 5 years. This somewhat broad definition wasdictated by small sample size which did not make it possible to restrict the tenure to, say, one year.
32
from their family. Young people looking for work, regardless of their region of residenceor ethnic status, are willing to accept work anywhere in the country. A large proportionof the young also indicate that they are amenable to working abroad.
2.31 How? The unemployed look for work through advertisements and through friendsand relatives. Few people, if any, believe that they can find work through theEmployment Bureau. Most of the interviewed regularly apply for advertised jobs and ifcalled, present themselves for an interview. Some of the interviewed seek work directlyin companies, regardless of whether there is an advertised job opening. Nevertheless,none of the persons interviewed had found work using these methods. The onlysuccessful method for finding jobs is considered to be "connections" with managers ofcompanies. Very few of the interviewed had any such acquaintances. Some of theunemployed have tried to contact some influential people calling upon old friendshipsand neighborhood ties, but all these attempts have been unsuccessful. However, mostunemployed, when questioned further, also believed that their low level of education andadvanced age was the main reason for their inability to find work.
G. Labor Market Policies and Poverty Reduction
2.32 Private sector growth, by absorbing a large number of less skilled workers, hasbeen critical to reducing poverty in the country. However, a considerable pool of lessskilled individuals remains unemployed. This pool may expand, at least in the short run,as insolvent enterprises layoff workers, and because of the recent Kosovo crisis. Thus, itwill take a considerable growth in employment to absorb the excess supply of less skilledlabor. Further, private sector growth will be required to raise real wages of labor and toreduce poverty amongst workers. There is a caveat. The increasing disparity of wagesmay worsen poverty, dampening the positive effect on the working poor of any increasein the average level of wages. Moreover, private sector growth may increase the relativedisparities between low-wage and top paid workers. 18 A growing inequality of income inthe initial phases of economic growth (to be followed by reduction in inequality andcontinuing growth) has been documented for many other countries in the world. Finally,the Kosovo crisis will have a major impact on the labor market, causing layoffs andunemployment and increasing poverty, at least in the short term, amongst workers as aresult of growing wage arrears and an increasing number of workers on forced leave.
2.33 Ensuring a flexible labor market can have an important positive impact onstimulating economic growth. As noted earlier, the Macedonian labor market ischaracterized by high labor costs that constrain formal employment growth andcontribute to a growing informalization of the economy. Labor market rigiditiesinherited from the socialist worker management system practiced in ex-Yugoslavia,particularly restrictive hiring and firing conditions and inflexible wage setting practices,continue to constrain the hiring of less skilled and poorer unemployed. Some of theserigidities embodied in the Labor Relations Law include i) excessive regulation of the
's Low-wage worker could realize an increase in real wages, but much less relative to that realized by top paid, or even medianworkers. Low-wage workers could also realize a decline in their absolute wage inequality increases outpace the growth in the medianwage.
33
hiring and termination processes; ii) extensive role of the court in reviewing terminationdecisions; iii) centralized collective bargaining system binding on all workers andemployers that can impose restrictive wage setting practices and can establish benefits, orother (termination) conditions, higher than those established in the Labor Relations Law;iv) high minimum mandatory benefits including a generous sick pay provision (sixty daysby employer). The result of these and other similar termination restrictions make itextremely difficult to fire workers and therefore also raise the cost of new hires.
2.34 High tax rates imposed to finance generous social insurance programs likelyinduce evasion, reduce formal sector growth, and contribute to a growing informnalizationof the economy. Moreover, rigidities in the land and credit markets, and other barriers totrade (high registration fees, etc.) constrain the development of small and mediumenterprises, and reduce incentives for private sector development.
2.35 The Government has recently adopted several measures to improve labor marketflexibility. In particular, reform of the Employment Law has eased regulations on thehiring process. However, it will be important to amend the Labor Relations Law to easetermination conditions and allow more flexibility in wage setting processes. These stepswill have to complemented by reforms in the credit and land markets to spur privatesector development and employment growth.
2.36 Summary
* The increase in poverty amongst workers is mainly the result of a sharp decline inreal wages. Wage disparity has increased but has contributed far less to the increasein poverty. Wage uncertainty has also increased and has an adverse impact onhousehold welfare. The lack of major restructuring of enterprises has helped containgrowth in open unemployment, but at high economic and fiscal costs.
* Low-paid and less educated workers have lost out in both relative and absolute termsin the transition to a market economy compared to well educated top paid (mainlyurban professional) workers. The incidence of low pay is highest amongstindividuals with primary education or less. The majority of low-paid workers aresecondary educated male manual workers in agriculture jobs.
* Poverty is linked strongly to unemployment. Nearly half of all poor live inhouseholds with one or more unemployed worker. Poverty rates increase with thenumber of unemployed in a household. Unemployment affects mainly secondaryearners and is a relatively greater problem in urban areas.
* The characteristics of the unemployed in FYR of Macedonia are similar to thosefound in OECD countries. However, quite atypically, the majority of the unemployedare new entrants to the labor force. Thus, unemployment is mainly a result ofconstraints to entry not exit, indicating high firing and therefore hiring costs in thecountry.
* The long duration of unemployment amongst the young is also worrisome.Unemployment of long duration discourages labor force participation, depreciates
34
labor force skills, and signals a "less productive worker" to the employer. Thus, evennew entrants are vulnerable to poverty over the long term. As in other countries, thismay be linked to the extensive duration of unemployment benefits (see Chapter 3).
* Private sector growth has helped absorb a large share of less skilled/less educatedworkers. The private sector is concentrated in less skill intensive agriculture andtrade jobs, pays low-wages, and employs half of all low-paid workers. All else beingequal, formal private sector growth in should help absorb the less skilled unemployed.There are three caveats. Given the large pool of unemployed workers that may wellincrease as restructuring resumes, it may take considerable employment growth in theprivate sector to (all else being equal) bid up wages and alleviate poverty amongst thelow-wage employed. Second, a larger role for the private sector may well increasewage disparities between less educated and highly educated workers and contribute toincreasing poverty. Third, the Kosovo situation may have an adverse impact onemployment and poverty.
* Women are the more vulnerable labor force participants than men. Women are morelikely to be unemployed, receive lower wages for the same work, and are less likelyto be hired in the private sector. Greater formalization of the economy to encouragenon-discrimination in the work force will be key to improving the welfare of femaleworkers.
i Investment in human capital has a large pay off in FYR of Macedonia. Increasing thesupply of well educated workers, along with other worker productivity increases(increase in the use of capital in production) should, all else being equal, raise realwages and reduce poverty over the long term. (The education system is discussed inthe following chapter).
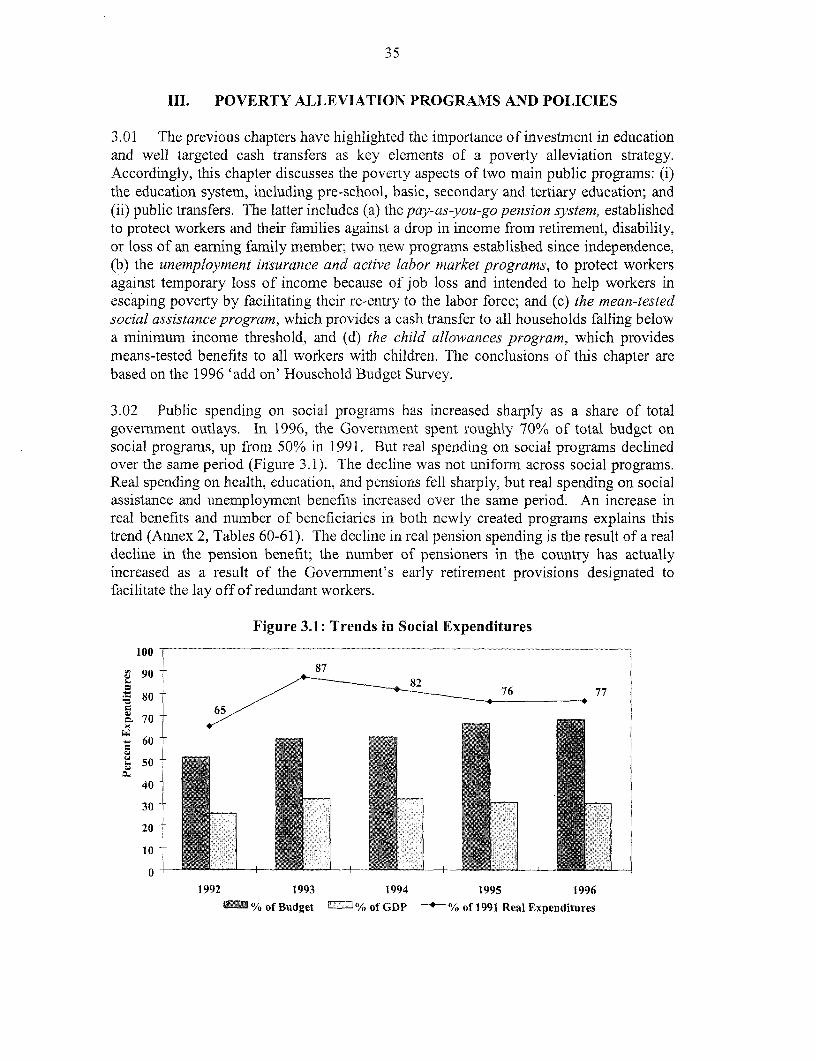
35
III. POVERTY ALLEVIATION PROGRAMS AND POLICIES
3.01 The previous chapters have highlighted the importance of investment in educationand well targeted cash transfers as key elements of a poverty alleviation strategy.Accordingly, this chapter discusses the poverty aspects of two main public programs: (i)the education system, including pre-school, basic, secondary and tertiary education; and(ii) public transfers. The latter includes (a) the pay-as-you-go pension system, establishedto protect workers and their families against a drop in income from retirement, disability,or loss of an earning family nmember; two new programs established since independence,(b) the unemployment insurance and active labor market programs, to protect workersagainst temporary loss of income because of job loss and intended to help workers inescaping poverty by facilitating their re-entry to the labor force; and (c) the mean-testedsocial assistance program, which provides a cash transfer to all households falling belowa minimum income threshold, and (d) the child allowances program, which providesmeans-tested benefits to all workers with children. The conclusions of this chapter arebased on the 1996 'add on' Household Budget Survey.
3.02 Public spending on social programs has increased sharply as a share of totalgovernment outlays. In 1996, the Government spent roughly 70% of total budget onsocial programs, up from 50% in 1991. But real spending on social programs declinedover the same period (Figure 3.1). The decline was not uniform across social programs.Real spending on health, education, and pensions fell sharply, but real spending on socialassistance and unemployment benefits increased over the same period. An increase inreal benefits and number of beneficiaries in both newly created programs explains thistrend (Annex 2, Tables 60-6 1). The decline in real pension spending is the result of a realdecline in the pension benefit; the number of pensioners in the country has actuallyincreased as a result of the Government's early retirement provisions designated tofacilitate the lay off of redundant workers.
Figure 3.1: Trends in Social Expenditures
100
90
ne 80° ~ 77
~.7060
~-5040
30
20
10
01992 1993 1994 1995 1996
% of Budget % of GDP + % of 1991 Real Expenditures
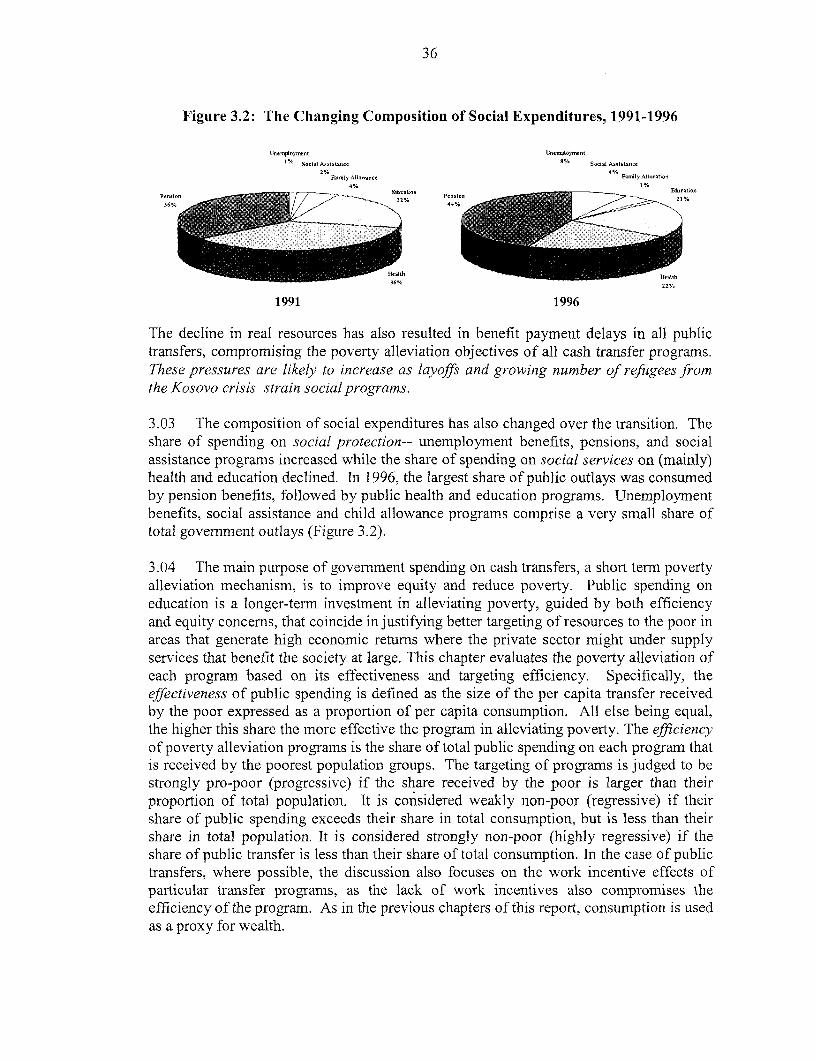
36
Figure 3.2: The Changing Composition of Social Expenditures, 1991-1996
IJne,rio met t'nmtim ealon t
'° Social Assistace8 Social ASs,ilSnt-
4% i%
_~~~~ Xe~~HAtih H.1tth
22%
1991 1996
The decline in real resources has also resulted in benefit payment delays in all publictransfers, compromising the poverty alleviation objectives of all cash transfer programs.These pressures are likely to increase as layoffs and growing number of refugees fromthe Kosovo crisis strain socialprograms.
3.03 The composition of social expenditures has also changed over the transition. Theshare of spending on social protection-- unemployment benefits, pensions, and socialassistance programs increased while the share of spending on social services on (mainly)health and education declined. In 1996, the largest share of public outlays was consumedby pension benefits, followed by public health and education programs. Unemploymentbenefits, social assistance and child allowance programs comprise a very small share oftotal government outlays (Figure 3.2).
3.04 The main purpose of government spending on cash transfers, a short term povertyalleviation mechanism, is to improve equity and reduce poverty. Public spending oneducation is a longer-tern investment in alleviating poverty, guided by both efficiencyand equity concerns, that coincide in justifying better targeting of resources to the poor inareas that generate high economic returns where the private sector might under supplyservices that benefit the society at large. This chapter evaluates the poverty alleviation ofeach program based on its effectiveness and targeting efficiency. Specifically, theeffectiveness of public spending is defined as the size of the per capita transfer receivedby the poor expressed as a proportion of per capita consumption. All else being equal,the higher this share the more effective the program in alleviating poverty. The efficiencyof poverty alleviation programs is the share of total public spending on each program thatis received by the poorest population groups. The targeting of programs is judged to bestrongly pro-poor (progressive) if the share received by the poor is larger than theirproportion of total population. It is considered weakly non-poor (regressive) if theirshare of public spending exceeds their share in total consumption, but is less than theirshare in total population. It is considered strongly non-poor (highly regressive) if theshare of public transfer is less than their share of total consumption. In the case of publictransfers, where possible, the discussion also focuses on the work incentive effects ofparticular transfer programs, as the lack of work incentives also compromises theefficiency of the program. As in the previous chapters of this report, consumption is usedas a proxy for wealth.
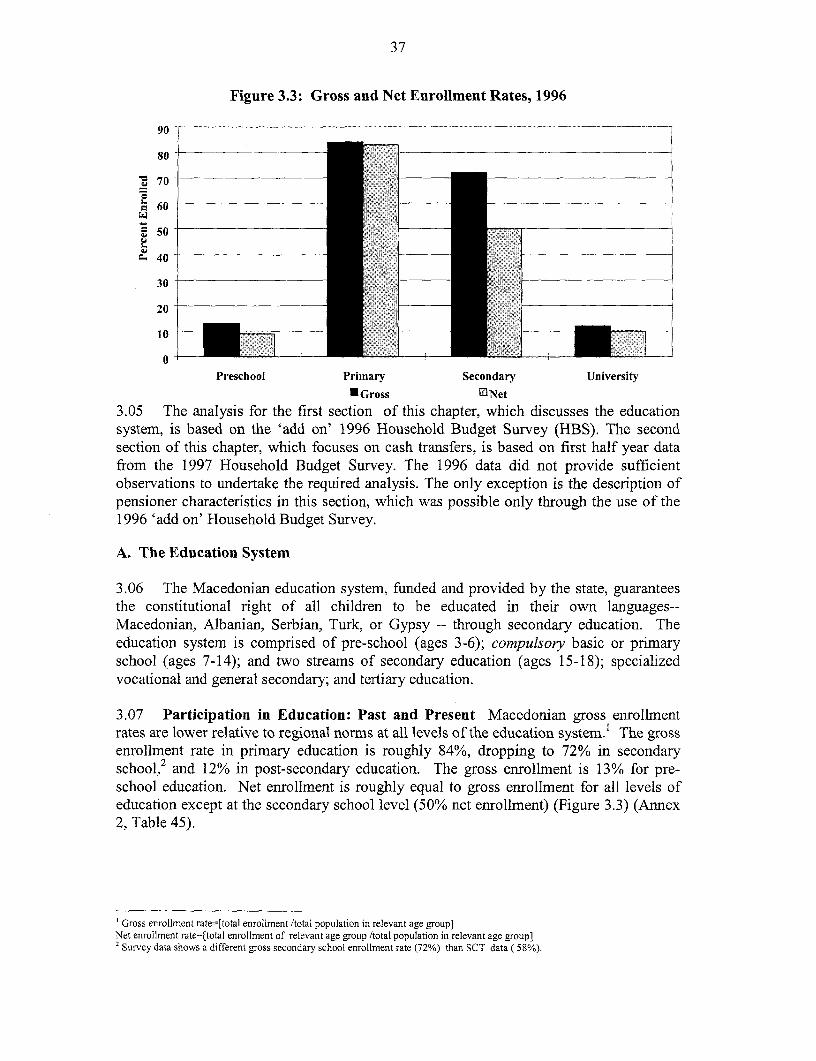
37
Figure 3.3: Gross and Net Enrollment Rates, 1996
90
so
*z 70
60
5 50
40
30
20
10
0Preschool Primary Secondary University
*Gross ONet
3.05 The analysis for the first section of this chapter, which discusses the educationsystem, is based on the 'add on' 1996 Household Budget Survey (HBS). The secondsection of this chapter, which focuses on cash transfers, is based on first half year datafrom the 1997 Household Budget Survey. The 1996 data did not provide sufficientobservations to undertake the required analysis. The only exception is the description ofpensioner characteristics in this section, which was possible only through the use of the1996 'add on' Household Budget Survey.
A. The Education System
3.06 The Macedonian education system, funded and provided by the state, guaranteesthe constitutional right of all children to be educated in their own languages--Macedonian, Albanian, Serbian, Turk, or Gypsy -- through secondary education. Theeducation system is comprised of pre-school (ages 3-6); compulsory basic or primaryschool (ages 7-14); and two streams of secondary education (ages 15-18); specializedvocational and general secondary; and tertiary education.
3.07 Participation in Education: Past and Present Macedonian gross enrollmentrates are lower relative to regional norms at all levels of the education system.' The grossenrollment rate in primary education is roughly 84%, dropping to 72% in secondaryschool,2 and 12% in post-secondary education. The gross enrollment is 13% for pre-school education. Net enrollment is roughly equal to gross enrollment for all levels ofeducation except at the secondary school level (50% net enrollment) (Figure 3.3) (Annex2, Table 45).
' Gross enrollment rate=[total enrollment /total population in relevant age group]Net enrollment rate=[total enrollment of relevant age group /total population in relevant age group]2 Survey data shows a different gross secondary school enrollment rate (72%) than SCT data ( 58%).

38
Figure 3.4: Highest Educational Level Completed by Age
Ages 70+
Ages 61-70
Ages 51-60
Ages 41-50
Ages 31-40
Ages 20-30
0% 10% 20% 30% 40% 50% 60% 70% 80% 90% 100%
r No School a Some Primary 1 Primarv M Secondary * University
% Completing Level
3.08 The current levels of participation in the education system must be seen in anhistorical context. There have been major changes in the participation rate in theeducation system during the transition. As in most transition countries, gross enrollmentrates have declined at all levels of the education system.3 The decline in enrollmentsoverall likely reflects a decline in real household income, an increase in the indirect (interms of foregone income for higher ages), and an increase in direct costs of obtaining aneducation, (as a result of the increased fees and reduced subsidies on textbooks (Seebelow). Another important trend, common to the region, is the switch in enrollmentsfrom highly specialized vocational secondary schools towards general secondaryeducation. This is generally attributed to growing dissonance between specializedvocational secondary education curricula and the market economy. However, despite thisdecline, the enrollment rate in vocational education still remains a very high share of total
4secondary enrollments compared to other countries in the region4.
3.09 The current participation rate also masks major gains made in the educationalattainment of the population over time. The increasing level of average education statuscan be gauged by comparing the educational attainment of successive cohorts (Figure3.4). Education status has increased overall for both men and women and for rural andurban areas. A most important development is the narrowing of the gap, over time,between the educational attainments of males and females and, to a lesser extent, of ruraland urban residents. The country has also achieved a 95% literacy rate. These major
'Laporte and Ringold, Trends in Education, SCT Paper.4ECA Education Sector Strategy.
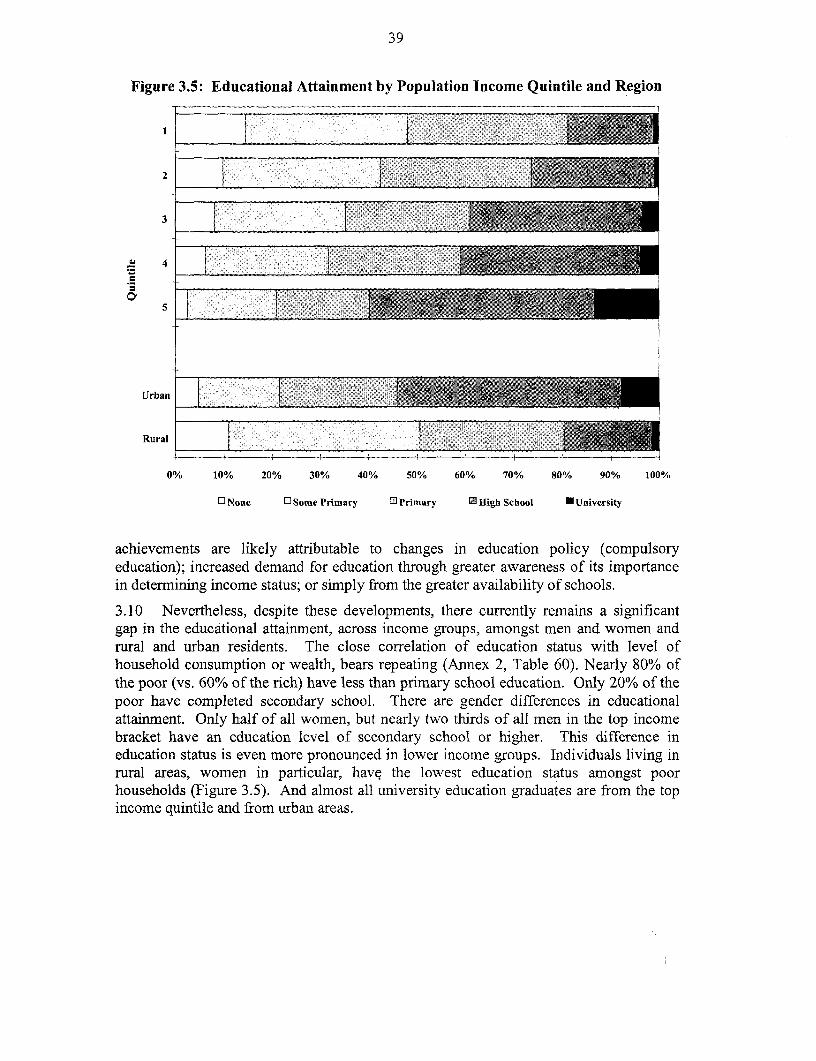
39
Figure 3.5: Educational Attainment by Population Income Quintile and Region
2
3
4
5
Rural
0% 10% 20% 30% 40% 50% 60% 70% 80% 90% 100%
rl None n Some Primary 0Primary El High School U University
achievements are likely attributable to changes in education policy (compulsoryeducation); increased demand for education through greater awareness of its importancein determining income status; or simply from the greater availability of schools.
3.10 Nevertheless, despite these developments, there currently remains a significantgap in the educational attainment, across income groups, amongst men and women andrural and urban residents. The close cor-relation of education status with level ofhousehold consumption or wealth, bears repeating (Annex 2, Table 60). Nearly 80% ofthe poor (vs. 60% of the rich) have less than primary school education. Only 20% of thepoor have completed secondary school. There are gender differences in educationalattainment. Only half of all women, but nearly two thirds of all men in the top incomebracket have an education level of secondary school or higher. This difference ineducation status is even more pronounced in lower income groups. Individuals living inrural areas, women in particular, havq the lowest education status amongst poorhouseholds (Figure 3.5). And almost all university education graduates are from the topincome quintile and from urban areas.
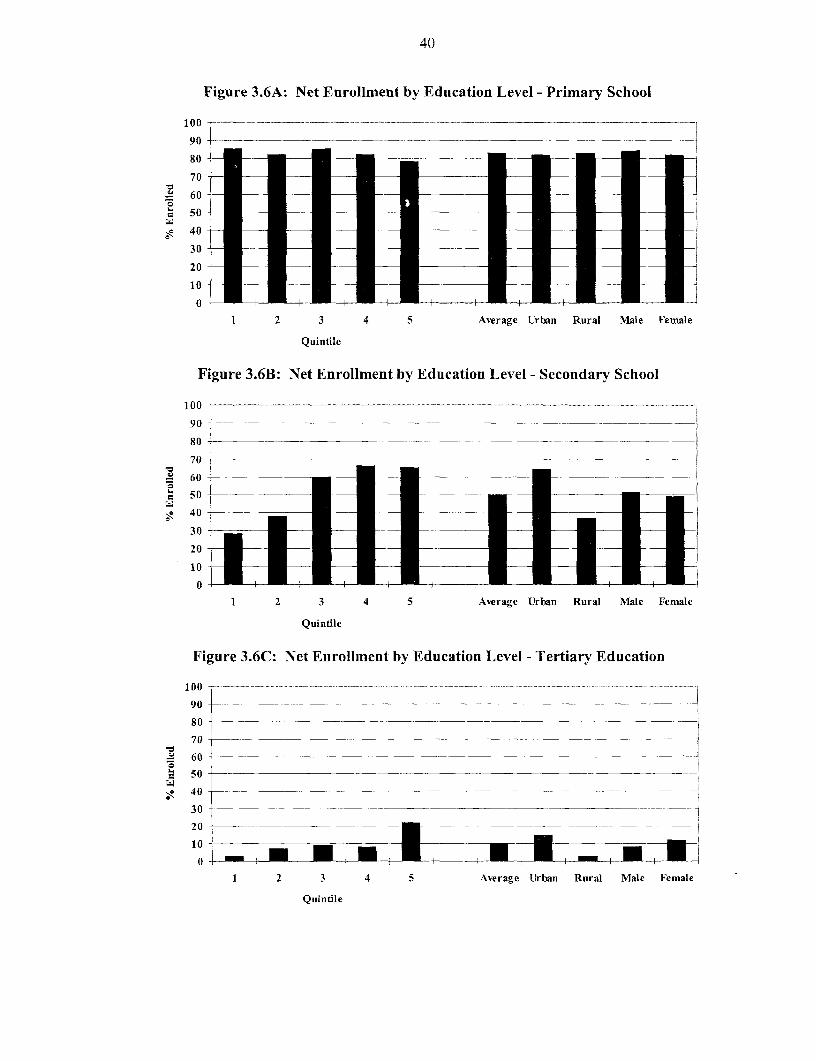
40
Figure 3.6A: Net Enrollment by Education Level - Primary School
100
90 _-__ _
7 0
- 60
5 0
40-
3 0
2 0
1 0
0-
1 2 3 4 5 Average Urban Rural Male Female
Quintile
Figure 3.6B3: Net Enrollment by Education Level - Secondary School
100 -- - - - - - - -- - _ _ _ _
90 - -
80 - _ _ _ _ _ _ _ - - -- - - -]
70
30
20
10
0
1 2 3 4 5 Average Urban Rur al Mal e Female
Quintile
Figure 3.6C: Net Enrollment by Education Level - Tertiary Education
100 .
90 -_ _ _ _ _ _
70 _ _ _ _ _
± 60 _ ___ _ _ _
50 -__
~40 - _ __--
30 _ _ _ _ _ _
2 00_
10
1 2 3 4 Average Urban Rural Male Female
Quintile
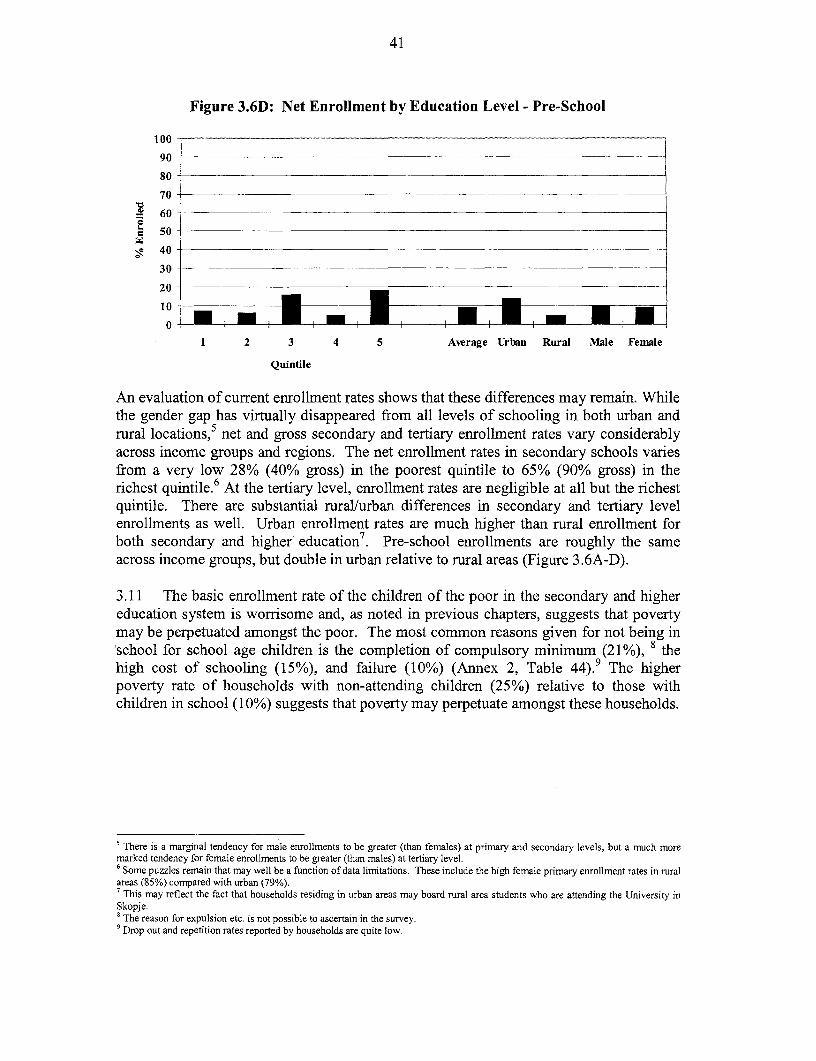
41
Figure 3.6D: Net Enrollment by Education Level - Pre-School
100 -
90-I80
70 -
4 60
5 50
40
30
20
10- U 10
1 2 3 4 5 Average Urban Rural Male Female
Quintile
An evaluation of current enrollment rates shows that these differences may remain. Whilethe gender gap has virtually disappeared from all levels of schooling in both urban andrural locations,' net and gross secondary and tertiary enrolLment rates vary considerablyacross income groups and regions. The net enrollment rates in secondary schools variesfrom a very low 28% (40% gross) in the poorest quintile to 65% (90% gross) in therichest quintile.6 At the tertiary level, enrollment rates are negligible at all but the richestquintile. There are substantial rural/urban differences in secondary and tertiary levelenrollments as well. Urban enrollment rates are much higher than rural enrollment forboth secondary and higher education . Pre-school enrollments are roughly the sameacross income groups, but double in urban relative to rural areas (Figure 3.6A-D).
3.11 The basic enrollment rate of the children of the poor in the secondary and highereducation system is worrisome and, as noted in previous chapters, suggests that povertymay be perpetuated amongst the poor. The most common reasons given for not being inschool for school age children is the completion of compulsory minimum (21%), 8 thehigh cost of schooling (15%), and failure (10%) (Annex 2, Table 44).9 The higherpoverty rate of households with non-attending children (25%) relative to those withchildren in school (10%) suggests that poverty may perpetuate amongst these households.
5 There is a marginal tendency for male enrollments to be greater (than females) at primary and secondary levels, but a much moremarked tendency for female enrollments to be greater (than males) at tertiary level.6 Some puzzles remain that may well be a function of data limitations. These include the high female primary enrollment rates in ruralareas (85%) compared with urban (79%).7 This may reflect the fact that households residing in urban areas may board rural area students who are attending the University inSkopje.
The reason for expulsion etc. is not possible to ascertain in the survey.Drop out and repetition rates reported by households are quite low.
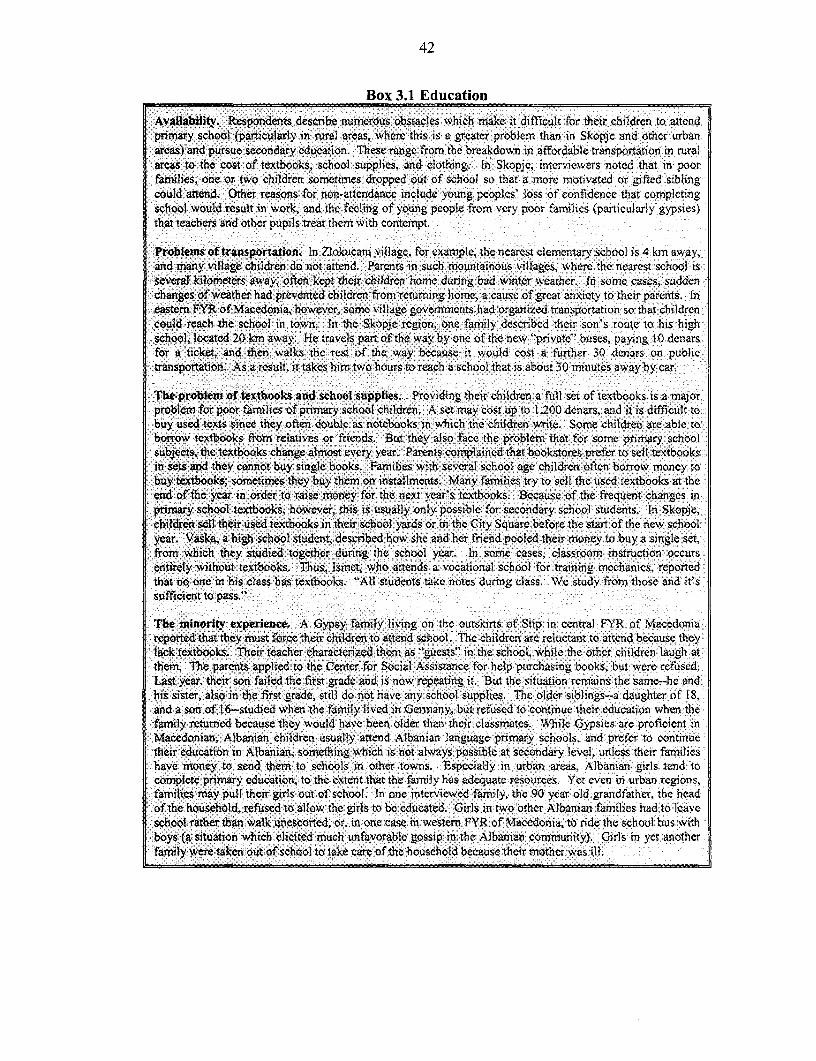
42
Box 3.1 Education
Repondet decribenumerous ibffclts whichdmake.it dfficult for their children o attendprimaryschl(pricuarly in rural areas, where ;this is agrater problem thn in Skopje and other urbanareas)ndpursuesecondaryedution. Tese rangefrm thebrea nin affordable transpoation in rralar0eas to the cost of textoos, school supplies,:and clothing, inq Wi0Skopje, interviewers noted that fi:n poorfamilieks, one or ftwochildren isoeties dropped out of schoo so that a more motivateor gifted ssibligcould atd. th e s for non-attendance include young peoples loss of confidence that completingschool woldresultinwork and the feeling o upe verypoor famnilies (paticularly gypsies)that teachers andotherpupils treat themn withcontiempt
[00UProblems 0of transportatioUn. In ZiLlokucani: villagefrexaple, the nearest elementary school is 4 km away,and many villagechildren donot attend. ParentSu ntinous the nearest school is
s'veral kilometers away, ofen kep their chidren home durin g badwinter weather, dIn some cases, suddenchanges of weatherhhad prevented children from returntinig hmne,a cause of great anxiety to their parents. bneatr FY of Macedonia, oee,l some vfiag gfovernments had oganize trransporationi so that cildren; c Xould breah the school in townS I[n thei Skopjeregin, o nme family describedtheir son's route to his lhijghschtool,located 20 .km0 awa* e travels partA ofthe wyby one jof the newj "private" buses, paying 10 denarssfor a hticket,and then walks theDrest of theway becauseit would; jcost a further 30 denars onpbictrants pofliatio Asa xresult, 0itakshin two hours torth a school tat is about30 Dminutes awtayby bcar. 0 0$
Tbe problem of textbooks and sool supples.. Providing theirchildren a fula sil set of tex is a; majoprob em orpori ies of primary schol chi:ldren. A set may ost up to 120 denars, and it is dificult tobu, ue text invce theyote dubl sntebooksin wich the hlrnwite. Som c0hilde are ajbjle to>fbor row textboks frmreliatives or fredsj. But they also face the prblem tat for some ;primay shool::subjets, hetxtokscanealot evey years Parentscopainedl that bookstoresprfrto sell textboolsitin setsand: they cannot buy single books. i Familllies with several school1 age children: oitn borrow moneyr tobuytcxiboksomtes te u te ninsalets. Many families Vtry ito sel the used textbooks 0at the fend Xof the yar ginoerto rise money frthe next; year's textooks. BEease gof the frequent changes in;iprimay school tetok, oee,th:s is is usual:ly only Xpossible for secondary school students. In Skopjes:
childe el hir used textbokis im thir :i:scho yrsor in tthe :City Square beforethe start of the new school
frmwhc he tdidtgehrd uraing the school 0year. In soecae,clsromisruto ocrXentirl \hutj textbooks Thus, jIsmet whoattends a vocational scho or @0training imechantics, 0reported40*0that no. one in his class has.txtoos "'All Vstudents takenotes dulring class. We 0studyfro tose and Siltssufficientto p ass.";id :: 'u ftt2 i:;fFV tX0:04 i: t ftt0i0Dif f X
00The0 minortyf exprence. jA Gypsyfaily livitng gon 0the outskirts of 0Stipg in central 0FYR of M0acedonireore tha the mwusti fore:itheir ch$ilde to Lattn schoobl.+ The: children are; rteluctantt to :attend beause :theyslack>;&; tetoos heir0 tache characterizdthem as "guests" inthe school, while the othrer :childrnlaugh atU
;:fthemn. The paretsppied to the enter fo Social; Assistac forXhelpurcasing books, fbut were refsed.;S Last y/ear, their son failed the- first gradie and is now repeating it.v But the fsituation remaianS the same-he and:his site,ls i n\t the first grde still Xdo not have Xany school upplies.0 The older siblings-a daugherof 18,>;
(fand a sonof 16-studied when the faily ived in Germ,any, ibut refused to cotnueKtheiir education when. the:famnily returried because they w>ouldf have been older: than theiir cliasmates.: Whil:e G(sies Vare :proficient in:Maeonian,; Albaia children ;usuallyjated fAlbanianilianguage pipnmary schools,: and tprefer to Qcontinue
ithefir euaion tin Albaian somting whtich is0 noit alwy possiblWe at seconday level,0 unless their faiies 0hae money ^to:send thm.to shools ain thr itows. 0Espcal min uranras.Albanian 00girls tend :tocoplt primary euaion,t to the eten tihat the faily has aeuate fresources. Yeti even fi n urtban regions,faile may :pull their girs out ;oftscol;. iTIn one interviewed fail, the909 year old grandfather, Xthe headof the hosehld,; refued tro alloMAwe thgirls to be edcated. GirlsX inz two tothter Albanian ifamilies had to lSeaveschool rathe than walkunesotred or, in one case in western FYR of Macdonia, to ride thei schoolbs wisthsi;bdys (a siuaion whiich elicited mtucih unfavoal gOSsiSp in the Albaniancomunity). X:Girls Vin yet anoter
fail wi*eretakenout ofschool to takecarei of thehousehld beicause thei:r motheras ill. 000000
b I;LLL;,iLL;L0 d ; LL;; L.jSS; :iuTW : : 0 ;i,LLiL : ::-0;ii X 4 k X ;,iai tS-j,L;,,,L, ,,,0i L , ,

43
3.12 The proportion of children who state that completion of the compulsory minimum(vs. completion of their desired level of schooling) is their main reason for not beingenrolled decreases with the income level of the household. Thus more poor than richchildren do not obtain their desired level of schooling . This may reflect the low qualityof schools in poorer areas, or the indirect or opportunity costs of forgone income ofeducating children faced by poorer households. This conjecture is supported by evidencefrom the labor force survey. According to the 1996 Household Budget Survey, somesecondary school age students in rural, or poorer areas, work. The high poverty rateamongst households with non-attending school age children mentioned above suggeststhat withdrawal of children for work is not alleviating poverty. The employment ofworking age children, although it reduces its depth and severity of poverty in the shortrun, does not allow their families to escape poverty, and likely perpetuates it. Gypsychildren are a particularly vulnerable group and some do not attend school (Box 3.1).
3.13 The main costs faced by households in educating their children are books andsupplies and transportation costs. Books and supplies are relatively more important as ashare of private spending for pre-school and primary school students. The share oftransport costs dominates as a share of private spending only at secondary and post-secondary levels. Admission fees become a significant share of education costs only atthe tertiary level (Annex 2 Table 46). Poor households spend more on educating eachchild as a share of household expenditures. The average enrollment cost as a share ofhousehold per capita expenditure decreases with income for all levels of the educationsystem (Table 3.1).
3.14 Public Spending on Education. Recent fiscal problems have reduced real publicspending on education. Education spending has been curtailed through a salary freeze,sharp reductions in non-salary budgets (teacher training, curriculum development,maintenance) and greater cost recovery. Students are now expected to pay for schoolsupplies and textbooks at all levels of the education system. These measures have beencoupled with some initiatives to improve the targeting of education resources towards the
Table 3.1: Ratio of Mean Per-Enrollment Cost and Expenditure Per Capita
euintie/ Preschool Primarv Secondary TertiaryRgio
1 0.08 0.10 0.19 0.342 0.09 0.09 0.17 0.293 0.05 0.08 0.14 0.244 0.02 0,.06 0.10 0.145 0.01 0.06 0.09 0.15
Total 0.03 0.06 0.11 0.21
Urban 0.03 0.06 0.10 0.20Rural 0.04 0.06 0.13 0.17
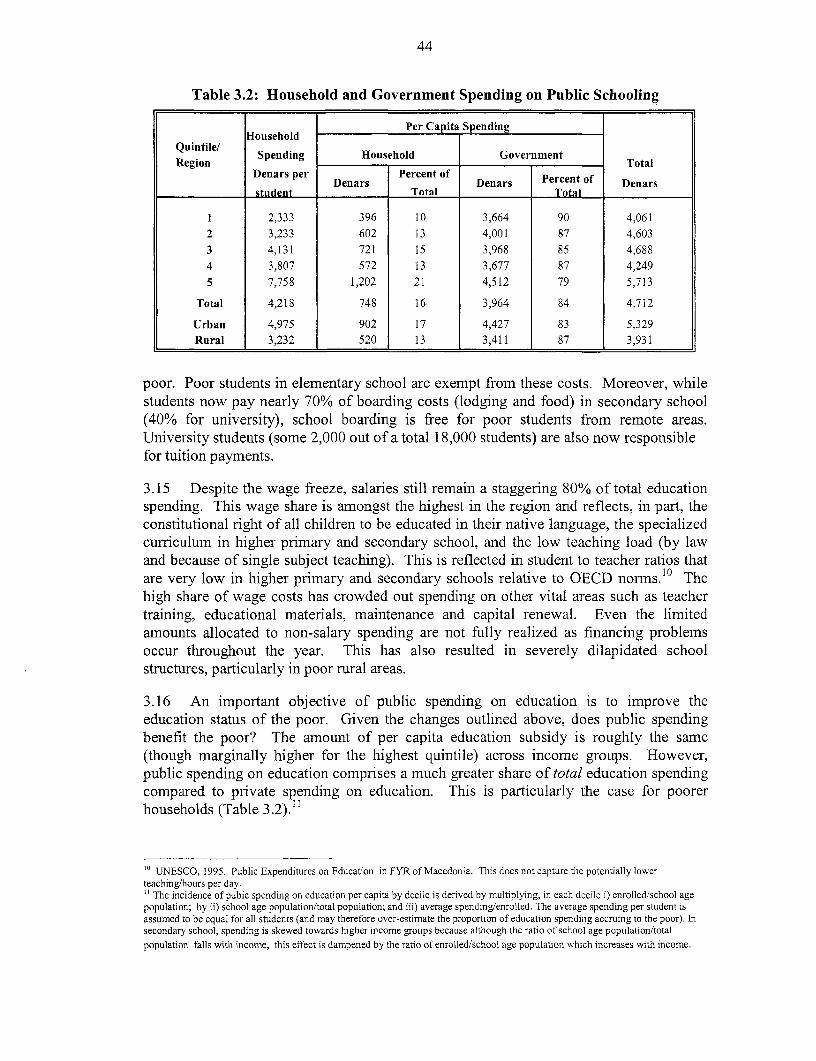
44
Table 3.2: Household and Government Spending on Public Schooling
Per Capita SpendingHouseholdl
Quintile/ Spending Household GovernmentRegion Total
Denars per Percent oflDenars Denars Percent of Denars
student T_t_l Total l
1 2,333 396 10 3,664 90 4,061
2 3,233 602 13 4,001 87 4,603
3 4,131 721 15 3,968 85 4,688
4 3,807 572 13 3,677 87 4,249
5 7,758 1,202 21 4,512 79 5,713
Total 4,218 748 16 3,964 84 4,712
Urban 4,975 902 17 4,427 83 5,329
Rural 3,232 520 13 3,411 87 3,931
poor. Poor students in elementary school are exempt from these costs. Moreover, whilestudents now pay nearly 70% of boarding costs (lodging and food) in secondary school(40% for university), school boarding is free for poor students from remote areas.University students (some 2,000 out of a total 18,000 students) are also now responsiblefor tuition payments.
3.15 Despite the wage freeze, salaries still remain a staggering 80% of total educationspending. This wage share is amongst the highest in the region and reflects, in part, theconstitutional right of all children to be educated in their native language, the specializedcurriculum in higher primary and secondary school, and the low teaching load (by lawand because of single subject teaching). This is reflected in student to teacher ratios thatare very low in higher primary and secondary schools relative to OECD norms.10 Thehigh share of wage costs has crowded out spending on other vital areas such as teachertraining, educational materials, maintenance and capital renewal. Even the limitedamounts allocated to non-salary spending are not fully realized as financing problemsoccur throughout the year. This has also resulted in severely dilapidated schoolstructures, particularly in poor rural areas.
3.16 An important objective of public spending on education is to improve theeducation status of the poor. Given the changes outlined above, does public spendingbenefit the poor? The amount of per capita education subsidy is roughly the same(though marginally higher for the highest quintile) across income groups. However,public spending on education comprises a much greater share of total education spendingcompared to private spending on education. This is particularly the case for poorerhouseholds (Table 3.2).1
'° UNESCO, 1995. Public Expenditures on Education in FYR of Macedonia. This does not capture the potentially lowerteaching/hours per day." The incidence of pubic spending on education per capita by decile is derived by multiplying, in each decile i) enrolled/school agepopulation; by ii) school age population/total population; and iii) average spending/enrolled. The average spending per student isassumed to be equal for all students (and may therefore over-estimate the proportion of education spending accruing to the poor). Insecondary school, spending is skewed towards higher income groups because although the ratio of school age population/totalpopulation falls with income, this effect is dampened by the ratio of enrolled/school age population which increases with income.
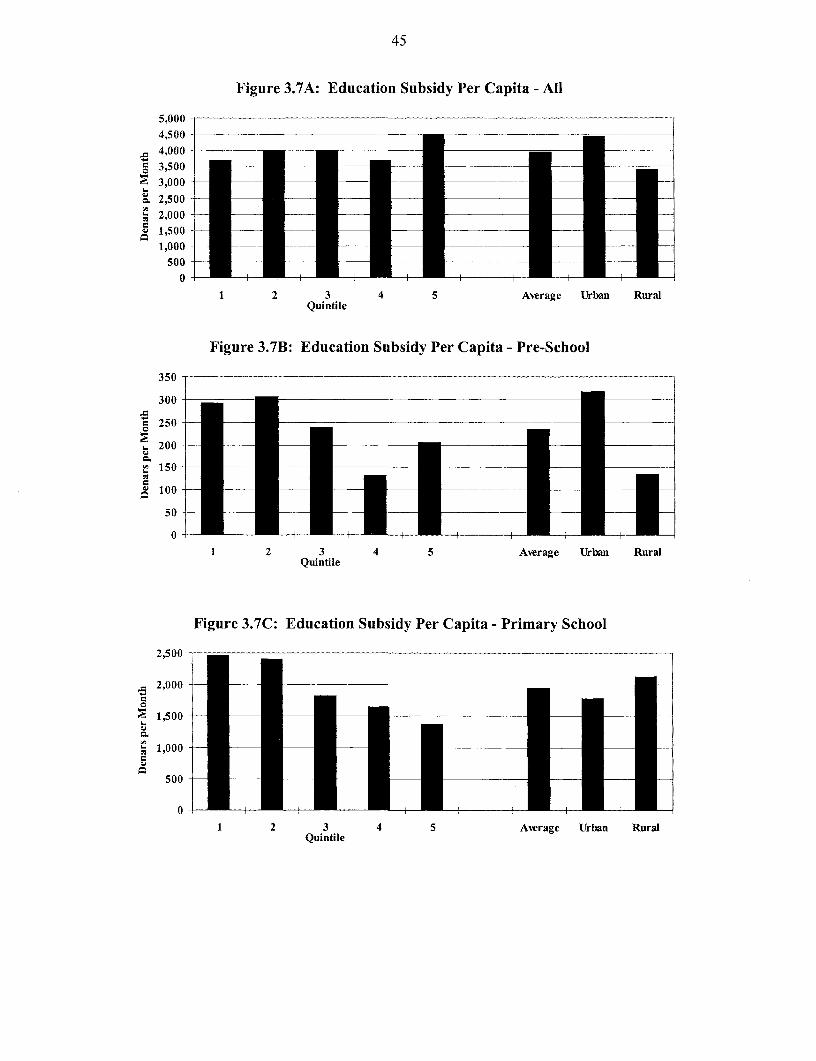
45
Figure 3.7A: Education Subsidy Per Capita - All
5,000
4,500
4,000 I _3,500 -3,000
2300 2,
2,000 1|
50 0S i,Oo- _ - -.
0
1 2 3 4 5 Average Urban RuralQuintile
Figure 3.7C : Education Subsidy Per Capita - Pre-School
350
300
250200
150
~100
2 0-
0U1 2 3 4 5 Average Urban Rural
Quintile
Figure 3.C: Education Subsidy Per Capita - Primary School
2,500-
2,000-
1,500-
1,000
500 m ,-0
1 2 3 4 5 Average Urban RuralQuintile
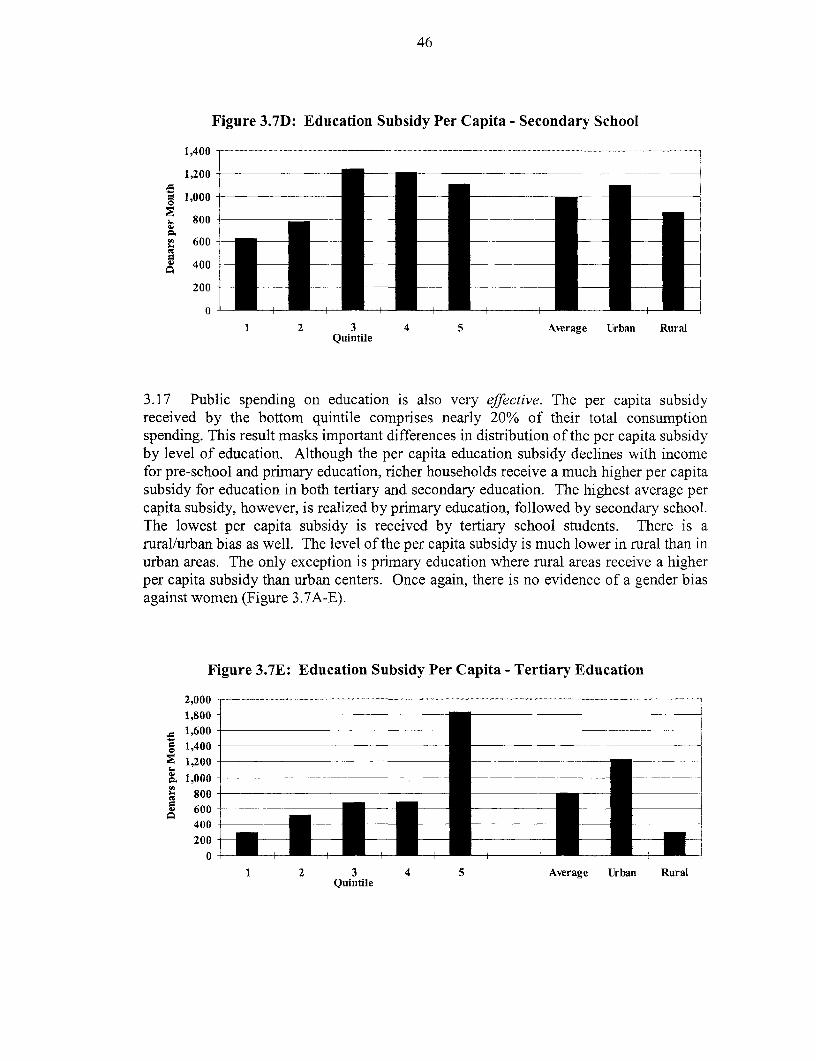
46
Figure 3.7D: Education Subsidy Per Capita - Secondary School
1,400
1,200
a1,000-
6 800
600
'@ 400
200
0
1 2 3 4 5 Average Urban RuralQuintile
3.17 Public spending on education is also very effective. The per capita subsidyreceived by the bottom quintile comprises nearly 20% of their total consumptionspending. This result masks important differences in distribution of the per capita subsidyby level of education. Although the per capita education subsidy declines with incomefor pre-school and primary education, richer households receive a much higher per capitasubsidy for education in both tertiary and secondary education. The highest average percapita subsidy, however, is realized by primary education, followed by secondary school.The lowest per capita subsidy is received by tertiary school students. There is arural/urban bias as well. The level of the per capita subsidy is much lower in rural than inurban areas. The only exception is primary education where rural areas receive a higherper capita subsidy than urban centers. Once again, there is no evidence of a gender biasagainst women (Figure 3.7A-E).
Figure 3.7E: Education Subsidy Per Capita - Tertiary Education
2,0001,800-
. 1,6005 1,400
2 1,200
o.1,000-6 800-
600400
2000
1 2 3 4 5 Average Urban RuralQuintile
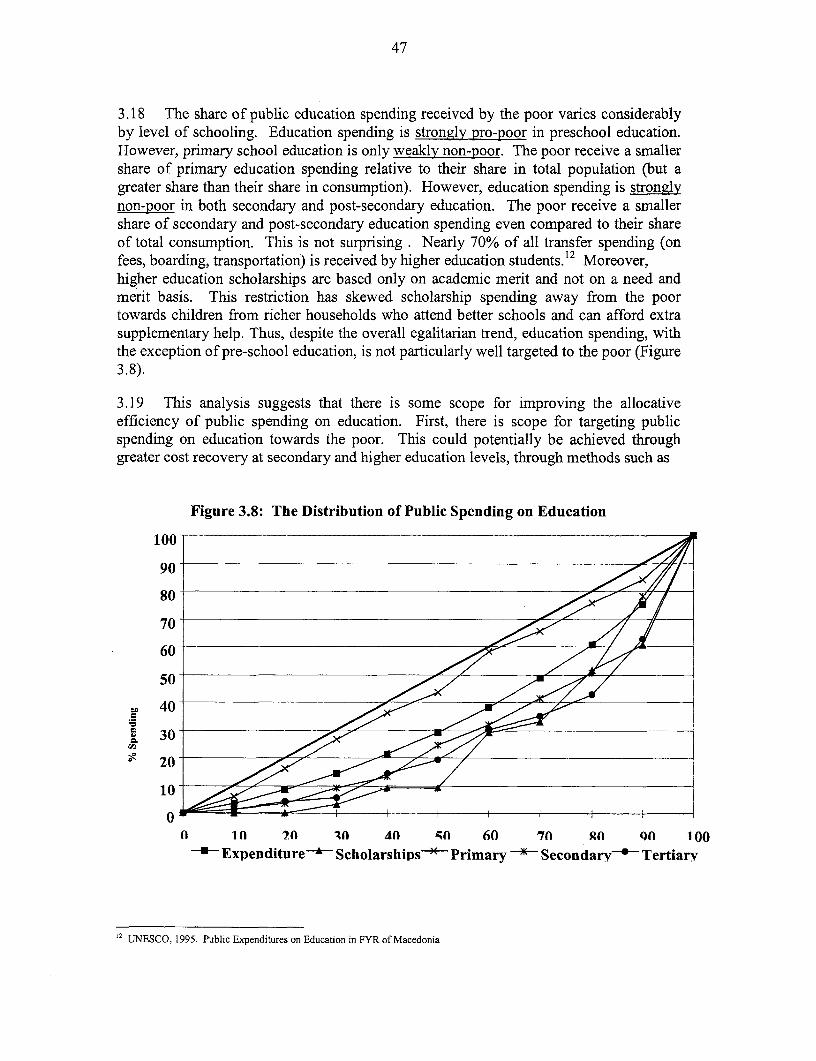
47
3.18 The share of public education spending received by the poor varies considerablyby level of schooling. Education spending is strongly pro-poor in preschool education.However, primary school education is only weakly non-poor. The poor receive a smallershare of primary education spending relative to their share in total population (but agreater share than their share in consumption). However, education spending is stronglynon-poor in both secondary and post-secondary education. The poor receive a smallershare of secondary and post-secondary education spending even compared to their shareof total consumption. This is not surprising . Nearly 70% of all transfer spending (onfees, boarding, transportation) is received by higher education students.12 Moreover,higher education scholarships are based only on academic merit and not on a need andmerit basis. This restriction has skewed scholarship spending away from the poortowards children from richer households who attend better schools and can afford extrasupplementary help. Thus, despite the overall egalitarian trend, education spending, withthe exception of pre-school education, is not particularly well targeted to the poor (Figure3.8).
3.19 This analysis suggests that there is some scope for improving the allocativeefficiency of public spending on education. First, there is scope for targeting publicspending on education towards the poor. This could potentially be achieved throughgreater cost recovery at secondary and higher education levels, through methods such as
Figure 3.8: The Distribution of Public Spending on Education
100 _~
90
80
70
60
50
40
130Con
s 20
10
0~n1 In 70 An An nfl 60 70 Rxn o 100
- Expenditure Scholarships " Primary x Secondarv+ Tertiary
12 UNESCO, 1995. Public Expenditures on Education in FYR of Macedonia

48
increased fees (with attention to the impact on the demand for education). These savingscould be used to subsidize fees, textbooks, boarding, and transportation for poor ruralstudents. To increase the participation of the poor in higher education, scholarships couldbe awarded on a need and merit basis, or set aside for a certain proportion for both.
3.20 Second, there may also be scope for improving the allocation of educationspending from wage to non-wage costs. However, this re-allocation will have to beconsistent with the phasing and content of the reforms in curriculum, teacher training, etc.to improve the quality of the education system.
3.21 Summary
* The country has made significant gains in raising the education status of thepopulation at all levels of income, gender, and rural/urban location. Nevertheless,education status of the working age population is still lower for women than men, forthe poor than the rich, and for rural than urban residents.
* The gender gap has been virtually eliminated at all levels of the education system,and income and rural/urban differences have been virtually overcome in compulsorybasic education.
- The enrollment rates of the poor are much lower in secondary and higher education.The low participation rates of children of poorer rural areas (with less educatedhousehold heads) is particularly worrisome and indicates that poverty may beperpetuate amongst these groups.
* Private spending on education is regressive. Poorer households spend more oneducation relative to their income compared to the rich. Books and supplies are themost important components of private costs in primary and pre-school education.Transportation costs dominate private spending at the secondary and post-secondarylevels.
o Public spending on pre-school education is strongly pro-poor, and primary educationspending is roughly egalitarian while public spending on both secondary and highereducation is strongly non-poor. Public education transfer spending on education isreceived by higher income tertiary education students. Scholarships are also receiveddisproportionately by higher income groups.
* Real spending on education should be kept constant. However, there is scope forimproving the resource allocation of education spending, from rich to poor and fromwage costs to investment in the quality of the education system and educationalfacilities.
* Pro-poor education policies include greater cost recovery in secondary and highereducation (with attention to demand) coupled with secondary and higher educationscholarships that focus on both merit and need; reducing the costs of textbooks andbooks/supplies at primary education levels and transportation/boarding for the poor,particularly at secondary and higher education levels.
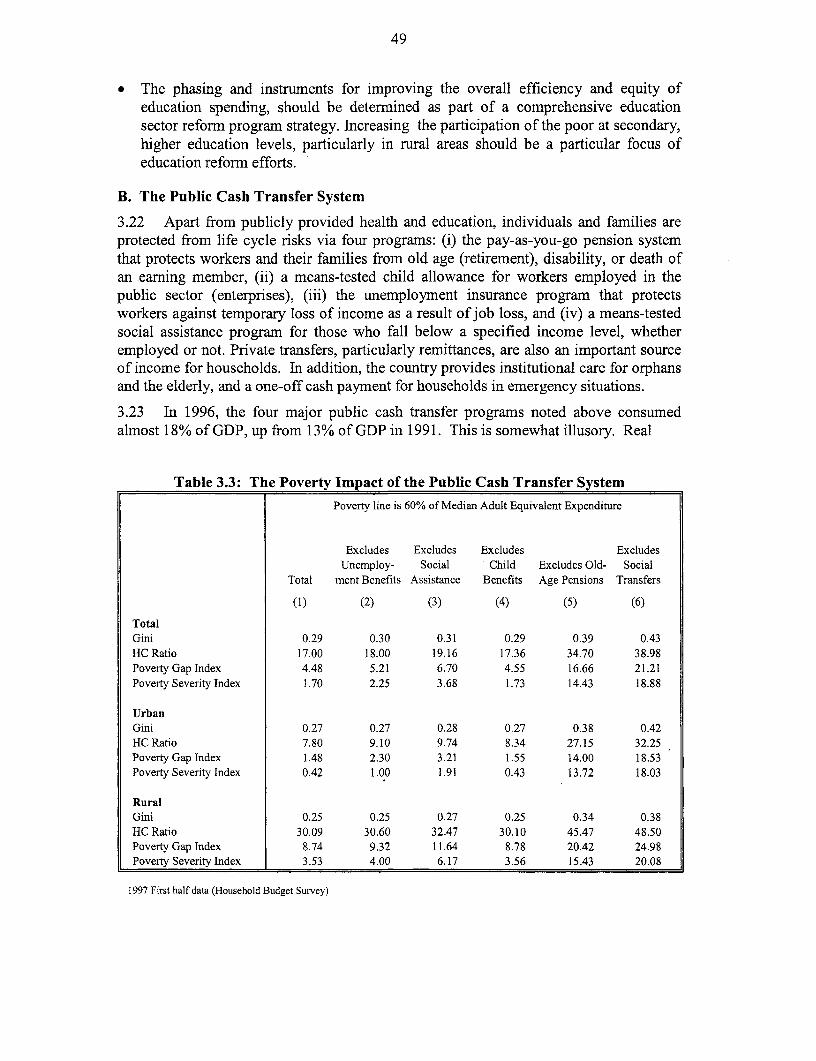
49
* The phasing and instruments for improving the overall efficiency and equity ofeducation spending, should be determined as part of a comprehensive educationsector reform program strategy. Increasing the participation of the poor at secondary,higher education levels, particularly in rural areas should be a particular focus ofeducation reform efforts.
B. The Public Cash Transfer System
3.22 Apart from publicly provided health and education, individuals and families areprotected from life cycle risks via four programs: (i) the pay-as-you-go pension systemthat protects workers and their families from old age (retirement), disability, or death ofan earning member, (ii) a means-tested child allowance for workers employed in thepublic sector (enterprises), (iii) the unemployment insurance program that protectsworkers against temporary loss of income as a result of job loss, and (iv) a means-testedsocial assistance program for those who fall below a specified income level, whetheremployed or not. Private transfers, particularly remittances, are also an important sourceof income for households. In addition, the country provides institutional care for orphansand the elderly, and a one-off cash payment for households in emergency situations.
3.23 In 1996, the four major public cash transfer programs noted above consumedalmost 18% of GDP, up from 13% of GDP in 1991. This is somewhat illusory. Real
Table 3.3: The Poverty Impact of the Public Cash Transfer SystemPoverty line is 60% of Median Adult Equivalent Expenditure
Excludes Excludes Excludes ExcludesUnemploy- Social Child Excludes Old- Social
Total ment Benefits Assistance Benefits Age Pensions Transfers
(1) (2) (3) (4) (5) (6)
TotalGini 0.29 0.30 0.31 0.29 0.39 0.43HC Ratio 17.00 18.00 19.16 17.36 34.70 38.98Poverty Gap Index 4.48 5.21 6.70 4.55 16.66 21.21Poverty Severity Index 1.70 2.25 3.68 1.73 14.43 18.88
UrbanGini 0.27 0.27 0.28 0.27 0.38 0.42HC Ratio 7.80 9.10 9.74 8.34 27.15 32.25Poverty Gap Index 1.48 2.30 3.21 1.55 14.00 18.53Poverty Severity Index 0.42 1.00 1.91 0.43 13.72 18.03
RuralGini 0.25 0.25 0.27 0.25 0.34 0.38HC Ratio 30.09 30.60 32.47 30.10 45.47 48.50Poverty Gap Index 8.74 9.32 11.64 8.78 20.42 24.98PovertySeveritylndex 3.53 4.00 6.17 3.56 15.43 20.08
1997 First half data (Household Budget Survey)
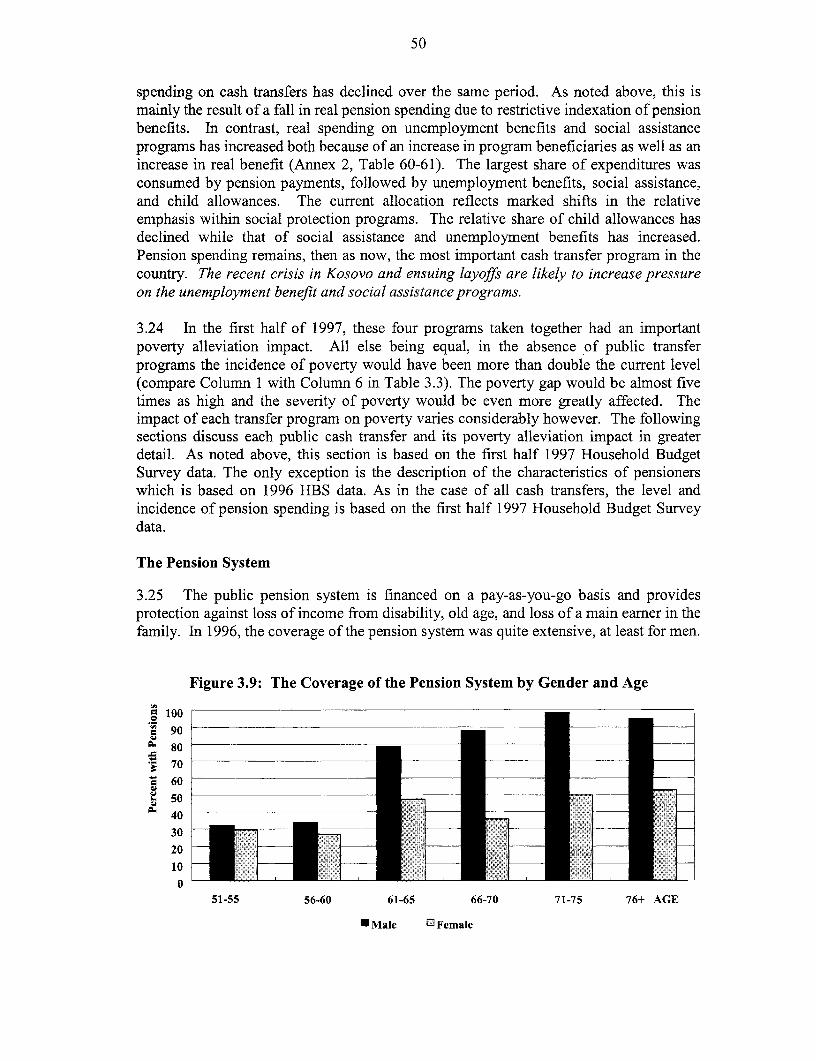
50
spending on cash transfers has declined over the same period. As noted above, this ismainly the result of a fall in real pension spending due to restrictive indexation of pensionbenefits. In contrast, real spending on unemployment benefits and social assistanceprograms has increased both because of an increase in program beneficiaries as well as anincrease in real benefit (Annex 2, Table 60-61). The largest share of expenditures wasconsumed by pension payments, followed by unemployment benefits, social assistance,and child allowances. The current allocation reflects marked shifts in the relativeemphasis within social protection programs. The relative share of child allowances hasdeclined while that of social assistance and unemployment benefits has increased.Pension spending remains, then as now, the most important cash transfer program in thecountry. The recent crisis in Kosovo and ensuing layoffs are likely to increase pressureon the unemployment benefit and social assistance programs.
3.24 In the first half of 1997, these four programs taken together had an importantpoverty alleviation impact. All else being equal, in the absence of public transferprograms the incidence of poverty would have been more than double the current level(compare Column 1 with Column 6 in Table 3.3). The poverty gap would be almost fivetimes as high and the severity of poverty would be even more greatly affected. Theimpact of each transfer program on poverty varies considerably however. The followingsections discuss each public cash transfer and its poverty alleviation impact in greaterdetail. As noted above, this section is based on the first half 1997 Household BudgetSurvey data. The only exception is the description of the characteristics of pensionerswhich is based on 1996 HBS data. As in the case of all cash transfers, the level andincidence of pension spending is based on the first half 1997 Household Budget Surveydata.
The Pension System
3.25 The public pension system is financed on a pay-as-you-go basis and providesprotection against loss of income from disability, old age, and loss of a main earner in thefamily. In 1996, the coverage of the pension system was quite extensive, at least for men.
Figure 3.9: The Coverage of the Pension System by Gender and Age
100C
908070
* 605040302010
051-55 56-60 61-65 66-70 71-75 76+ AGE
UMale 11 Female
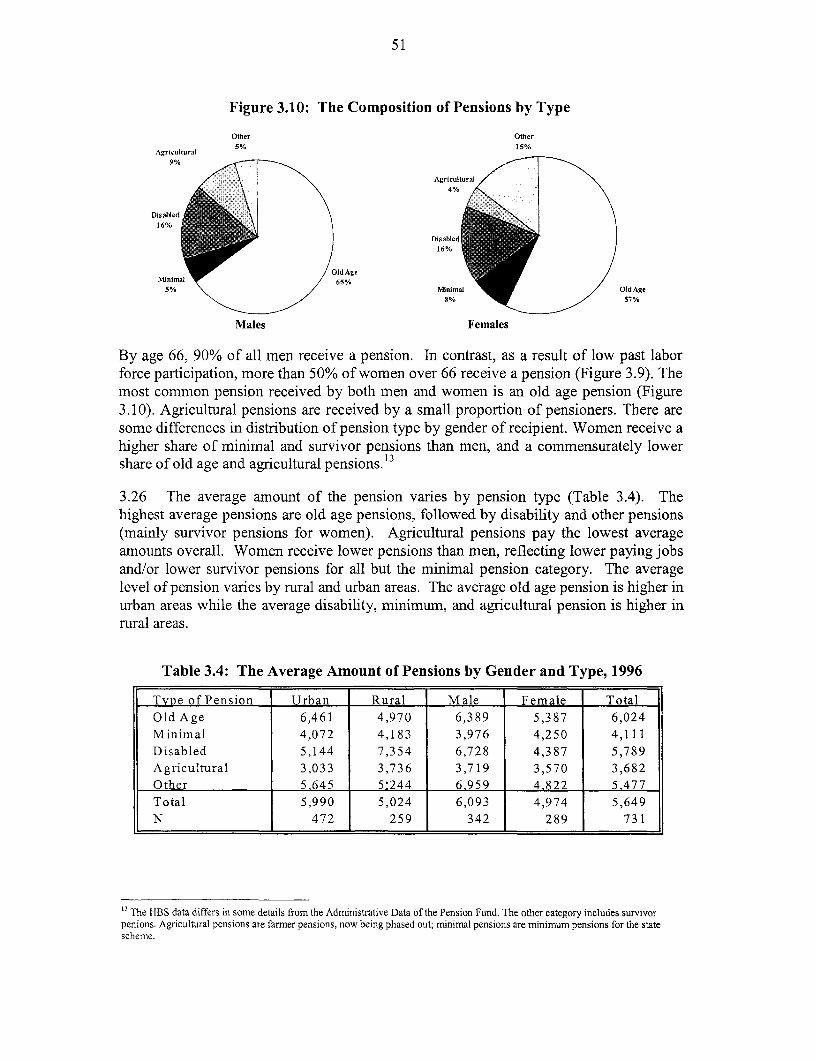
51
Figure 3.10: The Composition of Pensions by Type
Other Other5% 1 5%
Agricuitural9%
Agricultura\
Disabled16%
Disaled
/OldAgeMinimal 65%
5% / 1s53nim OldAge8% 57%
Males Females
By age 66, 90% of all men receive a pension. In contrast, as a result of low past laborforce participation, more than 50% of women over 66 receive a pension (Figure 3.9). Themost common pension received by both men and women is an old age pension (Figure3.10). Agricultural pensions are received by a small proportion of pensioners. There aresome differences in distribution of pension type by gender of recipient. Women receive ahigher share of minimal and survivor pensions than men, and a commensurately lowershare of old age and agricultural pensions.13
3.26 The average amount of the pension varies by pension type (Table 3.4). Thehighest average pensions are old age pensions, followed by disability and other pensions(mainly survivor pensions for women). Agricultural pensions pay the lowest averageamounts overall. Women receive lower pensions than men, reflecting lower paying jobsand/or lower survivor pensions for all but the minimal pension category. The averagelevel of pension varies by rural and urban areas. The average old age pension is higher inurban areas while the average disability, minimum, and agricultural pension is higher inrural areas.
Table 3.4: The Average Amount of Pensions by Gender and Type, 1996
Tvye of Pension Urban Rural Male Female Total
Old Age 6,461 4,970 6,389 5,387 6,024Minimal 4,072 4,183 3,976 4,250 4,111Disabled 5,144 7,354 6,728 4,387 5,789Agricultural 3,033 3,736 3,719 3,570 3,682Other 5.645 5:244 6.959 4.822 5.477Total 5,990 5,024 6,093 4,974 5,649N 472 259 342 289 731
"The HBS data differs in some details from the Administrative Data of the Pension Fund. The other category includes survivorpenions. Agricultural pensions are farmer pensions, now being phased out; minimal pensions are minimum pensions for the statescheme.
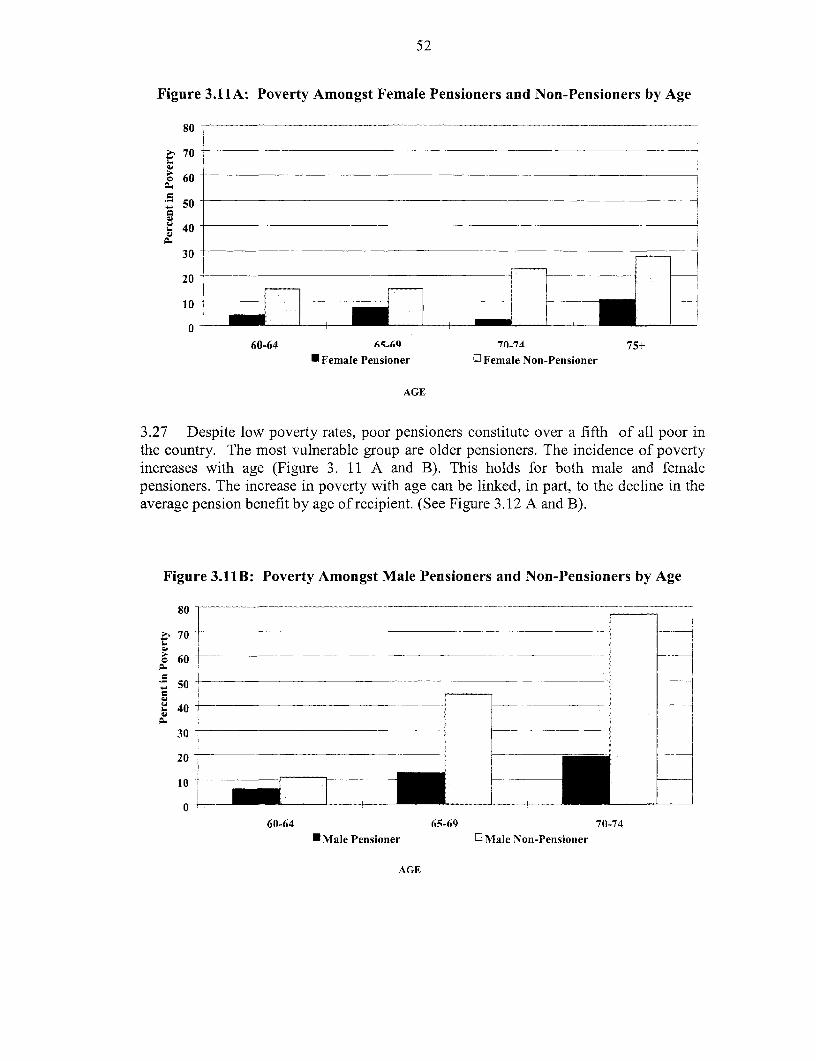
52
Figure 3.11A: Poverty Amongst Female Pensioners and Non-Pensioners by Age
80 1 _ _
70 _
> 60
50
, 40
30
20
60-64 '7fl71A 75+
* Female Pensioner 2 Female Non-Pensioner
AGE
3.27 Despite low poverty rates, poor pensioners constitute over a fifth of all poor inthe country. The most vulnerable group are older pensioners. The incidence of povertyincreases with age (Figure 3. 11 A and B). This holds for both male and femalepensioners. The increase in poverty with age can be linked, in part, to the decline in theaverage pension benefit by age of recipient. (See Figure 3.12 A and B).
Figure 3.11B: Poverty Amongst Male Pensioners and Non-Pensioners by Age
80 - _ _ _
70 ___
o608Z 0 _._______________ _ _.________ __ __ ______.___ ___.___.____
50
40
30
20
10'
6n-64 6^-69 70-74
*Male Pensioner Male Non-Pensioner
AGE
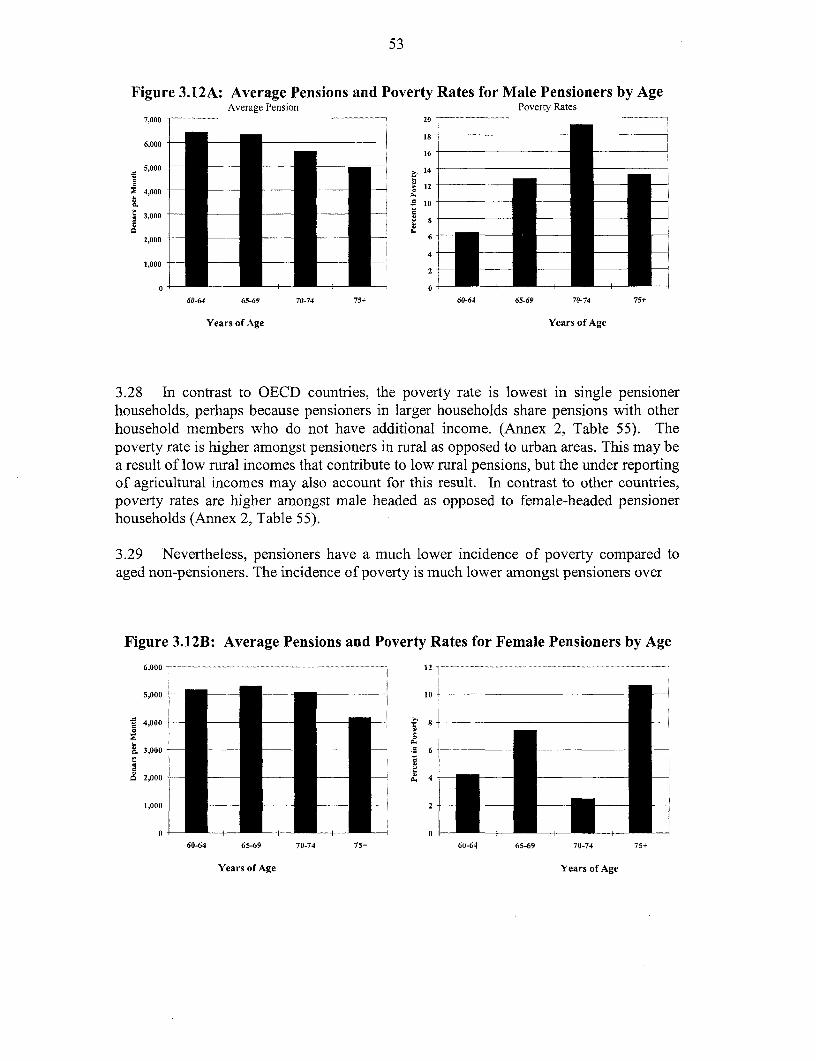
53
Figure 3.12A: Average Pensions and Poverty Rates for Male Pensioners by AgeAverage Pension Poverty Rates
7,000 ~ 20
6,000 - __ _ _ - 16
4,000 _ 421 2
3.000 U2,000 - 6,
1,0002
0 0 -
60-64 65-69 70-74 75+ 60-64 65-69 70-74 75+
Years of Age Years of Age
3.28 In contrast to OECD countries, the poverty rate is lowest in single pensionerhouseholds, perhaps because pensioners in larger households share pensions with otherhousehold members who do not have additional income. (Annex 2, Table 55). Thepoverty rate is higher amongst pensioners in rural as opposed to urban areas. This may bea result of low rural incomes that contribute to low rural pensions, but the under reportingof agricultural incomes may also account for this result. In contrast to other countries,poverty rates are higher amongst male headed as opposed to female-headed pensionerhouseholds (Annex 2, Table 55).
3.29 Nevertheless, pensioners have a much lower incidence of poverty compared toaged non-pensioners. The incidence of poverty is much lower amongst pensioners over
Figure 3.12B: Average Pensions and Poverty Rates for Female Pensioners by Age6 000 - --- -------- ..... ... 12
5,000 * 10 *
S 4.000 t
.3,000 .=6 6
8 2,000 4
1,000- 2 ** * .
60-64 65-69 70-74 75+ 60-64 65-69 70-74 75+
Years of Age Years of Age
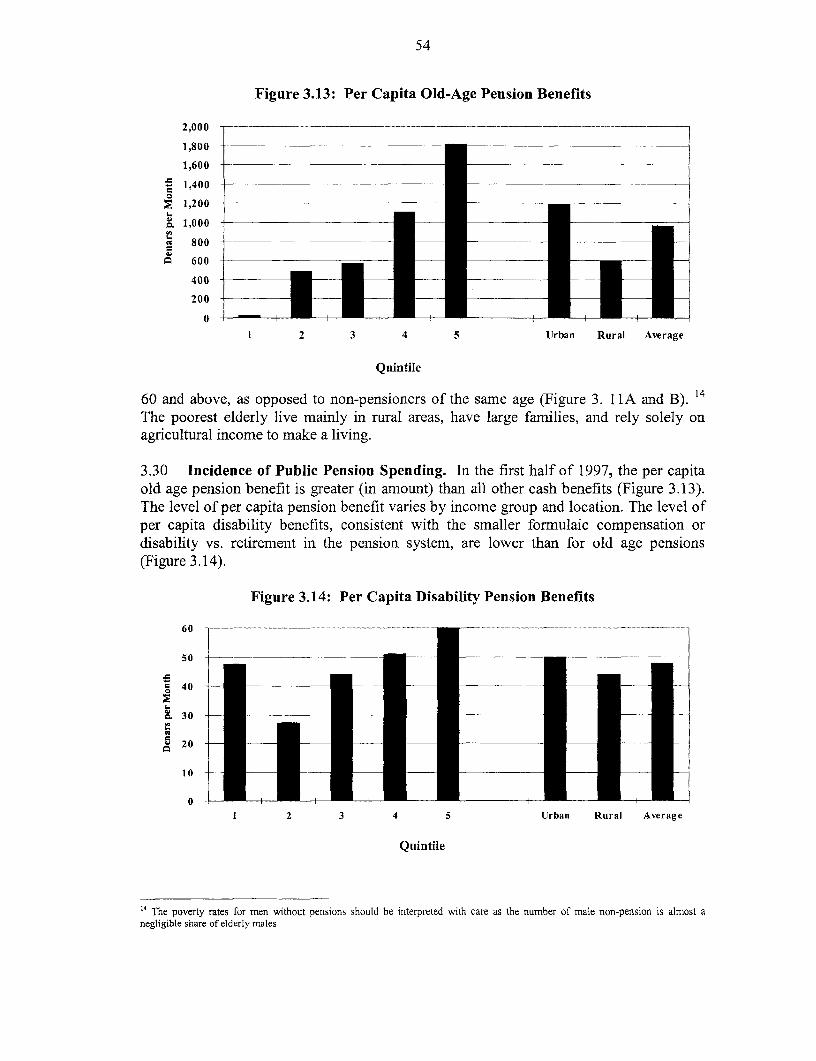
54
Figure 3.13: Per Capita Old-Age Pension Benefits
2,000
1,800
1,600
. 1,400
2 1,200
". 1,000
cw 800
C 600
400
200
0
1 2 3 4 5 Urban Rural Average
Quintile
60 and above, as opposed to non-pensioners of the same age (Figure 3. 1 IA and B). 14
The poorest elderly live mainly in rural areas, have large families, and rely solely onagricultural income to make a living.
3.30 Incidence of Public Pension Spending. In the first half of 1997, the per capitaold age pension benefit is greater (in amount) than all other cash benefits (Figure 3.13).The level of per capita pension benefit varies by income group and location. The level ofper capita disability benefits, consistent with the smaller formulaic compensation ordisability vs. retirement in the pension system, are lower than for old age pensions(Figure 3.14).
Figure 3.14: Per Capita Disability Pension Benefits
60......
50
C'40
30
A2010
0.1 2 3 4 5 Urban Rural Average
Quintile
'4 The poverty rates for men without pensions should be interpreted with care as the number of male non-pension is almost anegligible share of elderly males.
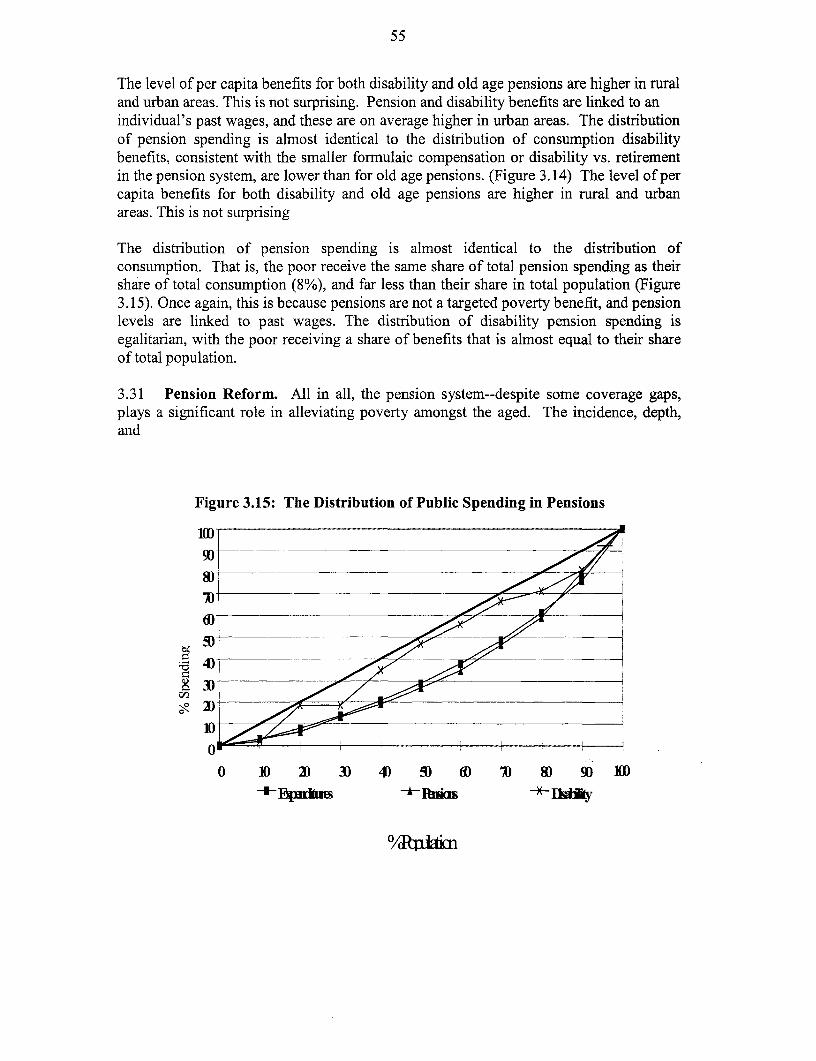
55
The level of per capita benefits for both disability and old age pensions are higher in ruraland urban areas. This is not surprising. Pension and disability benefits are linked to anindividual's past wages, and these are on average higher in urban areas. The distributionof pension spending is almost identical to the distribution of consumption disabilitybenefits, consistent with the smaller formulaic compensation or disability vs. retirementin the pension system, are lower than for old age pensions. (Figure 3.14) The level of percapita benefits for both disability and old age pensions are higher in rural and urbanareas. This is not surprising
The distribution of pension spending is almost identical to the distribution ofconsumption. That is, the poor receive the same share of total pension spending as theirshare of total consumption (8%), and far less than their share in total population (Figure3.15). Once again, this is because pensions are not a targeted poverty benefit, and pensionlevels are linked to past wages. The distribution of disability pension spending isegalitarian, with the poor receiving a share of benefits that is almost equal to their shareof total population.
3.31 Pension Reform. All in all, the pension system--despite some coverage gaps,plays a significant role in alleviating poverty amongst the aged. The incidence, depth,and
Figure 3.15: The Distribution of Public Spending in Pensions
90' '
6J I
10/ io-o,
50
4D--
56
severity of poverty would all increase significantly if there were no pension system at all.(See Table 3.3). 15 However, this protection against poverty in old-age has come atconsiderable cost to society.
3.32 Confronted with these problems, the Government has undertaken major reformsof the pension system. The system replacement rate was reduced, minimum pensionswere decreased, restrictive pension indexation policies are being pursued, and retirementages--for both men and women--are slowly being increased over time. The sharp growthin pension costs has therefore been largely contained, but pension expenditures stillremain a sizable share of GDP. As such, these transfers continue to impose a high taxrate on current workers with a potentially adverse impact on formal sector employment.
3.33 The growing financial problems over the transition reduced the level of protectionoffered by the system. As noted in chapter one, the incidence of poverty amongstpensioners has increased over time. The dissolution of pension contracts during times offinancial difficulties are endemic to public pay-as-you go pension systems. The aging ofthe population will only strain this level of protection in the future. Financial problemscould well emerge even earlier, as the restrictive pension indexation policy,--based on awage freeze in the public sector--is unlikely to be sustained over the medium term. Therecently revised savings contract between workers and the state could therefore not besustained in the future.
3.34 In the long run, increasing the financial viability of the public pension system thatwould allow payroll taxes to fall from current levels, and increasing the contribution-savings link through a private funded scheme, will help avert poverty amongst currentworkers by increasing employment, and perhaps even net wage, with no adverse effect onpensioners. The reform proposals being considered by the Government includes a reformof the public pension system to improve its financial solvency and the introduction ofprivate funded schemes that would allow individuals to save for old age using marketinstruments. Private life insurance and disability insurance provisions should helpprovide elderly left without a spouse or those with disabilities, to help smoothconsumption against these contingencies.
IS This analysis views the counter-factual as the removal of the existing system. It does not address whether poverty reduction wouldhave been greater had another more efficient (less costly) system been in place.
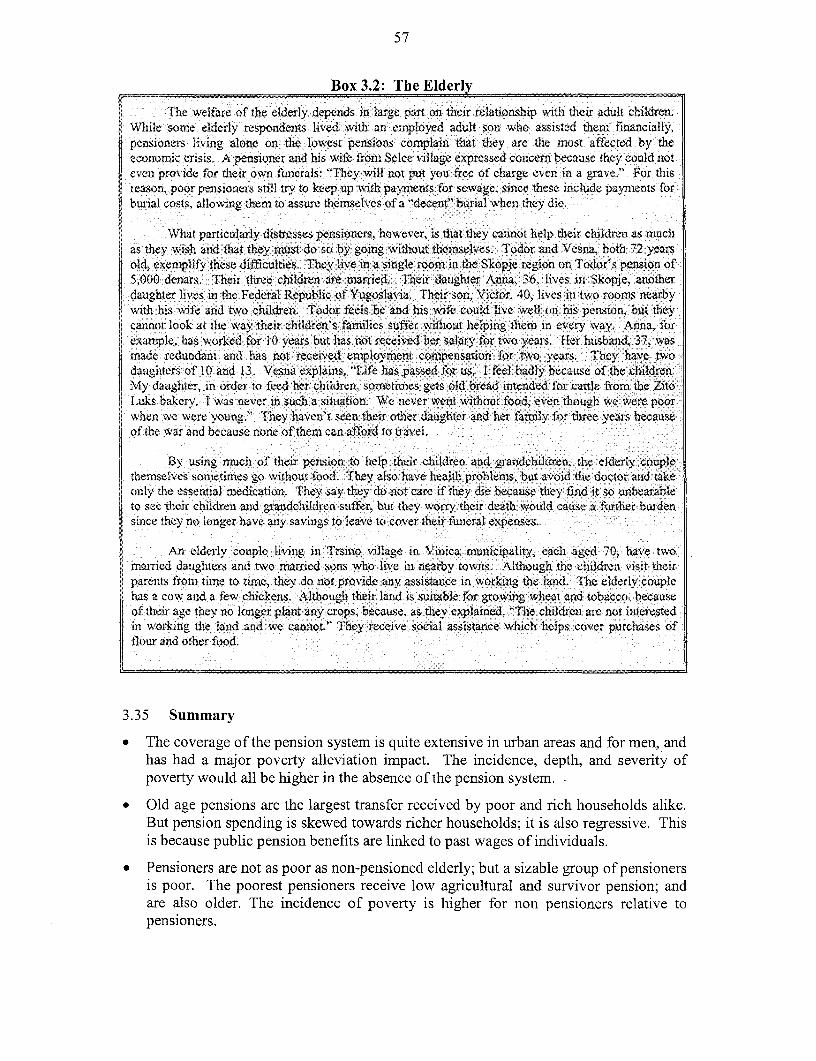
57
Box 3.2: The Elderly
The welfare of the elderly depends in large part on their relationship with their adult children.While some elderiy respondents lived with an employed adult son who assisted them financially,pensioners living alone on the lowest pensions complain that they are the most affected by theeconomic crisis. A pensioner and his wife from Selce village expressed concern because they could noteven provide for their own funerals: "They will not put you free of charge even in a grave." For thisreason, poor pensioners still try to keep up with payments for sewage, since these include paynments forburial costs, allowing them to assure themselves of a "decent' burial when they diel
What particularly distresses pensioners, however, is that they cannot help their children as muchas they wish and that they must do so by going without themselves. Todor and Vesna, both 72 yearsold, exemplify these difficulties. They live in a single room in the Skopje region on Todor's pension of5,000 denars. Their three children are married. Their daughter Anna. 36, lives in Skopje. anotherdaughter lives in the Federal Republic of Yugoslavia. Their son, Victor, 40, lives in two roorms nearbywith his wife and two children. Todor feels he and his wife could live well on his pension, but theycannot look at the way their children's families suffer without helping them in every way. Anna, forexample, has worked for 10 years but has not received her salary for two years. Her husband, 37. wasmade redundant and has not received employment compensation for two years. They have twodaughters of 10 and 13. Vesna explains, "Life has passed for us. I feel badly because of the children.My daughter. in order to feed her children, sometimes gets old bread intended for cattle from the ZitoLuks bakery. I was never in such a situation. We never went without food, even though we were poorwhen we were young." They haven't seen their other daughter and her fanmily for three years because
l of the war and because none of them can afford to travel.
By using much of their pension to help their children and grandchildren, the elderly couplethemselves sonmetimes go without food. They also have health problems, but avoid the doctor and takelonly the essential medication. They say they do not care if they die because they find it so unbearableto see their children anid grandchildren suffer, but they worry their death would cause a further burdensince they no longer have any savings to leave to cover their funeral expenses.
An elderly couple living in Trsino village in Vinica municipality, each aged 70, have twomarried daughters and two married sons who live in nearby towns. Although the children visit their
i parents from time to time, they do not provide any assistance in working the land. The elderly couplehas a cow and a few chickens. Although their land is suitable for growing wheat and tobacco, because
| of their age they no longer plant any crops, because, as they explained, "The children are not interestedin working the land and we cannot." They receive social assistance which helps cover purchases offlour and other food.
3.35 Summary
* The coverage of the pension system is quite extensive in urban areas and for men, andhas had a major poverty alleviation impact. The incidence, depth, and severity ofpoverty would all be higher in the absence of the pension system. -
* Old age pensions are the largest transfer received by poor and rich households alike.But pension spending is skewed towards richer households; it is also regressive. Thisis because public pension benefits are linked to past wages of individuals.
* Pensioners are not as poor as non-pensioned elderly; but a sizable group of pensionersis poor. The poorest pensioners receive low agricultural and survivor pension; andare also older. The incidence of poverty is higher for non pensioners relative topensioners.
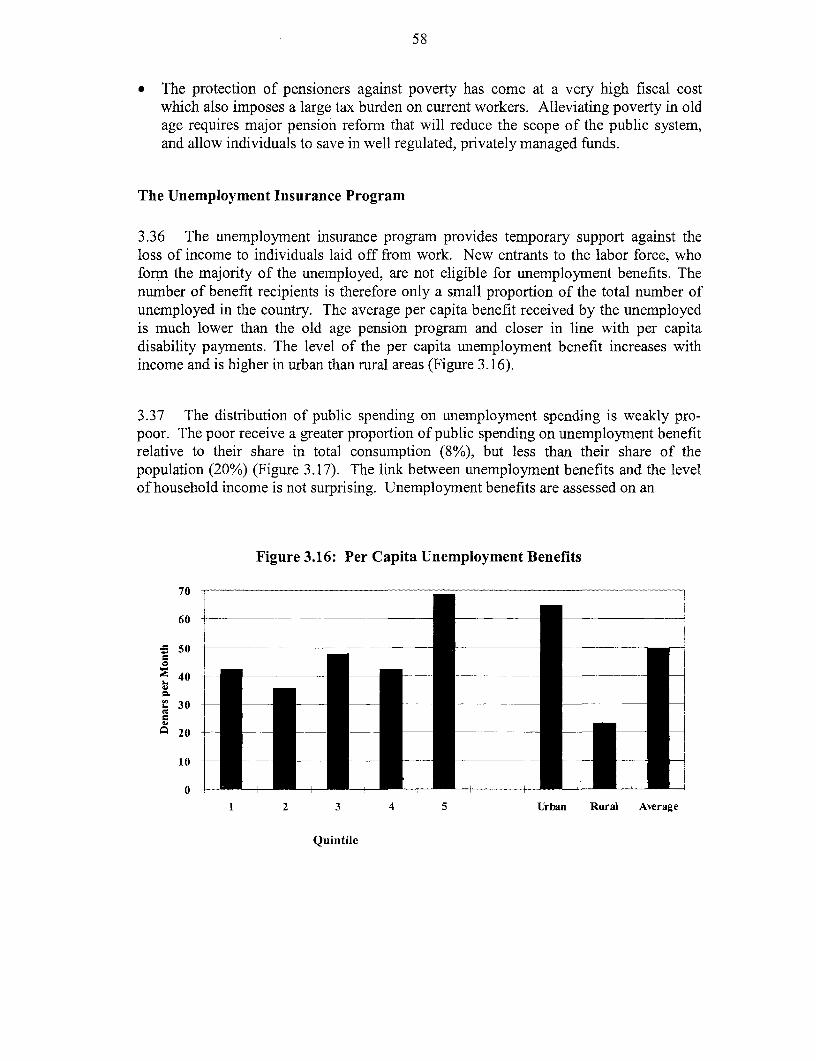
58
* The protection of pensioners against poverty has come at a very high fiscal costwhich also imposes a large tax burden on current workers. Alleviating poverty in oldage requires major pension reform that will reduce the scope of the public system,and allow individuals to save in well regulated, privately managed funds.
The Unemployment Insurance Program
3.36 The unemployment insurance program provides temporary support against theloss of income to individuals laid off from work. New entrants to the labor force, whoforrn the majority of the unemployed, are not eligible for unemployment benefits. Thenumber of benefit recipients is therefore only a small proportion of the total number ofunemployed in the country. The average per capita benefit received by the unemployedis much lower than the old age pension program and closer in line with per capitadisability payments. The level of the per capita unemployment benefit increases withincome and is higher in urban than rural areas (Figure 3.16).
3.37 The distribution of public spending on unemployment spending is weakly pro-poor. The poor receive a greater proportion of public spending on unemployment benefitrelative to their share in total consumption (8%), but less than their share of thepopulation (20%) (Figure 3.17). The link between unemployment benefits and the levelof household income is not surprising. Unemployment benefits are assessed on an
Figure 3.16: Per Capita Unemployment Benefits
70
60
50
40
30
Z 20
I10
01 2 3 4 5 Urban Rural Average
Quintile
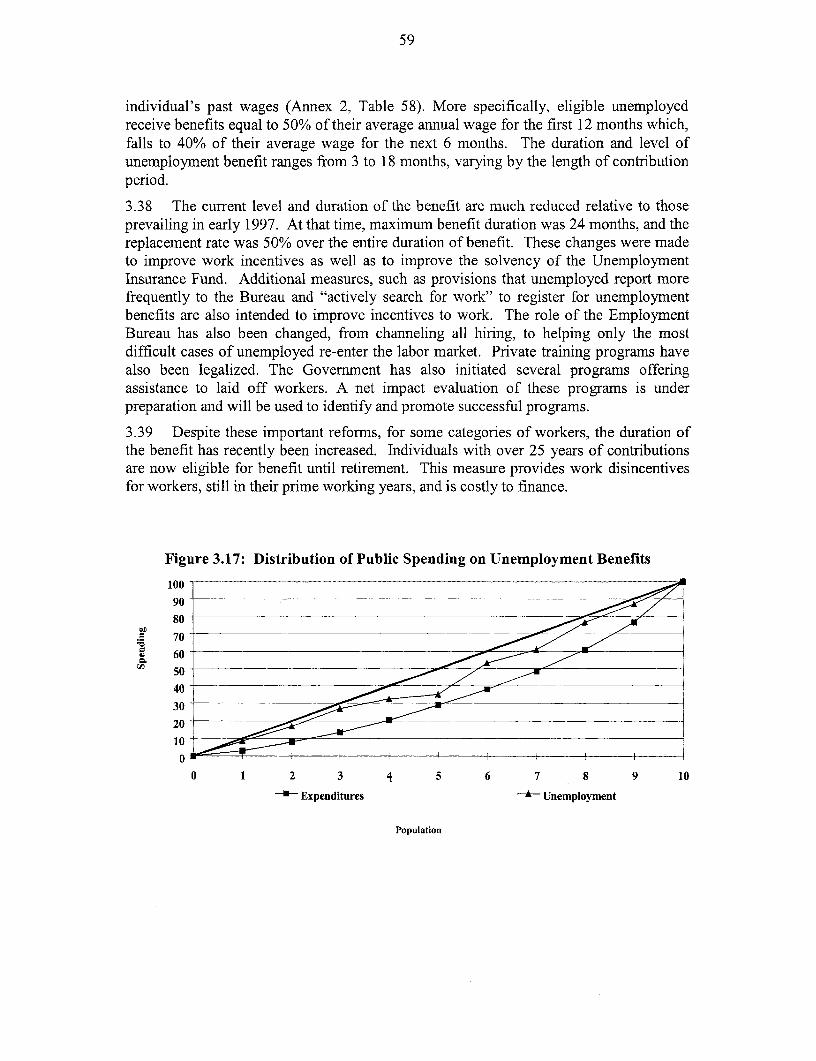
59
individual's past wages (Annex 2, Table 58). More specifically, eligible unemployedreceive benefits equal to 50% of their average annual wage for the first 12 months which,falls to 40% of their average wage for the next 6 months. The duration and level ofunemployment benefit ranges from 3 to 18 months, varying by the length of contributionperiod.
3.38 The current level and duration of the benefit are much reduced relative to thoseprevailing in early 1997. At that time, maximum benefit duration was 24 months, and thereplacement rate was 50% over the entire duration of benefit. These changes were madeto improve work incentives as well as to improve the solvency of the UnemploymentInsurance Fund. Additional measures, such as provisions that unemployed report morefrequently to the Bureau and "actively search for work" to register for unemploymentbenefits are also intended to improve incentives to work. The role of the EmploymentBureau has also been changed, from channeling all hiring, to helping only the mostdifficult cases of unemployed re-enter the labor market. Private training programs havealso been legalized. The Government has also initiated several programs offeringassistance to laid off workers. A net impact evaluation of these programs is underpreparation and will be used to identify and promote successful programs.
3.39 Despite these important reforms, for some categories of workers, the duration ofthe benefit has recently been increased. Individuals with over 25 years of contributionsare now eligible for benefit until retirement. This measure provides work disincentivesfor workers, still in their prime working years, and is costly to finance.
Figure 3.17: Distribution of Public Spending on Unemployment Benefits
1009080
.E 70
to 60
40
30
201
100
0 1 2 3 4 5 6 7 8 9 10
+ Expenditures A Unemployment
Population
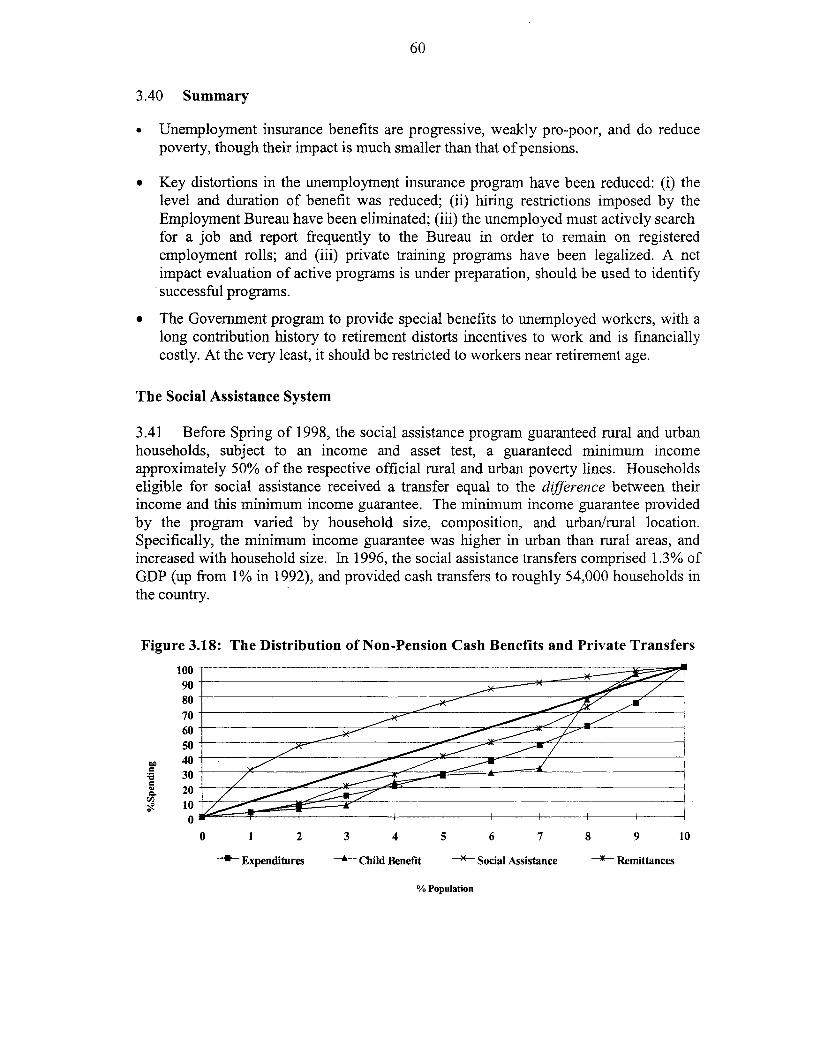
60
3.40 Summary
* Unemployment insurance benefits are progressive, weakly pro-poor, and do reducepoverty, though their impact is much smaller than that of pensions.
* Key distortions in the unemployment insurance program have been reduced: (i) thelevel and duration of benefit was reduced; (ii) hiring restrictions imposed by theEmployment Bureau have been eliminated; (iii) the unemployed must actively searchfor a job and report frequently to the Bureau in order to remain on registeredemployment rolls; and (iii) private training programs have been legalized. A netimpact evaluation of active programs is under preparation, should be used to identifysuccessful programs.
* The Government program to provide special benefits to unemployed workers, with along contribution history to retirement distorts incentives to work and is financiallycostly. At the very least, it should be restricted to workers near retirement age.
The Social Assistance System
3.41 Before Spring of 1998, the social assistance program guaranteed rural and urbanhouseholds, subject to an income and asset test, a guaranteed minimum incomeapproximately 50% of the respective official rural and urban poverty lines. Householdseligible for social assistance received a transfer equal to the difference between theirincome and this minimum income guarantee. The minimum income guarantee providedby the program varied by household size, composition, and urban/rural location.Specifically, the minimum income guarantee was higher in urban than rural areas, andincreased with household size. In 1996, the social assistance transfers comprised 1.3% ofGDP (up from 1% in 1992), and provided cash transfers to roughly 54,000 households inthe country.
Figure 3.18: The Distribution of Non-Pension Cash Benefits and Private Transfers
100 9080706050
~D 4030
1020*
0 1 2 3 4 5 6 7 8 9 10
Expenditures * Child Benefit Social Assistance x Remittances
% Population

61
Figure 3.19: Per Capita Social Assistance Benefits
160 ____
140
120
100 __- 1
80
60
40
20
0
1 2 3 4 5 Urban Rural Average
Quintile
3.42 How effective and efficient are social assistance benefits? 1997 first half yearhousehold data reveals that social assistance benefits, are the most efficiently targetedcash transfers. (Figure 3.18). The bottom two deciles receive almost half of all publicspending on social assistance. The level of the per capita cash transfer provided by thesocial assistance system is the second highest overall, after pensions. In contrast with
Table 3.5: Social Assistance: Inclusion and Exclusion ErrorsEligible for Social Not Eligible of
Assistance Social AssistanceReceive Do not Receive Do not
l _______________________ Receive ReceivePer Adult Equivalent 3,753 2,671 8,850 16724
quarterlyPer Adult Equivalent 5.079 5,452 9,491 14,663
quarterlyHousehold Size 5 5 4 4
Children 0-15 years 2 1 1 1Elderly* 0 1 0 1
Urban (%) 55 25 67 68Capital (%) 92 17 62 32
Agricultural Households 4 60 13 30(%) I
Female Headed(%) 13 4 18 16Age of Head 38 51 43 54
Number Unemployed 1 0 0 0Number of Pensioners 0 0 0 0Number of Pensioner 168 77 114 877
*Elderly are males 60 and over and females 55 and over
62
pensions, the level of per capita social assistance benefit decreases with the level ofincome and is higher in rural than in urban areas (Figure 3.19). Not surprisingly, thesocial assistance program makes a contribution to the reduction of the incidence andseverity of poverty. Without social assistance, the severity of poverty would be twice thecurrent amount in rural areas (Table 3.3). 16
3.43 Other measures of efficiency are the exclusion and inclusion errors of a system.Exclusion errors are measured by the share of ineligible households who receive benefit.while inclusion errors are gauged by the share of eligible households who do not receivebenefit. Program exclusion errors are small. Nearly four out five household eligible forsocial assistance receive the benefit (Table 3.5). In both rural and urban areas, owning acar or house reduces the likelihood of receiving a social assistance transfer. Largefamilies, families with more unemployed members, and low-income families have agreater chance of receiving a benefit. In contrast, program inclusion errors - are high.Nearly 40% of all recipients are ineligible for the program benefit. These householdsreside mainly in urban areas and predominantly in Skopje. In discussions, social welfareofficers point out the difficulty of verifying claims in urban areas, particularly in largecities, where information about residents is less commonly available and individuals arerelatively more mobile (Table 3.5).
3.44 Three other problems with the program have emerged over time. First, theenormously detailed scale structure was cumbersome to administer. Large householdsalso had an incentive to split, falsely claiming that they were two separate households inorder to receive more benefit. Second, rural/urban differences in income were notmerited. The cost of living differential established between rural and urban areas wasbased on rural/urban poverty lines that did not accurately reflect these differences. Theprogram therefore discriminated against the bulk of the poor who live in rural, non-agricultural households. The third major problem was that the scheme lacked workincentives. There was a 100% marginal taxation on incremental income that createdserious disincentives to seek work. The lack of work incentives was more pertinent giventhat the earlier benefit scale provided fairly high replacement rates relative to averagewage (50%) for an average size Macedonian family with four or five members. Thecurrent high unemployment rate may dampen the adverse effects on incentive of socialassistance somewhat, but will not completely eliminate such effects. The right to registerfor such benefits may actually increase incentives to register and claim unemployment.Finally, the scheme encountered administrative problems. The random monitoring ofhouseholds --in addition to document checks--was not institutionalized. Individuals allarrived to file claims on the same day, creating mobbing and violence in social welfarecenters.
16 The analysis assumes that without social assistance transfers, households would not be earning any extra incomes. This is not anunrealistic assumption, given the current high unemployment rate of 30%. However, the impact may have been overestimated, to theextent the transfer encouraged a contraction of labor supply.
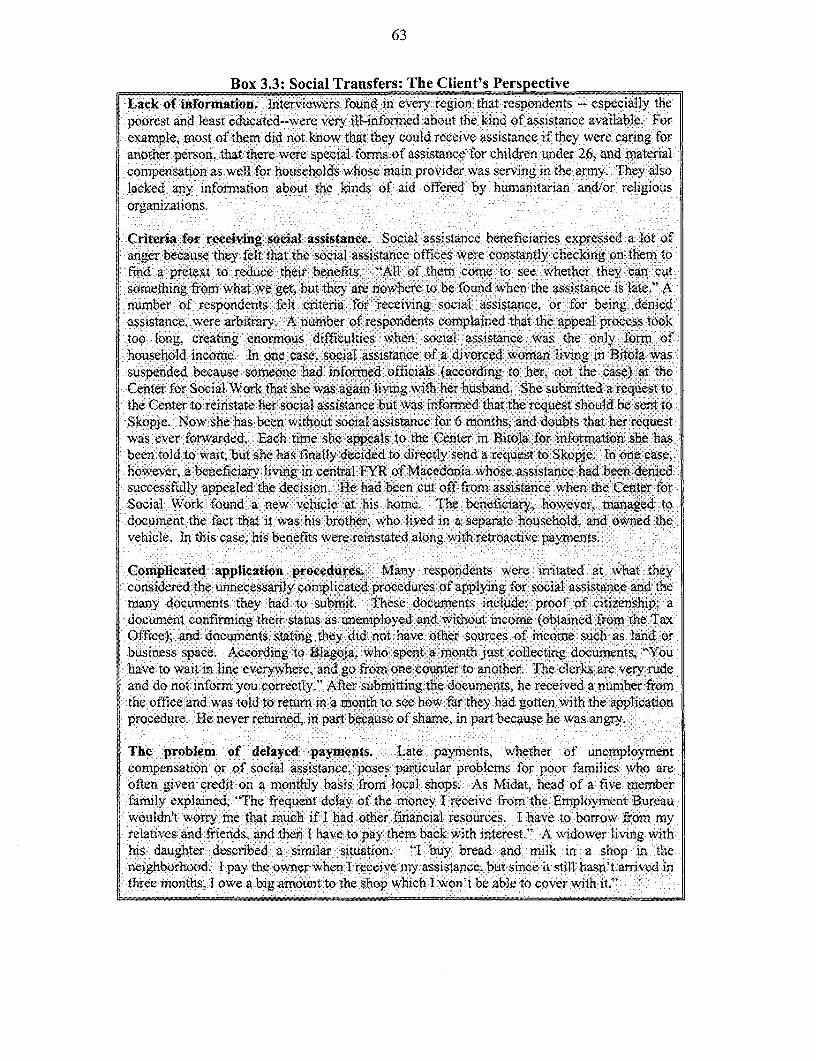
63
Box 3.3: Social Transfers: The Client's PerspectiveLack of information. Interviewers found in every region that respondents -- especially thepoorest and least educated--were very ill-informed about the kind of assistance available. Forexample, most of them did not know that they could receive assistance if they were caring foranother person, that there were special forms of assistance for children under 26, and materialcompensation as well for households whose main provider was serving in the army. They alsolacked any information about the kinds of aid offered by humanitarian and/or religiousorganizations.
Criteria for receiving social assistance. Social assistance beneficiaries expressed a lot ofanger because they felt that the social assistance offices were constantly checking on them tofind a pretext to reduce their benefits. "All of them come to see whether they can cutsomething from what we get, but they are nowhere to be found when the assistance is late.' Anumber of respondents felt criteria for receiving social assistance, or for being deniedassistance, were arbitrary. A number of respondents complained that the appeal process tooktoo long, creating enormous difficulties when social assistance was the only form ofhousehold income. In one case, social assistance of a divorced woman living in Bitola wassuspended because someone had informed officials (according to her, not the case) at theCenter for Social Work that she was again living with her husband. She submitted a request tothe Center to reinstate her social assistance but was informed that the request should be sent toSkopje. Now she has been without social assistance for 6 months, and doubts that her requestwas ever forwarded. Each time she appeals to the Center in Bitola for information she hasbeen told to wait, but she has finally decided to directly send a request to Skopje. In one case,however, a beneficiary living in central FYR of Macedonia whose assistance had been deniedsuccessfully appealed the decision. He had been cut off from assistance when the Center forSocial Work found a new vehicle at his home. The beneficiary, however, managed todocument the fact that it was his brother, who lived in a separate household, and owned thevehicle. In this case, his benefits were reinstated along with retroactive payments.
Complicated application procedures. Many respondents were irritated at what theyconsidered the unnecessarily complicated procedures of applying for social assistance and themany documents they had to submit. These documents include: proof of citizenship; adocument confirming their status as unemployed and without income (obtained from the TaxOffice); and documents stating they did not have other sources of income such as land orbusiness space. According to Blagoja, who spent a month just collecting documents, "Youhave to wait in line everywhere, and go from one counter to another. The clerks are very rudeand do not inform you correctly." After submitting the documents, he received a number fromthe office and was told to return in a month to see how far they had gotten with the applicationprocedure. He never returned, in part because of shame, in part because he was angry.
The problem of delayed payments. Late payments, whether of unemploymentcompensation or of social assistance, poses particular problems for poor families who areoften given credit on a monthly basis from local shops. As Midat, head of a five memberfamily explained, "The frequent delay of the money I receive from the Employment Bureauwouldn't worry me that much if I had other financial resources. I have to borrow from myrelatives and friends, and then I have to pay them back with interest." A widower living withhis daughter described a similar situation. "I buy bread and milk in a shop in theneighborhood. I pay the owner when I receive my assistance, but since it still hasn't arrived inthree months, I owe a big amount to the shop which I won't be able to cover with it."

64
3.45 In early 1998, recognizing these issues, the Government adopted a revised socialassistance decree. The decree provides a uniform scale rate for both rural and urbanareas. The new scale rates vary only with household size. The distinction betweenchildren and adults has been eliminated. The new scale rates for each household size are(with the exception of single households) roughly a simple average of the differentrural/urban scale rates. Thus, benefit levels in urban areas have been reduced and thosein rural areas have increased. However, the new rate structure (with relatively highabsolute magnitudes for two and three member families) continues to provide incentivefor large families to split. In addition, the minimum income guarantee for large familieshas been reduced to roughly 40% of average wage. However, this level of benefit stillremains well above the wages earned by a large proportion of workers, particularly inlow paying agricultural jobs. As such, this benefit provides an effective minimum wagefor the average Macedonian worker.
3.46 In order to introduce work incentives, the Government has decided to limit theduration of social assistance to four years. The income threshold will also be reducedover time. Individuals will get social assistance benefits at 100% of the current thresholdfor two years; benefits will be reduced to 70% and 50% in each following year.Households will not be eligible for benefits for two years after four years of continuousreceipt of social assistance. This measure may be abused by individuals who may leavesocial assistance for a short period (say three months), only to come back to re-apply foranother four year term of benefit. In order to minimize this problem, the followingprovision was introduced: households can re-claim another full four year benefit termonly if they have not received benefit for at least nine months. Households who have leftthe social assistance rolls for less than nine months can, if they re-qualify, rejoin thesystem but with a benefit term reduced by the amount of the previous claim. Individualswho leave may still rejoin the system after nine months simply to qualify for another fouryear term of benefit. However, they will have to leave benefit for at least nine months todo so. This work incentive is particularly onerous to administer, however, as it isdifficult to keep track of individual claims over time. Thus, the impact of this workincentive and its implementation will have to be closely watched in the future. Alternatework incentives, such as a 30% eamings disregard, or a lump sum earnings disregard,were considered by the Government and rejected because of the complexity ofcalculating benefit. These may well have to be reconsidered and re-evaluated if the termlimit of benefit poses administrative problems or does not induce individuals to leave thesystem.
3.47 While these changes in the Decree and Program administration may help reducethe high inclusion errors of the program, the targeting of the program should be closelymonitored, and eligibility tightened further if inclusion errors remain substantial. In anycase, the new scheme should be carefully monitored and evaluated so that its targetingefficiency can be constantly evaluated and improved. The crisis in Kosovo and theeconomic disruption which will likely cause an increase in social assistance expenditures
65
means that efforts to improve targeting of the system will have to be redoubled to ensurethat the poorest groups are protectedfrom falling into abject poverty.
3.48 Proxy Means Testing. As in the Macedonian case, the administration of socialassistance and other transfers in other countries in the region often relies on a mix ofmeans testing and indicator targeting. An analysis of this approach in several transitioneconomies has revealed that it usually does not work well, with leakage rates sometimesexceeding 50%, both in terms of households and amounts of money. In the Macedoniancase, as noted above, social assistance is administered with an income test, and there areindications that many households receive social assistance who are not qualified toreceive it. Part of the problem is the difficulty of ascertaining household income in theabsence of a comprehensive tax or asset registration record data bank.
3.49 An alternate way to target the poor is to use proxy-means tests, based on easilyobservable household characteristics rather than household income, to identify socialassistance claimants. The information required by social welfare administration can beobserved directly by a social worker or can be obtained by simple questioning. Empiricalestimates indicate that the wealthiest Macedonian households can be identified based onobservable characteristics with nearly 90% accuracy (Annex 2, Table 57). Once thesehouseholds are screened on the basis of the above indicators, the poorest Macedonianhouseholds can then be identified with nearly 70% accuracy, using indicators such ashousehold size (the best indicator), durables (electric cooker, car, freezer or washingmachine), the number of unemployed in the household, age and education of the head,receipt of private transfer from abroad (though difficult to document), and receipt ofpension.
3.50 The results of this exercise suggest that indicator-based targeting is an optionworth considering in order to further improve the targeting of social assistance and childallowance programs. The findings in the Macedonian case are not unique. Similarexercises for Poland, Hungary, and Bulgaria also reported that a set of initial screeningvariables could successfully identify over 90% of the non-poor, while a second set ofvariables could identify 60-80% of the poor in a second phase. While findings of thissort are indicative of the potential of indicator-based targeting, they are not a blueprint forpractical application. There are three caveats. First, household may still be able tomanipulate some indicators, such as the number of children, durables, and the number ofunemployed. Second, the characteristics of the poor may change over time. Thereforeindicators of poverty would have to be updated and re-evaluated periodically to test theircontinued relevance for targeting the poor. Third, the fiscal costs of this program wouldhave to be estimated and evaluated against those of the current social assistance system.
The Child Allowances Program
3.51 The child allowance program provides child benefits to families with at least oneemployed member with an income of less than 1,700 denars per month. The benefit is500 denars per month per child and is restricted to three children per family. The percapita benefit is almost negligible. The average per capita benefit is slightly higher inrural than in urban households. Rich households receive a higher per capita benefit thanthe poor (Figure 3.19). Child allowances are strongly non-poor. The poor receive a
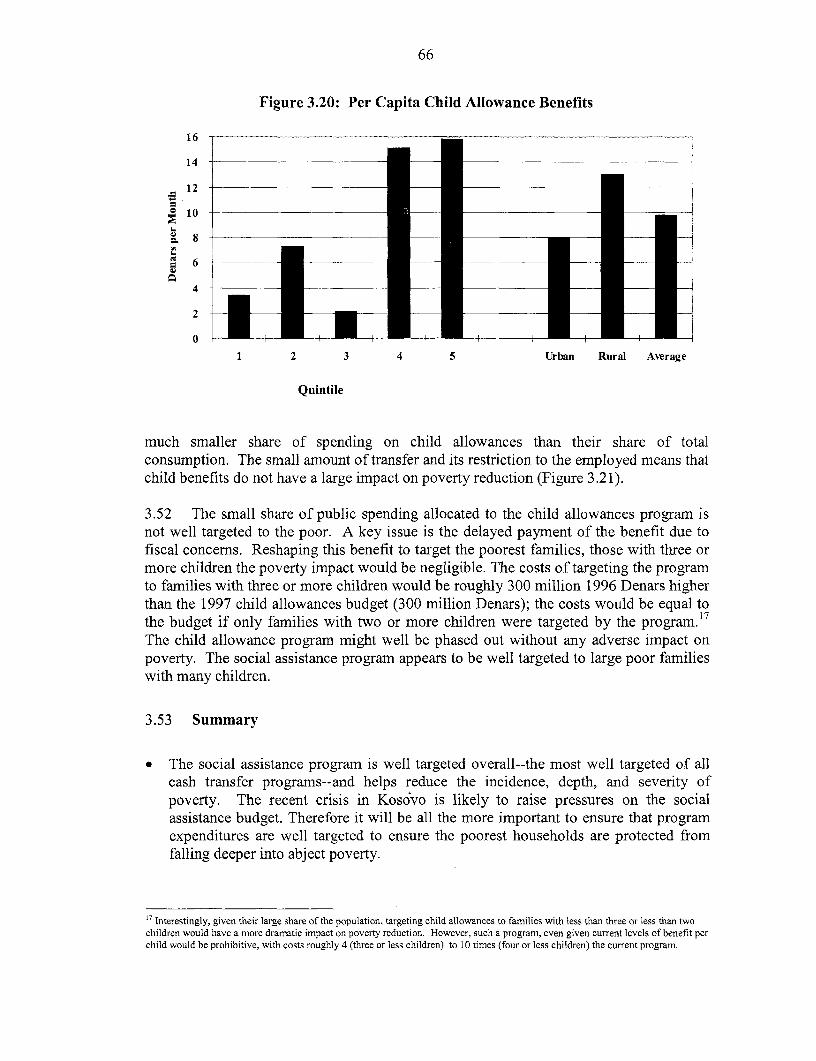
66
Figure 3.20: Per Capita Child Allowance Benefits
16
14
12
to1
X 8
4
2
0
1 2 3 4 5 Urban Rural Average
Quintile
much smaller share of spending on child allowances than their share of totalconsumption. The small amount of transfer and its restriction to the employed means thatchild benefits do not have a large impact on poverty reduction (Figure 3.21).
3.52 The small share of public spending allocated to the child allowances program isnot well targeted to the poor. A key issue is the delayed payment of the benefit due tofiscal concerns. Reshaping this benefit to target the poorest families, those with three ormore children the poverty impact would be negligible. The costs of targeting the programto families with three or more children would be roughly 300 million 1996 Denars higherthan the 1997 child allowances budget (300 million Denars); the costs would be equal to
17the budget if only families with two or more children were targeted by the program.The child allowance program might well be phased out without any adverse impact onpoverty. The social assistance program appears to be well targeted to large poor familieswith many children.
3.53 Summary
* The social assistance program is well targeted overall--the most well targeted of allcash transfer programs--and helps reduce the incidence, depth, and severity ofpoverty. The recent crisis in Kos6vo is likely to raise pressures on the socialassistance budget. Therefore it will be all the more important to ensure that programexpenditures are well targeted to ensure the poorest households are protected fromfalling deeper into abject poverty.
11Interestingly, given their large share of the population, targeting child allowances to families with less than three or less than twochildren would have a more dramatic impact on poverty reduction. However, such a program, even given current levels of benefit perchild would he prohibitive, with costs roughly 4 (three or less children) to 10 times (four or less children) the current program.
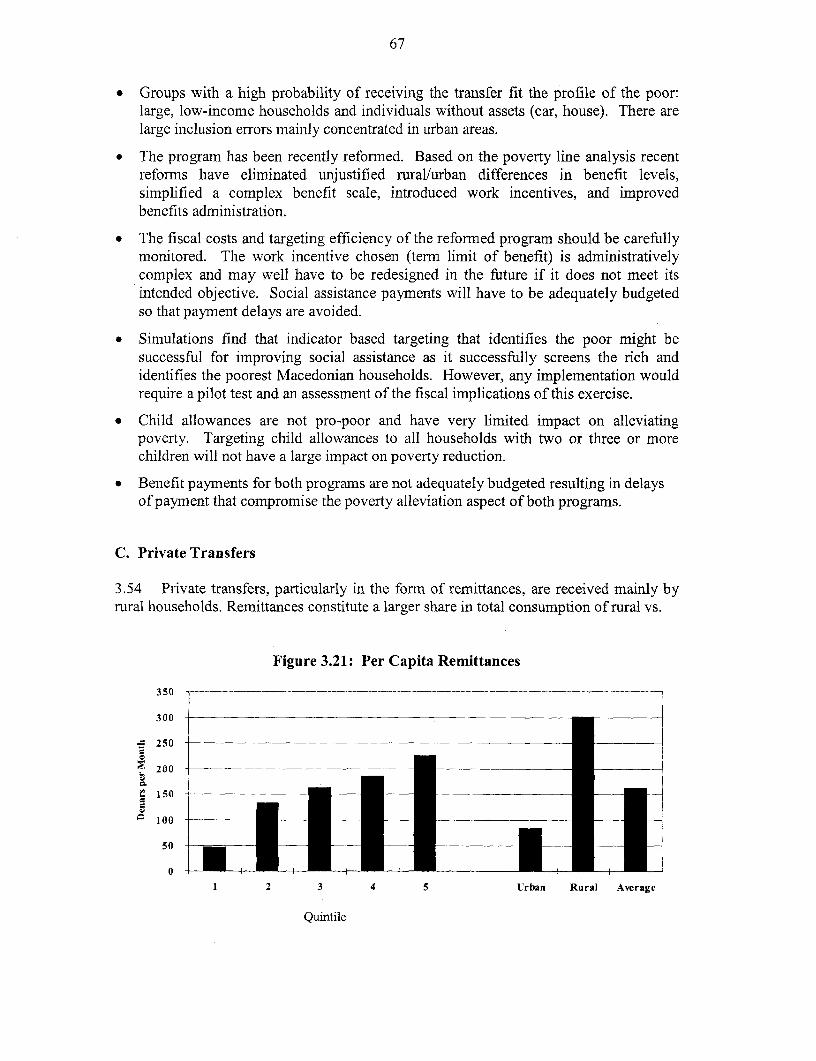
67
* Groups with a high probability of receiving the transfer fit the profile of the poor:large, low-income households and individuals without assets (car, house). There arelarge inclusion errors mainly concentrated in urban areas.
* The program has been recently reformed. Based on the poverty line analysis recentreforms have eliminated unjustified rural/urban differences in benefit levels,simplified a complex benefit scale, introduced work incentives, and improvedbenefits administration.
* The fiscal costs and targeting efficiency of the reformed program should be carefullymonitored. The work incentive chosen (term limit of benefit) is administrativelycomplex and may well have to be redesigned in the future if it does not meet itsintended objective. Social assistance payments will have to be adequately budgetedso that payment delays are avoided.
* Simulations find that indicator based targeting that identifies the poor might besuccessful for improving social assistance as it successfully screens the rich andidentifies the poorest Macedonian households. However, any implementation wouldrequire a pilot test and an assessment of the fiscal implications of this exercise.
* Child allowances are not pro-poor and have very limited impact on alleviatingpoverty. Targeting child allowances to all households with two or three or morechildren will not have a large impact on poverty reduction.
* Benefit payments for both programs are not adequately budgeted resulting in delaysof payment that compromise the poverty alleviation aspect of both programs.
C. Private Transfers
3.54 Private transfers, particularly in the form of remittances, are received mainly byrural households. Remittances constitute a larger share in total consumption of rural vs.
Figure 3.21: Per Capita Remittances
350
300
f 250
2 200
C 150
50
0
1 2 3 4 5 Urban Rural Average
Quintile

68
Table 3.6: The Distribution of Remittances by Share and Location
Per Capita Households Receiving Share in Total ExpendituresExpenditure Remittances (%)
Quintile Total Urban Rural Total Urban Rural1 13.5 9.5 15.1 3.9 5.8 3.22 24.3 9.5 30.2 6.8 0.6 11.83 20.3 14.3 22.6 6.1 1.3 15.14 20.3 23.8 18.9 5.2 2.7 10.95 21.6 42.9 13.2 4.3 2.4 18.6
Total 100.0 100.0 100.0 100.0 100.0 100.0N 74 21 53 1,015 645 370
urban households. After pensions, remittances are the largest per capita transfer receivedby households (Figure 3.21). The per capita level of remittances increases with the levelof income. The distribution of private transfers is only weakly non-poor (Figure 3.18).The poor receive a larger share of private transfers relative to their share in totalconsumption, but a smaller share than their share of the population.
3.55 Remittance income has had a much larger welfare impact in rural areas. First, theaverage per capita private transfer is higher in rural than in urban areas. Second, a largerproportion of households receiving remittances are based in rural areas. Third, the shareof private remittances in total income is much higher in rural than in urban areas.However, remittances are a much larger share of consumption for the poorest (firstquintile) households in urban (vs. rural areas).18
D. The Comparative Efficiency and Effectiveness of Poverty Alleviation Programs.
3.56 This section summarizes the comparative efficiency and effectiveness of thepublic programs discussed above. The effectiveness of public spending is measured as theratio of per capita benefits to the per capita consumption of a household. The higher thisratio the more effective the program in raising the income levels of the poor. Theefficiency of the program is the share of public spending on that program that reaches thepoor (or the bottom quintile). This is not the stated objective of many programs, but is away of measuring the distribution of program benefits that also allows a comparison ofthe poverty impact of diverse public programs. The comparison provided in the followingsections should be interpreted with some.care. The education data is based on the 1996Household Budget Survey, while the information on cash transfers is from the HouseholdBudget Survey in the first half of 1997.
3.57 The Comparative Effectiveness of Public Programs. Figure 3.22 compares theeffectiveness of public programs. It gives the ratio of per capita transfer to householdconsumption for the top and bottom population quintile. Compared in this way, education
18 Poor households may have received private transfers and moved into richer income groups. But the magnitude of this effect is notpossible to determine from a cross-sectional data set.
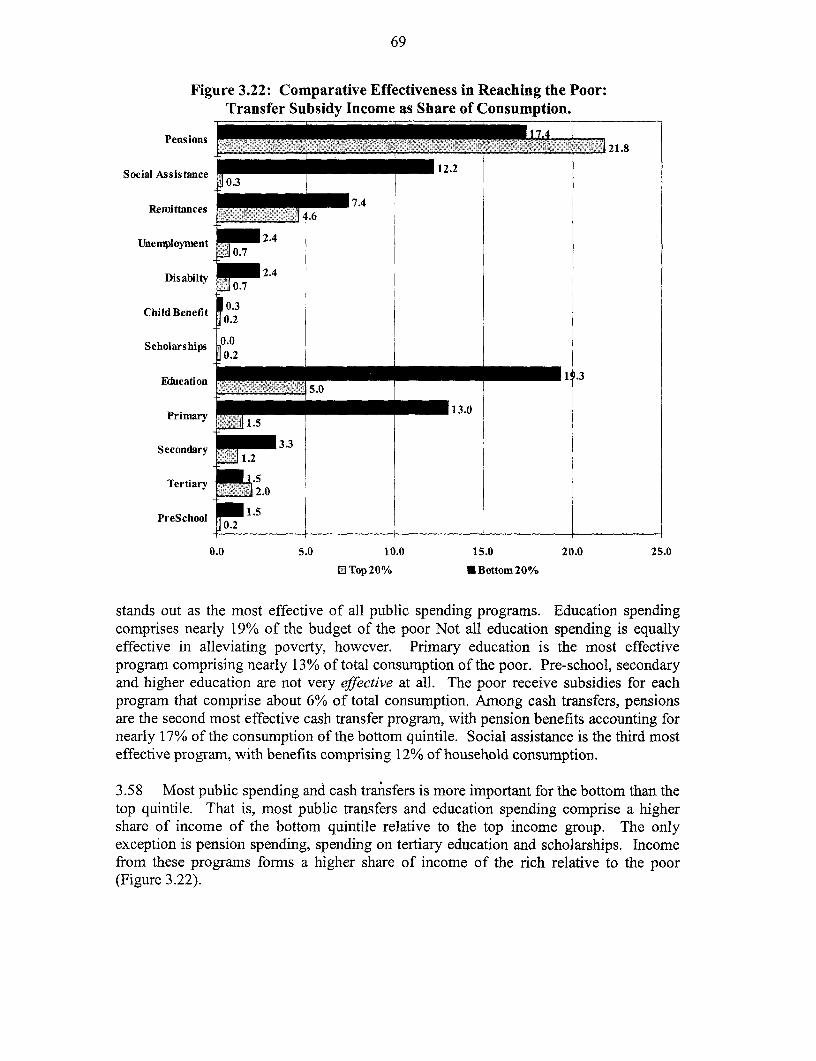
69
Figure 3.22: Comparative Effectiveness in Reaching the Poor:Transfer Subsidy Income as Share of Consumption.
Pensions 1 .4_ _ _ _ _ _ _ _ _ _ _ _ _ _ _ _ _ _ _ _ _ _ _ _ _ _ _ _ _ _ _ _ _ _ _ _ _ _ 2 1 .8
Social Assistance 12.2
Remittances 7.4
Unemployment 2.40.7
Disabilty 0 2.4
Child Benefit 0.30.2
Scholarships 0.2
Education 1 .3
Primary 15 35.03.3~~~~~~~1.
Pr .r 11.5
Secondary 3.3
Tertiary 54.0
PreSchool 0 1.5
0.0 5.0 10.0 15.0 20.0 25.0
OTop20% * Bottom 20%
stands out as the most effective of all public spending programs. Education spendingcomprises nearly 19% of the budget of the poor Not all education spending is equallyeffective in alleviating poverty, however. Primary education is the most effectiveprogram comprising nearly 13% of total consumption of the poor. Pre-school, secondaryand higher education are not very effective at all. The poor receive subsidies for eachprogram that comprise about 6% of total consumption. Among cash transfers, pensionsare the second most effective cash transfer program, with pension benefits accounting fornearly 17% of the consumption of the bottom quintile. Social assistance is the third mosteffective program, with benefits comprising 12% of household consumption.
3.58 Most public spending and cash transfers is more important for the bottom than thetop quintile. That is, most public transfers and education spending comprise a highershare of income of the bottom quintile relative to the top income group. The onlyexception is pension spending, spending on tertiary education and scholarships. Incomefrom these programs forms a higher share of income of the rich relative to the poor(Figure 3.22).
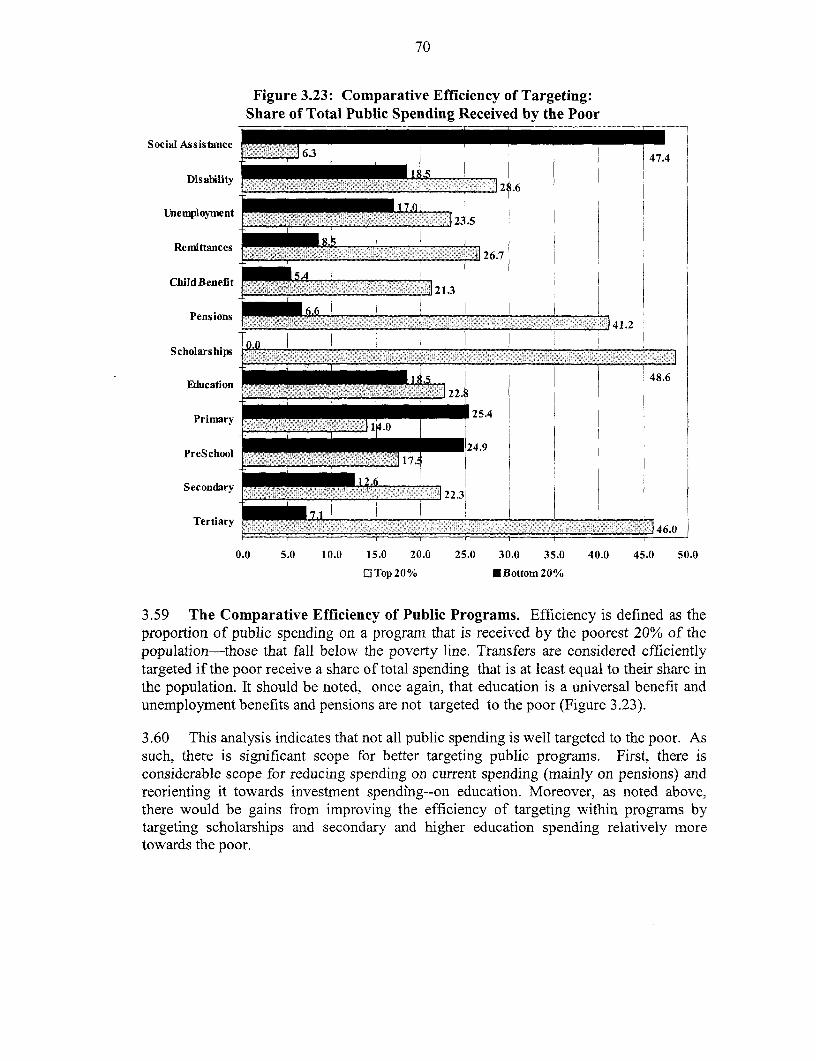
70
Figure 3.23: Comparative Efficiency of Targeting:Share of Total Public Spending Received by the Poor
Social Assistance
6.3 1 i I 47.4
Disability
Unemployment N
Remittances
ChildBenefit -777 7 7 l
Pensions 6= ONX _ N I 41.2
Scholarships
Edlucation _i 12 48.6. j i , I~~~2.
Primiary _ 0 1 25.4
PreSchool 24.9
Secondary
Tertiary A1S OW m .g .it-gS ;N0Q ;ig L <:2:l 4 6.0
0.0 5.0 10.0 15.0 20.0 25.0 30.0 35.0 40.0 45.0 50.0
OJTop2O% EBottom20%
3.59 The Comparative Efficiency of Public Programs. Efficiency is defined as theproportion of public spending on a program that is received by the poorest 20% of thepopulation-those that fall below the poverty line. Transfers are considered efficientlytargeted if the poor receive a share of total spending that is at least equal to their share inthe population. It should be noted, once again, that education is a universal benefit andunemployment benefits and pensions are not targeted to the poor (Figure 3.23).
3.60 This analysis indicates that not all public spending is well targeted to the poor. Assuch, there is significant scope for better targeting public programs. First, there isconsiderable scope for reducing spending on current spending (mainly on pensions) andreorienting it towards investment spending--on education. Moreover, as noted above,there would be gains from improving the efficiency of targeting within programs bytargeting scholarships and secondary and higher education spending relatively moretowards the poor.
71
E. Institutional vs. Locally-Based Care
3.61 Thus far this chapter has discussed cash transfers to families. Yet many of themost vulnerable groups do not live in families, e.g. single, sick and elderly who live alonein rural areas abandoned by their families who have migrated to cities or orphans, andphysically or mentally handicapped persons who live in institutions. These individualshave difficulty in taking care of themselves and can perhaps be considered the mostdisadvantaged in society.
3.62 Currently there are approximately 450 elderly living in institutions. There hasbeen an increase in the demand for institutional care amongst the elderly population. TheGerontology Institute reports that this is because many families are no longer financiallyable to take care of their elderly parents or relatives and there is greater acceptance ofsending the elderly to institutions. The elderly, who must be over age 65 to be eligible,have access to health care, meals, rooms in the institution. Elderly with a pension of lessthan 9,000 denars also receive a cash benefit equal to the difference between theirpension and this amount. A recent report on institutional care in a home for the elderly(Mother Teresa) cites that the average age of residents is 75 years and most of theresidents are women. The poor condition of elderly in rural areas and the large costs ofbuilding residential institutions means that day-care or in-home care for the elderlyprovided at the local level should be a major consideration.
3.63 There are two homes for orphaned children, one for children 0-3 years of age andthe other for children 3-18 years of age. Together both institutions accommodate roughly250 children. In 1997, the Government spent roughly 34 million denars on food andclothing for the children, salaries and utility bills. Financial and in kind assistance is alsoreceived from humanitarian institutions. However, in large part external donor agencieshave replaced enterprises as the main donors for the upkeep of the institutions. Allchildren are eligible for health insurance coupons. UNICEF has been particularly activein helping organize and improve the delivery of care to children within these institutions.
3.64 Social Welfare Officers consider institutionalization to be the worst possibleoutcome for children's welfare. Every effort is made by Social Welfare Officers to placethe child in a family atmosphere. Once in an institution, the children encounter problems,such as those described in Box 4.5. Therefore, several options are explored for takingcare of abandoned children before placing these children in an institution. These are a)placing the child with relatives; b) adoption; and c) foster family care. On the positiveside, there is considerable demand for adoption by the population. In the Skopje alone,there are approximately 300 applications but only 50 children in the center. However,improvements could well be made in ensuring that foster parenting is encouraged,payments to foster parents are made on time; greater screening of potential foster andadoptive parents is undertaken; and there is more monitoring of adoptive and fosterparents once the adoption/foster child placement has taken place.
72
Box 3.4: Institutional Care
Thecare of children without famriulies is provided bytwo initions, one in l3itola for infants (0-3),;and one in Skopje forchildren (3-18). Local Centers for Social Care make the decision as to whereto send a child when parental care is deemed inadequate. The Centers note particular problems in thecase of Gypsy children, however. Their parents often send them to beg in the streets, on bridges, inapartrnent complexes, or in front of shops. In SkpJe, the sight of a small infant in a box on thefootbridge leading into the Old City, presumably with an adult nearby watching the infant and waitingfor donations to be placed in the box, is not an unconmnon sight. Many of these children do not attendschool. The Centers, in cooperation with the police, often place such children in institutional care. Thechildren, however, run away and start begging again. One such parent stated that her 3 children do notattend school because she cannot afford to send them. Her husband, who owned a horse cart andworked as a hauler, died three years ago. Even then, hwever, the children did not attend school. Now,
every day, she takes her three-year old and goes to a particular place to beg, thereby earning about 150cdenars a day. Although she travels there each day by bus, the drivers already know her and do notdenand payment. Her other two children gather bread f0rom garage containers to sell as fodder topeople who raise cattle. They eam around a I 00 denars a day. The family also receives 4,000 denars insocial assistance, but according to the woman, only once every .3 months. This pattern describes thefamily income for the past 6 months. reviously, until the organization left FYROM, the fanily hadreceived monthly assistance in the formi of 25 kilos of flur, oil, sugar, iand firewood, from Caritas,
The most frequent reason for children under three to enter institutional care is that they havebeen born to single mothers. For children 3-1 8, of the present 135, 32 have no parents, 62 have onlyone parent, and 45 have two parents. Of the children with parents, the usual reasons for placement1inClude a parent in prison or a psychiatric institution; rejection after divorce and remarriage; and
parental inability (social or financial) to care for their childen. Trhe number of children placed for therlasteason has increased in recent years. It is rare that :such parens tikei their chldren back after
placing them in institutional care. Ognena, one such parent, however, has placed her children threetimes in institutional care, but taken theni home two times in the last two years, each time hoping thatthe higher amount of social assistance she receives when they are living at home would enable her totake care of them. The staff expects her to return the children a fourth time.n These changes areextremely disruptive for the children, who have been forced to change back and forth between schoolenvironments each time,
In the home for older children, children have the right to stay six months after they turn IS, 50
that they have time to find a job and aparment after completing secondary school. Until seven years, the children usually managed to fnd emnployment based onr recommendations from the Home or
from the Centers for Social Care. When several youths had found jobs, the Center for Social Caresometimes provided apartments they could share. Today, finding a job has become so difficult theHome is allowing the children to remain longer, sometimes until they are 20. Some have found jobsthrough a youth organization, but only 3-6 monthis at a time. They no longer receive apartnents. "Thechildren are afraid to leave the hbome," conmmented an instructor. When they do leave the home, two orthree of them may rent a smnall apartment together. Sometimes they find work- in coffee bars or inwarehouses, but not necessarily as formally registered employees. For example, a 19 year old boy nowliving in the Home works in a restaurant, but is not "offiially" employed. When young people leavethe Home now, they receive a blanket and bed sheets and 15,000 denars. The Center for Social Care inSkopje has proposed that the Ministry of LaboF and Social Policy provide children leaving the Homewith small apartments for a period of 5-10 years. They would not obtain in permanent ownership, butfor five or ten years. At present, the children face a very abrupt transition. As a staff member noted,"These children have everything up to the age of 18, and after 18, they have nothing."
73
3.65 In addition to institutions for orphans and elderly there are several institutions forthe care of children with disabilities. The main institution is Demir Kapija that housesnearly 485 beneficiaries. Several key issues regarding the care of disabled children wereidentified in a recent UN report. These include the very negative view of disabilityamongst the general population and by professionals that work in this area. This meansthat many households keep disabled children at home because it is considered shamefuland an embarrassment to the family. Children sent to institutions receive services basedon rigid categorization system that labels them according to a very narrow test of theirintelligence (IQ). The basic educational and emotional needs of disabled populations arenot met. Children and elderly are often left isolated without adequate stimulation, andwith limited opportunities to learn and develop. Children often do not learn to sit or evencrawl at one year, and many do not even learn to stand at two years of age. Livingconditions in the institutions are also poor. Residential institutions are in need ofupgrading and repair, staff are not adequately trained, resources are limited.'9
3.66 Summary
* Improving care for chronic poor would reduce emphasis on the institutionalization ofthese populations and increase the provision of community-based care. The focus ofthe programs could potentially be the alleviation of poverty amongst children at risk,the disabled, and non-pensioned elderly. The financing of this program, and themechanism for delivery of services, would have to evaluated carefully to assess itsfinancial and other economic implications.
* Promote fostering and adoption services, with adequate screening and monitoring ofprospective providers. These services would also need to be evaluated in terms oftheir financial and other economic implications.
* Ensure timely payment of foster parents and child disability payments.
'9 Benfield and Rothwell, Overview and Analysis of the Situation of Children with Disabilities in FYR of Macedonia, A reportprepared for UNICEF, Skopje.
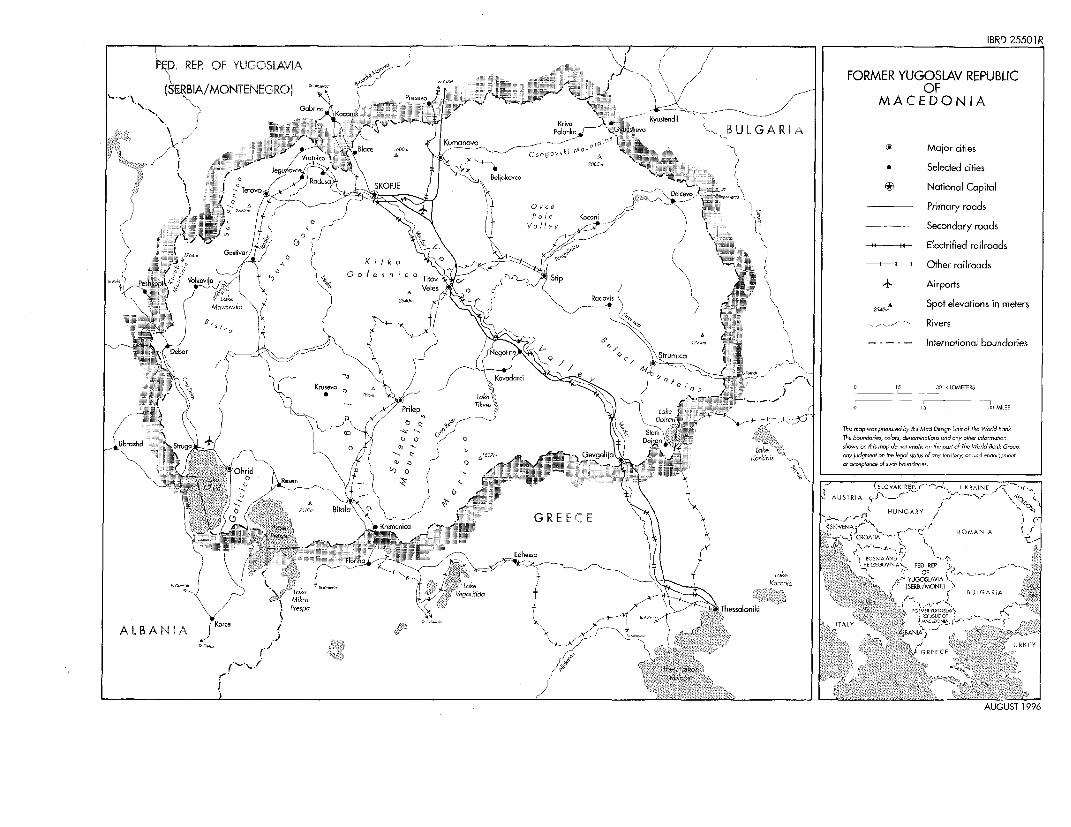
IBRD 25501 R
I"D REP. OF YUGOSLAVIA BIA/MONTENEGRO) to , 24.; H ~~~~~~~~~~FORMER YUGOSLAV REPUBLIC
Oobde J't.&t2A2 cj~~~/ MACEDONIA
>'>~~~~- 0~~~~o9 ov2k (I ~~~~~~~ Major cities2,~~ ~~2Vrt- +o r. .,< Selected cities
Rados Be0 kvoNational Coipitol~~~OTet~ ~ ~ ~~ -I 2 2>RICeP
2 2L22O2____
Orce 2 ~~~~~~~~~~~~~~~~~Primary roads
AR f (7 0Vole h9
2.2 Secondary roads
Ci 72 ~~~~~~~~ / .c~~~~~~ ~ ~ ~ po -w----s+--- ~~~~~~~~~~~~~Electrified railroadsNZ'n Koserri -tA-'k- Other railroaids
'.2> Thov ~~~~~~~ o e2 cStip
~~/r~~~~ > Golesnica~~~~~~~~~Vle r ~Airports
2<LOke 2/Ale ,o5 2/ ~~~~~~~~~~~~~~~~~~~~~~~~~~~~~~~~~~~~~10A Spot elevaitions in meters
r 5/ 22222 S -~~~~~~~~~~~~~~~~~~~~~~~~~~~~~~~~~~~~-~~~~~ ~~Riverst 22 j~~~~~~~~~~~~~2 - - - - - ~~~~~~~~~~~~~~~~~~~International boundaries
DeSobe 2
c--2
Neoo / / Strumico
20 Koooo 9 /3 KLOMETERS
( '-o R> PriMp Oboes> *"~~~~ 1ep33 MILES
We SIoc22rr2hSr Tb;,~~~~~~~~~~~~~~~~~~~~~~~~~~~n mopro pre-rd by tAc Mod Gedcgc Unrtof [be World o-k,
Lioh tog erev ho.- or bhi, op do ocr ;.ply, or do port of Tho W02ld B-ok Grop~~ 22> 2~~~ r ~~~222 C A0OZ2r ,¶, ,r/'Oi>. Geo~~~~~~V geia -yor nr jsd0 -eto - he legol sot.s of-yerroyo od od--tmer
hridjd R NE cc 2 1 I 2 (~~~~~~~~~~~~~~~~~~~~~~~~~~~SLOVAK REP C 2~
2? ~~~~~~~~~~~~~~~' A 2 ~~~~~~~~~~~~~~~~~~~AUSTRIA f2
-v 0> ,zjBdtol HUNGARY NC 4
>22>12/> 2 ~~~~GREECEN I ~~~~~~~ ~ ~~~ROMAN A I
I' I o>hr~~~~>7 2.'~~~r4¾,r~~~>. ig>fl
(21>> __ 2/2~~~~~~~~~~~~~~~~~~~~~~~~~~~~~~~~~~~~~~~~~- 2 OT./0 LAGUVIA b>Ml- ¾, 22~~~~~~~~~~~~~~~~~~~~~~~~~~~~~~~~~~~~~~~~~~~~~~~~~~~~~~~~~~~~(EB.MN) BUL
22 Mikro 2 reeqOflboo T 302 .2,222,2 2 - >22S BULGARIA 75e22~~~~~~~~~~~~~.nik
A L B A N 1 A ~ ~ ~ ~~~~Psp K O Is k .2Arpr KTce/~~2 22
ALBANIA (Kerco .2 22222222 72 2 t2Xi~~~~~~~~~~~~~~~~~~~~~~,X2Y AUGST 99


![Macedonia - Joinup.eu · 2018-05-23 · eGovernment in Former Yugoslav Republic of Macedonia May 2018 [3] Political Structure The Former Yugoslav Republic of Macedonia became independent](https://static.fdocuments.in/doc/165x107/5e6e54a6a9177c09ac18a5b3/macedonia-2018-05-23-egovernment-in-former-yugoslav-republic-of-macedonia-may.jpg)