Report for Sesamae Pos- Harvest Loss study in Ethiopia ... of post-harvest losses: Weather...
27
1
-
Upload
doannguyet -
Category
Documents
-
view
216 -
download
0
Transcript of Report for Sesamae Pos- Harvest Loss study in Ethiopia ... of post-harvest losses: Weather...

1

2
Report for Sesamae Pos-
Harvest Loss study in
Ethiopia
December 2014
Project: Alliance for Food Security through Reduction of Post- Harvest Loss
and Food Waste
Baseline Survey report

3
Monitored by: Tigray Agricultural Research Insttute (TARI)
Coordinated by: Humera Agricultural Research center (HuARC)
Principal Investigator (PI); Dr Fetien Abay (MU)
Crop Leader for the Survey; Muez Berhe (HuARC)
Crop: Sesame
Executive summary
In collaboration with The Feed the Future Innovation Lab for the Reduction of Post-Harvest
Loss, the survey was conducted to assess Sesame post-harvest losses and their determinant
factors in Ethiopia (Tigray, Amhara, and Oromiya). The survey allocated 200 farm households
(90 for Tigray, 80 for Amhara, and 30 for Oromiya). In each study area, respondents were
selected using a random sampling approach. The data were analyzed using descriptive statistical
approaches. Key findings of the survey are summarized as follows:
Household Sesame production activities: Average crop coverage from Sesame was about
16 hectares per household. The average coverage was higher in Tigray (25 hectares) followed
by Amhara (9.7 hectares) and Oromiya (5.58 hectares). The aggregate production statistics
indicates that the average Sesame production is about 44 quintals per household. The region

4
specific data shows that the average Sesame production per household is high in Tigray (62
quintals) followed by Amhara (31.3 quintals) and Oromiya (21.4 quintals). However, yield
per hectare was higher in Oromiya region. Production variability among producers seemed to
be high in Tigray ranging from about 0.8 to 1500 quintals per producer. This might be
because the survey included investors in Tigray region. The grain use management result
indicates that, on average, quantity sold at harvest was higher than the quantity stored for
later sale.
Estimated Post-harvest losses: The survey result shows that there are substantial post-
harvest losses in the study areas. The average post harvest loss amounted to be about 33 Kgs
per hectare with great variability among the farm households ranging from about 0 to 368.3
kgs per hectare. In percentage terms, the average loss in the study areas was about 13% of the
total crop produced. At household level, the average estimated loss was 1.8 quintal implying
a financial loss of birr 5632 to 6840 per household. The area specific result shows that post-
harvest losses were high in Tigray (38.38 Kgs/ha) followed by Amhara (32.5 Kgs/ha) and
Oromiya (13.5 Kgs/ha). Looking in to the different stages, significant losses occurred during
harvesting (33%), drying (26%) and threshing (18%).
Causes of post-harvest losses: Weather condition, termites, insects in field, shattering and
rodents in storage were identified as major loss casing factors across all the study areas. In
Oromiya, birds and spillage were added as major post-harvest loss casing agents.
Crop Marketing: The marketing process and market infrastructures are factors that can
affect crop post-harvest losses. In the study areas, farmers travel an average of 9.1 Kms to
market places though it varies across the study areas. In Amhara, the average distance to
market is about 15 Kms but there is a possibility of travelling up to 180 KMs by some
farmers. In Oromiya and Tigray, the average distance to market places is about 5 Kms. The
longest market distance for Oromiya and Tigray are 50 and 70 Kms respectively. Many of
the respondents (51%) used animal pulled cart for grain transportations. Producers use either
donkey or tracks for long market distances.
Household food consumptions: The household food consumption frequency indicated that
majority of the households (96%) ate three times per day. Their food diversities, however,
were limited to the consumption of starches and legumes. Dairy, meat, eggs, vegetables, and
fruits were insufficiently taken by most of the households.

5
1. Introduction
Sesame is strategically important to Ethiopia, as it consistently ranks as a top performing export
crop. In Ethiopia oilseed is the 3rd
largest crop sector in area coverage after cereals and pulses,
and sesame ranks 1st from the oil seeds sectors with a total land coverage of 239,532.34 ha in
2012/13 cropping season and estimated production of about 1,813,760.51quintals (CSA, 2013).
Ethiopia is 2rd
sesame exporter in the world and sesame is first export (79%) from oil seeds and
2nd
(20%) agricultural export next to coffee in Ethiopia (Ministry of trade, 2013). Tigray (36%),
Amhara (31%), Oromiya (17%) and Benishangul Gumuz (15%) are the main sesame producing
regions in the country (Adefris, et al., 2011). In Ethiopia, the amount of area under sesame,
production and productivity has been increasing consistently during 1995-2011 (CSA 1995-
2011). During 2011, 253,747 tons of sesame seed worth of 346 million USD was exported
(Ethiopian Customs Authority 2013).

6
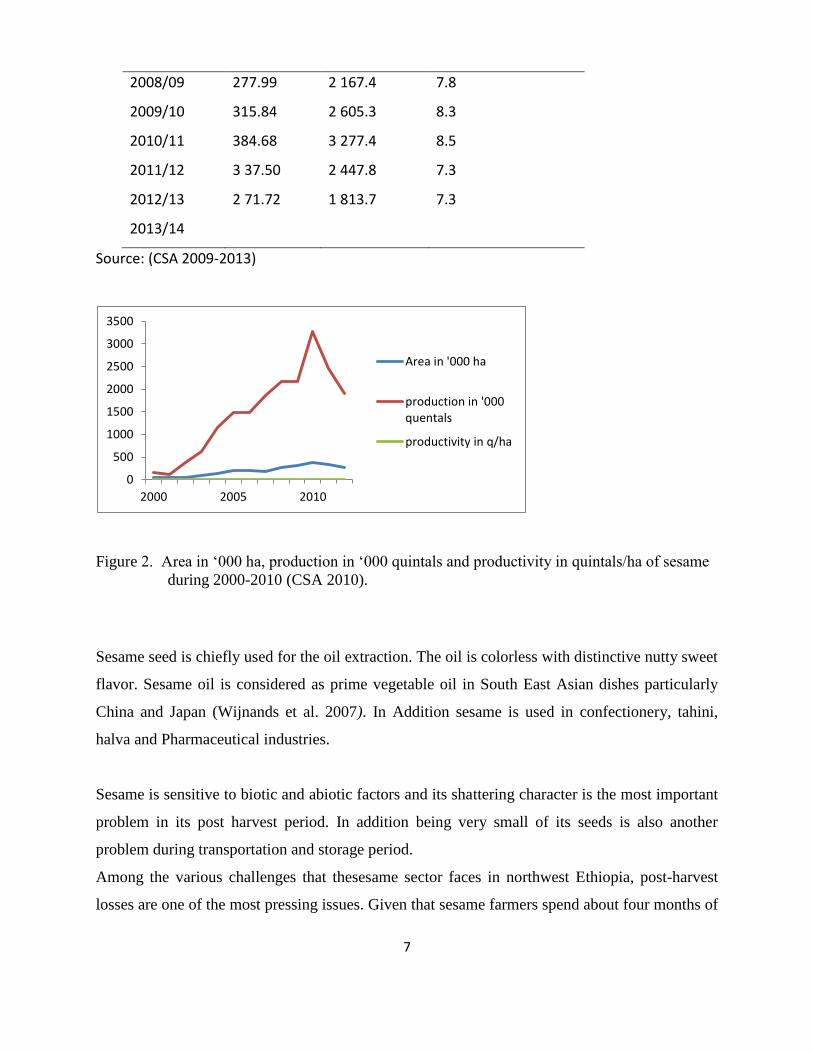
Figure 1. Production of oil seeds from 1991 to 2002 EC (Source CSA 1991-2002 EC)
Table 1.Production of sesame in Ethiopia during GTP-I period. 2000-2012
Year Area in
‘000 ha
Production in
‘000 quintal
Productivity
quintals/hectare
1999/00 38.19 156.3 4.1
2000/01 42.37 107.9 6.6
2001/02 58.78 388.9 6.6
2002/03 91.53 614.6 6.7
2004/05 136.22 1 153.9 8.5
2005/06 205.15 1 488.6 7.3
2006/07 211.31 1 493.8 7.1
2007/08 185.91 1 867.7 10.1
7
2008/09 277.99 2 167.4 7.8
2009/10 315.84 2 605.3 8.3
2010/11 384.68 3 277.4 8.5
2011/12 3 37.50 2 447.8 7.3
2012/13
2013/14
2 71.72 1 813.7 7.3
Source: (CSA 2009-2013)
Figure 2. Area in ‘000 ha, production in ‘000 quintals and productivity in quintals/ha of sesame
during 2000-2010 (CSA 2010).
Sesame seed is chiefly used for the oil extraction. The oil is colorless with distinctive nutty sweet
flavor. Sesame oil is considered as prime vegetable oil in South East Asian dishes particularly
China and Japan (Wijnands et al. 2007). In Addition sesame is used in confectionery, tahini,
halva and Pharmaceutical industries.
Sesame is sensitive to biotic and abiotic factors and its shattering character is the most important
problem in its post harvest period. In addition being very small of its seeds is also another
problem during transportation and storage period.
Among the various challenges that thesesame sector faces in northwest Ethiopia, post-harvest
losses are one of the most pressing issues. Given that sesame farmers spend about four months of
0
500
1000
1500
2000
2500
3000
3500
2000 2005 2010
Area in '000 ha
production in '000quentals
productivity in q/ha

8
the year working in a grueling way, it is striking that they lose much of their sesame on the piling
and threshing points. The losses do not stop there, but continue to occur in the multiple loading
and unloading activities, in transporting to either to warehouses or home and then to market
centers. It is generally assumed that 30% of harvestable sesame is lost. Action research has been
conducted to substantiate this claim. The study revealed that 13% losses occur, mainly at field
level. Although the research did not cover all the important stages, this number represents a very
important loss that is a value of more than 1 billion ETB (40 million Euro) (SBN,2014).
Although Sesame is an increasingly important cash crop to the Ethiopian agricultural economy,
and currently the 2nd
most significant earning agricultural export for Ethiopia, this agricultural
sub-sector has substantial potential for improvement both on the side of productivity and in
improving quality for accessing higher value markets.Since farming production, storage and
supply management differ from one chain to another, understanding these inefficiencies is key to
improving management for reducing harvest losses, the costs incurred and the potential
economic-gains missed. For studing sesame post harvest loss in Ethiopia a project proposal is
developed in collaboration with The Feed the Future Innovation Lab for the Reduction of Post-
Harvest Loss.
The Feed the Future Innovation Lab for the Reduction of Post-Harvest Loss is a five year project
supported by the United States Agency for International Development (USAID) to assess factors
contributing to post-harvest losses in four feed the future countries (Bangladesh, Ethiopia,
Ghana, and Guatemala) and develop research-based solutions to reduce such losses. The project
in Ethiopia is a collaborative effort between several US Universities, Ethiopian Universities,
several Ethiopian Institutes of Agricultural Research, International Seed Sector Development,
Sesame Business Network, Regional agricultural Bureaus, and several private businesses
supporting the postharvest sector.
This report presents base line survey results on Sesame post-harvest losses and the determinant
factors for Ethiopia (Tigray, Amhara and Oromiya). The report is divided in to four main
sections. Section 2 presents the methodological approaches followed in the study. Issues related
to site and respondent selection, and analytical approaches are discussed. In section 3 of the

9
report, descriptive and analytical survey results are presented. The last section presents
concluding points of the study.
2. Methodology
2.1 Sampling and data collection
The survey was conducted in three regions of Ethiopia; Tigray, Amhara and Oromiya from
October to November 2014. Discussion was held with research team members to identify these
potential Sesame producing areas. Based on their Sesame production activities, survey sites were
identified by the research team. Total of 200 respondents were shared among to each study
region and site (see table 1). In each study site, respondents were selected using random
sampling approach.
Table1 Site and respondent sampling
Region Woreda
Kebele/site DA Paricipnats to be interviewed
Tigray K.Humera Mykadra 1 10
Bereket 1 5
Rawyan 1 5
Baeker 1 5
Adebay 1 10
Myweni 1 5
Adigoshu 1 5
Ruwasa 1 5
Investors 1 10
Tseedea
Division 1 10
Dansha 1 10
Wlkayt
Mygeba 1 5
Korarit 1 5
Sub Total 90
Amhara
Mirab Armacho
Abderafie 1 10
Abreha Jira 1 10
Kor 1 10
Tach Armacheho Sanja 1 10
Shinfa Shinfa 1 10
Metama Gelego 1 10
Quara Quara 1 10

10
Sub Total 80
Western Oromiya 30
Total 200
The household questionnaire mainly ,but not limited to, focuses on variables related to the
farmers’ Sesame production behaviours, post-harvest losses, causes of losses, farm and
household level post-harvest loss management methods, and household consumption behaviour.
The production and loss data were collected for the 2013/14 production year.
3. Survey Results
3.1 Household characteristics
Age: Descriptive statistics for the respondents’ age group are given in table 2. The age of the
respondents ranges from 22 to 75 years with an average of 43.5 years. Many of the respondents
belong to the middle age (25-48 years). The average age ranges from 40 years (Oromiya) to 46
years (Tigray). This is in line with average age of farmers in the country, which is about 45
years.
Gender: The survey result shows that about 92% of the total respondents were males (see table
3). Looking across the study areas, female household heads were fairly represented in Tigray
(15.56%).
Table 2 descriptive information for age of respondents
Region Obs Mean Min Max
Amhara 78 42 22 60
Oromiya 30 40 23 62
Tigray 90 46 26 75
Aggregate 198 43.5 22 75
Table 3 descriptive information for gender of respondents
Region Male % Female %
Amhara 77 98.72 1 1.28
Oromiya 29 96.67 1 3.33
Tigray 76 84.44 14 15.56
Aggregate 182 91.92 16 8.08

11
Educational level of respondents: Table 4 gives the educational level of respondents both at the
aggregate and area specific sample levels. Out of the 198 respondents, the proportion of illiterate
farmers (with zero education) covers about 27%. Looking in to the cumulative percentage, about
50% of the respondents have educational level of below than grade four. Farmers who completed
primary school take about 41% .
Table 4 descriptive information for educational level of respondents
Amhara Oromiya Tigray Aggregate
Variable Freq % Freq % Freq % Freq %
No education 31 39.7 8 26.7 14 15.6 53 26.8
< grade 4 /informal education 21 26.9 16 53.3 9 10.0 46 23.2
Complete primary school 22 28.2 2 6.7 57 63.3 81 40.9
Secondary school 3 3.9 4 13.3 10 11.1 17 8.6
Diploma 0 0.0 0 0 0 0 0 0
Degree 1 1.3 0 0 0 0 1 0.5
Totals 78 100 30 100 90 100 198 100
Family size: The average household size is about 6 (see table 5). The lower average family size
was recorded in Amhara (6) while the maximum was in Oromiya (7). Children cover about 60%
of the household size. The lower value of the average proportion of children was recorded in
Amhara (52%) and the higher mean value was in Oromiya (68%). Probably, higher proportion of
children indicates higher family dependency ratio. The gender composition data shows that, on
average, females took 48% of the family members. In Oromiya and Tigray, this value is higher
taking 52% and 51% respectively.
Table 5 descriptive information for respondents' family size
Variable Amhara Oromiya Tigray Aggregate
Household size 5.9 7.4 6 6.2
Proportion of children 0.52 0.68 0.62 0.6
Proportion of females 0.44 0.52 0.51 0.48
3.2 Crop Production activities
Table 6 gives the mean values for Sesame production and grain use activities in the 2013/2014
production season. The average crop coverage seems higher in Tigray, which is about 25
hectares per producer. This might has been influenced by the presence of investor respondents in

12
the region. Without the investors, the average crop coverage would be about 10 hectares per
household, which is equivalent to that of Amhara region. The region wise production summary
indicates that all respondents were able to produce Sesame in the 2013-2014 production seasons.
The aggregate production statistics indicates that the average Sesame production is about 44
quintals per household. The region specific data shows that the average Sesame production per
household is high in Tigray (62 quintals) followed by Amhara (31.3 quintals) and Oromiya (21.4
quintals). However, yield per hectare was higher in Oromiya region (see table 6). Production
variability among producers seems to be high in Tigray ranging from about 0.8 to 1500 quintals
per producer. This is because the survey included investors in Tigray region. The grain use
management result indicates that, on average, quantity sold at harvest is higher than the quantity
stored for later sale. In some cases, quintiles sold at harvest seem to be higher than the average
quantity harvested, which somebody does not expect. This is because of the presence of extreme
values in the data.
Table 6 Mean values for Sesame production activities (in quintals) for the 2013-2014 production seasons
Aggregate Amhara Oromiya Tigray
Variable
Hectares covered 16.01 9.72 5.58 25.00
Quantity harvested 43.63 31.33 21.39 61.85
Production per hectare (Quintals) 3.71 3.57 5.30 3.29
Quantity sold at harvest 37.35 54.86 3.38 33.31
Quantity stored for sale 15.45 1.90 8.89 29.52
Quantity stored for consumption 0.04 0.00 0.00 0.08
Quantity stored for emergency 0.02 0.00 0.00 0.03
Quantity held for seed 1.69 0.41 2.60 2.50
3.3 Sesame grain loss
3.3.1 Causes of grain losses
As can be seen from figure 4, weather condition is the most loss casing agent. Respondents
explain that winds and intensive rainfall are the common elements of weather condition for grain
losses. Insects in field, termites, shattering, threshing, theft, harvesting, and rodents in storage are
also the loss causing factors perceived by more than 50% of the respondents. Table 7 gives the

13
severities of the grain loss factors both for the whole sample and regional data. The total number
of observations attached to each grain loss causing factor are those who only say “yes” to each
factor. The remaining farmers are those who either did not perceive the causal effects of the
factors or simply failed to respond the questions. Looking in to the who sample data, more than
half of the observations responded that weather condition, termites, insects in field, theft,
shattering, and rodents in storage are the factors causing severe grain loss effects. In the region
specific information, the above mentioned factors are also true to Tigray and Amhara. In
Oromiya, the severe grain loss causing factors are birds, spillage and insects in field.
Figure 4 Respondents' frequency distribution by causes of grain losses
Table 7 severity of grain loss factors (0 = Not Severe, 1 = Moderately Severe, 2 = Severe)
Aggregate By region
Tigray Amhara Oromiya
Obs. Mean Obs. Mean Obs. Mean Obs. Mean
Insects in field 171 1.34 76 1.29 67 1.37 28 1.39
Insects in storage 85 0.86 43 0.84 39 0.90 3 0.67
Molds in field 61 1.05 24 0.92 25 1.16 12 1.08
Molds storage 37 0.81 14 0.79 18 0.78 5 1.00
Rodent field 61 1.00 23 0.91 27 1.04 11 1.09
171
82
61
37
61
117
63
171
24
130
182
53
25
152
125
135
54
2
28
114
138
159
138
82
134
28
174
67
17
146
174
47
74
64
145
176
Insects in field
Insects in storage
Molds in field
Molds storage
Rodent field
Rodent storage
Other animals
Termites
Birds
Theft
Weather
Spillage
Broken
Shattering
Harvesting
Threshing
Transport
Others
No Yes

14
Rodent storage 117 1.22 57 1.23 46 1.26 14 1.07
Other animals 65 1.02 37 0.97 11 1.09 17 1.06
Termites 171 1.46 73 1.45 77 1.53 21 1.24
Birds 24 1.00 4 0.75 18 1.00 2 1.50
Theft 132 1.30 50 1.24 60 1.43 22 1.05
Weather 182 1.63 79 1.66 75 1.76 28 1.21
Spillage 54 0.93 30 1.10 22 0.64 2 1.50
Broken 25 0.64 0 14 0.36 11 1.00
Shattering 152 1.24 67 1.21 57 1.33 28 1.14
Harvesting 125 0.97 60 0.95 53 0.98 12 1.00
Threshing 135 0.89 75 1.11 55 0.58 5 1.00
Transport 53 0.85 30 0.87 21 0.81 2 1.00
Others 23 0.91 12 1.08 8 0.63 3 1.00
3.3.2 Estimated grain losses
The survey result shows that substantial post-harvest losses occur in the study areas. The average
post harvest loss amounts to be about 33 kgs per hectare with great variability among the farm
households ranging from about 0 to 368.3 kgs per hectare (see table 8). In percentage terms, the
average loss in the study areas is about 13%. At household level the average estimated loss is
about 1.8 quintals implying a financial loss of birr 5632 to 6840 per household. Figure 5 shows
the region specific post-harvest loss information recorded in the 2013/14 production season. Post
harvest-losses are high in Tigray (38.8 kgs/ha) followed by Amhara (32.5 kgs/ha) and
Oromiya(13.5 kgs/ha). Translating these results in to economic terms, the financial losses are
about 1350-1513.2, 1038.5- 1299.8, and 316.7- 442.8 birr per hectare for Tigray, Amhara and
Oromiya respectively. Similarly, high percentage losses were recorded in Tigray.
Table 8 estimated grain post-harvest losses for Sesame for the 2013/2014 production season
Loss (kg) Loss/ha (kg) Loss (%) Loss/ha (%)
Mean 181.12 32.89 13.05 5.36
Median 60 15.65 6.25 1.57
Standard Deviation 397.83 50.88 27.03 11.14
Kurtosis 35.87 15.98 80.57 29.45
Skewness 5.42 3.54 7.71 4.75
Minimum 0 0 0 0
Maximum 3400 368.33 315.71 97.50

15
Figure 5 average post-harvest losses by region
Post-harvest losses occur at different stages of the post-harvest management operations. Figure 6
gives the household level average losses at each stage of post harvest management. The
harvesting, threshing and drying stages together make about 77% of the post-harvest losses.
Substantial loss (33%) occurs during harvesting followed by drying (26%) and threshing (18%).
Considerable losses also occur during the marketing and storing stages taking about 10% and
6.4% respectively. Respondents explained that the losses in the harvesting stage are mainly
attributed to factors like the capsules remaining in the field, untimely harvest (early and late
harvests), unskilled labor, and weather conditions like wind and rain. Farmers explain that the
losses during the drying stage come from the crop shattering due to wind and rain, human and
animal contact with hillas, and insects and rodents. One of the causes of the losses in the
threshing stage is when hillas are moved to the threshing floor. While in storage, rodents are the
major causes of post-harvest losses. The substantial losses during marketing occur during sample
taking from containers. The region specific data confirms similar experience across the study
areas (see table 9). For all study regions, the verage loss is high at the harvesting stage.
Figure 6 Percentage of post-harvest losses at different stages
0
5
10
15
20
25
30
35
40
45
Amhara Oromiya Tigray
Loss/ha (kg)
Loss (%)
Loss/ha(%)
33%
26%
18%
0%
3%
3%
2% 4%
1% 10%
0%
Harvesting
Drying
Threshing
Dehulling
Cleaning
Packaging
Transport to storage
Storage
Transport to market
Marketing
Milling

16
Picture 1. Over maturity (left) and
Threshing (right)
Table 9 Region specific Sesame Post-harvest losses (kg) in different farm oepration stages for 2013-14
Farm operation stage Region
Tigray Amhara Oromiya
Mean Std Dev. Min Max Mean Std Dev. Min Max Mean Std Dev. Min Max
Harvesting 61.49 150.04 0 1000 100.30 366.18 0 3000 13.55 36.93 0 200
Drying 58.56 159.34 0 1000 69.99 169.59 0 1000 1.23 2.67 0 10
Threshing 61.72 120.92 0 800 23.34 40.28 0 200 0.90 1.84 0 7
Dehulling 0 0 0 0 0.57 3.58 0 25 0.00 0.00 0 0
Cleaning 7.81 25.66 0 200 4.22 14.60 0 100 0.18 0.46 0 2
Packaging 13.01 105.62 0 1000 0.90 5.81 0 50 0.00 0.00 0 0
Transport to storage 7.07 31.52 0 200 1.51 6.78 0 50 0.01 0.05 0 0.25
Storage 14.08 48.83 0 300 6.74 20.08 0 100 0.22 0.67 0 3
Transport to market 3.98 31.75 0 300 0.04 0.26 0 2 0 0 0 0
Marketing 43.32 368.96 0 3500 5.33 32.31 0 270 0 0 0 0
Milling 0 0 0 0 0 0 0 0 0 0 0 0

17
3.4 Controlling methods for grain losses in storage
It seems that many of the farmers in the study areas do not use the mentioned loss controlling
methods. Some farmers, however, explain that drying and Malathion dust are used as loss
controlling mechanisms at their storages. For example out of the 199 respondents, 72 explain that
they use drying mechanisms and 47 respondents use the Malathion dust (see figure 7).
Figure 7 Respondents' frequency distribution by grain loss controling methods in storage
Figure 8 presents factors that influence farmers’ selection of grain loss controlling mechanisms
in storages. Effectiveness, easiness of use, local availability and traditional practices are some of
the factors that influence farmers’ choice of controlling mechanisms. On the other hand, prior
positive results and training were the influencing factors stated by few farmers pointing that
scientific interventions and awareness creation schemes are less in the study areas.
Figure 8 Respondents' frequency distribution by reasons for their selections of controlling methods
5
0
3
0
1
0
0
0
0
47
7
3
6
72
192
198
194
198
197
198
197
198
198
151
191
195
192
125
Use of traditional herbes
Mix with Teff
Mix with Ashes
Mix with sawdust
Clay
Oil
Triplex
Filter cake
Actellic dust
Malathion dust
Fumigant
Use of fungicides
Smoking
Drying
No Yes
150
117 128 130 132
153 150
42
75 64 60 55
36 36
No Yes

18
3.5 farmers’ grain storage types
Figure 9 shows the frequency of respondents by their types of grain storages for Sesame in the
study areas. The survey result indicates that farmers use very limited number of storage types.
About 61% of the respondents explain that they use Polypropylene bag to store their Sesame
grain followed by ware houses (40%) and Jute bag (28.6%). Other storages like fertilizer bags,
balcony, and plastic bags are also used by few respondents.
The maximum number of months that farmers put their grain in storage is indicated in figure 10.
The frequency distribution graph shows that about 73% of the respondents put their Sesame
Figure 9 Respondents' frequency distribution by types of grain storage
198 196 197 198 197 199 198
195 195
182 197
185 76
140 198 199 199 199
178 117
1 3 0 0 1 0 1
1 3
16 0
13 122
57 1 0 0 0
21 81
G…T…I…L…A…
W…S…D…U…B…G…P…p…J…P…G…G…P…F…
W…
No Yes

19
grain in storages not for more than 3 months. This seems in line with duration of storage that
scientific studies recommend for Sesame. There are also respondents who store their grain up to
18 months, although they are outliers.
Figure 10 Frequency distribution of farmers' duration of grain storage for Sesame
3.6 Grain marketing for Sesame
Farmers can sell their grain to private business men, local cooperatives or nearby
Ethiopian Commodity Exchange office. About 78% of the respondents explained
that they sell their product from the market by travelling a fairly long distance. In
Amhara, the average distance to market is about 15 Kms but there is a possibility
of travelling up to 180 KMs by some farmers. In Oromiya and Tigray, the
average distance to market places is about 5 Kms. The longest market distance
for Oromiya and Tigray are 50 and 70 Kms respectively. Many of the
respondents (51%) used animal pulled cart for grain transportations. Producers
use either donkey or tracks for long market distances.
Figure 11 Percentage of respondents by the type of transportations
0
20
40
60
80
100
120
140
160
0 to 3 4 to 6 7 to 9 10 to 12 13 to 15 16 to 18
Re
spo
nd
en
ts' f
req
ue
ncy
1
21
4
51
4 4
16
Human Donkey Otheranimal
Animalpulled cart
Carro Tracktor Truck
Percentage of respondents

20
On aggregate the average selling and highest possible price levels for the 2013/14 production
years were birr 31.29 and 38 per Kg respectively. Market prices are, however, different for
products of the study areas. For Humera (Tigray), the average selling price was about birr 34.8
per Kg where as the highest possible price was averaged to be birr 39 per Kg. The price levels
were slightly lower for the product in Amhara region. The average selling and highest possible
price levels for Sesame produced in Amhara region were birr 31 and 38.8 per Kg respectively.
These values get lower for the product in Oromiya taking birr 23.46 to 32.8 per Kg.
3.7 Household Consumption behavior
3.7.1 Household meals and consumption frequency
Respondents vary in their choices of food items but injera, wot, bread, meat and vegetables are
among the commonly mentioned food types. Figure 12 presents respondents’ frequency of food
consumption per day. About 96% explained that they eat three times per day while very few
(4%) consume two times per day.
Figure 12 frequency distribution of respondents by consumption frequency/day
0 4
190
1
1 2 3 4
Respondents

21
On average, starches were consumed 15 times in 21 days (see table 10). Every household took
starches at least 3 times in 21 days. Legumes were consumed about 7 times, dairy 4.6 times, and
vegetables 3.4 times. Nuts, fruits and eggs were consumed less frequently in 21 days.
Table 10 average times a food item was consumed in 21 days
Obs. Mean Min Max
Starches 198 14.93 3 31
Legumes/Pulses 188 6.96 0 30
Nuts 115 2.05 0 21
Meat 181 2.33 0 20
Dairy 171 4.64 0 30
Eggs 143 2.21 0 21
Vegetables 163 3.40 0 21
Fruits 140 2.1 0 15

22
The graphical depiction for frequency distribution of respondents by the number of times they
consumed food item in 21 days is given in figure 13. About 99 respondents explained that they
consume starches 21 times in 21 days. That is at least once in a day. 68 consumed starches 7
times in 21 days. Legumes were consumed 21 times by 19 respondents and 7 times by 23
respondents. In general starches, legumes, dairy and vegetables were the food items that many
respondents consumed at least 3 times in 21 days.
Figure 13 respondents' frequency distribution for food consumption frequencies/week
Except for starches and legumes, respondents perceived that their consumption frequencies were
not sufficient for all food items (see figure 14). For starches, 195 respondents gave their opinion
on sufficiency of starch consumption in their families. About 72.3% explained that their
consumption frequency were sufficient in the 21 days. For legumes/pulses about 63.7% (out of
193 respondents) perceived that they had sufficiently consumed the food items in 21 days. Eggs,
fruits, vegetables, nuts, meat and dairy were perceived as insufficiently taken food items.
Figure 14 respondents' perception on sufficiency of food items
0 50 100 150 200 250
1
3
5
7
9
11
13
15
17
19
21
23
25
27
29
31
Respondents' frequency
Co
nsu
mp
tio
n f
req
ue
ncy
/we
ek
Starches
Legumes/Pulses
Nuts
Meat
Dairy
Eggs
Vegetables
Fruits

23
4. Conclusions and recommendations
In collaboration with The Feed the Future Innovation Lab for the Reduction of Post-Harvest
Loss, the survey was conducted to assess Sesame post-harvest losses and their determinant
factors in Ethiopia (Tigray, Amhara, and Oromiya). The survey allocated 200 farm households
(90 for Tigray, 80 for Amhara, and 30 for Oromiya). In each study area, respondents were
selected using a random sampling approach. Data were descriptively analyzed.
From the survey results we put the following concluding points
139 123
42 65
80
35 56
34 56
70
141 131 115
155 140
153
195 193 183 196 195 190 196 187
Yes No Totals

24
The survey result shows that there are substantial post-harvest losses in the study areas. The
average post harvest loss amounted to be about 33 kgs per hectare with great variability
among the farm households ranging from about 0 to 368.3 kgs per hectare indicating the
possibility of bringing farmers to very low post-harvest losses in the areas.
Substantial loss (33%) occurred during harvesting followed by drying (26 %) and threshing
(18%). Considerable losses also occur during the marketing and storing stages taking about
10% and 6.4% percents respectively pointing that improved post-harvest management
technologies at these stages of operation will greatly reduce considerable food losses in the
study areas.
Insects in the field, termites, weather condition and theft are among the causes of post-
harvest losses that most respondents labeled them as “highly severe”. Addressing these
agents of food losses should be the home work of researchers and other stake holders.
The household consumption behavior result indicated that food items for majority of the
households are limited to starches and legumes. Dairy, meat, eggs, vegetables, and fruits are
insufficiently taken by most of the households. Food diversity interventions are urgently
recommended if food security problems are to be tackled in the areas.
5. Notes for further works
Analyzing panel information so that more robust conclusions can be drawn
Conducting experments to come up with more statistically plausible conclusions.
Introducing and applying different post-harvest management technologies and food
security interventions
Conducting impact analyses for introduced technologies
Financial Expenditure Report

25
Budget Utilization; Over 99% of the budget is utilized.
N.B: the budget line for sesame seeds Laboratory analysis is transfered to Report compeletion.
Annex 1. Budget transfer Letter

26

27