REPORT DOCUMENTATION PAGE Form Approved .... Bharathan Narayanaswamy, Dr. Seema Bharathan IUP...
111
The public reporting burden for this collection of information is estimated to average 1 hour per response, including the time for reviewing instructions, searching existing data sources, gathering and maintaining the data needed, and completing and reviewing the collection of information. Send comments regarding this burden estimate or any other aspect of this collection of information, including suggesstions for reducing this burden, to Washington Headquarters Services, Directorate for Information Operations and Reports, 1215 Jefferson Davis Highway, Suite 1204, Arlington VA, 22202-4302. Respondents should be aware that notwithstanding any other provision of law, no person shall be subject to any oenalty for failing to comply with a collection of information if it does not display a currently valid OMB control number. PLEASE DO NOT RETURN YOUR FORM TO THE ABOVE ADDRESS. a. REPORT The Rapid Forensic Evaluation of Microbes in Biodefense research program will develop a rapid screening and detection system for multiple Bio-Threat (BT) agents for the Department of Defense. 14. ABSTRACT 16. SECURITY CLASSIFICATION OF: Global analytical approaches for forensic targets were developed and plant-fungal-viral model system was optimized for double-stranded (ds) RNA and protein signature identification. This approach developed at Indiana University of Pennsylvania (IUP) utilizes a non bio-threat plant-fungal-viral model system to develop methods and devices for rapid forensic analysis of microbes. The naturally occurring fungus Rhizoctonia solani (a common inhabitant of the soil ecosystem) was used to experiment, develop, optimize 1. REPORT DATE (DD-MM-YYYY) 4. TITLE AND SUBTITLE 31-05-2012 13. SUPPLEMENTARY NOTES The views, opinions and/or findings contained in this report are those of the author(s) and should not contrued as an official Department of the Army position, policy or decision, unless so designated by other documentation. 12. DISTRIBUTION AVAILIBILITY STATEMENT Approved for Public Release; Distribution Unlimited UU 9. SPONSORING/MONITORING AGENCY NAME(S) AND ADDRESS(ES) 6. AUTHORS 7. PERFORMING ORGANIZATION NAMES AND ADDRESSES U.S. Army Research Office P.O. Box 12211 Research Triangle Park, NC 27709-2211 15. SUBJECT TERMS Rhizoctonia solani, dsRNA, biosensor, proteomics, genomics Dr. Bharathan Narayanaswamy, Dr. Seema Bharathan IUP Research Institute IUP Research Institute 1179 Grant Street Indiana, PA 15701 - REPORT DOCUMENTATION PAGE b. ABSTRACT UU c. THIS PAGE UU 2. REPORT TYPE Final Report 17. LIMITATION OF ABSTRACT UU 15. NUMBER OF PAGES 5d. PROJECT NUMBER 5e. TASK NUMBER 5f. WORK UNIT NUMBER 5c. PROGRAM ELEMENT NUMBER 5b. GRANT NUMBER 5a. CONTRACT NUMBER W911NF-09-1-0066 Form Approved OMB NO. 0704-0188 55375-CH.3 11. SPONSOR/MONITOR'S REPORT NUMBER(S) 10. SPONSOR/MONITOR'S ACRONYM(S) ARO 8. PERFORMING ORGANIZATION REPORT NUMBER 19a. NAME OF RESPONSIBLE PERSON 19b. TELEPHONE NUMBER Narayanaswamy Bharathan 724-357-5988 3. DATES COVERED (From - To) 1-Mar-2009 Standard Form 298 (Rev 8/98) Prescribed by ANSI Std. Z39.18 - 29-Feb-2012
Transcript of REPORT DOCUMENTATION PAGE Form Approved .... Bharathan Narayanaswamy, Dr. Seema Bharathan IUP...

The public reporting burden for this collection of information is estimated to average 1 hour per response, including the time for reviewing instructions,
searching existing data sources, gathering and maintaining the data needed, and completing and reviewing the collection of information. Send comments
regarding this burden estimate or any other aspect of this collection of information, including suggesstions for reducing this burden, to Washington
Headquarters Services, Directorate for Information Operations and Reports, 1215 Jefferson Davis Highway, Suite 1204, Arlington VA, 22202-4302.
Respondents should be aware that notwithstanding any other provision of law, no person shall be subject to any oenalty for failing to comply with a collection of
information if it does not display a currently valid OMB control number.
PLEASE DO NOT RETURN YOUR FORM TO THE ABOVE ADDRESS.
a. REPORT
The Rapid Forensic Evaluation of Microbes in Biodefense
research program will develop a rapid screening and detection
system for multiple Bio-Threat (BT) agents for the Department
of Defense.
14. ABSTRACT
16. SECURITY CLASSIFICATION OF:
Global analytical approaches for forensic targets were developed and plant-fungal-viral model system was
optimized for double-stranded (ds) RNA and protein signature identification.
This approach developed at Indiana University of Pennsylvania (IUP) utilizes a non bio-threat plant-fungal-viral
model system to develop methods and devices for rapid forensic analysis of microbes. The naturally occurring
fungus Rhizoctonia solani (a common inhabitant of the soil ecosystem) was used to experiment, develop, optimize
1. REPORT DATE (DD-MM-YYYY)
4. TITLE AND SUBTITLE
31-05-2012
13. SUPPLEMENTARY NOTES
The views, opinions and/or findings contained in this report are those of the author(s) and should not contrued as an official Department
of the Army position, policy or decision, unless so designated by other documentation.
12. DISTRIBUTION AVAILIBILITY STATEMENT
Approved for Public Release; Distribution Unlimited
UU
9. SPONSORING/MONITORING AGENCY NAME(S) AND
ADDRESS(ES)
6. AUTHORS
7. PERFORMING ORGANIZATION NAMES AND ADDRESSES
U.S. Army Research Office
P.O. Box 12211
Research Triangle Park, NC 27709-2211
15. SUBJECT TERMS
Rhizoctonia solani, dsRNA, biosensor, proteomics, genomics
Dr. Bharathan Narayanaswamy, Dr. Seema Bharathan
IUP Research Institute
IUP Research Institute
1179 Grant Street
Indiana, PA 15701 -
REPORT DOCUMENTATION PAGE
b. ABSTRACT
UU
c. THIS PAGE
UU
2. REPORT TYPE
Final Report
17. LIMITATION OF
ABSTRACT
UU
15. NUMBER
OF PAGES
5d. PROJECT NUMBER
5e. TASK NUMBER
5f. WORK UNIT NUMBER
5c. PROGRAM ELEMENT NUMBER
5b. GRANT NUMBER
5a. CONTRACT NUMBER
W911NF-09-1-0066
Form Approved OMB NO. 0704-0188
55375-CH.3
11. SPONSOR/MONITOR'S REPORT
NUMBER(S)
10. SPONSOR/MONITOR'S ACRONYM(S)
ARO
8. PERFORMING ORGANIZATION REPORT
NUMBER
19a. NAME OF RESPONSIBLE PERSON
19b. TELEPHONE NUMBER
Narayanaswamy Bharathan
724-357-5988
3. DATES COVERED (From - To)
1-Mar-2009
Standard Form 298 (Rev 8/98)
Prescribed by ANSI Std. Z39.18
- 29-Feb-2012

The Rapid Forensic Evaluation of Microbes in Biodefense research program will develop a rapid screening and
detection system for multiple Bio-Threat (BT) agents for the Department of Defense.
Report Title
ABSTRACT
Global analytical approaches for forensic targets were developed and plant-fungal-viral model system was optimized for double-stranded
(ds) RNA and protein signature identification.
This approach developed at Indiana University of Pennsylvania (IUP) utilizes a non bio-threat plant-fungal-viral model system to develop
methods and devices for rapid forensic analysis of microbes. The naturally occurring fungus Rhizoctonia solani (a common inhabitant of
the soil ecosystem) was used to experiment, develop, optimize and validate bio-threat detection methods and potential device technologies
outside of a controlled facility. This model system has proven to be an economical approach to knowledge acquisition that does not require
an elaborate and more complex biological safety level (BSL) 3 capabilities. The fungus also harbors double stranded RNA viruses that
influence the parasitic and saprobic activity of the fungus and could be potentially exploited for bioterrorism. Since the project’s initiation in
February 2009, significant progress has been made specifically: A rapid manufacturing protocol was developed; 13 different viral agents
were characterized for their nucleic acid (milestone 1) and targetable proteins (milestone 3); universal primer for BT detection with
double-stranded (ds) RNA genome has been identified and verified. The sequencing of the R. solani genome in partnership with the J. Craig
Venter Institute (JCVI) is complete. So far 16 R. solani proteins have been annotated and several mutants with reduced genome
complement (RGC) have been generated. Protocols for the integration of modern imaging methods into bio-defense research to elucidate
mechanisms at the macro level that characterize host-microbe interactions were developed (milestone 2). Techniques used include
panoramic imaging, confocal imaging, and LC/MS/MS technologies for protein signature development.
(a) Papers published in peer-reviewed journals (N/A for none)
Enter List of papers submitted or published that acknowledge ARO support from the start of
the project to the date of this printing. List the papers, including journal references, in the
following categories:
PaperReceived
TOTAL:
(b) Papers published in non-peer-reviewed journals (N/A for none)
Number of Papers published in peer-reviewed journals:
PaperReceived
TOTAL:
Number of Papers published in non peer-reviewed journals:
(c) Presentations

CHEMICAL AND BIOLOGICAL DEFENSE SCIENCE AND TECHNOLOGY CONFERENCE
Paper Topic # 1).
Microbial Interactions ---Panoramic Imaging and Cytology of Non-Self Fungal Fusions in the Pathogenic Fungus Rhizoctonia solani Mark
Smith1, Anthony G. Gutierrez2, Andrea Strein1, Seema Bharathan1, Marc Cubeta3, Shan Min Chin1, Chin Hong Siew1, Richard Somiari4
and Narayanaswamy Bharathan1 1Indiana University of Pennsylvania, Indiana, Pennsylvania, 15705; 2 The U..S. Army Institute of Public
Health, Aberdeen Proving Ground, MD, 21010; 3Center for Integrated Fungal Research, North Carolina State University, Raleigh, NC
27606; 4ITSI-Biosciences, Johnstown, Pennsylvania 15901, USA
The integration of modern imaging methods into bio-defense research will help elucidate mechanisms at the macro level that characterize
host-microbe interactions. Our research at Indiana University of Pennsylvania funded by Defense Threat Reduction Agency (DTRA) in
cooperation with ITSI-Biosciences and Department of Health uses fungal-viral model system to study microbial interactions; cytoplasmic
exchange of genetic elements; protein factors; and the underlying causes of host cell death. In the present study using 19 different paired
combinations, we observed hyphal interactions between compatible and incompatible Rhizoctonia solani isolates using a compact portable
macro image stacking device (patent pending) that allows one to photograph objects as small as 0.5 mm using a standard DSLR camera.
When the mycelia of R. solani encounter mycelia with a different genetic background, distinct barrage lines (BL) form. Several ultra-high
resolution micro/macro images were generated showing high degree of stratification near or close to the tip of the fungal mycelium
suggesting active protein and lipid synthesis. The device uses a DSLR camera with a 1-5x Macro lens. Since the lens focuses on a depth of
field 1/10th to 1/50th of the width of the image it frames, a stacking device was developed earlier (Macropod tm , USAIPH) to capture
multiple images in depth to compile in to a single fully focused image. The Macropod tm consists of a macro lens equipped DSLR which is
mounted fixed on a 3 legged stand such that the DSLR is optically in line with one leg. That leg carries a specimen mount which can be
moved with precision short distances along its length, the Z axis. The specimen mount itself can also move the specimen in the X and Y
axes for shorter distances for stitching panoramic shots. The Z axis stack can be downloaded to a computer and stacked using any number
of stacking algorithms. Edited images provided extra high resolution that allowed us to observe perfect hyphal anastomosis in compatible
pairs. The hyphae never anastomosed with incompatible pairs (i.e., the hyphae remained parallel or crossed over without merging). These
behaviors appear to result from the detection of one or more diffusible factors or due to up-take of viruses, toxins and traffic within fungal
cells. Our results also suggest that the attraction to other hyphae in pairs of incompatible isolates was increased by supplementation of the
growing medium with activated charcoal. We will report data concerning programmed cell Death (PCD) with one or two approaching
hyphae. Techniques used include panoramic imaging, immunofluorescence, confocal imaging, and LC/MS/MS technologies for protein
signature development.
Funding was provided by a grant from Department of the Army and Defense Threat Reduction Agency (DTRA) to Dr. N. Bharathan and
Dr. Seema Bharathan. Award # W911NF-09-1-0066 PROPOSAL # 55375CH
Global Analytical Approaches to Forensic Target Optimization in a Plant-Fungal-Viral Model System. Seema Bharathan1, Richard
Somiari2, Shan Min Chin1, Chin Hong Siew1, Florentina Mayko, Stephen Russell2, Andrea Strein1, Doreen Domingo1, and
Narayanaswamy Bharathan1, Indiana University of Pennsylvania, Indiana, Pennsylvania, 15705; 2ITSI-Biosciences, Johnstown,
Pennsylvania 15901, USA
Paper Topic # 2).
Global Analytical Approaches to Forensic Target Optimization in a Plant-Fungal-Viral Model System. Seema Bharathan1, Richard
Somiari2, Shan Min Chin1, Chin Hong Siew1, Florentina Mayko, Stephen Russell2, Andrea Strein1, Doreen Domingo1, and
Narayanaswamy Bharathan1, Indiana University of Pennsylvania, Indiana, Pennsylvania, 15705; 2ITSI-Biosciences, Johnstown,
Pennsylvania 15901, USA
ABSTRACT The “Rapid Forensics Analysis of Microbes” program at Indiana University of Pennsylvania in collaboration with
ITSI-Biosciences utilizes plant and fungal viruses to develop methods and devices for rapid forensic detection of microbes. These
organisms are not classified as biothreat (BT) agents and hence it was possible to conduct experiments in a regular laboratory and develop
models that could be applied to other areas of BT agent research. Our focus was to identify extra-chromosomal RNA and proteins that are
characteristic of each fungal model system. The secondary focus was -- to determine if the presence of viruses can be detected in these
plant and fungal models and see-- if the presence of these viruses in any way causes detectable changes in protein expression.
Specifically, this program utilizes the plant pathogenic fungus Rhizoctonia solani as a model. R. solani is highly virulent on potato and
other economically important chlorophyllous plant species; it is naturally occurring with one phenotype but with multiple genotypes
harboring different viruses. In fact some R. solani carry more than one type of virus. The representative variants of the wild (heterokaryon)
type fungal strains and several reduced (homokaryon) complement (RC) strains of R. solani were characterized and their potential targets
identified at the molecular level for the presence of extra-chromosomal double-stranded (ds) RNA and proteins. Briefly, about 11 dsRNA
belonging to 11 different R. solani isolates that included both wild type and RC strains were cloned and sequenced. A unique strategy was

developed for amplification and cloning different middle (M)-size dsRNA fragments by synthesizing random primer-dN6
(5’-CCTGAATTCGGATCCTCCNNNNNN-3’). Full-length PCR products representing several genomic segments were cloned into
p-Drive cloning vector (Qiagen) and sequenced. The sequences were determined using Sanger sequencing with an ABI 3730 sequencer
(Retrogen Inc. San Diego, CA). The sequences were compared for similarity against the non-abundant sequence databases of EMBL, EU,
using the BLAST algorithm. Several clones were picked; preliminary sequence comparison of some mycoviral dsRNA suggests 26-30%
sequence identical to coat protein of Carrot Cryptic Virus, Beet Cryptic Virus, and the capsid protein of the White Clover Cryptic Virus. In
order to test for sensitivity and specificity, probes were prepared from cloned dsRNA fragments of the wild-type dsRNA and hybridized to
dsRNA and cloned DNA from both the other wild-type and RC strains of R. solani. Probes were dual labeled (5’FAM/3’BHQ-1) and the
design for qPCR assays was done using Biosearch Technologies (Novato, CA) Real Time Design™ software. Thus, our discovery
platform for the first time has developed a protocol to generate PCR products from unknown dsRNA sequences belonging to the genome of
pleomorphic viruses infecting the R. solani isolates that are heterokaryon and a homokaryon. Preliminary assessment of the identified
proteins indicate that some are unique to each model, and represent candidate targets that will allow the selective detection of the target
with high sensitivity and specificity.
Funding was provided by a grant from Department of the Army and Defense Threat Reduction Agency (DTRA) to Dr. N. Bharathan and
Dr. Seema Bharathan. Award # W911NF-09-1-0066 PROPOSAL # 55375CH
Paper Topic # 3).
Detection of Tomato Mosaic Virus (ToMV) Using One Step Reverse Transcription PCR Alan Kessler**, Charles Voyton*, Shan Min
Chin**, Chin Hong Siew**Dr. Seema Bharathan**, Dr. N. Bharathan** *Biochemistry Program, **Department of Biology, Indiana
University of Pennsylvania, Indiana, Pennsylvania 15705 Annual Undergraduate Research Conference, Indiana University of Pennsylvania
April4, 2012.
This poster won the award for the best student Presentation in the College of Natural Sciences and Mathematics.
Tomato Mosaic Virus (ToMV) is a single stranded RNA virus belonging to the Tobamo Virus Group. The genome of the virus is
single-stranded (ss) RNA about 6.2-kilobase (kb) in length and that is highly infectious. The virus is transmitted by mechanical injury and
there is no known invertebrate vector that has been found to transmit the virus in nature. There are reports that the virus is spread across the
continent via fog, mist, clouds, springs, and all forms of flowing water. The decrease in spruce and hemlock population in the Northern
Alleghany forests may be caused by shifting environmental factors that make these trees more susceptible to attack. A project was
undertaken to specifically identify the distribution of the ToMV in the aquatic habitat in order to predict the distribution of the virus in the
Western Alleghany Forest. Total RNA was extracted from various sources including streams, ponds, virus infected soil water, and plant
tissue infected with the virus. Presence or absence of the Viral RNA was tested using one-step-reverse transcription (RT)-PCR, in which
the combination of degenerate deoxinosine (dI)-substituted primers were designed to amplify part of the polymerase region of the ToMV
viral RNA genome, followed by a nested PCR amplification that increased specificity and sensitivity of detection. An attempt was made to
alleviate the problems of generic detection and identification of ToMV RNA by nested RT-PCR using DI-containing primers. Preliminary
results from real-time detection of ToMV RNA from various sources suggest the presence of copious amount of ToMV associated viral
RNA in soil water, including the streams. Results from the study to increase specificity and sensitivity of detection using virus ToMV viral
RNA specific probes indicate that RNA as high as 79.0µg/mL and as low as 3.4µg/mL could be detected.
Number of Presentations: 3.00
Non Peer-Reviewed Conference Proceeding publications (other than abstracts):
PaperReceived
TOTAL:
Number of Non Peer-Reviewed Conference Proceeding publications (other than abstracts):
Peer-Reviewed Conference Proceeding publications (other than abstracts):
PaperReceived
TOTAL:

(d) Manuscripts
Number of Peer-Reviewed Conference Proceeding publications (other than abstracts):
PaperReceived
1. Seema Bharathan, Richard Somiari, Shan Min Chin, Chin Hong Siew, Jessica Richards, N. Bharathan ,
2. Deanna Belsky, Jon Henninger, Chin Hong Siew, Shan Min Chin, Seema Bharathan, N. Bharathan, 3.
Jonathan Henninger, Deanna Belsky, Chin Hong Siew, Shan Min Chin, Seema Bharathan, N. Bharathan. 1.
Characterization of RNA and proteins signatures from viruses to develop single platform devices for multiple
detection of pathogens 2. Centrifugal Analysis of the Cytoplasmic Fractions of the Plant Pathogenic Fungus
3. PCR Cloning of Double-Stranded (ds) and Single-Stranded (ss) RNA from Viral Agents for Signature
Biodetection, 1. Department of Life Science, National Institute of Technology, Roukela, India (08 2011)
2011/08/30 10:33:14 2
1. Deanna Belsky, Jon Henninger, Chin Hong Siew, Shan Min Chin, Seema Bharathan and N. Bharathan
2. Jonathan Henninger, Deanna Belsky, Chin Hong Siew, Shan Min Chin, N. Bharathan and Seema
Bharathan. 1. Centrifugal Analysis of the Cytoplasmic Fractions of the Plant Pathogenic Fungus Rhizoctonia
solani for Double-Stranded RNA (dsRNA)
2. PCR Cloning of Double-Stranded (ds) and Single-Stranded (ss) RNA from Viral Agents for Signature
Biodetection, (04 2011)
2010/08/31 11:50:46 1
TOTAL: 2
Books
Number of Manuscripts:
PaperReceived
TOTAL:
Patents Submitted
None
Patents Awarded
None
Awards
Dr. Bhararathan Narayanaswamy Principal investigator in the project received the
i) Outstanding Research Award for the outreach sponsored Research program at Indiana University of Pennsylvania (IUP),
Indiana, Pennsylvania (IUP), Indiana, PA 15705 (2010-11)
ii) Received the Life Time Achieving Award 2011-12 for excellent service to students and Scholarship at IUP (2011-12).
Graduate Students

DisciplinePERCENT_SUPPORTEDNAME
Anjan H. Bangalore 0.10
Haripriya G. Patil 0.10
Shruthi Shivashankar 0.10
Mehak Mahajan 0.10
Shan Min Chin 0.33
Chin Hong Siew 0.33
Doreen Domingo 0.10
1.16FTE Equivalent:
7Total Number:
Names of Post Doctorates
PERCENT_SUPPORTEDNAME
FTE Equivalent:
Total Number:
Names of Faculty Supported
National Academy MemberPERCENT_SUPPORTEDNAME
Seema Bharathan 0.20
Narayanaswamy Bharathan 0.20
0.40FTE Equivalent:
2Total Number:
Names of Under Graduate students supported
DisciplinePERCENT_SUPPORTEDNAME
Louis Colaini 0.30 Chemistry
Alan Kessler 0.30 Biology
Charles Voyton 0.30 Biochemistry
0.90FTE Equivalent:
3Total Number:
The number of undergraduates funded by this agreement who graduated during this period with a degree in
science, mathematics, engineering, or technology fields:
The number of undergraduates funded by your agreement who graduated during this period and will continue
to pursue a graduate or Ph.D. degree in science, mathematics, engineering, or technology fields:
Number of graduating undergraduates who achieved a 3.5 GPA to 4.0 (4.0 max scale):
Number of graduating undergraduates funded by a DoD funded Center of Excellence grant for
Education, Research and Engineering:
The number of undergraduates funded by your agreement who graduated during this period and intend to
work for the Department of Defense
The number of undergraduates funded by your agreement who graduated during this period and will receive
scholarships or fellowships for further studies in science, mathematics, engineering or technology fields:
3.00
3.00
3.00
0.00
0.00
0.00
......
......
......
......
......
......
Student MetricsThis section only applies to graduating undergraduates supported by this agreement in this reporting period
The number of undergraduates funded by this agreement who graduated during this period: 3.00......
Names of Personnel receiving masters degrees

NAME
Total Number:
Names of personnel receiving PHDs
NAME
Total Number:
Names of other research staff
PERCENT_SUPPORTEDNAME
Ms. Kristy Anthony 0.20
Ms. A. Rao 0.10
Dr. Doreen Domingo 0.15
0.45FTE Equivalent:
3Total Number:
J. Craig Venter Institute J. Craig Venter Institute
9704 Medical Center Drive
Rockville MD 208503433
Sub Contractor Numbers (c):
Patent Clause Number (d-1):
Patent Date (d-2):
Work Description (e):
Sub Contract Award Date (f-1):
Sub Contract Est Completion Date(f-2):
1 a. 1 b.
J. Craig Venter Institute J. Craig Venter Institute
9704 Medical Center Drive
Rockville MD 208503433
Sub Contractor Numbers (c):
Patent Clause Number (d-1):
Patent Date (d-2):
Work Description (e):
Sub Contract Award Date (f-1):
Sub Contract Est Completion Date(f-2):
1 a. 1 b.
Integrated Technologies & Services International-Biosciences 633 Napoleon Street
Johnstown PA 15901
5/1/2010 12:00:00AM
2/1/2011 12:00:00AM
Sub Contractor Numbers (c):
Patent Clause Number (d-1):
Patent Date (d-2):
Work Description (e):
Sub Contract Award Date (f-1):
Sub Contract Est Completion Date(f-2):
1 a. 1 b.
Sub Contractors (DD882)

Inventions (DD882)
Scientific Progress
See Attchment.
Technology Transfer
1
Final Report
Rapid Forensic Evaluation of Microbes in Biodefense
Foreword
The ―Rapid Forensics Analysis of Microbes‖ program utilizes plant, fungal and viruses to
develop methods and devices for rapid forensic analysis of microbes. By using
microorganisms that are not classified as biothreat agents as models, it is possible to
conduct experiments and develop models that can be applied to other areas. Specifically
this program utilizes the fungus Rhizoctonia solani as a model because it is a naturally
occurring fungus with one phenotype but multiple genotypes because it harbors different
viruses. In fact some R. solani carry more than one type of virus. This means that using
this model organism it will be possible to evaluate the extent to which it will be possible
to discriminate between the fungus carrying for example dsRNA from a plant carrying
single stranded (ss) RNA. A major challenge for developing better and faster ways for
detection of biological agents of national interest is the limited availability of suitable
facilities and equipment to many researchers, as well as the difficulty in getting
security/safety clearances that will allow many more researchers to work with biothreat
agents. A way around this problem is the use of model organisms that are not regarded as
biothreat agents. Using model organisms that are not pathogenic provides an opportunity
to experiment, develop, optimize and validate methods and devices in a regular
laboratory prior to testing the hypothesis and/or performance of the protocol/device with
a bio-threat agent of interest in a controlled facility. In three years, representative variants
of the model plant and fungal strains were characterized, and potential molecular targets
identified at the nucleic acid and protein levels.

2
Contents
Milestone 1:
Task 1 Characterization of ToMV ssRNA……………………………………………..4
Milestone 2:
Task 1 Characterization of signature proteins in ToMV infected and healthy Plant Model
system ………………………………………………………………………………….11
Milestone 1:
Task 2: Characterization of fungal and viral nucleic acids from fungal Model
System…………………………………………………………………………………..15
Milestone 2:
Task 2: Characterization of signature proteins in Fungal Model system………………..30
Milestone 3:
Task 1: Develop and optimize protocol for Genomic DNA Extraction from Reduced
Complement Isolates of Rhizoctonia solani 29.3A and T2 for Genomic Sequencing
………………………………………………………………………………………….. 46
Milestone 3:
Task 2: Fungal Model Imaging and Cytoplasmic Content Analysis …………………. 50
Appendix A …………………………………………………………………………
Appendix B…………………………………………………………………………
Appendix C………………………………………………………………………...
Appendix D………………………………………………………………………..
Appendix E…………………………………………………………………………

3
Milestone 1: Characterization of fungal and viral nucleic acids. This milestone will
achieve the goal of full characterization of viruses infecting R. solani and tomato mosaic
virus RNA with the aim of identifying nucleic acid signatures that can be used to
discriminate between the viral and fungal models.
Milestone 2: Characterization of fungal and viral proteins. This milestone will achieve
the goal of performing proteomic analysis of R. solani and tomato mosaic virus proteins
with the aim of identifying protein signatures that can be used to discriminate between
the viral and fungal models.
Milestone 3: Explore the feasibility of sequencing the genome of R. solani AG-1/AG-4.
This milestone will achieve the goal of setting the stage for potential sequencing of the
genome of R. solani AG-1/AG-4. This will allow the development of a peptide database
to allow a more efficient and accurate annotation of R. solani AG-1/AG-4 at the
molecular level.

4
Milestone 1: Characterization of fungal and viral nucleic acids. This milestone will
achieve the goal of full characterization of viruses infecting R. solani and tomato mosaic
virus RNA with the aim of identifying nucleic acid signatures that can be used to
discriminate between the viral and fungal models.
TASK 1: Purification and Characterization of Plant viral nucleic acids Tomato Mosaic
Virus (ToMV) single stranded (ss) RNA.
Experimental Protocols
Project Design and Experimental Plan
i) Viral genomic RNA from Tomato Mosaic Virus (ToMV) was isolated from
partially purified virus and infected tissue. Isolation of RNA from Tomato
Mosaic Virus (ToMV) ssRNA: High quality ssRNA were purified as
described below using combination of clarification, tissue disruption, followed
by low-speed and high speed centrifugation. These step-wise processes were
performed on ice and under aseptic conditions.
ii) Extraction of ssRNA from partially purified viral agent. Purified ToMV was
diluted 10-fold in 2X NET (0.2M NaCl, 20mM Tris, 2mM EDTA and 10%
SDS. The mixture was heat to 70ºC in hot ddH2O to disrupt virus structure
and RNA extracted by phenol extraction. The aqueous phase was treated with
2.5 volume of ethanol (EtOH). The concentration and purity of ssRNA was
assessed using spectrophotometric analysis and tested for its integrity, purity
and concentration; analyzed by gel electrophoresis. Eventually the RNA was
used for generic detection by nested PCR.
iii) a) Concentration of RNA
More accurate estimation of nucleic acid concentration was made using UV
spectroscopy. DNA, RNA, and protein strongly absorb ultraviolet light in the 260 to 280
nm range. Nucleic acids absorb strongly at 260 nm and less strongly at 280 nm while
proteins just do the opposite. The general rules for determining concentrations of nucleic
acids at 260 nm are:

5
1 OD unit of single-stranded RNA is 40g/ml
Concentration [RNA] g/ml = OD260 nm X Dilution factor X 40 (Extinction Coefficient).
The results are shown in Appendix A and Figure 1
b) RT-PCR Analysis Tomato Mosaic Virus (ToMV): One-step-RT-PCR protocol was
tested and validated, using combination of degenerate deoxinosine (dI)-substituted
primers (Table 1) . These Primers were designed to amplify part of the polymerase region
of the ToMV viral RNA genome, followed by a nested PCR amplification step to
increase specificity and sensitivity of detection.
cDNA Synthesis using Degenerate primers Reverse Transcription PCR
Reverse transcription (RT) PCR of both the purified ssRNA from ToMV was done using the Ambion Retroscript© Kit with few modifications.
ssRNA or ToMV were denatured at 97°C for 90 seconds in the presence of 1% DMSO and random decamers or degenerate primers Appendix A and Table 1 were used.
All primers were synthesized by Invitrogen.
Denatured ssRNA was subjected to RT-PCR as described below:
2µL 10X RT Buffer
4 µL dNTP mix
1 µL RNase Inhibitor
1 µL of MMLV-RT Reverse Transcriptase to a final volume of 20µL.
Bio-Rad MyCycler Thermocycler was programmed for the following:
44°C for 1 hr, followed by 92°C for 10 min. The newly generated cDNA-RNA hybrids were used PCR. immediately for the 2nd round PCR
Conventional PCR of cDNA of ToMV ssRNA
Conventional PCR of the cDNA from the RT-PCR was conducted using Ambion SuperTaqTM Plus DNA Polymerase.
The reaction was set up as follows:
5µL of RT-PCR reaction,
5µL of 10X PCR Buffer (100 mM Tris-HCl pH 9.0, 500 mM KOAc, 15 mM MgSO4),
2.5µL dNTP mix (2.5 mM each dATP, dCTP, dGTP, dTTP),
33.5µL of nuclease- free water,
5 µM of primers (TOBRTUP1 (GAGTACGCIGCITICAGAC, where I denotes deoxyinosine), and TOBRTD02 (CGCTTCAAAGTTCCA) for ToMV ssRNA; and 1 U of SuperTaq DNA polymerase.

6
The reactions were placed in a Bio-Rad MyCycler programmed for the following:
Initial denaturation at 94°C 4 minutes,
30 cycles of denaturation (94°C for 30 seconds), annealing (46°C for 30 seconds), and extension (72°C for 4 minutes), followed by a final extension of 72°C for 10 minutes.
PCR products were analyzed by 1% agarose- gel electrophoresis in 1X TAE buffer. Agarose-gels were run at 37 V/cm for 2 to 3 hours.
Gel electrophoressis Pictures Results are in Appendix A
Real-time PCR of cDNA of TomV ssRNA
The cDNA from the RT-PCR reaction was done using DNA Master SYBR Green I from
Roche in an Eppendorf RealPlex© Real Time PCR Thermocycler. The reactions set up
included
13.6µL of nuclease- free water,
0.4µL of MgCl2 stock (25 mM),
5 µM each of the primers TOBRTD02 and TOBRTUP1 (for ToMV),
2µL of the SYBR Green Master Mix and 2µL of template from the previous RT-PCR reaction.
The reactions were placed in the thermocycler programmed for the following: initial denaturation at 94°C for 3 minutes,
40 cycles of denaturation (94°C for 15 seconds),
annealing (46°C for 15 seconds), and
extension (72°C for 1 minute), followed by a
final extension at 72°C for 5 minutes. Fluorescence readings were taken at the
extension phase of each cycle, and the samples were ultimately subjected to a melting
curve analysis.
RESULTS
The partially purified RNA was tested for its integrity, purity and concentration; analyzed
by gel electrophoresis. Eventually the RNA was used for generic detection by nested
PCR. The results are presented below:
a) Concentration of RNA
More accurate estimation of nucleic acid concentration was made using UV
spectroscopy. DNA, RNA, and protein strongly absorb ultraviolet light in the 260 to 280

7
nm range. Nucleic acids absorb strongly at 260 nm and less strongly at 280 nm while
proteins just do the opposite. The general rules for determining concentrations of nucleic
acids at 260 nm are:
1 OD unit of single-stranded RNA is 40g/ml
Concentration [RNA] g/ml = OD260 nm X Dilution factor X 40 (Extinction Coefficient).
The results are shown in Figure 1 (Appendix A).
b) Qualitative Assessment of RNA by Agarose Gel Electrophoresis Denaturing
Agarose Gels (MOPS –Formaldehyde gels)
a. Method: Since RNA is single-stranded, most RNA can form secondary structures via
intra molecular base pairing. It was therefore essential that denaturing gel is used to
separate the RNA. RNAse free reagents will be used, to optimize your results. A typical
protocol for denaturing RNA gels is taken from ―Current protocols in Molecular
Biology‖. Electrophoretric Gel analysis of RNA (Appendix A Figure 2).
c) RT-PCR Analysis: The microbial forensic project incorporated one-step-RT-PCR , in
which the combination of degenerate deoxinosine (dI)-substituted primers were designed
to amplify part of the polymerase region of the ToMV viral RNA genome, followed by a
nested PCR that amplification that increased specificity and sensitivity of detection. In
the present study, an attempt was made to alleviate the problems of Generic Detection
and Identification of ToMV RNA by nested RT-PCR using DI-containing primers. The
list and design of the degenerate primers are shown in table 1.
The higly degenerate primers (Tobamo 1 and Tobamo 2) were designed from conserved
motifs of the RdRp genes of tobamoviruses (Gibbs et al., 1998). All primers were
synthesized by Integrated DNA technologies and Invitrogen. The purified PCR products
were cloned into p-Drive cloning vector (Figure 5) and transformed into E. coli
competent cells according to the manufacturer instructions (Qiagen PCR Cloning Kit).
The transformed plasmids were purified from transformed E. coli cells by using GeneJEt
Plasmid Miniprep Kit (Fermentas). The transformation efficiency was determined to be
4.6%. In all 22 clones were selected and the purified plasmids were cut by EcoRI
FastDigest Enzyme (Fermentas) and ran them on the gel to determine the sizes of the
cloned fragments (Figure 6). The sizes of the cloned fragments are shown in the Table 4.

8
All these cloned plasmids containing the insert were eventually sequenced Retrogen Inc.
The sequences were compared for similarity against non-redundant sequence database of
the National Center for Biotechnology Information, Bethesda, USA or the EU
Consortium of Molecular Biology http://www.ebi.ac.uk/Tool/sss/fasta/. The sequence
comparison to known Tobamovirus groups have shown 90% sequence alignment Figure
7. Under the optimized amplification conditions, nested RT-PCR assays using leaf
extracts as templates also produced expected of the ToMV isolates (Figure 2). This type
of generic RT-PCR method can have very important practical implications in DNA
microarray DNA technology, by providing high quality amplified DNA targets tio be
hybridized onto a micro-array based plant-virus cDNA chip. Using the system we have
developed with degenerate primers it is possible to detect many different viruses in mixed
infections. These protocols support our effort to demonstrate multi-platform effectiveness
for our biodetector. The preliminary results from primer design, probe design (Figures 8
and 9) are shown in Table 8 and FAM profile in Figure 10.
b) Design of Dual labeled oligonucleotide probes for ToMV detection: Genomic
assays for ToMV viral RNA will be tested using profluorescent oligonucleotide probes
that are covalently labeled at the 5‗ end with a fluorophore at the 3‗ end with a quencher.
The probes will be designed using software from Integrated DNA Technologies (IDT) for
the following two targets of the ssRNA agent RNA-directed RNA polymerase and the
Coat protein (Cp) gene of the TMV virus.
Probe design for the target sequence is shown in Figure 1 below and the principle of Dual
labeled probes is shown in Figure 2. These allow achieving maximum specificity and
sensitivity. All real-time PCR assays will be done using eppendorf MastercylerR ep
Realplex with optimized qPCR in small reaction volumes. Probe design for the target
sequence is shown in Figure 10 below and the principle of Dual labeled probes is shown
in Figure 11. These allow achieving maximum specificity and sensitivity. All real-time
PCR assays will be done using eppendorf MastercylerR ep Realplex with optimized qPCR
in small reaction volumes.
A probe specific for the sequence of interest is used in PCR together with specific PCR
primers (see below). This probe is designed to anneal between the PCR primers. During

9
the extension phase of PCR, the 5'-3' exonuclease activity of Taq DNA polymerase
cleaves the fluorescent reporter from the probe. The amount of free reporter accumulates
as the number of PCR cycles increases. The fluorescent signal from the free reporter is
measured in real time and allows quantification of the amount of target sequence.
Probes Design:
i) It was specific to the ToMV RNA replication; RNA-directed RNA polymerase: for
the following Amino acid Sequence
(NCBI Resources http://www.ncbi.nlm.nih.gov/nuccore/AJ417701)
LKYYTVVMDP LVSIIRDLER VSSYLLDMYK VDAGTQQQLQ VDSVFKNFNL FVAAPKTGDI
SDMQFYYDKC LPGNSTLLNN YDAVTMKLTD ISLNVKDCIL DMSKSVAAPK DVKPTLIPMV
RTAAEMPRQT GLLENLVAMI KRNFNSPELS GVVDIENTAS LVVDKFFDSY LLKEKRKPNK
NFSLFSRESL NRWIAKQEQV TIGQLADFDF VDLPAVDQYR HMIKAQPKQK LDLSIQTEYP
ALQTIVYHSK KINAIFGPLF SELTRQLLDS IDSSRFLFFT RKTPAQIEDF FGDLDSHVPM
DVLELDISKY DKSQNEFHCA VEYEIWRRLG LEDFLAEVWK QGHRKTTLKD YTAGIKTCLW
YQRKSGDVTT FIGNTVIIAS CLASMLPMEK LIKGAFCGDD SLLYFPKGCE YPDIQQAANL
MWNFEAKLFK KQYGYFCGRY VIHHDRGCIV YYDPLKLISK LGAKHIKDWD HLEEFRRSLC
ii) Coat protein (Cp) gene of the ToMV capsid protein (ENA|CAD22082|CAD22082.1
Tomato mosaic virus capsid protein)
atgtcttactcaatcacttctccatcgcaatttgtgtttttgtcatctgtatgggctgaccctatagaattgttaaacgtttgtacaaactc
gctaggcaaccagtttcaaacacagcaagcaagaactactgttcaacagcagttcagcgaggtgtggaaacctttccctcagag
caccgtcagatttcctggcgatgtttataaggtgtataggtacaatgcagttttagatcctctaattactgcgttgctggggactttcg
atactaggaatagaataatcgaagtagagaaccagcagagtccgacaacagctgaaacgttagatgctacccgcagggtagac
gacgctacggttgcaattcggtctgctataaataatttagttaatgaactagtaagaggtactggactgtacaatcagaatacttttga
aagtatgtctgggttggtctggacctctgcacctgcatcttaa
Primer Sequence Design of ToMV isolates in the Microbes Project
Designed Forward Sequence : TCCGGAAACTCACAACCCTTTG

10
Designed Reverse Sequence: GCTGCATGTTTGGCTTCGAT
Designed Probe Sequence: AAGTACAGCAGACTGTCGTCACCGC
REAL-TIME: Probe Hybridization
The SensiFAST™ Probe Hi-ROX Kit (BIOLINE) was used to validate the sensitivity and
specificity of detection of ToMV RNA. The kit was specifically formulated for use with
probe-detection technology, including Di-Hybrid BHQ Probes (Figures 10 and 11)
Reaction mix composition: Prepare a PCR mastermix. The volumes given are based on
a standard 20 µl final reaction mix and can be scaled accordingly.

11
Milestone 2: Characterization of fungal and viral proteins. This milestone will achieve
the goal of performing proteomic analysis of R. solani and tomato mosaic virus proteins
with the aim of identifying protein signatures that can be used to discriminate between
the viral and fungal models.
Task 2: Characterization of Plan viral proteins in Plant Model system
One of the most important steps in the microbial forensics project is the identification of
distinguishing and targetable signatures/patterns in the model organisms. This milestone
had two specific Aims, including 1) discovery of distinguishing and targetable protein
signatures/patterns in the model viral organisms using 2D-DIGE and 2) isolation and
identification of proteins from the model organisms using nano-LC/MS/MS.
A total of two specimens were analyzed for proteomics analysis with the aim of
identifying proteins that show differential expression.
Code Sample
OHKS infected tobacco leaf
OGK healthy tobacco leaf
To archive this milestone we used a combination of one dimensional polyacrylamide gel
electrophoresis (1D PAGE) and two dimensional difference in-gel electrophoresis (2D-
DIGE) technologies to screen the model organisms. The 1D PAGE allowed us to
determine the generalized pattern of protein distribution and relative mass range of
distinguishing protein bands. Based on the 1D-PAGE data we were able to design 2D-
DIGE experiments that allowed us to profile and measure protein expression differences
between plants that are infected by the virus and those that were not infected. A
representative 1D gel image showing the electrophoretic pattern of the fungal purified
virus and purified virus protein (Figure 1A) and fungal proteins (Figure 1B) are
presented. This very important step is prerequisite to designing methods and devices that
will target selected viral proteins.
The central goal of the 2D-DIGE experiment was to identify proteins that show
qualitative and quantitative differences in the model organisms. This step is prerequisite

12
to determining which proteins are present at different levels, and which are present in one
organism and not in the second. We compared the protein expression in a tobacco plant
infected with the virus and a plant that is not infected with the virus.
This experiment was designed to allow us test the sensitivity of our assay systems in
detecting the presence of a virus in a plant. The ability to detect virus proteins (a
hypothetical threat agent) in plant tissue will suggest that our system will be capable of
detecting a real viral threat agent that is in a plant or benign fungi like the bread mold. As
shown in Figure 2, the 2D-DIGE technology was effective in detecting differences
between infected and non-infected leaves.
The samples were further cleaned up by precipitating with ToPREP and re-
suspending in fresh ToPI-DIGE protein isolation buffer to remove any
interfering substances that may affect the first dimension IEF.
Protein assay was performed on all samples using ToPA to determine the protein
concentration.
A volume that equaled 50ug of protein from each sample was aliquoted in a tube
and labeled with 200pmoles of either cy3 or cy5 protein labeling dye using GE
Healthcare Bio-Sciences protocol.
A standard pool of all samples was prepared by combining equal aliquots of
protein from each sample and labeled with 200pmoles/50ug protein of cy2 protein
labeling dye using the standard protocol.
The labeled samples were matched so that one cy5 labeled sample and one cy3
labeled sample were mixed together. To this mix 50ug of the labeled standard
pool was also added.
The mixed samples were loaded on a 24cm, pH 3-10 IPG strip by rehydrating the
dry strip with 450ul of rehydration buffer that contained the samples. The strip
was rehydrated in this buffer for 24 hours, with 30volts applied to assist with the
absorption of larger proteins.
After rehydration the Strip was focused for a total of 65,000 volt hours.

13
After the strips were focused to complete the first dimension they were processed
by equilibrating them in SDS equilibration buffer and alkylated with
iodoacetamide and reduced with dithiothreitol.
The equilibrated strips were loaded on a 24cmx20cm 12.5% SDS-PAGE gel, and
run to separate the proteins in the second dimension for 4.5 hours at 16watts per
gel.
The gels were then scanned on a GE Healthcare variable mode fluorescent
scanner.The gels were scanned at 3 wavelengths for each cy dye on the gel.
The images were cropped and loaded into Decyder software database for analysis.
The images were first processed on decyder DIA module to detect protein spots
on the gel.
The images with the detected spots were then analyzed using the DeCyder BVA
module. This module allows comparisons between gels using the standard pool
cy2 labeled gel image. There was one sample per type so there was no statistics
for this stage of the study.
Identification of the differentially expressed proteins:
This milestone is concerned with picking, in-gel digestion and sequencing of the target
proteins. To archive this milestone we performed differential in gel analysis of 2D-DIGE
gels toselect candidate spots that have unique patterns of expression.
We picked a total of 184 candidate proteins from the stained gels, performed robotic in-
geldigestion and sequenced the proteins using nano-LC/MS/MS technology as described
below.
In-Gel Digestion and LC/MS/MS.
184 protein spots that met the inclusion criteria were identified on the gel images, picked
into96 well plates with the Ettan Spot Picker (GE Healthcare) and digested overnight at
roomtemperature using the Ettan Spot Digester (GE Healthcare) as previously reported
(Somiari etal, 2003). The plate containing the digests were evaporated to dryness and
stored until massspectrometry to identify proteins by tandem LC/MS/MS.
To assign identities to the candidate proteins of interest, the tryptic digested samples were

14
reconstituted with ultra pure water and sequenced by tandem mass spectrometry as
describedby us (Boyiri et al 2009). Specifically, nano-flow LC/MS/MS was carried out
with nano-bore electrospray columns constructed from 360 mm o.d., 75 mm i.d. fused
silica capillary with thecolumn tip tapered to a 15-mm opening. The columns were
packed with 200 A 5 μm C18beads (Michrom BioResources, Auburn, CA) to a length of
10 cm. The mobile phase forgradient elution consisted of: a) 0.3% acetic acid, 99.7%
water, and b) 0.3% acetic acid, 99.7%acetonitrile. The flow through the column was split
pre-column to achieve a flow rate of 350nl/min.
All tandem mass spectra were acquired on a Thermo DECA XP Plus ion trap mass
spectrometer (Thermo Corp., San Jose, CA) with the needle voltage set at 3 kV. Ion
signalsabove a predetermined threshold automatically triggered the instrument to switch
from MS to MS/MS mode for generating fragmentation spectra.
The obtained MS/MS spectra were searched against the NCBI non-redundant protein
sequence database using the SEQUEST computer algorithm (Yates et al 1995).
Figure 3-5 show 2D-DIGE gels and spots patterns generated in DeCyder, and Table 2 and
3lists the proteins identified so far in the fungi and plant model systems.

15
MILESTONE 1
TASK 2: Characterization of fungal viral nucleic acids.
ii) Characterization of fungal Rhizoctonia solani viral nucleic acids.
a) Extraction of Total Double-stranded RNA and Gel Electrophoresis: Fungal
cultures used in the study are listed in Appendix B Table 1. In all 12 cultures were tested
based on culture characteristics including but not limited to phenotypic characteristics,
growth patterns, number of nucleic heterokaryon (2 nuclei) or homokaryon (1 nucleus),
and presence and absence of viral double-stranded (ds) RNA.
All such cultures were then cultivated in malt extract broth for 18-21 days as described
by Bharathan and Tavantzis (1990) for subsequent dsRNA extractions and analysis. Total
dsRNA were extracted from cultures grown concentrations in a liquid broth using the
procedure of Morris and Dodds (1979) with few modifications as described by Bharathan
et al., 2005. DsRNA eluted from CF-11 column were further treated with nucleases to
remove DNA and single–stranded RNA contaminants. Each DNAse and RNAse
digestion was followed by treatment with proteinase K for 30 min at 37 0C (Bharathan
and Tavantzis, 1990).
Nuclease Digestion of Total dsRNA from select R. solani isolates
Part of the extracted dsRNA was treated with DNaseI followed by S1 nuclease
(Fermentas) for 30 min each as recommended by the supplier. Aliquots (10 μl) of
digested and non-digested dsRNA were separated on 1% Agarose gel containing 0.5
μg/ml ethidium bromide for 1 h at 120 V in 1x TAE buffer and then visualized under
ultraviolet light.
Phenol Extraction Method of Total Nucleic Acids
About 100-400 mg mycelium was ground in liquid nitrogen using a mortar and pestle. To
the ground mycelia, 0.5 ml of 1x STE buffer containing 1.5% SDS and 20 mg/ml
Bentonite was added. The tubes were incubated at 60ºC for 10 min. One vol of Phenol :
chloroform : isoamyl alcohol (25:24:1) was added and the tubes were incubated at RT for

16
20 min with shaking. The tubes were centrifuged for 10 min at 7,818 x g, and the
supernatant was transferred to a new tube and re-extracted with Phenol: chloroform:
isoamyl alcohol as described above. Nucleic acids were precipitated from the supernatant
with 1 vol of isopropanol for 30 min at -70°C. The pellet was washed with 0.5 ml 70%
ethanol, dried for 5 min at 50°C, and dissolved in 100-300 μl ddH2O.
The purified dsRNA samples were fractionated electrophoresis in 1% agarose gels in
TAE buffer.
40 mM Tris, 2mM EDTA, 20 mM sodium acetate, pH 7.8) at 30 V/cm for 6-8 hours.
Following electrophoresis, gels will be stained with ethidium bromide and nucleic acid
bands will be visualized by UV trans-illumination and photographed using digital
documentation system.
b) Purification of viral particles of R. solani isolates
Four isolates of R. solani 303, 357, 301, and 386 were grown in malt extract broth for
minimum of 40 days, ~100 g of tissue was homogenized. 0.03 M Citrate PO4 buffer was
used for subsequent buffers containing (0.03 M NaPO4 dibasic anhydrous, 0.03 M citric
acid, anhydrous, pH 5.8). The homogenized tissue was subjected to extraction buffer
(0.03 M citrate PO4 buffer, 0.42% 0.5 M EDTA, 0.5% 2-mercaptoethanol, 0.1% Sodium
Diethyldithiocarbamate trihydrate). This mixture was filtered using miracloth and filtrate
was centrifuged at 11,000 g for 10 minutes at 4ºC using an Avanti Centrifuge J-25
Beckman Coulter low speed centrifuge. Supernatant was discarded and then high speed
pelleted at 113,000 g for 90 minutes at 4ºC using a Bechman Coulter Optima L-90 K
Ultracentrifuge. The pellet was then resuspended in pellet suspension buffer (0.03 M
Citrate PO4 buffer, 0.001 M dithiothreitol, 0.001 M EDTA). Once resuspended and rinsed
thoroughly with pellet suspension buffer, sample was stirred slowly overnight at 2-8ºC.
The solution was then high speed centrifuged through a sucrose cushion buffer (0.03 M
Citrate PO4 buffer, 25% sucrose and 0.001 M EDTA) for 4 hrs at 113,000 g. The
supernatant was discarded and pellet was resuspended in a total of 4 mL of 0.03 M
Citrate PO4 buffer and allowed to stir slowly overnight at 2-8ºC.
c) Extraction of double-stranded (ds) RNA from partially purified virus particles
17
This solution was then NET treated, 2x NET buffer (0.2 M NaCl, 1.0 M Tris, 0.002 M
EDTA) was added to equal volumes of purified virus and allowed to incubate at 65ºC for
10 minutes. Equal volume of phenol as purified sample was then added to the mixture.
The solution was vortexed adequately and then centrifuged for 10 minutes at room
temperature at high speed in a Biorad Model 16K Microcentrifuge. The aqueous phase
was collected being careful not to touch the interphase and equal volumes of phenol and
chloroform/isoamyl alcohol- 24:1 ratio, was added to the aqueous phase volume. The
solution was centrifuged for 10 minutes at room temperature at high speed in a
microcentrifuge. The aqueous phase was removed and added equal volume of
chloroform/isoamyl alcohol to aqueous phase volume. The solution was centrifuged once
more for 5 minutes at room temperature at high speed in a microcentrifuge. Aqueous
phase was collected and 1/10 volume of sodium acetate was added to each sample and
filled to the top of a microcentrifuge tube with cold absolute ethanol. These samples were
then stored overnight at -20ºC.
Characterization of dsRNA from various Reduced Complement (RC) and wild type
by Nucleic acid Hybridization.
The dsRNAs in gels from various RC isolates and wild type dsRNA were characterized
by PCR cDNA cloning, PCR sequencing, REAL-Time PCR, by probe preparation and
hybridization. Cloned dsRNA fragments (Bharathan et al., 2005) were also tested for
their sensitivity and specificity using specific RNA probe. . The representative variants
of the wild (heterokaryon) type fungal strains and several reduced (homokaryon)
complement (RC) strains of R. solani were characterized and their potential targets
identified at the molecular level for the presence of extra-chromosomal double-stranded
(ds) RNA and proteins. Briefly, about 11 dsRNA belonging to 11 different R. solani
isolates that included both wild type and RC strains were cloned and sequenced. A unique
strategy was developed for amplification and cloning different middle (M)-size dsRNA
fragments by synthesizing random primer-dN6 (5‘-
CCTGAATTCGGATCCTCCNNNNNN-3‘). Full-length PCR products representing
several genomic segments were cloned into p-Drive cloning vector (Qiagen) and
sequenced. The sequences were determined using Sanger sequencing with an ABI 3730

18
sequencer (Retrogen Inc. San Diego, CA). The sequences were compared for similarity
against the non-abundant sequence databases of EMBL, EU, using the BLAST algorithm.
R-PCR Conventional PCR of purified dsRNA from R. solani
Prior to PCR, the DNA in RNase treated dsRNA was further removed by with gDNAse
treatment (Qiagen). Reverse Transcription was done by adding Quantiscript Reverse
Transcriptase, dN6 primers (Qiagen) with few modifications Appendix B Figure 1 and
Figure 2
Because of the considerable variation in size, sequence heterogeneity, and complex
structures associated with the nature of dsRNA several protocols were identified and
modified or cDNA synthesis and cloning. The different manufacturers and types were
used individually or in combination as indicated below. They included
i) Qiagen ii) BIO-RAD iii) Ambion
iv) Fermentas v) Combination of Ambion-BIO-RAD
Random PCR (rPCR)
Up to 100 ng of a mixture of the 5 dsRNA segments were mixed with 0.25, 0.5, 1 or 2
μM of the up-dN6 primer, incubated at 99ºC for 2 min and quenched on ice for 5 min.
Two Units of RevertAid™ Reverse Transcriptase, 50 mM Tris-HCl (pH 8.3 at 25°C), 50
mM KCl, 4 mM MgCl2, 10 mM DTT, 1 mM dNTPs and 20 U of RiboLock™ RNase
Inhibitor were added, and the mixture was incubated at 43ºC for 1 h. At this stage, the
cDNA was used either directly in the subsequent PCR or for the synthesis of second
strand cDNA as follows. The cDNA was heated at 99°C for 2 min then quenched on ice
for 5 min. Ten U of the Klenow Fragment, 50 mM Tris-HCl (pH 8.0 at 25°C), 5 mM
MgCl2, 1 mM DTT, 0.5 mM dNTPs and ddH2O to a final volume of 50 μl were added.
The reaction was incubated at 37ºC for 30 min. The dscDNA was purified with the
NucleoSpin® Extract II, eluted in 30 μl ddH2O and stored at -20°C till use. To test the
sensitivity of the rPCR, 10-8-10-1 μg were reverse transcribed in the presence of 2 μM of

19
the universal primer-dN6 and directly amplified as described above without the Klenow
Fragment reaction.
PCR Amplification
Amplification of the dscDNA took place in a reaction mixture containing; 1 μl of cDNA,
1x Taq Buffer advanced, 1.5 U of Taq DNA Polymerase (5 PRIME), 2 mM MgCl2, 0.25
mM dNTPs and 1 μM of the UP primer. The thermal cycling was performed in a
Biometra T1 thermo cycler as follows: one cycle at 94ºC for 2 min, 65°C for 1 min and
72°C for 1 min, then 35 cycles of 94ºC for 40 sec, 52ºC for 30 sec and 72ºC for 3 min
followed by a final extension step at 72ºC for 8 min.
Single Primer Amplification Technique (SPAT)
Primer PC3 described by Potgieter et al. (2002) was ligated to the 3` ends of the dsRNA
as follows. About 250 ng of PC3 primer were ligated to 200 ng of a mixture of dsRNAs
at a molar ration of >40:1. The ligation mixture included: 50 mM HEPES/NaOH,
pH 8.0, 20 mM MgCl2, 0.01% BSA, 1 mM ATP, 3 mM DTT, 10% (v/v) DMSO, 20%
(w/v) (PEG)6000, 20 U of Ribolock Rnase inhibitor and 30 U of T4 RNA ligase in a final
volume of 30 μl. The ligation components were incubated at 37°C for 6 h then at 18°C
descending at a rate of 2°C per h down to 12°C. The dsRNA was purified with the
NucleoSpin® Extract II kit, eluted in 40 μl ddH2O, and concentrated in the SpeedVac
vacuum concentrator (Savant Instruments Inc.USA) for 10-15 min.
In another treatment, the PEG6000, DMSO, BSA, and Ribolock RNase inhibitor were
omitted from the ligation mixture and the reaction was incubated overnight at 16°C. The
primer-ligated dsRNA was purified from excess primer with the NucleoSpin® Extract II
and used in the subsequent RT-PCR. 2. The reverse transcription, removal of the RNA
and annealing of the cDNAs were carried out basically as described for the FLAC
method below with one exception: that is about 100 ng of the Oligo (dT)18 were used to
prime the PC3-dsRNA in the cDNA synthesis reaction.
Full length Amplification of cDNA (FLAC)

20
About 250 ng of PC3-T7 loop primer described by Potgieter et al., (2009) were ligated to
200 ng of a mixture of dsRNAs as described for the SPAT method above. The purified
primer-ligated dsRNA was denatured at 98°C for 2 min in the presence of 1M betaine
and 2.5% (v/v) DMSO then quenched on ice for 5 min. The cDNA synthesis reaction
contained: 50 mM Tris-HCl (pH 8.3 at 25°C), 75 mM KCl, 3 mM MgCl2, 10 mM DTT,
1 mM dNTPs, 20 U of Ribolock RNase inhibitor and 400 U of RevertAid™ Premium
Reverse Transcriptase. The reaction was incubated at 50°C for 1 h followed by 15 min at
55°C. RNA was digested with 0.1 M NaOH at 70°C for 20 min, followed by the addition
of 0.1M Tris-HCl pH 7.5 and 0.1 M HCl to neutralize the reaction. The cDNA was then
incubated at 68°C for one h followed by 1-2 h at 65°C.
The amplification mixture, calculated for a final volume of 25 μl, contained: 5 μl of
cDNA, 1x of the provided DNA polymerase buffer, 320 μM of each dNTP, 2 mM MgCl2
and 1.25 μM of PC2 primer and 2.5 U of one of the following DNA polymerases.
Phusion® High-Fidelity DNA Polymerase with Phusion GC Buffer, Platinium DNA
polymerase, Go Taq DNA polymerase with the colorless buffer, 5PRIME Taq
polymerase with advanced buffer set, or Long PCR Enzyme Mix with the long PCR
buffer. The mixtures were incubated in a Bio-RAD T professional thermo cycler at 72°C
for 2 min followed by 95°C for 2 min and then subjected to 35 cycles of 95°C for 25 sec
with an increment of 1 sec per cycle, 65°C for 30 sec and 68°C or 72°C (as recommended
by the manufacturer) for 5 min followed by a final step of 72°C for 10 min.
Direct ligation of dsRNA into pJET1.2 and pGEM®-T vectors
About 200 ng of a mixture of the dsRNAs were ligated into the E. coli cloning vector
pJET1.2 (Fermentas) or into pGEM®-T (Promega) at a molar ratio of about 4:1
(insert:vector). The ligation mixture contained 2.5 weiss U of T4 DNA ligase and 25 U of
T4 RNA ligase, 1 mM ATP, 5% (w/v) PEG6000 and 40 mM Tris-HCl, 10 mM MgCl2,
10 mM DTT in a final volume of 15 μl. The reaction was incubated at 14ºC for 24 h. In
another experiment the reaction was incubated at 14°C for 24 h then at 4°C for extra 24
h. Ligated plasmids were transformed into XL-1 blue E. coli competent cells by means of
heat shock at 42°C for 1 min. The obtained clones were screened by means of either PCR

21
or restriction digestion. Moreover, part of the positive clones was sequenced. The
experiment was repeated 3 times.
Cloning and Sequencing:
PCR products were purified from the agarose gel or directly from the PCR tube with the
NucleoSpin® Extract II, cloned into pGEM®-T cloning vector or pJET1.2 (Figure 3)
and transformed into E. coli competent cells either by heat shock or by electroporation as
described in the following sections. The sequences were determined using Sanger
sequencing with an ABI 3730 sequencer (Retrogen Inc. San Diego, CA). The sequences
were compared for similarity against the non-abundant sequence databases of EMBL,
EU, using the BLAST algorithm.
Preparation of electro-competent cells
About 1-2 ml of E. coli XL-1 blue cells were cultured in 500 ml LB medium under
shaking at 37ºC until the optical density of the culture at wavelength of 600 measures
0.5- 0.6. The culture was incubated on ice for 20 min and then the bacterial cells were
pelleted at 2,000 x g at 0-2°C for 15 min. The pellet was resuspended and washed two
times with 250 ml and a third wash with 10 ml of ice-cooled ddH2O. Each of the washing
steps was performed at 3,000 x g for 15 min. The pellet was resuspended in 800 μl of 7%
DMSO, divided into 50 μl aliquots, frozen in liquid nitrogen, and stored at -80ºC
Preparation of Chemical Competent cells
E. coli NM522 was cultured on LB-agar overnight at 37°C. Several colonies were
transferred into 1 l Erlenmeyer flask with 30 ml of SOB supplemented with 20 mM
MgCl2 and cultured until the OD550 reaches ~0.5. The culture was transferred into a
sterile glass-tube and incubated on ice for 15 min. The tube was centrifuged at 1500 x g at
4°C for 10 min, and then the pellet was resuspended in 10 ml TFB buffer, and incubated
on ice for 10 min. The suspension was centrifuged as described above, and then the pellet
was resuspended in 4 ml TFB buffer, and incubated on ice for 10 min. DND solution
(140 μl) was added to the suspension, mixed gently, and incubated on ice for 15 min. The

22
last step was repeated once. The competent cells were transferred (200 μl aliquots) into
Eppendorf tubes and used immediately for transformation.
Transformation of Competent cells
Chemical competent cells (50 μl) were mixed with the cloning vector an Eppendorf tube
and heat-shocked at 42°C for 1 min in a water bath. In case of electrocompetent cells, the
cloning vector was purified from salts after the ligation reaction by ethanol precipitation.
About 20-30 μl of the competent cells were mixed with the purified vector and
electroporated at 1250 V for 4-6 msec.
After the heat- or electric-shock, the tubes were incubated on ice for 2 min, then 700 μl of
SOC medium were added, and the cells were cultured for 1 h at 37°C. The bacteria were
cultured overnight on AIX-LB agar (100 – 150 μl/plate) at 37°C. White colonies were
screened by PCR, using vector-based primers flanking the cloning site. Colonies with
positive PCR results were cultured in LB-amp overnight at 37°C and plasmids were
purified as described in the following section.
MiniPreps and Restriction Digestion
Plasmids were purified from transformed bacterial cultures using the Fermentas GeneJEt
Plasmid Miniprep Kit. Restriction digestions with the appropriate enzymes were
performed according to the manufacturer instructions.
RESULTS
a) DsRNA profiling :Characterization of Total nucleic acid purified by CF-11
cellulose column
Double-stranded RNA was consistently detected in all the isolates of the R. solani tested.
Two isolates of R. solani t that were homokaryon (single nuclei) TOM7 and RS 29.3 did
not have any dsRNA associated and one isolate that was wild type heterokaryon (2
nuclei) also did not have any dsRNA (Table 2).
Agarose gel electrophoresis The sizes of the dsRNA were classified as Large (L) (>4.6
kilo-bases); Medium (1.1-4.5 kilo-bases); and Small (<1.0 kilo-bases) Figure 7 and Table

23
2. For the size distribution of dsRNA within each isolate of R. solani tested please refer to
Figure 7.
The double-stranded RNA nature of the nucleic acid was established by nuclease
treatment. All dsRNA fragments were resistant to DNAse and RNAse under high sal
conditions (figure 6). Only nuclease treated highly gel purified dsRNA were further used
for cloning and sequencing reactions of the project. Moreover, the output of our effort to
profile viral dsRNA is shown in the Appendix B Figure 4 and Figure 5; dsRNA nature of
viral nucleic acid in Figure 6; size distribution of different dsRNA in Appendix B Figure
7, Figure 8 and Table 2.
Only mid-size fragments of the dsRNA were further used for dsRNA characterization.
Results:
b) DsRNA profiling from Virus-like Particles (VlP’s)
Wild type 303, RS357, and RS386 were all tested. Each of these isolates were found in
the dsRNA from extraction procedure using CF-11 cellulose column chromatography
were found to contain dsRNA. These isolates were subjected to the virus purification
procedure as described elsewhere.
WT303, RS357, and RS386 were found to still contain mid size fragments which
corresponded to the dsRNA isolated by the dsRNA extraction procedure Appendix B
Figure 6 lanes 2, 3, 4 and 5. The band sizes of each of the tested isolates, WT303 (2.089
kb), RS357 (2.089 kb), and RS386 (1.962 kb) were found to correspond to the same
number of base pairs seen when dsRNA was extracted by the CF-11 cellulose column.
It is consistent that fungal isolates that have viral infections have m-size dsRNA
fragments that range between 1.1 and 4.5-kb.
c) Characterization of dsRNA from various Reduced Complement (RC) and wild
type by PCR Cloning Nucleic acid Hybridization.
The representative variants of the wild (heterokaryon) type fungal strains and several
reduced (homokaryon) complement (RC) strains of R. solani (Table 2) were
24
characterized and their potential targets identified at the molecular level for the presence
of extra-chromosomal double-stranded (ds) RNA and proteins. Briefly, about 11 dsRNA
belonging to 11 different R. solani isolates that included both wild type and RC strains
were cloned and sequenced. A unique strategy was developed for amplification and
cloning different middle (M)-size dsRNA fragments by synthesizing random primer-dN6
(5‘-CCTGAATTCGGATCCTCCNNNNNN-3‘). The r-PCR products generated for
representative dsRNA samples from the isolate 303 and 357 are shown in Figure 7. Full-
length PCR products representing several genomic segments were cloned into p-Drive
cloning vector (Qiagen) and sequenced. The sequences were determined using Sanger
sequencing with an ABI 3730 sequencer (Retrogen Inc. San Diego, CA). The sequences
were compared for similarity against the non-abundant sequence databases of EMBL,
EU, using the BLAST algorithm. Several clones were picked; preliminary sequence
comparison of some mycoviral dsRNA suggests 26-30% sequence identical to coat
protein of Carrot Cryptic Virus, Beet Cryptic Virus, and the capsid protein of the White
Clover Cryptic Virus. In order to test for sensitivity and specificity, probes were
prepared from cloned dsRNA fragments of the wild-type dsRNA and hybridized to
dsRNA and cloned DNA from both the other wild-type and RC strains of R. solani.
Probes were dual labeled (5‘FAM/3‘BHQ-1) and the design for qPCR assays was done
using Biosearch Technologies (Novato, CA) Real Time Design™ software. Thus, our
discovery platform for the first time has developed a protocol to generate PCR products
from unknown dsRNA sequences belonging to the genome of pleomorphic viruses
infecting the R. solani isolates that are heterokaryon and a homokaryon.
Several R. solani isolates belonging to both the heterokarytic and reduced genome
complements but containing M-sized dsRNA fragments were cloned. The conditions for
rPCr and PCR were optimized depending on the isolates and the size of the dsRNA. For
example One being dsRNA from 357 and the other was EGR 4. The isolate 357 is a
heterokaryon with two nuclei and EGR-4 is a homokaryon with one nuclei generated
from a basidiospore. The dsRNA nature of viral M-size fragment purified from 357 and
EGR-4 was established by nuclease treatment (Figure 8 lanes 1 and Figure 9, lanes 1 and
2). Single size dsRNA of size 2.287 kilo base (kb) was consistently purified from 357,
where as 3.301 kb dsRNA was detected in EGR-4 Figures 9 (b) and 8 (b), respectively.

25
All such highly purified nuclease treated dsRNA were subsequently used reverse
transcription PCR and cloning. The dsRNA was resistant to DNAse and RNAse under
high salt condition. The primer design and experimental protocol for optimum PCR
amplification is shown in Figures 11 and 12. The optimum concentration was found to be
2.0 mM for 357 (data not shown), where as for EGR-4 it was 2.0 and 2.5mM (Figure 16,
lanes 2 and 3, respectively. Little or no PCR products were detected at higher
concentrations (Figure 16 lanes 4, 5, and 6).
We have for the first time shown the amplification of viral-dsRNA from R. solani that are
both hetrokayon (reduced complement) and homokaryon (wild type). Thus, our discovery
platform for the first time has developed a protocol to generate PCR products from
unknown dsRNA sequences belonging to the genome of pleomorphic viruses infecting
the R. solani isolates that are heterokaryon and a homokaryon.
The PCR products thus generated were cloned into pDrive Cloning vector (Figure 3)
supplied in linear form with a U overhang at each end which ligates with high specificity
to the PCR product. In all over 600 clones were generated for nearly all the 11 isolates of
dsRNA viruses clone. All the white colonies that were selected for the isolates RS 113,
RS 114, and T2 clones are shown in Figure 357 and 5 clones for the homokaryon EGR-4.
The results from the enzyme digests of selected 7 and 5 clones from 357 and EGR-4 are
shown in Figure 11, 12 , and 13 along with the electropherogram of the cloned digests.
Several clones were selected that had varying sizes and were sequenced by (Retrogen,
San Diego, CA, USA). The sequences were determined using Sanger sequencing with an
ABI 3730 sequencer (Retrogen Inc. San Diego, CA). The sequences were compared for
similarity against the non-abundant sequence databases of EMBL, EU, using the BLAST
algorithm.
RESULTS:
Mini Preps and Restriction Digestion: In all plasmids were purified from over 600
clones and restricted enzyme digested. The results from select clones generated from
PCR products from isolates 113, 114, T2, 303, 357, and EGR4 are shown in figures 11,
12, and 13 with inserts showing the electropherogram for each clone. The sizes were
verified using the bioanalyzer data before sequencing. All such purified plasmids were

26
further tested for bioinformatic studies and experimental validation of novel and
conventional approaches to quantitative real-time PCR data analysis (milestone 2, task 2).
They included:
i) Specificity of the primers
ii) Sensitivity of detection
iii) Accurate and statistically verified quantification of relative template
abundance
iv) High PCR efficiency for more accurate quantification of the target nucleic
acid using virus specific probe.
Primers and Probe Design from Cloned dsRNA Fragments: Based on the sequence
data the Primers and probes were designed using the software on Bioline products for
the isolates 303, 357, 386, EGR-4 and T2 Containing R. solani Virus Isolates
Direct Real-Time PCR Using Probes Designed to Detect Specific Viral dsRNA from
Cloned rPCR Products
SensiFAST Probe One Step Kit (Bioline)
1. The primers and probes were diluted Dilute Primers and Probe to 1:10 from the
stock (100uM).
2. A typical reaction mixture consisted of 2X SensiFAST Probe One-Step Mix,
Forward Primer (10 uM), Reverse Primer (10 uM); Probe (10 uM); Reverse
transcriptase; RiboSafe RNase Inhibitor; Template plasmid or dsRNA. All
brought to a final volume of 50(µL).
3. The typical REAL-TIME PCR Running cycle was programmed for :
1 cycle 45 oC 10 minutes
1 cycle 95oC 2 minutes
40 cycle 95oC 5 seconds
60oC 60 seconds
SensiMix II Probe Protocol on Real-Time (Bioline)
1. The needed template mix (Plasmid DNA) was thawed, mixed and centrifuged for
few seconds and kept on ice
2. The primers and probes were diluted to 1:20 from the stock (100uM)

27
3. A typical Reaction Mixture: A typical reaction mixture consisted of 2X Sensi Mix
II Probe, Forward Primer (10 uM), Reverse Primer (10 uM); Probe (5 uM);
Template plasmid. All brought to a final volume of 50(µL)
4. The typical REAL-TIME PCR Running cycle was programmed for :
1 cycle 95oC 10 minutes
30 cycle 95oC 10 seconds
60oC 60 seconds
RESULTS:
Validation of the Primer and Probe for target nucleic aid detection by REAL-TIME
PCR Analysis
The specificity of the cloned fragments were tested by PCR amplification using specific
primers and probe design for Real-Time PCR hybridization. Based on the sequencing
data the forward and reverse primers were designed probes were synthesized and the type
of probe and sequence is shown in Table 3.
Real-time PCR further confirmed these results (figure 14). The top panel for 357 suggests
the Tm of the PCR product to be 86.9 0C with a cT value of 33. The primer sequence
used was generated from the rPCR products of the virus isolate 357. The forward
sequence and reverse sequence is shown in Table 3.
The results from EGR-4 suggests the TM of 87.4 with a cT value of 33. All such PCR
products were at various times analyzed by gel electrophoresis confirming the PCR
products data not shown. The primers designed from the cloned fragment of the dsRNA
from 303, 357, and 386 showed a great degree of sequence relationship. However, there
were high degree of specificity of the primers and probes for detection of the homologous
dsRNA. These results were confirmed by the amplification efficiency.
Real-time PCR further confirmed these results Figure 14. The top panel for 357 suggests
the Tm of the PCR product to be 86.9 0C with a cT value of 33. The results from EGR-4 (
Figure 16) suggests the TM of 87.4 with a cT value of 33. The probe sequence comes fro
the virus isolate 357 and the probe sequence is shown in Table 3.
28
In attempts to validate the specificity of the primers and probes from select isolates
several experiments were designed to address amplification efficiency by establishing
standard curve by performing series of dilutions of the template nucleic acids. These
dilutions were then amplified with specific primers. Based on the analysis of the
amplification profile position the efficacy of the approach is still limited by the necessary
assumption that all samples are amplified with the same efficiency as predicted by the
standard curve. So we took an approach for determining amplification efficiency by
measuring the fluorescent readings from individual amplification process.
Various dilutions of the templates were done and amplified using the primers sequence
from the isolate 357. The cT values ranged from 3 to 33 (Figure 17). In all about 57
clones were tested. The cT value of the primer alone was 29.33 (Figure 17). Similar
results were obtained with primer 357 when tested with different target nucleic acid
(Figure 18). The cT value of the primer alone was close to negative 29.33. This appeared
to be the limit of detection.
Amplification Efficiency: I addition to the original data from the BIOFORCATION
TAB, a condition was used for further analysis of the data. The condition states that only
values of the samples with the melting curve as 1 shall be used for calculations. This
indirectly states that any sample with melting curve of less than 1 has no significant
relationship. With these calculations the results got even more significant. Similar
computations were made which included Rn slope, amplification efficiency, and the
intercept. These results are depicted in the figures 19 and 20.
The intercepts plotted for 303, 386, and 357 revealed the efficiency of 92%, 98.5%, and
98.3% , respectively (Figure 19).The intercepts plotted for EGR-4, 113, and 114 revealed
the efficiency of 95.6, 85%, and 83%, respectively (Figure 20). These results suggest that
there is strong relationship for comparison in these target nucleic acids.
To Test the Variations on Ct values with the increase in the Annealing
Temperatures

29
To Test the Variations in Rn values with the increase in the Annealing Temperatur
Validation of dSRNA probes prepared from the virus isolates 386, 357, 303. Probes to
detect target nucleic acid molecules (viral dsRNA from) 386. The cTFAM ranged
between 7 and 34. The negative target cT FAM was 34.18. The target nucleic with the
highest dilution had a cTFAM value 22.11 (Figure 22 , 23, 24, and 25). These results
suggest that the signature nucleic acid for detection target nucleic acid is specific and
sensitive enough to detect very low concentration of the target nucleic acid.
Validation of dSRNA probes prepared from the virus isolate 357 to detect target nucleic
acids from different isolates like 386, and 303 (figure 26). In all such study the probes
from 357 were specific with itself (homologous) the CtFAM was between 7 and 17. It
could also detect target nucleic acids from different other targets with similar specificity
like in 386 target the CtFAM was as low as 3.83 and for the atrget nucleic acid from 303
it was as low as 7.33.

30
Milestone 2: Characterization of fungal and viral proteins. This milestone will achieve
the goal of performing proteomic analysis of R. solani virus proteins with the aim of
identifying protein signatures that can be used to discriminate between the viral and
fungal models. This milestone is prerequisite for identification of proteins that will be
eventually used to validate using the xMAP technology.
Task 2: Characterization of fungal and viral proteins for the development of a
multiplexed assay
Experience teaches us that the use of multiple proteomic platforms with complementary
strengths will improve the chances of realizing the specific aims of characterizing the
proteome of the model fungi and viruses (Pastwa et al 2007). Thus, our proteomics
analysis plan includes the use of 2D-DIGE, LC/MS/MS and xMAP technologies for
discovery, identification and validation of the proteomic signature of the model
organisms. As shown in Appendix C Table 1 different fungal samples were be analyzed
using proteomics technologies.
The 2-D work-flow process for protein target identification is shown in Figure 1
Appendix C
Methods and Materials
Sample Preparation. 400 µL of lysate was precipitated using ToPrep Kit (ITSI-
Biosciences, Johnstown, PA) using manufacturer‘s recommendation and the pellet was
re-suspended in 2D gel electrophoresis compatible lysis buffer pH 8.5 (30 mM Tris-HCl,
2 M Thiourea, 7 M Urea, 4% (w/v) CHAPS and 1% NP40). Samples concentration was
determined with ITSIPREP ToPA Kit (Bradford Assay, ITSI-Biosciences, Johnstown,
PA).
Protein Labeling. Proteins (50 µg) were labeled with CyDyes DIGE Fluors (GE
Healthcare, Bucks, UK) according to the manufacturer's recommended protocol (Cy3 or
Cy5 fluorophores for samples, and Cy2 was used as the internal standard). Internal
standard is a pooled sample of an equal amount of all samples in an experiment. Equal
amounts of samples (50 µg each) were labeled with Cy5 and Cy3, respectively. The

31
internal standard labeled with Cy2 was added to the mixture and the volume was brought
at 450 µL with 1X Rehydration Buffer (4% (w/v) CHAPS, 8 M Urea, 1 % (v/v) BioLyte
Buffer (BioRad, CA, USA), and 13 mM DTT).
2D Gel Electrophoresis. The first dimension, isoelectric focusing (IEF) was performed
in a 24-cm Immobiline DryStrip (BioRad, CA, USA) with a linear pH 3-10 gradient
using Ettan IPGphor II (GE Healthcare), at 20 ˚C. The strips were loaded by rehydrating
the strips for 12 hrs at 30 volts with final volume of 450 µL containing Rehydration
Buffer and labeled sample. The focusing of proteins on the rehydrated IEF strips was
performed in 5 steps: 1) 200 V for 1 hr, 2) 500 V for 1 hr, 3) 1000 V for 1 hr, 4) 3 hr
gradient from 1000 to 8000 V, and 5) finally held at 8000 V until 65,000 total volt hours
was accumulated. Prior to second dimension, the strips were equilibrated and reduced for
10 minutes in an Equilibration Buffer (50 mM TrisCl, pH 8.8, 6 M Urea, 30 % (v/v)
Glycerol, 2 % (w/v) SDS) containing 0.5 % (w/v) DTT. The strips were reequilibrated
and alkylated at room temperature on a shaker for 15 minutes in Equilibration Buffer
containing 4.5 % (w/v) Iodoacetamide. The focused strips were loaded onto a 24 cm x 20
cm, 12.5% SDS-PAGE gel, and run for 4 hours at 16 Watts per gel.
Gel Image Analysis. The separated proteins labeled with Cy3 or Cy5 fluorophores, and
Cy2 (the internal standard) were scanned and detected in gels using Typhoon Digital
Imager with 3 different wavelengths. After detection, the images were analyzed using
DeCyder analysis software (GE Healthcare), and candidate protein spots that were
differentially expressed at a 2-fold or greater threshold were annotated. Differential
Analysis Software (DIA) module in DeCyder software is used to perform protein spot
detection and quantitation based on the area, slope, volume, and peak height of the
proteins and the filtration is made to eliminate the spots that don‘t indicate the presence
of a protein in a gel. The Biological Variation Analysis (BVA) module is used to
perform gel to gel matching of spots, allowing quantitative comparison of protein
expression across multiple gels which are matched to a Master gel (the gel with the most
spots). Spots considered for picking were chosen based on a t-test of 0.05 or less and an
average spot ratio of 2.0 or higher.

32
Protein Identification. The gels were stained with Sypro Ruby (Invitrogen, USA) and
all protein spots that were processed using an Ettan Spot Handling Workstation (GE
Healthcare). Picked gel plugs were destained in 50 % Methanol/20 mM Ammonium
Bicarbonate. De-stained gel plus were reduced in 10 mM DTT / 20 mM ammonium
bicarbonate for 15 minutes at 55 °C and then alkylated in 20 mM IAA / 20 mM
Ammonium Bicarbonate for 30 minutes at room temperature. The dried plugs were
rehydrated in 20 mM Ammonium Bicarbonate containing 1 ng/µL Trypsin Gold, Mass
Spectrometry Grade (Promega, USA) and incubated overnight at 37 °C. After digestion,
50 % Acetonitrile/ 0.1 % Trifluoroacetic Acid was added to the plugs and incubated for
10 minutes at room temperature. The extraction solution was transferred to a clean tube
and the above mixture was added again and incubated for 10 minutes. The two extraction
solutions were combined, dried in the tube at 45° C for 2 hours and then analyzed by
LC/MS/MS and database search.
Mass Spectrometry. The mass spectrometry used was a Thermo Finnigan LCQ Deca XP
Plus operated in the positive ion mode with the spray voltage set at 1.8 kV. A Thermo
Finnigan Surveyor MS Pump was used to deliver a linear acetonitrile gradient from 2 to
30% B over 30 minutes. Solvents consisted of water with 0.1% formic acid on channel A
and acetonitrile with 0.1% formic acid on channel B. The MS Pump was connected to a
PicoFrit column (New Objective) with a micro tee and the nanospray column was
operated at a flow rate of 0.5 uL per minute. A ―Top Three‖ method was a full MS scan
from m/z 400-1500 was followed by MS/MS scans of the three most abundant ions to
generate the experimental MS/MS spectra. Bioworks 3.3.1 SP1 software (Thermo
Finnigan) was used to search the most recent NCBI non-redundant database with the
following parameters: precursor mass tolerance of 1.4 Da, fragment ion tolerance of 1.0
Da, and trypsin was the selected enzyme. Proteins were identified when two or more
unique peptides had X-correlation scores above 1.5, 2.0, and 2.5 for respective charge
states of +1, +2, and +3 and the delta CN value was greater than 0.1.
DeCyder is an automated image analysis software suite which enables detection,
quantitation, matching and analysis of Ettan DIGE system gels Differential Analysis

33
Software (DIA) and Biological Variation Analysis (BVA) are the two modules of the
DeCyder software.
DIA is used to perform protein spot detection and quantitation. A volume threshold of 2.0
fold or higher is used to highlight the spots that are differentially expressed between
compared samples. Based on the area, slope, volume, and peak height of the proteins a
filtration is made to eliminate the spots that don‘t indicate the presence of a protein in a
gel.
The BVA module is used to perform gel to gel matching of spots, allowing quantitative
comparison of protein expression across multiple gels. For comparison purposes, an
internal standard was used in the experimental design. This internal standard is a pooled
sample of an equal amount of all samples in an experiment. The BVA module allows for
the quantitative analysis across the multiple gels in the experiment. All gels in an
experiment are matched to a Master gel (the gel with the most spots). Spots considered
for picking were chosen based on a t-test of 0 0.05 or less and an average spot ratio of 2.0
or higher.
Mass Spec Analysis
The mass spec analysis were also done on the spots that were exclusive to Non-mutated
parent only. The peptides for each protein is shown in the Table
These procedures included
Sample Cleanup:
•The gels were scanned on a Typhoon Digital Imager with 3 different wavelengths.
•The images were analyzed using DeCyder analysis software (GE Healthcare), and
candidate protein spots that were present only non mutated parent were picked. These
spots were annotated and analyzed using LTQ.
•Eluates were dried down using a speed vac and reconstituted in 2% Acetonitrile with
0.1% Formic acid.

34
•Samples were loaded onto a PicoFrit C18 nanospray column (New Objective) using a
Thermo Scientific Surveyor Autosampler operated in the no waste injection mode.
Mass Spectrometry Conditions
•A linear Acetonitrile gradient was used to separate the tryptic peptides using the
following conditions: at time 0 the Acetonitrile concentration was 2% and increased to
50% over 30 minutes with a flow rate of 300 nanoliters per minute at the tip and a 90%
Acetonitrile wash was used at the end of the gradient for five minutes.
•A Thermo Scientific LTQ XL mass spectrometer was used for peptide sequencing using
the following parameters: spray voltage was 1.8 kV, ion transfer capillary was set at 180
degrees Celsius, and a data-dependent Top 5 method was used where a full MS scan from
m/z 400-1500 was followed by MS/MS scans on the five most abundant ions.
Methods for Identifying Proteins by Mass Spectrophotometry
Trypsin digested proteins are dried down in a vacuum concentrator and resuspended in
20uL of 2% Acetonitrile with 0.1% Formic acid. The peptide solutions are placed in
glass autosampler vials and loaded into a Surveyor Autosampler Plus (Thermo
Scientific)operated in the no-waste injection mode. After the sample loop is filled, the
valve is switched into the HPLC flow path and the sample is swept into a PicoFrit column
(New Objective, ProteoPep II C18, 0.075mm internal diameter X 100mm length) with a
flow rate of 300 nanoliters per minute. A linear Acetonitrile gradient is used to separate
the peptides based on their hydrophobicity using the following conditions:
at time 0, the Acetonitrile concentration is 2% and increased to 30% over 30 minutes. At
30.1 minutes the Acetonitrile concentration is increased to 90% and held for five minutes
to wash the column. After the high organic wash, the pump is once again set to 2%
Acetonitrile and allowed to run for 15 minutes for column re-equilibration. The peptides
are eluted from the column into an LTQ XL mass spectrometer (Thermo Scientific). The
spray voltage is set at 2.0kV and the ion transfer capillary is set to 180 degrees Celsius.

35
Database Search Parameters
Raw data files were searched against species-specific databases from NCBI using
Proteome Discoverer 1.2 (Thermo Scientific) and the SEQUEST algorithm.
•Databases containing proteins from Genus Ustilago , Genus Fusarium, Genus Botrytis
and Genus Rhizoctonia were searched using the following parameters: Trypsin as the
selected enzyme with a maximum of two missed cleavages and a static modification of
Carbamidomethyl Cysteine (+ 57.02 Daltons).
Proteins were identified when two or more unique peptides had X-correlation scores
greater than 1.5, 2.0, and 2.5 for respective charge states of +1, +2, and +3 and the delta
CN score was greater than 0.1.
Protein Target Identification: Here we used a combination of 2d-dige and nano-
lc/ms/ms technologies to characterize the model organisms at the protein level. the work
flow process is illustrated in Figure 1.
As shown in Figures 2, 3, 4, and 5 the 2D-DIGE system successfully revealed proteins
characteristic of each model system. In fact several proteins were clearly detected in all
isolates of R. solani. Models tested (Figure 2-5).
Protein Spot Analysis from Different Isolates of the R. solani Fungi: It is not unusual for
host cell to respond differentially to viral infections. RS 29.7 does not have a virus and is
a Reduced Complement isolate derived from parent isolate RS 29which is infected with
the virus that has a M-sized dsRNA fragment. There are some proteins that are
differentially expressed. Spot statistics data showed 2-fold increase or greater spot ratio
threshold Figures 6 and 7). The mutant type RS29.5 had higher protein content that
increased with no viral infections 114 sots (7.3%) compared to the wild type. Moreover
when these spots were compared for their uniqueness—position on the gel, abundance,
and spot volume ratio RS 29.5 had 88 and wild type parent isolate had only 10unique
spots.

36
In some models the proteins were up regulated 29.3 A had two unique proteins Figure 7
left panel and in RS29 no unique proteins were found (Figure 8)
In fact some of the models had differential protein expression. Some of the proteins are
up-regulated (Figure 9 and Table insert and Figure 10 Table insert). This relationship is
significant since both the cultures are have reduced genome complement and are
homokaryons. TOM7 isolate does not have any virus associated dsRNA and infect
tomato plants where as T2 is infected with a Mid-size dsRNA and the fungus infects
tobacco crop plants. It is not clear if these differences in the fungal genome content and
the virus content contribute to virulence. However, definitely the difference in protein
and the # of unique protein might have significant role in the infection process.
Our discovery platform was also able to detect proteins that show differential expression
in the plant (Appendix A) and fungus in response to virus infection. DeCyder automated
image analysis software suite which enables detection, quantitation, matching and
analysis of Ettan DIGE system gels Differential Analysis Software (DIA) and Biological
Variation Analysis (BVA) are the two modules of the De Cyder software was used. DIA
is used to perform protein spot detection and quantitation. A volume threshold of 2.0 fold
or higher is used to highlight the spots that are differentially expressed between compared
samples. Based on the area, slope, volume, and peak height of the proteins a filtration is
made to eliminate the spots that don‘t indicate the presence of a protein in a gel.
The Biological Variation Analysis (BVA) module was used to perform gel to gel
matching of spots thus allowing quantitative comparison of protein expression across
multiple gels. For comparison purposes, an internal standard was used in the
experimental design. This internal standard is a pooled sample of an equal amount of all
samples in an experiment. All gels in an experiment are matched to a Master gel (the gel
with the most spots). Spots considered for picking were chosen based on a t-test of 0 0.05
or less and an average spot ratio of 2.0 or higher. Graph view 29-3.A vs. TOM7- up
regulated in 29-3.A. Spot number 1988; T-test 0.014 Volume ratio 30.33 (Figure
12). The Graph view of 29-3.A vs. TOM7- down regulated in 29-3.A . The Spot number

37
is 1643 and the T-test 0.030 Volume ratio -18.42 (Figure 13). The Graph view 29-3.A
vs. TOM7- down regulated in 29-3.A; Spot number 1643 T-test 0.030
Volume ratio -18.42. The graphical view of the standardized log abundance of
proteins are shown in Figures 26 and 27. This is based on spot volume calculated by the
DIA module. The spot abundance between gels is standardized using the internal
standard. The dots on the graph are the actual standardized log abundance of the spot on
a gel. The blue line shows the trend between the spot on different sample types (Tom7,
29-3A, T2). It also shows the point of the average abundance between the spots. The
black lines connect the spots that are on the same gel. For example the top abundance
spot on Tom7 is on the same gel as the lower abundance spot on T2 (Figure 24).
Two protein spots were picked from the fungal and identified by LC/MS/MS using the
parameters described in the materials and methods section. Our focus was to profile the
plant and fungal model systems at the global level to identify proteins that are
characteristic of each model. Secondary focus was; a) to determine if the presence of
viruses can be detected in the plant and fungal models and b) if the presence of the virus
will cause differential protein expression. Preliminary assessment of the identified
proteins indicate that some are unique to each model, and represent candidate targets that
will allow the selective detection of the target with high sensitivity and specificity. The
sequencing of the genome of R. solani will achieve the goal of elucidating the genome of
these R. solani variants and developing a peptide database that
Graph view 29-3.A vs. TOM7- down regulated in 29-3.A
Spot number 1643
T-test 0.030
Volume ratio -18.42

38
Shows the graphical view of the standardized log abundance. This is based on spot
volume calculated by the DIA module. The spot abundance between gels is standardized
using the internal standard.
The dots on the graph are the actual standardized log abundance of the spot on a gel.
The blue line shows the trend between the spot on different sample types (Tom7, 29-3A,
T2). It also shows the point of the average abundance between the spots.
The black lines connect the spots that are on the same gel. For example the top
abundance spot on Tom7 is on the same gel as the lower abundance spot on T2.
Graph view 29-3.A vs. TOM7- up regulated in 29-3.A
Spot number 1988
T-test 0.014
Volume ratio 30.33
Graph view T2 vs. TOM7- down regulated in T2
Spot number 2131
T-test 0.029
Volume ratio -3.41

39
Graph view T2 vs. TOM7- up regulated in T2
Spot number 1048
T-test 0.038
Volume ratio 2.96
Graph view T2 vs. 29-3.A- down regulated in T2
Spot number 1585
T-test 0.017
Volume ratio -25.91
Graph view T2 vs. 29-3.A - up regulated in T2
Spot number 1609
T-test 0.038
Volume ratio 16.3
The Biological Variation Analysis (BVA) module was used to perform gel to gel
matching of spots thus allowing quantitative comparison of protein expression across
multiple gels. For comparison purposes, an internal standard was used in the
experimental design. This internal standard is a pooled sample of an equal amount of all
samples in an experiment. All gels in an experiment are matched to a Master gel (the gel
with the most spots). Spots considered for picking were chosen based on a t-test of 0 0.05
or less and an average spot ratio of 2.0 or higher. Graph view 29-3.A vs. TOM7- up
regulated in 29-3.A. Spot number 1988; T-test 0.014 Volume ratio 30.33 (Figure
12). The Graph view of 29-3.A vs. TOM7- down regulated in 29-3.A . The Spot number
is 1643 and the T-test 0.030 Volume ratio -18.42 (Figure 13). The Graph view 29-3.A

40
vs. TOM7- down regulated in 29-3.A; Spot number 1643 T-test 0.030
Volume ratio -18.42. The graphical view of the standardized log abundance of
proteins are shown in Figures 26 and 27. This is based on spot volume calculated by the
DIA module. The spot abundance between gels is standardized using the internal
standard. The dots on the graph are the actual standardized log abundance of the spot on
a gel. The blue line shows the trend between the spot on different sample types (Tom7,
29-3A, T2). It also shows the point of the average abundance between the spots. The
black lines connect the spots that are on the same gel. For example the top abundance
spot on Tom7 is on the same gel as the lower abundance spot on T2 (Figure 24).
DIA is used to perform protein spot detection and quantitation. A volume threshold of 2.0
fold or higher is used to highlight the spots that are differentially expressed between
compared samples. Based on the area, slope, volume, and peak height of the proteins a
filtration is made to eliminate the spots that don‘t indicate the presence of a protein in a
gel.
The BVA module is used to perform gel to gel matching of spots, allowing quantitative
comparison of protein expression across multiple gels. For comparison purposes, an
internal standard was used in the experimental design. This internal standard is a pooled
sample of an equal amount of all samples in an experiment. The BVA module allows for
the quantitative analysis across the multiple gels in the experiment. All gels in an
experiment are matched to a Master gel (the gel with the most spots). Spots considered
for picking were chosen based on a t-test of 0 0.05 or less and an average spot ratio of 2.0
or higher.
Graph view 29-3.A vs. TOM7- down regulated in 29-3.A
Spot number 1643
T-test 0.030
Volume ratio -18.42

41
Shows the graphical view of the standardized log abundance. This is based on spot
volume calculated by the DIA module. The spot abundance between gels is standardized
using the internal standard.
The dots on the graph are the actual standardized log abundance of the spot on a gel.
The blue line shows the trend between the spot on different sample types (Tom7, 29-3A,
T2). It also shows the point of the average abundance between the spots.
The black lines connect the spots that are on the same gel. For example the top
abundance spot on Tom7 is on the same gel as the lower abundance spot on T2.
Graph view 29-3.A vs. TOM7- up regulated in 29-3.A
Spot number 1988
T-test 0.014
Volume ratio 30.33
Graph view T2 vs. TOM7- down regulated in T2
Spot number 2131
T-test 0.029
Volume ratio -3.41
Graph view T2 vs. TOM7- up regulated in T2
Spot number 1048
T-test 0.038

42
Volume ratio 2.96
Graph view T2 vs. 29-3.A- down regulated in T2
Spot number 1585
T-test 0.017
Volume ratio -25.91
Graph view T2 vs. 29-3.A - up regulated in T2
Spot number 1609
T-test 0.038
Volume ratio 16.39
Several protein spots were picked from the fungal and identified by LC/MS/MS using the
parameters described in the materials and methods section. Our focus was to profile the
plant and fungal model systems at the global level to identify proteins that are
characteristic of each model. Secondary focus was; a) to determine if the presence of
viruses can be detected in the plant and fungal models and b) if the presence of the virus
will cause differential protein expression. Our assessment of the identified proteins
indicate that some are unique to each model, and represent candidate targets that will
allow the selective detection of the target with high sensitivity and specificity.
CONCLUSIONS: We have successfully identified candidate RNA and dsRNA targets
protein targets in fungal and plant model systems using the nucleic acid and 2D-DIGE
and LC/MS/MS technologies. The next phase of the project will involve identification of
more of the proteins that we picked from the gels, full characterization and validation of

43
identified proteins of interest. Ultimately, we will assign the proteins to biochemical
pathways and evaluate their suitability as protein targets.
The model agent in addition to harboring the virus-like particles is also a important
fungal pathogen causing very important diseases in cultivated crop plants (Figure 16). It
causes blight, damping off and they are known to produce toxin during infection process.
F. graminearum (teleomorph Gibberella zeae) is the causal agent of Fusarium head
blight in wheat, barley, and oats and Gibberella ear rot in maize in temperate climates
worldwide. It synthesizes trichothecene mycotoxins during plant host attack to facilitate
spread within the host. In order to study proteins and pathways that are important for
successful host invasion. In vitro conducted experiments in which F. graminearum cells
were grown in aseptic liquid culture conditions conducive to trichothecene and
butenolide production in the absence of host plant tissue. Protein samples were extracted
from three biological replicates of a time course study and subjected to iTRAQ (isobaric
tags for relative and absolute quantification) analysis.
Statistical analysis of a filtered dataset of over 230 proteins in the present study (Figure
12, 13, and 14) exhibited significant changes in expression, 72 of which were un-
accumulated relative to their level at the initial phase of the time course. There was good
agreement between up accumulated proteins identified by 2-DE-MS/MS and iTRAQ.
RT-PCR and northern hybridization confirmed that genes encoding proteins that were up-
regulated based on iTRAQ were also transcriptionally active under mycotoxin-producing
conditions.
Numerous candidate pathogenicity proteins were identified using this technique,
including many predicted secreted proteins. Curiously, enzymes catalyzing reactions in
the mevalonate pathway leading to trichothecene precursors were either not identified or
only identified in one replicate, indicating that proteomics approaches cannot always
probe biological characteristics. A total of 148 spots showing differences in abundance
were identified. Among these spots, 33 spots were subjected to ESI-MS/MS, with 23
identified. Seven proteins including sporulation-specific gene SPS2, triose phosphate
isomerase, nucleoside diphosphate kinase, and woronin body major protein precursor
were upaccumulated while 16, including enolase, saccharopine dehydrogenase,

44
flavohemoglobin, mannitol dehydrogenase, and malate dehydrogenase, were down
accumulated. Variations in protein abundance were investigated at the mRNA level by
real-time RT-PCR analysis, which confirmed the proteomic data for 9 out of the
representative 11 selected proteins.
A data-dependent "Top Five" method is used for peptide sequencing where a full MS
scan from m/z 400-1500 is followed by MS/MS scans on the five most abundant ions
(Figure 16)
Database Searching:
Raw files from the mass spectrometer were searched against the following databases
downloaded from NCBI: Genus Ustilago, Genus Fusarium, and Genus Botrytis using
Proteome Discoverer 1.2 (Thermo Scientific)and the SEQUEST algorithm. Two very
confident protein identifications were made and they included gi119364593 (Heat shock
70 kDa protein 2) with 8 peptide matches and gi71024269 (Actin) with 7 peptide
matches.
To further validate the identifications, a program called Protein Prophet was used for
database searching. For the Heat shock 70 protein, all of the same peptides were
identified with at least 97% probability and all except for two had 99% probability. For
the Actin protein, all of the same peptides were identified with 99% probability.
We have identified several proteins based on homology to the cousins of your Fungus
(Fusarium and Ustilago) and I have put them in an Excel sheet (see attached). So far, the
most confident ID came from the following protein with 8 peptides matching to the
protein:
http://www.ncbi.nlm.nih.gov/protein/119364593
For some of the proteins we identify, they are also found in the SwissProt database which
gives more information on protein function and other attributes, see the following link:
http://www.uniprot.org/uniprot/P18694

45
We have searched 200 data files so far and have many more proteins to put in the table.
DeCyder is an automated image analysis software suite which enables detection,
quantitation, matching and analysis of Ettan DIGE system gels Differential Analysis
Software (DIA) and Biological Variation Analysis (BVA) are the two modules of the
DeCyder software.
Two very confident protein identifications were made and they included gi119364593
(Heat shock 70 kDa protein 2) with 8 peptide matches and gi71024269 (Actin) with 7
peptide matches. To further validate the identifications, a program called Protein Prophet
was used for database searching. For the Heat shock 70 protein, all of the same peptides
were identified with at least 97% probability and all except for two had 99% probability.
For the Actin protein, all of the same peptides were identified with 99% probability.
We have identified several proteins based on homology to the cousins of your Fungus
(Fusarium and Ustilago) and I have put them in an Excel sheet (see attached). So far, the
most confident ID came from the following protein with 8 peptides matching to the
protein:
http://www.ncbi.nlm.nih.gov/protein/119364593
For some of the proteins we identify, they are also found in the SwissProt database which
gives more information on protein function and other attributes, see the following link:
http://www.uniprot.org/uniprot/P18694
We have searched 200 data files so far and I have many more proteins to put in the table.

46
MILESTONE 3
TASK 1:
Develop and optimize protocol for Genomic DNA Extraction from Reduced
Complement Isolates of Rhizoctonia solani 29.3A and T2 for Genomic Sequencing
This specific Aim was performed at Indiana University of Pennsylvania under the
supervision of Dr N. Bharathan and Dr S. Bharathan. This was done for the development
of a peptide database to allow a more efficient and accurate annotation of R. solani AG-
1/AG-4 at the molecular level. The sequencing of the genome of R. solani will achieve
the goal of elucidating the genome of these R. solani variants and developing a peptide
database that would allow a more precise annotation of R. solani AG-1/AG-4 at the
protein level. Two haploid isolates of the culture that currently being sequenced are 29.3
A and T2.
High quality genomic DNA required sequencing from the selected isolates was
developed and optimized (300 µg of genomic DNA in ~1 ml from each of the reduced
complement strains with purity and A260 /A280 ratio of 2.0) as stipulated in the
statement of work for the genomic sequencing (Dr. William C. Nierman, Ph.D. Professor
Director, Infectious Diseases Program J. Craig Venter Institute [email protected].
Extraction
1. Harvested 25g culture by using cool water, incubate culture in liquid nitrogen for
about 10 minutes.
2. Use mortar pestle to grind culture into powder form, transfer a breaker or big
bottle.
3. Add 100mL of CTAB extraction solution into a breaker.
4. Then add 50mL of CTAB/NaCl into it and wash the cylinder with 50mL of
CTAB extraction solution.
5. Use the blender to blend for 2 minutes, by 30sec off and on.
6. Mix well and incubate for 40 minutes at 65oC.

47
7. Add equal volume of Chloroform/Isoamyl, rock for 20 minutes.
8. Balance and centrifuge for 5minutes 7500xg at room temperature.
9. Recover the top (aqueous) phase, into a cylinder and add 1/10 volume of 65oC
CTAB/NaCl by using backside of the 10mL pipette.
10. Mix well and transfer it into new 30mL glass tube, balance and centrifuge it at
7500xg for 5 minutes in room temperature.
11. Recover the top layer into a new 30mL glass tube by using the backside of the
10mL pipette.
12. Add equal volume of cool -20oC of isopropyl alcohol, cap and mix by inversion
and keep at -20oC for overnight.
13. Balance it with Isopropanol and centrifuge at 4000rpm for 5minutes in 4oC
(Avanti J-25 beckman).
14. Pour out the supernatant and invert the tubes for a minute.
15. Add 2mL of cool 70% EtOH to wash the pellet, balance and centrifuge at
4000rpm for 5 minute by 4oC. Repeat this step by second time.
16. Pour out the 70% EtOH invert for a minute and keep on ice under the hood to let
it dry. DON‘T turn on UV light!!
17. Add 1mL of TE buffer to each tube and rock at Max Q 2000 until all dissolve.
18. Combine all the solution into one tube mix gently.
19. 1µL is used to screen at 260A and 280A by using Du 800 spectrophotometer for
calculate the purity of the DNA by
20. 20 µL is used to run on 0.8% Agarose gel.
CsCl Centrifugation
1. Divide the total DNA volume into 2 and added each into a 15mL top tube.
2. 10.6g of CsCl are added into each tube, allow the CsCl to dissolve by the DNA
sample.
3. TE buffer is added into each tube to bring the total volume into 10mL for help on
dissolve the CsCl.
4. Slowly transfer all the solution into a polyallomer quick seal centrifuge tube.
5. 600µL of 10mg/ml of EtBr is carefully added to each of the tube.

48
6. Another 2mL of TE buffer is needed to fill the tube to the top and balance at the
sametime.
7. The balanced tubes are centrifuge for 70K rpm at 20oC for 40 hours by Optima L-
90K Ultracentrifuge with rotor type 70.1 TI.
Draw the DNA band
1. Made a small hole on the top on the tube by using 18G1/2 needle and 5mL luer
lock.
2. Draw the DNA band from the top on the band, into a 50mL top tube.
*Do not do it from the bottom of the band, if so you may loss lot of the DNA.
3. Add isopropanol saturated into it to extract the EtBr out from the DNA.
4. Pippetted out the top layer of the isopropanol with EtBr into a solution of 5%
Clorox.
5. Repeat step 3 and 4 until the DNA sample is completely clear.
6. Precipitate the DNA by adding:
i) 10mL of TE buffer
ii) 5mL of 7.5M ammonium acetate
iii) Add 95% cold EtOH to top of the tube
iv) Keep it at -20oC for 1hour.
7. Balance the tube and centrifuge for 10K rpm for 10 minutes at 4oC.
8. Pour out the 95% EtOH, invert for few minute and air dry it on ice.
9. Add 500µL of TE buffer to each tube, to dissolve the pellet.
10. Close it with parafilm and keep at 2oC – 8
oC for overnight.
Re-precipitation of DNA
1. Add 1/10 volume fo 3M NaOAc, pH5.2 to the suspended solution to re-
precipitate.
2. Add cold 95% EtOH to top up the tube and keep at -20oC for overnight.
3. Centrifuge DNA sample at 14k rpm for 35 minutes at 4oC.
4. Draw out the 95% EtOH and wash pellep with 500µL of 70% cold EtOH.
5. Centrifuge it at 10k rpm for 5 minutes at 4oC.

49
6. Repeat for step 4 and 5 for 2nd
time wash.
7. Airs dry the pellet on ice.
8. Re-suspend the pellet with 500µL of TE buffer, take 1µL to screen at 260A and
280A by using Du 800 spectrophotometer for calculate the concentration and
purity of the DNA.
9. 300µL of the Genomic DNA is sending for sequencing and the left over is re-
precipitated.
Buffer
1) 3M sodium acetate pH6
a) Weight 20.40g of sodium acetate to 30mL of autoclaved water.
b) Adjust the pH with glacial acetic acid to pH6.
c) Add autoclaved water to the final volume of 50mL
2) Extraction buffer
a) Mix 20mL of 1M Tris-HCl, pH8
b) 20mL of 200mMEDTA,pH8
c) 16.36g of NaCl
d) 4g of CTAB
e) 200mL of autoclaved water
f) Incubate at 65oC of water bath until all dissolved
3) CTAB/NaCl solution
a) 80mL of autoclaved water
b) 4.1g of NaCl
c) 10g of CTAB
d) Final volume will be 100mL
e) Incubate at 65oC of water bath
4) TE buffer
a) Mix 150µL 200mM EDTA
b) 300 µL 1M Tris-HCl
c) 29.55mL autoclaved water

50
5) Isopropanol saturated
a) Mix 15mL of 20XSSC
i) Make 20XSSC by dissolve 175.3g of NaCl and 88.2g of sodium citrate into
800mL
ii) Adjust the pH to 7.0 with a few drops of 1M HCl.
iii) Add autoclaved water to the final volume of 1L.
iv) Sterilize by autoclaving.
b) 25mL of isopropanol
6) 7.5M ammonium acetate
a) Dissolve 28.875g of ammonium acetate into 25mL of autoclaved water.
7) Keep enough of 95% ETOH and isopropanol at -20oC.
The Results of purified genomic DNA and the subsequent PCR amplification using the
following
(ITS1-F) CTTGGTCATTTAGAGGAAGTAA and
(ITS4-R)CAGGAGACTTGTACACGGTCCAG (Gardes & Bruns, 1993) reverse
primers are shown in the Appendix D (Figure 1)
The annotation of R.solani strains T2 and 29.3 is being completed for data processing of
the proteins Appendix D (Table 1 and Table 2)

51
MILESTONE 3
Task 2
The modern imaging methods into biodefense research will help elucidate mechanisms at
the macro level that characterize host-microbe interactions. Our research at Indiana
University of Pennsylvania funded by Defense Threat Reduction Agency (DTRA) in
cooperation with ITSI-Biosciences and Department of Health uses fungal-viral model
system to study microbial interactions; cytoplasmic exchange of genetic elements; protein
factors; and the underlying causes of host cell death. In the present study using 19 different
paired combinations (Appendix E Figure 5), we observed hyphal interactions between
compatible and incompatible Rhizoctonia solani isolates using a compact image stacking
device that allows one to photograph objects as small as 0.5 mm using a confocal camera.
The staining technique for pair wide combination is shown in Appendix E, Figure 1. When
the mycelia of R. solani encounter mycelia with a different genetic background, distinct
barrage lines (BL) form (Figure 2, Figure 3, and Figure 5). Several incompatible reactions
were observed (Figure 2) or compatible interactions were seen Figure 4 and Figure 6.
Several ultra-high resolution images were generated showing high degree of stratification
near or close to the tip of the fungal mycelium suggesting active protein and lipid synthesis.
The device uses a a stacking device was developed earlier to capture multiple images in
depth to compile in to a single fully focused image. The specimen mount itself can also move
the specimen in the X and Y axes for shorter distances for stitching panoramic shots. The Z
axis stack can be downloaded to a computer and stacked using any number of stacking
algorithms. Edited images provided extra high resolution that allowed us to observe perfect
hyphal anastomosis in compatible pairs (Figure 6). The hyphae never anastomosed with
incompatible pairs (i.e., the hyphae remained parallel or crossed over without merging).
These behaviors appear to result from the detection of one or more diffusible factors or due
to up-take of viruses, toxins and traffic within fungal cells (figure 7). Our results also
suggest that the attraction to other hyphae in pairs of incompatible isolates was increased
by supplementation of the growing medium with activated charcoal. We will report data
concerning programmed cell Death (PCD) with one or two approaching hyphae. The
complex soil-borne fungus Rhizoctonia solani represent important plant pathogens that
affect a wide host-range of vegetable and field crops, ornamentals and tree species
worldwide causing consistent reductions in quality and economic yield. The combination of
strains that differ in host range, pathogenicity, and culture characteristics makes the R.

52
solani complex a challenging task in terms of characterizing genetically distinct or similar
fungal individuals. Since the first report of viral double-stranded RNA (dsRNA) genetic
elements associated with R. solani, the etiology, epidemiology, and molecular biology of the
disease have been studied extensively. The soil fungus Rhizoctonia solani is a potential
threat to food biosecurity because it can kill or reduce the vigor of developing seedlings
resulting in poor plant stand and productivity. The fungus is found in diverse soil habitats in
temperate, neotropical, and tropical regions of the world and a pathogen of most cultivated
and native species of plants, including various bioenergy crops such as conifers, maize,
poplar, sorghum, soybean and switchgrass. The fungus also harbors double stranded RNA
viruses that influence the parasitic and saprobic activity of the fungus and could be
potentially exploited for agricultural-bioterrorism. However, our ability to detect and
counter such threats is limited.
Results:
To our knowledge this represents the first demonstration of transmission of dsRNA
between genetically different individuals of R. solani confirmed with imaging (figures 4 and
Protein analysis Figures 8. We are confirming these results with nuclear and mitochondrial
markers. All such isolates also show considerable variations in the protein content (figures
8). In fact in many of these cultures the recipient isolates showed considerable increase or
decrease in protein content. These results suggest that transmission can occur between
somatically incompatible solates but that maintenance of the dsRNA in the recipient
isolates was not stable after repeated sub-culturing on nutrient medium. The dsRNA was
maintained in isolates for 5 wk but was not detected thereafter. This data suggests that the
dsRNA might not be stable when transmitted into a different cytoplasm in the new fungal
host environment. Perhaps factors or cellular mechanisms other than somatic
incompatibility present in the fungal host might interfere with the ability of the
transmitted dsRNA to replicate and persist within the new host.
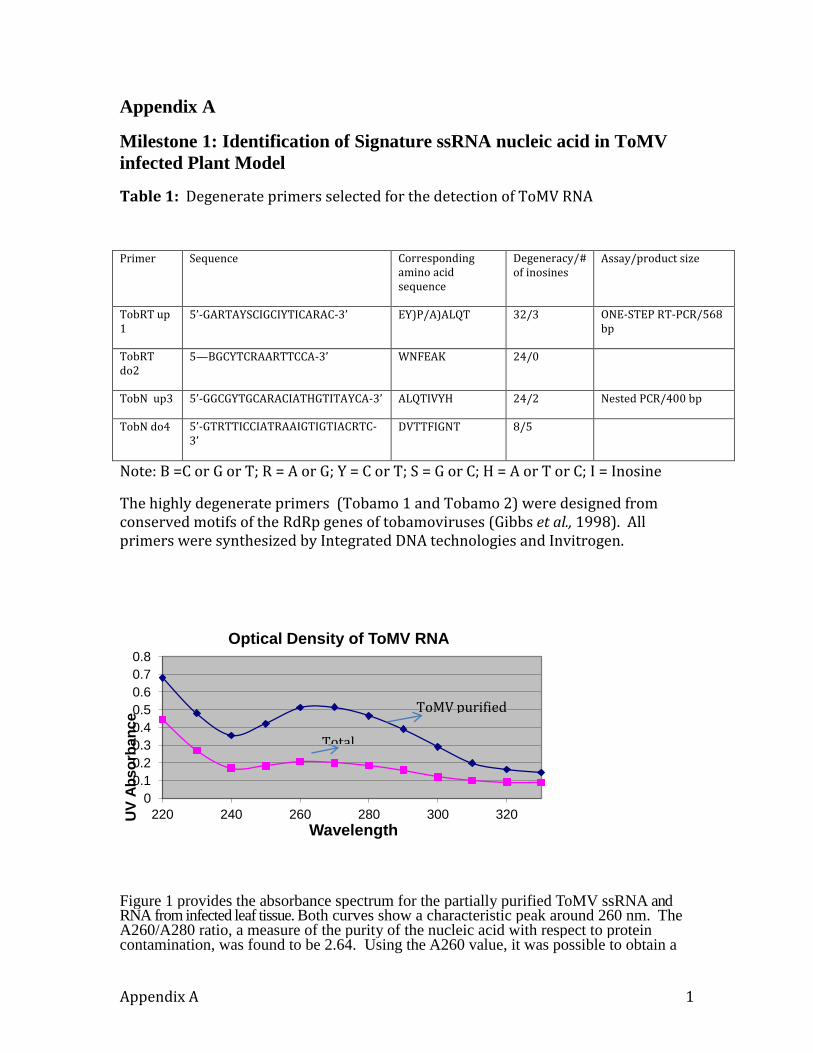
Appendix A 1
Appendix A
Milestone 1: Identification of Signature ssRNA nucleic acid in ToMV
infected Plant Model
Table 1: Degenerate primers selected for the detection of ToMV RNA
Primer Sequence Corresponding amino acid sequence
Degeneracy/# of inosines
Assay/product size
TobRT up 1
5’-GARTAYSCIGCIYTICARAC-3’ EY)P/A)ALQT 32/3 ONE-STEP RT-PCR/568 bp
TobRT do2
5—BGCYTCRAARTTCCA-3’ WNFEAK 24/0
TobN up3 5’-GGCGYTGCARACIATHGTITAYCA-3’ ALQTIVYH 24/2 Nested PCR/400 bp
TobN do4 5’-GTRTTICCIATRAAIGTIGTIACRTC-3’
DVTTFIGNT 8/5
Note: B =C or G or T; R = A or G; Y = C or T; S = G or C; H = A or T or C; I = Inosine
The highly degenerate primers (Tobamo 1 and Tobamo 2) were designed from conserved motifs of the RdRp genes of tobamoviruses (Gibbs et al., 1998). All primers were synthesized by Integrated DNA technologies and Invitrogen.
Figure 1 provides the absorbance spectrum for the partially purified ToMV ssRNA and RNA from infected leaf tissue. Both curves show a characteristic peak around 260 nm. The A260/A280 ratio, a measure of the purity of the nucleic acid with respect to protein contamination, was found to be 2.64. Using the A260 value, it was possible to obtain a
0 0.1 0.2 0.3 0.4 0.5 0.6 0.7 0.8
220 240 260 280 300 320 UV
Abso
rban
ce
Wavelength
Optical Density of ToMV RNA
ToMV purified
Total

Appendix A 2
rough estimation of the concentration of nucleic acid in the sample, where purified virus ssRNA was ~8.8 µg/µL and the total RNA was ~0.6 µg/µL. Electrophoretric Gel analysis of RNA (Appendix A Figure 2)
Figure 2: Lane 1: Purified viral RNA; Lane 2 Total Crude RNA from ToMV infected leaf
; Lanes 3 and 4 represent total RNA from non-inoculated Tobacco leaf.

Appendix A 3
Figure 4: PCR Program:

Appendix A 4
Figure 5: PCR Amplification Profile with the cT values.

Appendix A 5
Northern Hybridization
Figure 4A:
Ethidium Bromide stained gel of ToMV samples in preparation for Northern Hybridization.Lanes 1 and 2 contain IND-7 and PCR Markers , repectively. Lane 3 contains Total HealthyRNA, 4 contains Total Infected RNA, and 5 contains purified Viral RNA. Lanes 6, 7, 8, and 9contains cut ToMV plasmids. Lanes 10 and 11 have samples of PCR products of Total InfectedRNA and Viral RNA, respectively. Gel was run in order to transfer nucleic acid to nitrocellulosemembrane for Northern Hybridization.
Figure 4B:
Northern Hybridization membrane exposed to film. PCR product of viral ToMV RNA used asprobe for detection. Viral probe detected viral sequences in lanes 7, 8, 10, and 11. Samples inlanes 7 and 8 were ToMV plasmids cut with EcoRI restriction enzyme. Lane 10 contained PCRproduct of Total Infected RNA and lane 11 contained PCR product of PCR product of Viral RNA.
1 2 3 4 5 6 7 8 9 10 11 1 2 3 4 5 6 7 8 9 10 11
A B
Northern Hybridization
Figure 4A:
Ethidium Bromide stained gel of ToMV samples in preparation for Northern Hybridization.Lanes 1 and 2 contain IND-7 and PCR Markers , repectively. Lane 3 contains Total HealthyRNA, 4 contains Total Infected RNA, and 5 contains purified Viral RNA. Lanes 6, 7, 8, and 9contains cut ToMV plasmids. Lanes 10 and 11 have samples of PCR products of Total InfectedRNA and Viral RNA, respectively. Gel was run in order to transfer nucleic acid to nitrocellulosemembrane for Northern Hybridization.
Figure 4B:
Northern Hybridization membrane exposed to film. PCR product of viral ToMV RNA used asprobe for detection. Viral probe detected viral sequences in lanes 7, 8, 10, and 11. Samples inlanes 7 and 8 were ToMV plasmids cut with EcoRI restriction enzyme. Lane 10 contained PCRproduct of Total Infected RNA and lane 11 contained PCR product of PCR product of Viral RNA.
1 2 3 4 5 6 7 8 9 10 11 1 2 3 4 5 6 7 8 9 10 11
A BFigure 7 A and 7B
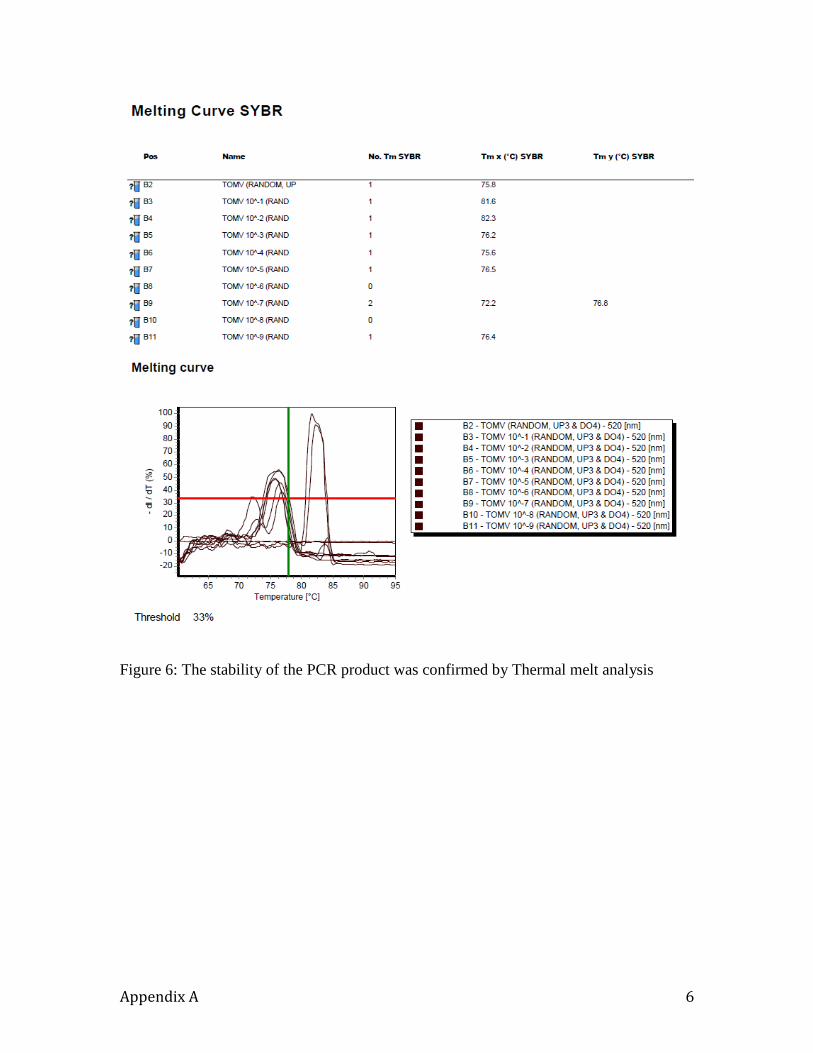
Appendix A 6
Figure 6: The stability of the PCR product was confirmed by Thermal melt analysis

Appendix A 7
Figure 8: pDrive plasmid cloning vector with multiple cloning sites and reporter gene
expression for clone selection.
Figure 9: Gel Picture of ethidium stained plasmid DNA that were fast digest with EcORI
DNA analysis of Cloned fragments of ToMV ssRNA following enzyme digests
1 2 3 4 5 6 7 8 9 10

Appendix A 8
Table 3: Sizes of the cloned fragments of ToMV from fast EcoRI digests
TOMV Plasmid
TOMV Plasmid
TOMV Plasmid
TOMV Plasmid
TOMV Plasmid
TOMV Plasmid
TOMV Plasmid
TOMV Plasmid
TOMV Plasmid
Lane 1 Lane 2 Lane 3 Lane 4 Lane 5 Lane 6 Lane 7 Lane 8 Lane 9
MW (bp) MW (bp) MW (bp) MW (bp) MW (bp) MW (bp) MW (bp)
MW (bp)
MW (bp)
3436.1 4314.3 3289.8 3309.1 3653 3683.7 4022 3622.3 3837.5
3251.2 3270.5 877.9 1003.1 3289.8 1913.7 843.9 359.2 756.5
955.1 574.4 668.2 866.8 843.9
679.2

Appendix A 9
Figure 10. The sequence comparison to known Tobamovirus groups have shown 90%
sequence
Figure 11: Dual Hybrid BHQ probes
TOMV-Q-2-M13F & TOMV-Q-2-M13R
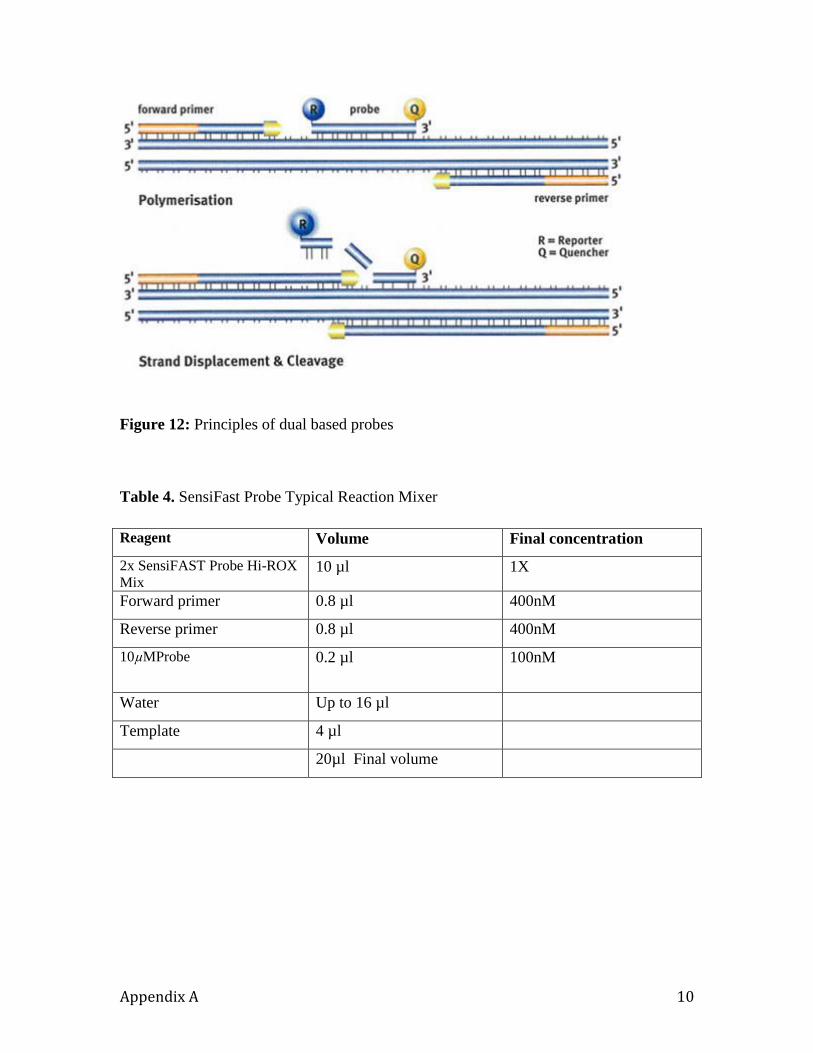
Appendix A 10
Figure 12: Principles of dual based probes
Table 4. SensiFast Probe Typical Reaction Mixer
Reagent Volume Final concentration
2x SensiFAST Probe Hi-ROX
Mix 10 µl 1X
Forward primer 0.8 µl 400nM
Reverse primer 0.8 µl 400nM
10 MProbe
0.2 µl 100nM
Water Up to 16 µl
Template 4 µl
20µl Final volume

Appendix A 11
Table 5. DNA Thermal Cycling Conditions
Cycles Temperature Time Notes
1 95 5 minutes Polymerase activation
40 95
60
10S
50S
Denaturation
Annealing/extension
(acquire at end of
step
Table 6: Results of FAM data following hybridization using ToMV probe
AAGTACAGCAGACTGTCGTCACCGC
.

Appendix A 12
Figure 13: Fluorescent profile various concentrations of ToMV RNA hybridized to the
probes as described in Materials and Methods.
Milestone 2: Signature Protein identification in ToMV infected Plant Model
Figure 14: SDS-PAGE of purified proteins from ToMV infected and healthy leaf tissue.
On the right is the electrophoretic banding pattern of BSA protein standards.

Appendix A 13
Figure 15: 2D-DIGE image showing the spot pattern and spot distribution of
proteins isolated from ToMV infected and uninfected plants. Proteins colored
green are more abundant in the virus infected plants and the proteins colored red
are more abundant in the uninfected plants. The proteins colored Yellow are
present at similar levels in both the samples. The virus coat protein are present
only in virus infected plants.
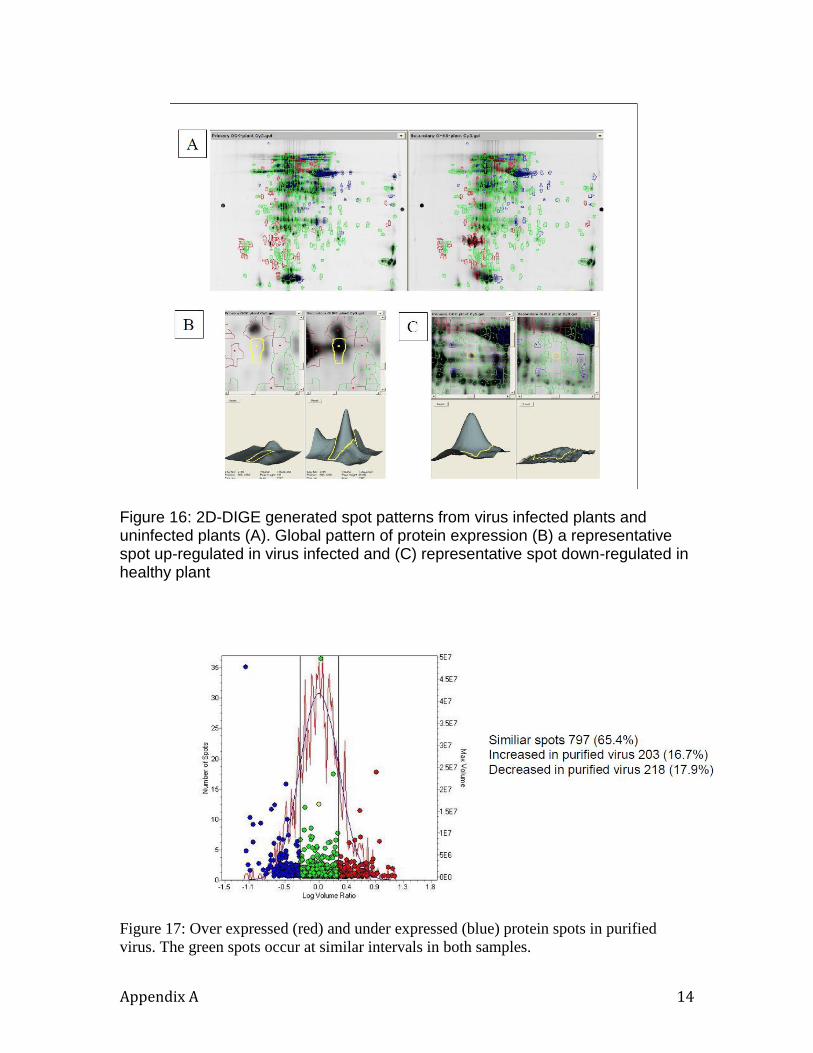
Appendix A 14
Figure 16: 2D-DIGE generated spot patterns from virus infected plants and uninfected plants (A). Global pattern of protein expression (B) a representative spot up-regulated in virus infected and (C) representative spot down-regulated in healthy plant
Figure 17: Over expressed (red) and under expressed (blue) protein spots in purified
virus. The green spots occur at similar intervals in both samples.

Appendix B 1
Appendix B
Milestone 1: Task 2 Characterization of fungal and viral nucleic acids. This milestone
will achieve the goal of full characterization of viruses infecting R. solani and tomato
mosaic virus RNA with the aim of identifying nucleic acid signatures that can be used to
discriminate between the viral and fungal models.
Table 1: Isolates of R.solani that were tested for the presence and absence of
Double-stranded RNA
Fungal Isolate Name Growth Characteristics Type of Nuclei Genome Type
RS 303 Rapid Growth; Brown Heterokaryon Normal
RS 357 Rapid Growth; Brown Heterokaryon Normal
RS 386 Slower Growth; Brown Heterokaryon Normal
Rhs 113 Slower Growth; Brown Heterokaryon Normal
Rhs 114 Slower Growth; Brown Heterokaryon Normal
TE2-4 Rapid Growth; Downy Heterokaryon Normal
RS 29 Slower Growth; Pale yellow Heterokaryon Normal
RS29.3 Slower Growth; White and Downy
Homokaryon Reduced Genome
T2 Slower Growth and white Homokaryon Reduced Genome
TOM-7 Rapid Growth and Brown Homokaryon Reduced Genome
EGR-4 Rapid Growth; white and Downy
Homokaryon Reduced Genome
HUD 2-1 Brown and Rapid Growth heterokaryon Normal
Note: Heterokaryon isolates have 2 nuclei; whereas Homokaryon isolates have
one nuclei

Appendix B 2
Figure 1: R-PCR Design of the random and reverse transcription
Figure 2: PCR Amplification Model
R-PCR Primer Design
• Reverse transcription PCR
1 2 3 4 5
dsRNA
Denatured at 99°C for 90 seconds1% DMSO primer-dN6 5’-CCTGAATTCGGATCCTCCNNNNNN-3’
MMLV-RT Reverse TranscriptasedNTP mixRNase Inhibitor10X RT Buffer
cDNA
Complementary to primer5’ GGACTTAAGCCTAGGAGG

Appendix B 3
Figure 3. QIAGEN® pDrive cloning vector and the genes it expresses. ToMV was
inserted in between the “sticky” U ends which then anneals together. LacZ flanks the
insertion point which becomes expressed if target nucleic acid is not inserted .
Figure 4: Ethidium bromide stained agarose gel showing the fractionation of dsRNA
purified from R. solani isolates shown in Appendix B Table 1. The gels were stained with
ethidium bromide and photographed using Kodak-pro Imaging System.

Appendix B 4
Figure 5: Double-stranded RNA was extracted from select isolates indicated above and
analyzed by gel electrophoresis. The gels were stained with ethidium bromide and
photographed using Kodak-pro Imaging System.
Figure 6: Nuclease treated dsRNA from the select isolate EGR-4 to establish ds-RNA
nature of the viral nucleic acid. The gels were stained with ethidium bromide and
photographed using Kodak-pro Imaging System.

Appendix B 5
Figure 7: Size distribution profiling of dsRNA from viruses infecting different R. solani
isolates. The dsRNA coild be broadly classified into Large (L) (>4.6 kilo-bases);
Medium (1.1-4.5 kilo-bases); and Small (<1.0 kilo-bases).
Figure 8: Size distribution profiling of dsRNA from viruses infecting 10 different R.
solani isolates. The dsRNA coild be broadly classified into Large (L) (>4.6 kilo-bases);
Medium (1.1-4.5 kilo-bases); and Small (<1.0 kilo-bases).
DsRNA Size Distribution
DsRNA consistently Detected
80
100
60
0
20
40
% Fragments
AG6 AG7 AG8 AG9 AG10 AG11 AG12 AG13 AG14
= >4.6kb = 1.1 - 4.5kb =<1.0kb
AG = Anastomosis Groups
L M S
dsRNA profiling of 10 R. solani isolate
21226
5148
4268
3530
2027
1904
1584
1375
947
831
5000
2000
850
400
100
Lanes 1 2 3 4 5 6 7
Sample λ DNA Hindlll/EcoRI 357 303 386 Middle Range Ladder RS 29 T2Sizes (bp) 1973.5 1983.4 2083 1291.4 2159.3
Lanes 8 9 10 12 11 13
Sample RS113 RS114 EGR 4 MC35B3 TE2-4Middle Range
Ladder
Sizes (bp) 6650.7 6885.1 3489.3 2919.6 35002582.3 2601.8
1443.5 2108.6
1 2 3 4 5 6 7 8 9 10 11 12 13

Appendix B 6
Table 2: Isolates of R.solani sizes of Double-stranded RNA
Fungal Isolate Name Size of DsRNA Type of Nuclei Genome Type
RS 303 Medium Heterokaryon Normal
RS 357 Medium Heterokaryon Normal
RS 386 Medium Heterokaryon Normal
Rhs 113 Large, Medium , and Small Heterokaryon Normal
Rhs 114 Large, Medium, and Small Heterokaryon Normal
TE2-4 Medium and Small Heterokaryon Normal
RS 29 Mid-size Fragment Heterokaryon Normal
RS29.3 No dsRNA Homokaryon Reduced Genome
T2 Mid-size Fragment Homokaryon Reduced Genome
TOM-7 No dsRNA Homokaryon Reduced Genome
EGR-4 Mid-size Fragment Homokaryon Reduced Genome
HUD 2-1 No dsRNA heterokaryon Normal
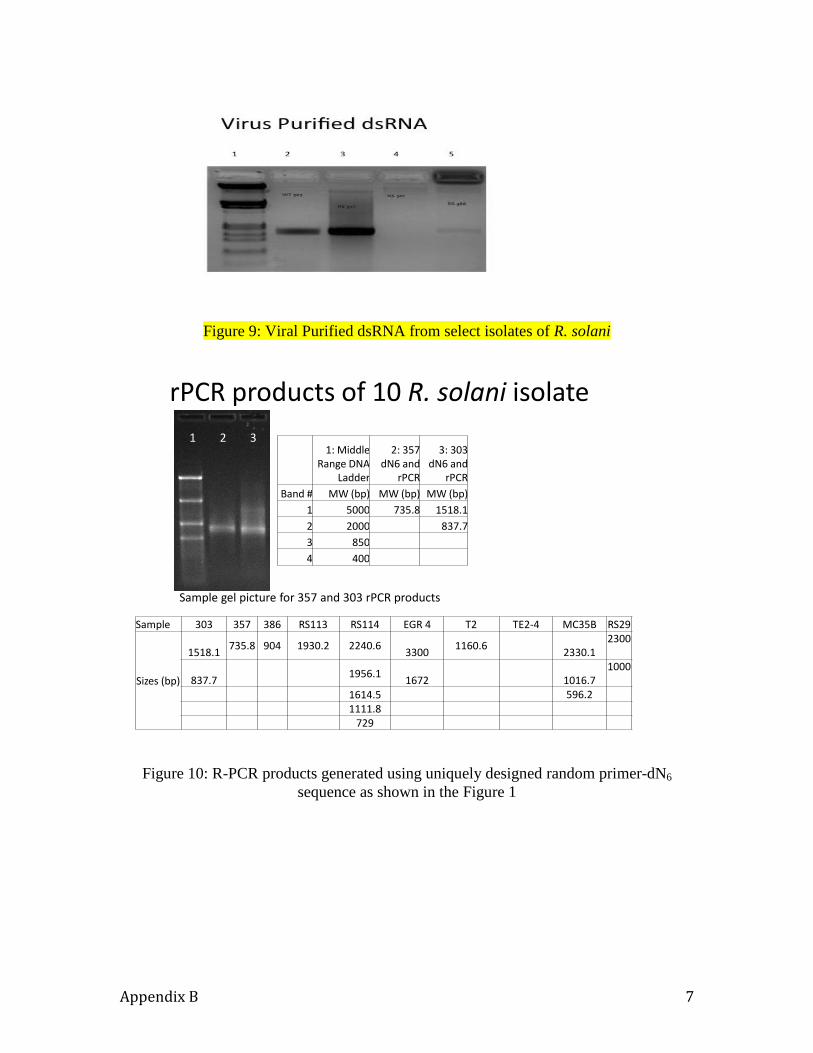
Appendix B 7
Figure 9: Viral Purified dsRNA from select isolates of R. solani
Figure 10: R-PCR products generated using uniquely designed random primer-dN6
sequence as shown in the Figure 1
rPCR products of 10 R. solani isolate
1: Middle Range DNA
Ladder
2: 357 dN6 and
rPCR
3: 303 dN6 and
rPCR
Band # MW (bp) MW (bp) MW (bp)
1 5000 735.8 1518.1
2 2000 837.7
3 850
4 400
Sample gel picture for 357 and 303 rPCR products
Sample 303 357 386 RS113 RS114 EGR 4 T2 TE2-4 MC35B RS29
Sizes (bp)
1518.1735.8 904 1930.2 2240.6
33001160.6
2330.12300
837.71956.1
1672 1016.71000
1614.5 596.21111.8
729
1 2 3

Appendix B 8
Figure 11: Optimum PCR conditions for cDNA synthesis and PCR amplification
EGR-4 PCR and effect of MgCl2Concentration in PCR
362120401120784
1 2 3 4 5 6 7
Ethidium Bromide stained gel of PCR products generated from rPCR. The sizes of molecular weight markers are shown left of lane 1 molecular weight marker, lane 2 and 3 represent PCR products from 2.0 and 2.5, 3.0, 3.5 and 4.0 mM concentration of MgCl2 in the PCR reaction mixture.
1000750500
250

Appendix B 9
Figure 12: Gel Electrophoresis of fast digest cloned plasmids from the isolates 113, 114,
and T2 dsRNA. The bottom panel shows the electrpherogram of the cloned fragments
from representative clone analyzed.
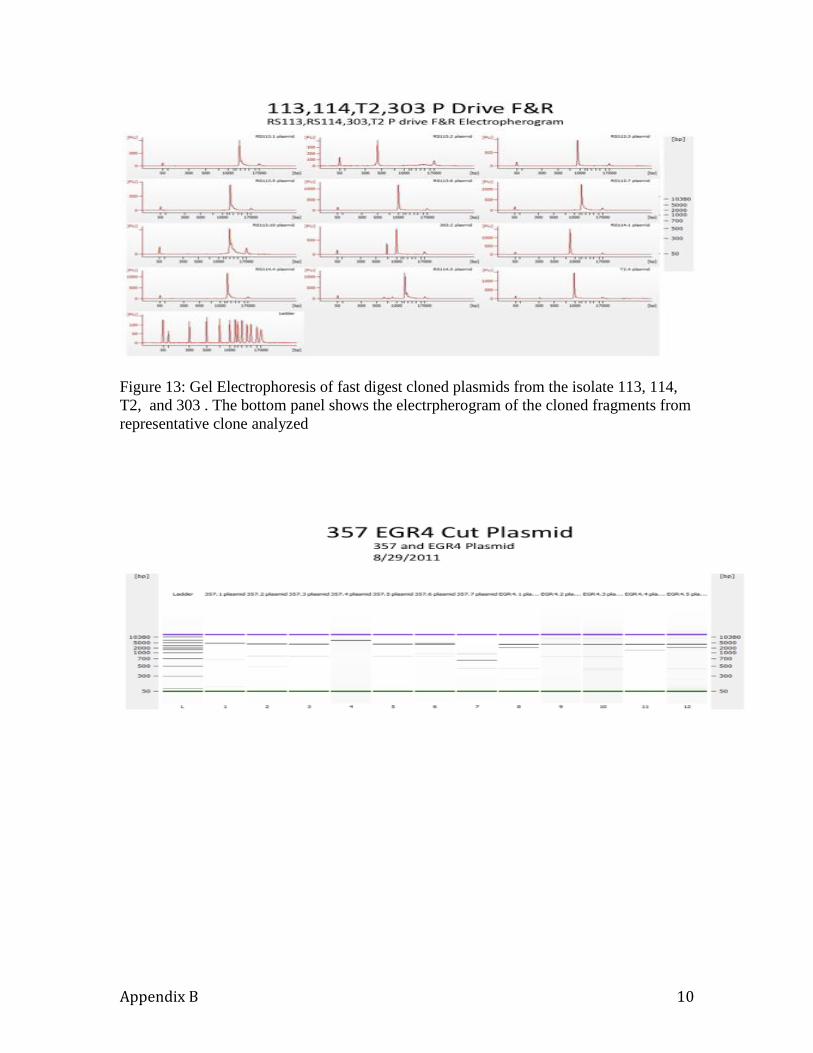
Appendix B 10
Figure 13: Gel Electrophoresis of fast digest cloned plasmids from the isolate 113, 114,
T2, and 303 . The bottom panel shows the electrpherogram of the cloned fragments from
representative clone analyzed

Appendix B 11
Figure 14 : Gel Electrophoresis of fast digest cloned plasmids from the isolate 357 and
EGR-4. The bottom panel shows the electrpherogram of the cloned fragments from
representative clone analyzed.
Primer Probe Design from Cloned dsRNA Fragments from the isolates 303, 357,
386, EGR-4 and T2 Containing R. solani Virus Isolates
Table 3: Forward and Reverse primer design
Culture dsRNA size (bp)
dN6/rPCR size Forward sequence Revese sequence Probe sequence F&R PCR gel and size
TOMV 6000 407.7 TCCGGAAACTCACAACCCTTTG GCTGCATGTTTGGCTTCGAT AAGTACAGCAGACTGTCGTCACCGC
303 1966 1518
357 1970 736 TTCCTCCTGGAGCAGTCAATC GGCGCTGAGGTAGAGTTGATC CCGTACCCGGCAGACTGTTTCTA
386 1914 904
EGR4 3200 AGCGCTGACCTTGCTATCGAATC CCACCGGAAGAGGGAAATCC AGTGCCGATCAGCCCTCCACCG
T2 2692 1160.6 TTCCTCCTGGAGCAGTCAATC GGCGCTGAGGTAGAGTTGATC CCGTACCCGGCAGACTGTTTCTA

Appendix B 12
Table 4: Reaction Volume
Reagent Volume (µL)
2X SensiFAST Probe One-Step Mix 10
Forward Primer (10 uM) 0.8
Reverse Primer (10 uM) 0.8
Probe (10 uM) 0.2
Reverse transcriptase 0.2
RiboSafe RNase Inhibitor 0.4
Water 3.6
Template (plasmid) 4
Final Volume 50
Table 5: Reaction Volume
Reagent Volume (µL)
2X Sensi Mix II Probe 25
Forward Primer (5 uM) 2
Reverse Primer (5 uM) 2
Probe (5 uM) 0.5
Water 15.5
Template (plasmid) 5
Final Volume 50
Figure 15: Real-Time PCR analysis using primers specifically obtained from the isolate
357.

Appendix B 13
Figure 16: Melt curve analysis of the PCR product generated from the reaction in Figure
15.
Figure 17: Real-Time PCR analysis using primers specifically obtained from the isolate
357 and probes designed from 357.

Appendix B 14
Figure 18: Real-Time PCR analysis of target nucleic acid from three virus isolates 303,
357, and 386. The primer sequence was designed from the isolate 357.

Appendix B 15
Figure 19: Real-Time PCR analysis of target nucleic acid from three virus isolates EGR-
4, 357, 114, and 113. The primer sequence was designed from the isolate 357.
Figure 20: Bioinformatics of the Real-Time PCR data using specific primers sequences and target nucleic acid from 303, 386, and 357.
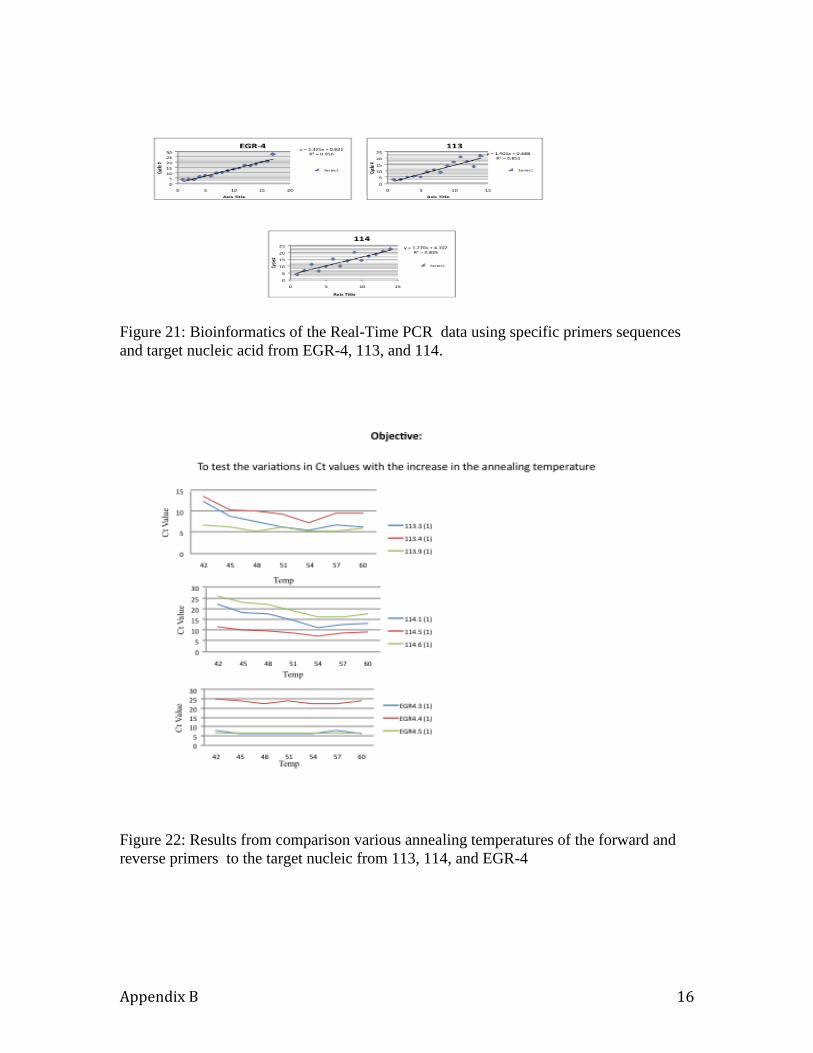
Appendix B 16
Figure 21: Bioinformatics of the Real-Time PCR data using specific primers sequences
and target nucleic acid from EGR-4, 113, and 114.
Figure 22: Results from comparison various annealing temperatures of the forward and
reverse primers to the target nucleic from 113, 114, and EGR-4

Appendix B 17
Figure 23: Effect of increase in annealing temperatures of the primers to target nucleic
acid on Rn values from isolates 113, 114, and EGR 4.
Figure 24: Probe from the virus isolate 386 and target nucleic 386 (limit of detection)
using various dilutions

Appendix B 18
Figure 25: Probe from the virus isolate 386 and target nucleic (limit of detection) using
various dilutions of the target dsRNA nucleic acid
Figure 26: Probe from the virus isolate 357 and target nucleic (limit of detection) using
various dilutions of the target dsRNA nucleic acids.
Figure 27: Probe from the virus isolate 303 and target nucleic (limit of detection) using
various dilutions of the target dsRNA nucleic acids.
Figure 27: Probe from the virus isolate 303 and target nucleic (limit of detection) using
various dilutions of the target dsRNA nucleic acids.

Appendix B 19
Figure 27: Probe from the virus isolate 303 and target nucleic (limit of detection) using
various dilutions of the target dsRNA nucleic acids.
Figure 28: Probe from the virus isolate 357 and target nucleic acids coming from
different targets (limit of detection) using various dilutions of the target dsRNA nucleic
acids.

Appendix C
Milestone 2:
Task 2:
Table 1: Fungal isolates tested for Proteomic Analysis
Fungal Isolate Name Growth Characteristics Type of Nuclei
Genome Type
RS 303 Rapid Growth; Brown Heterokaryon Normal
RS 357 Rapid Growth; Brown Heterokaryon Normal
RS 386 Slower Growth; Brown Heterokaryon Normal
Rhs 113 Slower Growth; Brown Heterokaryon Normal
Rhs 114 Slower Growth; Brown Heterokaryon Normal
TE2-4 Rapid Growth; Downy Heterokaryon Normal
RS 29 Slower Growth; Pale yellow
Heterokaryon Normal
RS29.3 Slower Growth; White and Downy
Homokaryon Reduced Genome
T2 Slower Growth and white Homokaryon Reduced Genome
TOM-7 Rapid Growth and Brown Homokaryon Reduced Genome
EGR-4 Rapid Growth; white and Downy
Homokaryon Reduced Genome
HUD 2-1 Brown and Rapid Growth heterokaryon Normal
Note: Heterokaryon isolates have 2 nuclei; whereas Homokaryon isolates have
one nucleus

The 2-D work-flow process for protein target identification is shown in Figure 1 below.
Figure 2 and 3: Representative 2D-DIGE gels showing protein portrait of two R. solani
anastomosis groups. [A] ESNLG (GREEN spots) - EQRACH (RED spots) [B]
EQRCHF50 (GREEN spots) - EQRIVEA-A51 (RED spots). Over 2400 candidate protein
spots are detected on each gel
Test IS
Cy3Cy3 Cy2Cy2 Cy5Cy5
2D-DIGE2D-DIGE
Image AnalysisPick & Process
Spots
MS Analysis
Mix
Report
Gel 1
Reference
Isolate protein from infected & non-infected plat, fungi and virus isolated from plant and
fungi.
Plant and Fungal Model Systems
2D-DIGE Workflow process for identification of protein targets in plant and fungal model systems

Table 2. Spot statistics of proteins in Isolates of R. solani belonging to the same AG
Total number of spots Spot Statistics
1310 Decreased Similar Increased
526 (40.2%) 70 (5.3%) 714 (54.5%)
Figure 4and 5: Representative 2D-DIGE gels showing protein portrait of two R. solani
anastomosis groups. [A] ESNLG (GREEN spots) - EQRACH (RED spots) [B]
EQRCHF50 (GREEN spots) - EQRIVEA-A51 (RED spots).
RS 113 and T2

Table 3. Spot statistics of proteins in Isolates of R. solani belonging to different AG
Total number of spots Spot Statistics
2126 Decreased Similar Increased
413 (19.4%) 1140
(53.6%)
573 (27.%)
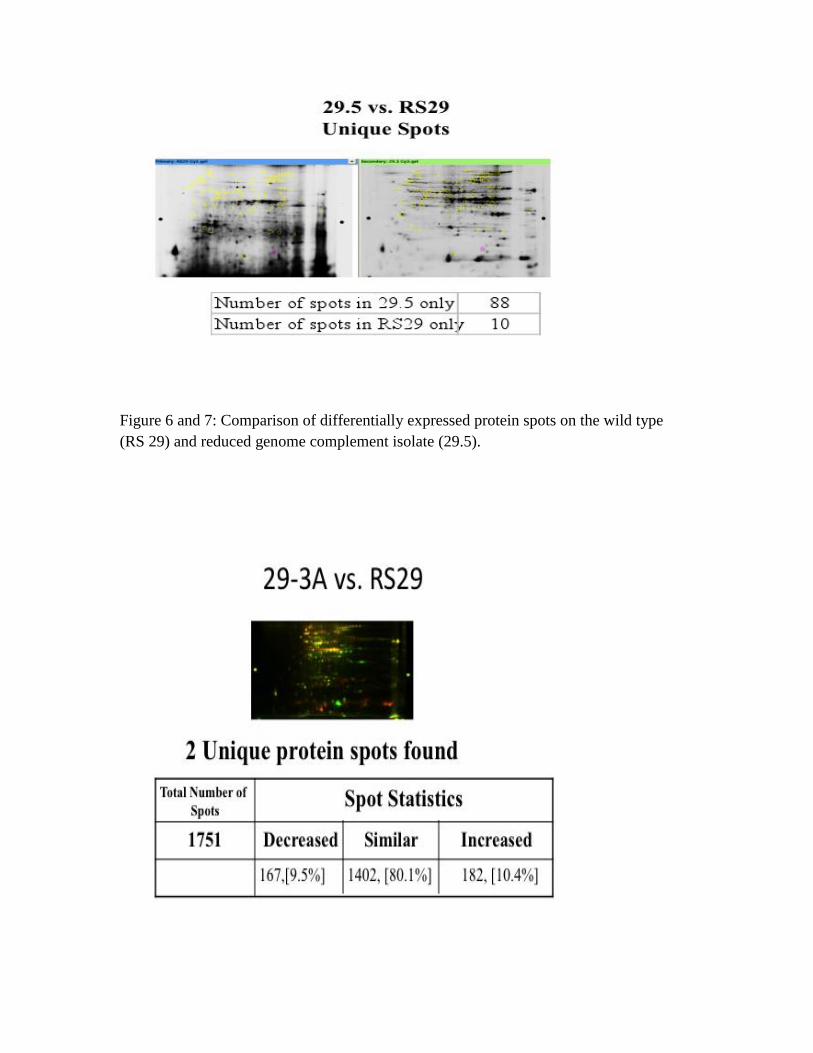
Figure 6 and 7: Comparison of differentially expressed protein spots on the wild type
(RS 29) and reduced genome complement isolate (29.5).

Figure 7 and 8: Up-regulated and down regulated proteins in (29.3A ) reduced genome
complement isolate and wild type RS 29.
Figure 9: Up-regulated and down regulated proteins when T2 was compared against
TOM 7 both have reduced genome complement isolates.

Figure 10: Up-regulated and down regulated proteins when TOM7 was compared against
T2both have reduced genome complement isolates.
Graph view 29-3.A vs. TOM7(Down regulated)
T2
tom
7
29-3
.A T2
tom
7
Stan
dard
ized
Log
Abu
ndan
ce
0.20.1
0-0.1-0.2
-0.3-0.4-0.5-0.6-0.7-0.8-0.9
-1
-1.1-1.2-1.3

FIGURE : 11 Graphic view of protein regulation in selected isolates of R.solani isolate
29.3 and TOM7
Figure 12: Representative 2D-DIGE gels showing protein portrait of two R. solani
isolates wild type heterokaryon (RS 114) having the virus and reduce genome
complement also having the virus (EGR-4) [A] ESNLG (GREEN spots) - EQRACH
(RED spots) [B] EQRCHF50 (GREEN spots) - EQRIVEA-A51 (RED spots).
Graph view 29-3.A vs. TOM7(Up regulated)
T2
tom
7
29-3
.A T2
tom
7
Stan
dard
ized
Log
Abu
ndan
ce0.2
0
-0.2
-0.4
-0.6
-0.8
-1
-1.2
-1.4
-1.6

Figure 13: Representative 2D-DIGE gels showing protein portrait of two R. solani
isolates wild type heterokaryons (357) having the virus and 386 also heterokaryon and
having the virus [A] ESNLG (GREEN spots) - EQRACH (RED spots) [B] EQRCHF50
(GREEN spots) - EQRIVEA-A51 (RED spots).
Figure 14: Representative 2D-DIGE gels showing protein portrait of two R. solani
isolates wild type heterokaryons (303) having the virus and HUD2-1also heterokaryon
and but not having the virus [A] ESNLG (GREEN spots) - EQRACH (RED spots) [B]
EQRCHF50 (GREEN spots) - EQRIVEA-A51 (RED spots).

Figure 15: Representative 2D-DIGE gels showing protein portrait of two R. solani
isolates wild type heterokaryons (386) having the virus and 357-also heterokaryon and
having the virus [A] ESNLG (GREEN spots) - EQRACH (RED spots) [B] EQRCHF50
(GREEN spots) - EQRIVEA-A51 (RED spots).

Figure 16: Representative Protein sample on Agilant bio-analyzer showing protein
portrait of R. solani isolates one wild type heterokaryons (Rhs1AP) having the virus
and all others that are virus free and reduce genome complements.
Figure 16: peptide sequencing where a full MS scan from m/z 400-1500 is followed by
MS/MS scans on the five most abundant ions.
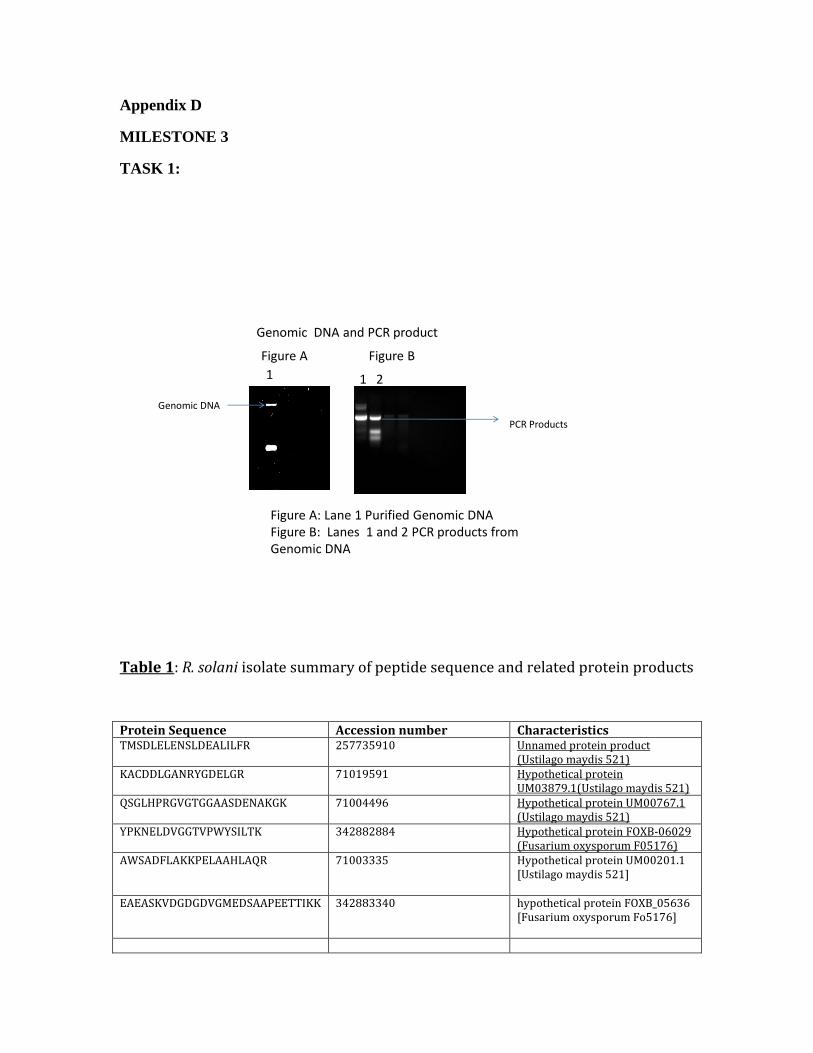
Appendix D
MILESTONE 3
TASK 1:
1 21
Genomic DNA and PCR product
Figure A: Lane 1 Purified Genomic DNA Figure B: Lanes 1 and 2 PCR products from Genomic DNA
Figure A Figure B
Genomic DNA
PCR Products
Table 1: R. solani isolate summary of peptide sequence and related protein products
Protein Sequence Accession number Characteristics TMSDLELENSLDEALILFR
257735910 Unnamed protein product (Ustilago maydis 521)
KACDDLGANRYGDELGR
71019591 Hypothetical protein UM03879.1(Ustilago maydis 521)
QSGLHPRGVGTGGAASDENAKGK 71004496 Hypothetical protein UM00767.1 (Ustilago maydis 521)
YPKNELDVGGTVPWYSILTK 342882884 Hypothetical protein FOXB-06029 (Fusarium oxysporum F05176)
AWSADFLAKKPELAAHLAQR
71003335
Hypothetical protein UM00201.1 [Ustilago maydis 521]
EAEASKVDGDGDVGMEDSAAPEETTIKK
342883340
hypothetical protein FOXB_05636 [Fusarium oxysporum Fo5176]

Table 2: Protein spot Characteristics from select Isolates of R. solani

AxB
Procedure for Nuclear Staining and Hyphal Anastomosis
FIRST DAY
・Prepare each isolate on a Petri-dish containing 20 ml of potato dextrose agar (PDA) and incubate 2 days.
SECOND DAY・Soak glass slides in plastic box filled with 70 % ethanol for sterilizing (Fig. A).
・Dry glass slides putting on paper towel (Fig. B).
・Write the names of pairing isolates on the edge of each glass slide.
・Wipe up inside of the plastic box.
FOURTH or FIFTH DAY・Prepare 0.1% phenosafranin (10 mg/10 ml H2O) and
3% KOH (0.3 g/10 ml H2O) staining solutions.
・When mycelium of paired colonies come in contact with each
other, remove agar plugs carefully with sterile forceps.
・Add one drop of 0.1% phenosafranin, and then add one drop of
3% KOH (Fig G).
・Cover with a clean glass cover slip and examine microscopically.
Fig. A
・Set the paper towel on the plastic box and moisturized by
distilled water, and put the glass slides into box (Fig E).
3% KOH
Fig. B Fig. C
Fig. G
THIRD DAY
2% WA
wipe the under side of slide
with sterile paper towel
to remove agar
Fig. D
Fig. E
Moisturized paper towel
Fig. F
AxB
0.1 % phenosafranin
AxB
Remove agar carefully
Soak in 70% ethanol
A x BA x B
A x BA x B
A x BA x B
A x BA x B
A x BA x B
A x BA x B
A x BA x B
A x BA x B
A x B
・Prepare 60 ml of 2% water agar (WA) in 100 ml bottle.
・Using forceps, dip each glass slide in WA (Fig C).
A x B
・Wipe the under side of slide with sterile paper towel
to remove agar (Fig D).
・Transfer two agar plugs from growing mycelium on PDA to
WA on glass slide (Fig F).
・Place plugs 2-3 cm agar and prepare two replicates of each isolate
including self control pairings.
・Cover and incubate for 12 to 48 hours
at 25 C in the dark.
Growing mycelium
Figure 1: Steps in Staining the actively growing fungal hyphae

Incompatible Interaction-Panoramic Imaging
Figure 2: Fungal Interactions: Mutant and Wild type
Figure 3: Incompatible Interaction Figure 4: Compatible Interaction

Figure 5 Killing reaction
Figure 6 Compatible Interaction
Fungal Interactions at Microscopic level

Incompatibility Interactions: Time course Interactions: Several isolates
Figure 7: Fungal Interactions at Microscopic level at various time intervals

Figure 8 : Protein profile following fungal anastomosis
Rfsi#P 12JE
(RJJ "" ~·
[FUJ .,.. {)'
1500
1500
1000 ~<o
<-· •\
"'' ll ~ I .,. 1. ~· I 500
~· [I ', , I"' ... ~1·, l .. \ r\ ~ ~ , ... '-' !!>~
.,<~>· ~p.V ~· h 0 --.:::...J- '--- \j ---
1000 ~'#' '\.
I
~ I <!'
500
l r1 ~~·
I~ 'I I
I I'J} t><~> ·" ~h 1.; f' ):1, ~· 0 ......... .l ~-- -'-
[ktla j 1.6 l.S o.s 15 2a <16 ;~ 9S [ICol]
Overoll Results for sample S : 123 E Overall Results for sample & : Rhs lAP
Number of peaks fo<rod: 13 1.5 loi.Jnt•r d pelks 'owl!: 10 llois.: 1.8 Total R!l Concc 8,895.5 ng.'~l T :>til Rtl Con:: 10,112.7 nrAI