Report: Bangladesh Integrated Household Survey - … · 93 7. SUMMARY AND CONCLUSIONS . A thorough...
147
93 7. SUMMARY AND CONCLUSIONS A thorough understanding of the factors influencing food availability, access, and utilization is crucial for effective policy design to improve the food security of the Bangladeshi people. Such understanding comes from context-specific and timely information. It is thus important to broaden the collection of and access to accurate data on the wide-ranging determinants of food security. This report presents results of analyses of the 2011–12 Bangladesh Integrated Household survey (BIHS) data on various topics that, combined, represent the current food security situation in Bangladesh. The study looks at how that situation varies between the Feed the Future (FTF) zone of influence in the southern region and other regions throughout the country. The BIHS was conducted under the Bangladesh Policy Research and Strategy Support Program (PRSSP), implemented by the International Food Policy Research Institute (IFPRI) with financial support from the U.S. Agency for International Development (USAID). The BIHS sample is statistically representative at the following levels: (1) rural Bangladesh nationwide, (2) rural areas of each of the country’s seven administrative divisions, and (3) the FTF zone. Summary Characteristics of Survey Households A person who can read and write a sentence in Bengali is considered to be literate. Overall, the female population has a lower literacy rate than the male population. Literacy rates have strong, positive relationships with income. Rangpur division has the lowest literacy rates (51 percent for males and 48 percent for females), in contrast to Barisal division (66 percent for males and 64 percent for females). Net school enrollment rates are higher in the FTF zone than national rural average rates. In the FTF zone, 86 percent of boys and 89 percent of girls are enrolled in primary schools, and 67 percent of boys and 72 percent of girls are enrolled in secondary schools. While girls overtake boys in terms of enrollment at both primary and secondary levels of education, the difference is larger at the secondary level. This pattern is an indication of the success of the female secondary education stipend programs in attracting girls to school. Among the selected assets in the analysis, ownership of mobile phones is most prevalent. Three-quarters of households in the FTF zone and 73 percent of households in entire rural Bangladesh own functional mobile phones. Over 90 percent of households in the richest quintile and even half of all households in the poorest quintile own mobile phones. New information and knowledge are critical inputs for improved agricultural practices and marketing of agricultural products, and mobile phone technology holds great promise in delivering information to resource-poor farmers through agricultural extension services. Besides agriculture, mobile-based interventions are also promising for enhancing education, nutrition, and health, which are important food security attributes. Clear policies need to be formulated taking into account the critical role of the private sector in this context. In addition to being an indicator of wealth, an electricity connection has important beneficial impacts on education, communication, and general lifestyle. About 45 percent of households in the FTF zone and 48 percent of households in entire rural Bangladesh have electricity. The percentage of households with electricity connections increases sharply as household income increases. The percentage of households having electricity varies widely across regions of
Transcript of Report: Bangladesh Integrated Household Survey - … · 93 7. SUMMARY AND CONCLUSIONS . A thorough...

93
7. SUMMARY AND CONCLUSIONS
A thorough understanding of the factors influencing food availability, access, and utilization is crucial for effective policy design to improve the food security of the Bangladeshi people. Such understanding comes from context-specific and timely information. It is thus important to broaden the collection of and access to accurate data on the wide-ranging determinants of food security.
This report presents results of analyses of the 2011–12 Bangladesh Integrated Household survey (BIHS) data on various topics that, combined, represent the current food security situation in Bangladesh. The study looks at how that situation varies between the Feed the Future (FTF) zone of influence in the southern region and other regions throughout the country. The BIHS was conducted under the Bangladesh Policy Research and Strategy Support Program (PRSSP), implemented by the International Food Policy Research Institute (IFPRI) with financial support from the U.S. Agency for International Development (USAID). The BIHS sample is statistically representative at the following levels: (1) rural Bangladesh nationwide, (2) rural areas of each of the country’s seven administrative divisions, and (3) the FTF zone.
Summary
Characteristics of Survey Households
A person who can read and write a sentence in Bengali is considered to be literate. Overall, the female population has a lower literacy rate than the male population. Literacy rates have strong, positive relationships with income. Rangpur division has the lowest literacy rates (51 percent for males and 48 percent for females), in contrast to Barisal division (66 percent for males and 64 percent for females).
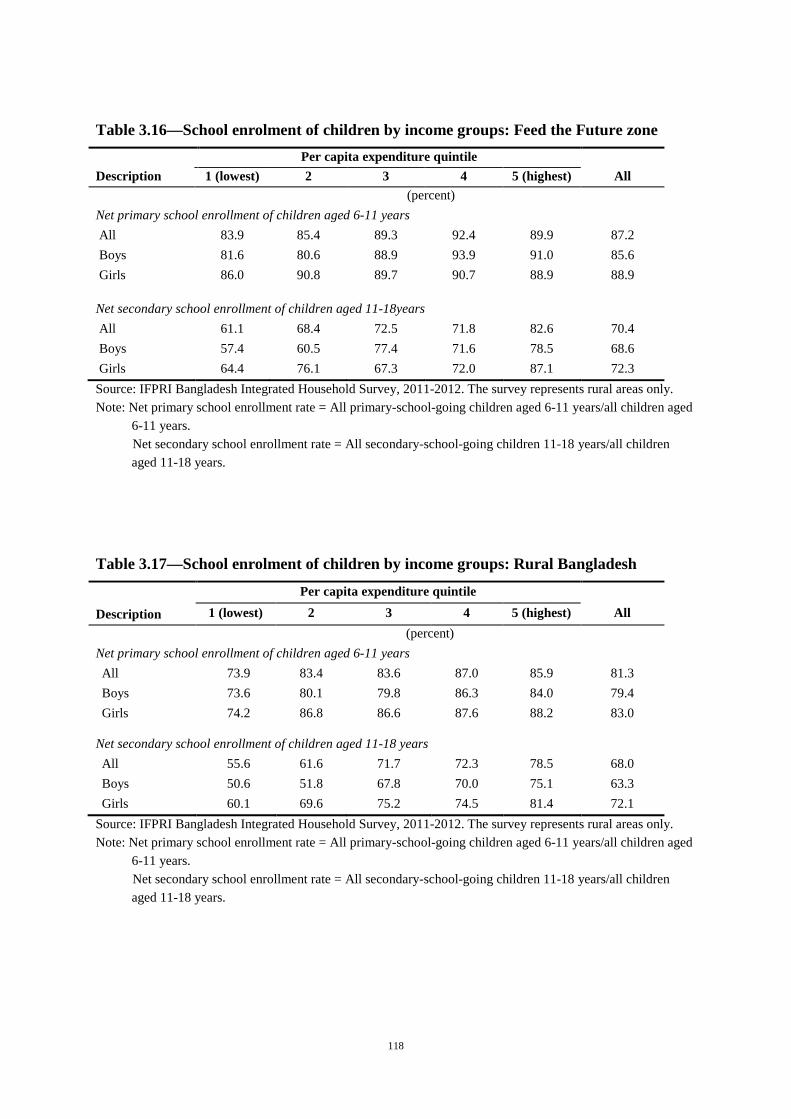
Net school enrollment rates are higher in the FTF zone than national rural average rates. In the FTF zone, 86 percent of boys and 89 percent of girls are enrolled in primary schools, and 67 percent of boys and 72 percent of girls are enrolled in secondary schools. While girls overtake boys in terms of enrollment at both primary and secondary levels of education, the difference is larger at the secondary level. This pattern is an indication of the success of the female secondary education stipend programs in attracting girls to school.
Among the selected assets in the analysis, ownership of mobile phones is most prevalent. Three-quarters of households in the FTF zone and 73 percent of households in entire rural Bangladesh own functional mobile phones. Over 90 percent of households in the richest quintile and even half of all households in the poorest quintile own mobile phones. New information and knowledge are critical inputs for improved agricultural practices and marketing of agricultural products, and mobile phone technology holds great promise in delivering information to resource-poor farmers through agricultural extension services. Besides agriculture, mobile-based interventions are also promising for enhancing education, nutrition, and health, which are important food security attributes. Clear policies need to be formulated taking into account the critical role of the private sector in this context.
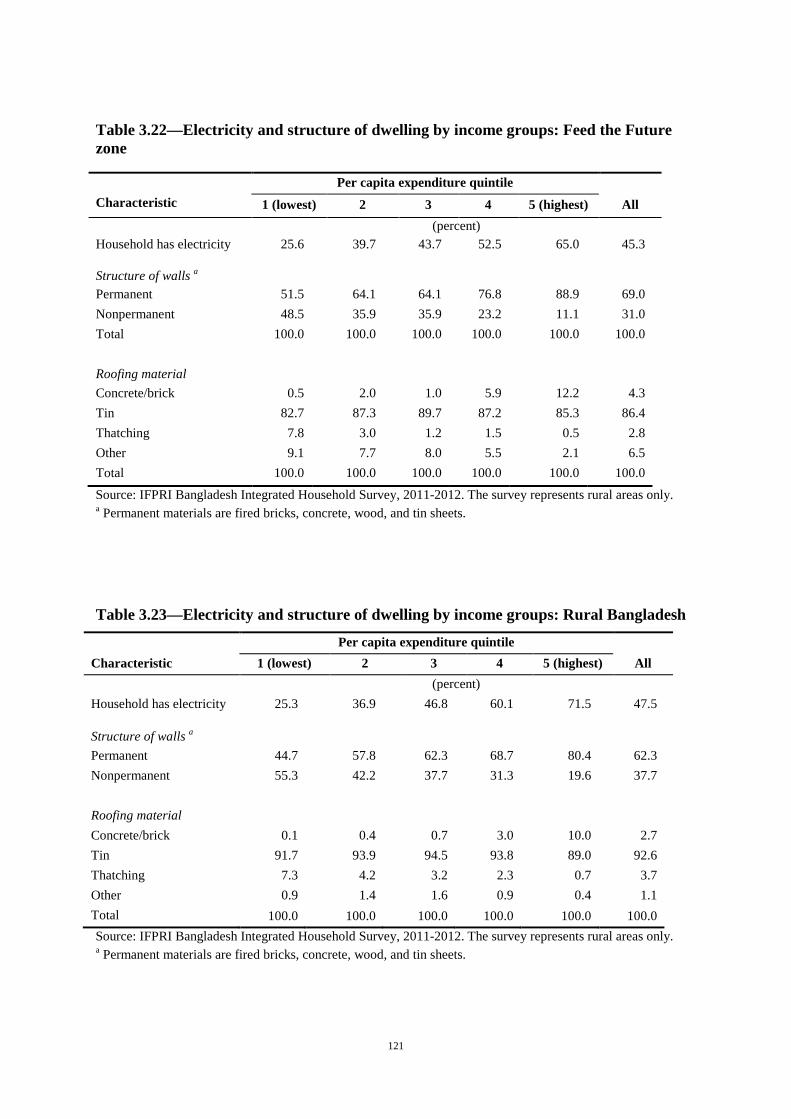
In addition to being an indicator of wealth, an electricity connection has important beneficial impacts on education, communication, and general lifestyle. About 45 percent of households in the FTF zone and 48 percent of households in entire rural Bangladesh have electricity. The percentage of households with electricity connections increases sharply as household income increases. The percentage of households having electricity varies widely across regions of

94
rural Bangladesh, ranging from 26 percent of households in Rangpur division to 56 percent in Chittagong division.
Food Availability Land is the most important factor of agricultural production. However, 51 percent of households in the FTF zone and 57 percent of households in entire rural Bangladesh are landless—they do not own any cultivable land.
In rural Bangladesh, about one-third of the farmers are pure tenants—that is, they do not own any cultivable land. In the FTF zone, 28 percent of all households who operate land for cultivation are pure tenants. These farmers have either sharecropping or cash-lease arrangements with landlords for their operated land. Much of the farmer-level analysis in this study disaggregates the sample farmers into four operated farm size groups: (1) marginal farmers (operating less than 0.5 acre of land), (2) small farmers (operating 0.5–1.49 acres of land), (3) medium farmers (operating 1.5–2.49 acres of land), and (4) large farmers (operating 2.5 acres or more).
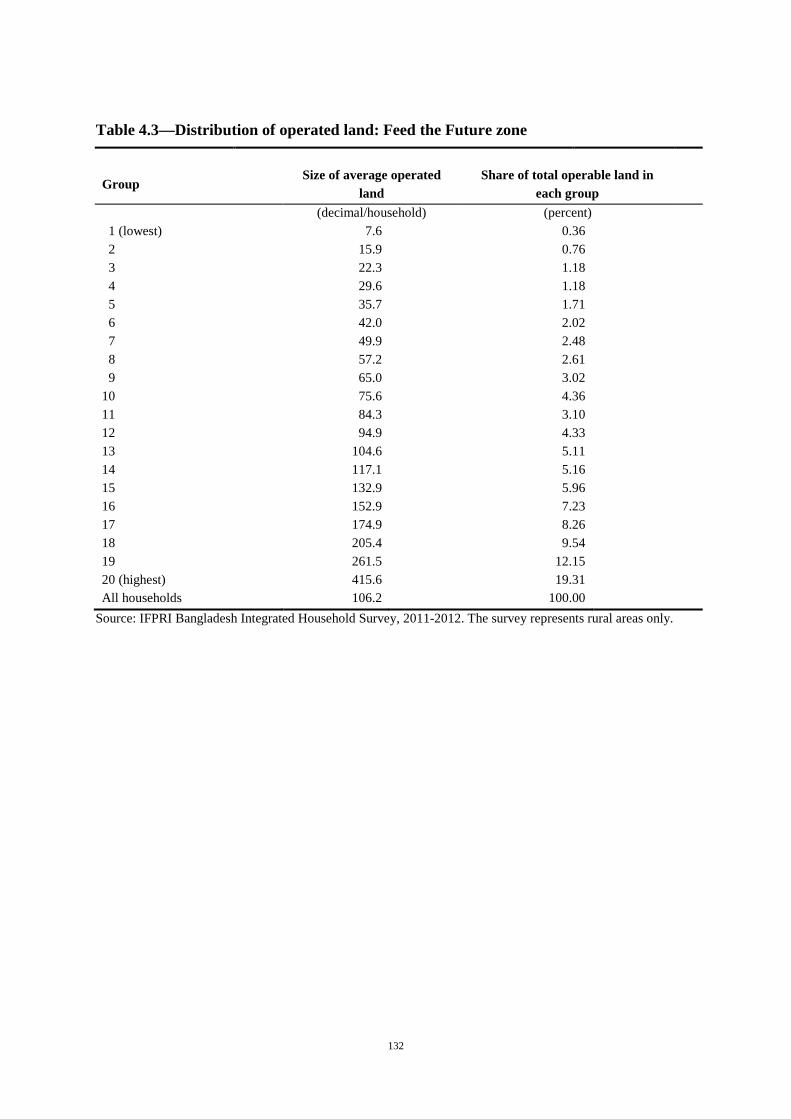
About one-third of all farmers in the FTF zone are marginal farmers, who operate only about 8 percent of total operated land in the zone. At the other extreme, only about 8 percent of all farmers in the FTF zone are large farmers, who operate about 27 percent of total operated land in the zone. Similar patterns are observed in overall rural Bangladesh.
The dominant tenurial arrangement in Bangladesh is sharecropping, where the produce is shared between the cultivator and the landowner in different proportions that have been agreed upon prior to cultivation. About 40 percent of the farmers are sharecroppers both in the FTF zone and at the national level. Land tenure patterns in the FTF zone are similar to those prevailing in rural Bangladesh as a whole.
Rice is overwhelmingly dominant in the country’s cropping patterns. On average, rice accounts for about 77 percent of the total cropped area of sample households at the national level. The share of rice on total cropped area varies, from about 68 percent in the FTF zone to as high as 94 percent in Sylhet division. Sylhet division shows a rather unique, almost rice monoculture cropping pattern, probably because of its considerable land area under tea plantations (which are excluded from total cropped land calculations) and its hilly topography. On the other hand, the relatively low share of rice on the total cropped land in the FTF zone indicates a more balanced and diversified cropping pattern in the zone in contrast to other regions of the country.
Irrigation is one of the most critical factors of agricultural production in Bangladesh. Tripling rice production in the country since the early 1970s would not have been possible without irrigation. About 60 percent of total cropped area of farm households in the FTF zone and 64 percent of total cropped areas in rural Bangladesh are irrigated. The rate of irrigation coverage ranges from only about 15 percent of total cropped land in Barisal division to about 85 percent in Rajshahi division.
Irrigation induces farmers to adopt high-yielding-variety (HYV) technologies for rice cultivation. About 80 percent of total HYV rice area in the FTF zone and about 76 percent of total HYV rice area in the country are cultivated under irrigation. Rice yields are about 74 percent higher on irrigated plots compared to nonirrigated plots in the FTF zone. At the national level, rice yields are 32 percent higher with irrigation.

95
Groundwater is the main source of irrigation for 59 percent of farmers in the FTF zone and 61 percent of farmers in entire rural Bangladesh. About 18 percent of farmers in the FTF zone use surface water for irrigation, compared to about 11 percent of farmers who use surface water for irrigation at the national level.
Farmers in the FTF zone use diesel fuel to run their irrigation equipment to irrigate about 77 percent of their total irrigated area, compared to about 67 percent at the national level.
In general, smaller farmers tend to use relatively larger amounts of fertilizers than larger farmers. For example, marginal farmers and small farmers in the FTF zone use 11 percent and 15 percent higher amounts of urea fertilizer, respectively, compared to large farmers for cultivating boro rice.
Almost one-half of the aus and aman farmers use seeds saved from the last harvest, either from their own harvest or received as gifts from their neighbors, friends, or relatives. The situation is quite different for boro rice cultivation, with most farmers purchasing their seeds.
What stands out across the three rice crops is the fact that the majority of the farmers do not know the brand of the seed they buy. Knowing the different seed brands can help farmers make informed choices, since large, well-known seed companies most likely have better-quality seeds for establishing their good reputation in the market.
Rice cultivation practices in Bangladesh are overwhelmingly male dominated, accounting for 95–99 percent of total labor use. Only about 1 percent of the total labor force for local transported aman (t. aman) cultivation is female, both in the FTF zone and in Bangladesh as a whole. The female labor rates are about 4 percent for HYV t. aman and 3 percent for HYV boro cultivation in the FTF zone. This minimal participation of women is mainly geared toward weeding activities.
In contrast, women perform a substantial proportion of rice post-harvest operations. For instance, in the FTF zone, total female labor use for post-harvest activities of HYV boro cultivation (carrying, threshing, drying, sorting, and packaging/bundling) amounts to 130 hours (16 days) per crop, of which women’s labor use accounts for 32 hours, or 25 percent. The use of female labor is particularly high for paddy drying, ranging from 58 percent to 71 percent of total labor use for this activity.
Women play a significant role in the production of high-value crops, such as vegetables. For example, at the national level, women’s participation accounts for 42 percent of total labor use for sweet gourd cultivation, 38 percent for tomatoes, 20 percent for leafy vegetables, and 18 percent for potatoes.
The share of women’s time spent for raising chickens and ducks is over 90 percent at the country level. Women’s time also accounts for 55 percent of total time for raising goats and about 30 percent for taking care of milk cows in rural Bangladesh.
The use of mechanical power for farmland preparation is quite high: 76 percent of farmers in the FTF zone and 72 percent of farmers at the national rural level use two-wheeler power tillers.
Marginal and small farmers constitute the largest share of farmers in Bangladesh. However, the outreach of agricultural extension services to these two groups of farmers is very low in absolute terms and considerably less than the service provided to medium and large farmers.

96
Credit is a critical input for farmers. However, their access to formal agricultural credit institutions, such as the Bangladesh Krishi Bank (BKB) and the Rajshahi Krishi Unnayan Bank (RAKUB), is relatively very small. Moreover, the outreach of these two credit institutions is more toward medium and large farmers than marginal and small farmers.
This study provides the estimates of costs of production and returns for rice cultivation. Full cost (including the imputed values of land rent and family labor) per hectare is lowest for local aman cultivation, and increases by about 14 percent for HYV aman cultivation and by 57 percent for HYV boro cultivation. By contrast, the full cost per metric ton of paddy is the highest for local aman, and the cost declines sharply for HYV aman and HYV boro. The full cost per metric ton of boro paddy is 37 percent—less than that of local aman.
Crop output can increase substantially if the farmers adopt modern technologies, such as biochemical technology and irrigation. Within such a technological environment, the farmers’ production cost per unit of output declines because of increased yields. The average yield of local aman is only 1.6 metric tons of rice per hectare (tons/ha) for the national sample. The yield increases to 2.4 tons/ha for HYV aman and to 3.7 tons/ha for HYV boro—more than double the yield of local aman. This analysis demonstrates the importance of investment in agricultural research for productivity improvements.
Did the government’s paddy procurement price cover the average cost of paddy production in 2011? The government’s domestic procurement price of paddy was Bangladeshi Taka (Tk) 18 per kilogram (Tk 18,000 per metric ton) in 2011 for the aman and the boro seasons. The procurement price covered the full cost of boro paddy cultivation. However, for local and HYV aman, the procurement price covered only the cash cost of production.
Did the government procurement price cover the cost of production of pure tenants who must pay rent for the land they cultivate (either in cash or in terms of crop share)? Taking into account the imputed value of land rent but not the imputed value of family labor in cost calculations, the costs per ton of producing boro, HYV aman, and local aman are Tk 13,033, Tk 16,867, and Tk 19,970, respectively. Thus, the 2011 paddy procurement price covered the cost of production (including imputed land rent but not family labor) of HYV boro and HYV aman for the pure-tenant farmers, but not for mixed-tenant farmers who cultivated local t. aman.
On a cash cost basis (that is, when the full-cost, imputed values of land rent and family labor are not taken into account in cost calculations), the rates of profit per ton are 68 percent of total cash cost for HYV boro, 45 percent for HYV aman, and 26 percent for local aman. However, when the imputed values of land rent and family labor are considered in the cost calculations, only HYV boro cultivation registers a small profit margin (about 6 percent of full cost). Local and HYV aman farmers appear to incur considerable loss when the profitability is calculated on a full-cost basis.
BIHS collected information on households’ month-end rice and paddy stock from December 2010 to November 2011. Key findings are (1) rice stocks fluctuate throughout the year, peaking around May during the boro harvest season and again in November for the aman season; (2) the stocks held by farmers in May are twice as large as the average monthly stock (roughly 4 million metric tons), which highlights the importance of boro rice; and (3) the stocks held by farmers in Dhaka, Rajshahi, and Rangpur represent about 68 percent of the total stock available in the country.

97
Economic Access to Food
In the FTF zone, 40.5 percent of the population lived below the purchasing power parity exchange rate of $1.25 per person per day in 2011–12. While 38.2 percent of the population in rural Bangladesh was living below the family welfare threshold, there are pronounced regional differences in the incidence, with the rate ranging from a low of 31.0 percent in Chittagong division to as high as 65.5 percent in Rangpur division.
The labor force participation rate for all household members age 15 and above is about 73 percent both in the FTF zone and in entire rural Bangladesh. However, there are considerable differences in labor force participation rates in terms of males and females: in the FTF zone, the overall labor force participation rate for males is 86 percent, while for females, it is 61 percent. The rates are similar in rural Bangladesh as a whole. The labor force participation rate is the highest for the poorest income group and declines as household income increases, and this relationship is more pronounced for males.
Rural Bangladesh is predominantly an agrarian society, with low rates of employment in the nonfarm sector. Farming is by far the main source of employment, with two-thirds of the total labor force in rural Bangladesh engaged in farming. The overall rate of labor force participation is highest in Rangpur division (82 percent) and lowest in Chittagong division (60 percent). The patterns of regional labor force participation rates reflect marked gender differences. Indeed, the overall lowest participation rate in Chittagong division is driven mostly by relatively very low participation rate by females (44 percent). On the other hand, the gender gap in labor force participation is the smallest in Rangpur division, owing to the high rate of participation by women (73 percent).
Agricultural wage laborers are among the poorest in rural Bangladesh. Therefore, the level of agricultural wage has a large bearing on the incidence of poverty and food insecurity. Agricultural wages have increased quite sharply in recent years, enabling the rural poorest to improve their livelihoods significantly.
The BIHS data suggest that, on average, a rural household with 4.7 members consumes 2.33 kilograms of rice per day (average daily per capita rice consumption is 495.5 grams). Average daily agricultural wage for a male worker in rural Bangladesh during the survey could buy 7.6 kilograms of rice, which is 3.3 times higher than the average rice consumption of a rural household.
In the FTF zone, 21.9 percent of the households received private transfers either from within Bangladesh or abroad: 16.9 percent of the households received private assistance from within the country, 4.4 percent received remittance from abroad, and 0.6 percent received transfers from both home and abroad. A higher percentage of households in the richer expenditure quintiles received transfers than those in the poorer quintiles. Chittagong division has the highest percentage of households (24 percent) receiving remittance from abroad, followed by Sylhet division (19 percent), and by Rangpur division at the lowest end of the scale (1.3 percent).
At the national rural level, the average total private transfers (average of both recipient and nonrecipient households) represent 13.8 percent of average annual household income, domestic transfers account for 3.7 percent, and remittances from abroad account for 10.2 percent. Private transfers as a percentage of total household income are higher for richer households, accounting for 23.6 percent of average total income of the richest 20 percent of all, compared to only 4.1 percent for the households in the poorest quintile group. Private

98
transfers as a percentage of total household income vary widely across divisions, with the highest incidence in Chittagong and the lowest in Rajshahi. The highest transfer in Chittagong division is driven by remittance from abroad—total private transfers account for 29.7 percent of average total annual income of households, while international remittances account for 25.1 percent.
Most of nonagricultural businesses owned by rural households (62 percent) are trade-related enterprises. This share is more than twice as high as manufacturing (25 percent) businesses, and more than four times higher than service-oriented (13 percent) businesses at the national level. Trade-related businesses have the highest profits compared to other occupational sectors (manufacturing and services). They tend to be located in fixed premises outside of the homestead, and represent a very low share of registered businesses (one-tenth of trade businesses).
Turning next to household access to credit, average loan size is lower for households in the FTF zone (Tk 41,232 per household) than in rural Bangladesh as a whole (Tk 52,216 per household). The loan size increases with household income, reflecting greater ease of borrowing for higher-income households. Nongovernmental organizations (NGOs) are the primary source of credit for all households. NGOs tend to be more important loan sources for poorer households, indicating these households’ lower access to credit from commercial sources as well as NGOs’ targeting performance.
On average, 61 percent of households in the FTF zone and 59 percent of the households at the national rural level reported having any savings. In terms of the place of savings, NGOs account for the bulk of savings, with 40 percent of household savings in the FTF zone and 38 percent of savings at the national rural level held by NGOs. The rates are higher for households in the lower-income groups.
In rural Bangladesh, 45 percent of households participate in at least one social safety net program. In any safety net system, there are problems of exclusion (i.e., leaving out those who are needy) and inclusion (i.e., providing benefits to those who do not need them). Although Bangladesh’s safety net system is quite progressive, it excludes many poor and includes many nonpoor households. While 61 percent of the households in the poorest income quintile are beneficiaries of at least one safety net program, 22 percent of the households in the highest income group also receive benefits from the system in rural Bangladesh.
Among all safety net programs, the Employment Generation Program for the Poorest (EGPP) targets the poorest most effectively, followed by the school feeding program. The work requirement of the EGGP makes the program strongly self-targeted. Both male and female beneficiaries do physical work in the program that mainly involves earth moving. About half (49 percent) of the total EGPP participants belong to the poorest 20 percent of the households. However, around 29 percent of the EGPP participants were in the top three income quintiles in 2011, suggesting that there is room for improving the program’s performance targeting mechanisms.
On average, cash transfers account for 70 percent and the value of food transfers account for 30 percent of total annual transfers received by safety net beneficiaries. Compared to the recipients in the poorest quintile, the average amount of cash transfers is 31 percent higher for safety net participants belonging to the richest quintile (22 percent of the households in the richest quintile are recipients of safety net transfers).

99
The analysis suggests that safety net programs must improve their targeting effectiveness to reach the poorest of the poor. For an efficient safety net system in Bangladesh, the administrative and institutional capacities to target the poorest and run the programs, and the fiscal affordability of programs, are critical considerations.
The analysis of the BIHS data shows that medical expenses due to illness or injuries were the most common cause of crisis, affecting more than one-fifth of all households, on average. A well-designed and targeted health insurance program holds promise to effectively mitigate the health risks faced by the poor.
Food Utilization and Nutrition
Bangladesh has made commendable progress in food production. However, a considerable share of households is food energy-deficient. An analysis of the BIHS data shows that in 2011–12, 36.8 percent of households in the FTF zone and 35.3 percent of households in the rural national sample were food energy-deficient, who could not afford an adequate diet to provide 2,122 kilocalories per person per day (kcal/person/day). Furthermore, 17.5 percent of the households in the FTF zone and 16.5 percent of the households in entire rural Bangladesh were below the lower food energy threshold of 1,805 kcal/person/day and, therefore, remained severely food energy-deficient.
BIHS is the first nationally representative household survey in the country that collected data on intrahousehold food consumption, using a combination of 24-hour food-recall and food-weighing methods to estimate consumption quantities of various food items by individual household members. In general, individuals with higher incomes have more adequate calorie intakes. Yet, even the richest income groups in the FTF zone and the country as a whole consume insufficient amounts of calories. The national-level figures are greater than those of the FTF zone, especially for the lower-income groups, indicating that, on average, the FTF zone is worse off in terms of calorie adequacy than the country is as a whole.
Female primary school-age children and adolescents are better off in terms of calorie adequacy than the males in their age group. This is consistent for the FTF zone as well as the national sample. However, adult men consume a more calorie-adequate diet than women. In fact, adult women are among the worst off in terms of calorie adequacy in both the samples. With the lowest calorie adequacy among all age groups across both samples, preschool children of the FTF zone stand out from the rest.
Overall, the findings emphasize the need to continue to support and address both exclusive breastfeeding and adequate complementary feeding, to ensure that children under age 2 have diets of adequate nutrient quality. Practices, such as early introduction of liquids, compromise exclusive breastfeeding. And even though a majority of babies are introduced to high-nutrient-value foods in the right age group (6–8 months), there is much room for improvement. Continued efforts to scale up counseling by frontline health workers and to shape social norms around infant and young child feeding will be important.
Last, but not least, there are practically no differences in the types of complementary foods offered to boys and girls. This is an important finding, in the face of a general notion that gender discrimination in feeding children is widespread and starts early. Overall, the differences in achievement of minimum diet diversity by child age, by administrative division, and by per capita expenditure quintile are greater than differences due to child gender. The differences by division and expenditure quintile likely reflect both food availability and access, but a striking finding here is the poor diet quality, even among high-income quintile groups in these rural areas.

100
Conclusions In rural Bangladesh, land tenure is a major constraint, particularly for the food insecure, who, for a large part, do not own the land that they work. About one-third of the farmers do not own any cultivable land. Therefore, they have insecure, prohibitive, and unstable access to land through sharecropping or land-leasing arrangements, which reduce the impact of agricultural development interventions on their livelihoods. These farmers must pay rent for the land they cultivate, which makes farming a low-profit enterprise for them. Greater investment in agricultural research for increased productivity will result in lower production cost per unit of output for these farmers and higher profitability, if crop yields increase with the adoption of modern agricultural technology.
Improvement in food security can be enhanced by rapidly increasing the incomes of small landholding farmers. These farmers dominate the agricultural sector in Bangladesh. Providing them with adequate access to institutional credit and effective agricultural extension services is critical for agricultural development in the FTF zone and in rural Bangladesh as a whole.
Since Bangladesh currently has very little fallow arable land available, future production increases will have to come from higher yields. This will mean developing new technologies and innovations through research to address production problems in flood, drought, and salinity-induced stressed conditions, while at the same time trying to reduce gaps in yields and increase yields in high-potential areas. Emerging food and agricultural technologies offer significant promise for augmenting agricultural productivity, but only if they are disseminated to farmers through effective extension systems and are supported by appropriate policies and institutions.
Food security in Bangladesh has historically relied on growth in rice—the country’s major crop in terms of area cultivated and income generated (or value added). Future agricultural growth, however, will likely need to increasingly emphasize higher-value crops, as well as fish, poultry, and dairy products, in part because of land constraints.
Generally, labor productivity is known to be relatively low in agriculture, compared to other sectors of the economy. In Bangladesh, the capacity to absorb the growing rural labor force in agriculture is extremely limited, because of no scope for expansion of the land, the intensity of cropping has almost reached the limit, and the growth of crop production now depends almost entirely on technological progress, resulting in low employment response of increased output. Therefore, a shift of rural labor force out of agriculture, accompanied by faster agricultural growth, is key to boosting rural incomes. This requires the creation of nonfarm employment opportunities in higher-productivity sectors.
Rapid development of rural-urban food value chains is important for generating nonfarm employment and incomes. The growth of the agro-processing sector would lead to enhanced rural employment. Modern food retail is currently very small, but it is growing rapidly. While private-sector activities are increasingly creating rural employment opportunities and income, the public sector should complement them. The government’s role in providing an enabling policy environment for the private sector is crucial in this regard.
A well-functioning social safety net system can effectively improve Bangladesh’s food security by increasing the real incomes of its poor. Bangladesh possesses a wealth of institutional diversity and a wide range of experience in assisting the poor through social safety net programs. To confirm its commitment to establishing a comprehensive social

101
protection strategy, in fiscal year 2011–12 the Government of Bangladesh allocated US$2.7 billion, accounting for 14 percent of its budget, to cover more than 70 safety net program. The safety net budget represented 2.4 percent of the nation’s gross domestic product for 2011–12.
A number of safety net programs have been effective in augmenting the incomes of extremely poor households in Bangladesh and are helping them cope with stresses and shocks. Nevertheless, important issues remain. Programs must improve their targeting effectiveness to reach the poorest of the poor. The targeting errors of exclusion and inclusion are large in most programs. Many programs have limited coverage, are uncoordinated, and are not adequately funded. Program resources and, hence benefits to program participants, are spread too thin. For an efficient safety net system in Bangladesh, the administrative and institutional capacities to target the poorest and run the programs, and the fiscal affordability of programs, are critical considerations. In Bangladesh, tripling rice production in the past three decades has, to a large extent, solved the foodgrain availability problem. While rice production has increased significantly, it has not been matched by increased production (and consumption) of noncereal production of vegetables, fruits, fish, eggs, and meat. This imbalance has adverse implications for protein and micronutrient intakes, especially for the poor and the poorest.
Rice is overwhelmingly dominant in the cropping patterns as well as in the diet of the people. Rice accounts for 77 percent of total cropped area and 71 percent of the total dietary energy intakes on average. One of the most important causes of widespread malnutrition is the deficiency in the habitual diet in Bangladesh, with rice contributing most of the total dietary energy and other foods contributing much less than required. As a result, food consumption patterns show very little dietary diversity. A large share of the Bangladeshi population is food-insecure due to poor dietary quality. The solution lies in increased consumption of high-quality foods (such as fruits, vegetables, fish, meat, milk), which the poor desire but cannot afford.
Agriculture can play an important role by contributing to the improved quality (diversity) of the family diet, reducing micronutrient undernutrition. This brings to the fore the policy issue of reorienting agriculture for ensuring the supply of nonrice food for improved dietary quality. In Bangladesh, investments in agricultural research to improve productivity of nonstaple foods have been somewhat neglected in favor of cereal-centric investments to improve productivity of rice and wheat. Review of agricultural investments in high-value-added and high-nutrition value-added nonstaples is urgently needed.

102

103
REFERENCES Ahmed, A. U., 1994. Input-output coefficients for estimating rice production costs and
returns in Bangladesh. Bangladesh Food Policy Project Manuscript 61. Washington, D.C.: International Food Policy Research Institute.
Ahmed, A.U., N. Aberman, M. Jabbar, and N. Akhtar. 2011. Policy perspectives of the
country investment plan for food and nutrition security in Bangladesh. Report prepared for the Bangladesh Government’s Country Investment Plan (CIP) for Agriculture, Food Security and Nutrition. Dhaka: Bangladesh Policy Research and Strategy Support Program, International Food Policy Research Institute.
Ahmed, A.U., P. Dorosh, Q. Shahabuddin, and R. Talukder. 2010. Income growth, safety
nets, and public food distribution. Paper prepared for the Bangladesh Food Security Investment Forum, May 26-27, 2010, Dhaka, Bangladesh. Washington, D.C.: International Food Policy Research Institute.
Ahmed, A.U., A. Quisumbing, J. Villafuerte, and R. dela Cruz. 2004. Strengthening social
protection in the Philippines. Policy paper prepared for the World Bank. Washington, D.C.: International Food Policy Research Institute.
Ahmed, A. U., and R. K. Sampath. 1992. Effects of irrigation-induced technological change
in Bangladesh rice production. American Journal of Agricultural Economics 74(1): 144-157.
BBS (Bangladesh Bureau of Statistics). 2007. Report of the Household Income and
Expenditure Survey 2005. Bangladesh Bureau of Statistics, Planning Division, Ministry of Planning, Government of the People’s Republic of Bangladesh, Dhaka.
BBS (Bangladesh Bureau of Statistics). 2011. Report of the Household Income and
Expenditure Survey 2010. Bangladesh Bureau of Statistics, Statistics Division, Ministry of Planning, Government of the People’s Republic of Bangladesh, Dhaka.
Friedman, M. 1957. A theory of the consumption function. Princeton, N.J.: Princeton
University Press. Lutter, C.K., Daelmans, B.M.E.G., de Onis, M., Kothari, M.T., Ruel, M.T., Arimond, M.,
Deitchler, M., Dewey, K.G., Blossner, M., Borghi, E. 2011. Undernutrition, poor feeding practices, and low coverage of key nutrition interventions. Pediatr.; 128:e1418-e1427.
Mellor, J. W. 2010. Increasing food security through strategies and investment to increase
income of small commercial farmers. Paper presented at the Bangladesh Food Security Investment Forum, Dhaka, May 26-27, 2010.
NIPORT (National Institute of Population Research and Training), Mitra and Associates,
MEASURE DHS ICF International. 2013. Bangladesh Demographic and Health Survey 2011 Preliminary Report. Calverton (MD): ICF Macro.

104
Sen, B., P. Menon, A. U. Ahmed, and F. Chowdhsury. Food utilization and nutrition
security. 2010. Paper prepared for the Bangladesh Food Security Investment Forum, May 26-27, 2010, Dhaka, Bangladesh. Washington, D.C.: International Food Policy Research Institute.
Timmer, C. P., W. D. Falcon, and S. R. Pearson. 1983. Food Policy Analysis. Baltimore:
Johns Hopkins University Press for the World Bank. Zhang, Z., S. Rashid, K. Ahmad, V. Mueller, H. L. Lee, S. Lemma, S. Belal, and A. U.
Ahmed. 2013. Rising wages in Bangladesh. IFPRI Discussion Paper 1249. Washington, D.C.: International Food Policy Research Institute.

105
TABLES

106

107
TABLES FOR SECTION 3: PROFILE OF SURVEY HOUSEHOLDS

108
Table 3.1—Characteristics of survey households by income groups: Feed the Future zone
Per capita expenditure quintile Item 1 (lowest) 2 3 4 5 (highest) All Household size (person) 5.0 5.0 4.7 4.5 4.0 4.7 Dependency ratio* (percent) 116.3 100.2 82.1 79.5 66.8 90.5 Primary-school-age children (6-11 years) who do not go to school
16.1 14.6 10.7 7.6 10.1 12.8
Secondary-school-age children (11-18 years) who do not go to school
38.9 31.6 27.5 28.2 17.4 29.6
Years of schooling, male household head
2.4 2.8 3.4 4.2 6.4 3.8
Years of schooling, wife of household head
2.6 3.0 3.2 4.0 5.1 3.6
Years of schooling of adult male aged 15 and above
3.0 4.0 4.7 5.4 7.2 4.8
Years of schooling of adult female aged 15 and above
2.8 3.6 4.2 4.7 5.9 4.1
No schooling adult male (percent) 51.9 38.9 35.8 29.9 19.8 35.9 No schooling adult female (percent) 52.5 45.9 40.9 34.6 24.7 40.5 Female-headed household (percent) 17.2 14.7 11.2 17.6 22.1 16.6 Average owned cultivable landholding size (decimal)
29.2 44.7 56.7 85.8 137.4 70.6
Less than 0.5 acre of cultivable land owned (percent)
86.0 71.7 64.1 50.5 41.4 62.8
Per capita monthly expenditure (Tk) 1,313 1,809 2,285 2,956 4,964 2,660
Principal occupation of household head (percent) Agricultural day laborer 22.4 15.0 9.0 3.8 2.8 11.2 Nonagricultural day labor 6.6 7.1 5.5 2.3 0.6 4.7 Salaried 2.5 2.0 4.8 4.8 8.6 4.3 Self employed 8.1 6.9 6.2 9.4 7.1 7.6 Rickshaw/van puller 6.5 5.9 4.4 1.8 0.7 4.1 Business/trade 5.1 10.6 12.5 11.6 19.6 11.4 Production business 0.9 0.5 0.6 0.3 0.4 0.5 Livestock related work - 0.2 - 0.4 0.2 0.2 Farming 40.5 44.2 51.8 57.6 44.3 47.5 Non-earning occupations 7.5 7.6 5.3 8.0 15.6 8.5 Total 100.0 100.0 100.0 100.0 100.0 100.0
Source: IFPRI Bangladesh Integrated Household Survey, 2011-2012. The survey represents rural areas only. *Dependency ratio= number of dependents (less than 15 or over 60 years of age) divided by number of working age people (15 to 60 years).

109
Table 3.2—Characteristics of survey households by income groups: Rural Bangladesh
Per capita expenditure quintile Item 1 (lowest) 2 3 4 5 (highest) All Household size (person) 5.0 4.8 4.7 4.6 4.5 4.7 Dependency ratio* (percent) 121.5 98.7 90.2 82.1 70.6 94.4 Primary-school-age children (6-11 years) who do not go to school
26.1 16.6 16.4 13.0 14.1 18.7
Secondary-school-age children (11-18 years) who do not go to school
44.4 38.4 28.3 27.7 21.5 32.0
Years of schooling, male household head
1.6 2.6 3.0 4.0 5.9 3.3
Years of schooling, wife of household head
2.0 2.7 3.1 3.6 4.7 3.1
Years of schooling of adult male aged 15 and above
2.3 3.4 4.1 5.3 6.6 4.3
Years of schooling of adult female aged 15 and above
2.3 3.3 3.9 4.5 5.6 3.9
No schooling adult male (percent) 63.2 48.0 42.8 31.5 23.5 42.3 No schooling adult female (percent) 62.8 51.4 44.3 38.7 29.5 45.9 Female-headed household (percent) 15.6 14.5 14.1 16.5 25.3 17.1 Average owned cultivable landholding size (decimal)
17.9 34.0 46.4 66.9 126.6 57.0
Less than 0.5 acre of cultivable land owned (percent)
91.0 78.5 71.3 63.5 46.1 70.7
Per capita monthly expenditure (Tk) 1,323 1,838 2,344 3,041 5,155 2,692
Principal occupation of household head (percent) Agricultural day laborer 26.5 14.9 9.1 5.1 1.3 12.3 Nonagricultural day labor 8.2 6.6 5.1 3.6 1.0 5.1 Salaried 2.6 3.1 3.8 4.3 6.9 4.0 Self employed 8.3 9.2 8.5 7.3 5.9 7.9 Rickshaw/van puller 8.2 5.6 5.2 1.4 1.2 4.6 Business/trade 5.6 10.9 11.2 14.6 18.1 11.7 Production business 0.7 0.9 0.5 0.8 0.5 0.7 Livestock related work 0.4 0.2 0.0 0.2 0.3 0.2 Farming 33.2 41.3 48.4 51.5 44.6 43.3 Non-earning occupations 6.3 7.3 8.3 11.3 20.1 10.2 Total 100.0 100.0 100.0 100.0 100.0 100.0
Source: IFPRI Bangladesh Integrated Household Survey, 2011-2012. The survey represents rural areas only. *Dependency ratio= number of dependents (less than 15 or over 60 years of age) divided by number of working age people (15 to 60 years).

110
Table 3.3—Characteristics of survey households by division: Rural Bangladesh
Division
Description Barisal Chittagong Dhaka Khulna Rajshahi Rangpur Sylhet Bangladesh
Household size (person) 4.8 5.1 4.6 4.4 4.6 4.4 5.9 4.7
Dependency ratio* (percent)
100.9 114.0 98.2 75.1 77.4 85.9 105.5 94.4
Primary-school-age children (6-11 years) who do not go to school
16.1 22.9 19.9 12.6 15.4 20.8 16.0 18.7
Secondary-school-age children (11-18 years) who do not go to school
30.6 39.2 30.3 24.7 23.1 26.8 45.8 32.0
Years of schooling, male household head
4.0 3.6 3.0 4.0 3.1 3.0 3.2 3.3
Years of schooling, wife of household head
3.9 3.5 2.8 3.8 2.9 3.0 3.0 3.1
Years of schooling of adult male aged 15 and above
4.9 4.6 4.0 5.1 4.2 3.7 4.0 4.3
Years of schooling of adult female aged 15 and above
4.6 4.4 3.6 4.4 3.6 3.2 3.6 3.9
No schooling adult male (percent)
32.4 37.8 46.4 36.2 44.5 49.4 39.5 42.3
No schooling adult female (percent)
33.9 41.4 48.6 42.2 49.4 51.8 48.3 45.9
Female-headed household (percent)
24.5 34.4 18.0 10.2 4.5 9.4 19.0 17.1
Average owned cultivable landholding size (decimal)
60.4 33.1 56.5 82.7 62.7 48.7 74.8 57.0
Less than 0.5 acre of cultivable land owned (percent)
67.6 79.5 68.5 63.0 70.9 72.9 69.6 70.7
Per capita monthly expenditure (Tk)
2,606 3,090 2,842 2,691 2,515 1,989 2,952 2,692
Principal occupation of household head (percent) Agricultural day laborer 10.7 5.5 9.9 9.6 16.6 26.3 10.1 12.3
Nonagricultural day labor 5.6 4.7 4.7 5.9 3.4 5.4 9.3 5.1
Salaried 4.7 3.8 3.7 4.9 3.5 3.6 5.5 4.0
Self employed 7.6 9.8 7.0 6.3 7.7 8.0 10.1 7.9
Rickshaw/van puller 2.1 4.1 4.9 4.2 6.1 5.3 2.5 4.6
Business/trade 13.5 12.0 10.5 11.2 12.0 12.8 11.6 11.7
Production business 1.1 0.9 0.5 1.1 0.8 0.2 1.0 0.7
Livestock related work 0.3 0.1 0.0 0.5 0.2 0.5 0.0 0.2
Farming 43.1 32.2 48.6 52.2 47.6 34.8 42.7 43.3
Non-earning occupations 11.5 26.9 10.2 4.1 2.0 3.1 7.3 10.2
Total 100.0 100.0 100.0 100.0 100.0 100.0 100.0 100.0
Source: IFPRI Bangladesh Integrated Household Survey, 2011-2012. The survey represents rural areas only. *Dependency ratio= number of dependents (less than 15 or over 60 years of age) divided by number of working age people (15 to 60 years).

111
Table 3.4—Literacy rates by income groups: Feed the Future zone Per capita expenditure quintile
Description 1 (lowest) 2 3 4 5 (highest) All (percent) For people aged 7 years and over Male 56.7 64.6 67.2 80.0 82.8 69.6 Female 54.3 63.8 63.2 73.8 77.9 66.0 All 55.4 64.1 65.2 76.7 80.3 67.7
For people aged 15 years and over Male 46.4 57.0 62.2 77.9 82.2 65.1 Female 42.5 55.7 55.5 68.2 75.1 59.2 All 44.3 56.3 58.8 72.7 78.6 62.0
Source: IFPRI Bangladesh Integrated Household Survey, 2011-2012. The survey represents rural areas only. Note: A person who can read and write a sentence in Bangla is considered to be literate.
Table 3.5—Literacy rates by income groups: Rural Bangladesh Per capita expenditure quintile Description 1 (lowest) 2 3 4 5 (highest) All (percent) For people aged 7 years and over Male 49.9 59.6 63.8 73.7 80.1 64.5 Female 51.1 59.4 64.4 68.4 75.1 62.8 All 50.5 59.5 64.1 70.9 77.4 63.6 For people aged 15 years and over Male 37.3 50.2 57.1 68.8 77.3 57.6 Female 37.6 48.7 55.7 61.6 71.0 54.4 All 37.5 49.4 56.4 65.0 74.0 55.9
Source: IFPRI Bangladesh Integrated Household Survey, 2011-2012. The survey represents rural areas only. Note: A person who can read and write a sentence in Bangla is considered to be literate.
Table 3.6—Literacy rates by division: Rural Bangladesh
Division
Description Barisal Chittagong Dhaka Khulna Rajshahi Rangpur Sylhet Bangladesh (percent)
For people aged 7 years and over Male 70.9 68.7 61.3 68.9 61.3 58.9 68.2 64.5 Female 69.7 67.2 60.3 64.8 60.6 58.2 62.4 62.8 All 70.3 67.9 60.8 66.8 61.0 58.6 65.2 63.6
For people aged 15 years and over Male 65.9 62.7 53.4 64.3 54.9 50.9 60.5 57.6 Female 64.0 60.5 50.8 58.9 50.4 48.2 53.3 54.4 All 64.9 61.4 52.1 61.5 52.7 49.5 56.7 55.9 Source: IFPRI Bangladesh Integrated Household Survey, 2011-2012. The survey represents rural areas only. Note: A person who can read and write a sentence in Bangla is considered to be literate.

112
Table 3.7—Highest level of education attained by population aged 25 and over by income groups: Feed the Future zone
Per capita expenditure quintile
Description 1 (lowest) 2 3 4 5 (highest) All
(percent)
No schooling Male 58.7 43.8 43.8 37.2 24.0 41.6 Female 61.4 55.3 52.1 44.3 32.0 49.2 All 60.2 49.7 48.0 41.0 28.2 45.6
Below primary Male 12.9 18.9 14.7 11.0 5.7 12.8 Female 14.9 15.8 13.9 13.2 12.1 14.0 All 14.0 17.3 14.3 12.2 9.1 13.4
Primary passed Male 25.1 31.6 34.0 38.1 41.2 34.0 Female 22.7 26.4 29.4 35.8 43.5 31.4 All 23.8 28.9 31.6 36.9 42.4 32.6
Secondary passed Male 2.4 4.0 4.0 6.5 12.1 5.7 Female 0.4 1.3 3.3 3.8 7.0 3.1 All 1.3 2.6 3.6 5.1 9.4 4.4
Higher secondary passed Male 0.6 0.5 1.4 2.5 7.5 2.4 Female 0.2 0.7 0.9 1.5 3.1 1.3 All 0.4 0.6 1.2 2.0 5.2 1.8
Received bachelor's degree or above Male 0.3 1.0 2.1 4.8 9.6 3.5 Female 0.5 0.5 0.4 1.3 2.2 1.0 All 0.4 0.7 1.3 2.9 5.7 2.2
Source: IFPRI Bangladesh Integrated Household Survey, 2011-2012. The survey represents rural areas only.

113
Table 3.8—Highest level of education attained by population aged 25 and over by income groups: Rural Bangladesh
Per capita expenditure quintile
Description 1 (lowest) 2 3 4 5 (highest) All
(percent)
No schooling
Male 69.6 54.3 50.6 40.1 28.1 49.1 Female 71.4 62.3 55.6 50.6 39.3 56.1 All 70.6 58.5 53.2 45.7 34.2 52.8
Below primary
Male 11.4 12.5 11.7 8.9 8.5 10.7 Female 10.0 11.4 11.6 9.4 10.9 10.6 All 10.7 11.9 11.7 9.2 9.8 10.7
Primary passed
Male 17.1 27.7 29.9 37.6 35.5 29.4 Female 18.2 25.0 29.9 34.8 39.4 29.3 All 17.7 26.3 29.9 36.1 37.7 29.3
Secondary passed
Male 1.4 4.1 4.2 6.9 11.3 5.4 Female 0.2 1.0 1.9 3.7 6.0 2.5 All 0.7 2.5 3.0 5.2 8.4 3.9
Higher secondary passed
Male 0.5 1.3 2.0 3.6 7.8 2.9 Female 0.1 0.2 0.5 0.9 2.9 0.9 All 0.3 0.7 1.2 2.2 5.1 1.8
Received bachelor's degree or above
Male - 0.2 1.6 3.0 8.6 2.5 Female 0.1 0.1 0.4 0.5 1.6 0.5 All 0.1 0.2 1.0 1.7 4.8 1.5 Source: IFPRI Bangladesh Integrated Household Survey, 2011-2012. The survey represents rural areas only.

114
Table 3.9—Highest level of education attained by population aged 25 and over by division: Rural Bangladesh
Divisions Description Barisal Chittagong Dhaka Khulna Rajshahi Rangpur Sylhet Bangladesh
(percent)
No schooling
Male 38.0 44.5 53.5 41.3 51.9 53.9 48.1 49.1 Female 44.1 50.7 59.4 50.8 59.0 61.8 61.4 56.1 All 41.3 48.2 56.6 46.2 55.4 57.9 55.3 52.8
Below primary Male 13.8 13.8 8.4 10.9 11.8 8.6 12.2 10.7 Female 15.1 11.0 10.7 10.1 11.7 8.2 8.2 10.6 All 14.5 12.2 9.6 10.5 11.8 8.4 10.1 10.7
Primary passed Male 34.1 29.0 29.0 34.1 24.9 28.6 31.4 29.4 Female 34.1 33.2 26.9 32.9 26.9 26.1 28.2 29.3 All 34.1 31.5 27.9 33.5 25.9 27.4 29.6 29.3
Secondary passed Male 6.5 5.8 4.9 7.1 5.6 4.3 4.3 5.4 Female 4.8 3.5 2.0 3.1 1.7 2.2 1.6 2.5 All 5.5 4.5 3.4 5.0 3.7 3.2 2.8 3.9
Higher secondary passed Male 3.6 4.5 2.9 2.4 2.9 2.0 1.9 2.9 Female 1.5 1.0 0.8 1.2 0.3 1.1 0.4 0.9 All 2.5 2.5 1.8 1.8 1.6 1.6 1.1 1.8
Received bachelor's degree or above Male 3.9 2.4 1.4 4.2 2.9 2.6 2.2 2.5 Female 0.4 0.5 0.2 1.9 0.3 0.5 0.1 0.5 All 2.0 1.3 0.7 3.0 1.6 1.6 1.1 1.5
Source: IFPRI Bangladesh Integrated Household Survey, 2011-2012. The survey represents rural areas only.

115
Table 3.10—Type of school attended by children enrolled in primary school by income groups: Feed the Future zone Per capita expenditure quintile Type of school attended 1 (lowest) 2 3 4 5 (highest) All (percent of enrolled students) Government school 68.5 65.6 63.9 67.3 56.6 65.6 Nongovernment registered 21.8 21.5 19.2 17.1 21.3 20.4 Nongovernment, non-registered 1.6 0.9 3.4 2.3 2.6 2.0 Ananda school - 0.8 0.9 0.8 1.7 0.7 BRAC school 4.0 3.5 2.4 2.1 3.5 3.2 Other NGO school 0.3 1.2 - - 0.8 0.5 Aliya Ebtedayi madrasa 2.3 3.5 6.1 4.2 3.6 3.8 Quomi madrasa 0.7 0.6 0.3 2.5 - 0.8 Other 0.9 2.4 3.9 3.9 10.0 3.2 Total 100.0 100.0 100.0 100.0 100.0 100.0
Source: IFPRI Bangladesh Integrated Household Survey, 2011-2012. The survey represents rural areas only.
Table 3.11—Type of school attended by children enrolled in primary school by income groups: Rural Bangladesh Per capita expenditure quintile Type of school attended 1 (lowest) 2 3 4 5 (highest) All (percent of enrolled students) Government school 68.0 63.5 68.5 65.1 59.1 65.6 Nongovernment registered 18.2 22.3 16.1 17.1 23.8 19.2 Nongovernment, non-registered 1.0 2.3 3.1 6.2 4.8 3.0 Ananda school 1.9 0.3 0.4 0.3 0.8 0.8 BRAC school 4.3 3.2 2.6 2.4 2.0 3.1 Other NGO school 0.4 1.3 0.3 0.3 0.3 0.6 Aliya Ebtedayi madrasa 4.4 4.6 4.9 4.1 5.1 4.6 Quomi madrasa 0.4 1.2 0.3 0.6 0.9 0.7 Other 1.5 1.3 3.9 3.9 3.2 2.5 Total 100.0 100.0 100.0 100.0 100.0 100.0
Source: IFPRI Bangladesh Integrated Household Survey, 2011-2012. The survey represents rural areas only.

116
Table 3.12—Type of school attended by children enrolled in primary school by division: Rural Bangladesh
Division
Type of school attended Barisal Chittagong Dhaka Khulna Rajshahi Rangpur Sylhet Bangladesh
(percent of enrolled students) Government school 61.4 66.5 71.6 57.9 54.7 64.9 72.5 65.6
Nongovernment registered
28.6 14.3 15.1 27.1 32.0 17.6 11.6 19.2
Nongovernment, non-registered
1.0 2.3 4.0 2.8 4.0 2.6 2.5 3.0
Ananda school - - 1.0 - 0.5 3.5 0.1 0.8
BRAC school 0.8 0.9 2.9 5.7 3.5 4.0 6.1 3.1
Other NGO school 0.3 - 0.8 0.4 0.3 1.2 0.8 0.6
Aliya Ebtedayi madrasa 3.5 8.6 2.8 2.7 2.9 4.7 5.8 4.6
Quomi madrasa 0.8 1.3 0.7 1.2 - 0.3 0.1 0.7
Other 3.6 6.3 1.1 2.2 2.2 1.2 0.6 2.5
Total 100.0 100.0 100.0 100.0 100.0 100.0 100.0 100.0
Source: IFPRI Bangladesh Integrated Household Survey, 2011-2012. The survey represents rural areas only.
Table 3.13—Type of school attended by children enrolled in secondary school by income groups: Feed the Future zone Per capita expenditure quintile Type of school attended 1 (lowest) 2 3 4 5 (highest) All (percent of enrolled students) Government school 12.8 9.6 8.3 8.1 9.9 9.7 Nongovernment registered 65.6 70.2 72.8 75.3 72.7 71.4 Nongovernment, non-registered 4.5 6.1 8.7 4.9 4.0 5.8 Aliya Dakhil madrasa 11.4 10.7 7.5 9.2 9.8 9.7 Quomi madrasa 1.5 - 1.7 - - 0.6 Other 4.3 3.3 1.1 2.5 3.6 2.8 Total 100.0 100.0 100.0 100.0 100.0 100.0
Source: IFPRI Bangladesh Integrated Household Survey, 2011-2012. The survey represents rural areas only.

117
Table 3.14—Type of school attended by children enrolled in secondary school by income groups: Rural Bangladesh Per capita expenditure quintile Type of school attended 1 (lowest) 2 3 4 5 (highest) All (percent of enrolled students) Government school 13.5 9.3 8.9 7.9 11.0 9.9 Nongovernment registered 69.5 74.5 75.1 79.1 72.8 74.6 Nongovernment, non-registered 4.0 1.1 4.9 2.8 4.4 3.5 BRAC school 1.5 - 0.2 - 0.3 0.3 Aliya Dakhil madrasa 7.8 12.1 8.7 8.1 9.6 9.2 Quomi madrasa - 0.8 0.3 0.6 0.6 0.5 Other 3.7 2.3 1.9 1.5 1.3 2.1 Total 100.0 100.0 100.0 100.0 100.0 100.0
Source: IFPRI Bangladesh Integrated Household Survey, 2011-2012. The survey represents rural areas only.
Table 3.15—Type of school attended by children enrolled in secondary school by division: Rural Bangladesh
Division
Type of school attended
Barisal Chittagong Dhaka Khulna Rajshahi Rangpur Sylhet Bangladesh
(percent of enrolled students) Government school 4.5 10.8 11.1 5.8 5.6 15.6 16.5 9.9 Nongovernment registered
82.8 71.4 79.2 66.4 83.6 66.9 64.2 74.6
Nongovernment, non-registered
0.3 3.2 1.4 15.2 - 1.4 5.8 3.5
BRAC school - 0.8 - - - 1.0 1.0 0.3 Aliya Dakhil madrasa
7.8 11.7 6.7 8.7 10.3 9.3 10.7 9.2
Quomi madrasa - 1.1 0.5 - - 0.8 0.4 0.5 Other 4.7 1.0 1.1 4.0 0.5 5.0 1.6 2.1 Total 100.0 100.0 100.0 100.0 100.0 100.0 100.0 100.0
Source: IFPRI Bangladesh Integrated Household Survey, 2011-2012. The survey represents rural areas only.
118
Table 3.16—School enrolment of children by income groups: Feed the Future zone Per capita expenditure quintile
Description 1 (lowest) 2 3 4 5 (highest) All
(percent)
Net primary school enrollment of children aged 6-11 years All 83.9 85.4 89.3 92.4 89.9 87.2 Boys 81.6 80.6 88.9 93.9 91.0 85.6 Girls 86.0 90.8 89.7 90.7 88.9 88.9
Net secondary school enrollment of children aged 11-18years All 61.1 68.4 72.5 71.8 82.6 70.4 Boys 57.4 60.5 77.4 71.6 78.5 68.6 Girls 64.4 76.1 67.3 72.0 87.1 72.3 Source: IFPRI Bangladesh Integrated Household Survey, 2011-2012. The survey represents rural areas only. Note: Net primary school enrollment rate = All primary-school-going children aged 6-11 years/all children aged
6-11 years. Net secondary school enrollment rate = All secondary-school-going children 11-18 years/all children
aged 11-18 years.
Table 3.17—School enrolment of children by income groups: Rural Bangladesh
Per capita expenditure quintile
Description 1 (lowest) 2 3 4 5 (highest) All
(percent)
Net primary school enrollment of children aged 6-11 years All 73.9 83.4 83.6 87.0 85.9 81.3 Boys 73.6 80.1 79.8 86.3 84.0 79.4 Girls 74.2 86.8 86.6 87.6 88.2 83.0
Net secondary school enrollment of children aged 11-18 years All 55.6 61.6 71.7 72.3 78.5 68.0 Boys 50.6 51.8 67.8 70.0 75.1 63.3 Girls 60.1 69.6 75.2 74.5 81.4 72.1
Source: IFPRI Bangladesh Integrated Household Survey, 2011-2012. The survey represents rural areas only. Note: Net primary school enrollment rate = All primary-school-going children aged 6-11 years/all children aged
6-11 years. Net secondary school enrollment rate = All secondary-school-going children 11-18 years/all children
aged 11-18 years.

119
Table 3.18—School enrolment of children by division: Rural Bangladesh
Division
Description Barisal Chittagong Dhaka Khulna Rajshahi Rangpur Sylhet Bangladesh (percent)
Net primary school enrollment of children 6-11 years All 83.9 77.1 80.1 87.4 84.6 79.2 84.0 81.3 Boys 82.6 77.0 78.0 83.5 82.1 77.7 81.4 79.4 Girls 85.4 77.2 82.1 91.3 86.8 80.7 86.4 83.0
Net secondary school enrollment of children 11-18 years All 69.4 60.8 69.7 75.3 76.9 73.2 54.2 68.0 Boys 72.7 55.3 64.2 74.4 64.3 71.6 49.0 63.3 Girls 66.2 64.9 75.1 76.2 88.9 74.5 58.6 72.1
Source: IFPRI Bangladesh Integrated Household Survey, 2011-2012. The survey represents rural areas only. Note: Net primary school enrollment rate = All primary-school-going children aged 6-11 years/all children aged
6-11 years. Net secondary school enrollment rate = All secondary-school-going children 11-18 years/all children
aged 11-18 years.
Table 3.19—Selected household asset ownership by income groups: Feed the Future zone
Source: IFPRI Bangladesh Integrated Household Survey, 2011-2012. The survey represents rural areas only.
Per capita expenditure quintile Asset 1 (lowest) 2 3 4 5 (highest) Total (percent)
Electric fan 13.2 26.0 33.1 41.2 60.0 34.7 Radio 6.3 6.0 6.6 6.9 8.7 6.9 Cassette player 2.2 2.8 3.4 7.8 13.9 6.0 Television 8.9 16.0 21.9 31.7 47.3 25.1 Mobile phone 51.5 71.4 77.3 83.3 90.2 74.7 Sewing machine 3.0 3.6 5.6 4.4 6.2 4.5 Bicycle 22.1 29.9 35.0 35.2 35.3 31.5 Hand tube well 13.9 17.7 22.4 26.8 33.0 22.7 Rickshaw/van 10.6 8.8 10.4 6.1 3.8 7.9 Boat 6.7 5.1 6.6 7.4 6.4 6.4 Motor cycle 0.3 1.0 1.2 3.1 9.4 3.0 Solar panel 3.0 5.6 4.4 6.4 10.6 6.0 Fishing net 26.6 28.9 25.3 29.5 30.3 28.1

120
Table 3.20—Selected household asset ownership by income groups: Rural Bangladesh Per capita expenditure quintile Asset 1 (lowest) 2 3 4 5 (highest) Total (percent) Electric fan 13.1 26.9 37.5 52.3 67.5 38.7 Radio 2.0 3.4 4.4 4.4 5.5 3.9 Cassette player 1.2 1.6 3.9 8.0 16.6 6.1 Television 6.8 16.9 21.0 34.7 51.8 25.7 Mobile phone 49.6 67.1 74.7 83.2 92.1 72.8 Sewing machine 2.4 3.5 4.2 4.5 7.4 4.3 Bicycle 18.5 25.0 29.4 32.6 31.5 27.2 Hand tube well 14.5 16.6 25.1 28.4 39.1 24.4 Rickshaw/van 10.1 8.3 9.2 4.1 3.2 7.1 Boat 1.8 2.1 1.6 3.1 1.7 2.1 Engine boat 0.3 0.4 0.3 0.3 0.8 0.4 Motor cycle 0.2 0.4 0.9 2.7 10.5 2.8 Solar panel 1.0 2.8 1.8 5.3 6.5 3.4 Fishing net 13.3 19.3 19.7 24.0 27.0 20.5
Source: IFPRI Bangladesh Integrated Household Survey, 2011-2012. The survey represents rural areas only.
Table 3.21—Selected household asset ownership by division: Rural Bangladesh Division
Asset Barisal Chittagong Dhaka Khulna Rajshahi Rangpur Sylhet Bangladesh
(percent) Electric fan 27.9 49.1 41.9 44.3 40.2 19.0 34.9 38.7 Radio 4.1 3.2 2.8 7.4 6.7 1.7 2.2 3.9 Cassette player 4.1 9.1 5.8 6.5 5.5 2.8 9.3 6.1
Television 19.8 27.8 25.2 30.6 30.3 17.1 25.3 25.7 Mobile phone 70.2 81.6 70.1 77.2 74.1 64.3 70.6 72.8 Sewing machine 3.6 5.0 4.1 4.8 4.7 3.3 4.4 4.3 Bicycle 12.4 14.0 20.4 48.3 38.6 39.6 13.6 27.2
Hand tube well 5.7 14.2 38.2 35.2 12.1 20.8 22.1 24.4
Rickshaw-van 3.6 4.7 7.2 9.6 9.8 8.1 2.1 7.1 Boat 5.0 1.0 3.1 0.9 1.4 0.0 5.3 2.1 Engine boat 1.9 0.2 0.4 0.4 0.2 0.4 0.4 0.4
Motor cycle 1.4 1.4 2.5 5.0 3.6 3.3 2.1 2.8 Solar panel 10.2 1.9 3.6 3.7 1.9 1.5 7.2 3.4 Fishing net 31.9 14.1 17.6 29.8 23.5 14.4 27.9 20.5
Source: IFPRI Bangladesh Integrated Household Survey, 2011-2012. The survey represents rural areas only.
121
Table 3.22—Electricity and structure of dwelling by income groups: Feed the Future zone
Source: IFPRI Bangladesh Integrated Household Survey, 2011-2012. The survey represents rural areas only. a Permanent materials are fired bricks, concrete, wood, and tin sheets.
Table 3.23—Electricity and structure of dwelling by income groups: Rural Bangladesh
Per capita expenditure quintile Characteristic 1 (lowest) 2 3 4 5 (highest) All
(percent)
Household has electricity 25.3 36.9 46.8 60.1 71.5 47.5
Structure of walls a
Permanent 44.7 57.8 62.3 68.7 80.4 62.3 Nonpermanent 55.3 42.2 37.7 31.3 19.6 37.7 Roofing material Concrete/brick 0.1 0.4 0.7 3.0 10.0 2.7 Tin 91.7 93.9 94.5 93.8 89.0 92.6 Thatching 7.3 4.2 3.2 2.3 0.7 3.7 Other 0.9 1.4 1.6 0.9 0.4 1.1 Total 100.0 100.0 100.0 100.0 100.0 100.0 Source: IFPRI Bangladesh Integrated Household Survey, 2011-2012. The survey represents rural areas only. a Permanent materials are fired bricks, concrete, wood, and tin sheets.
Per capita expenditure quintile Characteristic 1 (lowest) 2 3 4 5 (highest) All (percent) Household has electricity 25.6 39.7 43.7 52.5 65.0 45.3
Structure of walls a
Permanent 51.5 64.1 64.1 76.8 88.9 69.0 Nonpermanent 48.5 35.9 35.9 23.2 11.1 31.0 Total 100.0 100.0 100.0 100.0 100.0 100.0 Roofing material Concrete/brick 0.5 2.0 1.0 5.9 12.2 4.3 Tin 82.7 87.3 89.7 87.2 85.3 86.4 Thatching 7.8 3.0 1.2 1.5 0.5 2.8 Other 9.1 7.7 8.0 5.5 2.1 6.5 Total 100.0 100.0 100.0 100.0 100.0 100.0

122
Table 3.24—Electricity and structure of dwelling by division: Rural Bangladesh Division
Characteristic Barisal Chittagong Dhaka Khulna Rajshahi Rangpur Sylhet Bangladesh (percent) Household has electricity
43.3 56.3 50.2 54.4 49.5 26.0 42.9 47.5
Structure of walls a Permanent 87.6 68.8 76.1 53.5 42.8 48.8 48.2 62.3 Nonpermanent 12.4 31.3 23.9 46.5 57.2 51.2 51.8 37.7 Roofing material Concrete/brick 1.0 5.2 1.5 5.6 2.2 0.4 3.9 2.7 Tin 94.1 89.7 96.2 80.9 97.2 94.1 90.8 92.6 Thatching 5.0 5.1 2.3 5.2 0.5 5.6 5.2 3.7 Other 0.0 0.0 0.1 8.3 0.0 0.0 0.0 1.1 Total 100.0 100.0 100.0 100.0 100.0 100.0 100.0 100.0
Source: IFPRI Bangladesh Integrated Household Survey, 2011-2012. The survey represents rural areas only. a Permanent materials are fired bricks, concrete, wood, and tin sheets.
Table 3.25—Types of latrine by income groups: Feed the Future zone
Source: IFPRI Bangladesh Integrated Household Survey, 2011-2012. The survey represents rural areas only.
Per capita expenditure quintile Item 1 (lowest) 2 3 4 5 (highest) All (percent) None (open field) 2.4 1.9 1.0 1.0 0.0 1.3 Kutcha (fixed place) 24.1 18.4 15.8 14.7 9.4 16.5 Pucca (unsealed) 54.1 55.8 60.6 47.4 45.6 52.7 Sanitary without flush 18.1 22.9 21.4 36.7 43.1 28.4 Sanitary with flush 0.0 0.5 0.5 0.3 2.0 0.7 Community latrine 1.3 0.5 0.7 0.0 0.0 0.5 Total 100.0 100.0 100.0 100.0 100.0 100.0

123
Table 3.26—Types of latrine by income groups: Rural Bangladesh Per capita expenditure quintile
Item 1 (lowest) 2 3 4 5 (highest) All (percent) None (open field) 7.1 4.5 3.3 2.1 1.1 3.7 Kutcha (fixed place) 27.4 22.1 20.6 16.3 8.8 19.3 Pucca (unsealed) 49.0 53.4 51.4 47.3 42.1 48.7 Sanitary without flush 13.2 17.0 21.9 31.9 45.3 25.5 Sanitary with flush 0.1 0.1 0.1 0.2 1.6 0.4 Community latrine 3.3 2.6 2.6 2.2 1.0 2.3 Other 0.0 0.3 0.1 0.0 0.1 0.1 Total 100.0 100.0 100.0 100.0 100.0 100.0
Source: IFPRI Bangladesh Integrated Household Survey, 2011-2012. The survey represents rural areas only.
Table 3.27—Types of latrine by division: Rural Bangladesh Division
Item Barisal Chittagong Dhaka Khulna Rajshahi Rangpur Sylhet Bangladesh
(percent) None (open field) 1.4 1.2 3.1 0.6 7.4 8.8 2.2 3.7 Kutcha (fixed place) 17.4 10.2 24.9 8.9 27.8 19.3 19.4 19.3 Pucca (unsealed) 60.5 47.0 47.9 66.3 38.3 44.2 45.6 48.7 Sanitary without flush 20.0 37.0 20.7 23.5 24.8 24.7 29.0 25.5 Sanitary with flush 0.7 0.3 0.3 0.6 0.2 0.2 1.7 0.4 Community latrine 0.0 4.1 3.1 0.2 1.6 2.8 1.8 2.3 Other 0.0 0.3 0.1 0.0 0.0 0.0 0.3 0.1 Total 100.0 100.0 100.0 100.0 100.0 100.0 100.0 100.0 Source: IFPRI Bangladesh Integrated Household Survey, 2011-2012. The survey represents rural areas only.

124
Table 3.28—Source of fuel by income groups: Feed the Future zone
Per capita expenditure quintile Item 1 (lowest) 2 3 4 5 (highest) All (percent) Source of cooking fuel Electricity 1.3 2.0 2.5 1.0 1.2 1.6 Kerosene 1.0 0.5 1.0 0.3 0.5 0.7 Firewood 35.0 41.3 41.5 49.2 66.0 46.6 Dried cow dung 24.3 25.5 28.4 27.4 13.7 23.9 Rice bran/saw dust 0.3 0.2 0.7 1.4 0.5 0.6 Dried leaves 35.6 27.2 22.3 17.9 15.0 23.6 Other 2.6 3.3 3.6 2.8 3.2 3.1 Total 100.0 100.0 100.0 100.0 100.0 100.0 Source of lighting fuel Electricity 23.4 34.1 40.5 48.3 60.4 41.3 Solar electricity 3.7 6.0 5.3 8.2 9.8 6.6 Kerosene 72.4 59.8 54.0 43.1 29.6 51.8 Other 0.6 0.0 0.3 0.5 0.3 0.3 Total 99.9 100.0 100.0 100.0 100.0 100.0
Source: IFPRI Bangladesh Integrated Household Survey, 2011-2012. The survey represents rural areas only.

125
Table 3.29—Source of fuel by income groups: Rural Bangladesh
Per capita expenditure quintile
Item 1 (lowest) 2 3 4 5 (highest) All (percent) Source of cooking fuel
Electricity 0.8 0.9 1.6 2.1 3.1 1.7 Kerosene 0.4 0.6 0.7 0.4 0.3 0.5
Firewood 26.0 32.9 35.1 41.8 57.6 38.3 Dried Cow Dung 26.7 24.9 23.9 21.0 13.9 22.3 Rice bran/saw dust 2.5 4.0 2.9 3.1 2.2 3.0 Dried Leaves 38.7 33.5 32.9 27.9 18.9 30.6
Other 4.9 3.2 3.0 3.6 4.0 3.7
Total 100.0 100.0 100.0 100.0 100.0 100.0
Source of lighting fuel
Electricity 25.0 35.7 46.2 58.8 70.2 46.6 Solar Electricity 1.8 3.4 2.4 6.5 7.3 4.2 Kerosene 72.0 59.8 49.9 33.6 21.2 48.0 Other 1.2 1.1 1.4 1.2 1.3 1.2 Total 100 100 100 100 100 100 Source: IFPRI Bangladesh Integrated Household Survey, 2011-2012. The survey represents rural areas only.

126
Table 3.30—Source of fuel by division: Rural Bangladesh
Division
Item Barisal Chittagong Dhaka Khulna Rajshahi Rangpur Sylhet Bangladesh
(percent) Source of cooking fuel Electricity 0.71 5.2 1.4 0.9 1.0 0.0 0.7 1.7 Kerosene 0.0 0.9 0.5 0.6 0.5 0.2 0.3 0.5 Firewood 53.1 67.4 33.8 43.0 14.7 23.9 43.9 38.3 Dried Cow Dung
9.8 5.9 18.3 34.6 34.8 34.8 15.8 22.3
Rice bran/saw dust
0.5 0.8 3.7 0.4 8.3 1.8 2.2 3.0
Dried Leaves 35.7 13.8 39.3 19.1 37.2 35.5 27.1 30.6 Other 0.2 5.9 3.0 1.5 3.4 3.7 10.0 3.8
Total 100.0 100.0 100.0 100.0 100.0 100.0 100.0 100.0
Source of lighting fuel Electricity 35.5 56.3 49.5 52.8 49.5 26.0 42.9 46.6
Solar Electricity 9.8 2.8 4.3 3.5 3.5 3.0 8.3 4.2 Kerosene 54.5 37.2 45.1 43.7 45.7 70.7 48.8 48.0 Other 0.2 3.8 1.1 0.0 1.4 0.4 0.0 1.2 Total 100 100 100 100 100 100 100 100 Source: IFPRI Bangladesh Integrated Household Survey, 2011-2012. The survey represents rural areas only.
Table 3.31—Source of drinking water by income groups: Feed the Future zone
Source: IFPRI Bangladesh Integrated Household Survey, 2011-2012. The survey represents rural areas only.
Per capita expenditure quintile Item 1 (lowest) 2 3 4 5 (highest) All (percent) Supply water (piped), inside house 2.8 2.0 2.5 1.2 3.2 2.3 Supply water (piped), outside house 0.0 0.3 0.5 1.0 0.8 0.5 Own tubewell 25.5 33.3 38.8 42.5 51.8 38.4 Community tubewell 55.2 46.4 45.5 42.3 30.3 43.9 Rain water 0.0 0.0 0.0 0.0 0.2 0.0 Pond/river/canal 4.9 4.8 3.4 3.5 3.5 4.0 Other 11.7 13.2 9.4 9.5 10.3 10.8 Total 100.0 100.0 100.0 100.0 100.0 100.0

127
Table 3.32—Source of drinking water by income groups: Rural Bangladesh
Source: IFPRI Bangladesh Integrated Household Survey, 2011-2012. The survey represents rural areas only.
Table 3.33—Source of drinking water by division: Rural Bangladesh
Division Item Barisal Chittagong Dhaka Khulna Rajshahi Rangpur Sylhet Bangladesh
(percent) Supply water (piped), inside house
1.0 1.9 0.8 1.1 1.7 0.6 0.8 1.1
Supply water (piped), outside house
0.0 0.5 0.2 0.9 1.0 0.0 0.4 0.4
Own tubewell 11.7 44.7 53.1 46.9 62.6 72.0 34.6 51.1 Community tubewell 69.3 41.4 23.9 39.1 33.5 25.6 38.8 34.2 Rain water 0.2 0.1 0.2 0.4 0.0 0.2 0.0 0.2 Ring well/indara 0.0 0.3 0.1 0.0 0.0 0.0 0.6 0.1 Pond/river/canal 4.5 3.5 0.6 7.2 1.2 1.1 5.1 2.6 Other 13.3 7.6 21.2 4.4 0.0 0.6 19.7 10.2 Total 100.0 100.0 100.0 100.0 100.0 100.0 100.0 100.0 Source: IFPRI Bangladesh Integrated Household Survey, 2011-2012. The survey represents rural areas only.
Per capita expenditure quintile
Item 1 (lowest) 2 3 4 5 (highest) All
(percent)
Supply water (piped), inside house 0.7 1.2 0.8 1.0 1.9 1.1 Supply water (piped), outside house 0.0 0.1 0.3 0.7 1.1 0.4 Own tubewell 39.8 43.6 48.7 58.4 66.9 51.1 Community tubewell 44.8 39.5 36.0 28.7 20.6 34.2 Rain water 0.1 0.2 0.3 0.1 0.1 0.2 Ring well/indara 0.1 0.0 0.1 0.3 0.1 0.1 Pond/river/ canal 2.9 2.9 3.0 1.9 2.4 2.6 Other 11.6 12.3 10.7 8.9 7.1 10.2 Total 100.0 100.0 100.0 100.0 100.0 100.0

128

129
TABLES FOR SECTION 4: FOOD AVAILABITY

130
Table 4.1—Distribution of owned cultivated land: Feed the Future zone
Group Size of average cultivable
land owned Share of total cultivable land in
each group
(decimal/household) (percent) 1 (lowest) 5.3 0.29 2 10.5 0.55 3 15.2 0.75 4 19.1 1.09 5 24.3 1.29 6 30.2 1.57 7 35.1 1.69 8 40.9 2.01 9 47.8 2.91 10 54.5 2.51 11 62.0 2.92 12 70.5 3.73 13 82.1 4.19 14 95.5 5.06 15 113.0 6.10 16 134.7 6.35 17 158.4 8.24 18 188.4 9.80 19 249.3 12.96 20 (highest) 508.7 25.96 All households 97.1 100.00
Source: IFPRI Bangladesh Integrated Household Survey, 2011-2012. The survey represents rural areas only.

131
Table 4.2—Distribution of owned cultivated land: Rural Bangladesh
Group
Size of average cultivable
land owned
Share of total cultivable land in
each group
(decimal/household) (percent) 1 (lowest) 5.23 0.27 2 10.8 0.56 3 15.3 0.73 4 18.9 1.01 5 23.8 1.16 6 29.3 1.45 7 33.8 1.62 8 39.9 1.93 9 47.8 2.59 10 56.1 3.42 11 63.9 2.28 12 72.2 3.61 13 84.5 4.76 14 97.3 4.17 15 111.8 5.45 16 132.7 6.63 17 158.2 7.64 18 196.2 9.81 19 274.2 13.59 20 (highest) 528.7 26.22 All households 97.5 100.00
Source: IFPRI Bangladesh Integrated Household Survey, 2011-2012. The survey represents rural areas only.
132
Table 4.3—Distribution of operated land: Feed the Future zone
Group Size of average operated
land Share of total operable land in
each group
(decimal/household) (percent) 1 (lowest) 7.6 0.36 2 15.9 0.76 3 22.3 1.18 4 29.6 1.18 5 35.7 1.71 6 42.0 2.02 7 49.9 2.48 8 57.2 2.61 9 65.0 3.02 10 75.6 4.36 11 84.3 3.10 12 94.9 4.33 13 104.6 5.11 14 117.1 5.16 15 132.9 5.96 16 152.9 7.23 17 174.9 8.26 18 205.4 9.54 19 261.5 12.15 20 (highest) 415.6 19.31 All households 106.2 100.00
Source: IFPRI Bangladesh Integrated Household Survey, 2011-2012. The survey represents rural areas only.

133
Table 4.4—Distribution of operated land: Rural Bangladesh
Group Size of average operated
land Share of total operable land in
each group
(decimal/household) (percent) 1 (lowest) 8.9 0.47 2 16.4 0.74 3 22.1 1.18 4 28.7 1.37 5 33.1 1.61 6 38.6 1.78 7 46.7 2.91 8 53.1 1.96 9 59.7 2.78 10 66.6 3.19 11 74.7 3.60 12 83.6 4.15 13 95.6 4.97 14 106.4 4.66 15 120.9 6.12 16 140.7 6.83 17 162.4 7.55 18 194.8 9.60 19 256.7 12.29 20 (highest) 444.4 21.58 All households 99.3 100.00
Source: IFPRI Bangladesh Integrated Household Survey, 2011-2012. The survey represents rural areas only.

134
Table 4.5—Distribution of operated land by farm size groups
Division
Farm Size FTF zone
Barisal Chittagong Dhaka Khulna Rajshahi Rangpur Sylhet Bangladesh
(percent of all farmers) Marginal farmer
(below 0.5 acres) 32.82 33.15 45.87 36.35 29.60 37.17 43.13 15.99 36.32
Small farmer (0.5-1.49 acres)
43.82 42.54 42.2 47.29 46.26 42.51 41.53 46.39 44.57
Medium farmer (1.5-2.49 acres)
15.61 12.71 7.95 11.46 16.09 11.5 8.31 19.75 11.81
Large farmer (2.5 acres and above)
7.75 11.60 3.98 4.90 8.05 8.82 7.03 17.87 7.31
Total 100.00 100.00 100.00 100.00 100.00 100.00 100.00 100.00 100.00
(percent of total operated land)
Marginal farmer (below 0.5 acres)
8.31 7.13 16.10 11.03 7.81 9.49 12.95 2.71 9.61
Small farmer (0.5-1.49 acres)
37.18 32.08 45.88 46.51 37.20 35.62 39.99 27.01 37.75
Medium farmer (1.5-2.49 acres)
27.77 18.45 18.75 23.79 28.42 20.07 17.76 23.83 21.58
Large farmer (2.5 acres and above)
26.74 42.34 19.27 18.67 26.56 34.82 29.30 46.44 31.06
Total 100.00 100.00 100.00 100.00 100.00 100.00 100.00 100.00 100.00
Source: IFPRI Bangladesh Integrated Household Survey, 2011-2012. The survey represents rural areas only.

135
Table 4.6—Number of operated plots by farm size groups: Feed the Future zone Number of plots Farm size (in acres) Mean Minimum Maximum St. dev. Marginal (>0-<0.5) 1.64 1 13 1.07 Small (.5-1.49) 3.87 1 18 2.19 Medium (1.50-2.49) 6.20 1 22 3.32 Large (>=2.5) 7.60 2 31 4.85 All 3.72 1 31 3.11
Source: IFPRI Bangladesh Integrated Household Survey, 2011-2012. The survey represents rural areas only.
Table 4.7—Number of operated plots by division: Rural Bangladesh Number of plots Division Mean Minimum Maximum St. dev. Barisal 3.31 1 31 3.48 Chittagong 2.76 1 19 2.40 Dhaka 3.53 1 15 2.63 Khulna 3.90 1 18 2.99 Rajshahi 4.92 1 31 4.80 Rangpur 3.25 1 13 2.56 Sylhet 3.58 1 16 2.67 All 3.67 1 31 3.25
Source: IFPRI Bangladesh Integrated Household Survey, 2011-2012. The survey represents rural areas only.

136
Table 4.8—Average size of operated land by farm size groups: Feed the Future zone Operated land size Farm size (in acres) Mean Minimum Maximum St. dev. (acres/farm household) Marginal (>0-<0.5) 0.23 0.01 0.50 0.14 Small (.5-1.49) 0.91 0.50 1.49 0.28 Medium (1.50-2.49) 1.90 1.50 2.47 0.27 Large (>=2.5) 4.18 2.50 25.18 3.11 All 1.06 0.01 25.18 1.42
Source: IFPRI Bangladesh Integrated Household Survey, 2011-2012. The survey represents rural areas only.
Table 4.9—Average size of operated land by division: Rural Bangladesh Operated land size Division Mean Minimum Maximum St. dev. (acres/farm household) Barisal 1.09 0.01 15.90 1.70 Chittagong 0.67 0.01 8.62 0.83 Dhaka 0.90 0.01 6.30 0.84 Khulna 1.11 0.01 20.30 1.42 Rajshahi 1.19 0.02 13.53 1.73 Rangpur 0.95 0.03 12.00 1.19 Sylhet 1.48 0.01 17.36 1.77 All 0.99 0.01 20.30 1.30
Source: IFPRI Bangladesh Integrated Household Survey, 2011-2012. The survey represents rural areas only.

137
Source: IFPRI Bangladesh Integrated Household Survey, 2011-2012. The survey represents rural areas only. Note: Marginal farmers are with operated landholding below 0.5 areas; small farmers, between 0.5 and 1.49 acres; medium farmers, between 1.50 and 2.49 acres; and large farmers, 2.5 acres and more.
Table 4.11—Land tenure arrangements across divisions
Tenurial arrangement
Division
Barisal Chittagong Dhaka Khulna Rajshahi Rangpur Sylhet Bangladesh
(percent of farmers)
Pure tenant 24.1 37.1 33.5 30.3 34.1 36.1 36.8 33.5
Sharecropping 66.1 60.3 72.0 53.9 68.2 72.8 72.7 67.0
Cash lease 25.4 27.6 16.5 22.2 20.5 13.2 5.3 18.8
Both 8.5 12.2 11.5 23.9 11.4 14.0 22.0 14.1
Own land only 44.1 39.9 40.1 33.9 29.7 39.2 33.7 37.1
Mixed tenant (own land + land taken in)
31.8 23.0 26.5 35.8 36.2 24.7 29.6 29.4
Sharecropping 56.4 69.1 69.8 63.0 45.0 74.4 59.4 62.3
Cash lease 25.6 16.5 17.5 19.6 32.1 19.2 13.2 21.4
Both 18.0 14.4 12.7 17.4 22.9 6.4 27.4 16.3
Source: IFPRI Bangladesh Integrated Household Survey, 2011-2012. The survey represents rural areas only.
Table 4.10—Land tenure arrangements by farm size groups Tenurial arrangement
Farm size groups (operated land)
Feed the Future zone Rural Bangladesh
Marginal Small Medium Large All Marginal Small Medium Large All
(percent of farmers) Pure tenant 35.4 29.2 13.7 16.8 28.1 41.0 33.5 18.4 17.4 33.5
Sharecropping 73.4 58.4 53.8 38.1 63.9 74.7 62.2 46.0 56.3 67.0
Cash lease 23.6 25.0 39.1 33.3 25.8 21.6 16.7 18.2 7.5 18.8
Both 3.0 16.7 7.1 28.6 10.3 3.7 21.1 35.8 36.2 14.1
Own land only 51.9 29.9 28.0 25.5 37.2 48.8 30.2 25.4 31.9 37.1
Mixed tenant (own land + land taken in)
12.7 40.9 58.3 57.7 34.7 10.2 36.3 56.3 50.8 29.4
Sharecropping 63.7 65.8 60.2 53.9 62.5 68.3 66.0 58.5 47.9 62.3
Cash lease 31.1 18.9 22.6 25.7 22.4 23.7 18.3 25.8 23.8 21.4
Both 5.2 15.3 17.3 20.4 15.2 8.0 15.7 15.7 28.2 16.3

138
Table 4.12— Share of crops on total cropped land by Feed the Future zone and divisions of rural Bangladesh: December 2010 to November 2011
Division
Crop FTF zone
Barisal Chittagong Dhaka Khulna Rajshahi Rangpur Sylhet Bangladesh
(percent of total cropped area) Rice 67.6 79.4 75.3 76.2 73.0 71.6 82.3 94.3 76.8 Wheat 1.3 0.2 0.5 0.7 1.5 3.7 2.2 - 1.5 Potato 0.3 0.7 4.0 0.6 0.4 3.2 2.2 1.8 1.7 Eggplant 1.0 0.8 0.8 0.9 1.5 0.6 0.2 0.2 0.8 Other vegetables
3.8 3.9 5.1 3.8 1.6 2.0 0.4 2.2 2.7
Lentil 2.5 0.1 0.2 1.5 1.5 0.7 0.0 - 0.8 Other pulses 4.0 10.5 1.4 1.6 2.9 2.5 0.0 0.3 2.1 Mustard 1.1 - 1.3 2.1 0.8 1.5 0.5 0.2 1.3 Sugarcane 0.2 - 0.4 0.3 0.2 2.7 0.5 - 0.8 Chili 2.1 0.6 2.1 1.3 1.7 0.2 0.5 0.3 1.0 Onion 1.2 - 0.2 1.2 0.9 1.9 0.8 - 1.0 Jute 9.2 0.4 1.7 7.1 6.1 4.4 3.5 0.3 4.7 All other crops 5.7 3.3 6.8 2.9 7.9 5.0 7.0 0.5 5.0 Total 100.0 100.0 100.0 100.0 100.0 100.0 100.0 100.0 100.0
Source: IFPRI Bangladesh Integrated Household Survey, 2011-2012. The survey represents rural areas only.
Table 4.13—Source of irrigation by division: Rural Bangladesh Division Source of Irrigation
FTF zone
Barisal Chittagong Dhaka Khulna Rajshahi Rangpur Sylhet Bangladesh
(percent of farmers) Rainfed 13.9 64.6 17.4 5.1 10.7 1.0 4.5 14.7 9.2 Groundwater 59.4 0.5 34.7 67.4 58.9 71.8 81.3 16.8 61.0 Surface water 17.8 34.9 37.8 9.1 8.1 2.4 1.1 50.8 11.3 Groundwater & surface water
9.0 0 10.1 18.4 22.4 24.8 13.1 17.7 18.5
Source: IFPRI Bangladesh Integrated Household Survey, 2011-2012. The survey represents rural areas only.
Table 4.14—Method of irrigation for HYV/hybrid boro rice cultivation by division: Rural Bangladesh
Division Irrigation method
FTF zone
Barisal Chittagong Dhaka Khulna Rajshahi Rangpur Sylhet Bangladesh
(percent of farmers) Manual 3.7 1.5 4.4 2.3 6.9 1.3 0.8 14.4 3.0 Shallow tubewell
65.0 2.9 50.6 76.3 79.7 58.6 90.5 35.4 69.1
Deep tubewell 9.1 0 4.4 14.0 5.9 40.1 5.3 0.7 17.9 Low lift pump 20.5 95.6 40.0 7.0 6.7 0.1 2.5 48.6 9.6 Canal irrigation 1.1 0 0.7 0.5 0.8 0 0.8 0.9 0.5
Source: IFPRI Bangladesh Integrated Household Survey, 2011-2012. The survey represents rural areas only.

139
Table 4.15—Fertilizer use by type of rice and farm size groups: Feed the Future zone and rural Bangladesh Farm size groups (operated land)
Type of rice Fertilizer Feed the Future zone
Bangladesh
Marginal Small Medium Large Total
Marginal Small Medium Large Total (kilograms/hectare)
T aman (local)
Urea 103 93 97 87 96 161 132 124 105 139 TSP 50 39 31 15 38 46 41 36 17 40 DAP 6 13 0 3 8 6 9 4 2 7 MoP 15 11 5 5 10 18 17 15 14 17
T aman (HYV)
Urea 196 175 176 141 179 192 171 187 155 179 TSP 100 92 72 79 89 68 56 68 53 61 DAP 19 24 19 16 21 13 15 21 19 15 MoP 45 46 33 30 42 38 37 44 42 39
Boro (HYV and hybrid)
Urea 252 260 247 227 253 272 248 255 219 254 TSP 137 122 114 126 125 107 102 105 87 103 DAP 23 25 24 22 24 28 28 30 32 29 MoP 74 59 60 51 63 67 69 72 67 69
Source: IFPRI Bangladesh Integrated Household Survey, 2011-2012. The survey represents rural areas only. Note: Marginal farmers are with landholding below 0.5 areas; small farmers, between 0.5 and 1.49 acres; medium farmers,
between 1.50 and 2.49 acres; and large farmers, 2.5 acres and more.
Table 4.16—Incidence of cultivation of local and modern rice varieties by farm size groups: Feed the Future zone and rural Bangladesh
Types of rice seed
Farm size groups (operated land)
Feed the Future zone Rural Bangladesh
Marginal Small Medium Large All Marginal Small Medium Large All
Aus (percent of farmers)
Local 6.06 0.00 10.20 0.00 3.91 34.67 10.18 18.89 21.13 20.55
HYV 93.94 100.00 89.80 100.00 96.09 65.33 89.82 81.11 78.87 79.45
Aman
Local 16.64 9.04 8.32 4.08 10.25 16.74 10.90 9.38 4.35 11.93
HYV 85.54 89.50 91.68 95.92 89.75 82.63 89.10 91.67 95.65 88.01
Boro
HYV 91.35 87.66 83.61 74.16 86.60 94.76 92.58 93.97 92.53 93.41
Hybrid 9.62 16.02 23.01 33.82 17.33 5.70 10.56 12.33 15.72 9.78
Source: IFPRI Bangladesh Integrated Household Survey, 2011-2012. The survey represents rural areas only. Marginal farmers are with landholding below 0.5 areas; small farmers, between 0.5 and 1.49 acres; medium farmers, between 1.50 and 2.49 acres; and large farmers, 2.5 acres and more.

140
Table 4.17—Source of rice seed by farm size groups: Feed the Future zone and rural Bangladesh
Source of seed for different rice seasons
Farm size groups (operated land) Feed the Future zone Rural Bangladesh
Marginal Small Medium Large All Marginal Small Medium Large All
Aus (percent of farmers) Own/gift 35.35 67.98 39.72 73.93 52.46 42.91 37.88 74.80 79.78 47.08
From seed dealers of big seed companies
0.00 0.00 10.36 0.00 1.97 0.00 0.00 0.00 0.00 0.00
From pvt shop (do not know seed brand)
69.71 32.02 49.92 26.07 47.21 57.09 65.52 25.20 30.33 55.22
Govt (BADC) 0.00 0.00 0.00 0.00 0.00 0.00 0.00 0.00 0.00 0.00
Aman
Own/gift 31.13 60.59 64.38 56.92 53.53 31.20 52.56 66.76 67.86 49.12
From seed dealers of big seed companies
1.82 1.46 0.00 0.00 1.03 1.27 1.66 1.43 0.00 1.36
From pvt shop (do not know seed brand)
62.69 38.17 29.17 29.30 41.24 67.96 46.60 37.02 32.64 50.74
Govt (BADC) 4.36 4.15 6.45 13.77 5.87 0.00 2.21 1.43 3.38 1.53
Boro
Own/gift 26.89 35.94 41.67 34.67 34.58 27.34 43.44 56.86 64.97 42.25
From seed dealers of big seed companies
2.89 3.01 2.43 10.22 3.54 2.48 2.81 2.09 4.67 2.79
From pvt shop (do not know seed brand)
61.54 57.79 52.13 52.96 57.25 68.81 50.80 43.76 33.87 53.81
Govt (BADC) 10.62 6.80 9.09 12.86 8.76 2.61 5.17 3.01 3.82 3.99
Source: IFPRI Bangladesh Integrated Household Survey, 2011-2012. The survey represents rural areas only. Note: Marginal farmers are with landholding below 0.5 areas; small farmers, between 0.5 and 1.49 acres; medium farmers, between 1.50 and 2.49 acres; and large farmers, 2.5 acres and more.

141
Table 4.18—Technology adoption for non-rice crops: Feed the Future zone and rural Bangladesh
Type of seed
Farm size group (operated land)
Feed the Future zone Rural Bangladesh
Marginal Small Medium Large All Marginal Small Medium Large All
(percent of farmers) Pulses Local 90.79 86.45 90.82 87.13 88.28 83.98 87.74 89.92 76.27 85.85
HYV 9.24 11.43 13.11 12.87 11.43 17.82 10.83 10.08 20.42 13.45
Oilseeds
Local 68.06 83.56 88.01 83.48 82.04 69.90 73.78 71.19 64.96 71.11
HYV 31.94 20.20 7.16 11.01 17.06 28.15 29.16 25.92 35.17 29.14
Potatoes
Local 100.00 65.45 55.03 66.67 66.97 31.19 43.55 32.47 53.02 40.65
HYV 0.00 23.15 44.97 33.33 28.37 65.99 51.51 67.53 52.76 57.78
Jute
Local 69.57 53.28 54.34 58.98 57.73 69.53 63.56 67.55 49.46 64.50
HYV 26.46 43.55 50.28 41.02 40.76 25.35 35.46 36.85 46.71 34.14
Source: IFPRI Bangladesh Integrated Household Survey, 2011-2012. The survey represents rural areas only. Note: Marginal farmers are with landholding below 0.5 areas; small farmers, between 0.5 and 1.49 acres; medium farmers, between 1.50 and 2.49 acres; and large farmers, 2.5 acres and more.

142
Table 4.19—Source of seeds by farm size groups for selected non-rice crops: Feed the Future zone and rural Bangladesh
Source of seed
Farm size group (operated land)
Feed the Future zone Rural Bangladesh
Marginal Small Medium Large All Marginal Small Medium Large All
Wheat (percent of farmers)
Own/gift 7.75 26.63 21.74 25.00 22.51 5.02 15.81 21.76 28.34 15.31 From seed
dealers of big seed companies
0.00 2.43 0.00 0.00 1.26 0.00 0.93 5.71 0.00 1.62
From pvt shop (not know seed brand)
92.25 68.43 73.89 75.00 73.65 94.98 83.26 78.37 71.66 84.25
Govt (BADC) 0.00 7.38 4.37 0.00 5.10 0.00 0.93 0.00 10.69 1.18
Pulses Own/gift 44.33 56.32 67.62 65.77 56.88 33.76 43.48 49.68 55.24 43.75 From seed dealers
of big seed companies
1.65 0.74 0.00 0.00 0.72 3.35 0.00 0.00 0.00 0.75
From pvt shop (not know seed brand)
56.82 45.27 38.25 40.67 45.95 62.89 57.80 54.60 46.77 57.07
Govt (BADC) 0.00 0.63 1.97 0.00 0.67 0.00 0.54 0.00 3.72 0.72
Oilseeds Own/gift 48.09 59.25 70.16 51.35 59.50 28.63 43.65 57.53 44.48 44.27 From seed dealers
of big seed companies
4.01 0.00 2.40 0.00 1.50 0.00 1.23 0.00 0.00 0.53
From pvt shop (not know seed brand)
47.91 44.85 32.24 53.25 42.62 68.72 58.75 46.08 62.23 58.15
Govt (BADC) 4.01 2.07 0.00 0.00 1.50 2.65 0.00 0.00 3.55 1.03
Potatoes Own/gift 35.27 23.15 44.97 0.00 28.37 23.57 53.40 42.80 45.17 44.06 From seed dealers
of big seed companies
0.00 0.00 0.00 0.00 0.00 2.72 1.22 1.79 5.67 2.44
From pvt shop (not know seed brand)
64.73 65.45 55.03 100.00 66.97 73.59 49.18 51.93 57.77 55.95
Govt (BADC) 0.00 11.40 0.00 0.00 4.66 3.87 0.00 6.09 0.00 1.99
Jute Own/gift 0.32 9.60 10.60 21.76 10.75 6.85 8.12 9.38 20.15 9.08 From seed dealers
of big seed companies
1.12 3.82 1.50 0.00 2.41 1.08 2.65 1.07 0.00 1.75
From pvt shop (not know seed brand)
89.56 91.07 87.92 89.40 89.94 92.42 90.84 91.57 84.88 90.84
Govt (BADC) 1.34 2.54 7.55 0.00 3.07 0.73 1.89 2.66 3.08 1.83
Source: IFPRI Bangladesh Integrated Household Survey, 2011-2012. The survey represents rural areas only.
Note: Marginal farmers are with landholding below 0.5 areas; small farmers, between 0.5 and 1.49 acres; medium farmers, between 1.50 and 2.49 acres; and large farmers, 2.5 acres and more.

143
Table 4.20—Average male and female labor use for rice cultivation, by activity
Category Land
preparation Planting
Fertilizer application
Pesticide application
Weeding Irrigation Harvest Total
(hours per hectare) Male T. Aman local FTF zone 39.2 130.0 15.0 11.4 205.5 11.4 161.1 573.5 Bangladesh 44.0 190.7 14.1 10.6 194.9 16.1 204.7 675.1 T. Aman HYV FTF zone 89.4 215.3 28.6 16.6 226.1 50.1 232.3 858.3 Bangladesh 72.0 256.6 19.5 13.4 203.7 29.2 226.7 821.2 Boro HYV FTF zone 119.9 241.8 31.3 19.7 272.2 89.6 240.1 1014.7 Bangladesh 81.8 277.5 25.8 15.2 263.3 86.9 297.2 1047.8 Female T. Aman local FTF zone 1.0 0.6 0.0 0.0 0.9 0.0 4.9 7.4 Bangladesh 0.2 2.2 0.0 0.0 1.6 0.7 3.6 8.2 T. Aman HYV FTF zone 4.0 3.9 1.0 0.0 15.9 1.0 11.9 37.7 Bangladesh 1.4 5.3 0.4 0.0 11.9 0.3 18.4 37.6 Boro HYV FTF zone 5.5 5.0 1.2 0.1 18.5 0.5 13.7 44.4 Bangladesh 3.1 4.9 0.2 0.0 11.6 1.3 7.5 28.6 Source: IFPRI Bangladesh Integrated Household Survey, 2011-2012. The survey represents rural areas only.

144
Table 4.21—Share of male and female labor use for rice cultivation by activities
Source: IFPRI Bangladesh Integrated Household Survey, 2011-2012. The survey represents rural areas only.
Category Land
preparation Planting
Fertilizer application
Pesticide application
Weeding Irrigation Harvest Total
(percent of total labor hours) Male T. Aman local FTF zone 97.9 99.5 100.0 100.0 99.7 100.0 98.1 99.0 Bangladesh 100.0 98.9 100.0 100.0 99.4 96.6 97.8 98.6 T. Aman HYV FTF zone 96.4 98.8 97.4 100.0 93.8 98.6 95.8 96.5 Bangladesh 97.8 97.8 100.0 100.0 93.3 100.0 93.1 95.4 Boro HYV FTF zone 97.5 98.6 97.7 100.0 95.0 99.3 96.1 97.0 Bangladesh 97.3 98.4 100.0 100.0 96.0 98.4 98.4 97.9 Female T. Aman local FTF zone 2.1 0.5 0.0 0.0 0.3 0.0 1.9 1.0 Bangladesh 0.0 1.1 0.0 0.0 0.6 3.4 2.2 1.4 T. Aman HYV FTF zone 3.6 1.2 2.6 0.0 6.2 1.4 4.2 3.5 Bangladesh 2.2 2.2 0.0 0.0 6.7 0.0 6.9 4.6 Boro HYV FTF zone 2.5 1.4 2.3 0.0 5.0 0.7 3.9 3.0 Bangladesh 2.7 1.6 0.0 0.0 4.0 1.6 1.6 2.1

145
Table 4.22—Average male and female labor use by rice postharvest activities
Source: IFPRI Bangladesh Integrated Household Survey, 2011-2012. The survey represents rural areas only.
Category Carrying Threshing Drying Sorting Packaging Total
(hours per crop)
Male T. Aman local
All FTF 13.3 15.0 6.0 2.6 5.4 42.2 Bangladesh 24.7 16.4 7.5 3.6 6.2 58.4 T. Aman HYV All FTF 43.4 21.0 6.2 2.2 4.2 77.0 Bangladesh 40.3 26.4 5.7 3.2 3.8 79.3 Boro HYV All FTF 53.4 24.4 7.2 5.2 7.0 97.3 Bangladesh 43.2 23.6 8.0 3.6 5.1 83.4 Female T. Aman local All FTF 0.3 1.8 15.0 6.4 6.5 30.1 Bangladesh 0.2 1.7 16.6 5.9 6.7 31.2 T. Aman HYV All FTF 1.7 5.6 8.6 3.1 2.9 21.9 Bangladesh 0.8 3.8 12.7 7.1 3.8 28.1 Boro HYV All FTF 1.4 5.5 13.5 6.4 5.4 32.2 Bangladesh 0.7 4.2 18.2 8.1 4.8 36.0

146
Table 4.23—Share of male and female labor use by rice postharvest activities
Source: IFPRI Bangladesh Integrated Household Survey, 2011-2012. The survey represents rural areas only.
Farm size Carrying Threshing Drying Sorting Packaging Total
(percent of total labor hours)
Male T. Aman local
All FTF 97.8 89.3 28.6 28.9 45.4 58.4 Bangladesh 99.2 90.6 31.1 37.9 48.1 65.2 T. Aman HYV All FTF 96.2 78.9 41.9 41.5 59.2 77.9 Bangladesh 98.1 87.4 31.0 31.1 50.0 73.8 Boro HYV All FTF 97.4 81.6 34.8 44.8 56.5 75.1 Bangladesh 98.4 84.9 30.5 30.8 51.5 69.8 Female T. Aman local All FTF 2.2 10.7 71.4 71.1 54.6 41.6 Bangladesh 0.8 9.4 68.9 62.1 51.9 34.8 T. Aman HYV All FTF 3.8 21.1 58.1 58.5 40.8 22.1 Bangladesh 1.9 12.6 69.0 68.9 50.0 26.2 Boro HYV All FTF 2.6 18.4 65.2 55.2 43.5 24.9 Bangladesh 1.6 15.1 69.5 69.2 48.5 30.2

147
Table 4.24—Average male and female labor use for production of vegetables and potatoes
Category Land
preparation Planting
Fertilizer application
Pesticide application
Weeding Irrigation Harvest Total
(hours per hectare) Male
Leafy Vegetables FTF zone 255.1 277.6 88.5 55.1 355.0 125.7 593.8 1,750.9 Bangladesh 282.5 278.4 71.0 46.2 436.3 253.9 581.3 1,949.6
Sweet gourd FTF zone 33.6 240.1 12.4 5.6 359.4 211.8 701.5 1,564.4 Bangladesh 145.1 409.0 15.8 11.9 128.8 23.2 506.8 1,240.6
Tomatoes
FTF zone 140.5 222.3 87.3 58.6 156.5 661.6 835.9 2,162.7 Bangladesh 420.4 294.5 109.3 50.2 255.2 152.6 555.0 1,837.1
Potatoes FTF zone 267.8 383.3 56.0 22.0 1,180.0 296.4 588.7 2,794.2 Bangladesh 95.4 420.9 36.3 39.2 223.2 73.5 288.2 1,176.6
Female Leafy Vegetables FTF zone 23.2 41.0 15.8 1.6 49.7 33.4 246.7 411.4 Bangladesh 31.8 55.3 18.9 3.1 37.7 98.3 231.9 477.0
Sweet gourd FTF zone 1.5 148.3 0.0 0.0 20.5 197.7 395.5 763.5 Bangladesh 0.0 190.7 95.3 0.0 149.0 0.0 466.2 901.2
Tomatoes
FTF zone 90.7 11.6 0.0 0.0 0.0 363.3 199.2 664.8 Bangladesh 61.7 151.7 57.1 0.0 97.6 134.9 600.0 1,103.0
Potatoes FTF zone 0.0 22.2 0.0 0.0 80.0 20.1 105.8 228.1 Bangladesh 1.1 41.2 0.2 0.0 10.2 5.3 209.0 267.0
Source: IFPRI Bangladesh Integrated Household Survey, 2011-2012. The survey represents rural areas only.

148
Table 4.25— Share of male and female labor use for production of vegetables and potatoes
Category Land
preparation Planting
Fertilizer application
Pesticide application
Weeding Irrigation Harvest Total
(percent of total labor hours) Male
Leafy vegetables FTF zone 91.7 87.1 84.9 97.1 87.7 79.0 70.7 81.0 Bangladesh 89.9 83.4 79.0 93.7 92.0 72.1 71.5 80.3
Sweet gourd FTF zone 95.7 61.8 100.0 100.0 94.6 51.7 63.9 67.2 Bangladesh 100.0 68.2 14.2 100.0 46.4 100.0 52.1 57.9
Tomatoes FTF zone 60.8 95.0 100.0 100.0 100.0 64.6 80.8 76.5 Bangladesh 87.2 66.0 65.7 100.0 72.3 53.1 48.1 62.5
Potatoes
FTF zone 100.0 94.5 100.0 100.0 93.6 93.7 84.8 92.5 Bangladesh 98.9 91.1 99.4 100.0 95.6 93.3 58.0 81.5
Female
Leafy vegetables FTF zone 8.3 12.9 15.1 2.9 12.3 21.0 29.3 19.0 Bangladesh 10.1 16.6 21.0 6.3 8.0 27.9 28.5 19.7
Sweet gourd
FTF zone 4.3 38.2 0.0 0.0 5.4 48.3 36.1 32.8 Bangladesh 0.0 31.8 85.8 0.0 53.6 0.0 47.9 42.1
Tomatoes FTF zone 39.2 5.0 0.0 0.0 0.0 35.4 19.2 23.5 Bangladesh 12.8 34.0 34.3 0.0 27.7 46.9 51.9 37.5
Potatoes FTF zone 0.0 5.5 0.0 0.0 6.4 6.3 15.2 7.5 Bangladesh 1.1 8.9 0.6 0.0 4.4 6.7 42.0 18.5
Source: IFPRI Bangladesh Integrated Household Survey, 2011-2012. The survey represents rural areas only.

149
Table 4.26—Looking after livestock: Feed the Future zone Per capita expenditure quintile Livestock caretaker 1 (lowest) 2 3 4 5 (highest) All (percent) Bullock Male 83.7 75.5 75.6 72.4 71.2 75.5 Female 16.3 24.5 24.4 27.6 28.8 24.5 Milk cow Male 81.8 64.9 67.6 64.7 72.9 69.6 Female 18.2 35.2 32.5 35.3 27.1 30.4 Buffalo Male . 100.0 100.0 . 100.0 100.0 Female . . . . . . Goat Male 47.1 52.2 53.4 44.1 50.2 49.4 Female 52.9 47.8 46.6 55.9 49.8 50.6 Sheep Male 50.0 0.0 100.0 100.0 . 60.0 Female 50.0 100.0 0.0 0.0 . 40.0 Chicken Male 11.6 12.3 9.2 8.7 8.4 10.0 Female 88.4 87.7 90.8 91.3 91.6 90.0 Duck Male 11.9 14.2 12.6 8.0 6.9 10.7 Female 88.1 85.9 87.4 92.0 93.1 89.3 Other birds Male 48.5 39.7 46.6 60.3 43.0 48.1 Female 51.5 60.3 53.4 39.7 57.0 51.9 Others Male 25.0 58.5 60.0 15.4 26.9 33.2 Female 75.0 41.5 40.0 84.6 73.2 66.8
Source: IFPRI Bangladesh Integrated Household Survey, 2011-2012. The survey represents rural areas only.

150
Table 4.27—Looking after livestock: Rural Bangladesh Per capita expenditure quintile Livestock caretaker 1 (lowest) 2 3 4 5 (highest) All (percent) Bullock Male 64.5 67.8 69.0 72.4 70.8 68.8 Female 35.6 32.2 31.0 27.6 29.3 31.2 Milk cow Male 65.0 69.9 72.5 71.5 71.2 70.3 Female 35.0 30.1 27.5 28.5 28.8 29.8 Buffalo Male 100.0 100.0 100.0 100.0 72.2 91.9 Female 0.0 0.0 0.0 0.0 27.8 8.1 Goat Male 45.9 44.4 44.2 46.9 45.8 45.3 Female 54.1 55.6 55.8 53.2 54.3 54.7 Sheep Male 37.9 40.0 30.3 56.9 46.1 42.1 Female 62.1 60.0 69.7 43.1 53.9 57.9 Chicken Male 7.1 9.1 8.7 6.7 8.8 8.1 Female 92.9 90.9 91.3 93.3 91.2 91.9 Duck Male 5.5 9.2 7.8 6.1 6.8 7.1 Female 94.5 90.9 92.2 93.9 93.3 92.9 Other birds Male 52.4 30.3 49.8 38.2 35.2 40.9 Female 47.6 69.7 50.2 61.8 64.8 59.2 Others Male 48.5 66.7 59.2 48.4 23.6 50.4 Female 51.5 33.3 40.8 51.7 76.5 49.7
Source: IFPRI Bangladesh Integrated Household Survey, 2011-2012. The survey represents rural areas only.

151
Table 4.28—Source of credit by farm size groups: Feed the Future zone Farm size groups
Source of Credit Marginal Small Medium Large All (percent) Relative/friend/neighbour 17.18 16.06 15.76 13.88 16.21 Bangladesh Krishi Bank 5.34 9.57 14.29 15.49 9.31 Other banks 9.8 9.77 10.72 17.11 10.6 Other financial institutions 0.82 0.73 0.0 1.3 0.71 NGO 24.39 24.47 21.81 13.64 23.05 Employer 0.17 0.15 0.0 0.0 0.12 Shop / dealer / trader 5.82 4.83 4.51 5.2 5.17 Money lender 3.86 3.8 3.29 5.85 3.93 Shamity (other than NGO) 5.11 4.43 2.87 0.65 4.09 Other 4.42 5.68 3.89 5.72 4.98 Does not have any loan currently
23.08 20.52 22.86 21.17 21.83
Total 100 100 100 100 100
Source: IFPRI Bangladesh Integrated Household Survey, 2011-2012. The survey represents rural areas only. Note: Marginal farmers are with landholding below 0.5 areas; small farmers, between 0.5 and 1.49 acres; medium farmers, between 1.50 and 2.49 acres; and large farmers, 2.5 acres and more.

152
Table 4.29—Source of credit by farm size groups: Rural Bangladesh
Farm size groups
Source of Credit Marginal Small Medium Large All (percent)
Relative/friend/neighbour 26.34 25 24.13 22.38 25.15 Bangladesh Krishi Bank 5.28 9.43 12.75 12.78 8.63 Rajshahi Krishi Unnayon Bank
0.25 0.69 0.63 1.99 0.64
Other banks 14 12.19 12.47 16.18 13.24 Other financial institutions 0.66 0.28 0.6 0.45 0.47 NGO 32.47 27.94 22.13 17.27 27.91 Employer 0.16 0.14 0.0 0.0 0.12 Shop/dealer /trader 4.59 4.99 6.33 6.21 5.12 Money lender 5.55 5.15 7.94 9.34 6.02 Shamity (other than NGO) 4.17 4.42 1.99 1.95 3.81 Other 6.53 9.77 11.02 11.46 8.9 Total 100 100 100 100 100
Source: IFPRI Bangladesh Integrated Household Survey, 2011-2012. The survey represents rural areas only. Note: Marginal farmers are with landholding below 0.5 areas; small farmers, between 0.5 and 1.49 acres; medium farmers, between 1.50 and 2.49 acres; and large farmers, 2.5 acres and more. Table 4.30—Average crop yields by farm size groups: Feed the Future zone
Crop Farm size groups
Marginal Small Medium Large FTF (metric ton/hectare) All Rice 2.86 2.74 2.68 2.35 2.73 Aus (local) 1.37 1.09 0.95 1.41 1.15 Aus (HYV) 2.25 2.26 1.97 2.36 2.22 B aman (local) 1.42 1.25 1.30 1.06 1.28 T aman (local) 1.53 1.46 1.46 1.10 1.46 T Aman (HYV) 2.43 2.36 2.40 2.17 2.37 Boro (HYV) 3.93 3.67 3.65 3.24 3.71 Boro (hybrid) 4.10 4.01 3.84 4.21 4.02 Wheat 2.31 2.75 2.68 2.37 2.65 Lentil 0.90 0.98 0.86 0.94 0.93 Green gram 0.55 0.77 0.80 0.79 0.74 Black gram 0.75 0.62 0.70 -- 0.66 Mustard 0.61 0.94 1.14 0.54 0.88 Eggplant 5.24 6.58 6.67 3.35 6.03 Potatoes 12.98 13.26 7.72 6.58 10.52
Source: IFPRI Bangladesh Integrated Household Survey, 2011-2012. The survey represents rural areas only. Note: Marginal farmers are defined as farmers with landholding below 0.5 acres, small farmers with landholding
between 0.5 and 1.49 acres, medium farmers with landholding between 1.5 and 2.49 acres, large farmers with landholding equal or above 2.5 acres.

153
Table 4.31—Average crop yields by farm size groups: Rural Bangladesh
Crop Farm size groups
Marginal Small Medium Large Bangladesh (metric ton/hectare) All Rice 2.86 2.82 2.78 2.67 2.82 Aus (local) 1.67 1.43 1.29 1.81 1.50 Aus (HYV) 2.16 2.06 2.00 2.19 2.10 B aman (local) 1.72 1.31 1.30 1.18 1.44 T aman (local) 1.96 1.34 1.88 1.17 1.57 T Aman (HYV) 2.14 2.18 2.27 2.17 2.18 Boro (HYV) 3.81 3.64 3.70 3.58 3.70 Boro (hybrid) 4.37 4.74 4.44 4.23 4.55 Wheat 3.24 2.88 3.21 2.34 3.00 Lentil 0.84 0.99 0.98 1.09 0.96 Green gram 0.71 0.71 0.65 0.68 0.69 Black gram 4.66 1.07 0.86 0.79 1.74 Mustard 1.01 1.05 1.21 1.17 1.10 Eggplant 21.10 15.59 12.70 18.41 17.02 Potatoes 13.76 13.96 13.59 14.28 13.90
Source: IFPRI Bangladesh Integrated Household Survey, 2011-2012. The survey represents rural areas only. Note: Marginal farmers are defined as farmers with landholding below 0.5 acres, small farmers with landholding
between 0.5 and 1.49 acres, medium farmers with landholding between 1.5 and 2.49 acres, large farmers with landholding equal or above 2.5 acres.
Table 4.32—Average crop yields by division: Rural Bangladesh
Crop Divisions
Barisal Chittagong Dhaka Khulna Rajshahi Rangpur Sylhet Bangladesh (metric ton/hectare) All Rice 1.97 2.72 3.07 2.68 3.02 2.75 2.29 2.82 Aus (local) 1.04 1.60 1.38 1.51 1.66 2.35 1.91 1.50 Aus (HYV) 2.02 2.23 1.56 2.23 2.02 2.38 1.90 2.10 B aman (local) 1.41 1.31 1.57 1.04 1.53 1.46 1.18 1.44 T aman (local) 1.38 2.37 2.23 1.25 1.48 1.05 1.57 T Aman (HYV) 2.50 1.93 1.97 2.43 2.36 2.15 1.66 2.18 Boro (HYV) 3.53 3.47 3.77 3.53 3.95 3.73 2.90 3.70 Boro (hybrid) -- 3.97 5.40 3.98 4.84 4.34 4.29 4.55 Wheat 1.06 3.06 2.59 3.02 3.23 2.72 -- 3.00 Lentil 0.53 0.81 0.96 1.10 0.54 0.89 -- 0.96 Green gram 0.57 0.19 0.41 0.75 0.88 -- -- 0.69 Black gram -- 1.41 0.79 0.58 3.14 0.79 -- 1.74 Mustard 0.58 0.97 1.28 0.62 1.25 0.76 0.59 1.10 Eggplant 6.06 13.82 27.83 10.13 16.07 11.25 9.79 17.02 Potatoes 14.86 12.67 11.96 8.02 15.13 16.25 8.33 13.90
Source: IFPRI Bangladesh Integrated Household Survey, 2011-2012. The survey represents rural areas only.

154
Table 4.33—Average number of livestock holding by income groups as of November 1, 2011: Feed the Future zone
Per capita expenditure quintile
Livestock 1 (lowest) 2 3 4 5 (highest) Total
(number)
Bullock 0.5 0.7 0.7 0.7 0.5 0.6 Milk cow 0.3 0.5 0.5 0.6 0.5 0.5 Goat 0.6 0.7 0.7 0.6 0.5 0.6 Chicken 4.9 3.7 4.1 5.4 5.4 4.7 Duck 1.6 1.8 1.8 1.9 2.1 1.8 Other birds 0.1 0.3 0.6 0.5 0.5 0.4 Others 0.1 0.1 0.1 0.3 0.2 0.2
Source: IFPRI Bangladesh Integrated Household Survey, 2011-2012. The survey represents rural areas only.
Table 4.34—Average number of livestock holding by income groups as of November 1, 2011: Rural Bangladesh
Per capita expenditure quintile
Livestock 1 (lowest) 2 3 4 5 (highest) Total
(number)
Bullock 0.4 0.5 0.5 0.5 0.5 0.5 Milk cow 0.4 0.5 0.5 0.7 0.6 0.5 Goat 0.4 0.5 0.5 0.5 0.3 0.5 Chicken 3.4 3.7 6.6 4.6 7.7 5.1 Duck 0.8 1.2 1.2 1.2 1.5 1.2 Other birds 0.1 0.2 0.3 0.3 0.4 0.3 Others 0.0 0.1 0.2 0.1 0.1 0.1
Source: IFPRI Bangladesh Integrated Household Survey, 2011-2012. The survey represents rural areas only.

155
Table 4.35—Average annual production of milk and eggs by income groups: Feed the Future zone
Per capita expenditure quintile
Product 1 (lowest) 2 3 4 5 (highest) Total Average for producers
Milk (liter/year) 158 144 212 252 360 234 Eggs (number/year) 102 130 183 327 241 199
Average for all households Milk (liter/year) 22 29 52 74 84 52
Eggs (number/year) 67 85 127 234 167 136
Source: IFPRI Bangladesh Integrated Household Survey, 2011-2012. The survey represents rural areas only.
Table 4.36—Average annual production of milk and eggs by income groups: Rural Bangladesh
Per capita expenditure quintile Product 1 (lowest) 2 3 4 5 (highest) Total Average for producers
Milk (liter/year) 177 196 194 241 379 244 Eggs (number/year) 85 132 199 114 691 245
Average for all households Milk (liter/year) 24 37 39 59 89 49
Eggs (number/year) 46 82 128 77 463 155
Source: IFPRI Bangladesh Integrated Household Survey, 2011-2012. The survey represents rural areas only.

156
Table 4.37—Input costs per hectare for irrigated boro paddy cultivation Division
Input FTF zone
Barisal Chittagong Dhaka Khulna Rajshahi Rangpur Sylhet Bangladesh
(taka) Seed/seedling 4,757 3,957 6,902 6,049 4,549 6,710 3,769 4,159 5,549 Mechanical
irrigation 13,453 8,648 11,386 12,079 13,641 11,332 10,380 6,864 11,431
Manual irrigation 477 842 333 217 854 315 64 575 327 Land rent 14,565 10,763 12,973 14,434 15,110 18,854 16,892 14,414 15,623 Urea 3,696 3,647 3,464 3,489 4,031 3,494 3,419 2,398 3,487 TSP 3,445 4,581 4,182 2,494 3,889 2,463 2,532 2,041 2,858 DAP 771 - 185 1,147 849 1,193 848 25 885 MP 1,528 663 1,401 1,509 1,832 1,312 1,374 563 1,416 Zinc 700 449 351 277 1,217 417 196 85 408 Ammonia 16 - - 3 21 5 27 - 9 Gypsum 1,048 - 66 165 1,005 372 408 77 338 NPKS 23 - 9 36 6 8 9 17 17 Calcium 225 470 173 357 307 148 104 111 232 Manure 1,382 252 1,760 1,402 634 1,930 3,395 516 1,751 Pesticides 2,112 3,263 2,187 1,373 2,010 2,864 1,835 761 1,907 Drought animal 660 76 23 263 993 316 240 174 327 Power tiller 4,501 9,073 5,809 5,056 4,261 4,452 4,490 4,872 4,854 Seeding machine 76 - - 1 37 - - - 5 Equipment for
applying fertilizer
84 - - 3 187 - - - 24
Pesticide sprayer 80 118 114 59 81 85 66 60 75 Weeding
machine 60 562 0 - - 23 - 5 11
Harvesting machine
118 680 - 77 - 81 4 - 49
Family labor Land preparation Male 2,722 619 2,098 1,948 3,346 1,978 1,691 1,884 2,082 Female 117 - 40 6 156 4 166 16 58
Transplanting Male 2,509 2,965 2,483 3,386 1,981 3,277 2,412 1,913 2,828 Female 105 - 156 22 60 98 244 27 97 Fertilizer application Male 74 249 182 59 49 24 220 61 96 Female 17 - 4 5 2 1 12 4 5 Pesticide application Male 586 458 414 306 627 608 406 165 430 Female 2 - - 0 - - - - 0 Weeding Male 3,330 2,988 4,773 4,854 3,524 4,675 3,248 3,126 4,240 Female 194 - 122 62 229 70 412 21 152 Irrigation Male 3,084 1,503 856 2,640 4,802 2,139 3,178 2,539 2,694 Female 18 - 29 37 10 26 13 11 24
(continued)

157
Division
Input FTF zone
Barisal Chittagong Dhaka Khulna Rajshahi Rangpur Sylhet Bangladesh
(taka) Harvesting Male 2,961 3,144 2,942 3,842 2,467 3,234 2,849 1,848 3,156 Female 295 - 234 81 232 67 284 50 149 Hired labor Land preparation Male 903 471 673 540 576 257 296 661 465 Female 9 - - 30 21 - 54 - 22 Transplanting Male 4,395 4,703 9,001 5,850 4,822 4,651 3,466 5,429 5,373 Female 48 - 79 14 10 85 46 26 41 Fertilizer application Male 74 249 182 62 49 24 220 61 97 Female 1 - - 1 - - 5 8 2 Pesticide application Male 62 77 132 59 85 70 77 11 74 Female - - - - - - - - - Weeding Male 3,677 2,838 7,172 4,372 3,348 2,232 1,635 2,817 3,544 Female 183 - 68 9 360 14 180 43 93 Irrigation Male 65 382 67 182 - 17 18 266 91 Female - - - - - - - - - Harvesting Male 4,585 5,090 11,693 7,031 4,951 6,697 4,554 7,115 6,761 Female 11 - 35 - 25 13 49 - 19 Total cost 83,803 73,778 94,749 85,889 87,244 86,636 75,785 65,816 84,172
Source: IFPRI Bangladesh Integrated Household Survey, 2011-2012. The survey represents rural areas only. Note: All seed costs are included as cash costs.

158
Table 4.38—Costs of inputs as percentages of full costs per hectare for irrigated boro paddy cultivation
Region Seed Irrigation Land rent
Fertilizer Manure Pesticide Equipment Family labor
Hired labor
Total
(percent)
FTF zone 5.7 16.6 17.4 13.7 1.6 2.5 6.7 19.1 16.7 100.0
Barisal 5.4 12.9 14.6 13.3 0.3 4.4 14.2 16.2 18.7 100.0
Chittagong 7.3 12.4 13.7 10.4 1.9 2.3 6.3 15.1 30.7 100.0
Dhaka 7.0 14.3 16.8 11.0 1.6 1.6 6.4 20.1 21.1 100.0
Khulna 5.2 16.6 17.3 15.1 0.7 2.3 6.4 20.0 16.3 100.0
Rajshahi 7.7 13.4 21.8 10.9 2.2 3.3 5.7 18.7 16.2 100.0
Rangpur 5.0 13.8 22.3 11.8 4.5 2.4 6.3 20.0 14.0 100.0
Sylhet 6.3 11.3 21.9 8.1 0.8 1.2 7.8 17.7 25.0 100.0
Bangladesh 6.6 14.0 18.6 11.5 2.1 2.3 6.3 19.0 19.7 100.0
Source: IFPRI Bangladesh Integrated Household Survey, 2011-2012. The survey represents rural areas only. Note: Equipment include drought animal, power tiller and other agricultural machineries
Table 4.39— Costs of inputs as percentages of cash costs per hectare for irrigated boro paddy cultivation
Region Seed Irrigation Fertilizer Manure Pesticide Equipment Hired labor Total
(percent)
FTF zone 8.9 26.2 21.5 2.6 4.0 10.5 26.3 100.0
Barisal 7.7 18.6 19.2 0.5 6.4 20.6 27.0 100.0
Chittagong 10.2 17.4 14.6 2.6 3.2 8.8 43.1 100.0
Dhaka 11.2 22.7 17.5 2.6 2.5 10.1 33.5 100.0
Khulna 8.3 26.5 24.1 1.2 3.7 10.2 26.1 100.0
Rajshahi 13.0 22.6 18.2 3.7 5.6 9.6 27.3 100.0
Rangpur 8.6 23.9 20.4 7.8 4.2 11.0 24.2 100.0
Sylhet 10.5 18.7 13.4 1.3 1.9 12.9 41.4 100.0
Bangladesh 10.6 22.4 18.4 3.3 3.6 10.2 31.6 100.0
Source: IFPRI Bangladesh Integrated Household Survey, 2011-2012. The survey represents rural areas only. Note: Equipment include drought animal, power tiller and other agricultural machineries.

159
Table 4.40—Total costs and profitability of irrigated boro paddy cultivation Cash
cost Total cost
Cash cost
Total cost
Value of crop
Value of crop
Net profit (full cost basis)
Gross profit (cash cost basis)
Region/ Division
Per hectare
Per hectare
Per ton
Per ton
Per hectare
Per ton
Per hectare
Per ton
Per hectare
Per ton
(taka)
FTF zone 53,224 83,803 10,038 16,078 103,689 18,220 19,886 2,142 50,466 8,182
Barisal 51,089 73,778 11,198 16,557 75,815 14,773 2,038 (1,784) 24,727 3,574
Chittagong 67,444 94,749 14,178 20,298 84,962 16,034 (9,787) (4,265) 17,518 1,856
Dhaka 54,208 85,889 10,223 16,407 98,395 17,197 12,506 790 44,188 6,973
Khulna 54,650 87,244 10,705 17,047 101,662 18,492 14,418 1,446 47,012 7,788
Rajshahi 51,580 86,636 8,772 14,807 110,399 16,832 23,763 2,025 58,820 8,060
Rangpur 43,758 75,785 8,402 14,750 91,347 16,206 15,562 1,456 47,589 7,804
Sylhet 39,738 65,816 8,697 14,858 76,090 15,841 10,274 983 36,352 7,143
Bangladesh 52,539 84,172 10,043 16,230 96,939 16,880 12,767 650 44,400 6,837
Source: IFPRI Bangladesh Integrated Household Survey, 2011-2012. The survey represents rural areas only. Notes: All seed costs are included as cash costs. Net profit = value of crop per hectare–total cost per hectare. Gross profit = value of crop per hectare–cash cost per hectare.

160
Table 4.41—Input costs per hectare for HYV aman paddy cultivation Division
Input FTF zone
Barisal Chittagong Dhaka Khulna Rajshahi Rangpur Sylhet Bangladesh
(taka)
Seed/seedling 3,932 7,042 5,614 6,130 3,706 4,232 3,403 3,698 4,572 Mechanical
irrigation 2,311 - 400 1,221 2,430 2,556 1,587 199 1,679
Manual irrigation
152 - 115 6 320 182 - 68 117
Land rent 14,367 10,763 12,973 14,434 15,110 18,854 16,892 14,414 15,854 Urea 3,394 2,862 3,517 3,016 4,014 4,014 3,040 2,416 3,452 TSP 2,450 1,267 2,499 1,026 2,905 1,757 1,147 1,375 1,715 DAP 631 30 374 544 646 446 508 48 475 MP 855 255 662 672 1,178 862 650 298 773 Zinc 520 - 110 52 668 442 104 - 270 Ammonia 37 - - 1 39 4 12 - 11 Gypsum 552 - 39 38 436 178 121 2 158 NPKS 6 - - 22 - - - 83 9 Calcium 170 - 75 93 168 154 77 5 109 Manure 549 34 491 377 405 1,316 1,181 638 775 Pesticides 1,735 1,083 1,735 688 1,661 1,984 1,355 758 1,413 Drought animal 450 596 80 162 474 223 471 467 319 Power tiller 4,270 4,782 6,033 4,548 4,536 4,780 4,491 4,602 4,721 Seeding
machine 70 - - - - - - 27 1
Equipment for applying fertilizer
- - - 4 - - - 3 1
Pesticide sprayer
49 76 23 35 40 52 45 94 45
Weeding machine
20 68 - - - 13 - 18 7
Harvesting machine
63 88 - - - 61 - 27 20
Family labor Land preparation Male 1,904 1,611 2,264 1,692 2,005 1,316 1,779 2,632 1,762 Female 55 - 10 11 36 7 86 16 29
Transplanting Male 2,523 4,119 3,001 3,242 2,159 2,699 2,216 2,236 2,678 Female 72 - 104 55 32 95 166 64 84 Fertilizer application Male 83 39 53 54 64 37 33 82 48 Female 24 - 2 4 - 8 8 4 5 Pesticide application Male 442 421 444 190 519 467 380 195 384 Female 1 - - - 1 1 - - 0 Weeding Male 3,253 3,087 3,643 3,939 3,087 2,805 2,497 2,756 3,115 Female 135 - 266 152 139 29 257 507 160 (continued)

161
Division
Input FTF zone
Barisal Chittagong Dhaka Khulna Rajshahi Rangpur Sylhet Bangladesh
(taka)
Irrigation Male 1,262 457 196 620 1,282 803 1,324 279 866 Female 7 - 16 5 2 3 11 4 6 Harvesting Male 3,339 3,807 2,886 3,987 2,485 2,177 2,313 2,206 2,767 Female 104 16 2,105 587 60 71 152 83 354 Hired labor Land preparation Male 628 251 834 299 480 250 323 311 366 Female 8 - - - - - - 5 0 Transplanting Male 3,834 3,132 7,694 5,951 4,251 3,498 3,664 3,409 4,507 Female - - 43 - - 136 75 19 52 Fertilizer application Male 83 39 53 54 64 37 33 82 48 Female 6 - 14 11 9 - 6 - 6 Pesticide application Male 54 60 71 44 57 79 97 27 67 Female - - - - - - - - - Weeding Male 2,964 1,490 5,869 3,270 2,857 2,527 1,554 2,820 2,798 Female 104 - 189 3 125 72 169 - 89 Irrigation Male 105 49 21 10 - 16 9 13 12 Female - - - - - - - - - Harvesting Male 3,479 2,804 6,209 4,519 3,596 4,579 3,212 4,290 4,169 Female 115 - 179 2 30 27 63 8 39 Total cost 61,206 50,328 70,909 61,660 62,154 64,020 55,571 51,167 60,949 All seed costs are included as cash costs
Source: IFPRI Bangladesh Integrated Household Survey, 2011-2012. The survey represents rural areas only.

162
Table 4.42—Costs of inputs as percentages of full costs per hectare for HYV aman paddy cultivation
Region Seed Irrigation Land rent
Fertilizer Manure Pesticide Equipment Family labor
Hired labor
Total
(percent)
FTF zone 6.4 4.0 23.5 14.1 0.9 2.8 8.0 21.6 18.6 100.0
Barisal 14.0 - 21.4 8.8 0.1 2.2 11.1 26.9 15.6 100.0
Chittagong 7.9 0.7 18.3 10.3 0.7 2.4 8.7 21.1 29.9 100.0
Dhaka 9.9 2.0 23.4 8.9 0.6 1.1 7.7 23.7 22.7 100.0
Khulna 6.0 4.4 24.3 16.2 0.7 2.7 8.1 19.2 18.4 100.0
Rajshahi 6.6 4.3 29.4 12.3 2.1 3.1 8.0 16.5 17.6 100.0
Rangpur 6.1 2.9 30.4 10.2 2.1 2.4 9.0 20.2 16.6 100.0
Sylhet 7.2 0.5 28.2 8.3 1.3 1.5 10.3 21.1 21.6 100.0
Bangladesh 7.5 3.0 26.0 11.5 1.3 2.3 8.4 20.1 19.9 100.0
Source: IFPRI Bangladesh Integrated Household Survey, 2011-2012. The survey represents rural areas only. Note: Equipment include drought animal, power tiller and other agricultural machineries.
Table 4.43—Costs of inputs as percentages of cash costs per hectare for HYV aman paddy cultivation
Division/Division Seed Irrigation Fertilizer Manure Pesticide Equipment Hired labor Total
(percent)
FTF zone 11.7 7.3 25.6 1.6 5.2 14.7 33.9 100.0
Barisal 27.1 - 17.0 0.1 4.2 21.6 30.1 100.0
Chittagong 13.1 1.2 16.9 1.1 4.0 14.3 49.3 100.0
Dhaka 18.7 3.7 16.7 1.1 2.1 14.5 43.2 100.0
Khulna 10.6 7.8 28.6 1.2 4.7 14.4 32.7 100.0
Rajshahi 12.3 7.9 22.8 3.8 5.8 14.9 32.5 100.0
Rangpur 12.4 5.8 20.7 4.3 4.9 18.3 33.6 100.0
Sylhet 14.3 1.0 16.4 2.5 2.9 20.3 42.6 100.0
Bangladesh 13.9 5.5 21.3 2.4 4.3 15.6 37.1 100.0
Source: IFPRI Bangladesh Integrated Household Survey, 2011-2012. The survey represents rural areas only. Note: Equipment include drought animal, power tiller and other agricultural machineries.

163
Table 4.44—Total costs and profitability of HYV aman paddy cultivation Cash
cost Total cost
Cash cost
Total cost
Value of crop
Value of crop
Net profit (full cost basis)
Gross profit (cash cost basis)
Region/ Division
Per hectare
Per hectare
Per ton
Per ton
Per hectare
Per ton
Per hectare
Per ton
Per hectare
Per ton
(taka)
FTF zone 33,613 61,206 9,650 17,979 64,701 17,322 3,495 (657) 31,087 7,671
Barisal 26,008 50,328 7,294 14,249 64,557 17,682 14,229 3,433 38,548 10,388
Chittagong 42,944 70,909 16,009 26,721 59,357 16,188 (11,552) (10,534) 16,413 178
Dhaka 32,629 61,660 12,720 24,403 49,207 16,396 (12,453) (8,007) 16,578 3,676
Khulna 35,135 62,154 10,546 18,836 60,344 16,712 (1,810) (2,124) 25,209 6,166
Rajshahi 34,635 64,020 11,081 20,988 58,034 15,968 (5,986) (5,020) 23,400 4,887
Rangpur 27,441 55,571 8,701 18,676 54,584 15,133 (987) (3,543) 27,143 6,432
Sylhet 25,975 51,168 10,741 21,880 39,971 14,535 (11,197) (7,345) 13,995 3,793
Bangladesh 32,826 60,949 11,101 21,110 55,410 16,049 (5,539) (5,061) 22,584 4,948
Source: IFPRI Bangladesh Integrated Household Survey, 2011-2012. The survey represents rural areas only. Notes: All seed costs are included as cash costs. Net profit = value of crop per hectare–total cost per hectare. Gross profit = value of crop per hectare–cash cost per hectare.

164
Table 4.45—Input costs per hectare for local aman paddy cultivation Division
Input FTF zone
Barisal Chittagong Dhaka Khulna Rajshahi Rangpur Sylhet Bangladesh
(taka)
Seed/seedling 4,343 4,147 5,530 4,726 3,871 3,395 4,759 2,240 4,396 Mechanical
irrigation 541 - 343 1,024 1,613 1,591 1,345 282 912
Manual irrigation
12 - - 14 71 135 166 - 50
Land rent 12,384 10,763 12,973 14,434 15,110 18,854 16,892 14,414 14,554 Urea 1,849 1,800 2,389 2,337 2,518 3,190 3,194 1,623 2,457 TSP 1,226 833 2,380 875 2,212 1,220 1,429 502 1,247 DAP 205 75 58 248 497 965 138 40 275 MP 301 80 599 340 740 472 618 119 405 Zinc 111 - 120 83 53 270 114 16 92 Ammonia - - - 98 - 17 - - 36 Gypsum 103 - 2 37 409 311 63 - 93 NPKS - - - 26 - - - 38 10 Calcium 6 - 87 19 4 94 48 - 33 Manure 221 29 318 362 145 427 991 173 372 Pesticides 866 908 865 418 624 1,335 1,119 223 760 Drought
animal 369 445 23 32 716 58 208 90 195
Power tiller 4,253 4,580 5,033 4,927 3,810 4,133 4,376 4,010 4,575 Seeding
machine 26 3 - - - - - - 0
Equipment for applying fertilizer
- 3 - - - - - - 0
Pesticide sprayer
48 59 37 19 39 40 90 33 43
Weeding machine
8 - - - - - - - -
Harvesting machine
190 12 - - - - - - 2
Family labor
Land preparation Male 1,700 1,224 2,261 1,400 1,903 891 1,940 2,396 1,567 Female 3 - 100 25 - - 543 - 98 Transplanting Male 2,844 3,065 1,898 2,208 1,606 1,420 3,795 2,038 2,408 Female 31 37 177 1 - - 1,101 - 186 Fertilizer application Male 38 - 61 25 3 6 - 20 17 Female 5 - 6 2 32 - 60 - 13 Pesticide application Male 341 289 186 158 369 249 362 36 237 Female - - - 1 - - - - 0 Weeding Male 3,226 2,388 4,388 3,451 2,350 3,716 4,049 1,854 3,318 Female 61 88 205 57 129 57 1,293 - 263 (continued)

165
Division
Input FTF zone
Barisal Chittagong Dhaka Khulna Rajshahi Rangpur Sylhet Bangladesh
(taka)
Irrigation Male 414 226 71 477 665 293 1,258 24 487 Female - - 29 77 - - 14 - 31 Harvesting Male 4,014 2,736 4,206 3,168 2,557 2,572 3,617 2,421 3,117 Female 205 19 212 127 - 124 1,051 81 238 Hired labor Land preparation Male 730 88 415 472 411 50 348 439 330 Female 6 2 31 22 - - - - 11 Transplanting Male 2,719 2,840 7,423 4,182 3,619 2,129 2,864 1,149 3,701 Female 61 - - - - - - - - Fertilizer application
Male 38 - 61 25 3 6 - 20 16 Female 18 - - - - - - - - Pesticide application
Male 42 28 255 14 10 56 7 - 44 Female - - - - - - - - - Weeding Male 2,097 1,370 3,021 3,624 2,479 1,524 1,237 741 2,386 Female 15 - - 19 - 953 482 - 180 Irrigation Male 219 - 18 - - 32 52 - 13 Female - - - - - - - - - Harvesting Male 3,166 2,596 7,854 4,753 3,398 5,220 3,517 3,382 4,395 Female 14 32 - - - - 88 - 18 Total cost 48,757 40,767 63,632 54,359 52,048 55,807 63,230 38,404 53,604
Source: IFPRI Bangladesh Integrated Household Survey, 2011-2012. The survey represents rural areas only. Note: All seed costs are included as cash costs.

166
Table 4.46—Costs of inputs as percentages of full costs per hectare for local aman paddy cultivation
Region Seed Irrigation Land rent
Fertilizer Manure Pesticide Equipment Family labor
Hired labor
Total
(percent)
FTF zone 9.0 1.2 25.4 7.7 0.5 1.8 10.0 26.2 18.3 100.0 Barisal 10.2 - 26.4 6.8 0.1 2.2 12.5 24.7 17.1 100.0 Chittagong 8.7 0.5 20.4 8.9 0.5 1.4 8.0 21.7 30.0 100.0 Dhaka 8.8 1.9 26.6 7.5 0.7 0.8 9.1 20.8 23.8 100.0 Khulna 7.6 3.3 29.0 12.4 0.3 1.2 8.8 18.1 19.3 100.0 Rajshahi 6.1 3.1 33.8 11.7 0.8 2.4 7.6 16.7 17.9 100.0 Rangpur 7.5 2.4 26.7 8.9 1.6 1.8 7.4 30.2 13.6 100.0 Sylhet 5.8 0.7 37.5 6.1 0.5 0.6 10.8 23.1 14.9 100.0 Bangladesh 8.2 1.8 27.2 8.7 0.7 1.4 9.0 22.4 20.6 100.0
Source: IFPRI Bangladesh Integrated Household Survey, 2011-2012. The survey represents rural areas only. Note: Equipment include drought animal, power tiller and other agricultural machineries.
Table 4.47—Costs of inputs as percentages of cash costs per hectare for local aman paddy cultivation
Region Seed Irrigation Fertilizer Manure Pesticide Equipment Hired labor Total
(percent)
FTF zone 18.2 2.3 16.0 0.9 3.6 20.6 38.3 100.0
Barisal 20.8 - 14.0 0.1 4.6 25.6 34.9 100.0
Chittagong 15.0 0.9 15.3 0.9 2.3 13.8 51.8 100.0
Dhaka 16.5 3.6 14.2 1.3 1.5 17.3 45.7 100.0
Khulna 14.2 6.2 23.6 0.5 2.3 16.8 36.4 100.0
Rajshahi 12.3 6.2 23.7 1.5 4.8 15.3 36.1 100.0
Rangpur 17.5 5.5 20.6 3.6 4.1 17.2 31.5 100.0
Sylhet 14.8 1.9 15.5 1.1 1.5 27.3 37.9 100.0
Bangladesh 16.3 3.6 17.2 1.4 2.8 17.8 41.0 100.0
Source: IFPRI Bangladesh Integrated Household Survey, 2011-2012. The survey represents rural areas only. Note: Equipment include drought animal, power tiller and other agricultural machineries.

167
Table 4.48—Total costs and profitability of local aman paddy cultivation
Cash cost
Total cost
Cash cost
Total cost
Value of crop
Value of crop
Net profit (full cost basis)
Gross profit (cash cost basis)
Region Per
hectare Per
hectare Per ton
Per ton
Per hectare Per ton
Per Hectare
Per ton
Per Hectare
Per ton
(taka)
FTF zone 23,609 48,757 12,269 25,816 38,131 17,172 (10,626) (8,644) 14,523 4,903 Barisal 19,933 40,767 10,354 21,413 34,267 16,735 (6,500) (4,678) 14,334 6,382 Chittagong 36,859 63,632 15,657 27,888 46,604 15,362 (17,028) (12,525) 9,745 (295) Dhaka 28,624 54,359 13,027 25,574 41,928 16,444 (12,431) (9,131) 13,304 3,417 Khulna 27,529 52,048 14,110 27,219 35,308 16,559 (16,740) (10,660) 7,779 2,449 Rajshahi 27,626 55,807 13,747 28,333 32,689 15,165 (23,118) (13,168) 5,063 1,418 Rangpur 27,255 63,230 12,432 27,607 41,255 15,874 (21,975) (11,733) 14,000 3,443 Sylhet 15,120 38,404 8,579 22,803 28,685 14,832 (9,718) (7,971) 13,565 6,252 Bangladesh 27,035 53,604 12,750 25,735 38,872 16,106 (14,732) (9,629) 11,836 3,356
Source: IFPRI Bangladesh Integrated Household Survey, 2011-2012. The survey represents rural areas only. Notes: All seed costs are included as cash costs. Net profit = value of crop per hectare–total cost per hectare. Gross profit = value of crop per hectare–cash cost per hectare.

168
Table 4.49—Total production and marketed surplus rates for selected products: Feed the Future zone and divisions of rural Bangladesh
Division
FTF Zone
Barisal Chittagong Dhaka Khulna Rajshahi Rangpur Sylhet Bangladesh
Total production (kg/farmer) Rice 1,529 1,801 1,279 1,803 1,593 2,533 1,877 2,303 1,891 Wheat 439 78 646 405 487 623 748 120 591 Pulses 185 187 134 200 164 301 67 347 196 Potatoes 455 557 442 209 260 656 703 467 Non Leafy Vegetables
420 47 622 557 329 618 188 221 437
Leafy Vegetables
133 14 347 80 140 50 19 72 98
Fruits 313 108 455 223 345 200 237 148 257
Marketed surplus rates (percent): direct (sold product only) Rice 32 31 14 31 35 43 40 27 36 Wheat 44 0 48 53 47 55 85 0 59 Pulses 55 51 53 49 54 69 22 22 53 Potatoes 15 8 12 7 0 21 0 6 11 Non Leafy Vegetables
28 5 22 19 22 34 10 12 20
Leafy Vegetables
12 3 24 9 8 8 2 25 9
Fruits 14 7 9 9 15 8 5 7 9
Marketed surplus rates(percent): indirect (sold product paid for services) Rice 50 47 36 47 48 60 51 53 52
Wheat 56 0 65 63 62 70 91 0 72
Pulses 68 65 60 66 64 77 41 44 66
Potatoes 31 23 23 31 17 47 0 34 29
Non Leafy Vegetables
37 15 34 30 31 47 25 21 32
Leafy Vegetables
23 11 37 23 19 20 16 34 21
Fruits 27 24 24 24 30 28 26 22 26
Source: IFPRI Bangladesh Integrated Household Survey, 2011-2012. The survey represents rural areas only.
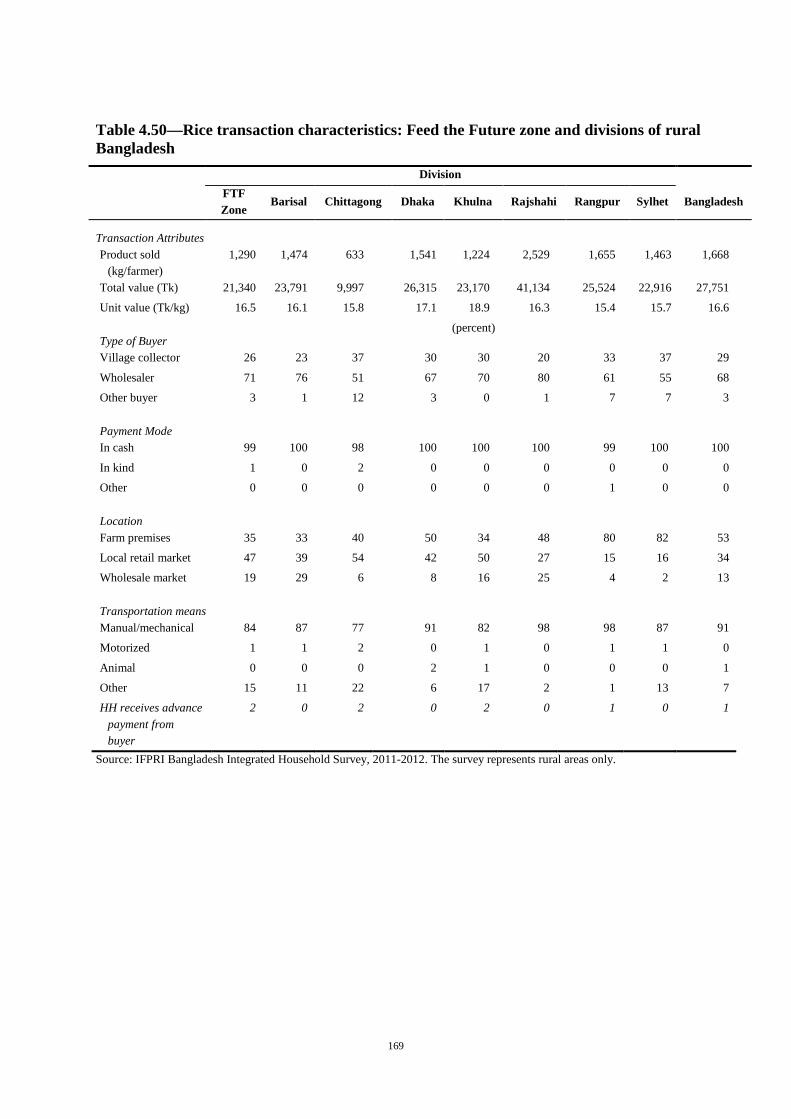
169
Table 4.50—Rice transaction characteristics: Feed the Future zone and divisions of rural Bangladesh
Division
FTF Zone
Barisal Chittagong Dhaka Khulna Rajshahi Rangpur Sylhet Bangladesh
Transaction Attributes Product sold
(kg/farmer) 1,290 1,474 633 1,541 1,224 2,529 1,655 1,463 1,668
Total value (Tk) 21,340 23,791 9,997 26,315 23,170 41,134 25,524 22,916 27,751 Unit value (Tk/kg) 16.5 16.1 15.8 17.1 18.9 16.3 15.4 15.7 16.6
Type of Buyer (percent)
Village collector 26 23 37 30 30 20 33 37 29 Wholesaler 71 76 51 67 70 80 61 55 68 Other buyer 3 1 12 3 0 1 7 7 3
Payment Mode In cash 99 100 98 100 100 100 99 100 100 In kind 1 0 2 0 0 0 0 0 0 Other 0 0 0 0 0 0 1 0 0
Location
Farm premises 35 33 40 50 34 48 80 82 53 Local retail market 47 39 54 42 50 27 15 16 34 Wholesale market 19 29 6 8 16 25 4 2 13
Transportation means Manual/mechanical 84 87 77 91 82 98 98 87 91
Motorized 1 1 2 0 1 0 1 1 0
Animal 0 0 0 2 1 0 0 0 1
Other 15 11 22 6 17 2 1 13 7
HH receives advance payment from buyer
2 0 2 0 2 0 1 0 1
Source: IFPRI Bangladesh Integrated Household Survey, 2011-2012. The survey represents rural areas only.

170
Table 4.51—Rice transaction characteristics by farm size groups: Rural Bangladesh Farm size groups
Marginal Small Medium Large Total
Transaction Attributes Product sold (kg/farmer) 370 983 2,109 5,225 1,668 Total value (Tk) 6,153 16,313 35,660 86,274 27,751 Unit value (Tk/kg) 16.6 16.6 16.9 16.5 16.6
Type of Buyer (percent)
Village collector 34 27 29 26 29 Wholesaler 60 69 69 72 68 Other buyer 6 4 1 2 3
Payment Mode In cash 100 100 100 100 100 In kind 0 0 0 0 0 Other 0 0 0 0 0
Location Farm premises 52 53 54 53 53 Local retail market 36 36 34 28 34 Wholesale market 11 12 13 19 13
Transportation means
Manual/mechanical 93 93 89 84 91 Motorized 0 0 1 2 0 Animal 0 1 1 2 1 Other 7 6 9 12 7 HH receives advance payment from buyer
1 1 1 0 1
Source: IFPRI Bangladesh Integrated Household Survey, 2011-2012. The survey represents rural areas only.

171
Table 4.52—Monthly rice equivalent paddy stock at farm level: Feed the Future zone and divisions of rural Bangladesh
Division
Month
FTF Zone
Barisal Chittagong Dhaka Khulna Rajshahi Rangpur Sylhet Bangladesh
(thousand metric tons) Dec-10 874 316 392 1,037 639 771 541 264 3,961 Jan-11 799 308 343 705 608 492 359 206 3,021 Feb-11 650 243 281 533 491 335 246 167 2,296 Mar-11 587 202 249 389 423 241 196 145 1,845 Apr-11 1,015 192 401 1,101 817 392 255 222 3,382 May-11 1,455 198 812 3,047 1,018 1,424 1,102 633 8,234 Jun-11 1,240 178 694 2,456 691 969 941 514 6,442 Jul-11 1,033 160 596 1,966 554 658 730 449 5,113 Aug-11 996 213 489 1,531 521 527 502 370 4,152 Sep-11 851 162 434 1,198 464 382 447 273 3,360 Oct-11 744 119 368 939 407 266 342 234 2,675 Nov-11 876 99 440 1,181 759 1,175 533 250 4,438
Source: IFPRI Bangladesh Integrated Household Survey, 2011-2012. The survey represents rural areas only.

172

173
TABLES FOR SECTION 5: ACCESS TO FOOD

174
Table 5.1—Distribution of per capita income: Feed the Future zone
Per capita expenditure group Average per capita
expenditure Share of total expenditure in
each group
(taka/month) (percent) 1 (poorest) 1,019 1.91 2 1,275 2.39 3 1,411 2.65 4 1,536 2.88 5 1,650 3.10 6 1,747 3.28 7 1,863 3.50 8 1,975 3.71 9 2,096 3.93 10 2,212 4.15 11 2,349 4.41 12 2,484 4.66 13 2,641 4.96 14 2,834 5.32 15 3,049 5.72 16 3,303 6.20 17 3,626 6.81 18 4,123 7.74 19 4,805 9.02 20 (richest) 7,283 13.67 All households 2,660 100.00
Source: IFPRI Bangladesh Integrated Household Survey, 2011-2012. The survey represents rural areas only.

175
Table 5.2—Distribution of per capita income: Rural Bangladesh
Per capita expenditure group Average per capita
expenditure Share of total expenditure in
each group
(taka/month) (percent) 1 (poorest) 1,015 1.85 2 1,275 2.32 3 1,440 2.62 4 1,566 2.85 5 1,671 3.04 6 1,781 3.24 7 1,893 3.45 8 2,016 3.67 9 2,140 3.89 10 2,268 4.12 11 2,412 4.39 12 2,566 4.66 13 2,734 4.97 14 2,916 5.32 15 3,137 5.70 16 3,386 6.16 17 3,749 6.82 18 4,263 7.75 19 5,062 9.20 20 (richest) 7,675 13.96 All households 2,692 100.00
Source: IFPRI Bangladesh Integrated Household Survey, 2011-2012. The survey represents rural areas only.

176
Table 5.3—Budget share of consumption items by income groups: Feed the Future zone Per capita expenditure quintile Item 1 (lowest) 2 3 4 5 (highest) All Monthly per capita total expenditure (taka)
1,313 1,809 2,285 2,956 4,964 2,660
Monthly per capita food expenditure (taka)
827 1,127 1,384 1,780 2,694 1,559
Monthly per capita nonfood expenditure (taka)
486 682 902 1,177 2,270 1,100
Budget share of expenditures (percent) Food 63.0 62.3 60.5 60.2 55.5 60.3 Fuel and lighting 9.7 8.4 7.8 6.9 5.6 7.7 Personal care 1.5 1.5 1.4 1.2 1.0 1.3 Cleaning materials 1.4 1.4 1.4 1.3 1.2 1.3 Transport and communication 3.5 4.0 4.6 5.3 6.1 4.7 Adult clothing 3.5 3.7 3.9 3.6 3.5 3.6 Children clothing 1.2 0.9 0.9 0.7 0.5 0.8 Other clothing 0.5 0.5 0.6 0.6 0.5 0.5 Footwear 0.6 0.6 0.7 0.7 0.7 0.6 Beddings 0.2 0.3 0.4 0.4 0.4 0.4 Other household expenses 0.1 0.1 0.1 0.3 0.3 0.2 Medical treatment for male 1.7 1.8 2.3 2.0 3.3 2.2 Medical treatment for female 1.8 2.2 2.6 2.5 3.3 2.5 Education for male 0.9 1.1 1.2 1.4 1.3 1.2 Education for female 1.0 0.9 0.9 1.0 0.9 1.0 Remittances sent 0.0 0.0 0.1 0.2 0.9 0.3 Gifts given 0.1 0.2 0.2 0.2 0.4 0.2 Kurbani/milad 0.2 0.6 0.7 1.0 1.9 0.9 Entertainment 0.1 0.1 0.3 0.2 0.3 0.2 Legal fees 0.1 0.3 0.5 0.4 0.8 0.4 Utensils 0.1 0.1 0.2 0.2 0.2 0.2 Furniture repair 0.0 0.0 0.0 0.0 0.0 0.0 Personal items (bag, watch etc.) 0.4 0.4 0.5 0.5 0.5 0.5 Lighting (bulb etc.) 0.0 0.0 0.0 0.0 0.0 0.0 House rent 5.8 5.6 5.4 5.7 6.6 5.8 Use value of household durables 1.9 2.3 2.4 3.0 3.6 2.7 Narcotics and tobacco 0.5 0.3 0.3 0.4 0.4 0.4 Miscellaneous 0.0 0.0 0.1 0.1 0.2 0.1 Total 100.0 100.0 100.0 100.0 100.0 100.0
Source: IFPRI Bangladesh Integrated Household Survey, 2011-2012. The survey represents rural areas only.
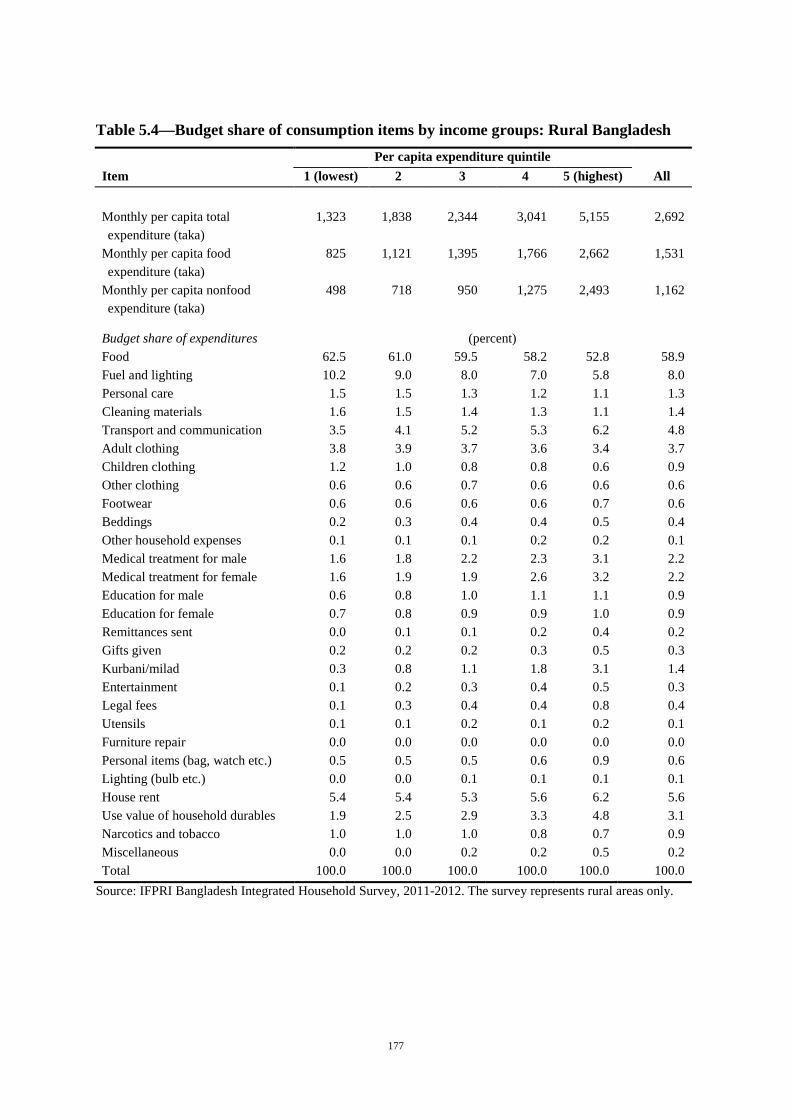
177
Table 5.4—Budget share of consumption items by income groups: Rural Bangladesh Per capita expenditure quintile Item 1 (lowest) 2 3 4 5 (highest) All Monthly per capita total expenditure (taka)
1,323 1,838 2,344 3,041 5,155 2,692
Monthly per capita food expenditure (taka)
825 1,121 1,395 1,766 2,662 1,531
Monthly per capita nonfood expenditure (taka)
498 718 950 1,275 2,493 1,162
Budget share of expenditures (percent) Food 62.5 61.0 59.5 58.2 52.8 58.9 Fuel and lighting 10.2 9.0 8.0 7.0 5.8 8.0 Personal care 1.5 1.5 1.3 1.2 1.1 1.3 Cleaning materials 1.6 1.5 1.4 1.3 1.1 1.4 Transport and communication 3.5 4.1 5.2 5.3 6.2 4.8 Adult clothing 3.8 3.9 3.7 3.6 3.4 3.7 Children clothing 1.2 1.0 0.8 0.8 0.6 0.9 Other clothing 0.6 0.6 0.7 0.6 0.6 0.6 Footwear 0.6 0.6 0.6 0.6 0.7 0.6 Beddings 0.2 0.3 0.4 0.4 0.5 0.4 Other household expenses 0.1 0.1 0.1 0.2 0.2 0.1 Medical treatment for male 1.6 1.8 2.2 2.3 3.1 2.2 Medical treatment for female 1.6 1.9 1.9 2.6 3.2 2.2 Education for male 0.6 0.8 1.0 1.1 1.1 0.9 Education for female 0.7 0.8 0.9 0.9 1.0 0.9 Remittances sent 0.0 0.1 0.1 0.2 0.4 0.2 Gifts given 0.2 0.2 0.2 0.3 0.5 0.3 Kurbani/milad 0.3 0.8 1.1 1.8 3.1 1.4 Entertainment 0.1 0.2 0.3 0.4 0.5 0.3 Legal fees 0.1 0.3 0.4 0.4 0.8 0.4 Utensils 0.1 0.1 0.2 0.1 0.2 0.1 Furniture repair 0.0 0.0 0.0 0.0 0.0 0.0 Personal items (bag, watch etc.) 0.5 0.5 0.5 0.6 0.9 0.6 Lighting (bulb etc.) 0.0 0.0 0.1 0.1 0.1 0.1 House rent 5.4 5.4 5.3 5.6 6.2 5.6 Use value of household durables 1.9 2.5 2.9 3.3 4.8 3.1 Narcotics and tobacco 1.0 1.0 1.0 0.8 0.7 0.9 Miscellaneous 0.0 0.0 0.2 0.2 0.5 0.2 Total 100.0 100.0 100.0 100.0 100.0 100.0
Source: IFPRI Bangladesh Integrated Household Survey, 2011-2012. The survey represents rural areas only.

178
Table 5.5—Budget share of consumption items by division: Rural Bangladesh
Division
Item Barisal Chittagong Dhaka Khulna Rajshahi Rangpur Sylhet Bangladesh
Monthly per capita total expenditure (taka)
2,606 3,090 2,842 2,691 2,515 1,989 2,952 2,692
Monthly per capita food expenditure (taka)
1,541 1,660 1,667 1,486 1,380 1,146 1,817 1,531
Monthly per capita nonfood expenditure (taka)
1,064 1,431 1,176 1,205 1,135 843 1,135 1,162
Budget share of expenditures (percent) Food 60.8 56.3 60.4 57.6 57.1 59.1 63.6 58.9
Fuel and lighting 7.4 7.5 8.2 8.2 8.0 9.3 6.9 8.0
Personal care 1.3 1.3 1.2 1.5 1.3 1.6 1.3 1.3
Cleaning materials 1.2 1.3 1.3 1.5 1.4 1.7 1.3 1.4
Transport and communication 3.2 5.3 4.2 5.8 5.5 4.7 4.4 4.8
Adult clothing 3.2 3.3 3.5 4.3 3.8 4.2 3.5 3.7
Children clothing 1.0 1.0 0.9 0.9 0.6 1.0 0.9 0.9
Other clothing 0.6 0.8 0.7 0.7 0.6 0.6 0.2 0.6
Footwear 0.5 0.6 0.6 0.8 0.5 0.6 0.5 0.6
Beddings 0.2 0.5 0.3 0.4 0.4 0.4 0.3 0.4
Other household expenses 0.2 0.1 0.1 0.1 0.2 0.1 0.1 0.1
Medical treatment for male 2.5 2.5 2.1 2.1 2.2 1.8 2.0 2.2
Medical treatment for female 2.6 2.7 2.2 2.4 2.2 1.5 2.2 2.2
Education for male 1.3 1.0 0.9 1.2 0.9 0.7 0.6 0.9
Education for female 1.1 1.1 0.8 0.9 1.0 0.5 0.7 0.9
Remittances sent 0.2 0.0 0.2 0.3 0.1 0.1 0.1 0.2
Gifts given 0.3 0.4 0.2 0.3 0.3 0.2 0.2 0.3
Kurbani/milad 1.0 2.2 1.3 0.9 1.6 1.1 0.8 1.4
Entertainment 0.1 0.3 0.2 0.4 0.5 0.1 0.2 0.3
Legal fees 0.5 0.4 0.4 0.3 0.4 0.3 0.4 0.4
Utensils 0.1 0.1 0.1 0.1 0.2 0.1 0.1 0.1
Furniture repair 0.0 0.0 0.0 0.0 0.0 0.0 0.0 0.0 Personal items (bag, watch
etc.) 0.4 0.5 0.5 0.5 0.7 0.9 0.4 0.6
Lighting (bulb etc.) 0.0 0.1 0.0 0.0 0.1 0.0 0.0 0.1
House rent 7.8 6.2 5.3 5.3 5.5 5.3 4.8 5.6 Use value of household
durables 2.2 3.5 2.8 3.2 3.3 3.0 2.9 3.1
Narcotics and tobacco 0.2 0.7 1.0 0.4 1.1 1.2 1.4 0.9
Miscellaneous 0.1 0.1 0.3 0.1 0.2 0.2 0.3 0.2
Total 100.0 100.0 100.0 100.0 100.0 100.0 100.0 100.0
Source: IFPRI Bangladesh Integrated Household Survey, 2011-2012. The survey represents rural areas only.

179
Table 5.6—Food budget share of selected food items by income groups: Feed the Future zone Per capita expenditure quintile
Item 1 (lowest) 2 3 4 5 (highest) All (taka/person/day) Monthly per capita food expenditure (Tk)
827 1,127 1,384 1,780 2,694 1,559
Food budget share (percent) Rice 46.64 39.22 35.13 29.32 22.54 34.60 Atta 1.48 1.39 1.35 1.44 1.30 1.39 Other cereal 0.22 0.30 0.22 0.25 0.53 0.30 Pulses 1.80 1.87 1.72 2.00 2.00 1.88 Oils 6.57 6.63 6.16 6.00 5.60 6.20 Oil seed 0.08 0.09 0.10 0.08 0.08 0.09 Vegetables 9.26 10.09 9.27 9.26 8.55 9.29 Potatoes 3.23 2.96 2.71 2.34 1.92 2.63 Leafy vegetables 1.79 1.55 1.64 1.58 1.39 1.59 Meats 1.86 4.20 7.35 9.11 12.94 7.08 Eggs 1.16 1.65 1.73 1.90 2.13 1.71 Milk and milk products 0.69 1.09 1.51 2.19 2.87 1.67 Fruits 1.71 2.50 3.06 4.53 6.01 3.56 Big fish 6.09 8.27 9.45 10.72 12.34 9.37 Small fish 3.20 3.74 3.39 3.56 3.82 3.54 Spices 4.66 4.39 4.08 4.03 4.00 4.23 Salt 0.62 0.54 0.48 0.44 0.36 0.49 Sugar and gur 1.35 1.57 1.78 1.95 1.94 1.72 Beverages 1.29 1.28 1.67 1.67 2.00 1.58 Betel leaf/nut 1.83 1.70 1.76 1.71 1.76 1.75 Other prepared foods 4.47 4.98 5.44 5.93 5.91 5.34 Total 100.00 100.00 100.00 100.00 100.00 100.00
Source: IFPRI Bangladesh Integrated Household Survey, 2011-2012. The survey represents rural areas only.
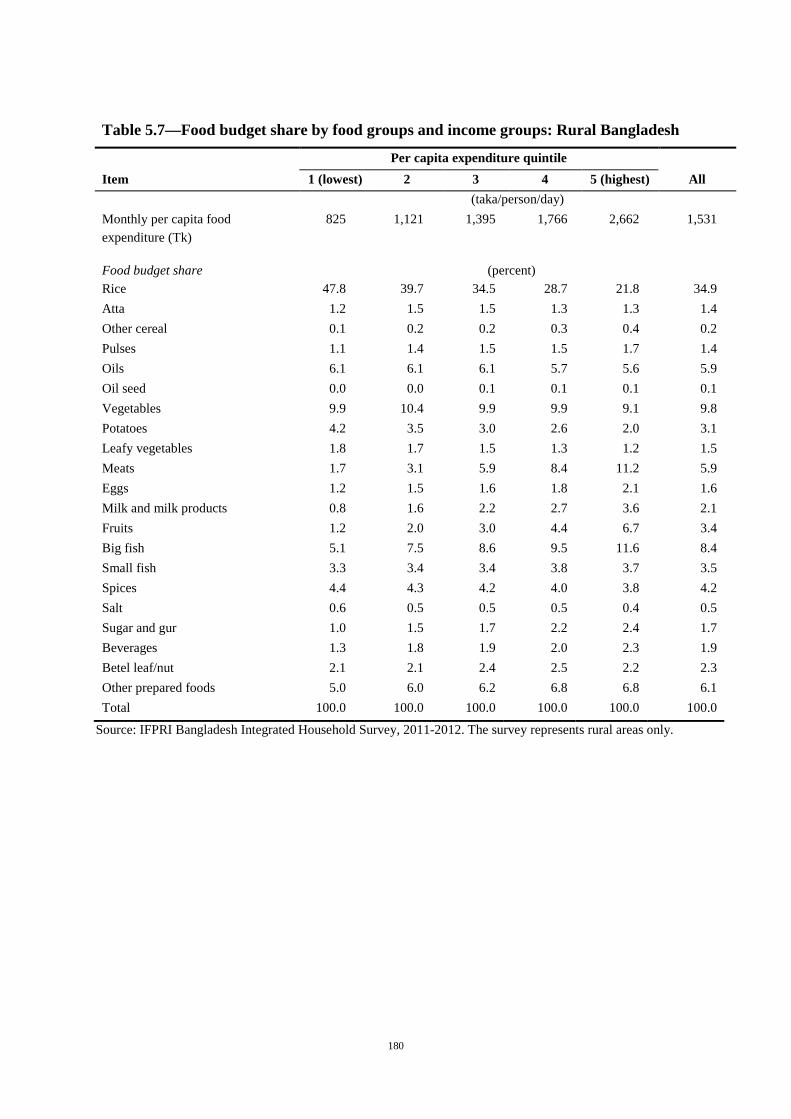
180
Table 5.7—Food budget share by food groups and income groups: Rural Bangladesh
Per capita expenditure quintile Item 1 (lowest) 2 3 4 5 (highest) All (taka/person/day) Monthly per capita food expenditure (Tk)
825 1,121 1,395 1,766 2,662 1,531
Food budget share (percent) Rice 47.8 39.7 34.5 28.7 21.8 34.9 Atta 1.2 1.5 1.5 1.3 1.3 1.4 Other cereal 0.1 0.2 0.2 0.3 0.4 0.2 Pulses 1.1 1.4 1.5 1.5 1.7 1.4 Oils 6.1 6.1 6.1 5.7 5.6 5.9 Oil seed 0.0 0.0 0.1 0.1 0.1 0.1 Vegetables 9.9 10.4 9.9 9.9 9.1 9.8 Potatoes 4.2 3.5 3.0 2.6 2.0 3.1 Leafy vegetables 1.8 1.7 1.5 1.3 1.2 1.5 Meats 1.7 3.1 5.9 8.4 11.2 5.9 Eggs 1.2 1.5 1.6 1.8 2.1 1.6 Milk and milk products 0.8 1.6 2.2 2.7 3.6 2.1 Fruits 1.2 2.0 3.0 4.4 6.7 3.4 Big fish 5.1 7.5 8.6 9.5 11.6 8.4 Small fish 3.3 3.4 3.4 3.8 3.7 3.5 Spices 4.4 4.3 4.2 4.0 3.8 4.2 Salt 0.6 0.5 0.5 0.5 0.4 0.5 Sugar and gur 1.0 1.5 1.7 2.2 2.4 1.7 Beverages 1.3 1.8 1.9 2.0 2.3 1.9 Betel leaf/nut 2.1 2.1 2.4 2.5 2.2 2.3 Other prepared foods 5.0 6.0 6.2 6.8 6.8 6.1 Total 100.0 100.0 100.0 100.0 100.0 100.0
Source: IFPRI Bangladesh Integrated Household Survey, 2011-2012. The survey represents rural areas only.

181
Table 5.8—Food budget share by division: Rural Bangladesh
Division
Item Barisal Chittagong Dhaka Khulna Rajshahi Rangpur Sylhet Bangladesh (taka/person/day) Monthly per capita food expenditure
1,541 1,660 1,667 1,486 1,380 1,146 1,817 1,531
Food budget share (percent) Rice 33.8 29.3 34.2 35.2 37.5 42.3 30.8 34.9 Atta 1.6 2.0 1.2 1.2 1.8 0.4 1.6 1.4 Other cereal 0.2 0.2 0.3 0.3 0.2 0.1 0.3 0.2 Pulses 2.6 1.5 1.7 1.5 0.9 0.8 1.5 1.4 Oils 5.1 6.1 6.0 7.2 6.0 5.4 4.5 5.9 Oil seed 0.0 0.0 0.0 0.1 0.1 0.1 0.0 0.1 Vegetables 8.7 11.1 10.2 10.1 8.6 8.8 10.5 9.8 Potatoes 2.8 2.9 2.8 3.0 3.0 4.3 2.6 3.1 Leafy vegetables 2.2 1.8 1.4 1.2 1.1 2.0 1.4 1.5 Meats 4.2 7.5 5.6 6.6 5.7 5.6 4.6 5.9 Eggs 1.6 1.4 1.7 2.1 1.7 1.6 1.1 1.6 Milk 1.1 2.3 2.6 1.4 2.3 1.8 2.6 2.1 Fruits 3.3 5.1 3.4 3.5 2.7 2.0 3.7 3.4 Big fish 7.5 9.3 9.2 10.1 7.7 5.0 8.9 8.4 Small fish 4.5 3.5 3.7 3.1 2.3 3.4 5.8 3.5 Spices 4.6 3.8 4.4 3.7 3.8 4.5 4.4 4.2 Salt 0.5 0.5 0.5 0.5 0.5 0.5 0.4 0.5 Sugar/gur 1.9 1.5 1.8 1.7 2.0 1.3 2.0 1.7 Beverages 2.2 2.2 1.5 1.4 2.4 1.7 2.4 1.9 Betel leaf/nut 4.7 2.4 2.6 0.9 1.4 1.9 4.1 2.3 Other prepared
foods 7.1 5.6 5.2 5.1 8.3 6.6 6.8 6.1
Total 100.0 100.0 100.0 100.0 100.0 100.0 100.0 100.0
Source: IFPRI Bangladesh Integrated Household Survey, 2011-2012. The survey represents rural areas only.

182
Table 5.9—Labor force participation of household members aged 15 years and over by income groups: Feed the Future zone Per capita expenditure quintile Indicator 1 (lowest) 2 3 4 5 (highest) All (percent) In the labor force
Male 88.1 87.0 86.4 85.4 80.4 85.7 Female 64.3 61.8 60.6 61.2 57.5 61.3 All 75.3 73.9 73.3 72.7 68.6 73.0
Type of employment (percentage of the labor force) Agricultural wage labor 12.0 8.1 6.3 3.1 1.5 6.5 Nonagricultural wage labor 6.1 3.7 3.3 2.0 1.4 3.4 Salaried 1.5 2.3 3.1 4.0 6.5 3.3 Rickshaw/van pulling 3.5 2.4 2.2 1.6 0.3 2.1 Business/trade 4.1 5.5 8.4 7.8 12.0 7.3 Nonagricultural production 1.6 1.0 0.6 0.4 0.2 0.8 Livestock related work - 0.1 0.2 0.4 0.3 0.2 Farming 64.4 71.8 71.0 74.9 73.2 70.9 Self-employed in other activities 6.1 4.8 4.7 5.2 4.2 5.0 Unemployed (looked for work) 0.9 0.3 0.4 0.5 0.4 0.5 Total 100.0 100.0 100.0 100.0 100.0 100.0
Source: IFPRI Bangladesh Integrated Household Survey, 2011-2012. The survey represents rural areas only.

183
Table 5.10—Labor force participation of household members aged 15 years and over by income groups: Rural Bangladesh Per capita expenditure quintile Indicator 1 (lowest) 2 3 4 5 (highest) All (percent) In the labor force
Male 92.3 89.4 88.5 84.5 80.4 87.2 Female 64.9 62.0 61.3 58.1 53.6 60.2 All 77.6 74.8 74.2 70.6 66.2 72.9
Type of employment (percentage of the labor force) Agricultural wage labor 12.0 9.4 7.1 3.4 1.0 7.7 Nonagricultural wage labor 6.1 5.8 4.3 3.1 1.8 4.6 Salaried 1.5 2.9 3.0 4.4 5.8 3.7 Rickshaw/van pulling 3.5 2.5 2.3 0.8 0.6 2.2 Business/trade 4.1 6.8 7.1 10.8 11.6 7.9 Nonagricultural production 1.6 1.2 1.2 1.0 0.5 1.1 Livestock related work - 0.1 0.1 0.2 0.3 0.2 Farming 64.4 64.3 67.6 69.4 71.7 65.9 Self-employed in other activities 6.1 6.9 6.9 6.1 6.3 6.3 Unemployed (looked for work) 0.9 0.3 0.5 0.8 0.5 0.6 Total 100.0 100.0 100.0 100.0 100.0 100.0
Source: IFPRI Bangladesh Integrated Household Survey, 2011-2012. The survey represents rural areas only.

184
Table 5.11—Labor force participation of household members aged 15 years and over by division: Rural Bangladesh
Division
Indicator Barisal Chittagong Dhaka Khulna Rajshahi Rangpur Sylhet Bangladesh (percent) In the labor force
Male 82.2 80.8 87.8 87.4 91.2 91.3 87.4 87.2
Female 55.4 44.3 61.6 69.3 67.1 73.0 54.8 60.2
All 68.0 59.7 74.1 78.0 79.2 81.8 70.2 72.9
Type of employment (percentage of the labor force) Agricultural wage
labor 12.0 5.2 6.8 6.6 8.6 13.2 7.1 7.7
Nonagricultural wage labor
6.1 5.7 4.4 4.1 3.3 3.7 7.1 4.6
Salaried 1.5 4.7 3.4 4.1 3.2 2.6 5.7 3.7 Rickshaw/van
pulling 3.5 2.0 2.2 2.5 2.5 2.1 1.5 2.2
Business/trade 4.1 10.4 7.8 6.3 7.3 5.9 7.8 7.9 Nonagricultural
production 1.6 1.3 0.5 1.5 2.1 0.3 1.1 1.1
Livestock related work
- 0.1 0.1 0.5 0.3 - - 0.2
Farming 64.4 59.1 68.3 70.3 66.9 67.3 60.7 65.9 Self-employed in
other activities 6.1 10.6 5.6 4.0 5.8 4.4 8.8 6.3
Unemployed (looked for work)
0.9 1.0 0.8 0.2 0.1 0.5 0.3 0.6
Total 100.0 100.0 100.0 100.0 100.0 100.0 100.0 100.0
Source: IFPRI Bangladesh Integrated Household Survey, 2011-2012. The survey represents rural areas only.

185
Table 5.12— Private transfer and remittance received by income groups: Feed the Future zone Per capita expenditure quintile 1 (lowest) 2 3 4 5 (highest) All
(Tk per household) For all households Average annual domestic remittance
2,320 3,197 4,098 8,231 9,756 5,510
Average annual international remittance
764 3,131 5,887 7,533 16,757 6,796
Average annual total remittance
3,083 6,328 9,985 15,764 26,513 12,306
(percentage of annual household expenditure) Domestic remittance 3.2 3.4 3.6 5.9 4.9 4.5 International remittance 1.1 3.3 5.1 5.4 8.4 5.5 Total remittance 4.3 6.7 8.7 11.3 13.3 10.0 For remittance receiving households Average annual domestic remittance
16,336 23,328 31,081 37,197 39,730 31,422
Average annual international remittance
49,348 106,583 183,187 124,120 148,371 135,908
Average annual total remittance
19,908 39,030 60,892 59,727 75,419 56,192
(percentage of households) Transfers from inside Bangladesh and abroad
0.3 0.4 0.0 1.8 0.7 0.6
Transfers from inside Bangladesh
13.9 13.3 13.2 20.3 23.9 16.9
Transfers from abroad 1.3 2.5 3.2 4.3 10.6 4.4
Source: IFPRI Bangladesh Integrated Household Survey, 2011-2012. The survey represents rural areas only.

186
Table 5.13—Private transfer and remittance received by income groups: Rural Bangladesh Per capita expenditure quintile 1 (lowest) 2 3 4 5 (highest) All
(Tk per household) For all households Average annual domestic remittance
2,072 2,793 3,419 6,102 9,683 4,715
Average annual international remittance
842 3,705 7,553 12,823 42,559 12,994
Average annual total remittance
2,914 6,498 10,972 18,925 52,242 17,708
(percentage of annual household expenditure) Domestic remittance 2.9 3.0 3.0 4.2 4.4 3.7 International remittance 1.2 4.0 6.5 8.7 19.2 10.2 Total remittance 4.1 6.9 9.5 12.9 23.6 13.8 For remittance receiving households Average annual domestic remittance
16,378 23,424 26,956 36,070 51,353 32,479
Average annual international remittance
63,145 82,329 106,981 105,891 170,580 134,034
Average annual total remittance
20,963 40,357 55,824 67,391 122,637 74,728
(percentage of households) Transfers from inside Bangladesh and abroad
0.1 0.3 0.1 0.9 1.2 0.5
Transfers from inside Bangladesh
12.6 11.6 12.6 16.0 17.7 14.0
Transfers from abroad 1.3 4.2 7.0 11.2 23.7 9.2
Source: IFPRI Bangladesh Integrated Household Survey, 2011-2012. The survey represents rural areas only.

187
Table 5.14—Private transfer and remittance received by division: Rural Bangladesh
Division
Barisal Chittagong Dhaka Khulna Rajshahi Rangpur Sylhet Bangladesh (Tk per household) For all households Average annual
domestic remittance 9,477 7,008 5,386 3,414 1,473 3,992 2,389 4,715
Average annual international remittance
5,274 38,535 10,349 5,481 4,943 3,260 19,150 12,994
Total annual remittance
14,751 45,543 15,736 8,896 6,416 7,252 21,539 17,708
(percentage of annual household expenditure)
Domestic remittance 7.6 4.6 4.2 2.8 1.2 4.4 1.4 3.7
International remittance
4.3 25.1 8.0 4.5 4.1 3.6 11.5 10.2
Total remittance 11.9 29.7 12.1 7.4 5.3 8.0 12.9 13.8
For remittance receiving households Average annual
domestic remittance 29,929 36,563 32,886 32,925 20,338 35,536 28,198 32,479
Average annual international remittance
116,579 138,037 135,399 148,000 130,318 221,250 100,640 134,034
Average annual total remittance
41,861 100,049 66,297 65,805 58,144 57,907 78,720 74,728
(percentage of households)
Transfers from inside Bangladesh and abroad
1.0 1.6 0.3 0.6 0.0 0.2 0.1 0.5
Transfers from inside Bangladesh
30.7 17.6 16.1 9.8 7.2 11.1 8.3 14.0
Transfers from abroad 3.6 26.4 7.4 3.2 3.8 1.3 18.9 9.2
Source: IFPRI Bangladesh Integrated Household Survey, 2011-2012. The survey represents rural areas only.

188
Table 5.15—Nonagricultural enterprise by division and Feed the Future zone
Division
FTF zone Barisal Chittagong Dhaka Khulna Rajshahi Rangpur Sylhet Bangladesh
(percent) Participation in nonagricultural Enterprises Share of HHs
having a nonagricultural enterprise
15 24 27 31 34 44 30 35 33
Having a manufacturing enterprise
2 4 3 4 4 7 5 5 5
Having a services enterprise
4 6 8 7 12 14 7 9 9
Having a trade enterprise
10 16 17 21 22 30 19 23 21
Distribution of nonagricultural Enterprises Share of enterprises
in Manufacturing 13 15 10 13 11 13 16 13 13
Services 27 24 29 20 30 26 23 25 25 Trade 61 61 61 66 59 61 61 62 62 Characteristics of Manufacture Businesses Profit in the last 12
months (Tk) 57,895 81,541 41,687 58,945 42,624 28,439 38,664 35,536 44,499
(percent) Location of
operation is at home
22 35 57 38 32 54 25 36 41
Fixed location outside from home
51 47 30 33 48 26 50 31 36
No fixed location 27 18 13 29 20 20 25 33 23 Months of operation
per year 10.6 10.5 10.1 9.9 10.0 8.3 10.3 9.8 9.6
Share of profits kept by HH
98 96 96 98 96 100 100 96 98
Sale location is at home
22 35 50 28 32 46 43 36 38
Village market (within own village)
28 35 27 19 24 13 21 18 20
Village market (outside own village)
32 12 20 33 32 35 21 33 29
Town market 11 18 3 18 8 2 14 3 10 Other place 7 0 0 3 4 4 0 10 3 Share of businesses
registered 14 12 7 9 16 7 4 8 8
Employees hired over the past year
0.6 0.3 0.2 0.8 0.8 0.3 0.6 0.4 0.5
Characteristics of Services Businesses Profit in the last 12
months (Tk) 44,530 44,030 48,302 51,585 45,514 43,832 35,951 54,015 46,302
(percent) Location of
operation is at home
7 11 4 5 6 10 7 8 7
Fixed location outside from home
21 25 21 35 20 32 34 35 29
(continued)

189
Division
FTF zone
Barisal Chittagong Dhaka Khulna Rajshahi Rangpur Sylhet Bangladesh
(percent) No fixed location 72 64 75 60 74 58 59 57 64
Months of operation per year
10.8 11.1 10.7 9.4 10.6 9.3 9.6 10.5 10.0
Share of profits kept by HH
98 100 95 96 95 97 100 100 97
Sale location is at home
9 11 4 11 10 13 10 7 10
Village market (within own village)
18 18 21 19 23 28 17 22 22
Village market (outside own village)
44 39 52 45 44 26 46 36 41
Town market 24 21 21 23 20 27 17 9 22 Other place 5 11 1 3 3 6 10 26 6 Share of businesses
registered 15 14 45 9 16 17 7 26 19
Employees hired over the past year
0.2 0.2 0.1 0.3 0.1 0.7 0.1 0.3 0.3
Characteristics of Trade Businesses Profit in the last 12
months (Tk) 50,563 52,649 60,712 57,260 51,600 46,998 39,672 53,141 52,142
(percent)
Location of operation is at home
15 17 19 13 16 23 13 16 17
Fixed location outside from home
60 66 57 63 58 52 56 51 58
No fixed location 25 17 24 25 26 25 31 33 26
Months of operation per year
10.3 10.6 10.2 9.8 10.6 9.5 10.7 10.1 10.1
Share of profits kept by HH
98 99 95 97 95 99 100 97 97
Sale location is at home
16 17 19 12 18 18 13 17 16
Village market (within own village)
34 52 37 36 29 34 38 24 35
Village market (outside own village)
34 23 30 34 39 35 31 36 34
Town market 13 8 13 17 11 13 15 12 14 Other place 3 0 1 1 3 0 4 11 2 Share of businesses
registered 10 8 11 9 10 12 5 11 10
Employees hired over the past year
0.1 0.0 0.4 0.2 0.1 0.2 0.1 0.2 0.2
Source: IFPRI Bangladesh Integrated Household Survey, 2011-2012. The survey represents rural areas only.

190
Table 5.16—Nonagricultural enterprises by income groups: Feed the Future zone
Per capita expenditure quintile 1 (lowest) 2 3 4 5 (highest) Total
(percent)
Participation in Nonagricultural Enterprises Share of HHs having a nonagricultural enterprise
11 14 18 17 15 15
Having a manufacturing enterprise 2 3 2 3 2 2 Having a services enterprise 5 5 6 4 2 4 Having a trade enterprise 4 8 14 12 11 10
Distribution of Nonagricultural Enterprises Share of enterprises in Manufacturing 15 15 7 13 15 13
Services 47 33 28 21 11 27 Trade 38 52 65 65 74 61
Characteristics of Manufacture Businesses Profit in the last 12 months (Tk) 48,397 61,307 33,142 56,139 79,473 57,895 (percent) Location of operation is at home 14 30 42 28 0 22
Fixed location outside from home 43 59 58 35 61 51 No fixed location 43 10 0 38 39 27
Months of operation per year 11.7 10.3 10.7 11.9 8.5 10.6 Share of profits kept by HH 100 92 100 100 100 98 Sale location is at home 14 30 42 28 0 22
Village market (within own village) 14 9 42 26 50 28 Village market (outside own village) 43 51 16 38 10 32 Town market 14 10 0 8 19 11 Other place 14 0 0 0 21 7
Share of businesses registered 0 30 0 0 29 14 Number of employees over the past 12 months 0.3 0.2 0.5 0.4 1.3 0.6
Characteristics of Services Businesses Profit in the last 12 months (Tk) 34,498 40,223 41,719 47,758 87,860 44,530 (percent) Location of operation is at home 9 12 0 5 13 7
Fixed location outside from home 13 34 23 0 40 21 No fixed location 78 53 77 95 47 72
Months of operation per year 11.3 10.5 10.5 10.8 10.7 10.8 Share of profits kept by HH 98 99 96 100 100 98 Sale location is at home 5 13 8 10 13 9
Village market (within own village) 14 30 20 0 24 18 Village market (outside own village) 40 45 47 53 24 44 Town market 36 12 18 37 13 24 Other place 5 0 7 0 24 5
Share of businesses registered 9 5 19 18 36 15 Number of employees over the past 12 months 0.1 0.0 0.3 0.0 0.5 0.2
Characteristics of Trade Businesses Profit in the last 12 months (Tk) 38,356 29,361 41,348 56,836 74,498 50,563 (percent) Location of operation is at home 16 23 15 15 6 15
Fixed location outside from home 50 63 55 55 73 60 No fixed location 34 13 30 29 22 25
Months of operation per year 10.4 10.4 9.9 10.6 10.5 10.3 Share of profits kept by HH 100 99 96 100 99 98 Sale location is at home 21 29 14 17 6 16
Village market (within own village) 33 26 32 35 41 34 Village market (outside own village) 23 25 43 30 39 34 Town market 23 14 8 13 14 13 Other place 0 6 3 4 0 3
Share of businesses registered 6 3 5 12 22 10 Number of employees over the past 12 months 0.1 0.0 0.0 0.1 0.3 0.1
Source: IFPRI Bangladesh Integrated Household Survey, 2011-2012. The survey represents rural areas only.

191
Table 5.17—Nonagricultural enterprises by income groups: Rural Bangladesh
Per capita expenditure quintile 1 (lowest) 2 3 4 5 (highest) Total
(percent)
Participation in Nonagricultural Enterprises Share of HHs having a nonagricultural enterprise
26 31 34 36 36 33
Having a manufacturing enterprise 3 5 4 5 6 5 Having a services enterprise 10 8 11 8 7 9 Having a trade enterprise 14 21 22 25 25 21
Distribution of Nonagricultural Enterprises Share of enterprises in Manufacturing 11 14 11 14 15 13
Services 36 23 29 20 19 25 Trade 52 63 60 67 67 62
Characteristics of Manufacture Businesses Profit in the last 12 months (Tk) 30,966 41,366 38,262 38,527 69,739 45,969 (percent) Location of operation is at home 31 40 51 45 34 41
Fixed location outside from home 34 36 38 29 39 35 No fixed location 34 25 11 26 27 24
Months of operation per year 10.1 9.3 9.5 10.2 9.7 9.7 Share of profits kept by HH 96 94 100 100 97 98 Sale location is at home 31 30 40 44 37 37
Village market (within own village) 23 23 17 16 24 20 Village market (outside own village) 23 34 36 34 19 29 Town market 14 11 6 5 13 10 Other place 9 2 0 2 6 3
Share of businesses registered 3 13 4 2 16 8 Number of employees over the past 12 months 0.2 0.2 0.4 0.3 1.2 0.5
Characteristics of Services Businesses Profit in the last 12 months (Tk) 34,546 36,773 41,434 51,802 79,971 47,506 (percent) Location of operation is at home 4 8 6 8 9 7
Fixed location outside from home 21 28 27 40 36 30 No fixed location 75 64 67 52 55 64
Months of operation per year 10.6 9.9 9.9 9.8 9.9 10.0 Share of profits kept by HH 97 98 97 98 96 97 Sale location is at home 5 10 13 8 9 9
Village market (within own village) 18 22 26 18 24 22 Village market (outside own village) 46 34 36 53 37 41 Town market 21 29 17 18 18 20 Other place 10 4 8 2 11 7
Share of businesses registered 14 16 18 20 36 20 Number of employees over the past 12 months 0.0 0.1 0.2 0.2 1.0 0.3
Characteristics of Trade Businesses Profit in the last 12 months (Tk) 31,394 35,433 44,700 54,217 85,080 53,128 (percent) Location of operation is at home 21 18 17 15 11 16
Fixed location outside from home 43 52 54 60 71 58 No fixed location 36 29 29 24 17 26
Months of operation per year 9.7 10.0 10.0 10.2 10.2 10.1 Share of profits kept by HH 98 98 97 98 96 97 Sale location is at home 21 18 17 14 11 16
Village market (within own village) 32 32 37 35 34 34 Village market (outside own village) 30 33 31 35 36 33 Town market 13 15 10 14 17 14 Other place 4 2 4 2 2 3
Share of businesses registered 4 3 4 10 22 10 Number of employees over the past 12 months 0.2 0.1 0.1 0.1 0.4 0.2
Source: IFPRI Bangladesh Integrated Household Survey, 2011-2012. The survey represents rural areas only.

192
Table 5.18—Loan size and source of loans by income groups: Feed the Future zone
Per capita expenditure quintile Loan size and source of loans 1 (lowest) 2 3 4 5 (highest) Total Average loan size (taka per household) 22,716 31,671 39,775 42,048 72,190 41,232
Source of loan (percentage of total number of loans)
Relative/friend 25.21 21.96 19.04 18.03 23.88 21.53 Bangladesh Krishi Bank 4.29 6.07 7.40 10.99 11.26 7.94 Other banks 11.02 11.73 9.85 15.60 16.69 12.86 Other financial institutions 0.51 0.33 1.19 1.30 0.79 0.83 NGO 38.26 36.59 43.41 31.76 28.15 35.90 Employer - - 0.17 - 0.20 0.08 Trader 5.63 7.35 6.11 7.52 5.25 6.39 Money lender 3.69 4.24 3.98 4.06 3.57 3.92 Shamity (savings society) 6.42 8.92 5.09 3.68 3.07 5.49 Other 4.97 2.81 3.76 7.06 7.15 5.07 Total 100.00 100.00 100.00 100.00 100.00 100.00 Source: IFPRI Bangladesh Integrated Household Survey, 2011-2012. The survey represents rural areas only.
Table 5.19—Loan size and source of loans by income groups: Rural Bangladesh
Per capita expenditure quintile
Loan size and source of loans 1 (lowest) 2 3 4 5 (highest) All Average loan size (taka per household) 22,010 32,364 39,566 63,045 113,826 52,216
Source of loan (percentage of total number of loans)
Relative/friend 25.4 24.2 26.8 24.8 30.1 26.1 Bangladesh Krishi Bank 2.7 4.1 4.7 6.1 10.3 5.4 Rajshashi Krishi bank 0.2 0.5 0.6 0.4 1.1 0.5 Other banks 11.8 10.7 14.6 13.4 14.4 12.9 Other financial institutions 0.3 0.2 0.4 0.3 0.5 0.4 NGO 36.9 39.4 35.9 32.8 22.9 33.9 Employer 0.0 0.0 0.1 0.1 0.3 0.1 Trader 4.3 3.9 4.1 4.6 4.4 4.3 Money lender 9.1 6.9 5.4 4.8 3.9 6.1 Shamity (savings society) 4.2 5.2 2.8 4.8 2.2 3.9 Other 5.0 4.7 4.6 8.0 9.9 6.3 Total 100.00 100.00 100.00 100.00 100.00 100.00 Source: IFPRI Bangladesh Integrated Household Survey, 2011-2012. The survey represents rural areas only.

193
Table 5.20—Use of loans by income groups: Feed the Future zone Per capita expenditure quintile Use of loans 1 (lowest) 2 3 4 5 (highest) All (percentage of total number of loans) Productive use Agricultural enterprise 14.89 12.90 17.94 20.27 14.36 15.99 Business enterprise 8.10 12.95 15.79 14.60 21.99 14.63 Purchase of productive assets for purposes other than agriculture
3.31 3.98 4.01 2.46 2.32 3.25
Purchase of cow/goat 6.53 5.03 5.09 4.46 4.00 5.03 Purchase of land 3.02 1.94 4.32 3.98 5.72 3.77 For lease of land used for purposes other than agriculture
0.40 0.70 0.64 0.44 0.14 0.47
Lending at higher interest 0.00 0.37 0.00 0.00 0.34 0.14 Consumption use Meet household consumption needs 27.15 27.77 16.16 16.75 16.19 20.82 Medical treatment 9.29 8.41 7.77 6.75 8.47 8.12 Improvement of housing 6.18 5.86 7.09 10.53 8.12 7.52 Marriage expenses 3.23 2.98 2.56 3.14 1.31 2.66 Dowry 1.31 0.79 0.35 0.51 0.00 0.59 Educational expenses 1.06 1.31 2.13 2.90 4.33 2.31 Funeral 0.00 0.10 0.35 0.08 0.00 0.11 To go abroad 0.79 1.70 2.82 3.24 4.41 2.57 Other use Repayment of another loan 9.36 7.50 7.62 4.95 2.62 6.48 Other 5.39 5.71 5.37 4.94 6.27 5.53 Total 100.00 100.00 100.00 100.00 100.60 100.00
Source: IFPRI Bangladesh Integrated Household Survey, 2011-2012. The survey represents rural areas only.

194
Table 5.21—Use of loans by income groups: Rural Bangladesh
Per capita expenditure quintile
Use of loans 1 (lowest) 2 3 4 5 (highest) All
(percentage of total number of loans) Productive use Agricultural enterprise 10.90 16.99 16.06 17.92 15.79 15.52 Business enterprise 8.01 13.38 16.49 19.25 21.98 15.62 Purchase of productive assets for purposes other than agriculture
1.79 2.17 2.69 1.29 0.83 1.79
Purchase of cow/goat 5.96 3.92 4.64 4.31 2.69 4.35 Purchase of land 1.99 2.00 3.52 2.86 4.83 2.99 For lease of land used for purposes other than agriculture
0.31 0.36 0.74 0.11 0.07 0.33
Lending at higher interest 0.19 0.16 0.28 0.00 0.00 0.13
Consumption use Meet household consumption needs 34.39 23.51 19.88 16.59 13.27 21.79 Medical treatment 8.62 7.66 6.31 7.01 7.51 7.41 Improvement of housing 6.68 7.73 6.46 7.80 9.68 7.60 Marriage expenses 2.24 2.09 3.19 3.35 3.72 2.89 Dowry 1.67 1.75 1.33 0.59 0.27 1.15 Educational expenses 0.71 0.58 1.18 2.05 3.03 1.46 Funeral 0.32 0.26 0.12 0.03 0.00 0.15 To go abroad 1.33 2.61 4.05 5.82 6.01 3.89
Other use Repayment of another loan 9.67 9.45 7.67 5.25 3.54 7.24 Other 5.15 5.39 5.38 5.75 6.77 5.66 Total 100.00 100.00 100.00 100.00 100.00 100.00 Source: IFPRI Bangladesh Integrated Household Survey, 2011-2012. The survey represents rural areas only.
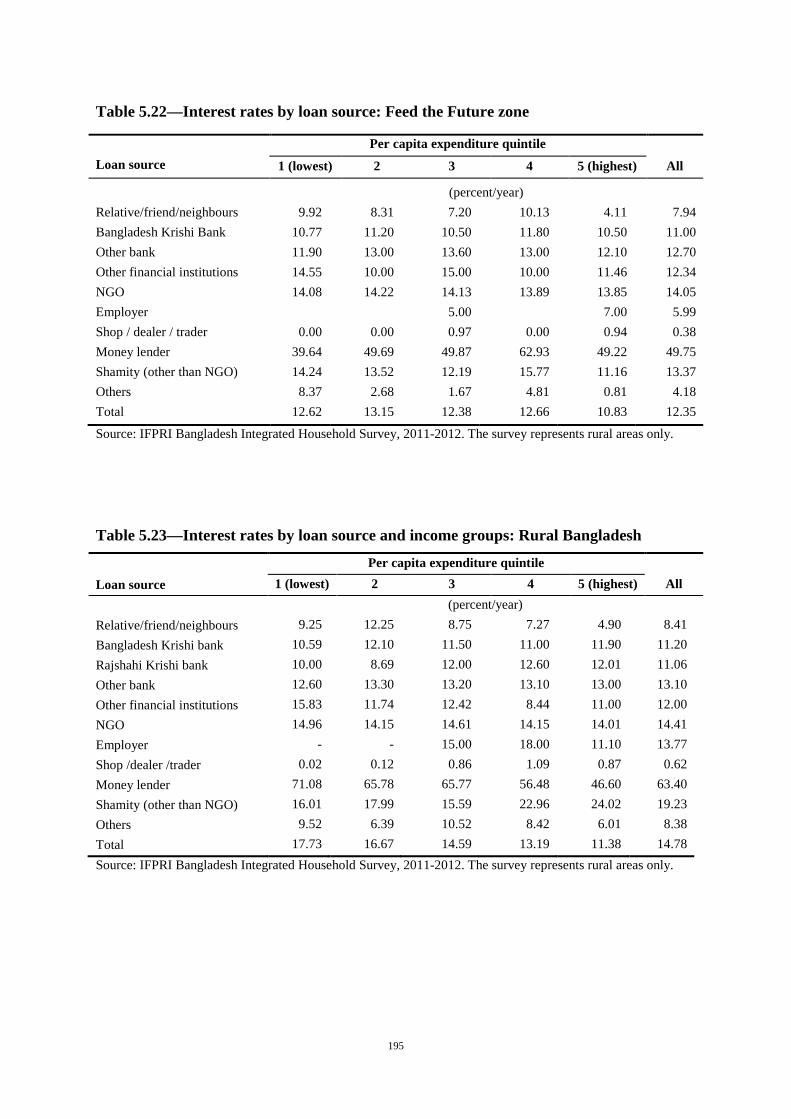
195
Table 5.22—Interest rates by loan source: Feed the Future zone
Per capita expenditure quintile Loan source 1 (lowest) 2 3 4 5 (highest) All (percent/year) Relative/friend/neighbours 9.92 8.31 7.20 10.13 4.11 7.94 Bangladesh Krishi Bank 10.77 11.20 10.50 11.80 10.50 11.00 Other bank 11.90 13.00 13.60 13.00 12.10 12.70 Other financial institutions 14.55 10.00 15.00 10.00 11.46 12.34 NGO 14.08 14.22 14.13 13.89 13.85 14.05 Employer 5.00 7.00 5.99 Shop / dealer / trader 0.00 0.00 0.97 0.00 0.94 0.38 Money lender 39.64 49.69 49.87 62.93 49.22 49.75 Shamity (other than NGO) 14.24 13.52 12.19 15.77 11.16 13.37 Others 8.37 2.68 1.67 4.81 0.81 4.18 Total 12.62 13.15 12.38 12.66 10.83 12.35
Source: IFPRI Bangladesh Integrated Household Survey, 2011-2012. The survey represents rural areas only.
Table 5.23—Interest rates by loan source and income groups: Rural Bangladesh
Per capita expenditure quintile
Loan source 1 (lowest) 2 3 4 5 (highest) All (percent/year) Relative/friend/neighbours 9.25 12.25 8.75 7.27 4.90 8.41 Bangladesh Krishi bank 10.59 12.10 11.50 11.00 11.90 11.20 Rajshahi Krishi bank 10.00 8.69 12.00 12.60 12.01 11.06 Other bank 12.60 13.30 13.20 13.10 13.00 13.10 Other financial institutions 15.83 11.74 12.42 8.44 11.00 12.00 NGO 14.96 14.15 14.61 14.15 14.01 14.41 Employer - - 15.00 18.00 11.10 13.77 Shop /dealer /trader 0.02 0.12 0.86 1.09 0.87 0.62 Money lender 71.08 65.78 65.77 56.48 46.60 63.40 Shamity (other than NGO) 16.01 17.99 15.59 22.96 24.02 19.23 Others 9.52 6.39 10.52 8.42 6.01 8.38 Total 17.73 16.67 14.59 13.19 11.38 14.78 Source: IFPRI Bangladesh Integrated Household Survey, 2011-2012. The survey represents rural areas only.

196
Table 5.24—Savings by income groups: Feed the Future zone
Per capita expenditure quintile 1 (lowest) 2 3 4 5 (highest) All Savings indicator Total savings (Tk/year) 2,914 9,319 9,820 15,891 32,763 14,109 Percentage of households with any savings
50 61 66 65 65 61
Place of savings by income (percentage of total savings amount) At home 2.7 3.0 3.0 6.7 5.8 4.3 NGO 53.1 44.1 45.8 35.2 24.0 39.8 Shamity (other than NGO) 9.2 11.6 8.0 4.4 5.6 7.7 Bank 13.7 14.5 14.7 23.8 32.8 20.2 Shop 0.0 0.0 0.0 0.0 0.4 0.1 Post office / government institution 0.0 0.2 0.5 0.7 2.0 0.7 Employer’s provident fund 0.5 0.1 0.7 1.7 1.2 0.9 Insurance company 10.6 15.3 12.3 15.2 17.0 14.2 Relative / friend / neighbor 3.2 2.8 4.4 2.9 2.6 3.2 Savings collector 0.4 0.4 0.0 0.0 0.0 0.2 Other 6.4 8.1 10.6 9.4 8.6 8.7 Total 100.0 100.0 100.0 100.0 100.0 100.0
Source: IFPRI Bangladesh Integrated Household Survey, 2011-2012. The survey represents rural areas only.
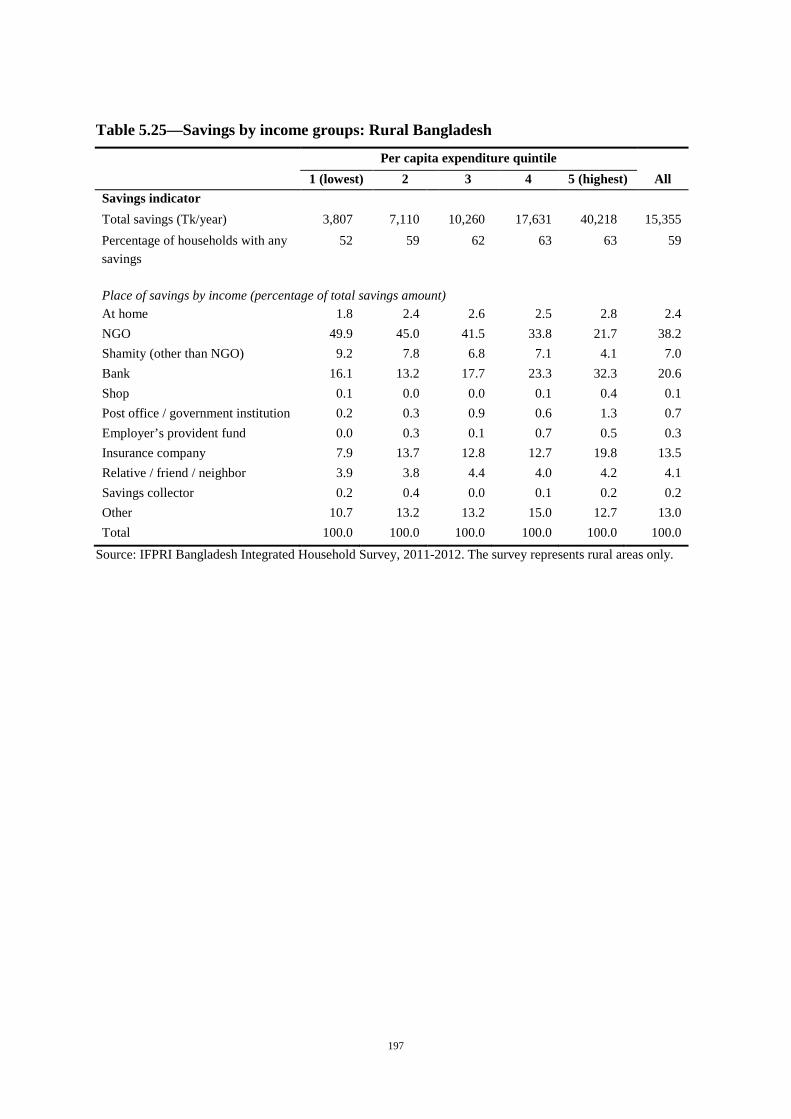
197
Table 5.25—Savings by income groups: Rural Bangladesh
Per capita expenditure quintile 1 (lowest) 2 3 4 5 (highest) All Savings indicator Total savings (Tk/year) 3,807 7,110 10,260 17,631 40,218 15,355 Percentage of households with any savings
52 59 62 63 63 59
Place of savings by income (percentage of total savings amount) At home 1.8 2.4 2.6 2.5 2.8 2.4 NGO 49.9 45.0 41.5 33.8 21.7 38.2 Shamity (other than NGO) 9.2 7.8 6.8 7.1 4.1 7.0 Bank 16.1 13.2 17.7 23.3 32.3 20.6 Shop 0.1 0.0 0.0 0.1 0.4 0.1 Post office / government institution 0.2 0.3 0.9 0.6 1.3 0.7 Employer’s provident fund 0.0 0.3 0.1 0.7 0.5 0.3 Insurance company 7.9 13.7 12.8 12.7 19.8 13.5 Relative / friend / neighbor 3.9 3.8 4.4 4.0 4.2 4.1 Savings collector 0.2 0.4 0.0 0.1 0.2 0.2 Other 10.7 13.2 13.2 15.0 12.7 13.0 Total 100.0 100.0 100.0 100.0 100.0 100.0
Source: IFPRI Bangladesh Integrated Household Survey, 2011-2012. The survey represents rural areas only.

198
Table 5.26—Planned use of savings by income groups: Feed the Future zone Per capita expenditure quintile Use of savings 1 (lowest) 2 3 4 5 (highest) All (percent) To buy household goods 4.8 5.7 4.5 5.2 2.4 4.5 To buy agricultural implements 2.8 3.1 2.2 2.3 2.8 2.7 To buy productive assets (other than agriculture)
3.7 4.0 1.1 1.8 1.3 2.4
To start / help business 4.1 7.3 4.2 2.0 8.6 5.2 To buy land / house 4.4 3.3 2.6 7.7 2.4 4.1 For education / training 0.8 2.1 1.6 1.5 2.8 1.8 For marriage / dowry 4.4 3.9 3.6 4.0 3.9 4.0 To build / repair house 2.5 3.6 4.4 4.4 2.1 3.4 To get loan 14.2 16.2 13.7 11.7 5.1 12.2 To lend to others 0.8 1.3 0.6 0.8 0.0 0.7 To prepare for difficult times/danger
28.8 19.1 29.6 25.4 28.5 26.3
To send someone abroad for a job 0.6 0.0 0.0 1.0 0.6 0.4 For the future of children 13.7 16.1 14.7 21.1 23.2 17.7 Medical or other emergency 0.4 0.4 0.5 0.4 1.2 0.6 Don’t know/no special reason 9.9 8.9 11.5 8.7 12.2 10.2 Others 4.1 5.0 4.8 1.8 2.9 3.7 Total 100.0 100.0 100.0 100.0 100.0 100.0
Source: IFPRI Bangladesh Integrated Household Survey, 2011-2012. The survey represents rural areas only.
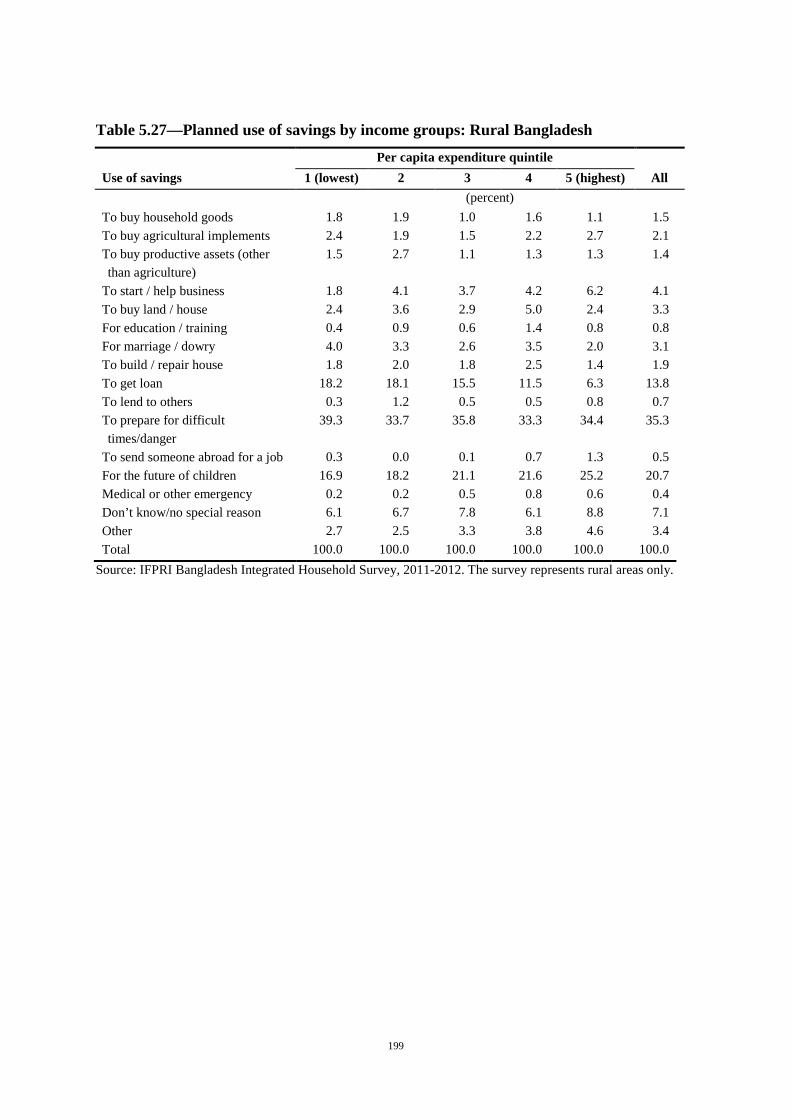
199
Table 5.27—Planned use of savings by income groups: Rural Bangladesh
Per capita expenditure quintile Use of savings 1 (lowest) 2 3 4 5 (highest) All (percent) To buy household goods 1.8 1.9 1.0 1.6 1.1 1.5 To buy agricultural implements 2.4 1.9 1.5 2.2 2.7 2.1 To buy productive assets (other than agriculture)
1.5 2.7 1.1 1.3 1.3 1.4
To start / help business 1.8 4.1 3.7 4.2 6.2 4.1 To buy land / house 2.4 3.6 2.9 5.0 2.4 3.3 For education / training 0.4 0.9 0.6 1.4 0.8 0.8 For marriage / dowry 4.0 3.3 2.6 3.5 2.0 3.1 To build / repair house 1.8 2.0 1.8 2.5 1.4 1.9 To get loan 18.2 18.1 15.5 11.5 6.3 13.8 To lend to others 0.3 1.2 0.5 0.5 0.8 0.7 To prepare for difficult times/danger
39.3 33.7 35.8 33.3 34.4 35.3
To send someone abroad for a job 0.3 0.0 0.1 0.7 1.3 0.5 For the future of children 16.9 18.2 21.1 21.6 25.2 20.7 Medical or other emergency 0.2 0.2 0.5 0.8 0.6 0.4 Don’t know/no special reason 6.1 6.7 7.8 6.1 8.8 7.1 Other 2.7 2.5 3.3 3.8 4.6 3.4 Total 100.0 100.0 100.0 100.0 100.0 100.0
Source: IFPRI Bangladesh Integrated Household Survey, 2011-2012. The survey represents rural areas only.

200
Table 5.28—Participation in selected safety net programs by income groups: Feed the Future zone Per capita expenditure quintile Form of assistance 1 (lowest) 2 3 4 5 (highest) All (percent) Primary education stipend program 35.1 29.7 29.9 18.2 9.8 24.6 School feeding program 6.5 5.7 5.0 2.9 1.4 4.3 Stipend for secondary education female students
6.0 5.5 8.6 6.1 5.0 6.3
Stipend for poor boys in secondary school 0.4 0.9 0.7 0.5 0.7 0.7 Old age allowance 8.1 6.3 5.5 3.9 4.8 5.7 Allowances for widowed, deserted and destitute women
3.4 2.2 0.9 1.3 2.2 2.0
Gratuitous Relief (GR) 8.7 5.7 5.6 3.7 1.7 5.1 General relief activities 5.3 3.6 3.3 2.6 2.1 3.4 Open Market Sales (OMS) 8.7 5.5 3.6 3.4 1.4 4.5 Vulnerable Group Development (VGD) 5.8 2.7 1.2 2.5 0.9 2.6 Vulnerable Group Feeding (VGF) 6.8 4.4 3.6 2.6 1.2 3.7 Test Relief (TR) 2.9 2.0 1.8 0.7 0.5 1.6 Employment Generation Program for the Poorest (EGPP)
1.7 1.0 1.0 0.3 0.0 0.8
Source: IFPRI Bangladesh Integrated Household Survey, 2011-2012. The survey represents rural areas only.

201
Table 5.29—Participation in selected safety net programs by income groups: Rural Bangladesh
Per capita expenditure quintile
Form of assistance 1 (lowest) 2 3 4 5 (highest) All
(percent)
Primary education stipend program 32.9 27.2 24.5 18.0 9.3 22.7 School feeding program 4.0 2.5 1.7 0.8 0.6 2.0 Stipend for secondary education female students
4.2 4.8 6.7 5.8 4.1 5.1
Stipend for poor boys in secondary school 0.5 0.3 0.4 0.2 0.5 0.4 Old age allowance 5.8 5.5 5.1 4.4 2.0 4.6 Allowances for widowed, deserted and destitute women
2.0 1.7 1.5 1.3 0.6 1.5
Gratuitous Relief (GR) 6.4 5.7 5.6 3.2 0.9 4.4 General relief activities 3.9 2.6 2.6 2.7 0.8 2.6 Open Market Sales (OMS) 3.9 2.6 2.9 1.6 0.4 2.3 Vulnerable Group Development (VGD) 4.0 2.6 1.9 2.3 0.7 2.3 Vulnerable Group Feeding (VGF) 11.1 7.4 5.9 4.8 2.3 6.4 Test Relief (TR) 1.6 1.3 0.8 0.3 0.0 0.8 Employment Generation Program for the Poorest (EGPP)
2.2 1.1 1.0 0.3 0.1 1.0
Source: IFPRI Bangladesh Integrated Household Survey, 2011-2012. The survey represents rural areas only.

202
Table 5.30—Distribution of total safety net participants by income groups: Rural Bangladesh
Per capita expenditure quintile
Form of assistance 1 (lowest) 2 3 4 5 (highest) All
(percent)
Primary education stipend program 30.7 24.4 21.6 15.6 7.7 100.0 School feeding program 43.2 25.7 17.5 8.0 5.6 100.0 Stipend for secondary education female students
17.5 19.0 26.2 22.0 15.3 100.0
Stipend for poor boys in secondary school 26.1 17.5 21.2 11.1 24.1 100.0 Old age allowance 26.7 24.4 22.3 18.5 8.0 100.0 Allowances for widowed, deserted and destitute women
29.6 24.4 20.1 17.7 8.2 100.0
Gratuitous Relief (GR) 30.5 26.3 25.0 14.3 3.9 100.0 General relief activities 32.6 20.7 20.0 20.8 5.8 100.0 Open Market Sales (OMS) 35.4 23.1 24.9 13.4 3.2 100.0 Vulnerable Group Development (VGD) 36.5 22.7 15.9 19.5 5.4 100.0 Vulnerable Group Feeding (VGF) 36.7 23.6 18.3 14.5 6.9 100.0 Test Relief (TR) 42.1 32.1 19.5 6.3 0.0 100.0 Employment Generation Program for the Poorest (EGPP)
48.5 22.5 21.2 6.1 1.7 100.0
Source: IFPRI Bangladesh Integrated Household Survey, 2011-2012. The survey represents rural areas only.

203
Table 5.31—Incidence of shocks in the last 5 years by income groups: Feed the Future zone
Per capita expenditure quintile 1 (lowest) 2 3 4 5 (highest) All
(percent of households)
Death of main earner 1.0 1.5 1.0 1.3 2.2 1.4
Death of other than main earner in the family 1.4 1.0 0.7 2.2 0.5 1.2
Loss of income due to illness or injury of household member
5.8 5.3 6.3 4.5 6.5 5.7
Medical expenses due to illness or injury 26.1 21.2 27.6 19.9 25.3 24.0
Loss of a regular job of a household member 0.5 0.3 0.5 0.0 1.2 0.5
Lost home due to river erosion 1.2 1.4 0.7 1.4 0.7 1.1
Eviction from previous residence 0.2 0.2 0.2 0.7 0.0 0.3
Divorce or abandonment 1.0 0.5 0.3 0.3 0.3 0.5
Major loss of crops due to floods 3.8 3.0 3.1 6.0 3.4 3.8
Major loss of crops due to other reasons (drought, storms, pests, disease, etc.)
1.8 2.0 4.1 4.5 1.8 2.8
Loss of livestock due to floods 0.5 0.5 0.7 0.5 0.3 0.5
Loss of livestock due to death 3.5 4.7 4.8 4.7 3.9 4.3
Loss of livestock due to theft 0.5 0.2 0.5 0.3 0.8 0.4
Loss of productive assets due to floods 1.6 2.4 2.2 1.6 2.1 2.0
Loss of productive assets due to other reasons (storm/cyclone, river erosion, theft, fire, etc.)
11.3 10.4 11.9 10.1 11.8 11.1
Loss or destruction of other consumption assets due to floods
3.1 3.3 1.8 3.6 2.2 2.8
Loss of consumption assets due to factors other than floods
1.0 0.9 0.8 0.3 0.2 0.6
Dowry payment 1.8 2.0 1.7 0.8 0.5 1.4
Other costs of wedding 2.3 2.3 3.9 2.5 2.3 2.7
Division of father’s property 0.7 0.0 0.5 0.0 0.2 0.3
Failure or bankruptcy of business 0.8 1.5 1.2 1.5 1.7 1.3
Extortion by mastans (thugs) 1.0 0.5 0.4 0.0 0.5 0.5
Household member arrested by police 0.0 0.0 0.3 0.5 0.3 0.2
Paid a big bribe 0.3 0.7 0.4 0.5 1.0 0.6
Cost of court case 1.0 1.2 3.6 2.7 3.1 2.3
Losses due to court case 0.5 1.8 2.8 3.4 3.6 2.4
Reparations for victim of crime committed by household member
0.3 0.0 0.0 0.5 1.5 0.4
Long duration hartals/strikes/political unrest 0.0 0.3 0.0 0.0 0.0 0.1
Cut-off or decrease of regular remittance to household 0.0 0.0 0.3 0.0 0.7 0.2
Increase in food prices 3.6 4.3 5.6 4.2 4.7 4.5
Increase in prices of inputs 0.4 0.0 0.0 0.3 0.0 0.1
Others 4.4 2.4 2.4 5.4 3.9 3.7
Source: IFPRI Bangladesh Integrated Household Survey, 2011-2012. The survey represents rural areas only.

204
Table 5.32—Incidence of shocks in the last 5 years by income groups: Rural Bangladesh Per capita expenditure quintile 1 (lowest) 2 3 4 5 (highest) All (percent of households)
Death of main earner 1.9 2.1 1.2 1.4 1.4 1.6
Death of other than main earner in the family 0.9 1.5 0.8 1.0 1.1 1.1
Loss of income due to illness or injury of household member
4.2 3.9 4.4 3.4 3.4 3.8
Medical expenses due to illness or injury 21.9 21.4 21.5 21.7 22.7 21.8
Loss of a regular job of a household member 0.4 0.4 0.6 0.2 0.9 0.5
Lost home due to river erosion 2.0 0.6 0.6 0.0 0.4 0.7
Eviction from previous residence 0.4 0.0 0.0 0.3 0.2 0.2
Divorce or abandonment 0.4 0.3 0.3 0.3 0.6 0.4
Major loss of crops due to floods 2.2 2.0 2.6 2.9 2.8 2.5
Major loss of crops due to other reasons (drought, storms, pests, disease, etc.)
2.5 2.1 4.0 4.1 2.6 3.0
Loss of livestock due to floods 0.5 0.0 0.3 0.3 0.2 0.3
Loss of livestock due to death 5.5 4.7 5.0 4.7 3.7 4.7
Loss of livestock due to theft 0.5 0.9 0.3 0.7 0.4 0.6
Loss of productive assets due to floods 0.4 0.3 0.3 0.4 0.5 0.4
Loss of productive assets due to other reasons (storm/cyclone, river erosion, theft, fire, etc.)
4.7 4.7 5.8 4.4 4.9 4.9
Loss or destruction of other consumption assets due to floods
1.0 1.0 0.8 0.9 0.8 0.9
Loss of consumption assets due to factors other than floods
0.5 0.7 0.4 0.6 0.4 0.5
Dowry payment 3.1 2.3 2.5 1.3 1.8 2.2
Other costs of wedding 2.3 1.8 2.6 2.6 3.0 2.5
Division of father’s property 0.1 0.1 0.3 0.1 0.0 0.1
Failure or bankruptcy of business 1.2 1.5 2.2 1.8 2.9 1.9
Extortion by mastans (thugs) 0.0 0.3 0.0 0.2 0.7 0.2
Family member put in prison 0.1 0.0 0.0 0.0 0.1 0.1
Household member arrested by police 0.2 0.1 0.1 0.3 0.1 0.2
Paid a big bribe 0.1 0.2 0.1 0.5 0.6 0.3
Cost of court case 0.6 1.2 2.0 2.4 1.8 1.6
Losses due to court case 1.3 1.6 1.9 2.4 2.4 1.9
Reparations for victim of crime committed by household member
0.0 0.0 0.1 0.1 0.3 0.1
Long duration hartals/strikes/political unrest 0.2 0.0 0.1 0.1 0.0 0.1
Cut-off or decrease of regular remittances to household 0.0 0.0 0.2 0.1 0.2 0.1
Withdrawal of NGO assistance 0.1 0.1 0.0 0.0 0.1 0.1
Increase in food prices 9.4 7.2 9.0 6.1 6.2 7.6
Increase in prices of inputs 0.1 0.1 0.1 0.3 0.0 0.1
Others 2.2 3.4 2.7 4.2 5.1 3.5
Source: IFPRI Bangladesh Integrated Household Survey, 2011-2012. The survey represents rural areas only.

205
Table 5.33—Coping Mechanism (multiple response): Feed the Future zone Per capita expenditure quintile
1 (lowest) 2 3 4 5 (highest) All
(percent of households experiencing negative shocks) None 31.7 41.1 42.0 48.2 49.5 42.5 Sold land 3.4 5.5 3.3 4.0 5.7 4.4 Mortgaged/leased out land 2.5 2.9 4.5 6.0 8.7 4.9 Sold productive asset 5.8 7.7 7.6 5.4 4.6 6.2 Mortgaged productive asset 1.3 0.8 0.4 0.8 1.6 1.0 Sold consumption asset 1.7 3.0 0.8 2.1 3.4 2.2 Mortgaged consumption asset 0.4 0.4 1.5 1.1 0.9 0.9 Took loan from NGO/formal institution 18.6 17.5 19.7 20.1 14.5 18.1 Took loan from non-formal source 18.6 18.8 21.5 16.4 19.3 18.9 Took help from others 28.2 24.3 16.6 18.3 19.1 21.3 Ate less food to reduce expenses 7.1 8.1 6.8 2.5 5.3 6.0 Ate lower quality food to reduce expenses 5.4 8.4 7.4 4.3 2.6 5.6 Took children out of school 0.4 0.8 1.2 0.4 1.2 0.8 Took children from expensive school to low cost school
0.0 0.4 0.0 0.0 0.4 0.2
Sent household member away permanently 0.4 0.0 0.4 0.4 0.0 0.3 Sent children to be fostered other places 0.4 0.0 0.0 0.0 0.8 0.3 Sent children to be fostered in relatives house 0.4 1.2 0.0 0.0 0.0 0.3 Sent children into domestic service 0.0 0.4 0.4 0.4 0.0 0.3 Sent children to be fostered in work 0.9 0.4 0.0 0.9 0.0 0.4 Sent children to her parental home 0.0 0.4 0.4 0.0 0.0 0.2 Emergency receipt of remittance from migrant family member
0.8 0.0 0.4 1.5 3.5 1.2
Forced to change occupation 1.5 1.2 0.0 0.4 1.5 0.9 Moved to less expensive housing 1.6 0.4 0.4 0.0 0.0 0.5 Sent non-working household member to work 0.8 0.9 0.4 0.9 0.8 0.7 Others 4.5 4.9 5.0 7.1 5.7 5.4 Total 136.6 149.6 140.7 141.0 149.2 143.4
Source: IFPRI Bangladesh Integrated Household Survey, 2011-2012. The survey represents rural areas only.
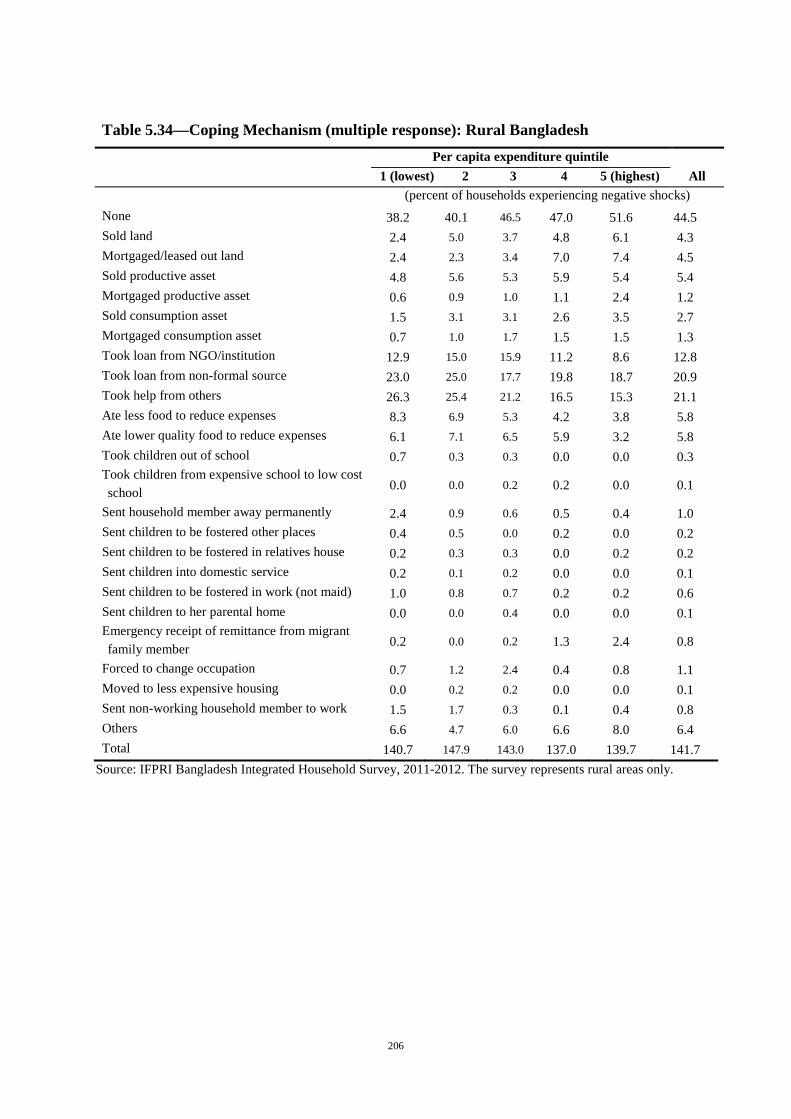
206
Table 5.34—Coping Mechanism (multiple response): Rural Bangladesh Per capita expenditure quintile
1 (lowest) 2 3 4 5 (highest) All
(percent of households experiencing negative shocks) None 38.2 40.1 46.5 47.0 51.6 44.5 Sold land 2.4 5.0 3.7 4.8 6.1 4.3 Mortgaged/leased out land 2.4 2.3 3.4 7.0 7.4 4.5 Sold productive asset 4.8 5.6 5.3 5.9 5.4 5.4 Mortgaged productive asset 0.6 0.9 1.0 1.1 2.4 1.2 Sold consumption asset 1.5 3.1 3.1 2.6 3.5 2.7 Mortgaged consumption asset 0.7 1.0 1.7 1.5 1.5 1.3 Took loan from NGO/institution 12.9 15.0 15.9 11.2 8.6 12.8 Took loan from non-formal source 23.0 25.0 17.7 19.8 18.7 20.9 Took help from others 26.3 25.4 21.2 16.5 15.3 21.1 Ate less food to reduce expenses 8.3 6.9 5.3 4.2 3.8 5.8 Ate lower quality food to reduce expenses 6.1 7.1 6.5 5.9 3.2 5.8 Took children out of school 0.7 0.3 0.3 0.0 0.0 0.3 Took children from expensive school to low cost school 0.0 0.0 0.2 0.2 0.0 0.1
Sent household member away permanently 2.4 0.9 0.6 0.5 0.4 1.0 Sent children to be fostered other places 0.4 0.5 0.0 0.2 0.0 0.2 Sent children to be fostered in relatives house 0.2 0.3 0.3 0.0 0.2 0.2 Sent children into domestic service 0.2 0.1 0.2 0.0 0.0 0.1 Sent children to be fostered in work (not maid) 1.0 0.8 0.7 0.2 0.2 0.6 Sent children to her parental home 0.0 0.0 0.4 0.0 0.0 0.1 Emergency receipt of remittance from migrant family member 0.2 0.0 0.2 1.3 2.4 0.8
Forced to change occupation 0.7 1.2 2.4 0.4 0.8 1.1 Moved to less expensive housing 0.0 0.2 0.2 0.0 0.0 0.1 Sent non-working household member to work 1.5 1.7 0.3 0.1 0.4 0.8 Others 6.6 4.7 6.0 6.6 8.0 6.4 Total 140.7 147.9 143.0 137.0 139.7 141.7
Source: IFPRI Bangladesh Integrated Household Survey, 2011-2012. The survey represents rural areas only.

207
TABLES FOR SECTION 6: FOOD UTILIZATION
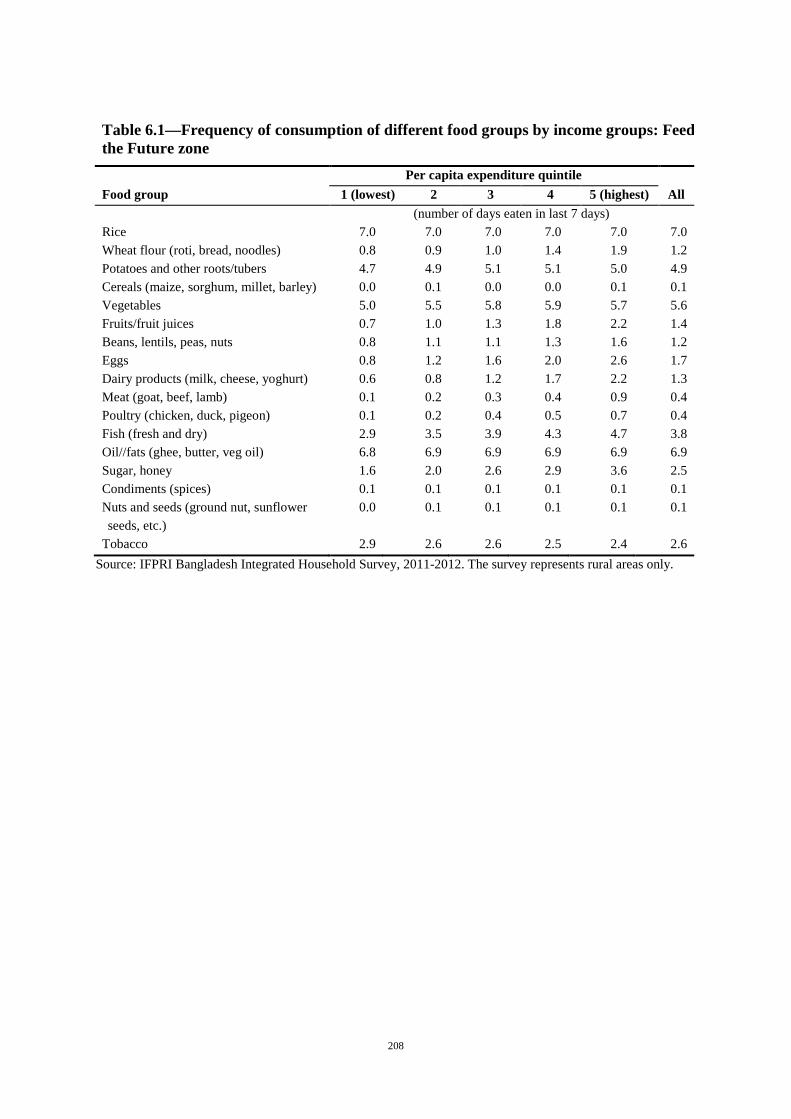
208
Table 6.1—Frequency of consumption of different food groups by income groups: Feed the Future zone Per capita expenditure quintile Food group 1 (lowest) 2 3 4 5 (highest) All (number of days eaten in last 7 days) Rice 7.0 7.0 7.0 7.0 7.0 7.0 Wheat flour (roti, bread, noodles) 0.8 0.9 1.0 1.4 1.9 1.2 Potatoes and other roots/tubers 4.7 4.9 5.1 5.1 5.0 4.9 Cereals (maize, sorghum, millet, barley) 0.0 0.1 0.0 0.0 0.1 0.1 Vegetables 5.0 5.5 5.8 5.9 5.7 5.6 Fruits/fruit juices 0.7 1.0 1.3 1.8 2.2 1.4 Beans, lentils, peas, nuts 0.8 1.1 1.1 1.3 1.6 1.2 Eggs 0.8 1.2 1.6 2.0 2.6 1.7 Dairy products (milk, cheese, yoghurt) 0.6 0.8 1.2 1.7 2.2 1.3 Meat (goat, beef, lamb) 0.1 0.2 0.3 0.4 0.9 0.4 Poultry (chicken, duck, pigeon) 0.1 0.2 0.4 0.5 0.7 0.4 Fish (fresh and dry) 2.9 3.5 3.9 4.3 4.7 3.8 Oil//fats (ghee, butter, veg oil) 6.8 6.9 6.9 6.9 6.9 6.9 Sugar, honey 1.6 2.0 2.6 2.9 3.6 2.5 Condiments (spices) 0.1 0.1 0.1 0.1 0.1 0.1 Nuts and seeds (ground nut, sunflower seeds, etc.)
0.0 0.1 0.1 0.1 0.1 0.1
Tobacco 2.9 2.6 2.6 2.5 2.4 2.6 Source: IFPRI Bangladesh Integrated Household Survey, 2011-2012. The survey represents rural areas only.

209
Table 6.2—Frequency of consumption of different food groups by income groups: Rural Bangladesh Per capita expenditure quintile Food group 1 (lowest) 2 3 4 5 (highest) All (number of days eaten in last 7 days) Rice 7.0 7.0 7.0 7.0 7.0 7.0 Wheat flour (roti, bread, noodles) 0.7 1.0 1.2 1.5 2.0 1.2 Potatoes and other roots/tubers 5.3 5.5 5.6 5.6 5.6 5.5 Cereals (maize, sorghum, millet, barley) 0.0 0.1 0.0 0.0 0.1 0.0 Vegetables 5.8 6.0 6.2 6.3 6.4 6.1 Fruits/fruit juices 1.0 1.3 1.6 2.2 2.8 1.7 Beans, lentils, peas, nuts 0.7 1.0 1.1 1.4 1.8 1.2 Eggs 0.7 1.2 1.4 2.0 2.8 1.5 Dairy products (milk, cheese, yoghurt) 0.6 1.2 1.7 2.2 3.2 1.7 Meat (goat, beef, lamb) 0.1 0.1 0.2 0.4 0.7 0.3 Poultry (chicken, duck, pigeon) 0.1 0.3 0.4 0.6 0.9 0.4 Fish (fresh and dry) 2.4 3.3 3.8 4.2 4.7 3.6 Oil//fats (ghee, butter, veg oil) 6.8 6.9 7.0 6.9 7.0 6.9 Sugar, honey 1.6 2.5 2.8 3.5 4.1 2.8 Condiments (spices) 0.1 0.1 0.2 0.2 0.2 0.1 Nuts and seeds (ground nut, sunflower seeds, etc.)
0.0 0.1 0.0 0.1 0.1 0.1
Tobacco 3.4 3.4 3.5 3.4 3.1 3.4 Source: IFPRI Bangladesh Integrated Household Survey, 2011-2012. The survey represents rural areas only.

210
Table 6.3—Frequency of consumption of different food groups by division: Rural Bangladesh
Division
Food group Barisal Chittagong Dhaka Khulna Rajshahi Rangpur Sylhet Bangladesh (number of days eaten in last 7 days) Rice 7.0 7.0 7.0 7.0 7.0 7.0 7.0 7.0 Wheat flour (roti, bread, noodles)
1.7 2.2 1.0 0.9 1.3 0.3 1.4 1.2
Potatoes and other roots/tubers
5.1 5.1 5.5 5.9 5.8 5.8 4.9 5.5
Cereals (maize, sorghum, millet, barley)
0.1 0.1 0.0 0.1 0.0 0.0 0.1 0.0
Vegetables 5.8 6.0 6.1 6.7 6.4 5.8 5.9 6.1 Fruits/fruit juices 1.9 1.8 1.9 1.6 1.7 1.1 1.8 1.7 Beans, lentils, peas, nuts
2.9 1.4 1.3 0.6 0.8 0.4 1.3 1.2
Eggs 1.7 1.5 1.6 2.0 1.6 1.2 1.1 1.5 Dairy products (milk, cheese, yoghurt)
1.2 2.2 1.8 1.1 1.8 1.4 2.2 1.7
Meat (goat, beef, lamb)
0.1 0.5 0.3 0.2 0.2 0.3 0.2 0.3
Poultry (chicken, duck, pigeon)
0.5 0.5 0.4 0.4 0.5 0.3 0.5 0.4
Fish (fresh and dry) 3.6 3.9 3.9 4.3 3.1 2.1 4.3 3.6 Oil//fats (ghee, butter, veg oil)
7.0 6.9 6.9 7.0 7.0 6.9 6.9 6.9
Sugar, honey 4.5 4.0 2.1 2.2 2.2 1.8 5.0 2.8 Condiments (spices) 0.1 0.3 0.2 0.1 0.1 0.1 0.2 0.1 Nuts and seeds (ground nut, sunflower seeds, etc.)
0.0 0.0 0.0 0.1 0.1 0.0 0.0 0.1
Tobacco 3.4 3.1 3.7 2.0 3.5 3.5 5.1 3.4
Source: IFPRI Bangladesh Integrated Household Survey, 2011-2012. The survey represents rural areas only.

211
Table 6.4—Quantity of food consumed by income groups: Feed the Future zone Per capita expenditure quintile Item 1 (lowest) 2 3 4 5 (highest) All (grams/person/day) Rice 427.3 483.5 520.3 538.7 565.2 506.8 Atta 13.8 16.1 16.3 25.6 31.6 20.6 Other cereal 2.8 5.5 6.8 11.0 16.3 8.5 Lentil 2.9 4.3 5.3 8.2 10.1 6.1 Chickpeas 0.3 0.2 0.9 1.0 1.2 0.7 Khesari 2.3 1.9 2.9 2.8 0.6 2.1 Other pulses 2.9 4.2 5.0 6.8 6.8 5.1 Soybean oil 11.8 17.6 20.8 26.4 33.1 21.9 Mustard oil 1.5 1.6 2.1 2.4 2.2 2.0 Ghee 0.0 - - 0.0 0.1 0.0 Other oils 0.1 0.1 0.4 0.3 0.5 0.3 Potatoes 74.0 80.1 88.5 93.8 97.8 86.8 Green leafy vegetables 35.4 40.1 44.9 49.4 58.1 45.5 Eggplants 29.9 32.5 36.1 31.0 31.4 32.2 Sweet gourd 0.1 1.1 1.4 3.8 3.3 1.9 Carrot 0.4 0.4 0.4 0.1 1.0 0.4 Other vegetables 115.4 148.7 159.4 175.9 225.4 164.8 Chicken 2.0 6.1 10.7 9.8 21.9 10.1 Beef 1.4 1.8 2.9 5.2 15.9 5.4 Goat meat - 0.5 0.3 1.4 2.4 0.9 Other meats 1.5 0.6 2.7 3.0 4.7 2.5 Eggs 2.2 3.8 4.8 8.6 12.6 6.4 Milk 5.5 8.0 12.4 21.3 34.1 16.2 Milk products 0.1 1.6 1.2 3.0 6.7 2.5 Small fish 17.4 24.6 21.5 28.2 32.2 24.8 Big fish 26.4 33.6 50.1 53.2 89.0 50.4 Banana 1.8 2.7 2.4 5.3 4.3 3.3 Orange 0.2 0.1 0.6 1.7 2.1 0.9 Apple 0.3 0.4 1.0 1.3 2.3 1.1 Other fruits 2.9 5.9 6.6 8.8 17.1 8.3 Sugar 2.0 3.5 3.8 5.6 8.4 4.6 Gur 0.7 1.4 2.2 2.8 3.9 2.2 Salt 9.7 10.8 12.1 12.3 13.9 11.7 Spices 4.4 5.4 7.3 7.4 10.4 7.0 Prepared foods 7.0 11.9 16.0 15.1 21.1 14.2
Source: IFPRI Bangladesh Integrated Household Survey, 2011-2012. The survey represents rural areas only. Note: Estimated from individual dietary intake data.

212
Table 6.5—Quantity of food consumed by income groups: Rural Bangladesh Per capita expenditure quintile Item 1 (lowest) 2 3 4 5 (highest) All (grams/person/day) Rice 442.4 481.9 498.2 513.2 548.6 495.5 Atta 13.3 18.1 20.1 22.9 31.5 21.0 Other cereal 4.5 8.3 10.3 13.1 16.3 10.3 Lentil 2.4 3.4 4.8 5.8 8.0 4.8 Chickpeas 0.1 0.2 0.6 0.3 0.5 0.3 Khesari 1.0 1.1 1.2 1.4 0.6 1.1 Other pulses 2.1 3.6 2.9 3.7 6.6 3.7 Soybean oil 8.8 13.5 16.5 19.6 30.4 17.5 Mustard oil 2.5 3.4 3.7 3.9 4.4 3.6 Ghee 0.0 0.0 0.0 0.0 0.0 0.0 Other oils 0.1 0.1 0.2 0.2 0.3 0.2 Potatoes 107.4 116.4 118.0 119.0 120.3 116.0 Green leafy vegetables 37.6 38.8 32.7 39.6 42.6 38.2 Eggplants 34.2 38.1 36.8 37.3 35.8 36.4 Sweet gourd 0.7 1.1 2.5 1.6 3.0 1.8 Carrot 0.2 0.0 0.3 0.2 0.9 0.3 Other vegetables 111.9 137.3 164.1 181.7 217.5 161.1 Chicken 2.2 4.3 11.8 10.8 22.9 10.1 Beef 1.0 2.2 5.4 7.0 19.3 6.8 Goat meat 0.3 0.4 0.4 2.1 1.5 0.9 Other meats 0.6 0.5 2.7 3.0 3.4 2.0 Eggs 2.0 3.9 3.9 7.6 10.5 5.5 Milk 5.2 8.9 16.2 21.9 39.8 17.9 Milk products 0.4 1.2 1.3 2.3 5.6 2.1 Small fish 12.8 18.5 20.6 24.5 30.2 21.1 Big fish 18.4 31.7 44.5 49.1 76.4 43.3 Banana 0.8 1.4 2.4 2.9 2.7 2.0 Orange 0.2 0.2 0.9 1.6 2.6 1.1 Apple 0.1 0.4 0.5 1.5 2.8 1.0 Other fruits 1.6 4.1 4.1 6.4 12.6 5.6 Sugar 2.0 3.6 3.9 5.3 10.7 5.0 Gur 1.1 1.9 2.7 4.5 7.3 3.4 Salt 9.5 10.5 11.6 12.0 14.0 11.5 Spices 4.2 5.6 7.5 8.0 10.8 7.1 Prepared foods 9.1 12.6 16.4 19.9 25.9 16.6
Source: IFPRI Bangladesh Integrated Household Survey, 2011-2012. The survey represents rural areas only. Note: Estimated from individual dietary intake data.

213
Table 6.6—Quantity of food consumed by division: Rural Bangladesh
Division
Item Barisal Chittagong Dhaka Khulna Rajshahi Rangpur Sylhet Bangladesh
(grams/person/day) Rice 528.0 424.6 511.5 513.9 503.0 512.2 489.6 495.5 Atta 22.6 34.7 18.6 17.7 25.5 4.8 23.6 21.0 Other cereal 6.5 12.5 8.7 9.8 14.1 10.2 8.4 10.3 Lentil 6.0 5.1 7.0 4.9 3.0 1.1 5.1 4.8 Chickpeas 0.5 1.0 0.2 0.2 0.1 0.0 0.4 0.3 Khesari 6.0 0.7 0.7 0.6 0.6 1.7 0.0 1.1 Other pulses 7.7 4.8 2.5 4.5 2.2 2.0 8.2 3.7 Soybean oil 23.8 16.5 17.6 23.3 16.7 11.6 16.6 17.5 Mustard oil 1.0 3.1 4.9 1.7 5.3 2.7 2.3 3.6 Ghee - 0.0 0.0 0.0 0.0 0.0 0.1 0.0 Other oils 0.0 0.2 0.0 0.7 0.1 0.1 0.1 0.2 Potatoes 89.0 93.0 114.4 100.5 129.0 162.7 112.1 116.0 Green leafy
vegetables 38.0 33.7 39.8 38.9 30.4 54.3 25.5 38.2
Eggplants 6.6 27.3 40.9 40.5 51.8 40.6 16.0 36.4 Sweet gourd 0.6 3.1 2.1 1.9 0.9 0.2 2.7 1.8 Carrot 1.1 0.2 0.2 0.4 0.6 - 0.0 0.3 Other vegetables 163.7 157.3 173.6 173.7 147.3 122.9 202.2 161.1 Chicken 10.0 12.4 10.5 12.3 8.9 5.3 11.7 10.1 Beef 3.7 14.1 5.3 5.9 3.6 5.3 9.2 6.8 Goat meat 0.6 0.3 0.5 1.7 1.6 1.6 0.4 0.9 Other meats 3.1 1.3 1.1 3.0 3.9 1.7 1.1 2.0 Eggs 7.0 4.4 6.1 6.4 5.8 4.4 3.0 5.5 Milk 10.1 16.6 27.6 12.0 15.7 13.9 9.7 17.9 Milk products 0.7 1.7 2.2 2.2 3.8 1.3 2.2 2.1 Small fish 27.5 22.8 24.0 20.3 15.5 13.0 29.2 21.1 Big fish 39.3 45.7 52.1 48.1 39.1 20.9 48.6 43.3 Banana 2.5 1.2 2.5 3.0 2.3 0.9 0.8 2.0 Orange 0.5 0.5 1.7 0.6 1.5 0.4 1.1 1.1 Apple 0.7 1.3 0.9 1.5 1.3 0.6 0.6 1.0 Other fruits 7.2 4.9 4.5 10.8 6.9 2.3 4.8 5.6 Sugar 5.8 6.2 4.6 5.0 3.8 3.4 9.7 5.0 Gur 3.1 1.6 4.7 4.3 4.2 1.9 2.1 3.4 Salt 9.6 9.5 12.1 12.1 11.8 11.5 13.7 11.5 Spices 7.5 8.6 8.0 5.3 7.0 5.0 7.6 7.1 Prepared foods 7.9 19.3 12.9 11.3 32.5 11.2 18.9 16.6
Source: IFPRI Bangladesh Integrated Household Survey, 2011-2012. The survey represents rural areas only. Note: Estimated from individual dietary intake data.

214
Table 6.7—Calorie share of food items by income groups: Feed the Future zone Per capita expenditure quintile Item 1 (lowest) 2 3 4 5 (highest) All Daily per capita calorie intake (kcal/person/day)
1,861 2,093 2,200 2,356 2,489 2,167
Calorie share of food items (percent) Rice 77.16 73.95 72.32 68.10 64.08 71.14 Atta 2.41 2.28 2.36 3.45 3.42 2.78 Other cereal 0.47 0.87 0.95 1.35 1.60 1.05 Pulses 1.51 1.54 1.84 2.36 2.09 1.87 Oils 6.16 7.74 8.09 9.29 10.30 8.31 Leafy vegetables 0.54 0.49 0.52 0.52 0.49 0.51 Other vegetables 6.63 6.52 6.61 6.44 6.68 6.58 Meats 0.21 0.33 0.51 0.64 1.14 0.56 Eggs 0.20 0.25 0.29 0.50 0.63 0.38 Milk and milk products 0.19 0.28 0.35 0.62 0.83 0.45 Small fish 1.08 1.30 1.71 1.71 2.35 1.63 Big fish 0.75 0.93 0.70 0.83 0.97 0.84 Fruits 0.35 0.61 0.60 0.77 0.94 0.65 Spices 0.67 0.71 0.77 0.78 0.94 0.78 Sugar and gur 0.53 0.78 0.77 1.03 1.24 0.87 Beverages 0.03 0.09 0.12 0.08 0.09 0.08 Other prepared foods 1.09 1.33 1.49 1.54 2.22 1.53 Total 100.0 100.0 100.0 100.0 100.0 100.0
Source: IFPRI Bangladesh Integrated Household Survey, 2011-2012. The survey represents rural areas only.

215
Table 6.8—Calorie share of food items by income groups: Rural Bangladesh Per capita expenditure quintile Item 1 (lowest) 2 3 4 5 (highest) All Daily per capita calorie intake (kcal/person/day)
1,984 2,202 2,275 2,378 2,483 2,243
Calorie share of food items (percent) Rice 78.0 73.6 71.2 68.5 63.2 71.1 Atta 2.2 2.6 3.0 3.2 3.8 3.0 Other cereal 0.7 1.2 1.4 1.6 1.8 1.4 Pulses 1.0 1.2 1.3 1.5 1.7 1.3 Oils 5.1 6.7 7.5 8.2 10.0 7.4 Leafy vegetables 0.6 0.5 0.4 0.5 0.4 0.5 Other vegetables 7.7 7.7 7.7 7.5 7.2 7.6 Meats 0.2 0.3 0.7 0.8 1.2 0.6 Eggs 0.2 0.3 0.3 0.5 0.6 0.3 Milk and milk products 0.2 0.3 0.5 0.7 1.1 0.6 Small fish 0.8 1.2 1.6 1.6 2.1 1.5 Big fish 0.7 0.9 0.9 1.0 1.0 0.9 Fruits 0.2 0.3 0.3 0.5 0.7 0.4 Spices 0.6 0.7 0.8 0.8 0.9 0.8 Sugar and gur 0.5 0.8 0.9 1.2 1.7 1.0 Beverages 0.1 0.1 0.1 0.1 0.1 0.1 Other prepared foods 1.2 1.5 1.5 1.9 2.4 1.7 Total 100.0 100.0 100.0 100.0 100.0 100.0
Source: IFPRI Bangladesh Integrated Household Survey, 2011-2012. The survey represents rural areas only.

216
Table 6.9—Calorie share of food items by division: Rural Bangladesh
Division
Item Barisal Chittagong Dhaka Khulna Rajshahi Rangpur Sylhet Bangladesh Daily per capita calorie intake (kcal/person/day)
2,129 2,036 2,370 2,234 2,278 2,227 2,357 2,243
Calorie share of food items (percent)
Rice 72.24 66.36 71.10 71.61 70.64 77.03 69.99 71.09 Atta 3.02 5.37 2.62 2.25 3.17 0.79 3.38 2.95 Other cereal 0.87 1.79 1.11 1.16 1.73 1.38 1.16 1.35 Pulses 2.59 1.72 1.30 1.27 0.83 0.69 1.71 1.32 Oils 8.46 7.69 7.63 8.81 7.68 5.15 6.49 7.44 Leafy vegetables 0.46 0.42 0.48 0.43 0.34 0.77 0.30 0.47 Other vegetables 5.61 7.08 7.55 7.38 7.86 8.84 7.64 7.55 Meats 0.50 0.96 0.50 0.67 0.57 0.49 0.65 0.62 Eggs 0.39 0.32 0.39 0.38 0.37 0.29 0.19 0.35 Milk and milk products
0.28 0.75 0.74 0.33 0.46 0.40 0.49 0.56
Small fish 1.24 1.67 1.83 1.41 1.18 0.72 1.59 1.45 Big fish 0.93 1.11 1.05 0.67 0.52 0.59 1.33 0.88 Fruits 0.57 0.37 0.34 0.73 0.38 0.12 0.32 0.38 Spices 0.78 1.01 0.83 0.63 0.66 0.62 0.79 0.78 Sugar and gur 1.01 1.21 1.02 1.01 0.82 0.76 1.60 1.02 Beverages 0.02 0.09 0.06 0.11 0.31 0.07 0.05 0.11 Other prepared foods
1.04 2.09 1.43 1.15 2.49 1.32 2.30 1.68
Total 100.0 100.0 100.0 100.0 100.0 100.0 100.0 100.0 Source: IFPRI Bangladesh Integrated Household Survey, 2011-2012. The survey represents rural areas only.

217
Table 6.10—Cost of calorie by food groups and income groups: Feed the Future zone Per capita expenditure quintile Food group 1 (lowest) 2 3 4 5 (highest) All
(taka/1,000 kcal) Rice 8.9 9.0 9.1 9.2 9.7 9.2 Atta 7.7 7.9 8.1 8.0 8.0 7.9 Other cereal 17.4 17.0 17.2 17.4 18.9 17.7 Pulses 20.4 21.2 21.3 23.4 24.3 22.3 Oils 14.0 14.1 14.2 14.3 14.1 14.2 Vegetables 32.0 33.6 33.2 36.5 37.9 34.6 Leafy vegetables 58.9 62.2 59.3 63.9 66.6 62.2 Meats 183.0 202.4 200.0 203.1 210.6 203.7 Eggs 81.5 83.4 80.2 80.5 82.4 81.6 Milk 56.3 58.2 59.9 62.3 61.3 60.3 Small fish 119.6 126.6 130.1 140.8 163.3 137.3 Big Fish 108.1 115.5 124.4 137.1 142.0 126.3 Fruits 77.5 76.5 86.0 94.4 112.0 91.1 Spices 85.0 91.0 94.0 97.1 103.8 94.2 Sugar/gur 27.1 20.4 21.5 18.1 20.0 20.9
Source: IFPRI Bangladesh Integrated Household Survey, 2011-2012. The survey represents rural areas only.

218
Table 6.11—Cost of calorie by food groups and income groups: Rural Bangladesh Per capita expenditure quintile Food group 1 (lowest) 2 3 4 5 (highest) All (taka/1,000 kcal) Rice 8.4 8.6 8.8 8.9 9.3 8.8 Atta 8.1 8.2 8.2 8.4 8.5 8.3 Other cereal 16.2 16.2 16.7 16.9 18.2 17.0 Pulses 21.4 22.5 24.1 24.4 25.6 23.9 Oils 15.0 15.1 15.0 14.9 14.8 15.0 Vegetables 26.2 29.4 30.8 33.7 36.8 31.2 Leafy vegetables 57.0 62.0 63.0 67.8 73.9 64.8 Meats 196.4 191.2 198.3 206.3 214.7 204.8 Eggs 84.0 84.2 82.7 84.2 85.2 84.1 Milk 56.7 60.0 62.9 65.1 67.0 63.6 Small fish 117.8 131.0 129.7 139.5 166.8 138.4 Big Fish 100.0 104.6 116.3 122.5 144.6 118.0 Fruits 89.9 103.4 122.4 140.6 160.8 128.6 Spices 83.3 86.7 90.8 93.7 98.5 90.4 Sugar/gur 19.6 18.9 19.9 19.6 18.3 19.2
Source: IFPRI Bangladesh Integrated Household Survey, 2011-2012. The survey represents rural areas only.

219
Table 6.12—Cost of calorie by food groups and division: Rural Bangladesh
Division
Food group
FTF zone
Barisal Chittagong Dhaka Khulna Rajshahi Rangpur Sylhet Bangladesh
(taka/1,000 kcal) Rice 9.2 8.9 9.2 9.3 8.6 8.5 7.8 8.8 8.8
Atta 7.9 8.1 8.6 8.5 7.9 8.0 7.8 8.5 8.3
Other cereal 17.7 21.7 16.1 17.6 16.7 16.9 14.8 17.5 17.0
Pulses 22.3 19.0 23.7 27.4 23.5 21.8 20.9 22.3 23.9
Oils 14.2 14.4 15.1 15.0 14.4 15.4 15.4 14.5 15.0
Vegetables 34.6 31.8 38.4 33.3 30.2 25.7 22.0 36.7 31.2
Leafy vegetables
62.2 69.0 82.3 62.9 49.0 55.0 47.8 103.0 64.8
Meats 203.7 164.9 219.3 200.5 199.1 196.8 227.1 197.9 204.8
Eggs 81.6 81.4 89.6 81.3 79.3 82.7 89.1 91.3 84.1
Milk 60.3 70.8 71.7 69.2 54.4 57.0 48.6 76.3 63.6
Small fish 137.3 150.3 160.0 132.0 124.1 128.4 135.5 167.7 138.4
Big Fish 126.3 152.3 120.4 119.7 104.3 127.7 93.8 115.8 118.0
Fruits 91.1 93.0 158.9 133.9 88.4 122.1 126.2 156.0 128.6
Spices 94.2 90.3 87.5 84.8 94.8 100.8 92.3 86.8 90.4
Sugar/gur 20.9 17.2 18.2 20.5 22.4 18.3 17.4 17.9 19.2
Source: IFPRI Bangladesh Integrated Household Survey, 2011-2012. The survey represents rural areas only.

220
Table 6.13—Daily per capita calorie intake by income and age groups: Feed the Future zone Per capita expenditure quintile Age group 1 (lowest) 2 3 4 5 (highest) All (kcal/person/day) Preschoolers (aged <5 years) 807 865 906 1,015 995 885 Male 796 952 964 1,128 1,140 942 Female 817 804 850 889 871 834 Primary school age children (aged 5-10 years)
1,347 1,510 1,576 1,693 1,651 1,516
Male 1,369 1,563 1,545 1,687 1,702 1,538 Female 1,327 1,452 1,606 1,699 1,599 1,494 Adolescents (aged >10 to <18 years) 1,834 2,020 2,054 2,235 2,440 2,072 Male 1,918 2,107 2,164 2,341 2,594 2,182 Female 1,753 1,926 1,911 2,125 2,241 1,950 Adults 1 (aged 18 to <40 years) 2,274 2,444 2,547 2,681 2,747 2,524 Male 2,505 2,672 2,797 2,915 2,986 2,771 Female 2,140 2,274 2,354 2,490 2,557 2,343 Adults 2 (aged 40 to <65 years) 2,245 2,441 2,522 2,598 2,680 2,495 Male 2,520 2,634 2,718 2,859 2,965 2,730 Female 1,949 2,228 2,278 2,338 2,434 2,248 Elderly (aged 65 years and more) 2,010 2,057 2,082 2,235 2,432 2,156 Male 2,176 2,217 2,252 2,499 2,711 2,375 Female 1,757 1,880 1,916 1,884 1,895 1,870 All 1,861 2,093 2,200 2,356 2,489 2,167 Male 1,984 2,240 2,349 2,517 2,696 2,325 Female 1,756 1,956 2,051 2,199 2,288 2,018
Source: IFPRI Bangladesh Integrated Household Survey, 2011-2012. The survey represents rural areas only. Note: Breastfed babies and <1 year kids have been excluded in all calculations.

221
Table 6.14—Daily per capita calorie intake by income and age groups: Rural Bangladesh Per capita expenditure quintile Age group 1 (lowest) 2 3 4 5 (highest) All (kcal/person/day) Preschoolers (aged <5 years) 990 1,060 1,074 1,126 1,145 1,059 Male 1,024 1,110 1,107 1,172 1,125 1,096 Female 963 1,020 1,043 1,068 1,167 1,025 Primary school age children (aged 5-10 years)
1,407 1,576 1,627 1,660 1,651 1,552
Male 1,398 1,617 1,619 1,675 1,693 1,564 Female 1,415 1,536 1,634 1,645 1,598 1,540 Adolescents (aged >10 to <18 years) 1,941 2,118 2,175 2,311 2,358 2,159 Male 2,002 2,222 2,262 2,407 2,447 2,245 Female 1,880 2,021 2,088 2,204 2,277 2,074 Adults 1 (aged 18 to <40 years) 2,401 2,562 2,625 2,676 2,780 2,599 Male 2,652 2,788 2,885 2,904 3,008 2,843 Female 2,243 2,390 2,440 2,507 2,598 2,422 Adults 2 (aged 40 to <65 years) 2,301 2,469 2,540 2,635 2,679 2,525 Male 2,506 2,690 2,780 2,869 2,888 2,742 Female 2,068 2,242 2,267 2,397 2,499 2,300 Elderly (aged 65 years and more) 2,092 2,149 2,178 2,127 2,394 2,192 Male 2,281 2,353 2,395 2,318 2,603 2,397 Female 1,827 1,891 1,919 1,888 2,063 1,918 All 1,984 2,202 2,275 2,378 2,483 2,243 Male 2,097 2,354 2,432 2,523 2,619 2,385 Female 1,884 2,065 2,132 2,243 2,357 2,114
Source: IFPRI Bangladesh Integrated Household Survey, 2011-2012. The survey represents rural areas only. Note: Breastfed babies and <1 year kids have been excluded in all calculations.

222
Table 6.15—Food energy adequacy by income and age groups: Feed the Future zone
Per capita expenditure quintile Age group 1 (lowest) 2 3 4 5 (highest) All (percent) Preschoolers (aged <5 years) 71.1 80.5 77.5 86.4 85.6 77.9 Male 66.3 78.7 79.5 93.4 93.4 78.0 Female 75.4 81.8 75.7 78.6 78.9 77.8 Primary school age children (aged 5-10 years)
77.4 84.8 88.4 95.1 92.3 85.6
Male 74.9 84.2 83.9 91.3 90.7 83.3 Female 79.7 85.5 92.8 99.3 93.9 88.0 Adolescents (aged >10 to <18 years) 85.0 90.1 90.0 98.4 105.5 92.2 Male 83.1 86.6 88.7 93.9 103.1 89.8 Female 86.9 93.8 91.7 103.1 108.6 95.0 Adults 1 (aged 18 to <40 years) 74.1 78.4 81.7 88.1 90.4 82.0 Male 75.6 81.1 85.2 92.4 94.2 85.5 Female 73.2 76.5 79.1 84.6 87.4 79.4 Adults 2 (aged 40 to <65 years) 76.2 82.7 84.4 89.1 92.8 84.9 Male 80.2 85.6 87.4 94.5 99.6 89.0 Female 71.8 79.5 80.7 83.6 87.0 80.6 Elderly (aged 65 years and more) 80.3 85.9 87.3 90.7 96.7 88.0 Male 79.6 84.6 88.2 93.3 103.8 90.0 Female 81.3 87.4 86.4 87.4 83.0 85.5 All 77.2 83.2 84.8 91.1 94.0 85.2 Male 77.3 83.9 86.2 93.2 98.0 86.7 Female 77.1 82.6 83.5 89.0 90.0 83.7
Source: IFPRI Bangladesh Integrated Household Survey, 2011-2012. The survey represents rural areas only. Note: Breastfed babies and <1 year kids have been excluded in all calculations.

223
Table 6.16—Food energy adequacy by income and age groups: Rural Bangladesh
Per capita expenditure quintile Age group 1 (lowest) 2 3 4 5 (highest) All (percent) Preschoolers (aged <5 years) 82.3 88.8 89.5 90.8 96.4 87.9 Male 82.7 90.4 89.8 91.9 91.5 88.3 Female 81.9 87.4 89.3 89.5 101.9 87.5 Primary school age children (aged 5-10 years)
80.8 89.0 92.2 92.2 90.2 87.6
Male 77.2 87.2 88.7 88.7 88.0 84.5 Female 84.3 90.7 95.3 95.6 92.9 90.5 Adolescents (aged >10 to <18 years) 90.6 96.7 98.7 103.0 103.5 97.8 Male 87.7 93.3 94.6 98.8 96.9 93.8 Female 93.5 99.9 102.9 107.5 109.5 101.8 Adults 1 (aged 18 to <40 years) 75.7 81.2 84.2 88.8 91.4 83.8 Male 77.8 84.4 88.4 94.0 95.8 87.8 Female 74.4 78.7 81.3 84.9 87.9 80.9 Adults 2 (aged 40 to <65 years) 78.1 84.5 85.8 90.2 92.3 86.2 Male 79.2 87.6 89.6 95.1 97.0 89.5 Female 76.8 81.3 81.5 85.3 88.1 82.7 Elderly (aged 65 years and more) 90.8 92.9 94.2 91.2 97.4 93.4 Male 89.3 94.1 94.1 90.5 98.2 93.5 Female 92.9 91.2 94.4 92.1 96.1 93.2 All 81.1 87.2 89.4 92.5 94.3 88.4 Male 81.0 88.3 90.4 94.3 95.5 89.3 Female 81.3 86.3 88.5 90.8 93.3 87.5
Source: IFPRI Bangladesh Integrated Household Survey, 2011-2012. The survey represents rural areas only. Note: Breastfed babies and <1 year kids have been excluded in all calculations.

224
Table 6.17—Daily per capita protein intake by income and age groups: Feed the Future zone Per capita expenditure quintile Age group 1 (lowest) 2 3 4 5 (highest) All (grams/person/day) Preschoolers (aged <5 years) 19.4 20.7 22.3 27.6 28.8 22.3 Male 19.1 21.8 24.2 30.7 34.4 23.8 Female 19.6 20.0 20.5 24.1 24.1 20.9 Primary school age children (aged 5-10 years)
31.3 36.0 38.1 42.9 45.0 36.9
Male 31.9 37.7 37.3 41.1 46.9 37.4 Female 30.7 34.1 38.8 45.0 43.0 36.4 Adolescents (aged >10 to <18 years) 41.3 48.0 48.2 56.5 66.0 50.1 Male 43.7 49.6 49.5 60.0 70.6 52.9 Female 39.0 46.3 46.4 52.8 60.0 47.1 Adults 1 (aged 18 to <40 years) 52.2 58.2 61.4 67.1 75.1 62.0 Male 57.3 64.4 66.9 73.2 83.0 68.5 Female 49.2 53.6 57.2 62.2 68.7 57.2 Adults 2 (aged 40 to <65 years) 51.8 58.3 60.7 65.5 70.9 61.3 Male 58.1 63.1 65.8 71.8 78.4 67.0 Female 44.9 52.9 54.5 59.2 64.4 55.3 Elderly (aged 65 years and more) 45.6 48.4 50.1 57.7 67.4 53.5 Male 49.9 51.9 54.9 63.5 75.2 59.2 Female 39.2 44.5 45.4 50.0 52.5 46.0 All 42.7 49.8 52.8 59.5 67.4 53.1 Male 45.6 53.5 56.1 63.5 73.6 57.1 Female 40.2 46.4 49.5 55.6 61.3 49.3
Source: IFPRI Bangladesh Integrated Household Survey, 2011-2012. The survey represents rural areas only. Note: Breastfed babies and <1 year kids have been excluded in all calculations.

225
Table 6.18—Daily per capita protein intake by income and age groups: Rural Bangladesh Per capita expenditure quintile Age group 1 (lowest) 2 3 4 5 (highest) All (grams/person/day) Preschoolers (aged <5 years) 23.4 25.7 27.1 27.1 32.5 26.7 Male 24.3 27.5 28.8 30.5 32.9 28.0 Female 22.8 24.2 25.6 29.8 32.2 25.5 Primary school age children (aged 5-10 years)
32.1 37.8 40.0 40.0 44.2 37.8
Male 32.3 38.7 40.1 43.1 45.3 38.3 Female 31.9 36.9 39.9 42.4 42.6 37.3 Adolescents (aged >10 to <18 years) 43.7 50.2 52.7 52.7 62.2 52.4 Male 45.2 52.2 54.2 60.4 64.1 54.2 Female 42.1 48.4 51.2 55.8 60.4 50.7 Adults 1 (aged 18 to <40 years) 54.3 59.9 64.1 64.1 73.7 63.3 Male 60.6 65.3 70.5 73.4 79.1 69.5 Female 50.3 55.7 59.6 62.6 69.4 58.8 Adults 2 (aged 40 to <65 years) 52.2 58.2 61.4 61.4 70.8 61.6 Male 56.7 63.8 67.3 71.1 76.3 66.8 Female 47.0 52.5 54.7 60.0 66.1 56.3 Elderly (aged 65 years and more) 48.2 51.1 54.2 54.2 64.7 54.9 Male 53.2 56.2 59.5 60.8 69.5 60.2 Female 41.2 44.7 48.0 47.7 57.3 47.8 All 45.0 51.9 55.5 55.5 65.9 54.8 Male 47.9 55.6 59.3 63.6 69.2 58.3 Female 42.5 48.6 52.0 56.5 62.9 51.6
Source: IFPRI Bangladesh Integrated Household Survey, 2011-2012. The survey represents rural areas only. Note: Breastfed babies and <1 year kids have been excluded in all calculations.

226
Table 6.19—Daily per capita vitamin A intake by age and income groups: Feed the Future zone Per capita expenditure quintile Age group 1 (lowest) 2 3 4 5 (highest) All
(retinol equivalent micrograms/person/day) Preschoolers (aged <5 years) 95 97 101 107 126 101 Male 120 78 93 113 135 107 Female 73 110 109 101 119 96 Primary school age children (aged 5-10 years)
179 170 177 199 175 179
Male 166 189 134 179 180 169 Female 190 149 218 221 171 189 Adolescents (aged >10 to <18 years) 168 236 196 233 227 209 Male 172 217 216 229 210 208 Female 164 256 171 237 249 211 Adults 1 (aged 18 to <40 years) 245 249 235 276 320 262 Male 272 250 270 295 386 290 Female 229 248 209 260 267 241 Adults 2 (aged 40 to <65 years) 230 230 252 292 312 262 Male 232 257 244 316 339 274 Female 229 201 261 268 290 250 Elderly (aged 65 years and more) 175 205 220 187 324 222 Male 178 231 238 193 367 245 Female 170 177 202 181 240 192 All 197 218 216 249 283 228 Male 202 224 223 257 312 238 Female 193 213 209 242 256 219
Source: IFPRI Bangladesh Integrated Household Survey, 2011-2012. The survey represents rural areas only. Note: Breastfed babies and <1 year kids have been excluded in all calculations.

227
Table 6.20—Daily per capita vitamin A intake by age and income groups: Rural Bangladesh Per capita expenditure quintile Age group 1 (lowest) 2 3 4 5 (highest) All
(retinol equivalent micrograms/person/day) Preschoolers (aged <5 years) 81 77 115 119 145 99 Male 95 87 127 112 122 106 Female 70 69 103 128 171 93 Primary school age children (aged 5-10 years)
131 150 136 171 149 144
Male 128 146 137 170 174 145 Female 134 155 135 172 117 143 Adolescents (aged >10 to <18 years) 188 202 160 184 243 193 Male 175 211 156 176 225 186 Female 201 192 163 193 259 199 Adults 1 (aged 18 to <40 years) 227 219 227 265 271 240 Male 248 230 255 299 294 264 Female 213 212 207 240 254 224 Adults 2 (aged 40 to <65 years) 243 218 223 247 280 242 Male 262 236 235 256 294 256 Female 222 199 210 238 267 228 Elderly (aged 65 years and more) 160 206 192 183 255 201 Male 157 204 197 194 286 211 Female 165 209 186 168 207 188 All 190 197 192 223 251 208 Male 196 205 203 231 260 217 Female 185 189 183 215 242 200
Source: IFPRI Bangladesh Integrated Household Survey, 2011-2012. The survey represents rural areas only. Note: Breastfed babies and <1 year kids have been excluded in all calculations.

228
Table 6.21—Daily per capita iron intake by income and age groups: Feed the Future zone Per capita expenditure quintile Age group 1 (lowest) 2 3 4 5 (highest) All (milligrams/person/day) Preschoolers (aged <5 years) 3.6 3.8 4.4 4.9 4.8 4.1 Male 3.6 3.7 4.3 5.4 5.7 4.2 Female 3.5 3.9 4.6 4.3 4.0 3.9 Primary school age children (aged 5-10 years)
6.3 6.7 7.4 8.3 8.5 7.1
Male 6.1 7.0 6.8 8.2 8.7 7.1 Female 6.5 6.3 7.9 8.3 8.3 7.2 Adolescents (aged >10 to <18 years) 7.4 8.9 9.1 10.7 12.0 9.3 Male 7.9 9.1 9.6 11.3 12.6 9.8 Female 7.0 8.7 8.5 10.1 11.2 8.7 Adults 1 (aged 18 to <40 years) 9.9 10.9 12.1 13.1 14.0 11.9 Male 10.6 11.9 13.4 14.2 15.6 13.1 Female 9.5 10.2 11.0 12.3 12.7 11.0 Adults 2 (aged 40 to <65 years) 9.9 10.8 12.0 12.6 13.5 11.7 Male 11.4 11.7 13.1 13.8 14.9 12.9 Female 8.2 9.7 10.7 11.3 12.2 10.5 Elderly (aged 65 years and more) 8.6 9.2 9.7 10.9 12.4 10.1 Male 9.2 9.8 10.7 11.8 13.7 11.0 Female 7.6 8.5 8.7 9.6 9.9 8.8 All 8.1 9.3 10.3 11.4 12.6 10.1 Male 8.6 9.9 11.0 12.2 13.7 10.8 Female 7.7 8.7 9.6 10.7 11.5 9.4
Source: IFPRI Bangladesh Integrated Household Survey, 2011-2012. The survey represents rural areas only. Note: Breastfed babies and <1 year kids have been excluded in all calculations.

229
Table 6.22—Daily per capita iron intake by income and age groups: Rural Bangladesh Per capita expenditure quintile Age group 1 (lowest) 2 3 4 5 (highest) All (milligrams/person/day) Preschoolers (aged <5 years) 4.2 4.8 4.7 5.4 5.3 4.7 Male 4.4 5.3 4.7 5.6 5.4 5.0 Female 4.1 4.4 4.7 5.2 5.3 4.5 Primary school age children (aged 5-10 years)
5.7 6.8 7.1 7.7 7.4 6.7
Male 5.7 7.0 7.1 7.6 7.6 6.8 Female 5.8 6.6 7.2 7.7 7.1 6.7 Adolescents (aged >10 to <18 years) 7.8 9.1 9.4 10.2 10.9 9.3 Male 8.1 9.4 9.8 10.5 11.3 9.6 Female 7.6 8.8 9.1 9.9 10.5 9.0 Adults 1 (aged 18 to <40 years) 9.7 10.8 11.7 12.2 13.0 11.4 Male 10.8 11.7 12.9 13.3 14.1 12.5 Female 9.0 10.2 10.8 11.4 12.1 10.6 Adults 2 (aged 40 to <65 years) 9.5 10.7 11.4 11.9 12.7 11.2 Male 10.3 11.7 12.4 13.0 13.7 12.2 Female 8.6 9.7 10.2 10.8 11.8 10.2 Elderly (aged 65 years and more) 9.2 10.1 9.9 9.8 11.7 10.2 Male 10.1 11.4 10.8 10.5 12.5 11.2 Female 8.0 8.3 8.8 8.8 10.4 8.8 All 8.1 9.5 10.1 10.8 11.6 9.9 Male 8.6 10.1 10.8 11.4 12.3 10.5 Female 7.7 8.9 9.4 10.2 11.0 9.3
Source: IFPRI Bangladesh Integrated Household Survey, 2011-2012. The survey represents rural areas only. Note: Breastfed babies and <1 year kids have been excluded in all calculations.

230
Table 6.23—Daily per capita zinc intake by age and income groups: Feed the Future zone Per capita expenditure quintile Age group 1 (lowest) 2 3 4 5 (highest) All
(milligrams/person/day) Preschoolers (aged <5 years) 2.5 2.7 2.8 3.5 3.5 2.9 Male 2.5 2.8 3.0 3.7 4.2 3.0 Female 2.6 2.6 2.7 3.2 3.0 2.7 Primary school age children (aged 5-10 years)
4.2 4.7 4.9 5.6 5.6 4.8
Male 4.2 5.0 4.7 5.5 5.9 4.9 Female 4.1 4.4 5.1 5.7 5.4 4.7 Adolescents (aged >10 to <18 years) 5.4 6.3 6.3 7.3 8.4 6.5 Male 5.8 6.4 6.6 7.8 9.0 6.9 Female 5.1 6.1 5.9 6.8 7.5 6.1 Adults 1 (aged 18 to <40 years) 6.9 7.6 7.9 8.8 9.5 8.0 Male 7.5 8.4 8.6 9.6 10.4 8.9 Female 6.5 7.0 7.4 8.2 8.7 7.4 Adults 2 (aged 40 to <65 years) 7.0 7.6 8.0 8.7 9.1 8.1 Male 7.9 8.3 8.7 9.6 10.2 8.8 Female 6.0 6.9 7.1 7.8 8.2 7.2 Elderly (aged 65 years and more) 6.3 6.3 6.5 7.6 8.7 7.0 Male 6.8 6.7 7.1 8.3 9.6 7.7 Female 5.5 5.9 5.9 6.6 6.9 6.1 All 5.7 6.5 6.9 7.8 8.6 6.9 Male 6.1 7.0 7.3 8.3 9.4 7.5 Female 5.3 6.1 6.4 7.3 7.8 6.4
Source: IFPRI Bangladesh Integrated Household Survey, 2011-2012. The survey represents rural areas only. Note: Breastfed babies and <1 year kids have been excluded in all calculations.

231
Table 6.24—Daily per capita zinc intake by age and income groups: Rural Bangladesh Per capita expenditure quintile Age group 1 (lowest) 2 3 4 5 (highest) All
(milligrams/person/day) Preschoolers (aged <5 years) 3.1 3.4 3.4 3.9 4.0 3.4 Male 3.2 3.7 3.5 3.9 3.9 3.6 Female 3.0 3.1 3.3 3.9 4.1 3.3 Primary school age children (aged 5-10 years)
4.2 4.8 5.0 5.4 5.4 4.8
Male 4.1 5.0 5.0 5.4 5.6 4.9 Female 4.2 4.7 5.0 5.3 5.2 4.7 Adolescents (aged >10 to <18 years) 5.7 6.5 6.7 7.3 7.7 6.7 Male 5.9 6.7 7.0 7.6 8.1 6.9 Female 5.5 6.3 6.5 7.0 7.4 6.5 Adults 1 (aged 18 to <40 years) 7.1 7.8 8.2 8.5 9.1 8.1 Male 7.9 8.5 9.1 9.3 9.8 8.9 Female 6.6 7.2 7.5 7.9 8.6 7.5 Adults 2 (aged 40 to <65 years) 6.9 7.6 7.9 8.3 8.8 7.9 Male 7.5 8.4 8.7 9.1 9.6 8.6 Female 6.2 6.9 7.0 7.6 8.2 7.2 Elderly (aged 65 years and more) 6.6 6.8 6.9 6.9 8.1 7.1 Male 7.3 7.5 7.4 7.5 8.7 7.7 Female 5.7 6.0 6.2 6.0 7.1 6.2 All 5.9 6.7 7.1 7.6 8.2 7.0 Male 6.3 7.2 7.6 8.0 8.6 7.5 Female 5.6 6.3 6.6 7.1 7.8 6.6
Source: IFPRI Bangladesh Integrated Household Survey, 2011-2012. The survey represents rural areas only. Note: Breastfed babies and <1 year kids have been excluded in all calculations.
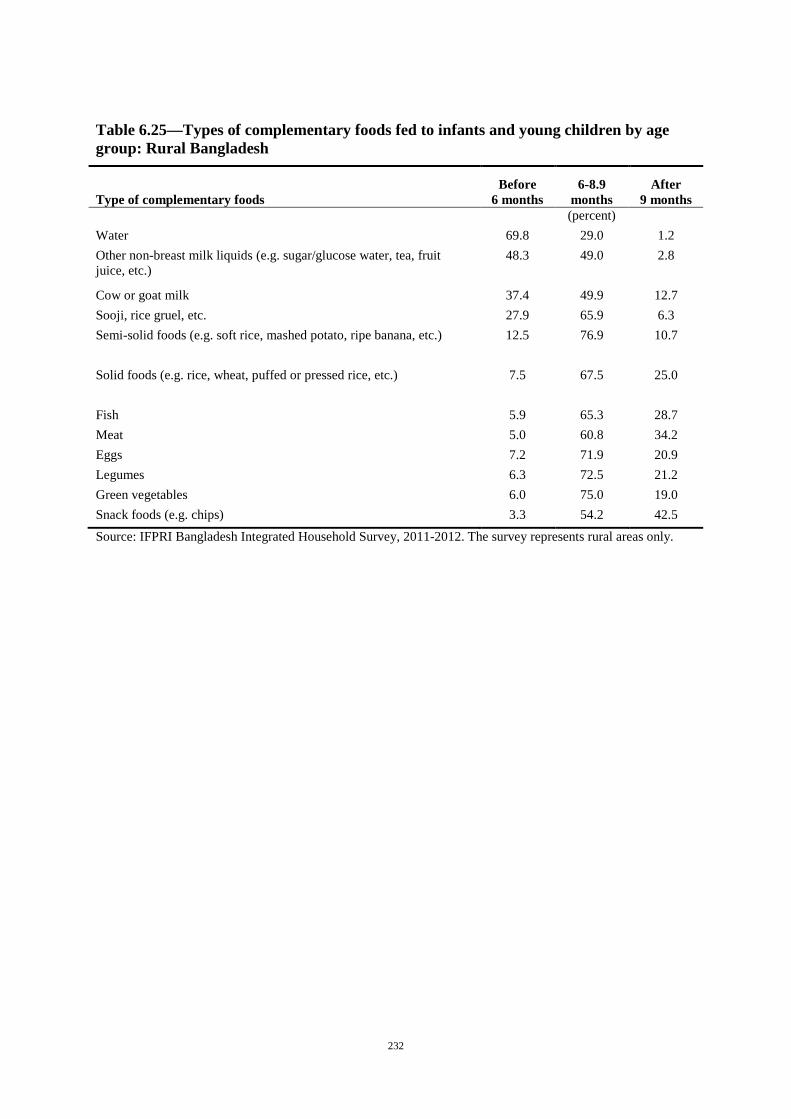
232
Table 6.25—Types of complementary foods fed to infants and young children by age group: Rural Bangladesh
Type of complementary foods Before
6 months 6-8.9
months After
9 months (percent)
Water 69.8 29.0 1.2 Other non-breast milk liquids (e.g. sugar/glucose water, tea, fruit juice, etc.)
48.3 49.0 2.8
Cow or goat milk 37.4 49.9 12.7 Sooji, rice gruel, etc. 27.9 65.9 6.3 Semi-solid foods (e.g. soft rice, mashed potato, ripe banana, etc.) 12.5 76.9 10.7
Solid foods (e.g. rice, wheat, puffed or pressed rice, etc.) 7.5 67.5 25.0
Fish 5.9 65.3 28.7 Meat 5.0 60.8 34.2 Eggs 7.2 71.9 20.9 Legumes 6.3 72.5 21.2 Green vegetables 6.0 75.0 19.0 Snack foods (e.g. chips) 3.3 54.2 42.5
Source: IFPRI Bangladesh Integrated Household Survey, 2011-2012. The survey represents rural areas only.

233
Table 6.26—Items fed to children aged 6-8 months based upon 24 hour recall: Rural Bangladesh
Item Feeding practice (percent) Liquids Breast milk 98.2 Water 87.5 Prepared baby formula 16.1 Any other kind of milk (e.g. powder, cow, goat, etc.) 31.8 Fruit juice (homemade) 8.0 Fruit juice (purchased) 1.2 Water-based liquids (e.g. teas, sugar water, coffee, etc.) 42.6 Food groups
Grains, roots, and tubers 70.3 Legumes and nuts 8.3 Dairy (e.g. milk, yogurt, cheese) 42.9 Flesh foods (e.g. meat, fish, poultry, and liver/organ meats) 5.3 Eggs 8.3 Vitamin A-rich fruits and vegetables 16.2 Other fruits and vegetables 10.4
Source: IFPRI Bangladesh Integrated Household Survey, 2011-2012. The survey represents rural areas only. Table 6.27—Mean height of household members by age-group and sex: Feed the Future zone
Age-group Male SD Female SD All SD
(height in meters)
<5 years 0.824 0.141 0.804 0.134 0.813 0.138 <6 months 0.580 0.063 0.594 0.055 0.587 0.059 6-8 months 0.662 0.035 0.651 0.033 0.656 0.034 9-11 months 0.699 0.062 0.683 0.046 0.689 0.052 12-17 months 0.744 0.033 0.726 0.041 0.734 0.038 18-23 months 0.792 0.051 0.755 0.046 0.774 0.052 24-35 months 0.856 0.057 0.835 0.056 0.844 0.057 36-47 months 0.914 0.055 0.906 0.064 0.910 0.060 48-59 months 0.982 0.069 0.965 0.058 0.973 0.064 5-10 years 1.193 0.121 1.194 0.122 1.193 0.122 >10 to <18 years 1.519 0.126 1.470 0.079 1.495 0.108 18 to <40 years 1.628 0.061 1.511 0.052 1.559 0.080 40 to <65 years 1.613 0.064 1.497 0.054 1.556 0.083 65 years and above 1.591 0.069 1.458 0.063 1.536 0.094
Source: IFPRI Bangladesh Integrated Household Survey, 2011-2012. The survey represents rural areas only. Note: SD=Standard deviation

234
Table 6.28—Mean height of household members by age-group and sex: Rural Bangladesh
Age-group Male SD Female SD All SD
(height in meters)
<5 years 0.821 0.135 0.810 0.134 0.816 0.135 <6 months 0.601 0.091 0.581 0.051 0.592 0.076 6-8 months 0.673 0.032 0.653 0.035 0.663 0.035 9-11 months 0.707 0.045 0.681 0.044 0.694 0.046 12-17 months 0.738 0.041 0.726 0.040 0.732 0.041 18-23 months 0.780 0.049 0.768 0.042 0.773 0.046 24-35 months 0.841 0.058 0.828 0.057 0.835 0.058 36-47 months 0.918 0.060 0.901 0.068 0.910 0.065 48-59 months 0.976 0.059 0.970 0.062 0.973 0.061 5-10 years 1.185 0.123 1.183 0.127 1.184 0.125 >10 to <18 years 1.504 0.130 1.464 0.081 1.483 0.109 18 to <40 years 1.626 0.064 1.507 0.058 1.555 0.084 40 to <65 years 1.615 0.063 1.496 0.056 1.557 0.084 65 years and above 1.592 0.064 1.455 0.062 1.535 0.092
Source: IFPRI Bangladesh Integrated Household Survey, 2011-2012. The survey represents rural areas only. Note: SD=Standard deviation

235
Table 6.29—Mean weight of household members by age-group and sex: Feed the Future zone
Age-group Male SD Female SD All SD
(weight in kg)
<5 years 10.439 3.151 9.868 2.910 10.138 3.038 <6 months 5.302 1.683 5.371 1.187 5.337 1.445 6-8 months 7.235 0.981 7.113 0.917 7.169 0.938 9-11 months 7.712 1.328 7.479 1.109 7.557 1.175 12-17 months 8.581 0.982 8.247 1.353 8.401 1.202 18-23 months 9.507 1.014 8.922 1.199 9.214 1.139 24-35 months 11.140 1.706 10.422 1.511 10.743 1.636 36-47 months 12.412 1.543 11.802 1.714 12.108 1.654 48-59 months 13.881 1.585 13.386 1.569 13.632 1.591 5-10 years 20.843 5.383 20.390 5.389 20.621 5.389 >10 to <18 years 39.823 10.332 38.566 7.879 39.203 9.222 18 to <40 years 54.231 8.192 47.821 8.418 50.520 8.904 40 to <65 years 52.905 8.465 46.869 9.092 49.955 9.279 65 years and above 48.900 9.214 41.441 9.230 45.751 9.922
Source: IFPRI Bangladesh Integrated Household Survey, 2011-2012. The survey represents rural areas only. Notes: Results exclude pregnant women. SD=Standard deviation
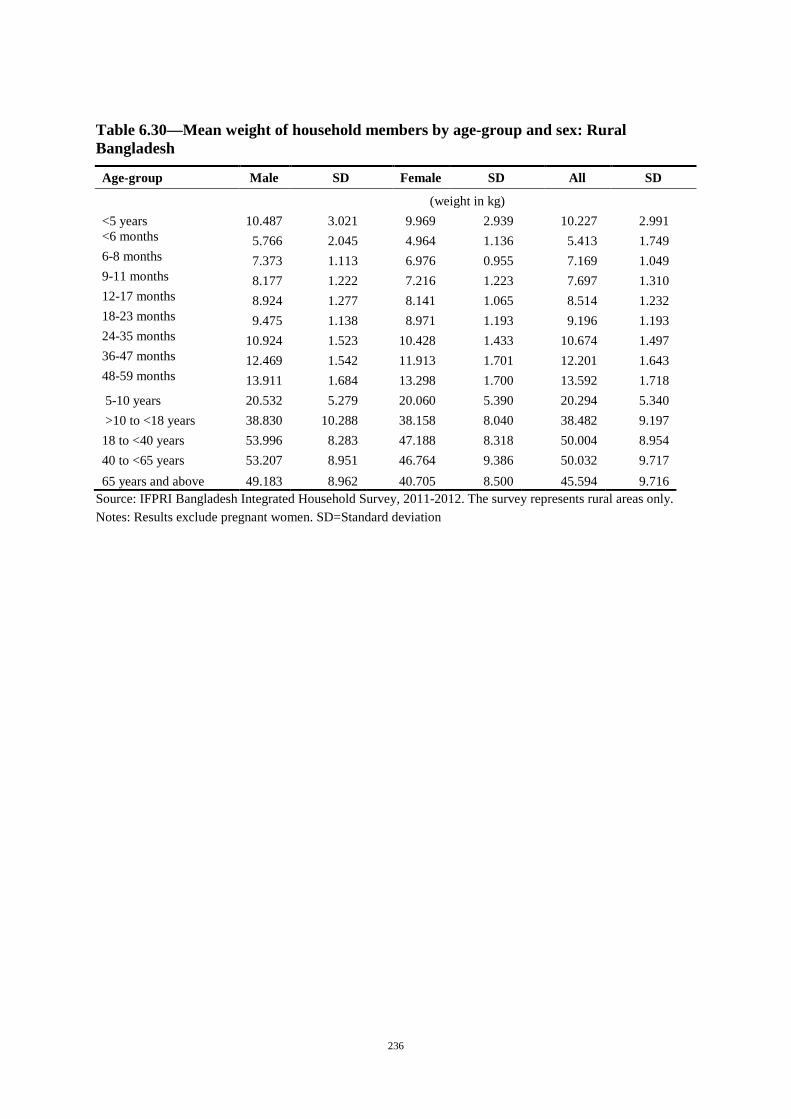
236
Table 6.30—Mean weight of household members by age-group and sex: Rural Bangladesh
Age-group Male SD Female SD All SD
(weight in kg)
<5 years 10.487 3.021 9.969 2.939 10.227 2.991 <6 months 5.766 2.045 4.964 1.136 5.413 1.749 6-8 months 7.373 1.113 6.976 0.955 7.169 1.049 9-11 months 8.177 1.222 7.216 1.223 7.697 1.310 12-17 months 8.924 1.277 8.141 1.065 8.514 1.232 18-23 months 9.475 1.138 8.971 1.193 9.196 1.193 24-35 months 10.924 1.523 10.428 1.433 10.674 1.497 36-47 months 12.469 1.542 11.913 1.701 12.201 1.643 48-59 months 13.911 1.684 13.298 1.700 13.592 1.718 5-10 years 20.532 5.279 20.060 5.390 20.294 5.340 >10 to <18 years 38.830 10.288 38.158 8.040 38.482 9.197 18 to <40 years 53.996 8.283 47.188 8.318 50.004 8.954 40 to <65 years 53.207 8.951 46.764 9.386 50.032 9.717 65 years and above 49.183 8.962 40.705 8.500 45.594 9.716
Source: IFPRI Bangladesh Integrated Household Survey, 2011-2012. The survey represents rural areas only. Notes: Results exclude pregnant women. SD=Standard deviation

237
Table 6.31—Incidence of illness during 30 days preceding the survey: Feed the Future zone
Per capita expenditure quintile
Age group 1 (lowest) 2 3 4 5 (highest) All (percentage of household members) 0–5 years Any illness or injury in the last four weeks 49.5 46.2 52.8 46.3 42.4 48.0
Prolonged fever 39.5 38.4 43.5 36.5 32.3 38.7
Diarrhea 5.3 8.4 5.1 4.3 5.1 5.8
Persistent cough 26.7 28.2 22.9 24.6 25.9 25.9
Skin disease 2.4 2.6 1.5 1.2 1.7 2.0
Throat infection 0.6 1.2 2.2 0.0 0.0 0.9
6–10 years Any illness or injury in the last four weeks 29.2 24.6 22.8 32.7 22.2 26.6
Prolonged fever 23.8 19.1 19.6 25.6 20.4 21.7
Diarrhea 1.5 2.2 0.0 2.4 0.8 1.5
Persistent cough 12.3 7.8 7.6 13.6 9.3 10.1
Skin disease 2.5 1.4 0.9 2.2 0.0 1.6
Throat infection 0.3 0.0 0.4 0.0 0.8 0.3
11–17 years
Any illness or injury in the last four weeks 21.2 22.1 20.8 24.5 32.4 23.7
Prolonged fever 17.7 19.0 16.7 17.1 23.2 18.5
Diarrhea 2.4 0.0 0.4 1.8 1.8 1.2
Persistent cough 9.2 8.5 6.9 9.2 7.3 8.3
Skin disease 1.9 1.2 0.4 1.8 4.2 1.8
Throat infection 0.8 0.4 0.8 0.4 0.0 0.5
18–59 years
Any illness or injury in the last four weeks 31.6 32.7 33.2 31.5 32.5 32.3
Prolonged fever 23.1 24.2 24.1 23.3 22.3 23.4
Diarrhea 1.3 2.2 1.4 2.8 2.2 2.0
Persistent cough 12.2 12.4 11.2 11.5 12.8 12.0
Skin disease 2.4 1.7 1.0 2.1 3.2 2.0
Throat infection 1.1 0.6 1.3 0.7 1.1 1.0
60 years and over
Any illness or injury in the last four weeks 42.1 47.1 45.8 42.4 45.8 44.8
Prolonged fever 28.6 34.3 28.0 31.4 30.0 30.5
Diarrhea 1.4 4.1 1.2 1.4 6.8 3.1
Persistent cough 16.8 18.0 17.0 17.7 19.4 17.8
Skin disease 3.5 4.4 0.6 4.4 1.0 2.7
Throat infection 2.9 0.0 1.8 0.7 1.5 1.3
Source: IFPRI Bangladesh Integrated Household Survey, 2011-2012. The survey represents rural areas only.

238
Table 6.32—Incidence of illness during 30 days preceding the survey: Rural Bangladesh
Per capita expenditure quintile
Age group 1 (lowest) 2 3 4 5 (highest) All
(percentage of household members)
0–5 years Any illness or injury in the last four weeks 39.0 41.5 42.2 42.0 42.6 41.0
Prolonged fever 28.0 30.4 32.4 31.0 29.1 29.9
Diarrhea 7.5 7.4 7.0 6.2 8.9 7.3
Persistent cough 20.2 21.6 21.7 24.6 20.1 21.5
Skin disease 2.7 1.8 0.8 1.6 1.3 1.8
Throat infection 0.8 0.4 1.1 0.0 0.5 0.6
6–10 years
Any illness or injury in the last four weeks 20.8 20.4 15.1 21.2 19.6 19.5
Prolonged fever 15.6 16.3 11.9 17.6 15.5 15.3
Diarrhea 1.4 1.5 0.7 0.9 0.8 1.2
Persistent cough 6.5 5.8 5.3 8.6 7.6 6.5
Skin disease 2.1 1.3 0.3 0.5 1.2 1.2
Throat infection 0.4 0.5 0.7 0.0 0.4 0.4
11–17 years Any illness or injury in the last four weeks 19.9 16.8 18.2 16.5 19.1 18.1
Prolonged fever 13.2 12.6 12.9 12.3 12.1 12.7
Diarrhea 2.5 0.3 1.1 0.5 0.7 1.1
Persistent cough 4.3 4.8 6.2 5.9 5.3 5.3
Skin disease 2.6 1.5 1.4 0.8 1.1 1.5
Throat infection 0.9 0.6 0.5 0.5 0.6 0.6
18–59 years
Any illness or injury in the last four weeks 26.9 27.8 29.0 30.2 27.3 28.2
Prolonged fever 18.5 18.6 18.5 19.5 16.9 18.4
Diarrhea 2.2 1.8 1.9 1.9 1.9 1.9
Persistent cough 7.2 7.3 8.2 7.6 8.9 7.8
Skin disease 1.5 1.1 1.7 1.6 1.6 1.5
Throat infection 0.6 0.6 0.7 0.6 0.8 0.6
60 years and over
Any illness or injury in the last four weeks 42.7 47.5 46.0 42.1 42.3 44.2
Prolonged fever 23.2 25.9 26.9 24.3 26.2 25.4
Diarrhea 3.2 2.3 2.4 2.8 2.6 2.6
Persistent cough 15.1 16.8 16.8 13.2 14.8 15.3
Skin disease 1.6 1.1 2.5 2.0 1.0 1.6
Throat infection 0.5 0.3 0.4 0.0 0.6 0.4
Source: IFPRI Bangladesh Integrated Household Survey, 2011-2012. The survey represents rural areas only.

239