![UoNGBR: A regional assimilation barotropic tidal …...Therefore, an accurate bathymetry model is the main precursor to develop a new tidal model for coastal zones [25]. In this regard](https://static.fdocuments.in/doc/165x107/5f5d7a3d11af5d6a3d7c6614/uongbr-a-regional-assimilation-barotropic-tidal-therefore-an-accurate-bathymetry.jpg)
Report #4- New Jersey Regional Tidal Data Resources
43
Natural Currents Energy Services, LLC Potential Tidal Power for New Jersey 2010-15 Sponsored by NJDOT and UTRC Project Report 140-04 New Jersey Regional Tidal Data Resources Roger Bason March 6, 2011 Contact Information: 845-691-4008 (O), [email protected]
-
Upload
natural-currents-energy-services-llc -
Category
Documents
-
view
217 -
download
0
description
A review of available tide data, tables, graphics, interactive Internet services and software that provide both historical and real time tidal and water current data is presented in support of tasks required for NJDOT 2010-15 Potential Tidal Power for New Jersey. The purpose of this review is to provide both an understanding of tidal flow dynamics and to identify related information resources.
Transcript of Report #4- New Jersey Regional Tidal Data Resources
Natural Currents Energy Services, LLC
Potential Tidal Power for New Jersey 2010-15Sponsored by NJDOT and UTRC
Project Report 140-04
New Jersey Regional Tidal Data Resources
Roger Bason
March 6, 2011
Contact Information: 845-691-4008 (O), [email protected]
1. IntroductionA review of available tide data, tables, graphics, interactive Internet services and software that provide both
historical and real time tidal and water current data is presented in support of tasks required for NJDOT
2010-15 Potential Tidal Power for New Jersey. The purpose of this review is to provide both an
understanding of tidal flow dynamics and to identify related information resources. This task is completed (1)
to assist in the identification of the 20 best locations for tidal energy sites in New Jersey and (2) to support
the development of a high-resolution computer model of tidal flows in state river and shoreline areas.
The introduction presents an overview of each of the sections in the paper. Background on the nature and
terminology of tidal flow is then presented to provide a summary of the technical terms describing the various
tide states to enable an understanding of the dynamics of tidal flux and movement.
Next a description is made of the National Oceanic and Atmospheric Administration (NOAA)/ National Ocean
Service's (NOS) National Current Observation Program (NCOP) to collect, analyze, and distribute
observations and predictions of currents. The New Jersey sites included in the program are highlighted on
maps and then detailed with accompanying tables that present the information available using this resource.
Section 4 presents a web-based tidal prediction program called Mobile Geographic that provides tables and
maps of sites used for tidal flow predictions. The presentation is made for the applicable sites in New Jersey.
Almost all sites provide information on tidal height. A few of the sites in this resource include tidal currents
speeds. A map identifies the site locations in New Jersey. An example of the data table output is presented
along with a list of options for tidal data presentations by day, month, year. This is followed by a list of all New
Jersey sites for tidal height and current data.
Section 5 provides an example of one of many available tidal software programs. The program that is
detailed is called Mr Tides-3 that is available in both PC and Mac based applications. The Mr Tides-3
software presents data for many sites in New Jersey and also displays the information in four graphical
formats with optional time scales that may be useful in the overall analysis of tidal flows.
Section 6 presents the NOAA Physical Oceanographic Real-Time System (PORTS®) system. The objectives
of the PORTS® program are to promote navigation safety, improve the efficiency of U.S. ports and harbors,
and ensure the protection of coastal marine resources. This is a very robust and real time system that may
prove very useful to the 2010-15 Project.
Section 7 presents the NOAA 2011 Tidal Current Predictions. This system will allow you to obtain tidal
current predictions computed by CO-OPS for more than 2,700 tidal current locations along the U.S.
coastline. The publication of full daily predictions is limited to a select number of "reference stations." The
remaining stations are referred to as "subordinate stations." Tidal predictions for subordinate stations are be
obtained by applying specific differences to the times and speeds of the predicted tidal currents for the
specified reference stations. Section 8 presents a real time NOAA Now Coast application that provides both
Natural Currents Energy Services, LLC
2

sea state and weather data. Section 9 presents the Coastal Digital data based on the Lidar data collection
housed and distributed by the NOAA Coastal Services Center. The data span more than a decade and were
collected using several different sensors. The collection includes data from topographic and bathymetric lidar
sensors.
2. Basic Terminology for Tidal Flow DynamicsThere are several different kinds of currents including oceanic, river, and wind-driven; all with their own driving
force. Tidal currents (a horizontal motion) are a result of the rise and fall of the water level due to tides (a
vertical motion). The effects of tidal currents on the movement of water in and out of bays and harbors can
be substantial. A fundamental understanding of tidal flow dynamics requires an understanding of basic terms
that describe the various aspects of the tidal cycle. These terms include:
Set - The set is the direction that current flows toward. This is the opposite of the way winds are reported.
Drift - This is the speed of a current. On ocean waters it is usually stated in knots; in rivers, mph.
Velocity - As the typical term in physics infers, this is an indication of both speed and direction (set and drift)
Speed - How fast the water is moving in relation to a stationary object (e.g. shore, light house).
Flood Flow - The tidal flood when flow is coming from the sea to the shore (tide is coming in).
Ebb Flow - The tidal ebb when it is coming from shore and returning to the sea (low tide ensuing).
Slack Water - The point between flood and ebb (or ebb and flood) is when there is no horizontal movement.
Stand - The point where vertical changes stop as the tide reverses. This is not the same as slack water; this
is a tidal (vertical) occurrence, not a tidal current (horizontal) occurrence.
Maximum Current - The normal maximum speeds of the ebb and flood currents. This does not include
effects of weather or run off from rain or melting snow, which can significantly effect tidal currents.
Water Characteristics and Related Tidal Flow Example
It has mass, therefore when it moves it has momentum, exerts force, and generates friction.
It's a fluid. Fluids are defined as any substance that has no rigidity. Liquids and gases are both fluids.
It is viscous. Viscosity is defined as a fluid's resistance to motion.
Water is a viscous fluid and exactly how water flows is a function of its viscosity. No matter how you move
water around, it will always take time to move any distance due to its own viscosity, or the interaction of its
viscosity with its surroundings.
As an illustration of the effects of the viscosity of water, consider this: No matter how fast you pour out a
bucket of water, it will always take some amount of time to empty the bucket. Always.
Natural Currents Energy Services, LLC
3

Figure-1. A Schematic of Tidal Flow in a Bay.
Imagine a large, long, narrow bay on the coast. We position one person on the ship anchored at the opening
to the sea (lower right) and another at the distant white light, a point on the bay as far from the sea as he can
get. We assume the tide is low and there are no tidal currents in the bay.
The tide comes in and reaches high tide at 11 am so the person at the mouth of the bay reports high tide at
11 am. Meanwhile the person inland is still watching the water level rise until, at 1 pm, he announces high
tide where he is. That's a difference of two hours between high tide in the two locations.
Let's look at what actually happens throughout the cycle. As the tide comes in, the water entering the bay
has to overcome slow water to move forward into the bay (viscosity) so this change is not seen at the other
end of the bay immediately. The tidal currents in the bay are now in flood flow.
When the tide is highest at the entrance of the bay, the tide is at high stand in that location, but there is still a
flood flow into the bay because the high stand has not been reached further into the bay yet. A while later,
half way into the bay (the red light), the water also reaches its high stand, but there's still a flood flow
because the high stand has not yet been reached further in.
Finally the high stand is reached all the way inside the bay at the white light and the current stops. It doesn't
reverse; it stops. This is called slack water. Even though the tide may have started going out at the bay's
entrance, the current in the bay stops, like a ball that has been thrown up in the air stops at the apex of its
flight before falling back to earth.
As the tide starts going out, the same thing happens in reverse. The water level once again changes first at
the bay's entrance while the water further in the bay may still be at high stand. The current in the bay,
Natural Currents Energy Services, LLC
4
though, is now in ebb flow.
When the ocean is at low tide at the entrance of the bay, the water is at its low stand. Further into the bay,
low stand has not yet been reached so the ebb flow continues. Finally low stand is reached all the way inside
the bay and once again slack water occurs in the bay.
To summarize, we can list the sequence of events at any point in the bay, but the time at which these events
occur will be different between any two points at different distances from the sea. The sequence is as follows
(starting at low tide):
Flood flow, when the tide starts to rise.
High stand, when highest water level is reached and flood flow continues.
High slack water, when high stand is reached throughout the bay and flood flow stops.
Ebb flow, when the tide starts to receed.
Low stand, when the lowest water level is reached and ebb flow continues.
Low slack water, when low stand is reached throughout the bay and ebb flow stops.
The same applies to rivers flowing into the sea, but with some important differences. The water flowing from
the river will tend to hinder the movement of water into the river, hence causing the flood current to be less
swift. On the other hand, the ebb flow currents can be extremely swift because water leaving the river at low
tide is augmented by water flowing from the river. Add to that the possibility of rain and/or snow runoff inland
that has caused the river to swell, and ebb currents can be even faster.
In some waters, even the maximum current is so swift that less powerful boats must wait for slack water to
navigate them effectively. In order to safely navigate inshore waters, it is important to be able to predict the
tides. This is accomplished with the use of tide tables. They can be found in various formats and contain
varying amounts of information. Some definitions that are useful in understanding the
Reference Station - Reference stations are points along the coast that are specified stationary points for
the measurement of tides.
Subordinate Station - A subordinate station is a point reporting information relative to it's assigned
reference station. One reference station can be assigned hundreds of subordinate stations. The National
Ocean Service (NOS) collects and publishes tidal data for various geographical areas. These publications
contain data for all reference stations and subordinate stations in a given area.
The data for all points in all areas is given as relative to a reference plane called Mean Lower Low Water
(MLLW).
To predict the tides at a point that is not a reference station, one uses a combination of data from a reference
station and data from a table of 'tidal differences' for that reference station. The table of tidal differences
actually tells the difference between a subordinate station's tides and that of it's 'parent' reference station.
Natural Currents Energy Services, LLC
5

3. NOAA National Current Observation Program (NCOP)
Figure-2. NOAA National Current Observation (NCOP) Along US Eastern Seaboard
The National Oceanic and Atmospheric Administration (NOAA)/ National Ocean Service's (NOS) Center
for Operational Oceanographic Products and Services (CO-OPS) manages the National Current
Observation Program (NCOP) to collect, analyze, and distribute observations and predictions of
currents. The program's goals are to ensure safe, efficient and environmentally sound maritime
commerce, and to support environmental needs such as HAZMAT response. The principal product
generated by this program is information used to maintain and update the Tidal Current Tables.
Background
- NOAA and its predecessor agencies have collected information on currents in various ports and
harbors, and in the Gulf Stream, since the mid-1800s. The Coast and Geodetic Survey first published
tidal current predictions for the use by mariners on the East Coast in 1890 and for those on the West
Coast in 1898. By 2002, Tidal Current Tables contained predictions for over 2,700 locations throughout
the USA. Most of the data presently in use was collected between 1930 and 1980 when significant
resources were dedicated to the program. From the 1960s through the mid-1980s, two NOAA ships
(the McARTHUR on the West Coast and Alaska, and the FERREL on the East Coast) and numerous
staff oceanographers and technicians were dedicated full-time to the collection, processing, and
Natural Currents Energy Services, LLC
6

analysis of tidal current data. These complete comprehensive physical oceanographic surveys measured
currents, water levels, water temperatures and salinity, and meteorological data. Many were the first
complete physical studies ever conducted on major U.S. estuaries.
Due to budget cuts and ship reassignments in the late 1980s, the program was reduced significantly.
Since the mid-1990s, the National Current Observation Program has been recognized as fulfilling a vital
mission of national interest to both the maritime industry and environmental stewardship. As a result,
many organizations strongly recommend that it is time for the program's data to be updated.
Future Directions -
Approximately 70 percent of the stations in the 2001 Tidal Current Tables are over 30 years old. Many of
these stations are based on analyses of less than 7 days of data (the data duration is known for 24% of
all stations). Channel dredging and changes in the configuration of ports and harbors over the years
have significantly altered the physical oceanography of many of the nation's estuaries. Reports from
local users indicate that many of the National Ocean Service’s tidal current predictions may be
inaccurate. NOS intends to address these deficiencies by rebuilding the program and re-sampling the
currents at every major port and estuary within the next 20 years. The majority of work to deploy,
recover, and maintain the program's sensors is likely to be conducted by contractors overseen by NOS
staff.
This system will allow the public to obtain tidal current predictions computed by CO-OPS for more than
2,700 tidal current locations along the U.S. coastline. The publication of full daily predictions is limited to
a select number of "reference stations." The remaining stations are referred to as "subordinate stations."
Tidal predictions for subordinate stations are be obtained by applying specific differences to the times
and speeds of the predicted tidal currents for the specified reference stations.
These pages provide a listing of the 2,700 plus reference stations and subordinate stations. Selecting
the "predictions" link beside a station listing will provide tidal current predictions for the location with the
differences already applied.
Unlike tide stations, which are normally located along the shoreline, most tidal current stations are
located offshore in channels, rivers, and bays. Tidal current stations are often named for the channel,
river, or bay in which they are located or for a nearby navigational reference point. A map or some
personal knowledge of the area may be necessary to help identify stations in the area you are interested
in.
The list of subordinate stations has been broken down into states and other areas where tidal current
stations are located. Each state is further broken down into regions. Each region presents a list of the
tidal current stations in the area. The stations are listed geographically; thus, stations that are near each
Natural Currents Energy Services, LLC
7
other along the shoreline appear together in the listing. This assists the user in locating a station of
interest.
Depth of stations: Although current measurements may have been recorded at various depths in the
past, the data listed for many subordinate stations are mean values determined to have been
representative of the current at each location. For that reason, no specific current meter depths for those
stations are listed. Beginning with the Boston Harbor tidal current survey in 1971, data for individual
meter depths were published and subsequent data will be presented in a similar manner. Most historic
tidal current data is collected from meters suspended from survey vessels or anchored buoys, the listed
depths for these stations are those measured downward from the surface. More recent tidal current
data are collected from meters anchored at fixed depths from the bottom, the listed depths for these
stations are defined as depth below chart datum and will be accompanied by the small letter "d". All
depths listed are in units of feets.
Natural Currents Energy Services, LLC
8
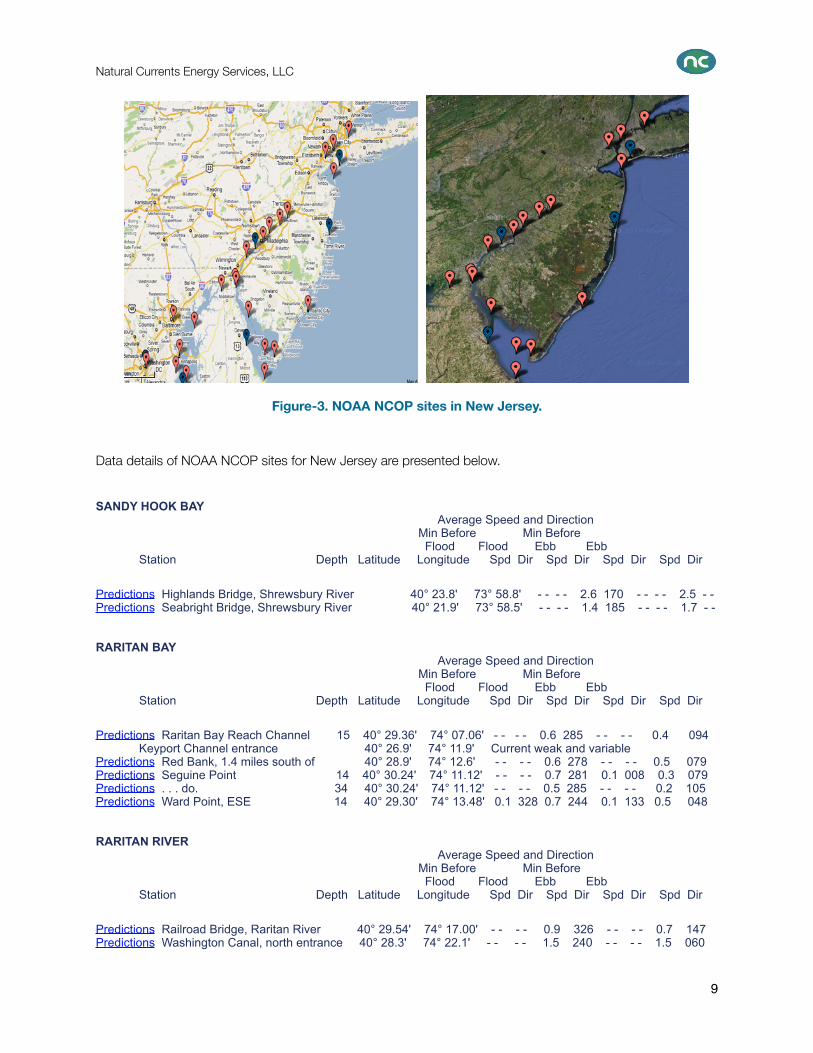
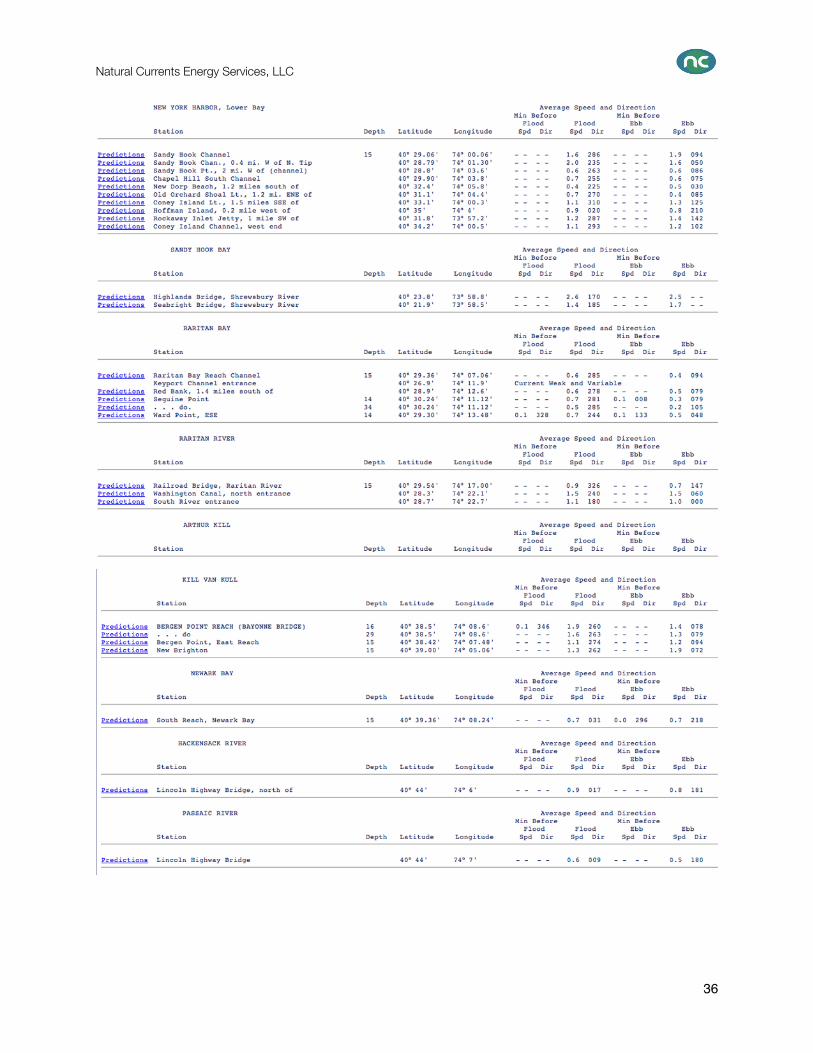
Figure-3. NOAA NCOP sites in New Jersey.
Data details of NOAA NCOP sites for New Jersey are presented below.
SANDY HOOK BAY Average Speed and Direction Min Before Min Before Flood Flood Ebb Ebb Station Depth Latitude Longitude Spd Dir Spd Dir Spd Dir Spd Dir
Predictions Highlands Bridge, Shrewsbury River 40° 23.8' 73° 58.8' - - - - 2.6 170 - - - - 2.5 - - Predictions Seabright Bridge, Shrewsbury River 40° 21.9' 73° 58.5' - - - - 1.4 185 - - - - 1.7 - -
RARITAN BAY Average Speed and Direction Min Before Min Before Flood Flood Ebb Ebb Station Depth Latitude Longitude Spd Dir Spd Dir Spd Dir Spd Dir
Predictions Raritan Bay Reach Channel 15 40° 29.36' 74° 07.06' - - - - 0.6 285 - - - - 0.4 094 Keyport Channel entrance 40° 26.9' 74° 11.9' Current weak and variable Predictions Red Bank, 1.4 miles south of 40° 28.9' 74° 12.6' - - - - 0.6 278 - - - - 0.5 079 Predictions Seguine Point 14 40° 30.24' 74° 11.12' - - - - 0.7 281 0.1 008 0.3 079 Predictions . . . do. 34 40° 30.24' 74° 11.12' - - - - 0.5 285 - - - - 0.2 105 Predictions Ward Point, ESE 14 40° 29.30' 74° 13.48' 0.1 328 0.7 244 0.1 133 0.5 048
RARITAN RIVER Average Speed and Direction Min Before Min Before Flood Flood Ebb Ebb Station Depth Latitude Longitude Spd Dir Spd Dir Spd Dir Spd Dir
Predictions Railroad Bridge, Raritan River 40° 29.54' 74° 17.00' - - - - 0.9 326 - - - - 0.7 147 Predictions Washington Canal, north entrance 40° 28.3' 74° 22.1' - - - - 1.5 240 - - - - 1.5 060
Natural Currents Energy Services, LLC
9
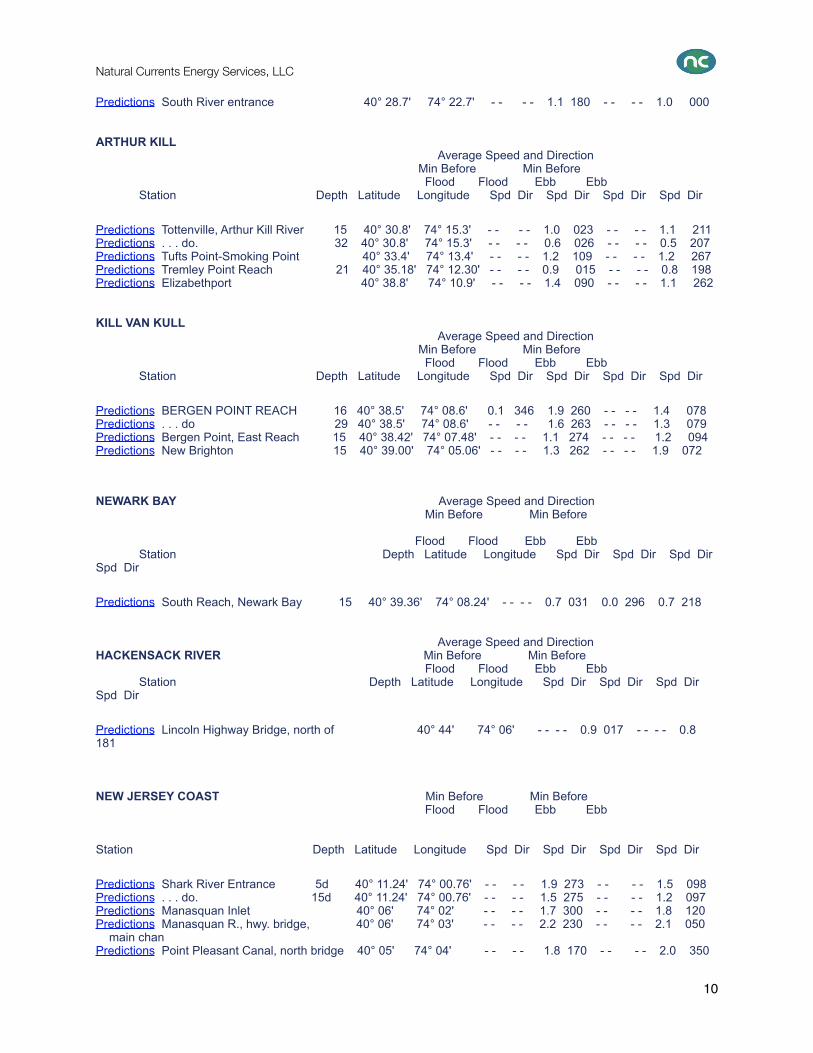
Predictions South River entrance 40° 28.7' 74° 22.7' - - - - 1.1 180 - - - - 1.0 000
ARTHUR KILL Average Speed and Direction Min Before Min Before Flood Flood Ebb Ebb Station Depth Latitude Longitude Spd Dir Spd Dir Spd Dir Spd Dir
Predictions Tottenville, Arthur Kill River 15 40° 30.8' 74° 15.3' - - - - 1.0 023 - - - - 1.1 211 Predictions . . . do. 32 40° 30.8' 74° 15.3' - - - - 0.6 026 - - - - 0.5 207 Predictions Tufts Point-Smoking Point 40° 33.4' 74° 13.4' - - - - 1.2 109 - - - - 1.2 267 Predictions Tremley Point Reach 21 40° 35.18' 74° 12.30' - - - - 0.9 015 - - - - 0.8 198 Predictions Elizabethport 40° 38.8' 74° 10.9' - - - - 1.4 090 - - - - 1.1 262
KILL VAN KULL Average Speed and Direction Min Before Min Before Flood Flood Ebb Ebb Station Depth Latitude Longitude Spd Dir Spd Dir Spd Dir Spd Dir
Predictions BERGEN POINT REACH 16 40° 38.5' 74° 08.6' 0.1 346 1.9 260 - - - - 1.4 078 Predictions . . . do 29 40° 38.5' 74° 08.6' - - - - 1.6 263 - - - - 1.3 079 Predictions Bergen Point, East Reach 15 40° 38.42' 74° 07.48' - - - - 1.1 274 - - - - 1.2 094 Predictions New Brighton 15 40° 39.00' 74° 05.06' - - - - 1.3 262 - - - - 1.9 072
NEWARK BAY Average Speed and Direction Min Before Min Before
Flood Flood Ebb Ebb Station Depth Latitude Longitude Spd Dir Spd Dir Spd Dir Spd Dir
Predictions South Reach, Newark Bay 15 40° 39.36' 74° 08.24' - - - - 0.7 031 0.0 296 0.7 218
Average Speed and DirectionHACKENSACK RIVER Min Before Min Before Flood Flood Ebb Ebb Station Depth Latitude Longitude Spd Dir Spd Dir Spd Dir Spd Dir
Predictions Lincoln Highway Bridge, north of 40° 44' 74° 06' - - - - 0.9 017 - - - - 0.8 181
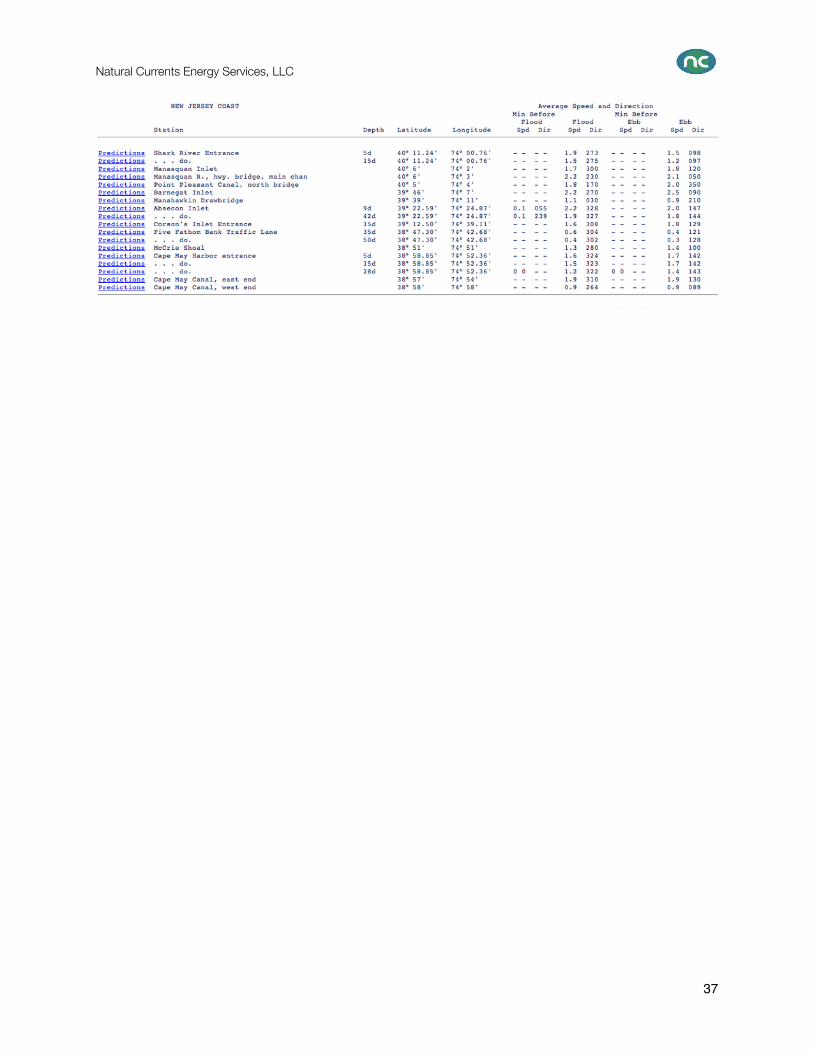
NEW JERSEY COAST Min Before Min Before Flood Flood Ebb Ebb
Station Depth Latitude Longitude Spd Dir Spd Dir Spd Dir Spd Dir
Predictions Shark River Entrance 5d 40° 11.24' 74° 00.76' - - - - 1.9 273 - - - - 1.5 098 Predictions . . . do. 15d 40° 11.24' 74° 00.76' - - - - 1.5 275 - - - - 1.2 097 Predictions Manasquan Inlet 40° 06' 74° 02' - - - - 1.7 300 - - - - 1.8 120 Predictions Manasquan R., hwy. bridge, 40° 06' 74° 03' - - - - 2.2 230 - - - - 2.1 050 main chan Predictions Point Pleasant Canal, north bridge 40° 05' 74° 04' - - - - 1.8 170 - - - - 2.0 350
Natural Currents Energy Services, LLC
10
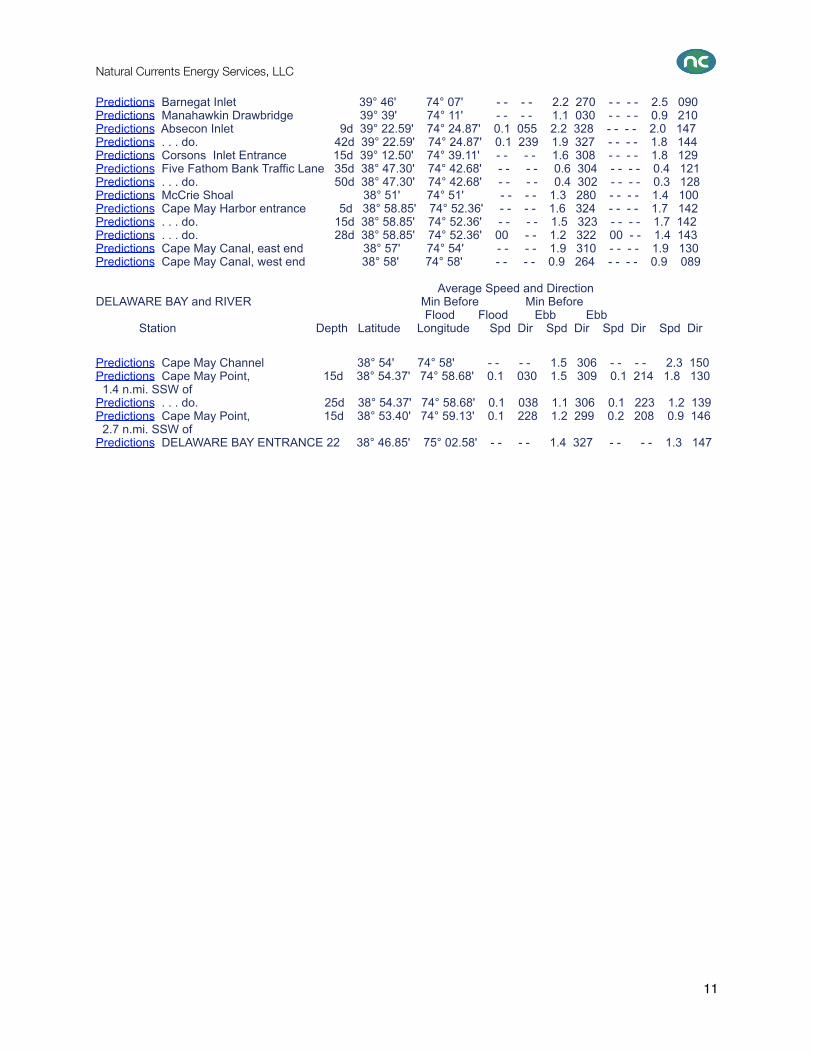
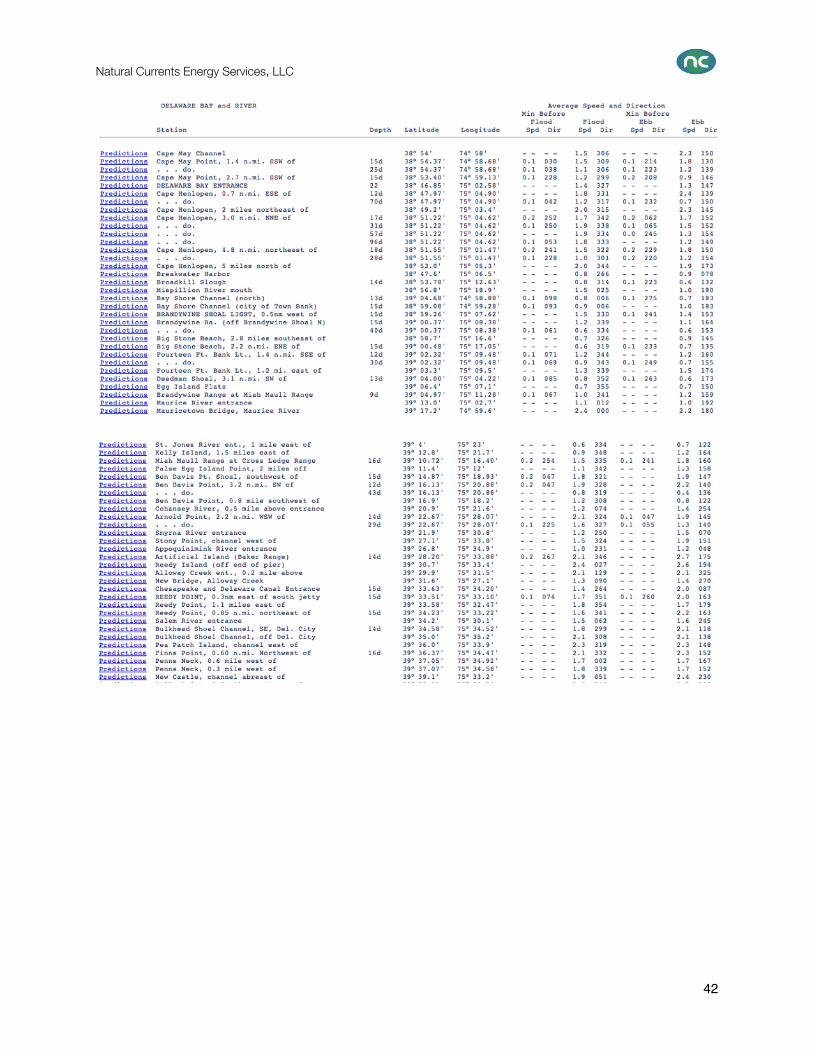
Predictions Barnegat Inlet 39° 46' 74° 07' - - - - 2.2 270 - - - - 2.5 090 Predictions Manahawkin Drawbridge 39° 39' 74° 11' - - - - 1.1 030 - - - - 0.9 210 Predictions Absecon Inlet 9d 39° 22.59' 74° 24.87' 0.1 055 2.2 328 - - - - 2.0 147 Predictions . . . do. 42d 39° 22.59' 74° 24.87' 0.1 239 1.9 327 - - - - 1.8 144 Predictions Corsons Inlet Entrance 15d 39° 12.50' 74° 39.11' - - - - 1.6 308 - - - - 1.8 129 Predictions Five Fathom Bank Traffic Lane 35d 38° 47.30' 74° 42.68' - - - - 0.6 304 - - - - 0.4 121 Predictions . . . do. 50d 38° 47.30' 74° 42.68' - - - - 0.4 302 - - - - 0.3 128 Predictions McCrie Shoal 38° 51' 74° 51' - - - - 1.3 280 - - - - 1.4 100 Predictions Cape May Harbor entrance 5d 38° 58.85' 74° 52.36' - - - - 1.6 324 - - - - 1.7 142 Predictions . . . do. 15d 38° 58.85' 74° 52.36' - - - - 1.5 323 - - - - 1.7 142 Predictions . . . do. 28d 38° 58.85' 74° 52.36' 00 - - 1.2 322 00 - - 1.4 143 Predictions Cape May Canal, east end 38° 57' 74° 54' - - - - 1.9 310 - - - - 1.9 130 Predictions Cape May Canal, west end 38° 58' 74° 58' - - - - 0.9 264 - - - - 0.9 089 Average Speed and DirectionDELAWARE BAY and RIVER Min Before Min Before Flood Flood Ebb Ebb Station Depth Latitude Longitude Spd Dir Spd Dir Spd Dir Spd Dir
Predictions Cape May Channel 38° 54' 74° 58' - - - - 1.5 306 - - - - 2.3 150 Predictions Cape May Point, 15d 38° 54.37' 74° 58.68' 0.1 030 1.5 309 0.1 214 1.8 130 1.4 n.mi. SSW ofPredictions . . . do. 25d 38° 54.37' 74° 58.68' 0.1 038 1.1 306 0.1 223 1.2 139 Predictions Cape May Point, 15d 38° 53.40' 74° 59.13' 0.1 228 1.2 299 0.2 208 0.9 146 2.7 n.mi. SSW of Predictions DELAWARE BAY ENTRANCE 22 38° 46.85' 75° 02.58' - - - - 1.4 327 - - - - 1.3 147
Natural Currents Energy Services, LLC
11

4. Web-based Tidal Prediction Tables and Maps
Other web based tidal prediction tables for New Jersey are presented at the site referenced as
http://www.mobilegeographics.com/tides/. These site locations are presented on the map figure below.
Figure-4. Map Overview of Mobilegeographics Tide Sites in New Jersey
Data for each of these sites is summarized in the table below. Also listed are the time frames for data listing
that may be most appropriate for modeling needs. The listed example is for the Barnegat Bay Inlet, that may
be a promising location for tidal energy development. The site locations indicated on the map in Figure X are
also listed below. It is important to note that most of these sites do not include information on the current
flow, unless the word current is listed following the site name. Points provide tidal height data and time only.
Natural Currents Energy Services, LLC
12
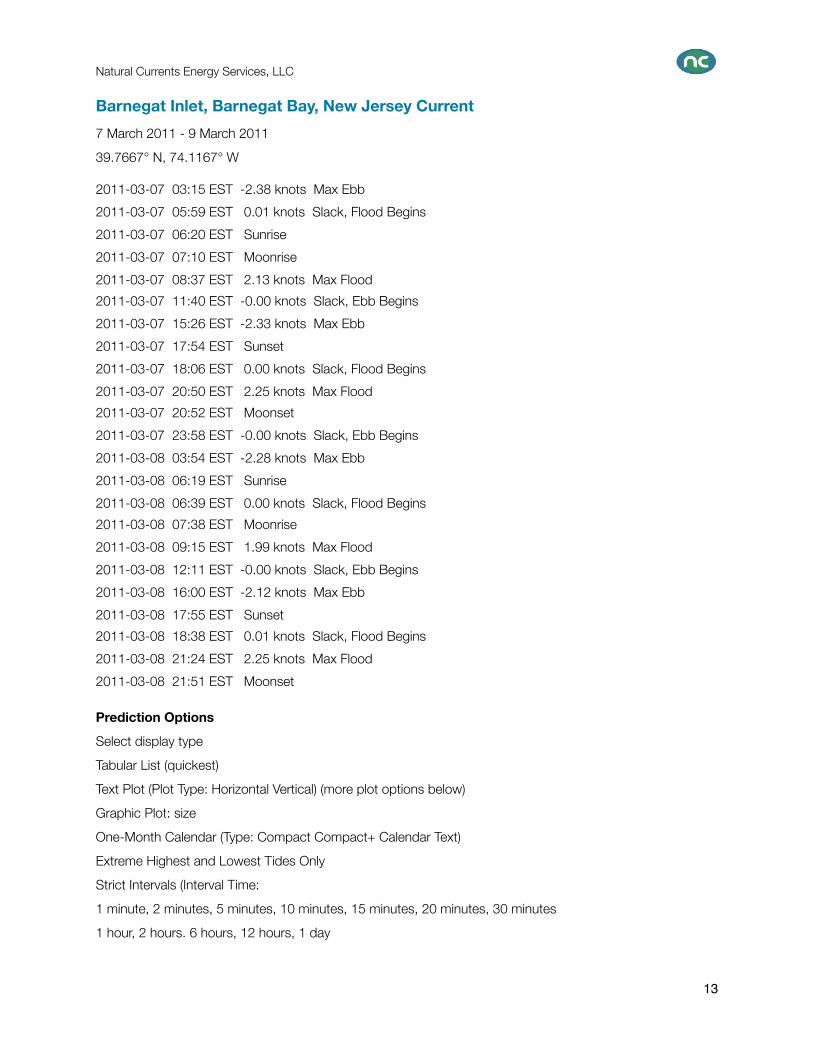
Barnegat Inlet, Barnegat Bay, New Jersey Current
7 March 2011 - 9 March 2011
39.7667° N, 74.1167° W
2011-03-07 03:15 EST -2.38 knots Max Ebb
2011-03-07 05:59 EST 0.01 knots Slack, Flood Begins
2011-03-07 06:20 EST Sunrise
2011-03-07 07:10 EST Moonrise
2011-03-07 08:37 EST 2.13 knots Max Flood
2011-03-07 11:40 EST -0.00 knots Slack, Ebb Begins
2011-03-07 15:26 EST -2.33 knots Max Ebb
2011-03-07 17:54 EST Sunset
2011-03-07 18:06 EST 0.00 knots Slack, Flood Begins
2011-03-07 20:50 EST 2.25 knots Max Flood
2011-03-07 20:52 EST Moonset
2011-03-07 23:58 EST -0.00 knots Slack, Ebb Begins
2011-03-08 03:54 EST -2.28 knots Max Ebb
2011-03-08 06:19 EST Sunrise
2011-03-08 06:39 EST 0.00 knots Slack, Flood Begins
2011-03-08 07:38 EST Moonrise
2011-03-08 09:15 EST 1.99 knots Max Flood
2011-03-08 12:11 EST -0.00 knots Slack, Ebb Begins
2011-03-08 16:00 EST -2.12 knots Max Ebb
2011-03-08 17:55 EST Sunset
2011-03-08 18:38 EST 0.01 knots Slack, Flood Begins
2011-03-08 21:24 EST 2.25 knots Max Flood
2011-03-08 21:51 EST Moonset
Prediction Options
Select display type
Tabular List (quickest)
Text Plot (Plot Type: Horizontal Vertical) (more plot options below)
Graphic Plot: size
One-Month Calendar (Type: Compact Compact+ Calendar Text)
Extreme Highest and Lowest Tides Only
Strict Intervals (Interval Time:
1 minute, 2 minutes, 5 minutes, 10 minutes, 15 minutes, 20 minutes, 30 minutes
1 hour, 2 hours. 6 hours, 12 hours, 1 day
Natural Currents Energy Services, LLC
13

List of New Jersey Tidal Height and Current Sites
Toms River (town), Toms River, Barnegat Bay, New Jersey
Coates Point, Barnegat Bay, New Jersey Pavonia, Cooper River, RR. bridge, New Jersey
Seaside Heights, ocean, New Jersey
Philadelphia (USCG Station), Delaware River, Pennsylvania
Philadelphia, Delaware River
Seaside Park, Barnegat Bay, New Jersey
Barnegat Pier, Barnegat Bay, New Jersey
Sloop Creek, Barnegat Bay, New Jersey
Penrose Avenue Bridge, Schuylkill River, Pennsylvania
Tinicum National Wildlife Refuge, Darby Creek, Pennsylvania (2)
Norwood City, Darby Creek, Pennsylvania Tinicum National Wildlife Refuge, Darby Creek, Pennsylvania
Wanamaker Bridge, Darby Creek, Pennsylvania
Westville, Rt. 47 bridge, Big Timber Creek, New Jersey
Cedar Creek, Barnegat Bay, New Jersey
Woodbury Creek, New Jersey
Island Beach, Barnegat Bay, New Jersey
Billingsport, New Jersey
Stouts Creek, Barnegat Bay, New Jersey
Paulsboro, Mantua Creek, New Jersey
Forked River, Barnegat Bay, New Jersey Marcus Hook, Pennsylvania
Marcus Hook, Pennsylvania (sub)
Marcus Hook, Pennsylvania, Delaware River, Pennsylvania
Oyster Creek, Barnegat Bay, New Jersey
Bridgeport, Raccoon Creek, New Jersey
Bridgeport, Raccoon Creek, New Jersey, Delaware River, New Jersey
Mantua, Mantua Creek, New Jersey
Waretown, Barnegat Bay, New Jersey (2)
Island Beach, Sedge Islands, Barnegat Bay, New Jersey
Barnegat Inlet, Barnegat Bay, New Jersey Current Barnegat Inlet, USCG Station, Barnegat Bay, New Jersey
Pedricktown, Oldmans Creek, Delaware River, New Jersey
Barnegat Inlet (inside), New Jersey
Pedricktown, Oldmans Creek, New Jersey
Natural Currents Energy Services, LLC
14
http://tbone.biol.sc.edu/tide/tideshow.cgi?site=Barnegat+Inlet%2C+Barnegat+Bay%2C+New+Jersey+Current

High Bar, Barnegat Bay, New Jersey
Edgemoor, Delaware Edgemoor, Delaware River, Delaware
Double Creek, Barnegat Bay, New Jersey
Loveladies Harbor, Barnegat Bay, New Jersey
Millside, RR. bridge, Christina River, Delaware
Millside, RR. bridge, Delaware
Wilmington Marine Terminal, Delaware
Wilmington Marine Terminal, Christina River, Delaware
Auburn, Oldmans Creek, Delaware River, New Jersey
Auburn, Oldmans Creek, New Jersey
Flat Creek, Manahawkin Bay, New Jersey Salem Canal entrance, Delaware River, New Jersey
North Beach, Manahawkin Bay, New Jersey
Manahawkin Creek, Manahawkin Bay, New Jersey
Mill Creek, 1 n.mi. above entrance, Little Egg Harbor, New Jersey
Mill Creek, 1 n.mi. above entrance, New Jersey
Dinner Point Creek, upper end, Little Egg Harbor, New Jersey
New Castle, Chesapeake and Delaware Canal, Delaware
New Castle, Delaware River, Delaware
Dinner Point Creek, upper end, New Jersey
New Castle, Chesapeake and Delaware Canal, Delaware (2) Cedar Run, New Jersey
Cedar Run, Little Egg Harbor, New Jersey
Manahawkin Drawbridge, Manahawkin Bay, New Jersey
West Creek, Westecunk Creek, Little Egg Harbor, New Jersey
West Creek, Westecunk Creek, New Jersey
Sweetwater, Mullica River Marina, Mullica River, New Jersey
Sweetwater, Mullica River Marina, New Jersey
Wading River (town), Wading River, New Jersey
Wading River (town), Wading River, Mullica River, New Jersey
Parker Run, upper end, Little Egg Harbor, New Jersey Parker Run, upper end, New Jersey
Beach Haven Crest, New Jersey
Westecunk Creek entrance, New Jersey
Beach Haven Crest, Little Egg Harbor, New Jersey
Westecunk Creek entrance, Little Egg Harbor, New Jersey
Green Bank, Mullica River, New Jersey
Natural Currents Energy Services, LLC
15
http://tbone.biol.sc.edu/tide/tideshow.cgi?site=Cedar+Run%2C+Little+Egg+Harbor%2C+New+Jersey&units=f
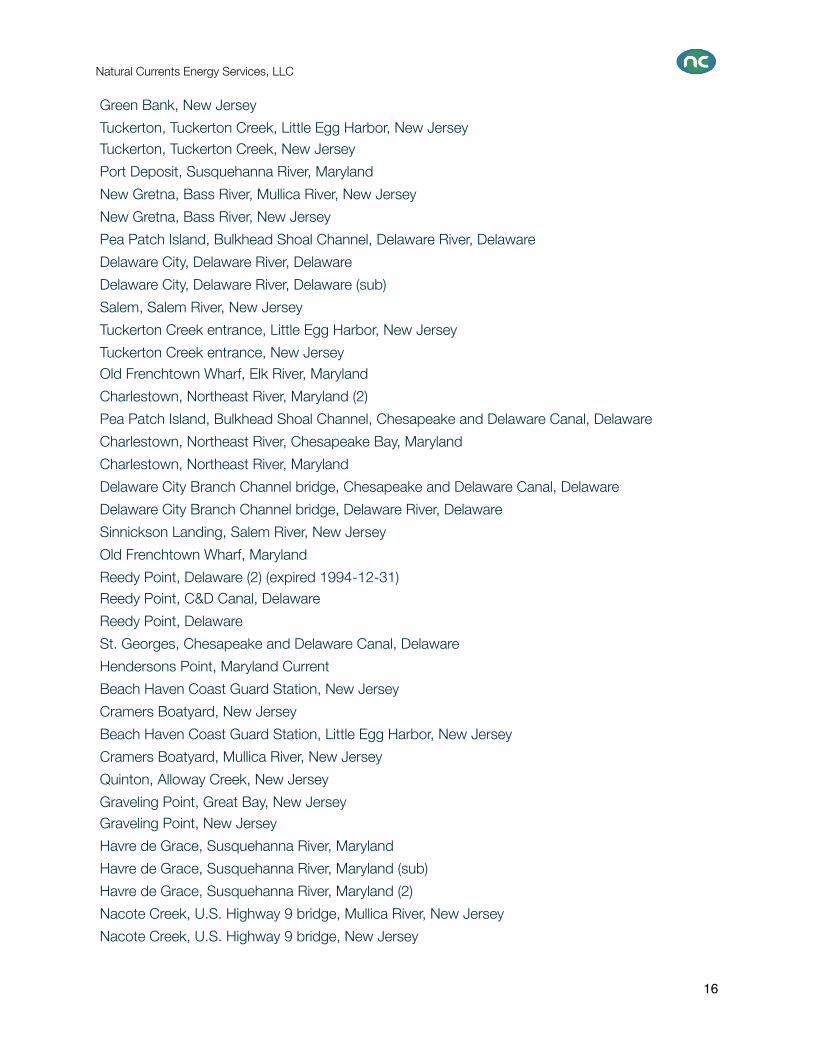
Green Bank, New Jersey
Tuckerton, Tuckerton Creek, Little Egg Harbor, New Jersey Tuckerton, Tuckerton Creek, New Jersey
Port Deposit, Susquehanna River, Maryland
New Gretna, Bass River, Mullica River, New Jersey
New Gretna, Bass River, New Jersey
Pea Patch Island, Bulkhead Shoal Channel, Delaware River, Delaware
Delaware City, Delaware River, Delaware
Delaware City, Delaware River, Delaware (sub)
Salem, Salem River, New Jersey
Tuckerton Creek entrance, Little Egg Harbor, New Jersey
Tuckerton Creek entrance, New Jersey Old Frenchtown Wharf, Elk River, Maryland
Charlestown, Northeast River, Maryland (2)
Pea Patch Island, Bulkhead Shoal Channel, Chesapeake and Delaware Canal, Delaware
Charlestown, Northeast River, Chesapeake Bay, Maryland
Charlestown, Northeast River, Maryland
Delaware City Branch Channel bridge, Chesapeake and Delaware Canal, Delaware
Delaware City Branch Channel bridge, Delaware River, Delaware
Sinnickson Landing, Salem River, New Jersey
Old Frenchtown Wharf, Maryland
Reedy Point, Delaware (2) (expired 1994-12-31) Reedy Point, C&D Canal, Delaware
Reedy Point, Delaware
St. Georges, Chesapeake and Delaware Canal, Delaware
Hendersons Point, Maryland Current
Beach Haven Coast Guard Station, New Jersey
Cramers Boatyard, New Jersey
Beach Haven Coast Guard Station, Little Egg Harbor, New Jersey
Cramers Boatyard, Mullica River, New Jersey
Quinton, Alloway Creek, New Jersey
Graveling Point, Great Bay, New Jersey Graveling Point, New Jersey
Havre de Grace, Susquehanna River, Maryland
Havre de Grace, Susquehanna River, Maryland (sub)
Havre de Grace, Susquehanna River, Maryland (2)
Nacote Creek, U.S. Highway 9 bridge, Mullica River, New Jersey
Nacote Creek, U.S. Highway 9 bridge, New Jersey
Natural Currents Energy Services, LLC
16
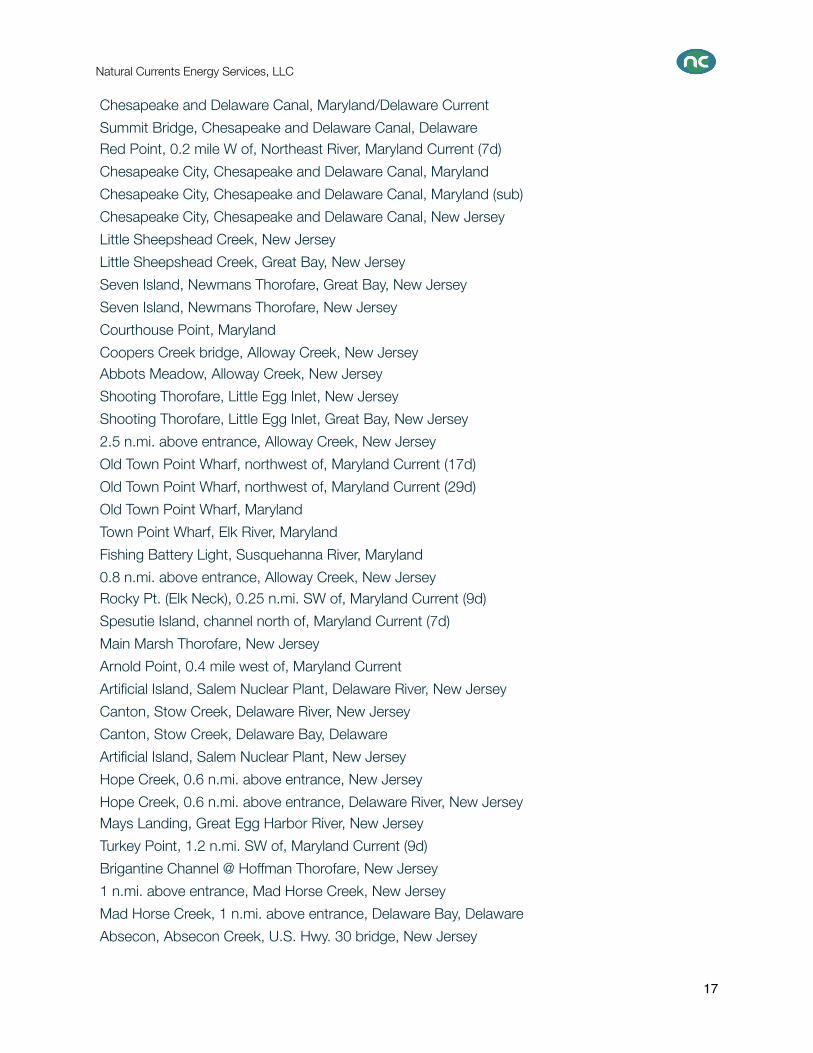
Chesapeake and Delaware Canal, Maryland/Delaware Current
Summit Bridge, Chesapeake and Delaware Canal, Delaware Red Point, 0.2 mile W of, Northeast River, Maryland Current (7d)
Chesapeake City, Chesapeake and Delaware Canal, Maryland
Chesapeake City, Chesapeake and Delaware Canal, Maryland (sub)
Chesapeake City, Chesapeake and Delaware Canal, New Jersey
Little Sheepshead Creek, New Jersey
Little Sheepshead Creek, Great Bay, New Jersey
Seven Island, Newmans Thorofare, Great Bay, New Jersey
Seven Island, Newmans Thorofare, New Jersey
Courthouse Point, Maryland
Coopers Creek bridge, Alloway Creek, New Jersey Abbots Meadow, Alloway Creek, New Jersey
Shooting Thorofare, Little Egg Inlet, New Jersey
Shooting Thorofare, Little Egg Inlet, Great Bay, New Jersey
2.5 n.mi. above entrance, Alloway Creek, New Jersey
Old Town Point Wharf, northwest of, Maryland Current (17d)
Old Town Point Wharf, northwest of, Maryland Current (29d)
Old Town Point Wharf, Maryland
Town Point Wharf, Elk River, Maryland
Fishing Battery Light, Susquehanna River, Maryland
0.8 n.mi. above entrance, Alloway Creek, New Jersey Rocky Pt. (Elk Neck), 0.25 n.mi. SW of, Maryland Current (9d)
Spesutie Island, channel north of, Maryland Current (7d)
Main Marsh Thorofare, New Jersey
Arnold Point, 0.4 mile west of, Maryland Current
Artificial Island, Salem Nuclear Plant, Delaware River, New Jersey
Canton, Stow Creek, Delaware River, New Jersey
Canton, Stow Creek, Delaware Bay, Delaware
Artificial Island, Salem Nuclear Plant, New Jersey
Hope Creek, 0.6 n.mi. above entrance, New Jersey
Hope Creek, 0.6 n.mi. above entrance, Delaware River, New Jersey Mays Landing, Great Egg Harbor River, New Jersey
Turkey Point, 1.2 n.mi. SW of, Maryland Current (9d)
Brigantine Channel @ Hoffman Thorofare, New Jersey
1 n.mi. above entrance, Mad Horse Creek, New Jersey
Mad Horse Creek, 1 n.mi. above entrance, Delaware Bay, Delaware
Absecon, Absecon Creek, U.S. Hwy. 30 bridge, New Jersey
Natural Currents Energy Services, LLC
17
http://tbone.biol.sc.edu/tide/tideshow.cgi?site=Abbots+Meadow%2C+Alloway+Creek%2C+New+Jersey&units=f

Pine Island, Malapartis Creek, Mad Horse Creek, New Jersey
Raccoon Ditch, Newport Meadows, Stow Creek, Delaware River, New Jersey Pine Island, Malapartis Creek, Mad Horse Creek, Delaware Bay, Delaware
Raccoon Ditch, Newport Meadows, Stow Creek, Delaware Bay, Delaware
Liston Point, Delaware
Stathems Neck, Stow Creek, Delaware River, New Jersey
Stathems Neck, Stow Creek, Delaware Bay, Delaware
Taylors Bridge, Blackbird Creek, Delaware
Taylors Bridge, Blackbird Creek, Delaware River, Delaware
Grove Point, 0.7 n.mi.NW of, Maryland Current (14d)
Millville, Maurice River, New Jersey
Pond Point, Bush River, Chesapeake Bay, Maryland Absecon Channel, State Route 87 bridge, New Jersey
Pond Point, Susquehanna River, Maryland
Greenwich Pier, Cohansey River, Delaware Bay, New Jersey
Pleasantville, Lakes Bay, Great Egg Harbor Inlet, New Jersey
Grove Point, Maryland Current
Tindalls Wharf, Cohansey River, Delaware Bay, New Jersey
Howell Point, 0.4 mile NNW of, Maryland Current
Ordinary Point, 0.4 mile west of, Maryland Current
Sassafras River, Betterton, Chesapeake Bay, Maryland
Betterton, Maryland Howell Point, 0.8 n.mi. west of, Maryland Current (15d)
River Bend Marina, Great Egg Harbor River, New Jersey
Georgetown, Maryland Current
Bush River, 0.4 mi. SW of Bush Point, Maryland Current
Atlantic City (Steel Pier), New Jersey
Atlantic City (Steel Pier), New Jersey (2) (expired 1989-12-31)
Atlantic City (Steel Pier), New Jersey (3)
Atlantic City (Steel Pier), New Jersey (4)
Atlantic City, Atlantic Ocean, New Jersey
Dock Thorofare, Risley Channel, New Jersey Menantico Creek entrance, Maurice River, New Jersey
Woodland Beach, Delaware River, Delaware
Woodland Beach, Delaware Bay, Delaware
Steelmanville, Patcong Ck., 2.5 n.mi. above ent, Great Egg Harbor Bay, New Jersey
Steelmanville, Patcong Ck., 2.5 n.mi. above ent., New Jersey
Ventnor City, ocean pier, New Jersey
Natural Currents Energy Services, LLC
18
http://tbone.biol.sc.edu/tide/tideshow.cgi?site=Atlantic+City+%28Steel+Pier%29%2C+New+Jersey&units=f
http://tbone.biol.sc.edu/tide/tideshow.cgi?site=Atlantic+City+%28Steel+Pier%29%2C+New+Jersey&units=f
http://tbone.biol.sc.edu/tide/tideshow.cgi?site=Woodland+Beach%2C+Delaware+River%2C+Delaware&units=f

Battery Point, Gunpowder River, Maryland
Worton Point, 1.1 miles northwest of, Maryland Current Port Elizabeth, Manumuskin River, Maurice River, New Jersey
Gunpowder River entrance, Maryland Current
Worton Point, 1.5 n.mi. WSW of, Maryland Current (17d)
Longport (inside), Great Egg Harbor Inlet, New Jersey
Back Creek entrance, Nantuxent Cove, Delaware Bay, New Jersey
Ship John Shoal, Delaware River, New Jersey
Bowley Bar, Middle River, Maryland
Worton Creek entrance, Maryland
Cedar Creek entrance, Nantuxent Cove, Delaware Bay, New Jersey
Worton Creek entrance, Chesapeake Bay, Maryland Robins Point, 0.7 mile ESE of, Maryland Current (5d)
Tuckahoe, Tuckahoe River, Great Egg Harbor Bay, New Jersey
Tuckahoe, Tuckahoe River, Great Egg Harbor Bay, New Jersey (sub)
Tuckahoe, Tuckahoe River, New Jersey
Tuckahoe, Tuckahoe River, New Jersey (2)
Newport Landing, Nantuxent Creek, Delaware Bay, New Jersey
Beesleys Point, New Jersey
Beesleys Point, Great Egg Harbor Bay, New Jersey
Mauricetown, Maurice River, New Jersey
Money Island, Nantuxent Creek entrance, Delaware Bay, New Jersey Fells Point, Baltimore Harbor, Maryland
Pooles Island, Susquehanna River, Maryland
Ocean City, 9th Street Bridge, New Jersey
Hollywood Beach, The Glades, Delaware Bay, New Jersey
Miller Island, 1.5 miles ENE of, Maryland Current (7d)
Pooles Island, 1.6 n.mi. east of, Maryland Current (16d)
Baltimore (Fort McHenry), Maryland
Middle Branch, Baltimore Harbor, Maryland
Fort McHenry Marsh, Patapsco River, Maryland
Pooles Island, 0.8 mile south of, Maryland Current Millington, Maryland
Crumpton, Maryland
Lynch Point, Back River, Maryland Current
Rocky Point, Back River, Maryland
Rocky Point, Back River, Maryland (2)
Weir Creek bridge, Dividing Creek, Delaware Bay, New Jersey
Natural Currents Energy Services, LLC
19
http://tbone.biol.sc.edu/tide/tideshow.cgi?site=Battery+Point%2C+Gunpowder+River%2C+Maryland&units=f
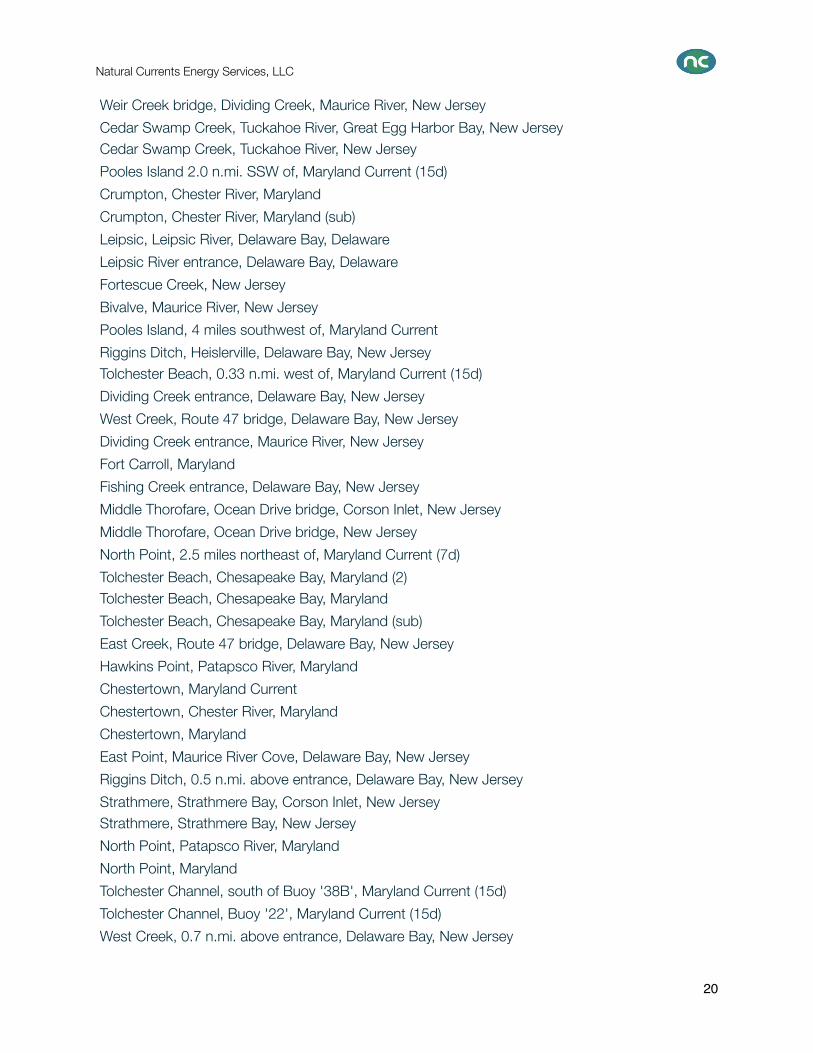
Weir Creek bridge, Dividing Creek, Maurice River, New Jersey
Cedar Swamp Creek, Tuckahoe River, Great Egg Harbor Bay, New Jersey Cedar Swamp Creek, Tuckahoe River, New Jersey
Pooles Island 2.0 n.mi. SSW of, Maryland Current (15d)
Crumpton, Chester River, Maryland
Crumpton, Chester River, Maryland (sub)
Leipsic, Leipsic River, Delaware Bay, Delaware
Leipsic River entrance, Delaware Bay, Delaware
Fortescue Creek, New Jersey
Bivalve, Maurice River, New Jersey
Pooles Island, 4 miles southwest of, Maryland Current
Riggins Ditch, Heislerville, Delaware Bay, New Jersey Tolchester Beach, 0.33 n.mi. west of, Maryland Current (15d)
Dividing Creek entrance, Delaware Bay, New Jersey
West Creek, Route 47 bridge, Delaware Bay, New Jersey
Dividing Creek entrance, Maurice River, New Jersey
Fort Carroll, Maryland
Fishing Creek entrance, Delaware Bay, New Jersey
Middle Thorofare, Ocean Drive bridge, Corson Inlet, New Jersey
Middle Thorofare, Ocean Drive bridge, New Jersey
North Point, 2.5 miles northeast of, Maryland Current (7d)
Tolchester Beach, Chesapeake Bay, Maryland (2) Tolchester Beach, Chesapeake Bay, Maryland
Tolchester Beach, Chesapeake Bay, Maryland (sub)
East Creek, Route 47 bridge, Delaware Bay, New Jersey
Hawkins Point, Patapsco River, Maryland
Chestertown, Maryland Current
Chestertown, Chester River, Maryland
Chestertown, Maryland
East Point, Maurice River Cove, Delaware Bay, New Jersey
Riggins Ditch, 0.5 n.mi. above entrance, Delaware Bay, New Jersey
Strathmere, Strathmere Bay, Corson Inlet, New Jersey Strathmere, Strathmere Bay, New Jersey
North Point, Patapsco River, Maryland
North Point, Maryland
Tolchester Channel, south of Buoy '38B', Maryland Current (15d)
Tolchester Channel, Buoy '22', Maryland Current (15d)
West Creek, 0.7 n.mi. above entrance, Delaware Bay, New Jersey
Natural Currents Energy Services, LLC
20
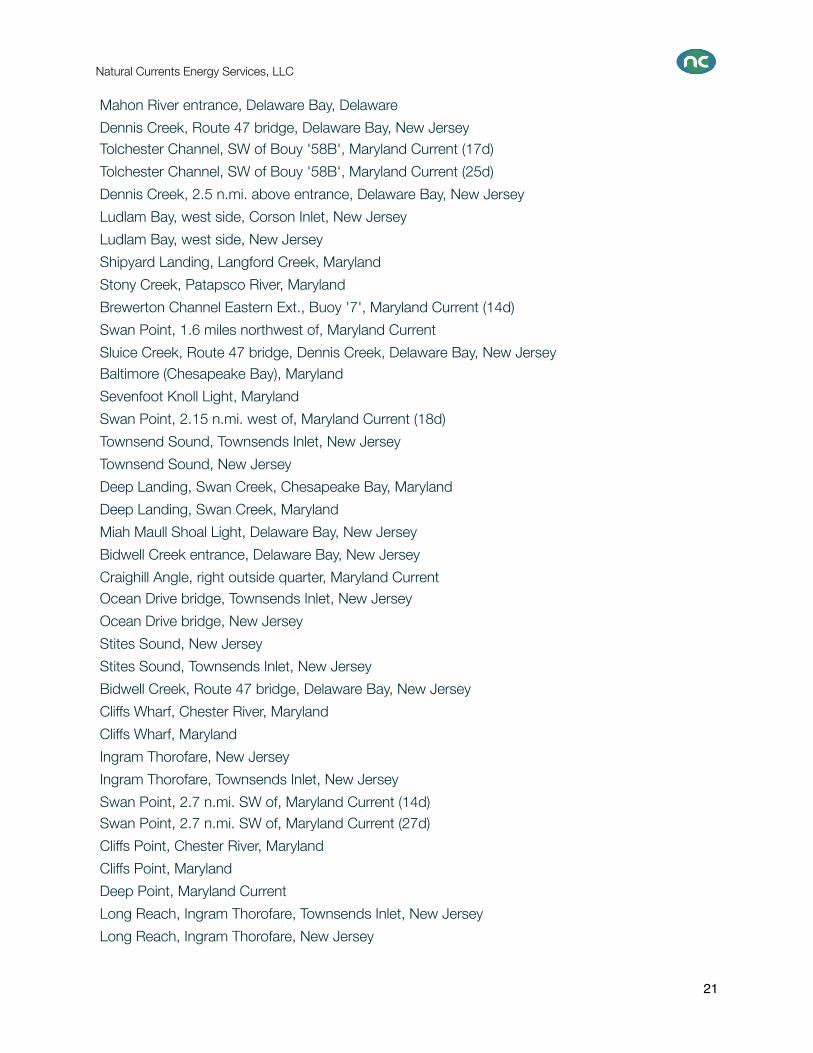
Mahon River entrance, Delaware Bay, Delaware
Dennis Creek, Route 47 bridge, Delaware Bay, New Jersey Tolchester Channel, SW of Bouy '58B', Maryland Current (17d)
Tolchester Channel, SW of Bouy '58B', Maryland Current (25d)
Dennis Creek, 2.5 n.mi. above entrance, Delaware Bay, New Jersey
Ludlam Bay, west side, Corson Inlet, New Jersey
Ludlam Bay, west side, New Jersey
Shipyard Landing, Langford Creek, Maryland
Stony Creek, Patapsco River, Maryland
Brewerton Channel Eastern Ext., Buoy '7', Maryland Current (14d)
Swan Point, 1.6 miles northwest of, Maryland Current
Sluice Creek, Route 47 bridge, Dennis Creek, Delaware Bay, New Jersey Baltimore (Chesapeake Bay), Maryland
Sevenfoot Knoll Light, Maryland
Swan Point, 2.15 n.mi. west of, Maryland Current (18d)
Townsend Sound, Townsends Inlet, New Jersey
Townsend Sound, New Jersey
Deep Landing, Swan Creek, Chesapeake Bay, Maryland
Deep Landing, Swan Creek, Maryland
Miah Maull Shoal Light, Delaware Bay, New Jersey
Bidwell Creek entrance, Delaware Bay, New Jersey
Craighill Angle, right outside quarter, Maryland Current Ocean Drive bridge, Townsends Inlet, New Jersey
Ocean Drive bridge, New Jersey
Stites Sound, New Jersey
Stites Sound, Townsends Inlet, New Jersey
Bidwell Creek, Route 47 bridge, Delaware Bay, New Jersey
Cliffs Wharf, Chester River, Maryland
Cliffs Wharf, Maryland
Ingram Thorofare, New Jersey
Ingram Thorofare, Townsends Inlet, New Jersey
Swan Point, 2.7 n.mi. SW of, Maryland Current (14d) Swan Point, 2.7 n.mi. SW of, Maryland Current (27d)
Cliffs Point, Chester River, Maryland
Cliffs Point, Maryland
Deep Point, Maryland Current
Long Reach, Ingram Thorofare, Townsends Inlet, New Jersey
Long Reach, Ingram Thorofare, New Jersey
Natural Currents Energy Services, LLC
21

Cornfield Creek, Magothy River, Chesapeake Bay, Maryland
Craighill Channel, Belvidere Shoal, Maryland Current (18d) Dias Creek, Route 47 bridge, Delaware Bay, New Jersey
Craighill Channel, NE of Mountain Pt, Maryland Current
Love Point, 2.5 miles north of, Maryland Current
Love Point, 2.0 nmi north of, Maryland Current (15d)
Love Point, 2.0 nmi north of, Maryland Current (5d)
Mountain Point, Magothy River, Maryland
St. Jones River entrance, Delaware Bay, Delaware
Mountain Point, Magothy River, Chesapeake Bay, Maryland
Murderkill River entrance, Delaware Bay, Delaware
Mountain Point, Magothy River entrance, Maryland Current Stone Harbor, Great Channel, Hereford Inlet, New Jersey
Stone Harbor, Great Channel, New Jersey
Centreville Landing, Corsica River, Maryland
Centreville Landing, Corsica River, Chester River, Maryland
Craighill Channel entrance, Buoy '2C', Maryland Current (15d)
Craighill Channel entrance, Buoy '2C', Maryland Current (38d)
Love Point, 1.6 n.mi. east of, Maryland Current (16d)
Love Point, Chester River, Maryland
Love Point, Maryland
Nummy Island, Grassy Sound Channel, New Jersey Nummy Island, Grassy Sound Channel, Hereford Inlet, New Jersey
Brewer Point, Severn River, Maryland
Brewer Point, Maryland
Old Turtle Thorofare, RR. bridge, New Jersey
North Highlands Beach, Delaware Bay, New Jersey
Old Turtle Thorofare, RR. bridge, Hereford Inlet, New Jersey
Sandy Point, Maryland
Baltimore Harbor Approach, Maryland Current
Baltimore Harbor Approach (off Sandy Point), Maryland Current
Hail Point, 0.7 n.mi.east of, Maryland Current (16d) West Wildwood, Grassy Sound, Hereford Inlet, New Jersey
West Wildwood, Grassy Sound, New Jersey
Sandy Point, 0.8 n.mi. ESE of, Maryland Current (15d)
Sandy Point, 0.8 n.mi. ESE of, Maryland Current (43d)
Sandy Point, 2.3 n.mi. east of, Maryland Current (15d)
Sandy Point, 2.3 n.mi. east of, Maryland Current (41d)
Natural Currents Energy Services, LLC
22
Queenstown, Maryland
Queenstown, Chester River, Maryland Chesapeake Bay Bridge, main channel, Maryland Current
Brandywine Shoal Light, Delaware Bay, New Jersey
Brandywine Shoal Light, Delaware Bay, New Jersey (sub)
Annapolis, Maryland
Annapolis, Maryland (2)
Annapolis (US Naval Academy), Severn River, Maryland
Annapolis (US Naval Academy), Severn River, Maryland (sub)
U.S. Naval Academy, Annapolis, Maryland
Swain Channel, Taylor Sound, Cape May Inlet, New Jersey
Swain Channel, Taylor Sound, New Jersey Wildwood Crest, Sunset Lake, New Jersey
Wildwood Crest, Sunset Lake, Cape May Inlet, New Jersey
Wildwood Crest, ocean pier, New Jersey
Greenbury Point, 1.8 miles east of, Maryland Current (8d)
Kent Island Narrows (highway bridge), Maryland Current (4d)
Cape May, ferry terminal, Delaware Bay, New Jersey (3)
Cape May Canal, Cape May, Delaware Bay, New Jersey
Cape May, ferry terminal, Delaware Bay, New Jersey
Cape May, ferry terminal, Delaware Bay, New Jersey (2)
Kent Island Narrows, Chesapeake Bay, Maryland Greenbury Point Shoal Light, Maryland
Greensboro, Choptank River, Maryland
Kent Island Narrows, Maryland
Gingerville Creek, Maryland (2)
Matapeake, Kent Island, Maryland
Gingerville Creek, Maryland
Gingerville Creek, South River, Chesapeake Bay, Maryland
Matapeake, Kent Island, Chesapeake Bay, Maryland
Edgewater, South River, Chesapeake Bay, Maryland
Edgewater, South River, Maryland Cape May Harbor, New Jersey
Cape May Harbor, Cape May Inlet, New Jersey
Mispillion River entrance, Delaware Bay, Delaware
Cape Island Creek, Cape May, New Jersey
Cape May Point, Sunset Beach, Delaware Bay, New Jersey
Natural Currents Energy Services, LLC
23

5. Tidal Software
An effective software program suitable for both PC and Mac applications includes Mr Tides 3. Natural
Currents is moving to Mac based platform for much of its operations so Mr Tides 3 - for the Mac is a
convenient and effective tool that can be downloaded for free from the Internet. The following figures present
an overview of the functionality of the this program provides for sites in New Jersey.
Figure-5. Mr. Tides-3 Software Provides Many Mapped Site for Tidal Flow in New Jersey
Figures 5,6,7,8 and 9 present the various graphics presentations of data available to Mr Tides-3 users. These
include graphs of the (6) tidal height changes over time for days, (7) tidal height changes for a monthly cycle,
(8) the same tidal height data presented in tabular form, and (9) a calendar and clock graphic to identify tidal
states at a glance.
Natural Currents Energy Services, LLC
24
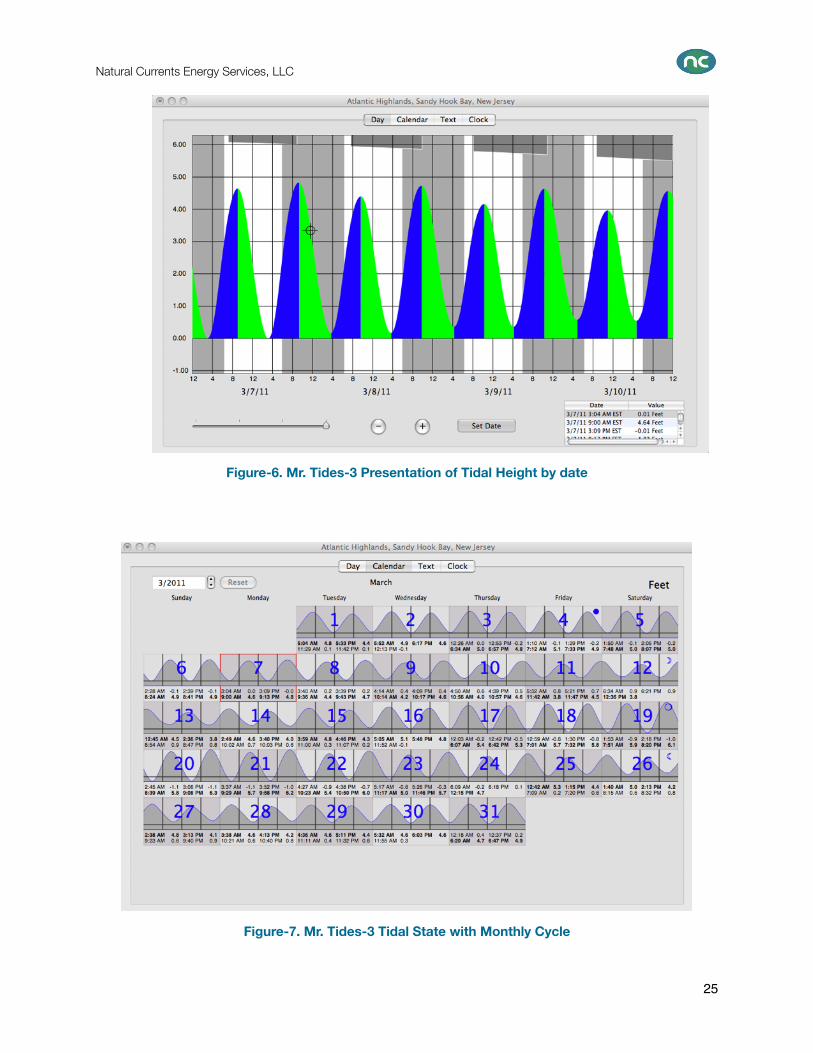
Figure-6. Mr. Tides-3 Presentation of Tidal Height by date
Figure-7. Mr. Tides-3 Tidal State with Monthly Cycle
Natural Currents Energy Services, LLC
25
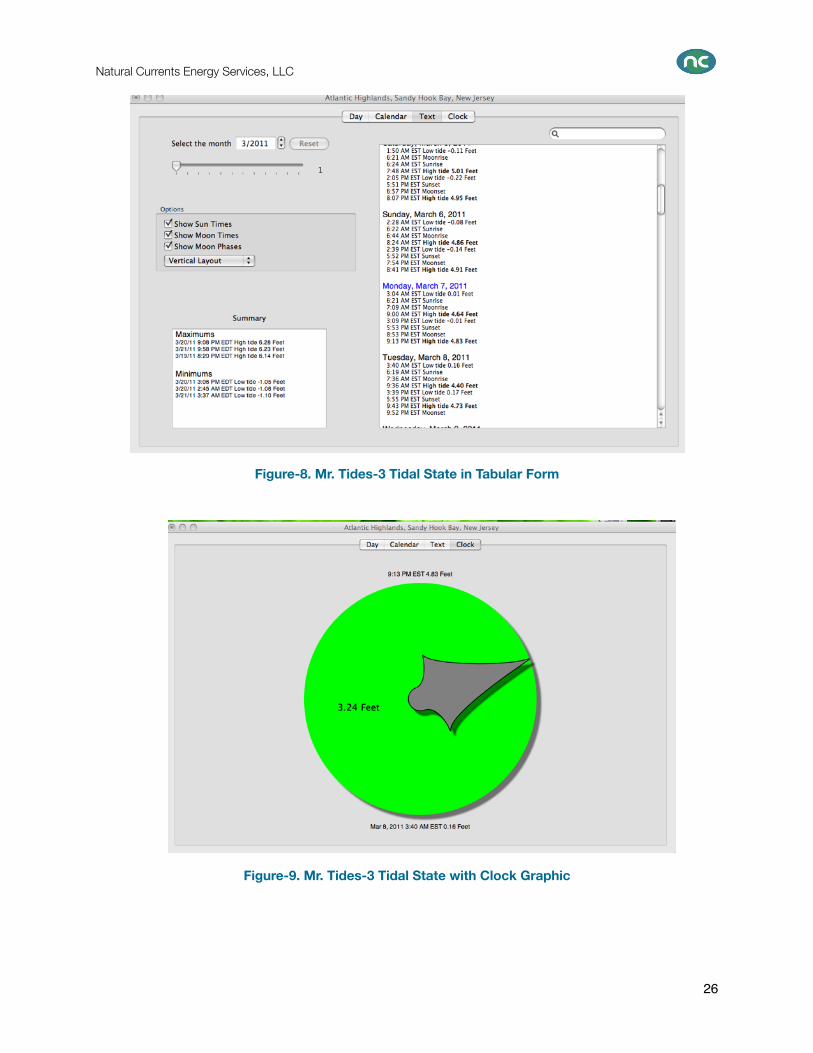
Figure-8. Mr. Tides-3 Tidal State in Tabular Form
Figure-9. Mr. Tides-3 Tidal State with Clock Graphic
Natural Currents Energy Services, LLC
26
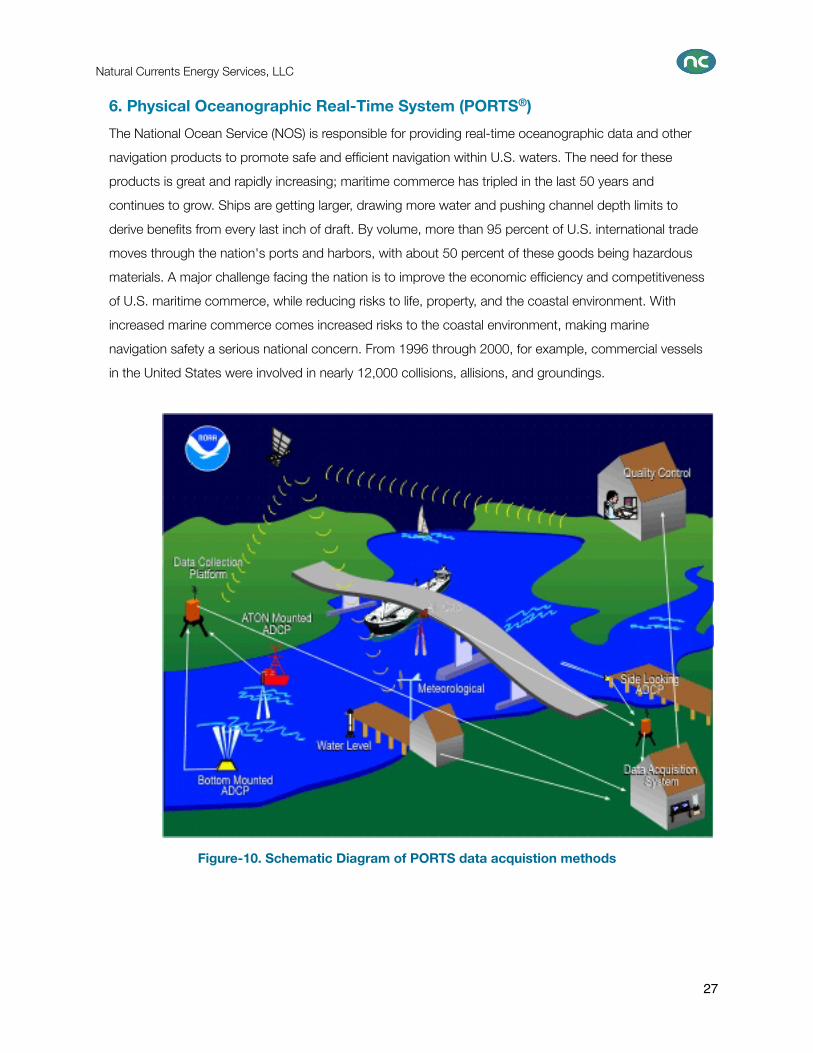
6. Physical Oceanographic Real-Time System (PORTS®)
The National Ocean Service (NOS) is responsible for providing real-time oceanographic data and other
navigation products to promote safe and efficient navigation within U.S. waters. The need for these
products is great and rapidly increasing; maritime commerce has tripled in the last 50 years and
continues to grow. Ships are getting larger, drawing more water and pushing channel depth limits to
derive benefits from every last inch of draft. By volume, more than 95 percent of U.S. international trade
moves through the nation's ports and harbors, with about 50 percent of these goods being hazardous
materials. A major challenge facing the nation is to improve the economic efficiency and competitiveness
of U.S. maritime commerce, while reducing risks to life, property, and the coastal environment. With
increased marine commerce comes increased risks to the coastal environment, making marine
navigation safety a serious national concern. From 1996 through 2000, for example, commercial vessels
in the United States were involved in nearly 12,000 collisions, allisions, and groundings.
Figure-10. Schematic Diagram of PORTS data acquistion methods
Natural Currents Energy Services, LLC
27
PORTS® - PORTS® is a decision support tool that improves the safety and efficiency of maritime
commerce and coastal resource management through the integration of real-time environmental
observations, forecasts and other geospatial information. PORTS® measures and disseminates
observations and predictions of water levels, currents, salinity, and meteorological parameters (e.g., winds,
atmospheric pressure, air and water temperatures) that mariners need to navigate safely.
Program Objectives - The objectives of the PORTS® program are to promote navigation safety, improve
the efficiency of U.S. ports and harbors, and ensure the protection of coastal marine resources.
Navigation Safety - The real-time tide and current data provided through PORTS® represents one
component of NOS's integrated program to promote safe navigation. PORTS® data, when combined
with up-to-date nautical charts and precise positioning information, can provide the mariner with a
clearer picture of the potential dangers that may threaten navigation safety. NOS fulfills its navigation
safety mission in close concert with other federal agencies, such as the U.S. Coast Guard and the U.S.
Army Corps of Engineers.
Improved Economic Efficiency - Our nation's waterfronts, ports and harbors have historically been
centers of rapid industrial and urban growth, and have advanced critical national objectives by
promoting energy exploration, fishery production, commerce, and recreation. In 2002 alone, commercial
port activities provided employment for 1.1 million Americans and $44 billion in personal income, and
generated approximately $16 billion in federal, state and local taxes. Increasingly, shipping companies
are implementing new navigation systems aboard ships to maximize cargo load while reducing
uncertainties in under keel clearances. These new systems rely on the availability of real-time tide/current
and other information. One additional foot of draft may account for between $36,000 and $288,000 of
increased profit per transit. Knowledge of the currents, water levels, winds, and density of the water can
increase the amount of cargo moved through a port and harbor by enabling mariners to safely utilize
every inch of dredged channel depth.
Coastal Resource Protection - Most ports are located at the mouths of major estuaries, which
provide critical habitat for many important biological resources. For example, coastal waters provide
nurseries and spawning grounds for 70 percent of U.S. commercial and recreational fisheries.
Commercial fishing employs over 350,000 people in vessel- and shore-related fisheries work. An
additional 17 million people participate in recreational saltwater fishing, spending $7.2 billion annually.
Activities at ports can greatly affect these critical resources; dredging is but one such activity. Each year
in the U.S., approximately 400 million cubic yards of dredged material are removed from navigation
channels, berths, and terminals.
The prevention of maritime accidents is the most cost-effective measure that can be taken to protect
fragile coastal ecosystems. In 2004 alone, NOS's Office of Response and Restoration responded to
over 120 events, including the release of 270,000 gallons of crude oil into the Delaware River near
Philadelphia, and spill of over 400,000 gallons of bunker oil in Alaska. One major oil spill (e.g., the 1989
Natural Currents Energy Services, LLC
28
Exxon VALDEZ accident) can cost billions of dollars and destroy sensitive marine habitats critical to
coastal ecosystems. PORTS® provides information to make navigation safer, thus reducing the likelihood
of a maritime accident, and also provides information to mitigate the damages from a spill, should one
occur.
PORTS® provides accurate real-time oceanographic information, tailored to the specific needs of the
local community. PORTS® systems come in a variety of sizes and configurations, each specifically
designed to meet local user requirements. The largest of NOS's existing PORTS® installations is
comprised of over 50 separate instruments; the smallest consists of a single water-level gauge and
associated meteorological instruments (e.g., winds, barometric pressure, etc.). Regardless of its size,
each PORTS® installation provides information that allows mariners to maintain an adequate margin of
safety for the increasingly large vessels visiting U.S. ports, while allowing port operators to maximize port
throughput.
PORTS® has the potential to save the maritime insurance industry from multi-million dollar claims
resulting from shipping accidents. PORTS® is accessible to maritime users in a variety of user-friendly
formats, including telephone voice response and Internet. PORTS® also provides forecasts via numerical
circulation models. Telephone voice access to accurate real-time water-level information allows U.S. port
authorities and maritime shippers to make sound decisions regarding loading of tonnage (based on
available bottom clearance), maximizing loads, and limiting passage times without compromising safety.
PORTS provides data for Northern New Jersey (New York and New Jersey Harbor) and for the Southern
portion of the state (Delaware River and Bay).
Natural Currents Energy Services, LLC
29
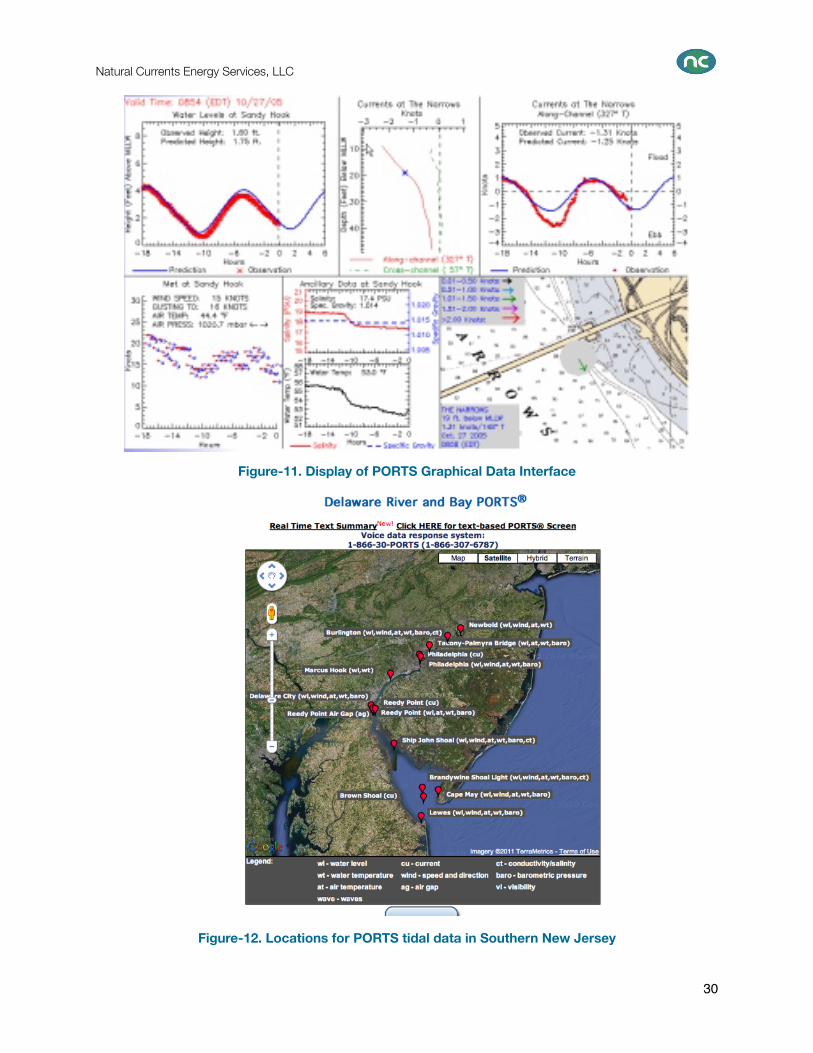
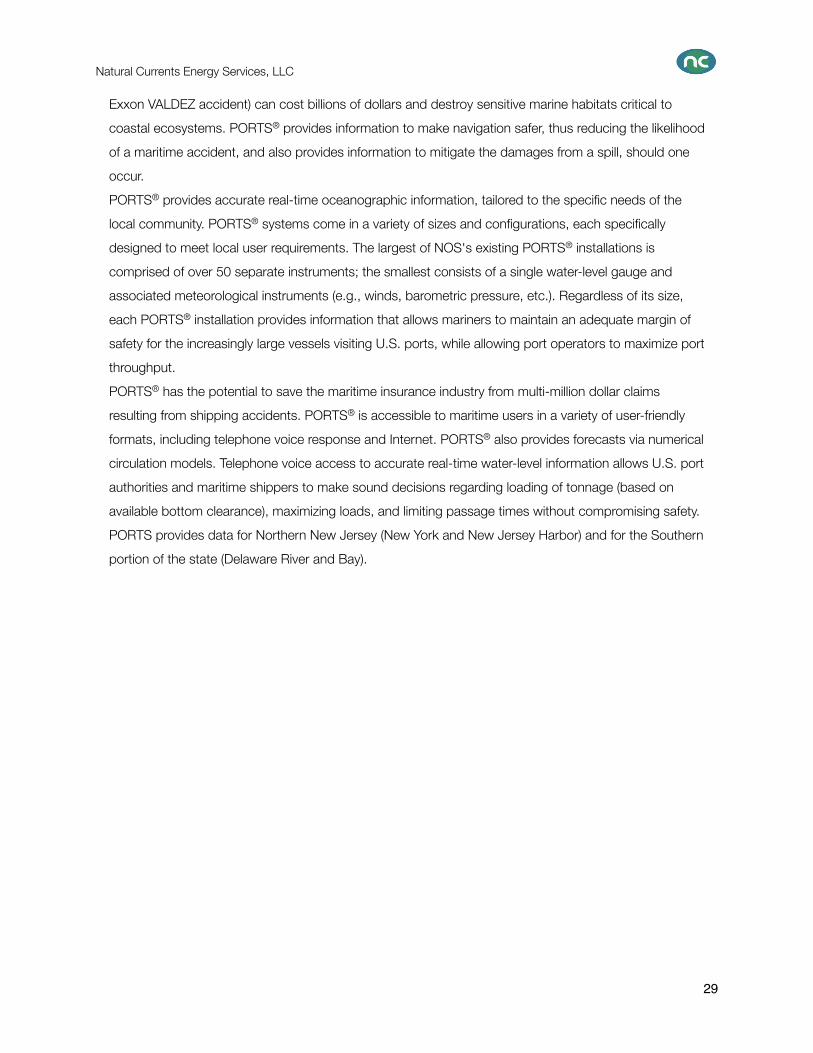
Figure-11. Display of PORTS Graphical Data Interface
Figure-12. Locations for PORTS tidal data in Southern New Jersey
Natural Currents Energy Services, LLC
30
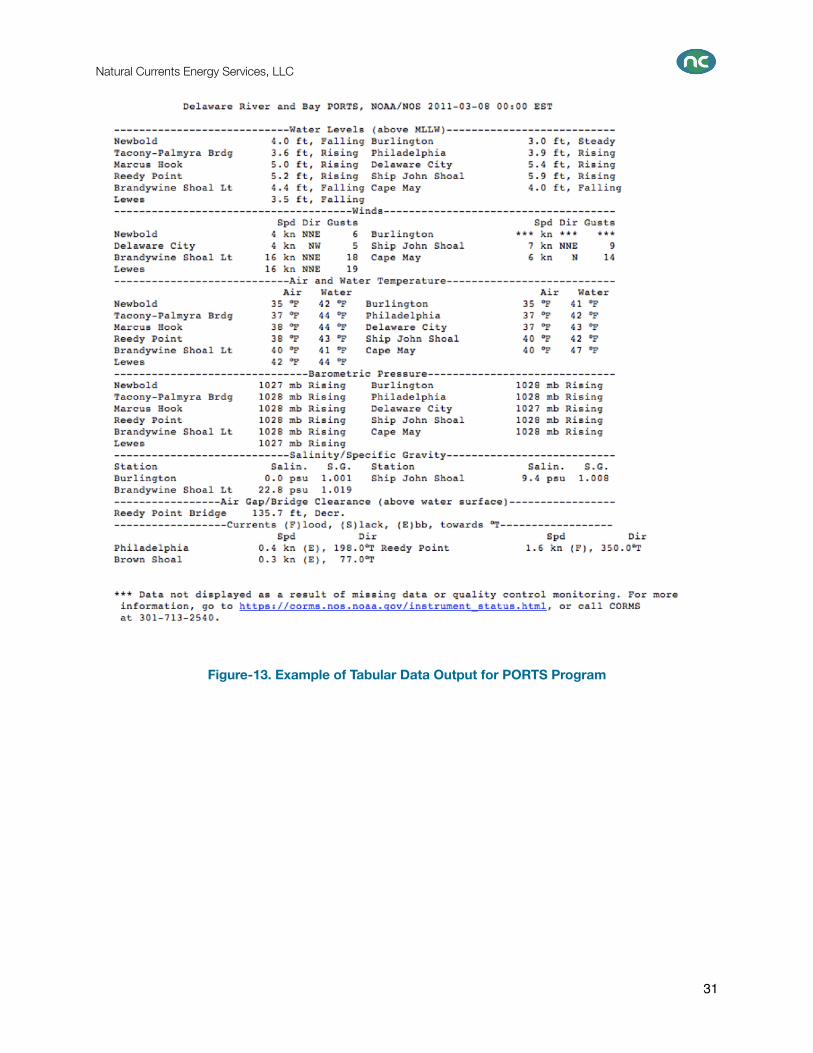
Figure-13. Example of Tabular Data Output for PORTS Program
Natural Currents Energy Services, LLC
31
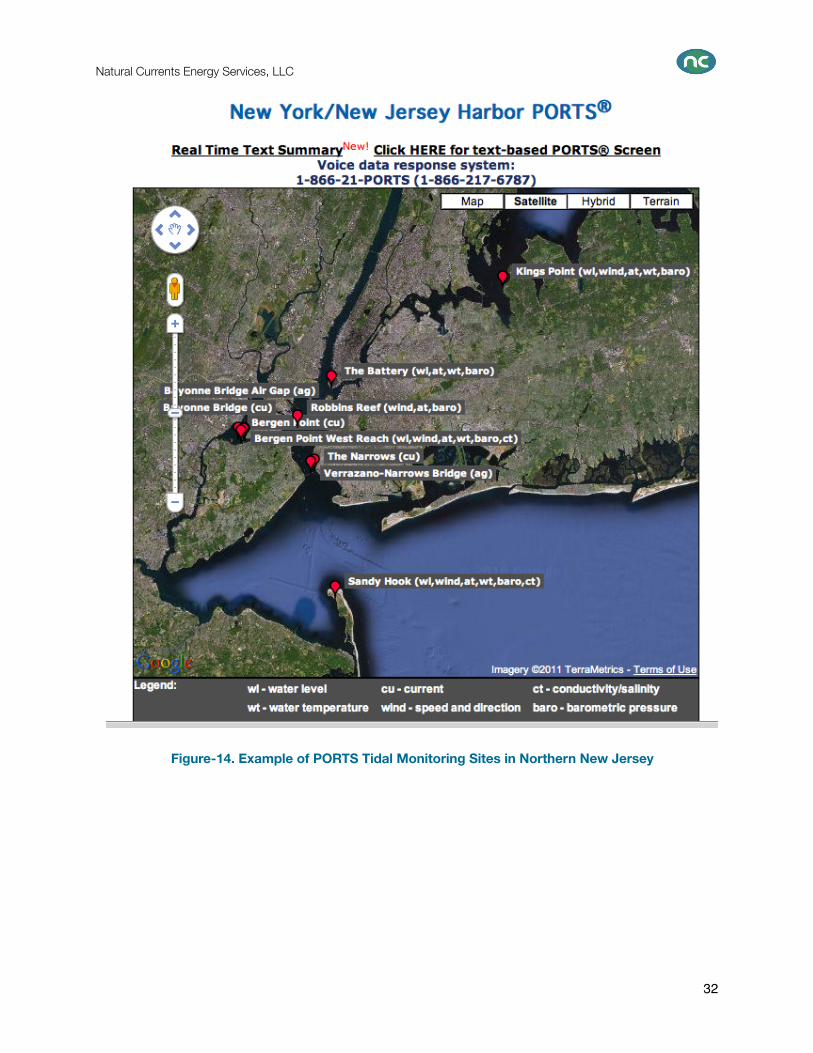
Figure-14. Example of PORTS Tidal Monitoring Sites in Northern New Jersey
Natural Currents Energy Services, LLC
32
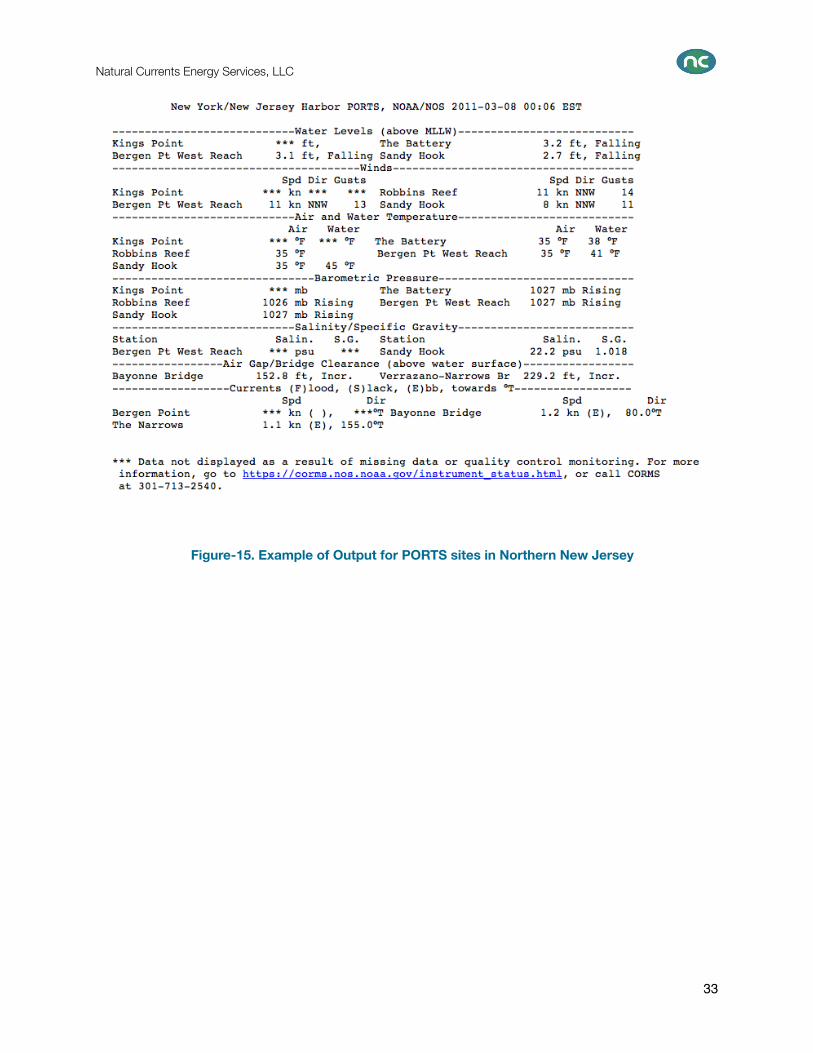
Figure-15. Example of Output for PORTS sites in Northern New Jersey
Natural Currents Energy Services, LLC
33
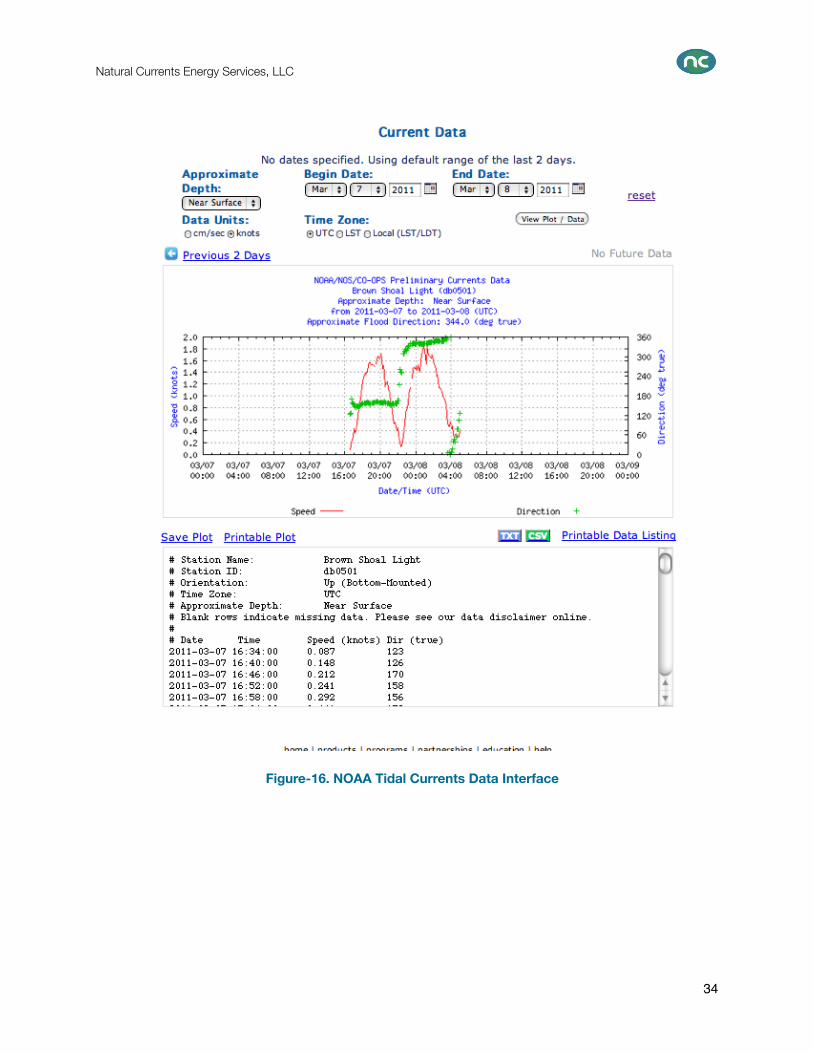
Figure-16. NOAA Tidal Currents Data Interface
Natural Currents Energy Services, LLC
34
7. NOAA 2011 Tidal Current Predictions
This system will allow you to obtain tidal current predictions computed by CO-OPS for more than 2,700
tidal current locations along the U.S. coastline. The publication of full daily predictions is limited to a
select number of "reference stations." The remaining stations are referred to as "subordinate stations."
Tidal predictions for subordinate stations are be obtained by applying specific differences to the times
and speeds of the predicted tidal currents for the specified reference stations.
These pages provide a listing of the 2,700 plus reference stations and subordinate stations. Selecting the
"predictions" link beside a station listing will provide tidal current predictions for the location with the
differences already applied.
Unlike tide stations, which are normally located along the shoreline, most tidal current stations are located
offshore in channels, rivers, and bays. Tidal current stations are often named for the channel, river, or bay
in which they are located or for a nearby navigational reference point. A map or some personal
knowledge of the area may be necessary to help identify stations in the area you are interested in.
The list of subordinate stations has been broken down into states and other areas where tidal current
stations are located. Each state is further broken down into regions. Each region presents a list of the
tidal current stations in the area. The stations are listed geographically; thus, stations that are near each
other along the shoreline appear together in the listing. This assists the user in locating a station of
interest.
Depth of stations: Although current measurements may have been recorded at various depths in the
past, the data listed for many subordinate stations are mean values determined to have been
representative of the current at each location. For that reason, no specific current meter depths for those
stations are listed. Beginning with the Boston Harbor tidal current survey in 1971, data for individual
meter depths were published and subsequent data will be presented in a similar manner. Most historic
tidal current data is collected from meters suspended from survey vessels or anchored buoys, the listed
depths for these stations are those measured downward from the surface. More recent tidal current data
are collected from meters anchored at fixed depths from the bottom, the listed depths for these stations
are defined as depth below chart datum and will be accompanied by the small letter "d". All depths listed
are in units of feet.
Bookmarks may be created to the daily predictions for specific stations using the URL listed when the
predictions are displayed. However, that link will only provide access to the predictions for the year
available when the bookmark was created. Each successive year of predictions will use a different URL
address, and thus any bookmarks must be updated to access each new year of predictions.
Natural Currents Energy Services, LLC
35
Natural Currents Energy Services, LLC
36
Natural Currents Energy Services, LLC
37
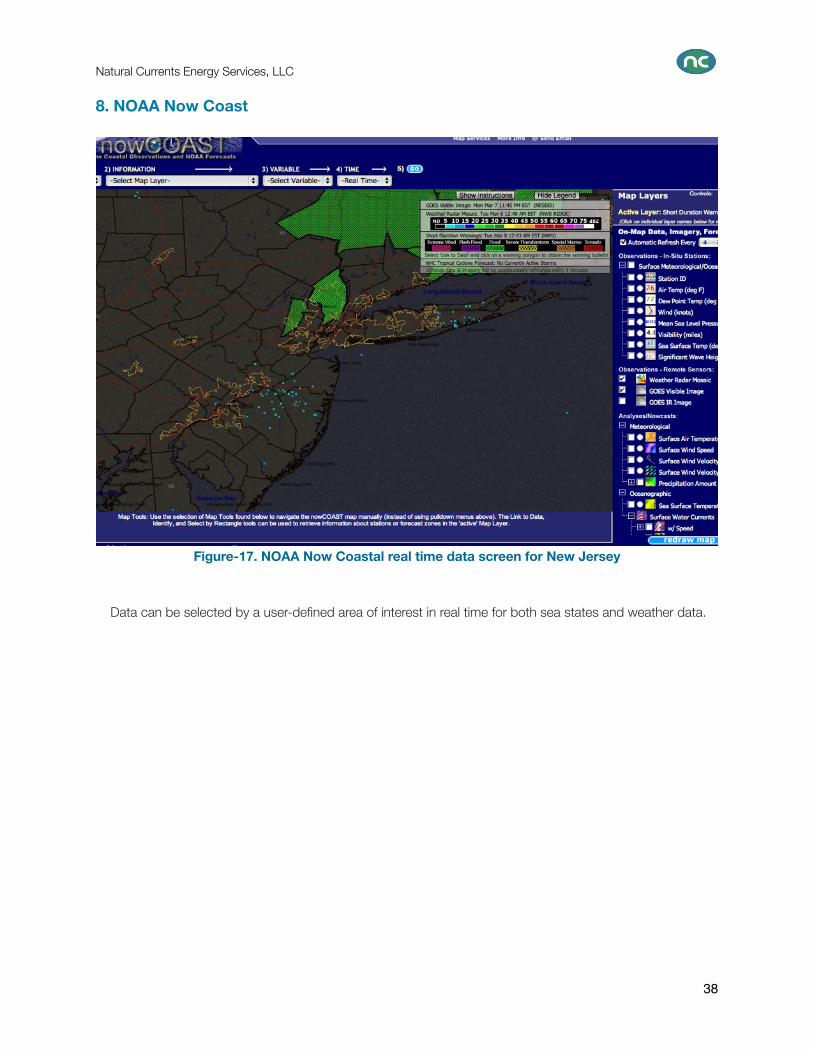
8. NOAA Now Coast
Figure-17. NOAA Now Coastal real time data screen for New Jersey
Data can be selected by a user-defined area of interest in real time for both sea states and weather data.
Natural Currents Energy Services, LLC
38
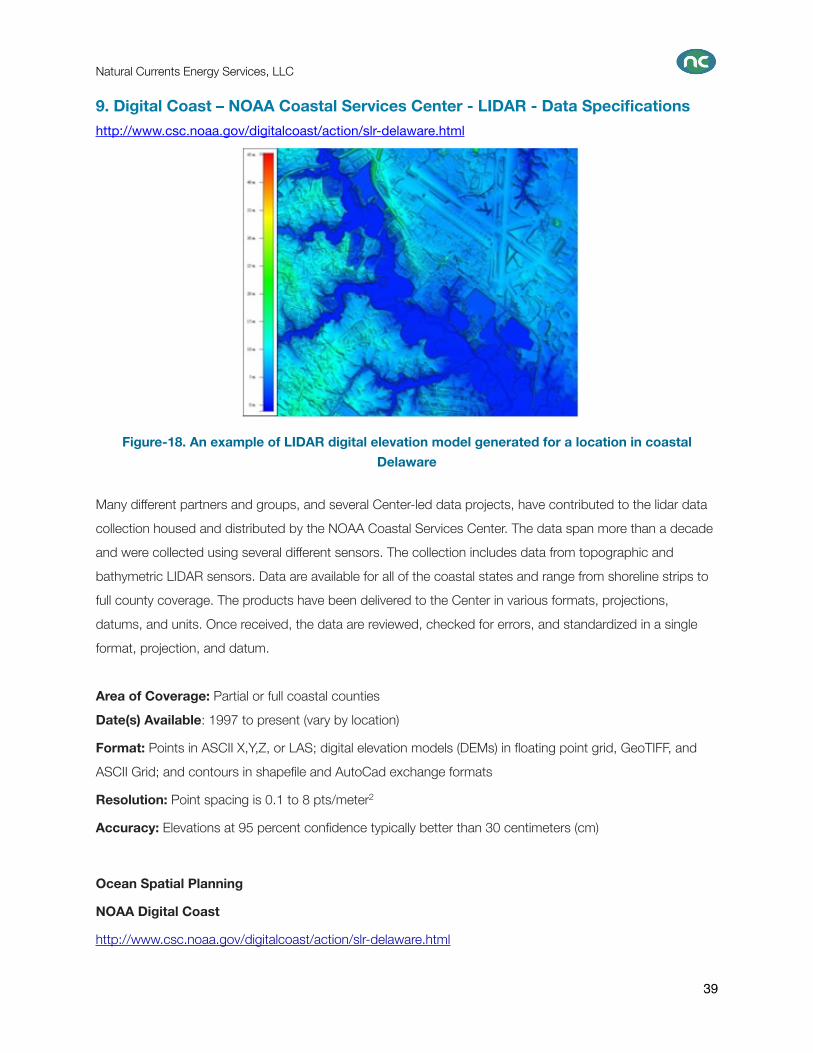
9. Digital Coast – NOAA Coastal Services Center - LIDAR - Data Specifications
http://www.csc.noaa.gov/digitalcoast/action/slr-delaware.html
Figure-18. An example of LIDAR digital elevation model generated for a location in coastal
Delaware
Many different partners and groups, and several Center-led data projects, have contributed to the lidar data
collection housed and distributed by the NOAA Coastal Services Center. The data span more than a decade
and were collected using several different sensors. The collection includes data from topographic and
bathymetric LIDAR sensors. Data are available for all of the coastal states and range from shoreline strips to
full county coverage. The products have been delivered to the Center in various formats, projections,
datums, and units. Once received, the data are reviewed, checked for errors, and standardized in a single
format, projection, and datum.
Area of Coverage: Partial or full coastal counties
Date(s) Available: 1997 to present (vary by location)
Format: Points in ASCII X,Y,Z, or LAS; digital elevation models (DEMs) in floating point grid, GeoTIFF, and
ASCII Grid; and contours in shapefile and AutoCad exchange formats
Resolution: Point spacing is 0.1 to 8 pts/meter2
Accuracy: Elevations at 95 percent confidence typically better than 30 centimeters (cm)
Ocean Spatial Planning
NOAA Digital Coast
http://www.csc.noaa.gov/digitalcoast/action/slr-delaware.html
Natural Currents Energy Services, LLC
39
SummaryBasic terminology that defines tidal states and flow conditions are presented in the introduction. Nine types
of tide data tables, graphics, interactive Internet services and software that provide both historical and real
time tidal and water current data are presented in support of tasks required for NJDOT 2010-15 Potential
Tidal Power for New Jersey.
Historical data and real time data have various applications to the NJDOT 2010-15 Project and may prove
useful in both the computer model verification and the identification of the best sites for tidal energy
development.
Depending on the particular application of choice, tabular or graphic presentations may be most helpful for a
particular use or site location covered in the scope of a particular service or system of tidal flow reference.
The key point in all applications is that they are of coarse granularity and not detailed enough to provide the
necessary information to either calibrate a high-resolution computer model of the tides or provide conclusive
information about the site location of a tidal energy plant.
Careful review and comparison of the available data presented in these models can yield helpful indications
of areas for further study and detailed field site assessments.
Natural Currents Energy Services, LLC
40

References:
1. www.lobstermanspage.net. About Tides.
2. www.tidesandcurrents.noaa.gov/curr_pred.html
3. www.mobilegeographics.com/tides/
4. www.mrtides.com
5. www.tidesandcurrents.noaa.gov/PORTS/html
6. www.tidesandcurrents.noaa.gov/
7. www.nowcoast.noaa.gov
8. www.csc.noaa.gov/digitalcoast/data/coastallidar/download.html
9. NOAA’s Coastal and Marine Spatial Planning (CMSP)
Natural Currents Energy Services, LLC
41
Natural Currents Energy Services, LLC
42

Natural Currents Energy Services, LLC
43