State of New Jersey Regional Haze/Regiona… · · 2009-11-17State of New Jersey Department of...
97
State of New Jersey Department of Environmental Protection State Implementation Plan (SIP) For Regional Haze Final July 2009
Transcript of State of New Jersey Regional Haze/Regiona… · · 2009-11-17State of New Jersey Department of...

State of New Jersey Department of Environmental Protection
State Implementation Plan (SIP) For Regional Haze
Final
July 2009

Preface Pursuant to the requirements of 42 U.S.C. § 7491 (Sections 169 and 169A of the Clean Air Act) and the Federal Regional Haze Rules at 40 C.F.R. § 51.308, New Jersey is finalizing a revision to the New Jersey State Implementation Plan to address the requirements for improving visibility in the mandatory Class I Federal areas, including the Brigantine Wilderness Area of the Edwin B. Forsythe National Wildlife Refuge. Elements of this State Implementation Plan address the Federal requirements pursuant to 40 C.F.R. § 51.308(d) and the Best Available Retrofit Technology components of 40 C.F.R. 51.308(e). In addition, this State Implementation Plan addresses Regional Planning, State and Federal Land Manager coordination, and contains a commitment to provide State Implementation Plan revisions and adequacy determinations in the future as required by 40 C.F.R. § 51.308 (f) and (g), which require the State to submit periodic implementation plan upgrades and progress reports. This document outlines New Jersey’s long-term plan for dealing with visibility-impairing air pollution within its borders and from out-of-state sources that transport emissions to New Jersey’s Federal Clean Air Act defined Class I area.
Acknowledgments The New Jersey Department of Environmental Protection acknowledges the efforts and assistance of the many agencies and individuals whose contributions were instrumental in the preparation of this State Implementation Plan Revision. In particular, the New Jersey Department of Environmental Protection wishes to acknowledge the many individuals within the United States Department of the Interior, Fish and Wildlife Service, in particular the staff and management of the Brigantine Wilderness Area and the Air Quality Branch; the United States Environmental Protection Agency, Region 2; the Mid-Atlantic/Northeast Visibility Union; the Northeast States for Coordinated Air Use Management; and the Mid-Atlantic Regional Air Management Association; as well as staff within the New Jersey Department of Environmental Protection for their assistance and guidance.
ii
Table of Contents Preface ........................................................................................................................................ ii Acknowledgments........................................................................................................................... ii Table of Contents........................................................................................................................... iii List of Tables ................................................................................................................................. vi List of Figures ............................................................................................................................... vii List of Appendices ....................................................................................................................... viii Acronyms and Abbreviations ......................................................................................................... x Executive Summary ..................................................................................................................... xiv 1.0 BACKGROUND AND OVERVIEW OF THE REGIONAL HAZE REGULATIONS ......................................................................................................... 1-1 1.1 Introduction ................................................................................................................. 1-1 1.2 Description of the Brigantine Wilderness Area .......................................................... 1-2 1.3 Regional Haze in the Brigantine Wilderness Area...................................................... 1-3 1.4 The Regional Haze Visibility Equation....................................................................... 1-6 2.0 GENERAL PLANNING PROVISIONS .................................................................... 2-1 2.1 Regional Planning ....................................................................................................... 2-1 2.2 State and Federal Land Manager Coordination........................................................... 2-2 3.0 ASSESSMENT OF BASELINE AND NATURAL CONDITIONS WITHIN THE BRIGANTINE WILDERNESS AREA.............................................................. 3-1 3.1 Requirement, Data and Methods Used........................................................................ 3-1 3.2 Baseline and Natural Visibility at the Brigantine Wilderness Area............................ 3-1 3.3 Visibility Trends at the Brigantine Wilderness Area .................................................. 3-2 4.0 MONITORING STRATEGY FOR VISIBILITY IMPAIRMENT IN THE
BRIGANTINE WILDERNESS AREA ...................................................................... 4-1 4.1 Introduction ................................................................................................................. 4-1 4.2 Monitoring Information and Strategy for the Brigantine Wilderness Class I Area .... 4-1 5.0 EMISSION INVENTORY.......................................................................................... 5-1 5.1 Regional Emission Inventory Development................................................................ 5-1 5.1.1 Regional Emission Inventory Pollutants and Sectors.................................................. 5-3 5.2 Regional Emission Inventory Summary...................................................................... 5-3 5.2.1 Sulfur Dioxide (SO2) ................................................................................................... 5-3 5.2.2 Volatile Organic Compounds (VOC).......................................................................... 5-6 5.2.3 Oxides of Nitrogen ...................................................................................................... 5-8 5.2.4 Primary Particulate Matter (PM10 and PM2.5) ........................................................... 5-10 5.2.5 Ammonia Emissions (NH3)....................................................................................... 5-13 5.3 Source Retirement and Replacement Schedules ....................................................... 5-16 6.0 BEST AVAILABLE RETROFIT TECHNOLOGY (BART)..................................... 6-1 6.1 Introduction ................................................................................................................. 6-1
iii
6.2 Description of BART-Eligible Sources in the State of New Jersey............................ 6-2 6.3 Determination of BART Requirements for Identified BART-Eligible Sources and Analysis of the Best System of Control for Each Source .................................... 6-3 6.4 Analysis of Visibility Improvement Achievable from all BART Sources in the Region ............................................................................................................... 6-6 7.0 CONTRIBUTION ASSESSMENT OF STATES CAUSING OR
CONTRIBUTING TO VISIBILITY IMPAIRMENT IN THE BRIGANTINE WILDERNESS AREA................................................................................................ 7-1
7.1 Introduction ................................................................................................................. 7-1 7.2 Contribution Assessment............................................................................................. 7-1 7.3 Contribution Assessments Based on Emissions Inventories ....................................... 7-2 7.3.1 Sulfur Dioxide Emissions Divided by Distance.......................................................... 7-2 7.3.2 Emissions times Upwind Probability .......................................................................... 7-4 7.4 Contribution Assessments Based on Dispersion Models ............................................ 7-7 7.5 Contribution Assessments Based on Grid Models ...................................................... 7-8 7.5.1 Model Performance Evaluation …………………………………………………….7-10 7.6 Identification of States that Contribute to Visibility Impairment at the Brigantine
Wilderness Area ........................................................................................................ 7-10 7.7 Notification................................................................................................................ 7-11 7.8 New Jersey’s Contribution to Other Class I Areas.................................................... 7-12 8.0 REASONABLE PROGRESS GOALS AND LONG TERM STRATEGY ............... 8-1 8.1 Introduction ................................................................................................................. 8-1 8.2 Brigantine Wilderness Area Visibility Goal ............................................................... 8-1 8.3 The Process.................................................................................................................. 8-1 8.3.1 Identifying Reasonable Controls and the Four Factor Analysis.................................. 8-2 8.3.2 Consultation................................................................................................................. 8-3 8.3.3 “Asks” ......................................................................................................................... 8-4 8.4 Reasonable Measures for Brigantine – Regional Measures ........................................ 8-5 8.4.1 MANE-VU States........................................................................................................ 8-6 8.4.2 Areas outside MANE-VU ........................................................................................... 8-7 8.5 Reasonable Progress Goal for Brigantine Wilderness Area........................................ 8-8 8.6 CAIR Vacatur……………………………………………………………………….8-10 8.7 Baseline Inventory and Projections........................................................................... 8-11 8.8 Model Performance Evaluation……………………………………………………..8-11 9.0 NEW JERSEY ACTIONS .......................................................................................... 9-1 9.1 BART .......................................................................................................................... 9-1 9.2 EGU Strategy .............................................................................................................. 9-1 9.3 Low-Sulfur Fuel Oil Strategy...................................................................................... 9-2 9.4 Energy Efficiency........................................................................................................ 9-2 9.5 Additional Class I State Required Measures............................................................... 9-2 9.5.1 Measures to Mitigate the Impacts from Construction Activities ................................ 9-3 9.5.2 Fugitive Dust ............................................................................................................... 9-4 9.5.3 Agricultural and Forestry Smoke Management……………………………………...9-4
iv

9.5.3.1 Open burning............................................................................................................... 9-4 9.5.3.2 Prescribed Burning ...................................................................................................... 9-5 9.5.3.3 Agricultural Management Burning ............................................................................. 9-6 9.6 Residential Wood Burning Strategies ......................................................................... 9-6 9.7 Measures to Reduce Organic Carbon Emissions……………………………………..9-6 10.0 COMMITMENTS ..................................................................................................... 10-1 10.1 Control Measure Commitments ................................................................................ 10-1 10.2 Other Commitments .................................................................................................. 10-3 10.2.1 Visibility.................................................................................................................... 10-3 10.2.2 Consultation with Federal Land Managers ............................................................... 10-4 10.2.3 Monitoring................................................................................................................. 10-4 10.2.4 Emission Inventory………………………………………………………………… 10-4 10.2.5 Comprehensive Periodic Implementation Plan Revisions........................................ 10-4 10.2.6 State Requests of USEPA......................................................................................... 10-4 10.2.6.1 IMPROVE Network ................................................................................................. 10-4 10.2.6.2 New Jersey’s Reliance on Other State Actions for Reaching Reasonable Progress Goal ........................................................................................................... 10-4 10.2.6.3 Federal Funding to Support Regional Haze Efforts and the Regional Organizations............................................................................................................. 10-5 10.2.6.4 Federal Requirement to Obtain Additional Air Pollution Reductions from EGUs, Industrial/Commercial/Institutional (ICI) Boilers and Other Major Sources……….10-5 10.3 Commitments for Mid-Course Review….…………………………………………..10-5 11.0 PUBLIC PARTICIPATION...................................................................................... 11-1
v

List of Tables Table 2.1: Mid-Atlantic/Northeast Visibility Union Members* (MANE-VU) ....................... 2-1 Table 3.1: Visibility Information for the Brigantine Wilderness Area .................................... 3-2 Table 6.1: BART-Eligible Facilities in the State of New Jersey……………………………..6-3 Table 6.2: Anticipated Schedule for BART Determinations………….……………………...6-6 Table 7.1: 2002 SO2 Emissions over Distance Impact (ug/m3) ............................................... 7-3 Table 7.2: 2002 SO2 Upwind Probability ................................................................................ 7-6 Table 7.3: State Invited to Consult on Establishing New Jersey's Class I Area 2018 Reasonable Progress Goal..……………………………………………………….7-12 Table 8.1: Visibility Goals for the Brigantine Wilderness Area……………………………....8-1 Table 8.2: Reasonable Measures for MANE-VU States ("Asks" Within MANE-VU) ………8-6
Table 8.3: Reasonable Measures for non-MANE-VU States ("Asks" Outside MANE-VU)....8-7
Table 8.4: Reasonable Progress Goals for the Brigantine Wilderness Area………………… .8-9 Table 10.1: Regional Haze State Control Measure Commitments……...………….…………10-1 Table 10.2: Additional State Control Measures that Support Regional Haze Goals……...…..10-2 Table 10.3: Potential Future State Control Measures or Programs that Support Regional Haze
Goals……………………………………………………………………………...10-3
vi

List of Figures Figure 1.1 Map of Brigantine Wilderness Area...................................................................... 1-2 Figure 1.2 Pictures from Brigantine Wilderness Area............................................................ 1-3 Figure 1.3 Schematic of Visibililty Impairment Due to Light Scattering and Absorption..... 1-4 Figure 1.4 Brigantine Wilderness Area on a Clear Day ......................................................... 1-5 Figure 1.5 Brigantine Wilderness Area on a Hazy Day ......................................................... 1-5 Figure 2.1 Regional Planning Organizations for Regional Haze............................................ 2-2 Figure 3.1 Trends in Visibility Levels at the Brigantine Wilderness Area 1993 to 2005 ...... 3-3 Figure 4.1 The IMPROVE Monitor at the Brigantine Wilderness Area – BRIGI ................. 4-2 Figure 5.1 MANE-VU State Level Sulfur Dioxide Emissions............................................... 5-3 Figure 5.2 2002 Annual SO2 Emissions ................................................................................. 5-4 Figure 5.3 2018 Annual SO2 Emissions ................................................................................. 5-4 Figure 5.4 MANE-VU State Level VOC Emissions .............................................................. 5-5 Figure 5.5 2002 Annual VOC Emissions .............................................................................. 5-6 Figure 5.6 2018 Annual VOC Emissions .............................................................................. 5-6 Figure 5.7 MANE-VU State Level Nitrogen Oxide Emissions.............................................. 5-7 Figure 5.8 2002 Annual NOX Emissions ................................................................................ 5-8 Figure 5.9 2018 Annual NOx Emissions ................................................................................. 5-8 Figure 5.10 MANE-VU State Level Primary PM10 Emissions ................................................ 5-9 Figure 5.11 MANE-VU State Level Primary PM2.5 Emissions................................................ 5-9 Figure 5.12 2002 Annual Primary PM10 Emission ................................................................. 5-10 Figure 5.13 2002 Annual Primary PM2.5 Emissions............................................................... 5-11 Figure 5.14 2018 Annual Primary PM10 Emissions................................................................ 5-11 Figure 5.15 2018 Annual Primary PM2.5 Emissions............................................................... 5-12 Figure 5.16 MANE-VU State Level Ammonia Emissions .................................................... 5-13 Figure 5.17 2002 Annual NH3 Emissions............................................................................... 5-14 Figure 5.18 2018 Annual NH3 Emissions............................................................................... 5-14 Figure 7.1 Role of Sulfate in Visibility Impairment at Brigantine Wilderness Area ............. 7-1 Figure 7.2 Cumulative Sulfate Contributions to the Brigantine Wilderness Area Based on Emission Divided by Distance (Q/d) Results…………………………………….7-4 Figure 7.3 Cumulative Sulfate Contributions to the Brigantine Wilderness Area Based on Emissions times Upwind Probability (E x UP) Results ........................................ 7-6 Figure 7.4 Modeled 2002 Contributions to Sulfate by State at Brigantine............................. 7-7 Figure 7.5 Modeled 2002 Contributions to Sulfate by State at Brigantine………………….7-8 Figure 7.6 States Identified as Contributing to Visibility Impairment in New Jersey's Class I Area ……………………………………………………………………..7- 0 Figure 8.1 Projected Visibility Improvement at Brigantine Wilderness Area Based on Best and Final Modeling ........................................................... …………….. 8-9
vii

List of Appendices Appendix A: Background and History of the Regional Haze Rule and the Clean Air Act Amendments Appendix B: Overview of MANE-VU Roles and Responsibilities Appendix C*: Documentation of Consultations Within and Outside MANE-VU Appendix C-1*: Summary of Consultations Between the MANE-VU States Appendix C-2*: MANE-VU Inter RPO Consultation Briefing Book Appendix C-3*: Inter-RPO State/Tribal and FLM Consultation Framework Appendix D*: MANE-VU Statements and Principles Appendix D-1*: Statement of the Mid-Atlantic/Northeast Visibility Union (MANE-VU) Concerning a Course of Action within MANE-VU toward Assuring
Reasonable Progress Appendix D-2*: Statement of the Mid-Atlantic/Northeast Visibility Union (MANE-VU) Concerning a Request for a Course of Action by States Outside of MANE- VU toward Assuring Reasonable Progress Appendix D-3*: Statement of the Mid-Atlantic/Northeast-Visibility Union (MANE-VU)
Concerning a Course of Action by the United States Environmental Protection Agency (USEPA) toward Assuring Reasonable Progress
Appendix D-4*: MANE-VU Final Interim Principles for Regional Planning Appendix E*: Baseline and Natural Background Visibility Conditions – Considerations and Proposed Approach to the Calculation of Baseline and Natural Background Visibility Conditions at MANE-VU Class I Areas
NESCAUM, December 2006) Appendix F*: Emission Inventory Appendix F-1*: Technical Support Documentation for 2002 MANE-VU SIP Modeling Inventories, Version 3 (E. H. Pechan & Associates, Inc., November 2006) Appendix F-2*: Development of Emission Projections for 2009, 2012, and 2018 for Non- EGU Point, Area, and Nonroad Sources in the MANE-VU Region (MACTEC, February 2007) Appendix F-3*: Identification and Evaluation of Candidate Control Measures. OTC Final
Technical Support Document (MACTEC, February 28, 2007) Appendix G*: BART Documentation Appendix G-1*: Regional Haze Regulations; Final Rule (July 1, 1999) Appendix G-2*: Regional Haze Regulations and Guidelines for Best Available Retrofit
Technology (BART) Determinations; Final Rule (July 6, 2005) Appendix G-3*: Regional Haze Regulations; Revisions to Provisions Governing Alternative to Source-Specific Best Available Retrofit Technology (BART)
Determinations; Final Rule (October 13, 2006) Appendix G-4*: Five-Factor Analysis of BART-Eligible Sources: Survey of Options for
Conducting BART Determinations (June 2007) Appendix G-5*: New Jersey Letters to BART Facilities dated November 1, 2006 Appendix G-6: Responses to New Jersey Letters to BART Facilities dated November 1,
2006
*Note: These appendices and attachments are only available electronically
viii

Appendix G-7*: New Jersey Letters to BART Facilities dated March 3, 2009 Appendix G-8: Responses to New Jersey Letters to BART Facilities dated March 3, 2009 Appendix G-9*: PSEG Fossil LLC. Consent Decree Appendix G-10*: PSEG Fossil LLC. Amendment to 2002 Consent Decree Fact Sheet (USEPA, November 2006) Appendix G-11*: PSEG Fossil LLC. Amended Consent Decree Appendix G-12*: Coastal Eagle Point (Sunoco) Consent Decree Appendix G-13*: Coastal Eagle Point (Sunoco) Amended Consent Decree Appendix G-14*: Conoco Phillips Consent Decree Appendix G-15*: Conoco Phillips Company Notice of Lodging of First Amendment to
Consent Decree Appendix H*: MANE-VU Contribution Assessment Appendix H-1*: Contribution to Regional Haze in the Northeast and Mid-Atlantic United
States (NESCAUM, August 2006) (aka MANE-VU Contribution Assessment Report)
Appendix H-1*: Attachment 1: Appendix A: Application of Trajectory Analysis Methods to Sulfate Source Attribution Studies in the Northeast United States
Appendix H-1*: Attachment 2: Appendix A – Brigantine Supplement: Trajectory Analysis Results at Brigantine
Appendix H-1*: Attachment 3: Appendix A – New York City Supplement: Trajectory Analysis Results at Queens College, New York City Appendix H-1*: Attachment 4: Appendix A – Multiple Site Averages Supplement: Trajectory Analysis Results at Multiple Sites Appendix H-1*: Attachment 5: Appendix B: Source Attribution by Receptor-Based Methods Appendix H-1*: Attachment 6: Appendix C: Chemical Transport Model Results for Sulfate
Source Attribution Studies in the Northeast United States – Model Description and Performance Evaluation
Appendix H-1*: Attachment 7: Appendix D: Development of Parallel CALPUFF Dispersion Modeling Platforms for Sulfate Source Attribution Studies in the Northeast
United States Appendix I*: Letters of contribution Sent by New Jersey and Responses from States Appendix I-1*: New Jersey Letters to States Appendix I-2*: New Jersey Responses from States Appendix J*: Visibility Modeling Analysis Appendix J-1*: 2018 Visibility Projections (NESCAUM, May 2008) Appendix J-2*: Documentation of 2018 Emissions from Electric Generating Units in the
United States for MANE-VU’s Regional Haze Modeling (Alpine Geophysics LLC, April 2008) (aka Alpine Report)
Appendix K*: Comments on MANE-VU Final Modeling Appendix L*: Top 167 EGU Units in the Eastern United States – Developed by MANE- VU Appendix M: Control Measure Descriptions *Note: These appendices and attachments are only available electronically
ix
Appendix N*: Reference Documentation Appendix N-1*: Assessment of Reasonable Progress for Regional Haze in MANE-VU Class
I Areas (MACTEC, July 2007) (aka the Reasonable Progress Report) Appendix N-2*: MANE-VU Modeling for Reasonable Progress Goals: Model Performance Evaluation, Pollution Apportionment, and Control Measure Benefits (NESCAUM, February 2008) Appendix O: Public Participation Appendix O-1: Notice of Availability Appendix O-2: Documentation of the Notices that Appeared in the Newspapers and the
New Jersey Register Appendix O-3: Response to Comment Document
*Note: These appendices and attachments are only available electronically
x

Acronyms and Abbreviations µg/m3 Micrograms per cubic meter AL Alabama APA Administrative Procedures Act APCA Air Pollution Control Act AR Arkansas BART Best Available Retrofit Technology BC British Columbia BOTW Beyond on the Way CAIR Clean Air Interstate Rule CARB California Air Resources Board CENRAP Central Regional Air Planning Association CERR Consolidated Emissions Reporting Rule C.F.R. Code of Federal Regulations CMAQ Congestion Mitigation and Air Quality CMU Carnegie Mellon University CO Carbon monoxide CT Connecticut DE Delaware DC District of Columbia dv Deciview EGU Electric Generating Unit FLM Federal Land Manager GA Georgia HEDD High Electrical Demand Day HYSPLIT Hybrid Single-Particle Lagrangian Integrated Trajectory ICI Industrial/Commercial/Institutional I/M Inspection and Maintenance IMPROVE Interagency Monitoring of Protected Visual Environments IN Indiana IPM Integrated Planning Model KY Kentucky LEV Low Emission Vehicle MA Massachusetts MACT Maximum Available Control Technology MANE-VU Mid-Atlantic/Northeast Visibility Union MARAMA Mid-Atlantic Regional Air Management Association MD Maryland ME Maine MI Michigan MM5 Mesoscale Meteorological Model MN Minnesota MO Missouri MS Mississippi MW Megawatt
xi

MWRPO Midwest Regional Planning Organization NAAQS National Ambient Air Quality Standards NC North Carolina ND North Dakota NE Nebraska NEI National Emissions Inventory NESCAUM Northeast States for Coordinated Air Use Management NH New Hampshire NH3 Ammonia NJ New Jersey N.J.A.C. New Jersey Administrative Code NJDEP New Jersey Department of Environmental Protection N.J.S.A. New Jersey Statutes Annotated NLEV National Low Emission Vehicle Program NOAA National Oceanic and Atmospheric Administration NO2 Nitrogen dioxide NOx Oxides of Nitrogen NOy Total reactive nitrogen NSPS New Source Performance Standard NTE Not-To-Exceed NWS National Weather Service NY New York OH Ohio ORVR Onboard Refueling Vapor Recovery OTB On the Books OTC Ozone Transport Commission OTW On the Way PA Pennsylvania PM Particulate Matter PM2.5 Fine Particulate Matter (particles with an aerodynamic diameter less than or equal
to a nominal 2.5 micrometers) PM10 Particles with an aerodynamic diameter less than or equal to a nominal 10
micrometers ppm Parts per million PSEG Public Service Enterprise Group RACT Reasonably Available Control Technology REMSAD Regulatory Modeling System for Aerosols and Deposition RI Rhode Island RPG Reasonable Progress Goal RPO Regional Planning Organization SC South Carolina SD South Dakota SIP State Implementation Plan SO2 Sulfur Dioxide SO4 Sulfate SOx Oxides of Sulfur
xii

SOA Secondary organic aerosol TN Tennessee TX Texas USEPA United States Environmental Protection Agency U.S.C. United States Code VA Virginia VISTAS Visibility Improvement State and Tribal Association of the Southeast VOC Volatile Organic Compound VT Vermont WI Wisconsin WRAP Western Regional Air Partnership WV West Virginia
xiii

Executive Summary This revision to the State Implementation Plan (SIP) is New Jersey’s first step to address visibility impairment and meet the Federal Clean Air Act requirement to reach natural visibility conditions at the Brigantine Wilderness Area in New Jersey by 2064. This plan establishes the baseline and natural visibility conditions, identifies the states which contribute to visibility impairment at the Brigantine Wilderness Area, and establishes the 2018 Reasonable Progress Goal. This plan also addresses New Jersey’s contribution to visibility impairment in Acadia National Park and Moosehorn Wilderness Area in Maine, Great Gulf Wilderness Area and Presidential Range/Dry River Wilderness Area in New Hampshire, Lyebrook Wilderness Area in Vermont, and the Brigantine Wilderness Area. Facilities in New Jersey which are subject to Best Available Retrofit Technology (BART) are identified, and plans to address determinations and installation of BART are included in this plan. Brigantine Wilderness Area
The Brigantine Wilderness Area in the Edwin B. Forsythe National Wildlife Refuge, in New Jersey, Figure ES.1, is designated as a Federally protected visibility area or Class I area. The Brigantine Wilderness Area, a unique and valuable resource, is the home and stop-over point for migratory birds and water fowl along the eastern coast of our country. Over 290 different species of birds have been observed within the wilderness area. At the peak season for bird migration in early November, concentrations of over 100,000 ducks and geese have been seen in the saltwater marshes of the
refuge. The refuge itself attracts over 300,000 visitors per year who come to watch the birds or enjoy the scenic views of the Atlantic Ocean, Great Bay, Little Bay, Reeds Bay, and Little Egg Harbor area. The exceptional natural character and charm of the Brigantine Wilderness area create an oasis of beauty, Figure ES.2, within the most densely populated state in the nation.
Figure ES.1: Map of Brigantine Wilderness Area
Figure ES.2: Pictures from the Brigantine Wilderness Area
xiv
Visibility at Brigantine Visibility monitoring at the Brigantine Wilderness Area is overseen by the United States Fish and Wildlife Service, and is part of the national Interagency Monitoring of Protected Visual Environments (IMPROVE) network. Table ES-1 presents the baseline visibility conditions, the 2018 progress benchmark, the uniform rate of progress, and the 2064 natural background goal.
Table ES.1: Visibility Information for the Brigantine Wilderness Area
Conditions DeciviewsNatural Background Visibility on 20% of worst visibility days (Goal in 2064) 12.2Average Baseline Visibility on 20% of best visibility days (2000 – 2004) 14.3Average Baseline Visibility on 20% worst visibility days (2000 – 2004) 29.0Uniform Rate of Progress in 2018 on the 20% worst visibility days 25.1
Regional Planning Organizations The USEPA encouraged states to form Regional Planning Organizations (RPOs) and work together to address regional haze, Figure ES.3. New Jersey joined with the mid-atlantic and northeast states to form the Mid-Atlantic – Northeast Visibility Union (MANE-VU). MANE-VU
and other Regional Planning Organizations worked cooperatively to develop many of the materials utilized in this SIP revision. Causes of Visibility Impairment Visibility impairment is caused by many different pollutants. The largest contribution is currently from sulfate, Figure ES.4. For the purposes of the 2018 reasonable progress plan, the SIP focuses on identifying and implementing required measures to reduce sulfate.
New Jersey is also implementing measures to reduce carbon emissions, the second largest contributor to haze.
CenRAPWRAP Midwest
VISTAS
MANE-VU = OTCNESCAUM
MARAMA
Regional Planning Organizations for Regional Haze
Figure ES.3: Regional Planning Organizations for Regional Haze
Figure ES.4: Role of Sulfate in Visibility Impairment at Brigantine Wilderness Area
xv
20% Worst Day Mass [2000-2004]
20% Worst Day Haze [2000-2004]
Nitrate
Soil Coarse Mass
Soil
Elemental Carbon
Elemental Carbon
Coarse Mass
Nitrate
Organic Carbon
Organic Carbon
Sulfate
20% Worst Day Mass [2000-2004]
Sulfate

States Which Contribute to Visibility Impairment Based on a variety of technical methods, New Jersey identified 22 states which contributed to visibility impairment at the Brigantine Wilderness Area, Figure ES.5.
Figure ES.5: States Identified as Contributing to Visibility Impairment in New Jersey’s Class I Area
N ew Je rsey
Illi no is
G e or gi a
M ic hi ga n
K e n tuck y
Te n ne ssee
S ou th C a ro lina
M ic higa n
D e la war eDi st rict of C o lum bia
O hi o
V irg in ia
I nd ia n a
Ne w Y o rk
P en n sy lva ni a
No r th C a ro lin a
W e st V i rg in ia
M a ryla nd
M aine
V er m on t
M a ss ac hu set ts
C on ne ct ic ut
N e w H am p shi re
Rho de Is la nd
Iow a
M is so ur i
A rk a ns as
A la bam a
W is co n si n
Louis ia na
M is si ss ip pi
M inne so ta
K a nsa s
Tex a s
N e br a ska
Sou th D a ko ta
F lo rid a
O k lah o m a
No rth D ak ot a
R eason fo r In clu sionN ot Id entifiedM A N E-V U M e m b erC ontrib u tory to B riga ntin eN ew Jers e y
Maine, New Hampshire and Vermont determined that New Jersey contributed to their Class I areas, Acadia National Park and Moosehorn Wilderness Area, Great Gulf Wilderness Area and Presidential Range/Dry River Wilderness Area, and Lyebrook Wilderness Area, respectively. These states determined that New Jersey contributes to them. Additionally, New Jersey contributes to visibility impairment at the Brigantine Wilderness Area. Reasonable Measures and Reasonable Progress Goal The USEPA regulations set the guidelines for determining the 2018 Reasonable Progress Goal (RPG). This goal is defined by establishing reasonable measures for New Jersey and the other contributing states to implement to reduce emissions. New Jersey worked with the other MANE-VU states to identify potential control measures to reduce sulfate emissions from point and area sources. The State consulted with the other Regional Planning Organizations and the contributing states within MANE-VU regarding the reasonableness of the identified measures. Using input from the consultations, the benefits from the implementation of the identified measures were modeled to project the 2018 visibility levels. These projections serve as the 2018 Reasonable Progress Goal. For the Brigantine Wilderness Area, the 2018 projection is 25.1 deciviews. This projection meets the Uniform Rate of Progress goal set by the USEPA regulations. The reasonable measures used to set the 2018 Reasonable Progress Goal are:
• Timely implementation of the Clean Air Act requirement to install Best Available Retrofit Technology (BART) on eligible sources;
• At least 90% SO2 emission reductions from 2002 levels at the top 100 electric generating unit (EGU) sources that impact the Brigantine Wilderness Area (for the six MANE-VU visibility protected areas, there are 167 different EGU stacks that impact one or more of these areas);
xvi

• For the MANE-VU states, reducing the level of sulfur in fuel oil. • For the contributing states outside of MANE-VU, a 28% emission reduction from non-
electric generating unit sources is sought;1 • Continued evaluation of other measures, including Energy Efficiency, Alternative Clean
Fuels and other measures to reduce SO2, PM and NOx from all coal-burning facilities by 2018, and new source performance standards for wood combustion.
Other measures which were not included in the modeling to determine the 2018 reasonable progress goal are included in New Jersey’s plans to further improve visibility and reduce fine particle health effects. New Jersey Actions
• BART New Jersey identified four petroleum refineries and one electric generating facility as Best Available Retrofit Technology (BART)-eligible facilities potentially subject to those requirements under the Clean Air Act. Existing rules and consent decrees (CD) are expected to provide most, if not all, BART emission reductions from the affected units. New Jersey sent letters on March 3, 2009, requesting that each facility conduct a BART analysis to ensure that all BART affected units are evaluated for BART and install BART, if not already in place. New Jersey will finalize the BART determinations as single source SIP revisions and also if necessary as operating permit modifications. • Electric Generating Units New Jersey is home to four of the 167 EGU stacks identified in the setting of the 2018 reasonable progress goal at Brigantine or one of the five other Class I areas in MANE-VU. New Jersey has addressed emissions from these stacks through ACOs or CDs that require all four facilities to meet performance standards for SO2, NOx, and particulates. For the other electric generating units not specifically identified, New Jersey adopted new rules (April 20, 2009 New Jersey Register) to implement a multi-pollutant control strategy to reduce allowable NOx, SO2, and particulate emissions from all coal-fired boilers. Details regarding this rule proposal are available at NJDEP’s website, http://www.state.nj.us/dep/aqm/index.html. • Sulfur in Fuel Oil New Jersey intends to propose and adopt rules pursuant to the New Jersey Administrative Procedures Act (APA), (N.J.S.A. 52:14B-1 et. Seq.) and the New Jersey Air Pollution Control Act (APCA), (N.J.S.A.26:2C-1 et. Seq.) to modify the sulfur in fuel limits, N.J.A.C. 7:27-9, as outlined in accordance with the definition of reasonable measures, for the MANE-VU strategy. Some areas in New Jersey already meet the MANE-VU limits for heavy oil.
1 New Jersey and the other MANE-VU Class I states are recommending that contributing states determine the best way to achieve this level of emission reduction. The 28% represents an estimate of the benefits from the MANE-VU fuel oil strategy.
xvii

• Energy Master Plan and Greenhouse Gas Plan New Jersey developed an Energy Master Plan2 (EMP) to address New Jersey’s electricity and heating challenges. The draft plan was released on April 17, 2008, and finalized on October 22, 2008. One component of the Energy Master Plan addresses ways to increase energy efficiency in the State. New Jersey is also developing a Greenhouse Gas Reduction Plan pursuant to the Global Warming Response Act. Measures which will be implemented as a result of these plans will reduce multiple air contaminants and improve visibility.
• Smoke Management Plan and Construction Activities Since New Jersey is home to the Federally protected visibility area, the Brigantine Wilderness Area, New Jersey is required by the USEPA rules to:
• Develop and implement a smoke management plan • Address emissions from construction activities
New Jersey addresses smoke management through its Open Burning rules at N.J.A.C. 7:27-2. New Jersey addresses “fugitive dust” emissions from construction activities through its “Soil Erosion and Sediment Control Standards: Standards for Dust control.” The USEPA has promulgated several regulations which limit exhaust emissions from non-road vehicles, such as those used at construction sites. In addition, New Jersey has existing rules to limit the idling of vehicles and equipment. New Jersey will consider additional mitigating measures for construction activities on a case-by-case basis depending on the size and nature of the construction work, and the review of the potential emissions on the property in relation to any potential off-site impacts. New Jersey is considering amendments to its Open Burning Rule.
• Residential Wood Burning Strategies Residential wood burning from woodstoves and fireplaces is one of the largest sources of direct fine particulate matter, PM2.5, emissions in New Jersey. New Jersey is considering strategies to reduce the emissions of wood smoke. Implementation of these strategies will reduce fine particle emissions and improve visibility. One strategy under consideration is a Home Wood Heating Advisory Program, similar to those in Oregon and Washington states. In general, these programs request wood burning be limited during times when unhealthy air quality is forecast or monitored. Other control measures under investigation include woodstove and fireplace change-out programs.
The NJDEP has posted on its website an informational webpage regarding techniques for proper wood burning, health effects of wood burning, and links to other useful web pages.3
2 www.nj.gov/emp3 http://www.state.nj.us/dep/baqp/woodburning.html
xviii

• Measures to Reduce Organic Carbon Emissions Even though the focus of the Reasonable Progress Goal is to reduce emissions of sulfur dioxide, the largest contributor to regional haze, for the 2018 reasonable progress plan, New Jersey is taking actions to reduce emissions of organic carbon, the second largest contributor to visibility impairment at Brigantine Wilderness Area. Some of New Jersey’s existing and proposed rules which reduce emissions from organic carbon include:
• Existing Diesel Idling (N.J.A.C 7:27-14.3) o Removes or further limits the exemptions to the State’s idling restrictions. o Removes sleeper berth exemption from vehicles effective May 1, 2010. o Includes additional idling restrictions for gasoline vehicles
• Existing Open Burning (N.J.A.C 7:27-2) o One of the most stringent in the nation to limit or control open burning.
• Existing Industrial, Commercial and Institutional (ICI) Boilers (N.J.A.C. 7:27-16.8, -19.7)
o Sets performance standards for NOx, CO and VOC which ensure good combustion.
o Annual tune up requirements which reduces NOx emission and may also help reduce fuel consumption.
• Existing Heavy Duty Diesel Trucks (N.J.A.C 7:27-14)
o Sets tighter opacity standards for the Inspection and Maintenance (I/M) program.
Consultation with the Federal Land Managers
The State of New Jersey coordinated and consulted with the Federal Land Manager for the Brigantine Wilderness Area, which is part of the United States Fish and Wildlife Service, during the development of this SIP, and will continue to do so for future progress reports and plan revisions. Any written comments provided will be available for review in the docket. CAIR Vacatur On July 11, 2008, the United States Court of Appeals for the District of Columbia Circuit ruled on the Federal Clean Air Interstate Rule (CAIR). On December 23, 2008, the court remanded the CAIR to the USEPA without vacatur of CAIR “so that EPA may remedy CAIR’s flaws in accordance with” the court’s July 2008 opinion vacating CAIR. The court gave no deadline for the USEPA rulemaking, but it said: “[W]e remind EPA that we do not intend to grant an indefinite stay of the effectiveness of this court’s decision. Our opinion revealed CAIR’s fundamental flaws, which EPA must still remedy. Further, we remind the Petitioners that they may bring a mandamus petition to this court in the
xix

event that EPA fails to modify CAIR in a manner consistent with our July 11, 2008 opinion.” (North Carolina v. EPA, 531 F.3d 896, on reh’g. 550 F.3d 1176 at 1178 (D.C. Cir. 2008))
Therefore, the anticipated vacatur no longer applies since a mandate was never issued by the court on the July 11, 2008 opinion (State of North Carolina v. Environmental Protection Agency, 531 F.3d 896 (D.C. Cir. 2008)). In light of the court decisions made after the proposal of the SIP revision, the CAIR remains in full effect at this time. With the adoption of additional rules on March 20, 2009, NJDEP is not relying on CAIR for emission reductions within New Jersey for the Regional Haze SIP. NJDEP rules set performance standards for all electric generating units’ sulfur dioxide, nitrogen oxides, and direct emissions of particulate matter. This likely addresses BART for EGUs in New Jersey, with the possible exception of other smaller sources, such as coal piles and coal handling at the facilities. In order to address the court’s removal of CAIR, BART and other Clean Air Act (CAA) requirements for EGUs, the USEPA should also adopt performance standards as New Jersey has done.
xx
1.0 BACKGROUND AND OVERVIEW OF THE REGIONAL HAZE REGULATIONS 1.1 Introduction The Federal Clean Air Act4 sets a national goal to restore visibility to its natural conditions in many of the national parks, wilderness areas and memorial parks in the United States of America. New Jersey is home to one of these areas, the Brigantine Wilderness Area in the Edwin B. Forsythe National Wildlife Refuge. Section 169A of the Clean Air Act of 1977 sets the following national visibility goal:
Congress hereby declares as a national goal the prevention of any future, and the remedying of any existing, impairment of visibility in mandatory Class I Federal areas which impairment results from man-made air pollution.
The USEPA promulgated rules5 outlining the requirements for States and Tribes to achieve the natural visibility goal by 2064. These rules provide the basis for defining current and future goals for both natural background and interim milestones, and a process to achieve the milestones. New Jersey is proposing a revision to the New Jersey State Implementation Plan (SIP) to set the 2018 reasonable progress goals for Brigantine Wilderness Area, and to address New Jersey’s contribution to visibility impairment in Acadia National Park and Moosehorn Wilderness Area in Maine, Great Gulf Wilderness Area and Presidential Range/Dry River Wilderness Area in New Hampshire, Lyebrook Wilderness Area in Vermont, and the Brigantine Wilderness Area. This document outlines New Jersey’s long-term plan (2018) for dealing with visibility-impairing air pollution within its borders and from out-of-state sources that transport pollution to the Brigantine Wilderness Area. Elements of this SIP address the core requirements pursuant to 40 C.F.R. 51.308(d) and the Best Available Retrofit Technology (BART) components of 40 C.F.R. 51.308(e). In addition, this SIP addresses regional planning, State and Federal Land Manager coordination, and contains a commitment to provide SIP revisions and the 2013 progress review as required by 40 C.F.R. § 51.308 (f) and (g) which require the State to submit periodic implementation plan upgrades and progress reports. Regional Haze is not caused by the air pollution from any one specific source, but is caused by many air pollution sources located over a wide area. The solution to Regional Haze can only be found by looking at all emissions of visibility-impairing pollutants over a wide geographic area. More details on the history of the Federal Regional Haze Rule and the 1990 Clean Air Amendments are included in Appendix A. The Federal Regional Haze regulations are included in Appendices G-1, G-2 and G-3. 4 42 U.S.C. § 7491 5 40 C.F.R § 51.300-309
1-1
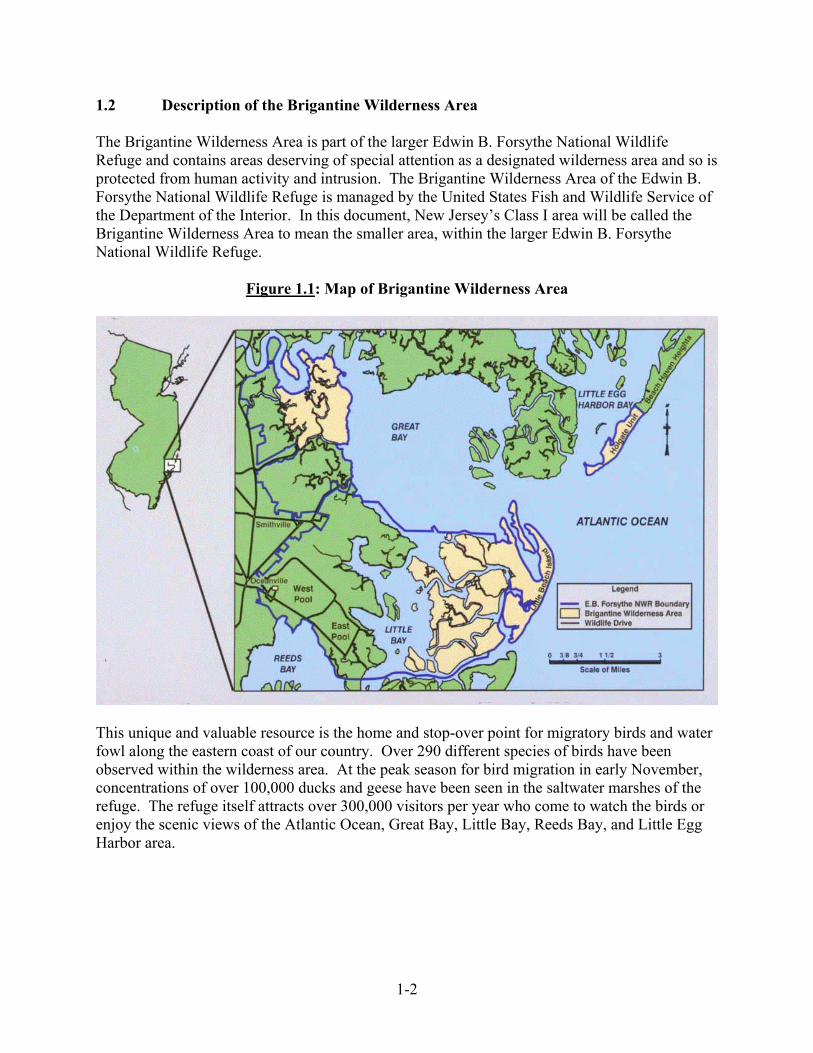
1.2 Description of the Brigantine Wilderness Area The Brigantine Wilderness Area is part of the larger Edwin B. Forsythe National Wildlife Refuge and contains areas deserving of special attention as a designated wilderness area and so is protected from human activity and intrusion. The Brigantine Wilderness Area of the Edwin B. Forsythe National Wildlife Refuge is managed by the United States Fish and Wildlife Service of the Department of the Interior. In this document, New Jersey’s Class I area will be called the Brigantine Wilderness Area to mean the smaller area, within the larger Edwin B. Forsythe National Wildlife Refuge.
Figure 1.1: Map of Brigantine Wilderness Area
This unique and valuable resource is the home and stop-over point for migratory birds and water fowl along the eastern coast of our country. Over 290 different species of birds have been observed within the wilderness area. At the peak season for bird migration in early November, concentrations of over 100,000 ducks and geese have been seen in the saltwater marshes of the refuge. The refuge itself attracts over 300,000 visitors per year who come to watch the birds or enjoy the scenic views of the Atlantic Ocean, Great Bay, Little Bay, Reeds Bay, and Little Egg Harbor area.
1-2

Pictures from the Brigantine Wilderness Area
Figure 1.2 Pictures from Brigantine Wilderness Area
The nearby attraction of Atlantic City, New Jersey draws over 35 million visitors per year and the views of the Brigantine Wilderness Area from Atlantic City are enjoyed by all. The exceptional natural character and charm of the Brigantine Wilderness area create an oasis of beauty within the most densely populated state in the nation. 1.3 Regional Haze in the Brigantine Wilderness Area Regional Haze is caused by the scattering or absorption of light particles in the atmosphere from air pollution. This absorption and scattering effect of fine particles is illustrated in Figure 1.3.
1-3
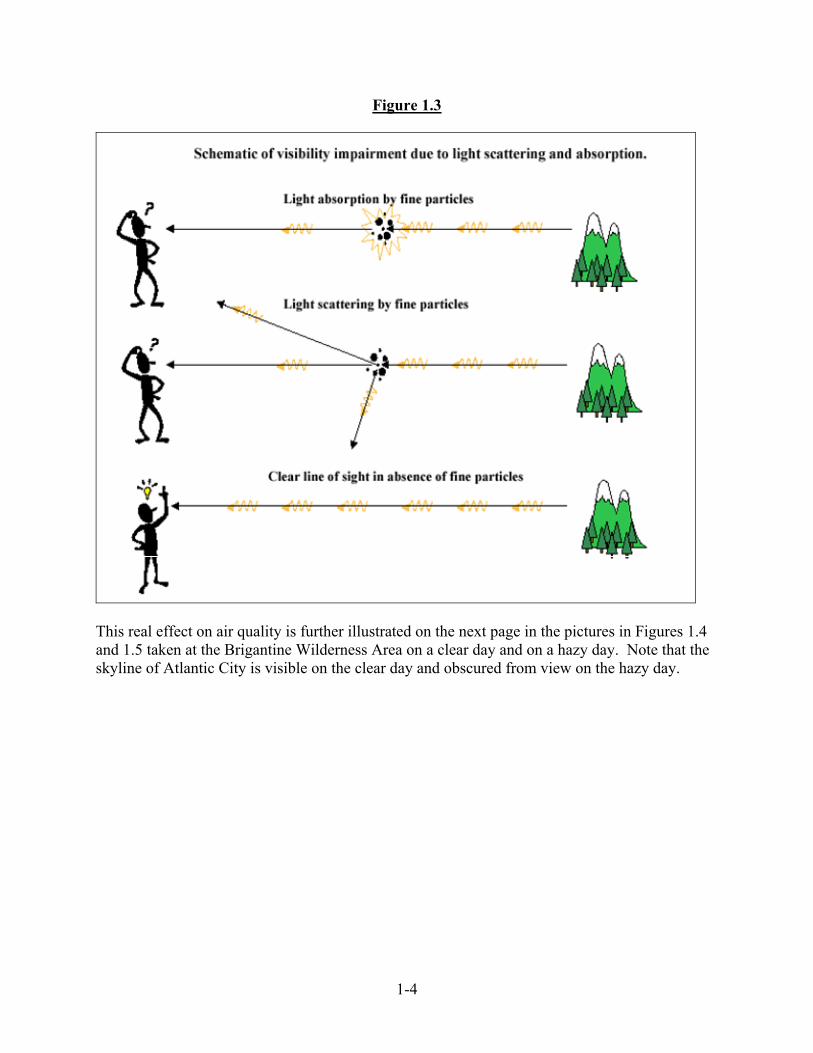
Figure 1.3
5
This real effect on air quality is further illustrated on the next page in the pictures in Figures 1.4 and 1.5 taken at the Brigantine Wilderness Area on a clear day and on a hazy day. Note that the skyline of Atlantic City is visible on the clear day and obscured from view on the hazy day.
1-4
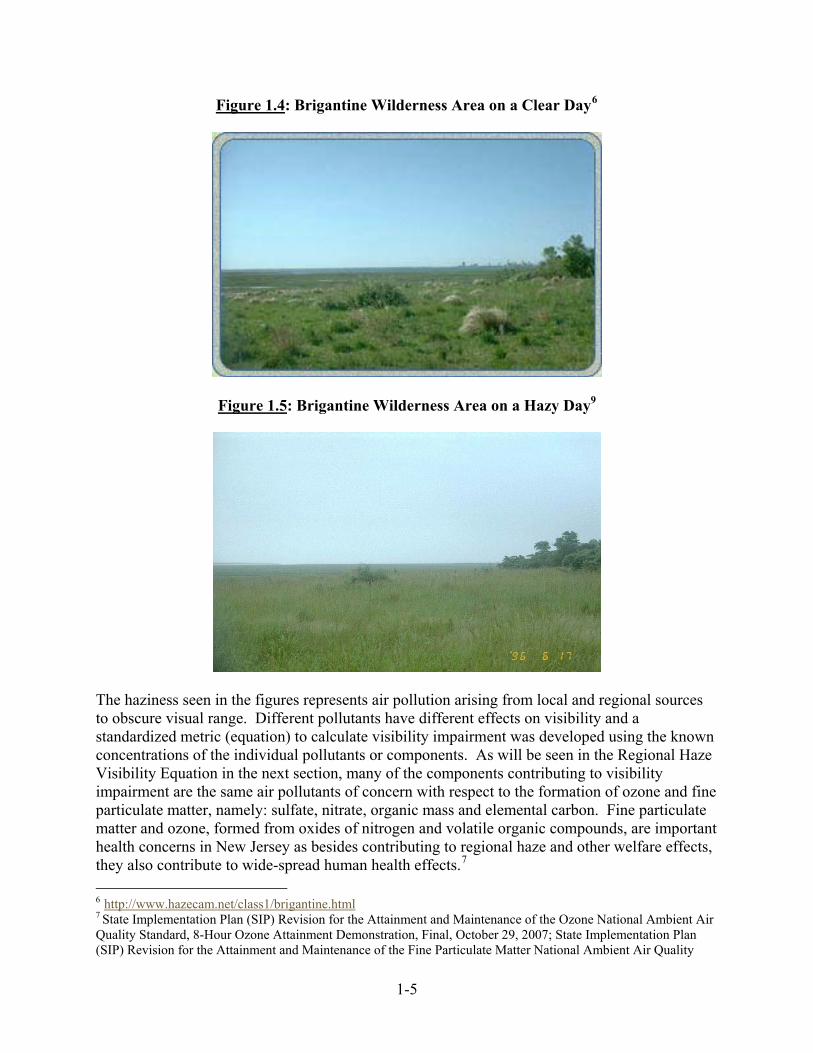
Figure 1.4: Brigantine Wilderness Area on a Clear Day6
Figure 1.5: Brigantine Wilderness Area on a Hazy Day9
The haziness seen in the figures represents air pollution arising from local and regional sources to obscure visual range. Different pollutants have different effects on visibility and a standardized metric (equation) to calculate visibility impairment was developed using the known concentrations of the individual pollutants or components. As will be seen in the Regional Haze Visibility Equation in the next section, many of the components contributing to visibility impairment are the same air pollutants of concern with respect to the formation of ozone and fine particulate matter, namely: sulfate, nitrate, organic mass and elemental carbon. Fine particulate matter and ozone, formed from oxides of nitrogen and volatile organic compounds, are important health concerns in New Jersey as besides contributing to regional haze and other welfare effects, they also contribute to wide-spread human health effects.7 6 http://www.hazecam.net/class1/brigantine.html 7 State Implementation Plan (SIP) Revision for the Attainment and Maintenance of the Ozone National Ambient Air Quality Standard, 8-Hour Ozone Attainment Demonstration, Final, October 29, 2007; State Implementation Plan (SIP) Revision for the Attainment and Maintenance of the Fine Particulate Matter National Ambient Air Quality
1-5

1.4 The Regional Haze Visibility Equation The degree of visibility impairment is expressed in deciviews, a unitless value. The calculation of visibility impairment utilizes two equations, one to calculate light extinction coefficient (Bext), and then its transformation into visibility impairment as expressed in deciviews (dv). The latest equation,8 approved by the Interagency Monitoring of Protected Visual Environments (IMPROVE) Steering Committee, to calculate light extinction coefficient is: BBext ≈ 2.2 x fS (RH) x [Small Sulfate] + 4.8 x fL (RH) x [Large Sulfate] + 2.4 x fS (RH) x [Small Nitrate] + 5.1 x fL (RH) x [Large Nitrate] + 2.8 x [Small Organic Mass] + 6.1 x [Large Organic Mass] + 10 x [Elemental Carbon] + 1 x [Fine Soil Mass] + 1.7 x fSS (RH) x [Sea Salt Mass] + 0.6 x [Coarse Mass] + Rayleigh Scattering (Site Specific) + 0.33 x [NO2 (ppb)] …….…….………..Equation 1 Where: BB
ext = The light extinction coefficient in inverse megameters [Mm ] -1
fs (RH) and fL (RH) = Humidity factor associated with small and large mode mass size distributions fss (RH) = Humidity factor associated with Sea Salt The on-site air monitoring of visibility causing pollutants by the IMPROVE monitoring network is discussed in more detail in Section 4 of this document. In Equation 1, total sulfate, nitrate and organic carbon compound concentrations are each divided into two particle size fractions, representing small and large size particle components. Site-specific Rayleigh scattering is calculated by IMPROVE for the elevation of the site as well as annual average temperature of each IMPROVE monitoring site. Once light extinction is calculated, visibility levels (in deciviews (dv)) can be calculated. The deciview equation is as follows: Deciviews (dv) = 10 ln (bext/10)………………………………………...………………Equation 2 where ln is the natural log function and Bext is calculated using the IMPROVE equation previously described. The calculated deciviews are unitless values where the higher the value, the greater amount of visibility impairment exists.
Standard, Fine Particulate Matter Attainment Demonstration, Proposal, June 16, 2008. 8 Review of the IMPROVE Equation for Estimating Ambient Light Extinction Coefficients - Final Report Jenny L. Hand and William C. Malm, March 2006
1-6

Equations 1 and 2 were used to calculate the baseline and projected visibility impairment in the Brigantine Wilderness Area and was used to set the progress goals as established in this document (see Section 3).
1-7

2.0 GENERAL PLANNING PROVISIONS 2.1 Regional Planning When the Regional Haze Rule was promulgated by the USEPA, it contained a provision to encourage the formation of regional planning groups to assist the States in creating their Regional Haze State Implementation Plans (SIP). New Jersey agreed to participate in a Regional Planning Organization (RPO). Using this early direction as a guide, the USEPA and affected states/tribes agreed to create five to facilitate interstate coordination on Regional Haze SIPs. New Jersey is a member of the Mid-Atlantic/Northeast Visibility Union (MANE-VU) RPO. Members of MANE–VU are listed in Table 2.1. New Jersey continues to work with its MANE-VU partners to jointly address regional haze issues. Additional background information on MANE-VU can be found in Appendix B.
Table 2.1: Mid-Atlantic/Northeast Visibility Union Members* (MANE-VU) Connecticut Pennsylvania Delaware Penobscot Nation District of Columbia Rhode Island Maine St. Regis Mohawk Tribe Maryland Vermont Massachusetts U.S. Environmental Protection Agency New Hampshire U.S. National Park Service New Jersey U.S. Fish and Wildlife Service New York U.S. Forest Service
*The U.S. Environmental Protection Agency, U.S. National Park Service, U.S. Fish and Wildlife Service and U.S. Forest Service are non-voting members. MANE-VU’s managing body is a Board, composed of the Commissioners or Secretaries of the Environmental Departments and Agencies of the member states and tribes. This managing Board is responsible for the decision making of the group and sets the direction and funding priorities for the organization. MANE-VU established an active committee structure, composed of staff members from the participating states and tribes, to address both technical and non-technical issues related to regional haze. Figure 2.1 shows the other Regional Planning Organizations (RPOs) and their member States. As discussed in Section 7, New Jersey identified the states in the Midwest, i.e., states in the Midwest RPO, and southeast, i.e., states in the VISTAS RPO, as causing or contributing to visibility impairment in the Brigantine Wilderness Area. New Jersey consulted with the Midwest RPO and the VISTAS RPO in accordance with the Regional Haze Rule.9 The details of the consultation process are described in Section 8 and in Appendix C.
9 40 C.F.R. § 51
2-1

CenRAPWRAP Midwest
VISTAS
MANE-VU = OTCNESCAUM
MARAMA
Regional Planning Organizations for Regional Haze
MANE-VU
Figure 2.1: Regional Planning Organizations for Regional Haze On June 20, 2007, the Commissioners of the states with mandatory Class I Federal areas in the MANE-VU region signed a Resolution regarding principles for implementing the regional haze rule. This set of principles include: establishing the reasonable progress goals for MANE-VU Class I areas by identifying reasonable measures that can be implemented by 2018; inviting all identified contributing states to review the identified measures; and asking that the states make timely emissions reductions. The principles also call on the USEPA to implement any national or regional measures deemed reasonable through the consultation process in a timely manner, and a commitment from the states to submit the 5-year progress reports required by the regional haze rule as a revision to the states’ initial SIP revision. The Class I states will rely on adequate Federal funding to comply with this Federal requirement. The signed resolution is documented in Appendix D. This SIP revision utilizes data analysis, modeling results and other technical support documents prepared for MANE-VU members to determine the states contributing to the visibility impairment at Brigantine Wilderness Area and to determine the reasonable measures to set the 2018 reasonable progress goal. 2.2 State and Federal Land Manager Coordination Coordination between States and the Federal Land Managers is required in accordance with 40 C.F.R. § 51.308(i). The Federal Land Manager for the Brigantine Wilderness Area is the U.S. Fish and Wildlife Service of the U.S. Department of the Interior. As required, the State of New Jersey provided the name and title of a contact person within the NJDEP to the Federal Land Manager. In development of this SIP Revision, the Federal Land Manager was consulted in accordance with the provisions of 40 C.F.R. § 51.308(i)(2). Additionally, the Department of Environmental Protection staff met with the Federal Land Manager at the Brigantine Wilderness Area, and conferred through conference calls. The State of New Jersey will continue to consult with the Federal Land Manager regarding future progress reports and plan revisions.
2-2

3.0 ASSESSMENT OF BASELINE AND NATURAL CONDITIONS WITHIN THE BRIGANTINE WILDERNESS AREA
3.1 Requirement, Data and Methods Used Baseline conditions represent the visibility conditions which existed on the best and worst days at the time the regional haze program was established for each Class I area. The Baseline is the average visibility (in deciviews) on the 20% most impaired days, or “worst” days, and on the 20% least impaired days, or “best days,” for the years 2000 through 2004.10
Natural background visibility conditions are the visibility conditions that would exist in absence of human-caused impairment,11 i.e., the visibility conditions before human activities affected air quality in the area. Each State with a Class I area must establish goals (expressed in deciviews) that provide for reasonable progress toward the goal of achieving natural visibility by 2064. The plans for achieving the reasonable progress goals must provide for an improvement in visibility on the most impaired days and ensure no degradation in visibility on the least impaired days. The USEPA established procedures for calculating visibility levels, using available air monitoring data.12 On-site air monitoring data at the Brigantine Wilderness Area were collected from the Interagency Monitoring of Protected Visual Environments (IMPROVE) air monitoring network and used to calculate the historic deciview levels as contained in this SIP revision.13 The Northeast States for Coordinated Air Use Management (NESCAUM) evaluated the data from the IMPROVE monitor at the Brigantine Wilderness Area and calculated the baseline conditions using on-site data gathered within the 5-year period of 2000 to 2004.14 This value sets the starting point to measure visibility impairment in the Brigantine Wilderness Area . 3.2 Baseline and Natural Visibility at the Brigantine Wilderness Area Natural background conditions, the conditions that would exist in the absence of all man-made pollution, represents the visibility goal for each Class I area to achieve in 2064. Natural background concentrations of naturally occurring air contaminants were estimated, using the USEPA guidance15 and Equations 1 and 2.16 The estimated natural background visibility in the Brigantine Wilderness Area for 20% worst days is 12.2 deciviews. The calculation of this value is described in Appendix E.
10 USEPA. Guidance on the Use of Models and Other Analyses for Demonstrating Attainment of Air Quality Goals for Ozone, PM2.5, and Regional Haze. Pg. 76. EPA-454/B-07-002. April 2007 11 NESCAUM. Baseline and Background Visibility Conditions. December, 2006 12 40 C.F.R. § 51.301 and 51.308(d)(4) 13 The IMPROVE monitoring network was set-up by the USEPA and the Federal Land Managers to measure air quality in certain national parks and wilderness areas (See Section 4) 14 Ibid 15 USEPA. Guidance for Estimating Natural Visibility Conditions under the Regional Haze Rule, EPA-454/B-03-005, September, 2003 16 40 C.F.R. § 51.301
3-1

The five-year average baseline visibility, using the on-site monitoring data from the years 2000 to 2004, for the Brigantine Wilderness Area is 14.3 deciviews for the 20 percent best visibility days (least impaired) and 29.0 deciviews for the 20 percent worst visibility days (most impaired). These values were calculated for both best and worst visibility in accordance with 40 C.F.R. § 51.308(d)(2). The regulations require that the rate of improvement projected for the long range strategy be compared with the uniform rate of progress. The uniform rate of progress is calculated by dividing the level of improvement needed (current conditions – natural background goal) by the time to meet the goal, or sixty (60) years. For the 2018 reasonable progress goal, this was calculated as follows: 29.0 deciviews – 12.2 deciviews / 60 years (difference between 2004 and 2064) = 0.28 deciviews /year x 14 years (between 2004 and 2018) = 3.9 deciview improvement by 2018 Or as the 2018 goal: 29.0 – 3.9 = 25.1 deciview in 2018 These data are summarized in Table 3.1.
Table 3.1: Visibility Information for the Brigantine Wilderness Area
Conditions Deciviews Natural Background Visibility on 20% of worst visibility days (Goal in 2064) 12.2 Average Baseline Visibility on 20% of best visibility days (2000 – 2004) 14.3 Average Baseline Visibility on 20% worst visibility days (2000 – 2004) 29.0 Uniform Rate of Progress in 2018 on the 20% worst visibility days 25.1 3.3 Visibility Trends at the Brigantine Wilderness Area Figure 3.1 presents the trends in the visibility impairment levels as recorded at the Brigantine Wilderness Area. The figure shows that visibility slightly improved at the Brigantine Wilderness Area between 1993 and 2005. The downward trend impairment in the levels is most noticeable after the implementation of the first phase of the Clean Air Act’s Acid Rain Program sulfur dioxide controls in the early 1990’s, but this downward trend has leveled off in recent years.
3-2
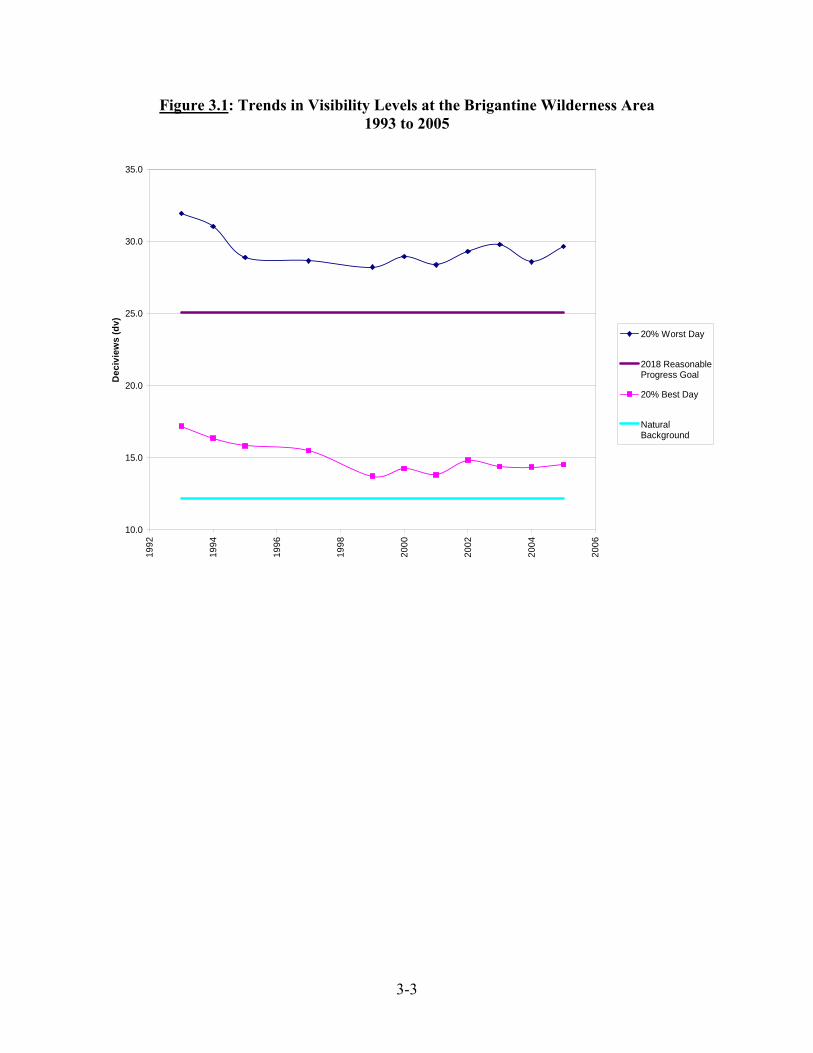
Figure 3.1: Trends in Visibility Levels at the Brigantine Wilderness Area 1993 to 2005
10.0
15.0
20.0
25.0
30.0
35.0
1992
1994
1996
1998
2000
2002
2004
2006
Dec
ivie
ws
(dv)
20% Worst Day
2018 ReasonableProgress Goal
20% Best Day
NaturalBackground
3-3

4.0 MONITORING STRATEGY FOR VISIBILITY IMPAIRMENT IN THE BRIGANTINE WILDERNESS AREA
4.1 Introduction Visibility conditions representative of those within the Brigantine Wilderness Area are monitored by the Federally operated Interagency Monitoring of Protected Visual Environments program, or also known as the IMPROVE monitoring program. In 1985, the IMPROVE monitoring program was established to measure visibility impairment in mandatory Class I areas throughout the United States. This monitoring is designed to aid the creation of Federal and State implementation plans for the protection of visibility in Class I areas stipulated in the 1977 amendments to the Clean Air Act. Data from the IMPROVE monitoring program have been collected since the early 1990s at the Brigantine Wilderness Area. The IMPROVE monitoring sites are operated and maintained through a formal cooperative relationship between the USEPA, the U.S. National Park Service, the U.S. Fish and Wildlife Service, the Bureau of Land Management, and U.S. Forest Service. In 1991, several additional organizations joined the effort. These organizations include the National Association of Clean Air Agencies (formerly State and Territorial Air Pollution Program Administrators and the Association of Local Air Pollution Control Officials), Western States Air Resources Council, Mid-Atlantic Regional Air Management Association, and the Northeast States for Coordinated Air Use Management. IMPROVE Program Objectives Data collected at these sites are used by land managers, industry planners, scientists, public interest groups, and air quality regulators to understand and protect the visual air quality resource in Class I areas. Most importantly, the IMPROVE program scientifically documents for American citizens, the visual air quality of their wilderness areas and national parks. Program objectives include:
• Establish current visibility and aerosol conditions in mandatory Class I areas, • Identify chemical species and emission sources responsible for existing man-made
visibility impairment, • Document long-term trends for assessing progress towards the national visibility goals, • Provide regional haze monitoring representing all visibility-protected Federal Class I
areas where practical, as required by the USEPA’s Regional Haze Rule. 4.2 Monitoring Information and Strategy for the Brigantine Wilderness Class I Area A monitoring strategy is required for measuring, characterizing, and reporting regional haze visibility impairment that is representative of all mandatory Class I Areas within the State in accordance with 40 C.F.R. § 51.308(d)(4). The monitoring strategy for New Jersey relies upon the continued availability of the IMPROVE network. The IMPROVE monitor for the Brigantine Wilderness Area (indicated as BRIG1 in the IMPROVE monitoring network database) is located outside the Edwin B. Forsythe National
4-1

Wildlife Refuge Headquarters in Oceanville, New Jersey at an elevation of 5 meters, a latitude of 39.47˚ and a longitude of -74.45˚.
Figure 4.1: The IMPROVE Monitor at the Brigantine Wilderness Area – BRIGI
Since access to or disturbance of the wilderness area is meant to be limited or non-existent in order to protect the ecological and biological resources, the monitoring station is located as close as practicable to, but not within, the wilderness area. Being located as close as practicable to the wilderness area means that the air monitoring data collected is representative of the air quality within the wilderness area but does not disturb the wilderness area’s ecology, or natural resources. The haze data for Brigantine Wilderness Area are collected by an IMPROVE monitor that is operated and maintained by the U.S. Fish and Wildlife Service. In 2007, NJDEP established at the same location a monitoring station that measures trace level SO2 and PM2.5 using continuous and Federal reference methods for sample collection. A visibility camera was also installed in 2007. NJDEP is currently testing a real time sulfate analyzer, but it is not yet in operation. This station replaces the one previously located nearby at the Nacote Creek Research station in Galloway Township.
4-2

The NJDEP worked extensively over the past two years to consolidate and coordinate the air monitoring sites in the area. The NJDEP plans to monitor the following air contaminants at the Brigantine Wilderness Area and maintain the monitors at this location if shown to be viable, to produce scientifically valid results, and to provide information needed to ascertain attainment of any national ambient air quality standard including progress to the national visibility goals. The planned monitoring at this site includes:
• Continuous Ozone, • Fine Particulate – PM2.5 (measured by the Federal Reference Method), • Fine Particulate – PM2.5 (measured by a continuous instrument), • Trace Gas Analyzer for SO2, • Continuous Sulfate (if proven practical by NESCAUM and NJDEP), • NOx / NOy
17 (anticipated to be conducted by Stockton State College in NJ), • An On-Site Camera to observe visibility levels,18 and a • Nephelometer.
The NJDEP plans to operate and maintain the monitoring site at the Brigantine Wilderness Area for the foreseeable future, although this is contingent upon continued Federal and State funding. Any network changes will be subject to a joint annual review process by both the NJDEP and the USEPA. Assuming continued availability of the IMPROVE monitoring data, New Jersey developed a monitoring strategy that is representative of the Class I area, and addresses the transport of pollutants from other areas to the Class I area. This program meets the requirements of 40 C.F.R. §51.305. The measurement of ozone and fine particulate concentrations, as well as NOx/NOy, SO2 and sulfate, along with the continued collection of data by the IMPROVE program, will provide data from this location that can be used to assess transported pollutants and their sources. Information that can be directly correlated with the on-site Nephelometer / Camera will be collected and made available for analysis.
17NOx is the abbreviation for oxides of nitrogen; NOy is the abbreviation for total reactive nitrogen. 18 The camera results from Brigantine is available on a real time basis at http://www.hazecam.net/brigantine.html
4-3
5.0 EMISSION INVENTORY 5.1 Regional Emission Inventory Development New Jersey is required to identify the baseline emission inventory on which emission reduction strategies to improve visibility are based in accordance with 40 C.F.R. § 51.308(d)(3)(iii). Based on USEPA guidance,19 2002 was identified as the baseline emission inventory year for regional haze. New Jersey and the MANE-VU states used 2002 as the baseline year for their Regional Haze SIP. New Jersey worked with other MANE-VU states in contributing to the development of the regional inventory compiled by the Mid-Atlantic Regional Air Management Association (MARAMA).20 The New Jersey portion of the MARAMA regional modeling inventory was based on the New Jersey 2002 base year inventory. New Jersey submitted this 2002 base year inventory to the USEPA’s National Emission Inventory (NEI)21 database as required by the Consolidated Emission Reporting Rule (CERR). The New Jersey 2002 inventory was also included in the “Attainment and Maintenance of the 8-Hour Carbon Monoxide National Ambient Air Quality Standard, 1-Hour Ozone National Ambient Air Quality Standard, and Fine Particulate Matter National Ambient Air Quality Standard SIP and the 2002 Periodic Emission Inventory” which can be found on the Department’s website at: http://www.state.nj.us/dep/baqp/sip/siprevs.htm and went through the public review process in March 2006. The USEPA approved the 2002 emission inventory for New Jersey on July 10, 2006. In addition, this 2002 inventory served as the baseline inventory for New Jersey’s 8-Hour Ozone Attainment Demonstration State Implementation Plan (SIP), proposed in June 2007 and final in October 2007, and the PM2.5 Attainment Demonstration SIP, proposed in June 2008 and final in March 2009. Some improvements were made to the inventory in the regional development process. Version 3 of the 2002 base year emission inventory was used in the regional modeling exercise. The MARAMA technical support documentation for the 2002 base year inventory, dated November 20, 2006, is presented in Appendix F-1. Emission inventory data files are available on the MARAMA website at: http://www.marama.org/visibility/EI_Projects/index.html. The 2002 emission inventories from non-MANE-VU areas within the modeling domain were obtained from other Regional Planning Organizations for their corresponding areas. The regional planning organizations and inventories included the Midwest Regional Planning Organization (MWRPO) – version K, and the VISTAS RPO – the G2 inventory. This Regional Haze SIP also includes a regional inventory for projected emissions for 2018 (i.e., the first planning period year). The MANE-VU states used the 2018 MARAMA compiled inventory, version 3, as the future year inventory to evaluate emission growth and emission benefits from existing and potentially new control measures. The emission control scenarios used for this future year inventory were as follows:
19 USEPA. Emissions Inventory Guidance for Implementation of Ozone and Particulate Matter National Ambient Air Quality Standards (NAAQS) and Regional Haze Regulations. United States Environmental Protection Agency, Emissions Inventory Group, Emissions, Monitoring, and Analysis Division, Office of Air Quality Planning and Standards, Research Triangle Park, NC, EPA-454/R-05-001, August 2005, Updated November 2005. 20 See http://www.marama.org/visibility21 65 Fed. Reg. 33268-80 (May 23, 2000) and http://www.epa.gov/ttn/chief/cerr/CERR_FR.pdf.
5-1
1. A combined on-the-books/on-the-way (OTB/OTW)22 control strategy accounting for emission control regulations already in place as of June 15, 2005, as well as some emission control regulations expected to achieve additional emission reductions by 2009.
2. A beyond-on-the way (BOTW)23 scenario to account for controls from potential new
regulations that may be necessary to meet attainment and other regional air quality goals, mainly for ozone.
The MARAMA technical support documentation for the 2018 (OTB/OTW), and 2018 BOTW inventories, dated February, 2007, is presented in Appendix F-2. The OTC technical support documentation for the BOTW control measures included in the modeling, dated February 28, 2007, is included in Appendix F-3. Descriptions of the 2002 and 2018 inventories are also included on pages 1-10 through 1-20 of the report on MANE-VU Modeling for Reasonable Progress Goal (NESCAUM 2008) in Appendix N-2. Based on MANE-VU’s initial modeling, contribution assessments and analyses of the four statutorily required factors, MANE-VU selected a number of control measures on which to base the modeling that would be used to develop proposed reasonable progress goals. An updated scenario to account for these additional potentially reasonable control measures was developed. For the MANE-VU region, these reasonable measures include:
• SO2 reductions at a set of 167 EGU stacks which were identified as contributing to visibility impairment at northeast Class I areas;
• Implementation of a low-sulfur fuel strategy for non-EGU sources, and; • Implementation of a Best Available Retrofit Technology (BART) strategy for BART-
eligible sources not controlled under other programs. Documentation for the future year estimations of EGUs and the remaining source sectors (non-EGU sectors) is presented in Appendix F-2. MANE-VU received comments from several stakeholders and another RPO suggesting that since the CAIR program and other “on the books” or “on the way” measures are projected to achieve uniform rates of progress as previously modeled, additional reductions to both EGU and non-EGU sectors were unnecessary. New Jersey and MANE-VU do not agree with this approach because CAIR is a cap and trade program, and there is no enforceable mechanism to require that states stay within their budget. Thus MANE-VU chose to add back emissions to reflect the CAIR cap. This assumption provides a conservative projection of less visibility improvement.
22 State Implementation Plan (SIP) Revision for the Attainment and Maintenance of the Ozone National Ambient Air Quality Standard, 8-Hour Ozone Attainment Demonstration, Chapter 4 – Control Measures, page 4-1, Final, October 29, 2007 23 ibid.
5-2

5.1.1 Regional Emission Inventory Pollutants and Sectors A statewide emission inventory of pollutants, that reasonably anticipate to cause or contribute to visibility impairment, in any mandatory Class I area, is required in accordance with 40 C.F.R. § 51.308(d)(4)(v) . As specified in the applicable USEPA guidance, the pollutants included in the regional modeling inventories for regional haze include:
• sulfur dioxide, • volatile organic compounds, • nitrogen oxides, • fine particulate matter (PM2.5), • coarse particulate matter (PM10), and • ammonia.
The regional emission inventories also include carbon monoxide (CO), but this pollutant is not considered a precursor for regional haze. The emission inventories are a compilation of the emissions from sources of anthropogenic (human-made) and biogenic (natural) pollutants. The sources are divided into five sectors, each making up one component of the inventory: point sources, area sources, onroad sources, nonroad sources and biogenic sources (natural). Anthropogenic (human-made) sources are discussed in this SIP. While the biogenic emissions from the coniferous trees of the Pinelands area are thought to adversely affect visibility, New Jersey does not need to address them in this SIP for a variety of reasons. The Brigantine Wilderness Area is surrounded on three sides by the coniferous forests in the Pinelands National Reserve, an internationally important ecological region of 1.1 million acres in size and occupying 22 percent (%) of New Jersey’s land area. It is the largest body of open space on the Mid-Atlantic seaboard between Richmond, Virginia and Boston, Massachusetts. The biogenic sources are not addressed in this SIP because the Congressional goal for visibility requires only the absence of all man-made pollution by the year 2064 and not the reduction or absence of all biogenic emissions. Thus the emissions from biogenic sources are accounted for in setting the natural background target goal to be reached in 2064. Natural background levels assume that a certain degree of visibility impairment is due to biogenic and other natural sources. 5.2 Regional Emission Inventory Summary 5.2.1 Sulfur Dioxide (SO2) Figure 5.1 shows SO2 emissions trends in the MANE-VU states extracted from the regional modeling inventory for 2002 and 2018.27,24 All the states, including New Jersey, show declines in the 2018 annual SO2 emissions as compared to the 2002 emissions. 27 USEPA, 2005 http://www.epa.gov/ttn/chief/eiinformation.html24 MARAMA 2004, http://www.marama.org/visibility/2002%20NEI/index.html
5-3

Figure 5.1 : MANE-VU State Level Sulfur Dioxide Emissions
0.0
0.2
0.4
0.6
0.8
1.0
1.2
CT DE DC ME MD MA NH NJ NY PA RI VT
SO2 m
illio
n t/y
MV 2002 V3
MV 2018 V3
Note that Figure 5.1 only shows the SO2 emissions from the MANE-VU states. Sulfur dioxide emissions from the Midwest, VISTAS, and CENRAP states were also included in the modeling to set the progress goal for the Brigantine Wilderness Area and SO2 emissions from EGUs and
gions were included in the regionally prepared inventories. fuel burning sources in these re
Figure 5.2 shows the contribution from different source categories to the overall, annual 2002 SO2 emissions in the MANE-VU states. The chart shows that point sources dominate SO2 emissions, which primarily consist of stationary combustion sources for generating electricity, industrial energy, and heat. Smaller stationary combustion sources called “area sources” (primarily commercial and residential heating) are another important source category in the MANE-VU states. By contrast, on-road and non-road mobile sources make only a relatively small contribution to overall SO2 emissions in the region,25 except in New Jersey where the contributions from on-road sources are more than that from area sources.
Figure 5.2: 2002 Annual SO2 Emissions
25 NESCAUM, “Regional Haze and Visibility in the Northeast and Mid-Atlantic States,” January 2001.
5-4

Bar graph: Fraction of Emissions by Source Category and State Line Graph: Annual Emissions in 106 tons per year
0%
25%
50%
75%
100%
CT DE DC ME MD MA NH NJ NY PA RI VT
Per
cent
age
0.0
0.2
0.4
0.6
0.8
1.0
1.2
1.4
SO2 m
illio
n t/y
AREA NONROAD ONROAD POINT Emission
Figure 5.3: 2018 Annual SO2 Emissions
Bar graph: Fraction of Emissions by Source Category and State Line Graph: Annual Emissions in 106 tons per year
0%
25%
50%
75%
100%
CT DE DC ME MD MA NH NJ NY PA RI VT
Perc
enta
ge
0.0
0.2
0.4
0.6
0.8
1.0
1.2
1.4
SO2 m
illio
n t/y
AREA NONROAD ONROAD POINT Emission
Figure 5.3 shows that point sources still dominate SO2 emissions in New Jersey and in the other MANE-VU states. 5.2.2 Volatile Organic Compounds (VOC)
5-5
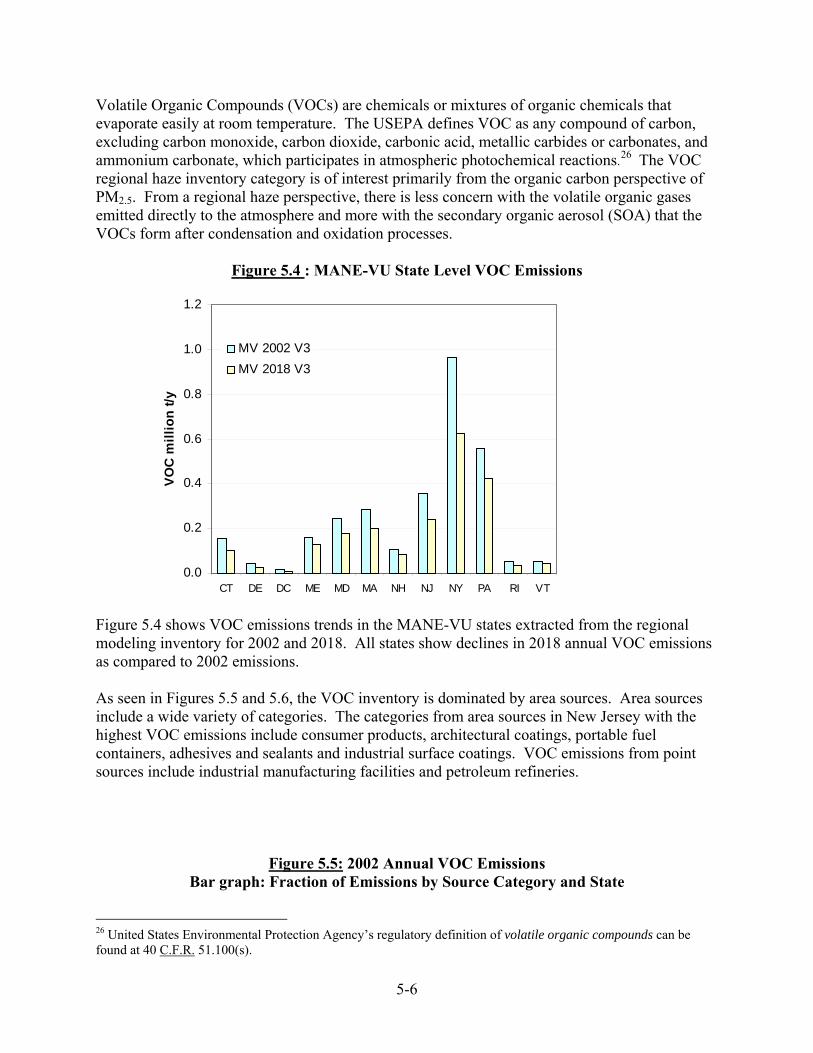
Volatile Organic Compounds (VOCs) are chemicals or mixtures of organic chemicals that evaporate easily at room temperature. The USEPA defines VOC as any compound of carbon, excluding carbon monoxide, carbon dioxide, carbonic acid, metallic carbides or carbonates, and ammonium carbonate, which participates in atmospheric photochemical reactions.26 The VOC regional haze inventory category is of interest primarily from the organic carbon perspective of PM2.5. From a regional haze perspective, there is less concern with the volatile organic gases emitted directly to the atmosphere and more with the secondary organic aerosol (SOA) that the VOCs form after condensation and oxidation processes.
Figure 5.4 : MANE-VU State Level VOC Emissions
0.0
0.2
0.4
0.6
0.8
1.0
1.2
CT DE DC ME MD MA NH NJ NY PA RI VT
VOC
mill
ion
t/y
MV 2002 V3MV 2018 V3
Figure 5.4 shows VOC emissions trends in the MANE-VU states extracted from the regional modeling inventory for 2002 and 2018. All states show declines in 2018 annual VOC emissions as compared to 2002 emissions. As seen in Figures 5.5 and 5.6, the VOC inventory is dominated by area sources. Area sources include a wide variety of categories. The categories from area sources in New Jersey with the highest VOC emissions include consumer products, architectural coatings, portable fuel containers, adhesives and sealants and industrial surface coatings. VOC emissions from point sources include industrial manufacturing facilities and petroleum refineries.
Figure 5.5: 2002 Annual VOC Emissions Bar graph: Fraction of Emissions by Source Category and State
26 United States Environmental Protection Agency’s regulatory definition of volatile organic compounds can be found at 40 C.F.R. 51.100(s).
5-6

Line Graph: Annual Emissions in 106 tons per year
0%
25%
50%
75%
100%
CT DE DC ME MD MA NH NJ NY PA RI VT
Perc
enta
ge
0.0
0.2
0.4
0.6
0.8
1.0
1.2
1.4
VOC
mill
ion
t/y
AREA NONROAD ONROAD POINT Emission
Figure 5.6: 2018 Annual VOC Emissions
Bar graph: Fraction of Emissions by Source Category and State Line Graph: Annual Emissions in 106 tons per year
0%
25%
50%
75%
100%
CT DE DC ME MD MA NH NJ NY PA RI VT
Per
cent
age
0.0
0.2
0.4
0.6
0.8
1.0
1.2
1.4
VO
C m
illio
n t/y
AREA NONROAD ONROAD POINT Emission
5.2.3 Oxides of Nitrogen
5-7

Oxides of Nitrogen (NOX) emissions contribute directly to visibility impairment in the eastern United States by forming light-scattering nitrate particles. Nitrate generally accounts for a substantially smaller fraction of fine particle mass and related light extinction than sulfate and organic carbon at northeastern Class I sites. Notably, nitrate may play a more important role at urban sites and in the wintertime. In addition, NOX may have an indirect effect on summertime visibility by virtue of its role in the formation of ozone, which in turn promotes the formation of secondary organic aerosols.27 Figure 5.7 shows projected NOX emissions at the state level in the MANE-VU region. All states show declines in 2018 annual emissions as compared to 2002 emissions. In New Jersey, the projected decrease is primarily due to Federal on-road and off-road control programs, the New Jersey NOx Budget program, and the consent decree with PSEG.
Figure 5.7 : MANE-VU State Level Nitrogen Oxide Emissions
0.0
0.2
0.4
0.6
0.8
1.0
1.2
CT DE DC ME MD MA NH NJ NY PA RI VT
NO x m
illio
n t/y
MV 2002 V3
MV 2018 V3
Figure 5.8 shows that mobile sources dominated the NOx emissions inventories for the states in 2002. Figure 5.9 shows that in 2018, the emissions are almost evenly distributed among all the sectors.
Figure 5.8: 2002 Annual NOX Emissions Bar graph: Fraction of Emissions by Source Category and State
27 NESCAUM, “Regional Haze and Visibility in the Northeast and Mid-Atlantic States,” January 2001
5-8
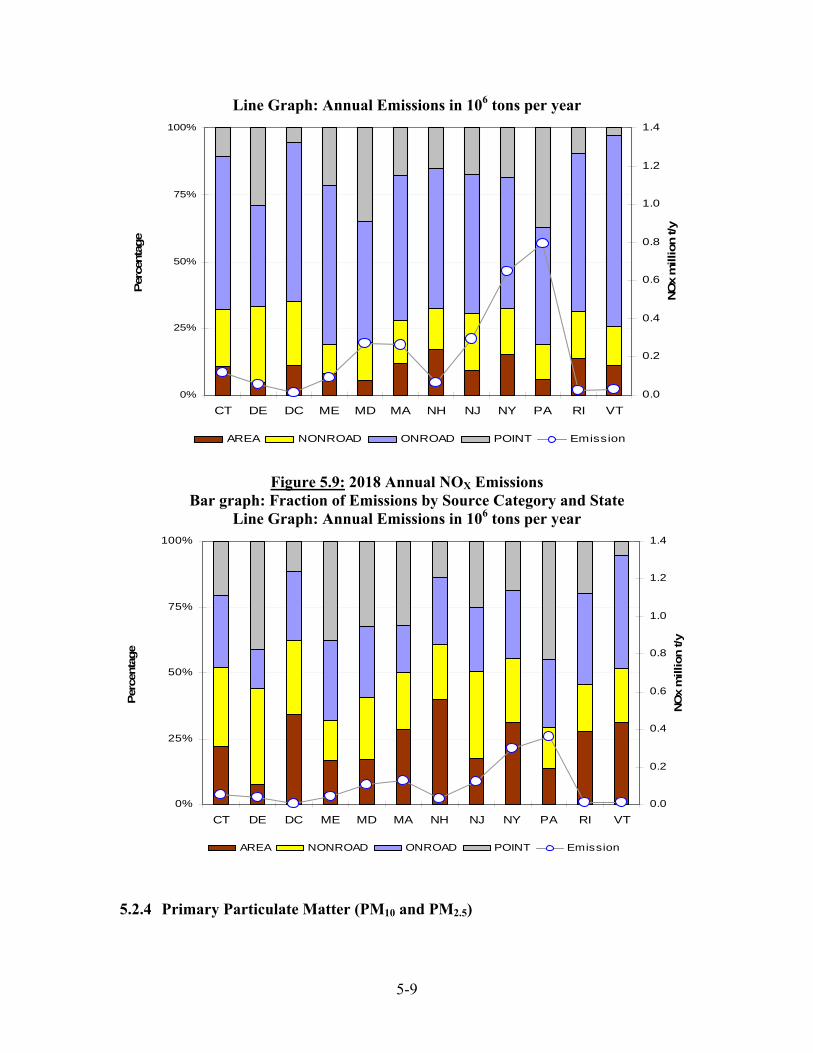
Line Graph: Annual Emissions in 106 tons per year
0%
25%
50%
75%
100%
CT DE DC ME MD MA NH NJ NY PA RI VT
Per
cent
age
0.0
0.2
0.4
0.6
0.8
1.0
1.2
1.4
NO
x m
illio
n t/y
AREA NONROAD ONROAD POINT Emission
Figure 5.9: 2018 Annual NOX Emissions
Bar graph: Fraction of Emissions by Source Category and State Line Graph: Annual Emissions in 106 tons per year
0%
25%
50%
75%
100%
CT DE DC ME MD MA NH NJ NY PA RI VT
Perc
enta
ge
0.0
0.2
0.4
0.6
0.8
1.0
1.2
1.4
NOx
mill
ion
t/y
AREA NONROAD ONROAD POINT Emission
5.2.4 Primary Particulate Matter (PM10 and PM2.5)
5-9
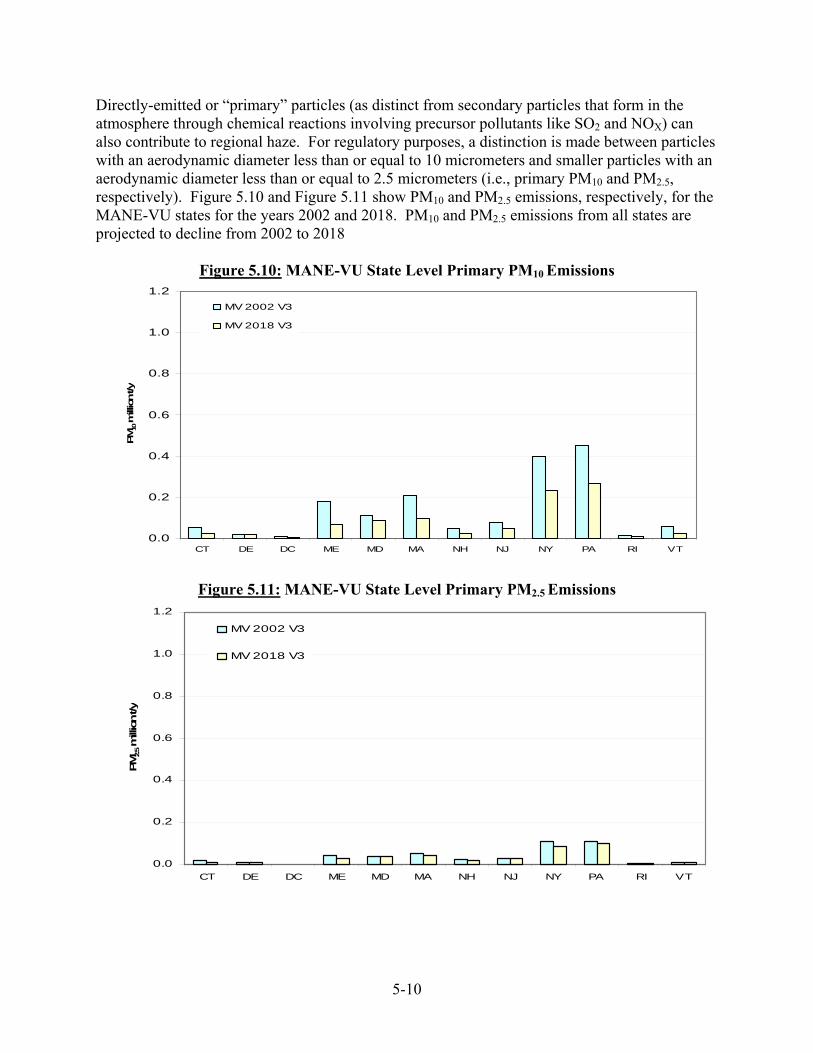
Directly-emitted or “primary” particles (as distinct from secondary particles that form in the atmosphere through chemical reactions involving precursor pollutants like SO2 and NOX) can also contribute to regional haze. For regulatory purposes, a distinction is made between particles with an aerodynamic diameter less than or equal to 10 micrometers and smaller particles with an aerodynamic diameter less than or equal to 2.5 micrometers (i.e., primary PM10 and PM2.5, respectively). Figure 5.10 and Figure 5.11 show PM10 and PM2.5 emissions, respectively, for the MANE-VU states for the years 2002 and 2018. PM10 and PM2.5 emissions from all states are projected to decline from 2002 to 2018
Figure 5.10: MANE-VU State Level Primary PM10 Emissions
0.0
0.2
0.4
0.6
0.8
1.0
1.2
CT DE DC ME MD MA NH NJ NY PA RI VT
PM10 m
illio
n t/
MV 2002 V3
MV 2018 V3
y
Figure 5.11: MANE-VU State Level Primary PM2.5 Emissions
0.0
0.2
0.4
0.6
0.8
1.0
1.2
CT DE DC ME MD MA NH NJ NY PA RI VT
PM2.5 m
illio
n t/
MV 2002 V3
MV 2018 V3
y
5-10

Figures 5.12, 5.13, 5.14 and 5.15 show that area sources dominate the primary PM emissions.28 The category from the New Jersey area source inventory with the highest PM emissions is residential wood burning. Other categories from the New Jersey area source inventory, in order of 2002 PM emissions, include restaurant operations, wildfires, residential and commercial natural gas and distillate oil combustion, prescribed burning and permitted open burning. Source attribution studies show that wood burning emissions may be a larger component of the total PM mass in rural areas, like the Brigantine Wilderness Area, than in urban areas. In rural areas, wood burning emissions may contribute five to ten percent of the total PM mass measured at the monitoring site. Another important consideration in this regard is that residential wood combustion occurs primarily in the winter months, while managed or prescribed burning activities occur largely in other seasons. The latter category includes agricultural field-burning activities, prescribed burning of forested areas and other burning activities. The relative contribution of larger point sources is larger in the primary PM2.5 inventory than in the primary PM10 inventory since the crustal component (which consists mainly of larger or “coarse-mode” particles) contributes mostly to overall PM10 levels and not to primary PM2.5 levels. At the same time, pollution control equipment commonly installed at large point sources is usually more efficient at capturing coarse-mode particles.
Figure 5.12: 2002 Annual Primary PM10 Emissions Bar graph: Fraction of Emissions by Source Category and State
Line graph: Annual Emissions in 106 tons per year
0%
25%
50%
75%
100%
CT DE DC ME MD MA NH NJ NY PA RI VT
Per
cent
age
0.0
0.2
0.4
0.6
0.8
1.0
1.2
1.4
PM
10 m
illio
n t/y
AREA NONROAD ONROAD POINT Emission
28 The NEI inventory categorizes residential wood combustion and some other combustion sources as area sources.
5-11

Figure 5.13: 2002 Annual Primary PM2.5 Emissions Bar graph: Fraction of Emissions by Source Category and State
Line graph: Annual Emissions in 106 tons per year
0%
25%
50%
75%
100%
CT DE DC ME MD MA NH NJ NY PA RI VT
Perc
enta
ge
0.0
0.2
0.4
0.6
0.8
1.0
1.2
1.4
PM2.
5 m
illio
n t/y
AREA NONROAD ONROAD POINT Emission
Figure 5.14: 2018 Annual Primary PM10 Emissions Bar graph: Fraction of Emissions by Source Category and State
Line graph: Annual Emissions in 106 tons per year
0%
10%
20%
30%
40%
50%
60%
70%
80%
90%
100%
CT DE DC ME MD MA NH NJ NY PA RI VT
Per
cent
age
0.0
0.2
0.4
0.6
0.8
1.0
1.2
1.4
PM10
mill
ion
t/y
AREA NONROAD ONROAD POINT Emission
5-12

Figure 5.15: 2018 Annual Primary PM2.5 Emissions Bar graph: Fraction of Emissions by Source Category and State
Line graph: Annual Emissions in 106 tons per year
0%
25%
50%
75%
100%
CT DE DC ME MD MA NH NJ NY PA RI VT
Per
cent
age
0.0
0.2
0.4
0.6
0.8
1.0
1.2
1.4
PM
2.5
mill
ion
t/y
AREA NONROAD ONROAD POINT Emission
5.2.5 Ammonia Emissions (NH3) Ammonium ion (formed from ammonia emissions to the atmosphere) is an important constituent of airborne particulate matter, typically accounting for ten to twenty percent of total fine particle mass. According to 1998 estimates, livestock, agriculture and fertilizer use accounted for approximately 86 percent of all ammonia emissions to the atmosphere.29 However, better ammonia inventory data for the photochemical models is needed to simulate fine particle formation and transport in the eastern United States. Because the USEPA does not regulate ammonia as a criteria pollutant or as a criteria pollutant precursor, these data do not presently exist at the same level of detail or certainty as for NOX and SO2. To address the need for improved ammonia inventories, MARAMA, NESCAUM and USEPA funded research at Carnegie Mellon University (CMU) in Pittsburgh to develop a regional ammonia inventory.30 This study focused on three issues with respect to current emissions estimates: (1) a wide range of ammonia emission factor values, (2) inadequate temporal and spatial resolution of ammonia emissions estimates, and (3) a lack of standardized ammonia source categories.
29 USEPA, National Air Pollutant Trends, 1900 – 1998, EPA 454/R-00-002, available online: http://www.epa.gov/ttn/chief/trends/trends98/trends98.pdf, 2000b. 30 Davidson, C., Strader, R., Pandis, S., and Robinson, A., Preliminary Proposal to MARAMA and NESCAUM: Development of an Ammonia Emissions Inventory for the Mid-Atlantic States and New England. Carnegie Mellon University, Pittsburgh, PA. 7-Jan. 1999.
5-13

The CMU project established an inventory framework with source categories, emissions factors, and activity data that are readily accessible to the user. With this framework, users can obtain data in a variety of formats31 and can make updates easily, allowing additional ammonia sources to be added or emissions factors to be replaced as better information becomes available.32, 33
Figure 5.16 shows that estimated ammonia emissions were fairly stable in 2002 and 2018 for MANE-VU states. Area and on-road mobile sources dominate the ammonia inventory as shown in Figures 5.17 and 5.18. Specifically, area source emissions from agricultural sources and livestock production account for the largest share of estimated ammonia emissions in the MANE-VU region, except in the District of Columbia. The two remaining sources with significant emissions contribution are wastewater treatment systems and gasoline exhaust from highway vehicles.
Figure 5.16: MANE-VU State Level Ammonia Emissions
0.0
0.2
0.4
0.6
0.8
1.0
1.2
CT DE DC ME MD MA NH NJ NY PA RI VT
NH 3
mill
ion
t/y
MV 2002 V3
MV 2018 V3
31 For example, the user will have the flexibility to choose the temporal resolution of the output emissions data or to spatially attribute emissions based on land-use data. 32 Strader, R., Anderson, N., and Davidson, C., Development of an Ammonia Inventory for the Mid-Atlantic States and New England, Progress Report, October 18, 2000, available online: http://marama.org/rt_center/MARAMAprogress10-18-00.pdf, 2000. 33 NESCAUM, “Development of an Improved Ammonia Emissions Inventory for the United States,” December 2001.
5-14

Figure 5.17 2002 Annual NH3 Emissions
Bar graph: Fraction of Emissions by Source Category and State Line graph: Annual Emissions in 106 tons per year
0%
25%
50%
75%
100%
CT DE DC ME MD MA NH NJ NY PA RI VT
Perc
enta
ge
0.0
0.2
0.4
0.6
0.8
1.0
1.2
1.4
NH3
mill
ion
t/y
AREA NONROAD ONROAD POINT Emission
Figure 5.18
2018 Annual NH3 Emissions
0%
25%
50%
75%
100%
CT DE DC ME MD MA NH NJ NY PA RI VT
Per
cent
age
0.0
0.2
0.4
0.6
0.8
1.0
1.2
1.4
NH3
mill
ion
t/y
AREA NONROAD ONROAD POINT Emission
5-15

5.3 Source Retirement and Replacement Schedules New Jersey is required to consider source retirement and replacement schedules in accordance with 40 C.F.R. § 51.308(d)(3)(v)(D). A full listing of the assumptions for equipment replacement in each State can be found in the documentation for development of the 2018 MANE-VU inventory.34 In developing the long-term strategy, source retirement and replacement schedules were considered in the following areas when the 2018 inventory was developed: Mobile Sources: The USEPA’s MOBILE6 model considers that a certain number of the
vehicle fleet in each State will be replaced every year by newer, less polluting vehicles. This “fleet turn-over” to less polluting vehicles that meet the USEPA Tier II motor vehicle standards was a component of the MOBILE6 modeling. These lower emissions have been built into the 2018 inventory as well as the benefits received from lower sulfur gasoline in on-road diesel and gasoline vehicles and the 2007 heavy-duty diesel standards. The reasons for including the benefits from lower sulfur gasoline in on-road diesel and gasoline vehicles and the 2007 heavy-duty diesel standards in the emission projections for 2018 are discussed in Section 8. All new mobile source measures and standards, as well as any benefits from implementation of individual State Inspection and Maintenance programs and implementation of statewide Low Emissions Vehicle (LEV) standards in applicable states, including New Jersey, were used in developing the 2018 inventory.
Electric Generating Units (EGUs): The MANE-VU 2018 inventory was developed
using the Integrated Planning Model (IPM) to forecast growth in electric demand and replacement of older, less efficient and more polluting power plants with newer, more efficient and cleaner units. While the output of the IPM model predicts that a certain number of older plants will be replaced by newer units to meet future electric growth and state-by-state NOx and SO2 caps, New Jersey did not directly rely upon the closure of any particular plant in establishing the 2018 inventory upon which the reasonable progress goals were set. The IPM model results are not the basis upon which to reliably predict plant closures and the issues of specific plant closures in New Jersey are addressed in the “Reasonable Measures” Section of this document (see Section 8 of this document).
Non-Road Sources: The USEPA’s Non-Road model considers that a certain number of
non-road sources will be replaced every year by newer, less polluting vehicles and equipment that meet the new USEPA emission standards for non-road sources. These lower emissions were included in the 2018 inventory as well as the benefits received from lower sulfur gasoline and diesel in off-road vehicles. Any new or proposed Federal standards for marine or other engine types or fuel standards to lower the sulfur content
34 Development of the Emission Projections for the 2009, 2012, and 2018 for the NonEGU Point, Area, and Nonroad Sources in the MANE-VU Region, Draft Technical Support Document, Prepared for the Mid-Atlantic Regional Air Management Association (MARAMA), Prepared by MACTEC Federal Programs, Inc., February 2007. http://www.marama.org/visibility/Inventory%20Summary/MANEVU_Emission_Projections_TSD_022807.pdf
5-16

used in these engines were not assumed in creating the 2018 progress goal. The cutoff point for nonroad sulfur content and fuel standards is 2004.35
Volatile Organic Compound (VOC) Sources: The 2018 MANE-VU inventory was
prepared with a certain replacement schedule for better controlled VOC sources which lead to lower emissions in 2018 due to these controls. Examples of new air pollution controls whose effectiveness is dependent upon replacement of the unit include portable fuel containers and consumer products.
Wood-Burning Equipment: The 2018 MANE-VU inventory was prepared with a
certain replacement schedule for better controlled wood burning sources which lead to lower emissions in 2018 due to the gradual implementation of these controls. A small fraction of wood burning fireplaces and wood stoves are changed out each year in every state and the incremental benefits of this change-out were assumed to accrue to 2018 and beyond.
35 http://www.epa.gov/otaq/models/nonrdmdl/nonrdmdl2004/sulfur.txt
5-17

6.0 BEST AVAILABLE RETROFIT TECHNOLOGY (BART) 6.1 Introduction The Best Available Retrofit Technology (BART) requirement of Section 169A of the Clean Air Act (42 U.S.C.§7491(b)(2)(A)) and implementing rules (40 CFR §51.308(e) and 40 CFR §51 Appendix Y) are intended to reduce visibility impairing pollutants emitted from certain existing stationary sources which were grandfathered from the New Source Review (NSR) requirements of the Clean Air Act. The Federal Regional Haze Federal Register publications are included in Appendices G-1, G-2 and G-3. The visibility impairing pollutants are defined by the USEPA as sulfur dioxide (SO2), oxides of nitrogen (NOx) and particles with an aerodynamic diameter less than or equal to 10 and 2.5 µm (i.e., PM10 and PM2.5, respectively).36 States are required to undertake three key steps to comply with the BART requirements of the Regional Haze Rule. These steps include:
1) Determining if a source is BART-eligible; 2) Determining if a source reasonably causes or contributes to visibility impairment in any
Class I area (subject to BART); 3) Determining if additional controls or emission limits are necessary (BART
determination). Eligibility is limited to sources in one of 26 source categories that have units installed and operating between 1962 and 1977, with the potential to emit more than 250 tons per year of a visibility impairing pollutant. The 26 source categories under the Federal Clean Air Act that are eligible for BART include the following types of stationary sources: (1) Fossil-fuel fired steam electric (13) Phosphate rock processing plants, plants of more than 250 million BTUs (14) Coke oven batteries, per hour heat input, (15) Sulfur recovery plants, (2) Coal cleaning plants (thermal dryers), (16) Carbon black plants (furnace process), (3) Kraft pulp mills, (17) Primary lead smelters, (4) Portland cement plants, (18) Fuel conversion plants, (5) Primary zinc smelters, (19) Sintering plants, (6) Iron and steel mill plants, (20) Secondary metal production facilities, (7) Primary aluminum ore reduction plants, (21) Chemical process plants, (8) Primary copper smelters, (22) Fossil-fuel boilers of more than 250 (9) Municipal incinerators capable of million BTUs per hour heat input, charging more than 250 tons of refuse (23) Petroleum storage and transfer facilities per day, with a capacity exceeding 300,000 (10) Hydrofluoric, sulfuric, and nitric acid barrels, plants, (24) Taconite ore processing facilities, (11) Petroleum refineries, (25) Glass fiber processing plants, and (12) Lime plants, (26) Charcoal production facilities.
36 40 CFR §51, Appendix Y and 70 Fed. Reg. 39160 (July 6, 2005)
6-1

Based on the MANE-VU contribution assessment (NESCAUM, 2006b), every MANE-VU state with BART-eligible sources contributes to visibility impairment at a Class I area to a significant degree. Therefore, this supported the decision made by the MANE-VU Board in June 2004, that if a source is “eligible” for BART, it is “subject” to BART. The CAA section 169A(b)2 and 40 CFR §51.308(e)(1)(ii) provide a state with this discretion as discussed in the Regional Haze revisions at 71 Fed. Reg. 60615 (October 13, 2006). Once a source has been identified as BART-eligible and “subject” to BART, it must conduct an analysis to determine the “best system of continuous emission control technology available and associated emission reductions achievable for each BART eligible source that is subject to BART within the State.”37 The Federal Regional Haze regulations require38 consideration of the technology available as well as five additional factors:
(1) the costs of compliance, (2) the energy and non-air quality environmental impacts of compliance, (3) any existing pollution control technology in use at the source, (4) the remaining useful life of the source, and (5) the degree of visibility improvement which may reasonably be anticipated from the use of BART.
Given the finding that all of the BART-eligible sources contribute to visibility impairment to some degree, New Jersey does not expect the fifth factor to play in the BART control determination process. Appendix Y to 40 CFR §51.308, Guidelines for BART Determinations Under the Regional Haze Rule, gives the states discretion to determine the weight and significance to be assigned to each factor. Once the SIP is approved by the USEPA, New Jersey may allow the BART facility up to five years to install the appropriate controls and comply with the emission levels which result from the BART determination.39 Where BART is not already in place, New Jersey plans to set a compliance date on a case-by-case basis through the operating permit revision process, and with single source SIP revisions. The BART process is discussed in more detail in the MANE-VU Five-Factor Analysis of BART-eligible Sources40, included in Appendix G-4. 6.2 Description of BART-Eligible Sources in the State of New Jersey Five facilities were determined to be BART-eligible and subject to BART based on the discussion in section 6.1. The five facilities are listed in Table 6.1. These facilities were identified in an analysis conducted by the Northeast States for Coordinated Air Use Management (NESCAUM) for New Jersey and other MANE-VU members using the BART guidelines in the BART Rule.41 The BART-eligible facilities in New Jersey fall into two of the 26 targeted
37 40 CFR §51.308(e)(ii)(A) 38 Ibid 39 40 CFR §51.308(e)(1)(iv) 40 Mid-Atlantic/Northeast Visibility Union Regional Planning Organization. “Draft Five-Factor Analysis of BART-Eligible Sources.” February 7, 2007 41 40 CFR §51, Appendix Y
6-2

categories, petroleum refineries and power plants. A detailed description of each BART-eligible facility is included in the MANE-VU Five-Factor Analysis of BART-eligible Sources42. Other facilities which were in one of the 26 source categories, but were determined to have total potential emissions of less than 250 tons/year of a visibility impairing pollutant are: General Chemical LLC, Kinder Morgan, Shell – Sewaren Terminal, Bayway Chemical Plant, Colorite and Griffin Pipe Products. Therefore, these facilities are not BART eligible. The NJDEP requested by letter, dated November 1, 2006, that four of the five facilities listed in Table 6.1, not including Chevron (at the time Chevron was not anticipated to be a BART facility), review and confirm their applicable emissions units. The letters are included in Appendix G-5. The NJDEP received written responses to the November 1, 2006 NJDEP letters from two of the facilities, Sunoco and ConocoPhillips, which are included in Appendix G-6. The NJDEP also conducted a conference call with PSEG regarding BART. Additional discussion regarding the responses to the November 1, 2006 NJDEP letters is also included in Appendix G-6.
Table 6.1: BART-Eligible Facilities in the State of New Jersey Source Pollutants Location (County) Facility I.D PSEG – Hudson NOx, SO2, PM Hudson 12202 Chevron NOx, SO2, PM Middlesex 18058 Amerada Hess NOx, SO2 Middlesex 17996 ConocoPhillips NOx, PM, SO2 Union 41805 Sunoco Eagle Point NOx, PM, SO2 Gloucester 55781
6.3 Determination of BART Requirements for Identified BART-Eligible Sources and
Analysis of the Best System of Control for Each Source The BART-affected emission units are those with start-up dates between August 7, 1962 and August 7, 1977, and having cumulative potential emissions for SO2 or for NOx greater than 40 tons per year for such pollutant(s), or for PM10 greater than 15 tons per year of such pollutant. A case-by-case BART analysis is required to address air pollution control measures for each pollutant that exceeds the plant-wide thresholds.43
In addition to the November 1, 2006 letter discussed above, New Jersey sent letters to the five BART-eligible facilities listed in Table 6.1, on March 3, 2009, requesting that they perform the required BART determination. The March 3, 2009 letters are included in Appendix G-7. To date, the NJDEP received written responses to the March 3, 2009 letter from all five facilities: PSEG, Chevron, ConocoPhillips, Hess, and Sunoco, which are included in Appendix G-8. Additional discussion regarding the responses is also included in Appendix G-8.
42 Mid-Atlantic/Northeast Visibility Union Regional Planning Organization. “Draft Five-Factor Analysis of BART-Eligible Sources.” February 7, 2007 43 70 Fed. Reg. 39117 (July 6, 2005)
6-3

Given the State’s adopted rules that are part of the 8-hour ozone and PM2.5 SIPs, and the consent decree agreements which apply to most major emission units at BART-eligible facilities, the State does not expect that the BART evaluations will identify significant additional emission reductions. Beginning in 2000, the USEPA and NJDEP entered into, or continue to negotiate, consent decrees (CDs) addressing air contaminant emissions from the petroleum refineries in New Jersey. ConocoPhillips and Sunoco Eagle Point have finalized consent decrees. Amerada Hess is in the process of discussions with USEPA and NJDEP to resolve issues as part of the federal refinery initiative. The consent decrees require implementation of control technologies, performance standards, emissions caps, and optimization plans to achieve significant reductions of SO2, NOx and PM, as well as reductions of benzene and VOCs. The focus of the consent decrees include fluidized catalytic cracking units (FCCUs), heaters and boilers (and fuel gas combustion devices), flares, and sulfur recovery units. The consent decrees are included in Appendices G-9 through 15. Many of the units covered by the consent decrees have also been identified as affected units at BART-facilities. All BART-affected units, including those covered by the consent decrees, will be included in a top-down BART analysis, which may result in additional air pollution control being required to satisfy BART requirements. In regard to BART-affected emission units at PSEG – Hudson Generating Station, New Jersey, the emission limits for the Unit 2 coal-fired boiler are consistent with the USEPA’s presumptive BART limits for SO2,44 and more stringent than those established for NOx.45 The PM, NOx and SO2 air pollution controls being installed on this coal-fired boiler, pursuant to a consent decree (CD), will satisfy BART requirements. Other lesser operations at this facility, such as the coal handling systems, are not subject to the presumptive norms, and will need a case-by-case evaluation and may need to reduce emissions to comply with BART requirements. New Jersey’s preliminary BART evaluation for four of the BART-eligible facilities (PSEG-Hudson, Amerada Hess, ConocoPhillips, and Sunoco Eagle Point) is as follows: Sulfur Dioxide (SO2) – The major SO2 emitting equipment at these four facilities are likely to be better than, or equal to, BART control, or there are enforceable agreements which are likely to be better than, or equal to, BART control.
• All four facilities either have BART scrubbers, or have enforceable commitments for BART scrubbers, on the major SO2 emitting equipment, which are the refinery Fluid Catalytic Cracking Units (FCCUs) and the coal-fired Electric Generating Units (EGUs).
• The future anticipated sulfur in fuel rule will be BART for any oil firing at these facilities. Oil firing is very limited at these facilities.
• The United States Environmental Protection (USEPA) requirements limiting the sulfur content in refinery gas is BART.
• The SO2 control on desulfurization equipment at the refineries is BART. 44 70 Fed. Reg. 39132 (July 6, 2005) 45 70 Fed. Reg. 39135 (July 6, 2005)
6-4

Nitrogen Oxide (NOx) – The control of major NOx emitting equipment at these facilities, as required by the Consent Decrees, is likely to be BART for the coal-fired EGU and also may be BART for the FCCUs.
• The EGU will have both low NOx burners and Selective Catalytic Reduction (SCR), with an emission limit of 0.1 lb NOx per million BTU, 30 day average, which is equal to, or better than, BART.
• The Consent Decree NOx limits for refinery heaters are likely to be BART for most heaters. However, the nationwide averaging allowed by the Consent Decrees could result in some heaters remaining with relatively high NOx limits. Consequently, the refineries are expected to be subject to new rules for NOx which may require further emission reductions than required by the consent decrees, including maximum NOx emission limits for each heater. These new rules, which will be equal to or better than BART for refinery heaters, are expected to be proposed in 2010
• The consent decree NOx limits for the FCCUs will be further evaluated to determine if they are BART. The FCCU’s will be subject to the new refinery rules for NOx which may require further emission reductions than required by some of the Consent Decrees. The new refinery rules for the FCCU’s will be equal to, or better than BART.
Directly Emitted Particulate Matter (PM) – The control of PM emitting major equipment at these facilities will be equal to or better than BART for the coal-fired EGU, and are now likely BART for the FCCUs at the refineries.
• The coal-fired EGU will be controlled by a baghouse with a particulate emission limit of 0.0150 lb/million btu, which is equal to or better than BART.
• The FCCU’s are all already subject to the New Jersey particulate emission limit of 0.02 grains per standard cubic foot of flue gas (gr/scf). This is likely to be BART, but we are asking the refineries to further evaluate the feasibility of lower allowable emission levels in the BART evaluation.
Minor Emitting Equipment – The vast majority (well over 90 percent (%)) of SO2, NOx, and PM emissions at these four facilities are emitted by the major equipment discussed above, most of which are likely to already have BART, or enforceable BART agreements for control that is BART. The Department is requiring these facilities to also evaluate all the other smaller BART affected equipment at these facilities, to ensure the smaller equipment emission limits are also BART. New Jersey’s regulations for coal-fired boilers serving EGUs were revised on March 20, 2009. Unless subject to more stringent permit limits or otherwise specified in an enforceable agreement, the regulations require the following limits for coal-fired boilers serving EGUs:
• 0.030 lb/MMBtu PM limit for existing coal-fired boilers and 0.0150 lb/MMBtu PM limit for new, or reconstructed particulate control effective May19, 2009,
• 0.150 lb/MMBtu SO2 limit on 30-calendar-day rolling average and 0.250 lb/MMBtu on 24-hour emission rate effective December 15, 2012, and
• 1.50 lb/MWh NOx limit on a 24-hour daily basis effective May 15, 2012.
6-5

New Jersey plans to propose a new refinery rule in 2010, which will consolidate and revise existing rules for FCCUs, flares, heaters and boilers, and Leak Detection and Repair (LDAR). BART determinations will be finalized in accordance with the schedule in Table 6.2.
Table 6.2: Anticipated Schedule for BART Determinations
Task Anticipated Schedule 1. Facility submits proposed BART evaluation and control plan to NJDEP
July 2009
2. NJDEP determines technical completeness December 2009 3. NJDEP issues public notice for single source SIP revision, and if necessary, significant modification of facility operating permit
February 2010
4. NJDEP addresses public comments, finalizes BART determinations, and submits BART determinations, and if necessary significant modification of facility operating permit, including BART installation deadlines, to USEPA for approval
May 2010*
5. Single source SIP revision, and if necessary, operating permit revision, finalized
Contingent upon USEPA approval
* Barring any extensive comment from the public 6.4 Analysis of Visibility Improvement Achievable from all BART Sources in the
Region One of the factors which can be considered to determine “subject to” BART is a determination of whether the emissions from the source reasonably cause or contribute to visibility impairment in any Class I area. MANE-VU used the cumulative assessment of contribution option46 to analyze the contribution to visibility impairment of all BART-eligible facilities within the region. As a result of NESCAUM’s cumulative assessment (NESCAUM, 2006b) of the sources in MANE-VU, it was determined every BART-eligible facility contributes to visibility impairment to some degree.47 In June 2004, the MANE-VU Board made a decision48 that if a source is eligible for BART, it is subject to BART based on the MANE-VU contribution assessment (NESCAUM, 2006b), that every MANE-VU state with BART-eligible sources contributes to visibility impairment at a Class I area to a significant degree. The CAA section 169A(b)2 and 40 CFR §51.308(e)(1)(ii) provide a state with this discretion as discussed in the Regional Haze revisions at 71 Fed. Reg. 60615 (October 13, 2006). New Jersey agrees with the use of a cumulative assessment and will not include source specific visibility assessment as an exemption criterion in
46 70 Fed. Reg. 39163 (July 6, 2005) 47 Mid-Atlantic/Northeast Visibility Union Regional Planning Organization. “Draft Five-Factor Analysis of BART-Eligible Sources.” February 7, 2007 48 Ibid
6-6

its BART analysis. More details regarding NESCAUM’s visibility modeling can be found in the MANE-VU Five-Factor Analysis of BART-eligible Sources.49
49 Ibid
6-7
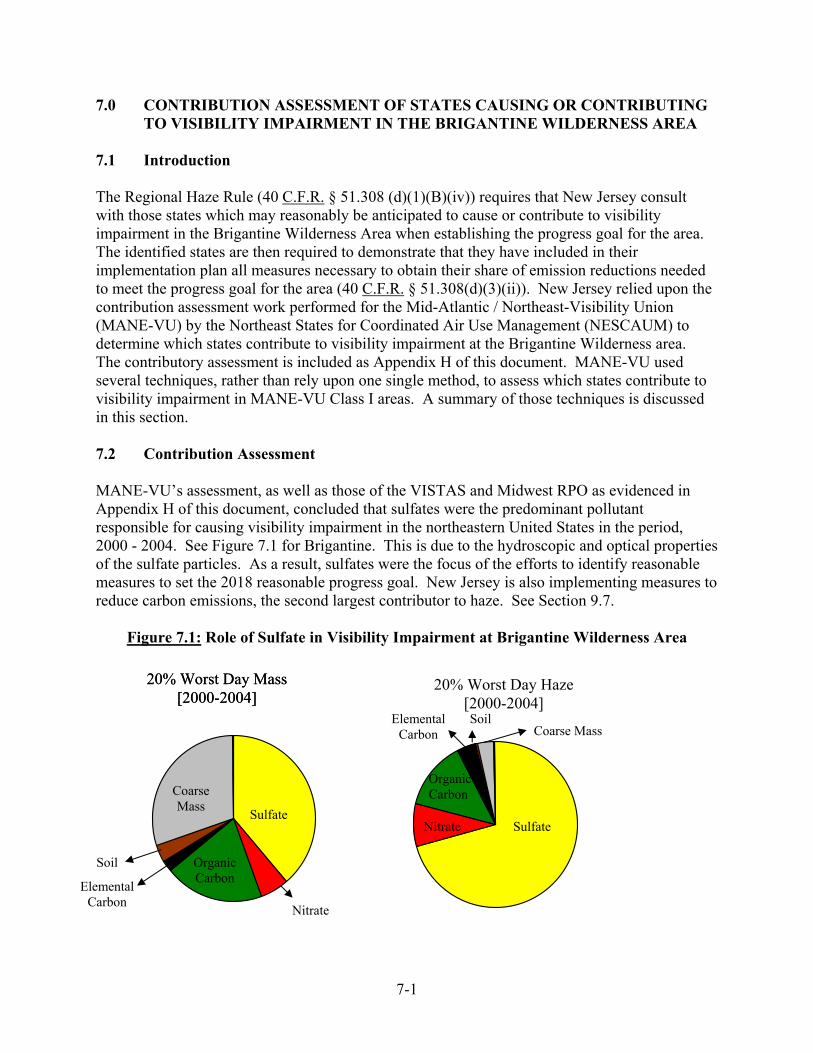
7.0 CONTRIBUTION ASSESSMENT OF STATES CAUSING OR CONTRIBUTING TO VISIBILITY IMPAIRMENT IN THE BRIGANTINE WILDERNESS AREA
7.1 Introduction The Regional Haze Rule (40 C.F.R. § 51.308 (d)(1)(B)(iv)) requires that New Jersey consult with those states which may reasonably be anticipated to cause or contribute to visibility impairment in the Brigantine Wilderness Area when establishing the progress goal for the area. The identified states are then required to demonstrate that they have included in their implementation plan all measures necessary to obtain their share of emission reductions needed to meet the progress goal for the area (40 C.F.R. § 51.308(d)(3)(ii)). New Jersey relied upon the contribution assessment work performed for the Mid-Atlantic / Northeast-Visibility Union (MANE-VU) by the Northeast States for Coordinated Air Use Management (NESCAUM) to determine which states contribute to visibility impairment at the Brigantine Wilderness area. The contributory assessment is included as Appendix H of this document. MANE-VU used several techniques, rather than rely upon one single method, to assess which states contribute to visibility impairment in MANE-VU Class I areas. A summary of those techniques is discussed in this section. 7.2 Contribution Assessment MANE-VU’s assessment, as well as those of the VISTAS and Midwest RPO as evidenced in Appendix H of this document, concluded that sulfates were the predominant pollutant responsible for causing visibility impairment in the northeastern United States in the period, 2000 - 2004. See Figure 7.1 for Brigantine. This is due to the hydroscopic and optical properties of the sulfate particles. As a result, sulfates were the focus of the efforts to identify reasonable measures to set the 2018 reasonable progress goal. New Jersey is also implementing measures to reduce carbon emissions, the second largest contributor to haze. See Section 9.7.
Figure 7.1: Role of Sulfate in Visibility Impairment at Brigantine Wilderness Area
20% Worst Day Mass [2000-2004]
20% Worst Day Haze [2000-2004]
Coarse Mass
SulfateNitrate
Organic Carbon
Elemental Carbon
Soil
Soil
Coarse Mass
Elemental Carbon
Organic Carbon
Nitrate
Sulfate
20% Worst Day Mass [2000-2004]
7-1

The techniques used in MANE-VU’s contribution assessment are discussed in the next subsections. These methods are based on emission inventory and meteorological data analysis as well as three dimensional models which considered emissions, meteorology and the atmospheric process. 7.3 Contribution Assessments Based on Emissions Inventories Two data analysis methods were developed that directly combine emission inventory data with meteorological data in order to provide first-order contributions to observed sulfate from individual states. The first approach, known as “Q/d,” evaluates the state contribution as a ratio of the total SO2 emissions from that state and the distance from the state to the receptor. States and sources were assigned wind sectors to account for prevailing wind patterns in establishing contributions. The second approach, known as “Emissions times Upwind Probability,” evaluates each state’s contribution by considering wind patterns. This approach determines the residence times at particular location for the air parcels using back trajectories. See Appendix A of the MANE-VU Contribution Assessment, located in Appendix H-1, for a more detailed description of trajectory methods. The back trajectory-derived residence times for the air parcels were mapped onto a grid to create a “residence time probability field,” which was then multiplied by an SO2 emissions field to obtain estimated source contributions. The results of these two approaches are computed for Class I areas in and around the MANE-VU region. 7.3.1 Sulfur Dioxide Emissions Divided by Distance For specific receptor locations, like a Class I visibility area, relative impacts from an upwind source decrease with increasing distance from the source as pollutants are dispersed in the atmosphere and removed through deposition. For a non-reactive primary pollutant, the relationship between down wind concentrations at a receptor and emissions from a source can be approximated as a function of 1/d2, where d represents the distance between the source and the receptor. For secondary pollutants like sulfate, where reductions in ambient concentrations occur as a result of atmospheric processes other than dispersion, including deposition of sulfate on surfaces, the relationship between down wind concentrations at a receptor and emissions from a source is better characterized by the function 1/d.50 During regional sulfate episodes when sulfur conversion rates are enhanced by the presence of gas and aqueous-phase oxidants, pollutant concentrations decline even less rapidly with distance as accelerated aerosol formation rates work to both generate more sulfate and reduce the remaining sulfur available for deposition (deposition rates are roughly an order of magnitude slower for sulfate than for SO2). Table 7.1 shows the relative contribution of states and Canadian provinces on Brigantine Wilderness area. The principal contributors of sulfate to the Brigantine Wilderness Area, according to the Q/d method, include the mid-western states of Indiana and Ohio, as well as Pennsylvania and New York.
50 MANE-VU Contribution Assessment. August 2006
7-2
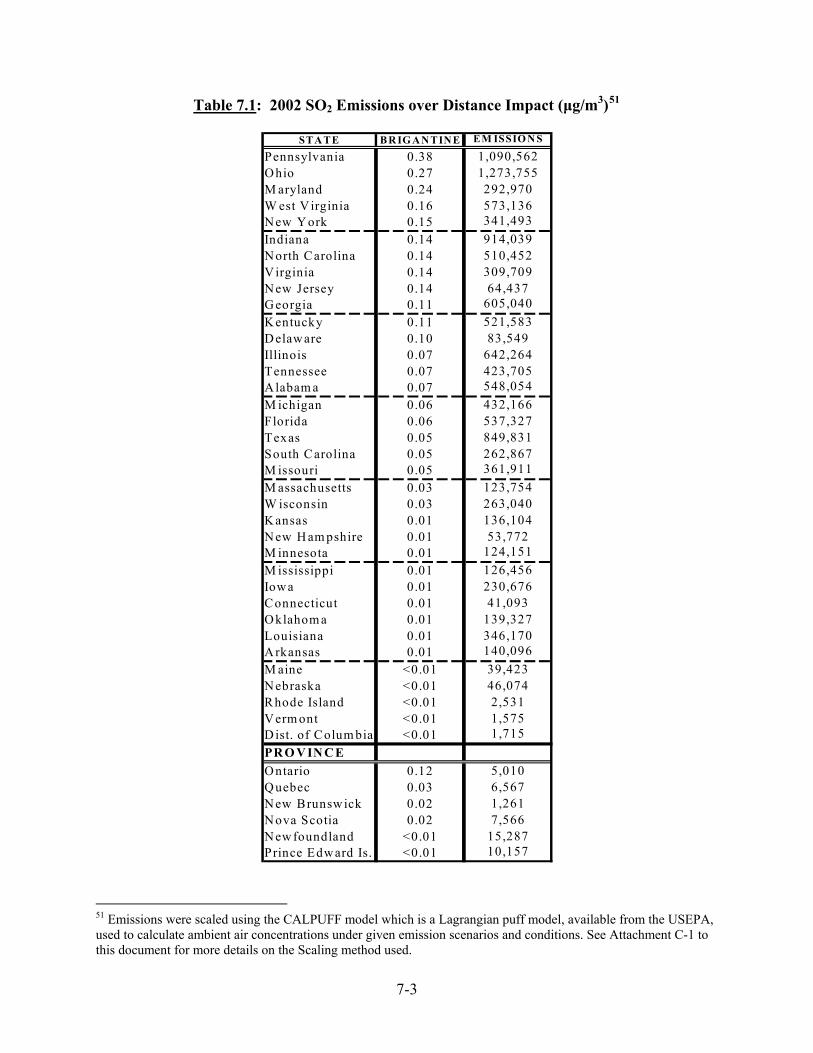
Table 7.1: 2002 SO2 Emissions over Distance Impact (μg/m3)51
STA TE BR IG A N TIN E EM ISSIO N S
Pennsylvania 0.38 1,090,562Ohio 0.27 1,273,755M aryland 0.24 292,970W est V irginia 0.16 573,136New Y ork 0.15 341,493Indiana 0.14 914,039North Carolina 0.14 510,452Virginia 0.14 309,709N ew Jersey 0.14 64,437Georgia 0.11 605,040Kentucky 0.11 521,583Delaware 0.10 83,549Illinois 0.07 642,264Tennessee 0.07 423,705Alabam a 0.07 548,054M ichigan 0.06 432,166Florida 0.06 537,327Texas 0.05 849,831South Carolina 0.05 262,867M issouri 0.05 361,911M assachusetts 0.03 123,754W isconsin 0.03 263,040Kansas 0.01 136,104New H am pshire 0.01 53,772M innesota 0.01 124,151M ississippi 0.01 126,456Iowa 0.01 230,676Connecticut 0.01 41,093Oklahom a 0.01 139,327Louisiana 0.01 346,170Arkansas 0.01 140,096M aine <0.01 39,423Nebraska <0.01 46,074Rhode Island <0.01 2,531Verm ont <0.01 1,575Dist. of Colum bia <0.01 1,715PRO VIN CEOntario 0.12 5,010Quebec 0.03 6,567New Brunswick 0.02 1,261Nova Scotia 0.02 7,566New foundland <0.01 15,287Prince Edward Is. <0.01 10,157
51 Emissions were scaled using the CALPUFF model which is a Lagrangian puff model, available from the USEPA, used to calculate ambient air concentrations under given emission scenarios and conditions. See Attachment C-1 to this document for more details on the Scaling method used.
7-3

Figure 7.2 shows the cumulative fraction of the states and provinces at Brigantine Wilderness Area Figure 7.2: Cumulative Sulfate Contributions to the Brigantine Wilderness Area based on Emissions divided by Distance (Q/d) Results
0.0
0.2
0.4
0.6
0.8
1.0
PA
OH
MD
Can
ada
WV NY
VA IN NJ
NC
GA KY
DE IL TN AL MI
TX SC FL MO
MA
WS KS
CT
MS
OK
NH
MN LA IA AR
ME
NE
DC RI
VT
State
Cum
ulat
ive
Con
trib
utio
n
The top 14 states from Figure 7.1 contribute about 80 percent of the total sulfate contribution in the Brigantine Wilderness Area. 7.3.2 Emissions times Upwind Probability The Emissions times Upwind Probability method for assessing contribution to pollution involves multiplying the back-trajectory calculated residence time probability for a grid cell with the total emissions from that grid cell and associated with a political jurisdiction such as a state. The back trajectories52 used in this study were calculated by the HYSPLIT system.53,54 For this analysis, five years of 72-hour back trajectories were calculated eight times per day, 14,600 back trajectories in total. The resulting matrix of emissions and air parcel residence times contain the
52 A back trajectory is the path that a parcel of air is calculated to have taken prior to its arrival at a given receptor (see Chapter 5 of the MANE-VU Contribution Assessment in Appendix H of this document). 53Draxler, R.D. and Hess, G.D., “Description of the HYSPLIT-4 Modeling System,” NOAA Technical Memorandum ERL, ARL-224, Air Resources Laboratory, Silver Springs, Maryland, 24 pgs., 1997. 54Draxler, R.D. and Hess, G.D., “An Overview of the HYSPLIT-4 Modeling System for Trajectories, Dispersion, and Deposition,” Australian Meteorological Magazine, 1998, 47, 295-308.
7-4

SO2-weighted residence times that are then numerically integrated within the boundaries of each state to define a “contribution” for each state. This provides a relative ranking of contribution by state that can be used to compare with other methods of attribution.55
The area of analysis included states from Maine to Mississippi. Several states lie on the periphery of the available SO2 emissions field and were used in the study despite an incomplete inventory of SO2 emissions for the far edges of each state; these included Missouri, Arkansas, Mississippi, Alabama, and Georgia.56 Canada has significant SO2 emissions in the domain of the SO2 grid, hence contributions have been calculated for portions of Ontario, Quebec and New Brunswick that were within the SO2 emission grid. Table 7.2 provides a ranking of state contributions.
55 Note that the absolute units are expressed as nmole/hr, which represent a fractional contribution of a grid cell’s emission rate that is likely to influence a downwind receptor. The physical meaning of this contribution is not clear, so this has been used in a relative sense only. 56 These states still had significant areas that were not covered by the SO2 grid. Thus only a fraction of these states’ emissions were included in the total state contribution. The following are estimates of the area not covered by the SO2 grid: MO-20%, AR-10%, MS-25%, AL-20%, GA-5%.
7-5

Table 7.2: 2002 SO2 Upwind Probability
STATE OR COUNTRY BRIGANTINEPennsylvania 13%Ohio 10%West Virginia 9%New Jersey 7%Kentucky 6%Virginia 6%Indiana 5%North Carolina 5%New York 4%Illinois 4%Georgia 4%Maryland 4%Michigan 2%Tennessee 2%Alabama 2%South Carolina 2%Delaware 2%Wisconsin 1%Missouri 1%Massachusetts <1%New Hampshire <1%Minnesota <1%Connecticut <1%Maine <1%Iowa <1%Dist. Of Columbia <1%Arkansas <1%Mississippi <1%Vermont <1%Louisiana <1%Rhode Island <1%Texas <1%Canada 8%
7-6

Figure 7.3: Cumulative Sulfate Contributions to the Brigantine Wilderness Area based on Emission times Upwind Probability (E x UP) Results
0
0.2
0.4
0.6
0.8
1
PA
OH
WV
Can
ada
NJ
VA KY IN NC NY IL GA
MD MI
TN SC
DE AL WS
MO
MN
MA
DC CT IA AR
NH
MS LA ME RI
VT
TX
State
Cum
ulat
ive
Con
trib
utio
n
The top 12 states from Figure 7.3 contribute about 80 percent of the total sulfate contribution in the Brigantine Wilderness Area. 7.4 Contribution Assessments Based on Dispersion Models The MANE-VU Contribution Assessment also explored the use of lagrangian puff dispersion models such as CALPUFF for estimating source contributions and compares two related but distinct versions of the CALPUFF modeling system that demonstrate the sensitivity of this tool to emissions and meteorology inputs. Dispersion models are commonly used to study the impacts of pollutant plumes or specific point source emissions on surrounding areas. The scale of these models has traditionally been limited to a few hundred kilometers because of a perceived lack of ability to accurately reproduce horizontal dispersion beyond these distances. Recent advances in the CALPUFF system including enhancements to its horizontal diffusion and dispersion algorithms as well as the addition of chemical transformation parameterizations have resulted in improved performance over much greater distances. The CALPUFF modeling domain was designed to be consistent with the other modeling systems (e.g., REMSAD, CMAQ) described in Section 7.5 and the MANE-VU Contribution Assessment report (Appendix H), enabling the comparison of the impacts from sources of sulfate-related visibility impacts in the MANE-VU region. Two different meteorological fields were considered
7-7

as part of the analysis, one based on the MM5 model57 and one based on the National Weather Service (NWS) data.
Figure 7.4: Modeled 2002 Contributions to Sulfate by State or Country at Brigantine
0%
10%
20%
30%
40%
50%
60%
70%
80%
90%
100%
MM5-basedMeteorology(MDE/MDNR)
NWS-basedMeteorology (VT DEC)
Canada(b)TX(a)VTMS(a)RISD(a)ND(a)MEDCNE(a)OK(a)NHCTKS(a)AR(a)MNIAAL(a)MOWISCGA(a)ILMATNMIDEKYNJNCNYINVAWVMDOHPA
Depending upon the meteorological fields, 12 – 14 states contribute 80 percent (%) of the sulfate mass at the Brigantine Wilderness Area. 7.5 Contribution Assessments Based on Grid Models The MANE-VU Contribution Assessment also used the Eulerian grid model, Regulatory Modeling System for Aerosols and Deposition (REMSAD), in the analysis. This type of model is likely to yield a more definitive assessment of contribution from different sources. Eulerian or “grid” models strive to provide a comprehensive accounting of the impacts from the emissions by considering the meteorological dynamics, chemical production, transformation, and destruction as well as wet and dry deposition and microphysical processes. With this degree of sophistication also comes attendant uncertainty, thus the consideration of more than one analysis system. 57 http://www.mmm.ucar.edu/mm5/
7-8

REMSAD was used with a 12 km grid in the eastern United States domain. The air quality was modeled using 22 vertical layers with hourly temporal resolution for the entire calendar year 2002. REMSAD has simplified chemistry but allows for emissions tracking of sulfate, nitrate, and mercury through a tagging feature that calculates the contribution of specific sources to ambient concentrations, visibility impacts, and wet or dry deposition. REMSAD model was used primarily for attribution of sulfate species in the eastern United States via the species-tagging scheme included in Version 7.10 and newer versions of the model. Sulfate is the focus of the regional haze plan for the first milestone period year (2018) in the MANE-VU Class I states. The left side of Figure 7.5 presents the IMPROVE monitored data by species for 2000-2004 (the baseline years), the center provides the REMSAD modeling results for 2002 indicating the contributions of the measured sulfate concentrations by states and regions, and, on the right, three maps indicating meeting the following criteria:
1. States/regions that contributed 0.1 µg/m3 sulfate or greater on the 20% worst visibility days in the base year (2002)
2. States/regions that contributed at least 2% of total sulfate observed on 20% worst visibility days in 2002
3. The top ten contributing states on the 20% worst visibility days in 2002.
Figure 7.5: Modeled 2002 Contributions to Sulfate by State or Country at Brigantine
Brigantine20% Worst Days
0
5
10
15
20
25
Brigantine
Sulfate Nitrate EC OC Sea Salt Soil
0%
10%
20%
30%
40%
50%
60%
70%
80%
90%
100%
Brigantine
CA NA DA
CENRA P
SE_BC
W_BC
N_BC
V T
RI
ME
DC
MS
CT
NH
MA
WI
NY
A L
IL
SC
MI
KY
TN
IN
NJ
DE
GA
WV
MD
V A
NC
OH
PA
0.1 µg/m3 Sulfate
2 % of Sulfate
#
Top 10 States
IMPROVE mass 00-04 Threshold optionsREMSAD 2002 Contribution to Sulfate
μg/m
3
#
#
7-9

7.5.1 Model Performance Evaluation The first step in the modeling process is to verify the model’s performance in terms of its ability to predict fine particles and other airborne pollutant concentration fields in the right locations and at the right levels. To do this, model predictions for the base year simulation are compared to the actual ambient data observed in the historical episode. This verification is a combination of statistical and graphical evaluations. If the model appears to be predicting fine particles and other airborne pollutants in the right locations for the right reasons, then the model can be used as a predictive tool to evaluate various control strategies and their effects on regional haze. The Regional Modeling System for Aerosols and Deposition (REMSAD) is a three-dimensional Eulerian model designed to support a better understanding of the distributions, sources, and removal processes relevant to fine particles and other airborne pollutants. It calculates the concentrations of both inert and chemically reactive pollutants by simulating the physical and chemical processes in the atmosphere that affect pollutant concentrations. The results of a model performance were examined prior to using REMSAD’s results to support MANE-VU’s contribution assessment. The performance of REMSAD was evaluated and found to meet the performance criteria set in USEPA guidance.58 Modeling results were compared with IMPROVE measurement, and showed that REMSAD’s simulation field is well-matched with measurement data. 7.6 Identification of States that Contribute to Visibility Impairment at the Brigantine
Wilderness Area The different methods employed in the Contribution analysis yield similar results. The same states appear as the greatest contributors to sulfate levels in the Brigantine Wilderness Area.
For the purposes of the first progress goal (2018) for the Brigantine Wilderness Area, New Jersey identified the states causing or contributing to visibility impairment at the Brigantine Wilderness Area using the techniques listed in Table 7.3.
58 USEPA. Guidance on the Use of Models and Other Analyses for Demonstrating Attainment of Air Quality Goals for Ozone, PM2.5, and Regional Haze. United States Environmental Protection Agency, office of Air Quality Planning and Standards, Air Quality Analysis Division, Air Quality Modeling Group, Research Triangle Park, NC, EPA-454/B-07-002, April 2007
7-10
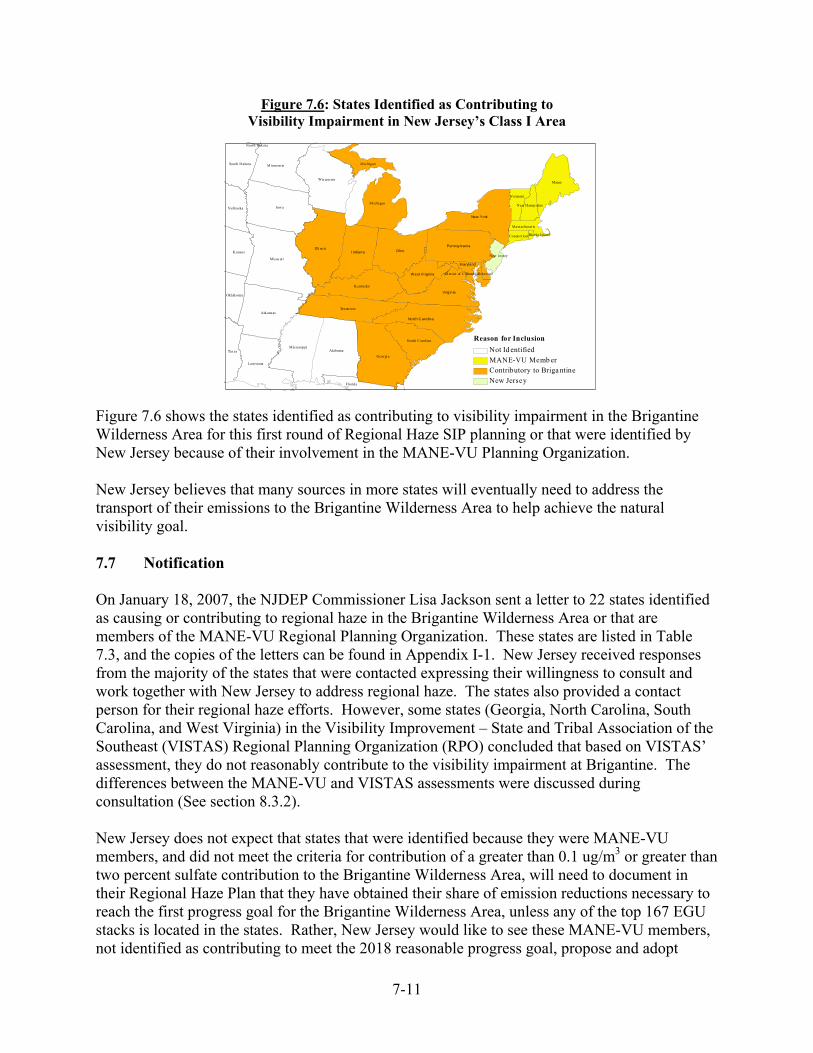
Figure 7.6: States Identified as Contributing to Visibility Impairment in New Jersey’s Class I Area
New Jersey
Illi no is
Georgi a
M ichi gan
Kentuck y
Ten nessee
South Carolina
M ic higan
DelawareDi st rict of Columbia
Ohi o
Virginia
I ndiana
New York
Pennsy lvania
North C arolina
West Virginia
Maryland
Maine
Vermon t
Mass achu set ts
Con nect icut
New H amp shi re
Rho de Is land
Iowa
Mis so uri
Ark ans as
Alabama
Wis co n si n
Louisiana
Mis si ss ip pi
M inneso ta
K ansas
Tex as
N ebraska
Sou th D ako ta
Flo rid a
Ok lah o ma
No rth Dak ot a
Reason for InclusionNot Id entifiedMANE-VU Memb erContributory to Briga ntineNew Jersey
Figure 7.6 shows the states identified as contributing to visibility impairment in the Brigantine Wilderness Area for this first round of Regional Haze SIP planning or that were identified by New Jersey because of their involvement in the MANE-VU Planning Organization. New Jersey believes that many sources in more states will eventually need to address the transport of their emissions to the Brigantine Wilderness Area to help achieve the natural visibility goal. 7.7 Notification On January 18, 2007, the NJDEP Commissioner Lisa Jackson sent a letter to 22 states identified as causing or contributing to regional haze in the Brigantine Wilderness Area or that are members of the MANE-VU Regional Planning Organization. These states are listed in Table 7.3, and the copies of the letters can be found in Appendix I-1. New Jersey received responses from the majority of the states that were contacted expressing their willingness to consult and work together with New Jersey to address regional haze. The states also provided a contact person for their regional haze efforts. However, some states (Georgia, North Carolina, South Carolina, and West Virginia) in the Visibility Improvement – State and Tribal Association of the Southeast (VISTAS) Regional Planning Organization (RPO) concluded that based on VISTAS’ assessment, they do not reasonably contribute to the visibility impairment at Brigantine. The differences between the MANE-VU and VISTAS assessments were discussed during consultation (See section 8.3.2). New Jersey does not expect that states that were identified because they were MANE-VU members, and did not meet the criteria for contribution of a greater than 0.1 ug/m3 or greater than two percent sulfate contribution to the Brigantine Wilderness Area, will need to document in their Regional Haze Plan that they have obtained their share of emission reductions necessary to reach the first progress goal for the Brigantine Wilderness Area, unless any of the top 167 EGU stacks is located in the states. Rather, New Jersey would like to see these MANE-VU members, not identified as contributing to meet the 2018 reasonable progress goal, propose and adopt
7-11

through their administrative processes the agreed upon Reasonable Measures. See Section 8.4.1 for more specifics.
Table 7.3: States Invited to Consult on Establishing New Jersey’s Class I Area 2018 Reasonable Progress Goal
State Name (alphabetical order) Technique / Reason for Inclusion Connecticut MANE-VU member Delaware > 0.1 ug/m3 or > 2% Sulfate Contribution, MANE-VU member District of Columbia > 0.1 ug/m3 or > 2% Sulfate Contribution, MANE-VU member Georgia > 0.1 ug/m3 or > 2% Sulfate Contribution Illinois > 0.1 ug/m3 or > 2% Sulfate Contribution Indiana 3 of 5 techniques (Q/D, CALPUFF 1 & 2) Kentucky > 0.1 ug/m3 or > 2% Sulfate Contribution Maine MANE-VU member Maryland 4 of 5 techniques (Q/D, REMSAD, CALPUFF1 &2) Massachusetts MANE-VU member Michigan > 0.1 ug/m3 or > 2% Sulfate Contribution New Hampshire MANE-VU member New York 4 of 5 techniques (Q/D, REMSAD, CALPUFF 1 &2) North Carolina 4 of 5 techniques (Q/D, REMSAD, CALPUFF1 &2) Ohio All techniques Pennsylvania All techniques Rhode Island MANE-VU member South Carolina > 0.1 ug/m3 or > 2% Sulfate Contribution Tennessee > 0.1 ug/m3 or > 2% Sulfate Contribution Vermont MANE-VU member Virginia 4 of 5 techniques (Q/D, REMSAD, Calpuff 1 &2) West Virginia All techniques 7.8 New Jersey’s Contribution to Other Class I Areas New Jersey was identified as a MANE-VU member contributing to visibility impairment in Maine, New Hampshire, and Vermont Class I areas. New Jersey’s contribution to visibility impairment in these states is relatively small. New Jersey believes that it is contributing its fair share to improve visibility in these states, based on its control measure commitments, especially New Jersey’s performance standards for EGUs, discussed in Chapter 10 (Commitments).
7-12

8.0 REASONABLE PROGRESS GOALS AND LONG TERM STRATEGY 8.1 Introduction New Jersey is required to establish the natural visibility conditions and reasonable progress goals to provide for progress towards achieving natural visibility in 2064, for Brigantine Wilderness Area.59 The goals must be set in such a way to provide improvement in visibility on the most impaired days and ensure no degradation in visibility on the least impaired days. In defining the reasonable progress goals, New Jersey determined reasonable measures, considering the cost of compliance, the time necessary for compliance, the energy and non-air quality environmental impacts, and the remaining useful life of the existing sources subject to such requirements.60 In developing the 2018 reasonable progress goal, New Jersey relied upon information and analyses developed by MANE-VU to meet the requirements. New Jersey consulted with states identified as contributing to the Brigantine Wilderness Area (see Section 7) through a process involving the states and the Federal Land Managers to set the natural background conditions and the 2018 progress goal. This Section presents the goals and describes the process used by New Jersey to set them. 8.2 Brigantine Wilderness Area Visibility Goal Table 8.1 summarizes the existing visibility conditions and the goals as described in Section 3. The uniform rate of improvement needed to achieve the reasonable progress goal on 20% of worst visibility days by 2018 is 3.9 deciviews, or an average baseline visibility of 25.1 deciviews on 20% of worst visibility days.
Table 8.1: Visibility Goals for the Brigantine Wilderness Area
Conditions Deciviews
Natural Background Visibility on 20% of worst visibility days (Goal in 2064) 12.2 Average Baseline Visibility on 20% of best visibility days (2000 – 2004) 14.3 Average Baseline Visibility on 20% of worst visibility days (2000 – 2004) 29.0 Uniform Rate of Progress in 2018 on the 20% worst visibility days 25.1 8.3 The Process This subsection discusses the process that New Jersey and the other Class I states in MANE-VU used to develop the reasonable progress goals in MANE-VU Class I areas, which include the
59 40 C. F. R. § 51.308 (d)(1) 60 40 C. F. R. § 51.308 (d)(1)(i)
8-1

Brigantine Wilderness area. New Jersey utilized USEPA guidance61 in setting the reasonable progress goal for Brigantine. 8.3.1 Identifying Reasonable Controls and the Four Factor Analysis In accordance with 40 C.F.R. § 51.308 (d)(1)(i)(A), when establishing reasonable progress goals for each Class I area, the state must consider the costs of compliance, the time necessary for compliance, the energy and non-air quality environmental impacts of compliance, and the remaining useful life of any potentially affected sources. The SIP must include a demonstration showing how these factors were taken into consideration in setting the goal. These factors are sometimes termed the “four statutory factors,” since their consideration is required by the Clean Air Act.62
As discussed in Section 7, sulfate currently causes the most visibility impairment at the Brigantine Wilderness Area. New Jersey considers it reasonable to focus on SO2 emissions reduction measures in setting the 2018 reasonable progress goal. Based on information from the contribution assessment and additional emission inventory analyses, MANE-VU identified the following source categories for further examination as reasonable measures:
• Coal and oil-fired Electric Generating Units (EGUs) • Point and area source industrial, commercial and institutional boilers • Cement and Lime Kilns • Heating oil, and • Residential wood combustion
MANE-VU analyzed these potential source categories based on the “four statutory factors” according to 40 C.F.R. § 51.308(d)(3)(v). Detailed information on control technologies assessed is presented in the MANE-VU Reasonable Progress Report,63 Appendix N. MANE-VU determined that due to the complexities of the individual units and the lack of specific data, a generalized determination of emission reductions from the cement and lime kiln category was not reasonable at this time. However, specific controls at individual cement plants or lime kilns may be reasonable under source specific control programs (i.e., BART). Additionally, MANE-VU determined for similar reasons that it was not reasonable at this time to develop a regional residential wood combustion program. New Jersey agrees with these determinations as they apply to the region. New Jersey has no cement and lime kilns. New Jersey will consider state specific wood burning provisions as described in section 9.6. ICI boilers were not specifically included on the list of Reasonable Measures for MANE-VU States for Regional Haze, because it is not an SO2 reduction measure. However, ICI boilers were included as an OTC regional measure as discussed in the OTC February 28, 2007 report included in Appendix F-3, and was included in the BOTW modeling for New Jersey.
61 USEPA, Office of Air Quality Planning and Standards. Guidance for Setting Reasonable Progress Goals Under the Regional Haze Program. June 1, 2007. 62 Section 169A (g)(1) [42. U.S.C. 7491] 63 “Assessment of Reasonable Progress for Regional Haze in MANE-VU Class I Areas” (MACTEC, July 9, 2007)
8-2
After identifying potential control measures and performing the four factor analysis, MANE-VU performed initial modeling which showed the visibility impacts from the implementation of the measures. The initial modeling results showed that the projected 2018 visibility on the 20% worst days at the Brigantine Wilderness area was better than the uniform rate of progress. Details of MANE-VU’s initial modeling were later documented in the MANE-VU Modeling for Reasonable Progress Goals report.64 Based on the modeling results and other analysis performed by MANE-VU, the MANE-VU states developed “Asks”, which are “emission management” strategies. These strategies served as the basis for the consultation with the other states. 8.3.2 Consultation The regulations at 40 C.F.R. 51.308 (d)(1)(iv) requires states with Class I areas to develop reasonable progress goals in consultation with any state that may reasonably cause or contribute to visibility impairment in the Class I area. The rule states:
In developing each reasonable progress goal, the State must consult with those States which may reasonably be anticipated to cause or contribute to visibility impairment in the mandatory Class I Federal area. In any situation in which the State cannot agree with another such State or group of States that a goal provides for reasonable progress, the State must describe in its submittal the actions taken to resolve the disagreement. In reviewing the State's implementation plan submittal, the Administrator will take this information into account in determining whether the State's goal for visibility improvement provides for reasonable progress towards natural visibility conditions.
As stated in Section 7, as part of this consultation process, NJDEP Commissioner Lisa Jackson sent a letter to the 22 eastern states identified as contributing to regional haze in the Brigantine Wilderness Area. New Jersey received responses from the majority of the states that were contacted expressing their willingness to consult and work together with New Jersey to address regional haze. The states also provided a contact person for their regional haze efforts. However, some states (Georgia, North Carolina, South Carolina, and West Virginia) in the Visibility Improvement – State and Tribal Association of the Southeast (VISTAS) Regional Planning Organization (RPO) concluded that based on VISTAS’ assessment, they do not reasonably contribute to the visibility impairment at Brigantine. Copies of the letters sent by NJDEP to other states and responses from some states are provided in Appendix I of this plan. New Jersey consulted with contributing states in the MANE-VU, MWRPO and VISTAS regions through conference calls and in-person meetings in 2007, to compare technical work and findings, discuss any adjustments that might be appropriate, and develop mutually beneficial solutions. During consultation, the MANE-VU Class I states established a resolution setting out the principles by which the regional haze rule will be implemented. The MANE-VU states also agreed through formal statements to pursue the adoption and implementation of the reasonable measures discussed in Section 8.4. These consultations are documented in more detail in Appendix C.
64 MANE-VU Modeling for Reasonable Progress Goals. February 7, 2008
8-3

Some of the key discussions of these consultations include discussions of emission inventory issues and modeling assumptions, and a review and identification of controls at the EGUs (actual vs. IPM estimated). There was no specific guidance by the other RPOs regarding any expected reductions from non-EGUs sources, and there was conceptual agreement to explore the development of an agreement to seek additional national control programs. Based on the consultations, changes were made to the definition of reasonable measures for inclusion in the final modeling, including changes to the definition of controls on the 167 stacks. The modified emission control strategies used to define reasonable measures and the 2018 reasonable progress goal are discussed in the Section 8.4. Additionally, MANE-VU conducted several public meetings with stakeholders as part of the consultation effort to discuss the progress and results of the collaborative regional efforts. These meetings are described in Appendix C. Some issues that were raised during consultation include the Midwest RPO’s concern regarding substituting reductions from the EGU sector for reductions that may not be obtainable from the non-EGU sector and West Virginia’s concern regarding MANE-VU’s requested 28 percent (%) reduction from the non-EGU sector (See Sub-section 8.4.2 (Areas Outside MANE-VU)). West Virginia, Reliant Energy, VISTAS and Utility Air Regulatory Group (UARG) also expressed concern on MANE-VU’s final modeling (See Sub-section 8.5 (Reasonable Progress Goal for Brigantine Wilderness Area)). 8.3.3 “Asks” After reviewing the four factor analysis, MANE-VU determined its reasonable measures to begin consultation with the other states. These were labeled as the “asks.” These ”asks” were documented in two separate statements that were agreed to as a regional strategy at the June 20, 2007 MANE-VU Board meeting. They apply to the states within and outside MANE-VU who were identified as contributing to visibility impairment in any of the MANE-VU Class I areas, including the Brigantine Wilderness Area. The statements are presented in Appendices D-1 and D-2 and are summarized below.
• “Asks” within MANE-VU
o Timely implementation of BART requirements o 90 percent (%) or greater SO2 emission reductions from each of the 167 electric
generating unit (EGUs) stacks identified by MANE-VU o Low sulfur fuel oil strategy o Continued evaluation of other measures, including measures to reduce SO2 and
NOx emissions from all coal-burning facilities and promulgation of new source performance standards for wood combustion
• “Asks” outside MANE-VU
o Timely implementation of BART requirements
8-4
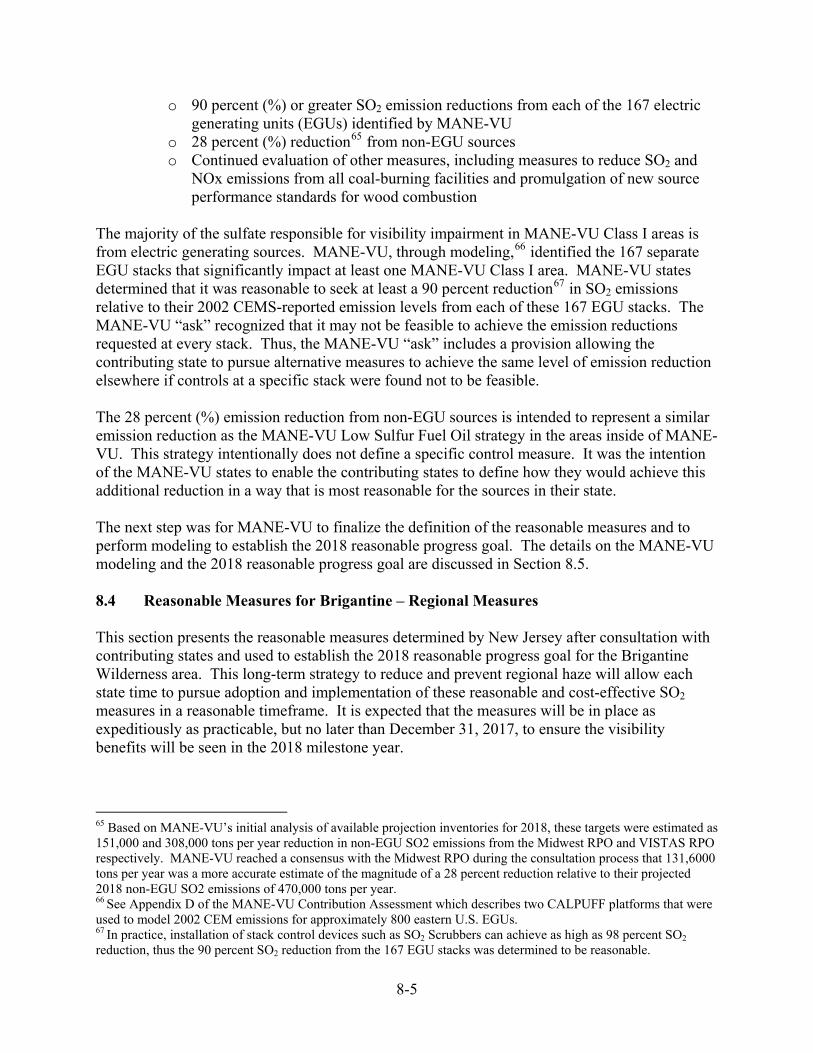
o 90 percent (%) or greater SO2 emission reductions from each of the 167 electric generating units (EGUs) identified by MANE-VU
o 28 percent (%) reduction65 from non-EGU sources o Continued evaluation of other measures, including measures to reduce SO2 and
NOx emissions from all coal-burning facilities and promulgation of new source performance standards for wood combustion
The majority of the sulfate responsible for visibility impairment in MANE-VU Class I areas is from electric generating sources. MANE-VU, through modeling,66 identified the 167 separate EGU stacks that significantly impact at least one MANE-VU Class I area. MANE-VU states determined that it was reasonable to seek at least a 90 percent reduction67 in SO2 emissions relative to their 2002 CEMS-reported emission levels from each of these 167 EGU stacks. The MANE-VU “ask” recognized that it may not be feasible to achieve the emission reductions requested at every stack. Thus, the MANE-VU “ask” includes a provision allowing the contributing state to pursue alternative measures to achieve the same level of emission reduction elsewhere if controls at a specific stack were found not to be feasible. The 28 percent (%) emission reduction from non-EGU sources is intended to represent a similar emission reduction as the MANE-VU Low Sulfur Fuel Oil strategy in the areas inside of MANE-VU. This strategy intentionally does not define a specific control measure. It was the intention of the MANE-VU states to enable the contributing states to define how they would achieve this additional reduction in a way that is most reasonable for the sources in their state. The next step was for MANE-VU to finalize the definition of the reasonable measures and to perform modeling to establish the 2018 reasonable progress goal. The details on the MANE-VU modeling and the 2018 reasonable progress goal are discussed in Section 8.5. 8.4 Reasonable Measures for Brigantine – Regional Measures This section presents the reasonable measures determined by New Jersey after consultation with contributing states and used to establish the 2018 reasonable progress goal for the Brigantine Wilderness area. This long-term strategy to reduce and prevent regional haze will allow each state time to pursue adoption and implementation of these reasonable and cost-effective SO2 measures in a reasonable timeframe. It is expected that the measures will be in place as expeditiously as practicable, but no later than December 31, 2017, to ensure the visibility benefits will be seen in the 2018 milestone year.
65 Based on MANE-VU’s initial analysis of available projection inventories for 2018, these targets were estimated as 151,000 and 308,000 tons per year reduction in non-EGU SO2 emissions from the Midwest RPO and VISTAS RPO respectively. MANE-VU reached a consensus with the Midwest RPO during the consultation process that 131,6000 tons per year was a more accurate estimate of the magnitude of a 28 percent reduction relative to their projected 2018 non-EGU SO2 emissions of 470,000 tons per year. 66 See Appendix D of the MANE-VU Contribution Assessment which describes two CALPUFF platforms that were used to model 2002 CEM emissions for approximately 800 eastern U.S. EGUs. 67 In practice, installation of stack control devices such as SO2 Scrubbers can achieve as high as 98 percent SO2 reduction, thus the 90 percent SO2 reduction from the 167 EGU stacks was determined to be reasonable.
8-5

8.4.1 MANE-VU States The reasonable emission control strategies to be implemented in the MANE-VU states to achieve the reasonable progress goal at Brigantine Wilderness Area by 2018 are listed in Table 8.2. During consultation, the MANE-VU states agreed through a statement (See Appendix D) to pursue the adoption and implementation of the reasonable measures in Table 8.3. New Jersey requests that MANE-VU members expeditiously propose and adopt, through their administrative processes, the agreed upon Reasonable Measures. New Jersey expects any state that is home to any of the 167 EGU stacks, identified by MANE-VU as contributing to haze in Class I areas, to address the emissions from the stack in their haze SIP. New Jersey recognizes that a 90 percent (%) reduction may not be feasible for every stack identified. If a state finds that such a reduction is not feasible, then New Jersey expects the state to identify the alternative measures the state will pursue to provide for equivalent emission reductions and document those measures in their SIP.
Table 8.2: Reasonable Measures for MANE-VU States (“Asks” Within MANE-VU)
BART Timely implementation of BART requirements
EGU A 90% or greater reduction in sulfur dioxide (SO2) emissions* from each of the 167 stacks identified by MANE-VU
Low Sulfur Fuel Oil Strategy S-1 S-2 Low Sulfur Oil - inner Zone (NJ, NY, PA)
Distillate 500 ppm 15 ppm
#4 0.25% sulfur 0.25% sulfur #6 0.3-0.5 %
sulfur 0.3-0.5 %
sulfur Low Sulfur Oil - outer zone (rest of MANE-VU)
Distillate 500 ppm 15 ppm
#4 0.25% sulfur #6 0.3-0.5 %
sulfur Additional Controls ** Continued evaluation of other measures, including
Energy Efficiency, Alternative Clean Fuels and other measures to reduce SO2 and NOx from all coal-burning facilities by 2018, and new source performance standards for wood combustion
* If it is infeasible for a state to achieve this level of reduction from a unit, alternative measures will be obtained. ** Not included in the Modeling
8-6

After consideration of the costs of compliance, the time necessary for compliance, the energy and non-air quality environmental impacts of compliance, and the useful life of existing sources that contribute to visibility impairment, New Jersey and the MANE-VU states believe that the reduction measures in Table 8.3 constitute reasonable progress and are necessary to achieve the Reasonable Progress Goal. Section 9 discusses the actions New Jersey will be taking to implement these reasonable measures. 8.4.2 Areas outside MANE-VU The states, outside of the MANE-VU states, found to contribute to haze at the Brigantine Wilderness Area for the 2018 milestone year are Georgia, Illinois, Indiana, Kentucky, Michigan, North Carolina, Ohio, South Carolina, Tennessee, Virginia, and West Virginia.68 The reasonable measures needed to improve visibility by the 2018 goal, developed by the MANE-VU states, during the consultation process, for the areas outside of the MANE-VU states, are listed in Table 8.3.
Table 8.3: Reasonable Measures for non-MANE-VU states (“Asks” Outside MANE-VU)
BART Timely implementation of BART requirements
EGU A 90% or greater reduction in sulfur dioxide (SO2) emissions* from each of the 167 stacks identified by MANE-VU
Non-EGU - 28 percent non-EGU SO2 reduction by 2018 for each contributing State
Additional Controls** Continued evaluation of other measures, including measures to reduce SO2 and NOx from all coal-burning facilities by 2018, and promulgation of new source performance standards for wood combustion
* If it is infeasible for a state to achieve this level of reduction from a unit, the state must identify alternative measures for equivalent emission reductions. ** Not included in the modeling. New Jersey and the MANE-VU states considered the costs of compliance, the time necessary for compliance, the energy and non-air quality environmental impacts of compliance, and the useful life of existing sources that contribute to visibility impairment, and determined that the measures listed in Table 8.3 constitute reasonable progress and are necessary to achieve the Reasonable Progress Goal. During consultation, an issue was raised regarding whether it would be acceptable for Midwest RPO states to substitute reductions from the EGU sector for reductions that may not be 68 In addition, the State of Vermont identified at least one source in the State of Wisconsin as a significant contributor to visibility impairment at the Lye Brook Wilderness Class I Area.
8-7

obtainable in the non-EGU sector. MANE-VU states indicated that this would be acceptable, depending on the location and type of the EGU source. West Virginia expressed concern that MANE-VU included a 28 percent (%) reduction from the non-EGU sector, indicating that they did not have any measures to meet this additional reduction burden. West Virginia also indicated that the additional emission reductions from the EGUs not captured in the MANE-VU modeling could cover the non-EGU sector reduction modeled. To the extent that the additional emission reductions are achieved from the EGUs and the reductions are not offset by increases by another EGU under the CAIR cap and trade program,69 New Jersey would accept these reductions to meet the non-EGU emission reduction measure included in the definition of reasonable measures for the Brigantine Wilderness Area. 8.5 Reasonable Progress Goal for Brigantine Wilderness Area To determine the reasonable progress goal (RPG) in deciviews, MANE-VU conducted an updated model simulation with refined representations of the reasonable control measures as determined through the consultation process. See Section 8.4. The final modeling included the non-EGU measure emission reductions (See Table 8.3) outside MANE-VU which were not reflected in the initial modeling, as well as updated information for the 167 EGU stacks. The EGU emission projections with the 90% control at the 167 stacks were less than the Federal Clean Air Interstate Rule (CAIR) cap. Emissions were added back into the modeling emission inventory to maintain the CAIR cap. New Jersey and other MANE-VU states consider additional EGU controls beyond CAIR as reasonable and necessary. A description of how the emissions controls were modeled to determine the visibility impact of the MANE-VU reasonable measures are documented in the MANE-VU 2018 Visibility Projections Report,70 and the Alpine Geophysics Report,71 included in Appendix J. Section 8.7 discusses the performance of the modeling system used to set the 2018 reasonable progress goal. The reasonable measures included in the final modeling would result in a 3.9 deciview improvement on the 20 percent worst days and 2.1 deciview improvement on the 20 percent best days, Table 8.4. The results indicate that the uniform rate of progress will be achieved. 69 The CAIR cap and trade program was vacated on July 11, 2008, by the United States Court of Appeal for the District of Columbia. New Jersey is currently evaluating its legal options to address the loss in emission reductions from the upwind sources. New Jersey will address this issue during its 2013 evaluation required by the visibility rule. 70 Mid-Atlantic/Northeast Visibility Union Regional Planning Organization. “Draft 2018 Visibility Projections Report.” March 31, 2008 71 Alpine Geophysics “Documentation of 2018 Emissions from Electric Generating Units in the Eastern U.S. for MANE-VU’s Regional Haze Modeling” April 2008
8-8

Table 8.4: Reasonable Progress Goals for the Brigantine Wilderness Area (all values expressed as deciviews)
Baseline
Visibility (2000-2004)
Natural Background
Conditions in 2064
Reasonable Progress Goal
for 2018
2018 CMAQ Projections
20% Worst Days 29.0 12.2 25.1 25.1 20% Best Days 14.3 5.5 14.3 12.2
The MANE-VU final modeling results were developed using the CMAQ modeling platform described in the MANE-VU Modeling for Reasonable Progress Report, Appendix N. Figure 8.1 illustrates the predicted visibility improvement by 2018, resulting from the implementation of the reasonable measures.
Figure 8.1: Projected Visibility Improvement at Brigantine Wilderness Area Based on Best and Final Modeling
0
5
10
15
20
25
30
35
1985
1990
1995
2000
2005
2010
2015
2020
2025
2030
2035
2040
2045
2050
2055
2060
2065
Year
Dec
ivew
s
20% Worst Observed20% Best Observed20% Worst Baseline20% Best BaselineUniform ProgressNo DegradationCMAQ 20% WorstCMAQ 20% Best20% Best 'Natural'
In establishing the reasonable progress goal for 2018, New Jersey recognizes that contributing states have the flexibility to submit SIP revisions between now and 2018, as they adopt reasonable control measures as expeditiously as practicable to achieve the 2018 reasonable progress goal at Brigantine Wilderness Area. It is expected that the measures will be in place no later than December 31, 2017, to ensure the visibility benefits will be seen in the 2018 milestone year. MANE-VU received comments from West Virginia, Reliant Energy, VISTAS, and the Utility Air Regulatory Group (UARG) on the final modeling. West Virginia, Reliant Energy and VISTAS objected to MANE-VU not using the same modeling emission inventory as VISTAS, specifically for the EGUs. The UARG comments focused on the fact that the MANE-VU 2018 visibility modeling report included control measures and emission reductions that went beyond currently existing regulations. They claimed that since the CAIR program and other “on the books” or “on the way” measures are projected to achieve uniform rates of progress as
8-9

previously modeled, additional reductions to both EGU and non-EGU sectors were unnecessary. The comments regarding the MANE-VU final modeling are documented in Appendix K. The USEPA rules require states to identify all reasonable measures, including potential point, area and mobile source controls to set the 2018 reasonable progress goal. New Jersey and MANE-VU’s analysis indicate that identified measures are reasonable and thus were appropriately used to set the 2018 progress goal, even if better than uniform rate of progress is achieved. The final modeling for the Brigantine Wilderness Area indicates that even with the additional reasonable measures, the uniform rate of progress benchmark will just be achieved in the Brigantine Wilderness Area. MANE-VU did not use the VISTA RPO emission inventory because the CAIR program is a cap and trade program. During the consultation, there was no enforceable mechanism to require that states stay within their budget. Thus MANE-VU chose to add back emissions to reflect the CAIR cap. This assumption provides a conservative projection of less visibility improvement. New Jersey supports enforceable measures in state haze SIPs to require at least 90% SO2 reduction at all 167 EGUs without offsetting emission increases elsewhere. 8.6 CAIR Vacatur On July 11, 2008, the United States Court of Appeals for the District of Columbia Circuit vacated the federal Clean Air Interstate Rule (CAIR). On December 23, 2008, the court remanded the CAIR to the USEPA without vacatur of CAIR “so that EPA may remedy CAIR’s flaws in accordance with” the court’s July 2008 opinion vacating CAIR. The court gave no deadline for the USEPA rulemaking, but it said:
“[W]e remind EPA that we do not intend to grant an indefinite stay of the effectiveness of this court’s decision. Our opinion revealed CAIR’s fundamental flaws, which EPA must still remedy. Further, we remind the Petitioners that they may bring a mandamus petition to this court in the event that EPA fails to modify CAIR in a manner consistent with our July 11, 2008 opinion.” (Order at 1, Dec. 23, 2008.)
Therefore, the anticipated vacatur no longer applies since a mandate by the court was never issued on the July 11, 2008 opinion (State of North Carolina v. Environmental Protection Agency, 531 F.3d 896 (D.C. Cir. 2008)). CAIR remains in full effect. The implementation of CAIR alone will not be sufficient to address interstate transport issues, especially for the Northeastern and Mid-Atlantic United States to meet the attainment requirements. To address transport and other Clean Air Act (CAA) requirements, New Jersey expects the USEPA to establish performance standards to apply to each EGU, as well as more stringent caps to achieve progress towards those performance standards and achieve additional emission reductions.
8-10

8.7 Baseline Inventory and Projections New Jersey is required to identify the baseline inventory on which the long-term strategy is based in accordance with 40 C.F.R. § 51.308(d)(3)(iii). For the MANE-VU region, New Jersey used the 2002 MARAMA inventory Version 3.0 as its baseline inventory. This inventory as well as the projection inventories used in the modeling, are discussed in Section 5 of this SIP. The regional MARAMA report documenting the development of the 2002 base year inventory is included in Appendix F-1. The regional MARAMA report documenting the development of the future year inventories for the non-EGU, area and non-road sectors, is included in Appendix F-2. The 167 EGU stacks and their baseline emissions are listed in Appendix L. For other regions, MANE-VU used inventories developed by the RPOs for those regions, including VISTAS Base G2, MWRPO’s Base K, and CENRAP’s emissions inventory as obtained. (Specific files are identified in the MANE-VU report, “Modeling for Reasonable Progress Goals” on page 1-18). VISTAS modeling for EGU’s projected total SO2 emissions for the MWRPO, MANE-VU and VISTAS to be below the CAIR cap. New Jersey supports VISTAS EGU emission inventory approach, but as previously stated, does not find a regulatory mechanism to reduce the CAIR cap, thus the rationale to the add back emissions. If the additional reductions are realized, then the interim reasonable progress goal may be achieved sooner and more progress made to reduce haze. 8.8 Model Performance Evaluation To set the 2018 reasonable progress goal, the CMAQ modeling system was utilized. One of the steps in the modeling process is to assess the modeling system’s ability to predict pollutant concentration fields in the correct locations and at the right levels and time. To do this, model predictions for the base year simulation are compared to the actual ambient data observed. This assessment involves the evaluation of statistical and graphical information. If the model appears to be predicting pollutant concentration fields appropriately, then the model can be used as a predictive tool to evaluate various control strategies and their effects on visibility. The results of a model performance evaluation were examined in accordance with the USEPA Modeling Guidance72 prior to using CMAQ’s results to support achieving the 2018 reasonable progress goal. NESCAUM conducted a performance evaluation of the 2002 base case CMAQ simulation for the pollution of interest on behalf of the MANE-VU member states. MANE-VU’s performance evaluation found the modeling tools to meet the performance criteria set in the USEPA modeling guidance. Predicted PM2.5 sulfate and measured sulfate are in 1:1 linear relationship between the model and observations. Appendix H provides comprehensive evaluation of the results.
72 USEPA. Guidance on the Use of Models and Other Analyses for Demonstrating Attainment of Air Quality Goals for Ozone, PM2.5, and Regional Haze. United States Environmental Protection Agency, Office of Air Quality Planning and Standards, Air Quality Analysis Division, Air Quality Modeling Group, Research Triangle Park, NC, EPA-454/B-07-002, April 2007
8-11

The CMAQ air quality simulations were performed cooperatively among five modeling centers: New York State Department of Environmental Conservation (NYSDEC), the New Jersey Department of Environmental Protection (NJDEP) in association with Rutgers University, the Virginia Department of Environmental Quality (VADEQ), University of Maryland (UMD), and NESCAUM. The modeling was conducted on the 12-km resolution domain for the years of 2002, 2009 and 2018. The model performance for visibility was examined based on the 2002 annual CMAQ run. Measurements from IMPROVE and STN networks were used for the evaluation. Regional haze modeling also requires a CMAQ performance evaluation for aerosol extinction coefficient (Bext) and the haze index. CMAQ prediction of the aerosol extinction coefficient at all Class I sites in the eastern United States agrees well with IMPROVE observation because CMAQ performs well on sulfate, which dominates aerosol extinction. Overall, MANE-VU CMAQ modeling for 2002 accurately portrays sulfate, PM2.5, aerosol extinction coefficient, and the Haze Index. For more details on CMAQ performance evaluation, see Appendix C of the MANE-VU Contribution Assessment report, presented in Appendix H of this report.
8-12
9.0 NEW JERSEY ACTIONS New Jersey is required to submit a long-term strategy that addresses regional haze visibility impairment for each mandatory Class I Federal area within and outside the State which may be affected by emissions from within the State in accordance with 40 C.F.R. § 51.308(d)(3). The long-term strategy must include enforceable emissions limitations, compliance schedules and other measures necessary to achieve the reasonable progress goals established by states where the Class I areas are located. This section describes how New Jersey plans to meet the long-term strategy requirements. New Jersey sources contribute to visibility impairment at the Brigantine Wilderness Area, a Class I area located in New Jersey. New Jersey is also home to four (4) of the 167 EGU stacks identified for reasonable controls. Additionally, Maine, New Hampshire and Vermont determined that New Jersey contributed to their Class I areas, Acadia National Park and Moosehorn Wilderness Area, Great Gulf Wilderness Area and Presidential Range/Dry River Wilderness Area, and Lyebrook Wilderness Area, respectively. To address the contributions, New Jersey is committed to take action to reduce the impact of these and other sources in New Jersey. New Jersey is basing its actions in part on the measures in the MANE-VU final modeling73. 9.1 BART New Jersey identified four petroleum refineries and one electric generating facility as Best Available Retrofit Technology (BART)-eligible facilities potentially subject to those requirements under the Clean Air Act. Existing rules and consent decree requirements already address the majority of BART requirements. New Jersey has sent letters dated March 3, 2009, requesting that each facility conduct a BART analysis. New Jersey will finalize the BART determinations as single source SIP revisions and also if necessary as operating permit modifications. New Jersey’s discussion regarding BART is included in Section 6. 9.2 EGU Strategy
• 167 EGU Stacks – Four of the 167 EGU stacks identified by MANE-VU as contributing to visibility impairment are located in New Jersey. They are located in the following facilities: BL England, PSEG - Hudson, and PSEG – Mercer. These facilities all have coal-fired EGU boilers. The BL England facility is under an Administrative Consent Order (ACO)74 to meet performance standards for SO2, NOx, and PM. The Hudson and Mercer facilities are under a Consent Decree75 to also meet performance standards for SO2, NOx and PM.76 These orders/decrees will require more than a 90 percent (%) SO2 emission reduction by 12/15/2012, in addition to about 90% reduction of NOx and PM.. New Jersey has also adopted a mercury
73 On a recent MANE-VU call (date) of the State Air Director Representative, the MANE-VU Class I states indicated that they were all defining their 2018 Reasonable Progress Goal based on the final MANE-VU modeling. 74 New Jersey Department of Environmental Protection Administrative Consent Order (ACO) NEA 040002-73001. Effective January 24, 2006 75 http://www.epa.gov/compliance/resources/decrees/amended/psegfossil-amended-cd.pdf 76 The Hudson and Mercer facilities will meet 90 percent SO2 reduction by 2010
9-1

rule77 that sets performance standards for coal-fired boilers, for companies which choose the multi-pollutant strategy in that rule. All four of the167 EGU stacks located in New Jersey are committed to multi-pollutant controls, as part of their mercury rule compliance plan.
• Electric Generating Units (EGU) Boilers – In addition to the mercury rule multi- pollutant control incentive, New Jersey adopted performance standards to reduce allowable NOx, SO2 and particulate emissions from all ten coal-fired boilers in New Jersey. Lowering the maximum allowable emission rates of particles, NOx and SO2 from these coal-fired boilers will help reduce regional haze. The NJDEP anticipates compliance by 2012 (2013, if the Department grants a one year extension due to a demonstrated need), as most of the required emission reductions are included in enforcement agreements or the existing multi-pollutant provisions of the mercury rule for coal-fired boilers at N.J.A.C. 7:27-27.7(d). New Jersey also adopted more stringent NOx emission standards for gas and oil-fired boilers serving EGUs in advance of the reasonable progress goal milestone date. 9.3 Low-Sulfur Fuel Oil Strategy New Jersey intends to propose and adopt rules in accordance with the New Jersey Administrative Procedures Act (APA) (N.J.S.A. 52:14B-1 et. seq.) and the Air Pollution Control Act (APCA) (N.J.S.A. 26:2C-1 et seq.) to modify the sulfur in fuel limits in accordance with the definition of reasonable measures, outlined in Subsection 8.4.1, for the MANE-VU strategy. N.J.A.C. 7:27 – 9 already meets the #6 fuel oil sulfur levels in parts of the state. 9.4 Energy Efficiency New Jersey issued a draft Energy Master Plan78 (EMP) to address New Jersey's electricity and heating challenges. Components of the Energy Master Plan address ways to increase energy efficiency in the State. On July 6, 2007, Governor Corzine signed the Global Warming Response Act. The Act requires New Jersey to reduce greenhouse gas emissions by 20 percent (%) by 2020 and by 80 percent (%) by 2050. Measures to meet these requirements will also help reduce SO2, PM, and NOx emissions and improve visibility. A Greenhouse Gas Reduction Plan was proposed on December 15, 2008. 9.5 Additional Class I State Required Measures The Clean Air Act and the USEPA Rule require states with Class I areas to address emissions from construction activities and implement smoke management plans. This subsection describes New Jersey’s action for these categories.
77 N.J.A.C 7:27-27.7 78 www.nj.gov/emp
9-2

9.5.1 Measures to Mitigate the Impacts from Construction Activities New Jersey is required to consider measures to mitigate the impacts of construction activities in accordance with 40 C.F.R. § 51.308(d)(3)(v)(B). Construction activities are sources of crustal (or inorganic) forms of directly emitted particulate matter (PM), or “fugitive dust”, as well as directly emitted carbonaceous PM from the exhaust emissions of the construction equipment. While much of the wind blown emissions are coarse PM, smaller particles are also present. During high wind events, fine crustal PM has been shown to be transported over very long distances, and contribute to regional haze. New Jersey has standards79 that reduce “fugitive dust” emissions from construction. These Standards were adopted by the New Jersey Department of Transportation and New Jersey Department of Agricultures under the “Soil Erosion and Sediment Control Standards: Standards for Dust control.” The Standard covers the control of dust on construction sites and roads, the control of flowing sediment from accessing construction sites, and the control of on-site construction traffic to minimize land disturbance. To address exhaust emissions, the USEPA has promulgated regulations that will limit the sulfur content of diesel fuel for on-road and non-road vehicles and equipment to 15 ppm before 2018. Additionally, the USEPA recently promulgated rules to require lower emissions from new non-road diesel engines.80 New Jersey has existing rules to limit the idling of vehicles and equipment. New Jersey has also proposed a rule to further reduce allowable smoke from on-road diesel engines.81 These measures will help reduce haze emissions and regional haze. Additionally, New Jersey will consider additional mitigating measures for construction activities on a case-by-case basis depending on the size and nature of the construction being done and the review of the potential emissions on the property in relation to any potential off-site impacts. To implement these requirements, the NJDEP can use existing authority under the Waterfront Development Rules, as well as Environmental Impact Statements required pursuant to the National Environmental Policy Act and/or Executive Order. In addition, any unreasonable off-site air quality impacts during construction can be addressed by New Jersey’s general prohibition of air pollution at N.J.A.C. 7:27-5 et seq. Mitigation measures would be required if construction activities unreasonably interfere with the enjoyment of life or property. As an example, mitigation of construction emissions in New Jersey was included as a permit condition for a large commercial development in the northern part of the State. The project included the construction of office buildings, an amusement park, a shopping mall and an indoor ski slope. One of the prime contractors was required to reduce particulate matter (PM) emissions from their construction equipment and their subcontractors' construction equipment by 35 percent. A variety of retrofit devices and fuels were used to achieve this reduction: diesel particulate filters, diesel oxidation catalysts, closed crankcase filtration systems, and the use of ultra low (15ppm sulfur content) and low sulfur diesel (500ppm sulfur content).
79 Standards for Soil Erosion and Sediment Control in New Jersey. Promulgated by the New Jersey State Soil Conservation Committee. Adopted July 1999. 80 Federal Register, Vol. 69, No. 124, June 29, 2004. 81 http://www.nj.gov/dep/aqm/CPR-041708.pdf
9-3

Emission reductions obtained through the implementation of measures required by the Federal conformity regulation will also reduce emissions from projects and help reduce regional haze. The Clean Air Act82 requires that Federal actions conform to a state’s State Implementation Plan (SIP). Specifically the Clean Air Act requires that the action/activity will not:
• Cause or contribute to any new violation of any National Ambient Air Quality Standard (NAAQS) in any area;
• Increase the frequency or severity of any existing violation of any NAAQS in any area; or,
• Delay timely attainment of any NAAQS or any required interim emission reductions or any other milestones in any area.
Federal actions taken in New Jersey must comply with the Federal General Conformity Rules83
for PM2.5 in the 13 counties in nonattainment of the PM2.5 standard and in the entire State for 8- hour ozone. The General Conformity Rule requires that VOC, NOx, and PM2.5 direct and indirect emissions from a project that exceed de minimis levels be mitigated, unless the activities are exempt. 9.5.2 Fugitive Dust New Jersey intends to further address fugitive dust84 emissions in a new rule. The rule as currently envisioned would establish provisions requiring dust management plans for certain source categories and any facility with a history of dust emissions. Requiring dust management plans for these facilities will help control dust emissions to eliminate nuisance dust, improve visibility, and improve the health of the citizens of New Jersey. As with any rule, the New Jersey Air Pollution Control and Administrative Procedures Act requirements will be followed. 9.5.3 Agricultural and Forestry Smoke Management New Jersey is required to consider smoke management techniques for the purposes of agricultural and forestry management in developing reasonable progress goals in accordance with 40 C.F.R. § 51.308(d)(3)(v)(E). New Jersey addresses smoke management through its Open Burning rules, as discussed in Section 9.5.3.1.85
9.5.3.1 Open Burning New Jersey has one of the most stringent open burning rules in the nation. The existing New Jersey rules limit all types of open burning within the State, N.J.A.C. 7:27-2 et seq. These rules have been in effect since 1956, with subsequent revisions further restricting open burning. The rules prohibit most open burning, limit other types of open burning, and have been successful in
82 42 U.S.C. 7506 83 40 C.F.R 93.150 84 Fugitive dust is made up of suspended particles caused by human activities and wind. Typical sources of fugitive dust include wind erosion, construction, roads, and agriculture. Industrial activities such as quarries and mineral processing can also emit fugitive dust. 85 N.J.A.C. 7:27-2
9-4

minimizing burning throughout the State. The limited instances where open burning is allowed, only after a person obtains an air pollution control and Forest Fire Service permit, include:
- Prescribed burning, - Limit agricultural management burning as follows:
- Infested plant life, - Herbaceous plant life and hedgerows, - Orchard prunings and cullings, - Land clearing for farming,
- Emergencies, - Dangerous material.
New Jersey plans to propose amendments to the current rules to require that any permit issued for open burning in the State would prohibit open burning on days forecasted as unhealthy for air quality. This condition is currently envisioned to apply in all but emergency situations. New Jersey commits to coordinate with Forest Fire Service to consider the effects on Brigantine when reviewing open burning permit applications for certain areas near Brigantine, especially for prescribed burning. New Jersey’s periodic area source emissions inventory includes estimated emissions from burning by county using data obtained from several sources, including the New Jersey Division of Fire Safety and the NJDEP Bureau of Forest Fire Management, Divisions A, B, and C. New Jersey’s 2002 area source inventory can be found at http://www.state.nj.us/dep/baqp/sip/siprevs.htm in the “Attainment and Maintenance of the 8-Hour Carbon Monoxide National Ambient Air Quality Standard, 1-Hour Ozone National Ambient Air Quality Standard, and Fine Particulate Matter National Ambient Air Quality Standard SIP and the 2002 Periodic Emission Inventory” dated May 2006. MANE-VU prepared a report on Open Burning in Residential Areas, prepared by E.H. Pechan and Associates, Inc., dated January 31, 2004. This report analyzed municipal solid waste, leaf, brush and municipal yard waste burning. Since this type of burning is essentially banned in New Jersey, the report concluded it to be a minor contributor to organic carbon emissions in New Jersey. 9.5.3.2 Prescribed Burning Prescribed burning is one of the few categories where open burning is allowed by permit in New Jersey, as discussed above, under specific conditions for public safety reasons. Prescribed burning is conducted or supervised by the Bureau of Forest Fire Management, to ensure public safety. Prescribed burning, when properly conducted, minimizes the potential future threat of large and serious uncontrolled wildfires which could seriously jeopardize human life and property. In addition, it reduces the number of wildfires and the visibility impairment associated with uncontrolled wildfire.
9-5

9.5.3.3 Agricultural Management Burning A few other categories where open burning is currently allowed with a permit in New Jersey, but limited in its scope, are conducted on agricultural lands. These categories include infested plant life, herbaceous plant life and hedgerows, orchard prunings and cullings and land clearing for agricultural purposes. NJDEP issues open burning permits to agricultural operations and establishments and ensures through these permits that only certain materials are burned. 9.6 Residential Wood Burning Strategies Residential wood burning from woodstoves and fireplaces is one of the largest sources of direct fine particulate matter, PM2.5, emissions in New Jersey. With the high price of conventional heating fuels, the onset of cold weather brings a dramatic increase in the use of fireplaces and woodstoves. This results in large quantities of particulate matter being released into the local air shed. Wood smoke contains over 200 chemicals and compound groups, many considered as air toxics. New Jersey is considering strategies to reduce the emissions of wood smoke. Implementation of these strategies would reduce fine particle emissions and improve visibility. One strategy under consideration is a Home Wood Heating Advisory Program, similar to those in Oregon and Washington states. In general, these programs require the limitation of burning during times when unhealthy air quality is forecast or monitored. Other strategies under investigation include woodstove and fireplace change-out programs. Financial incentives might be provided to help home owners to replace their older, more polluting fire box or stove with a newer, less polluting one. The NJDEP has posted on its website an informational webpage regarding techniques for proper wood burning, health effects of wood burning, and links to other useful web pages.86
9.7 Measures to Reduce Organic Carbon Emissions Organic carbon is the second largest contributor to visibility impairment. In addition to SO2, PM precursors include NOx and potentially volatile organic compounds (VOCs). VOCs form secondary organic aerosol (SOA) after condensation and oxidation processes in the atmosphere, thereby contributing to the organic fraction of visibility impairment. New Jersey is taking actions to reduce these emissions as discussed in the following sub-section:
1. Boilers (N.J.A.C 7:27-16.8) The existing rule sets VOC and Carbon Monoxide (CO) limits for indirect heat exchanges (boilers and furnaces). Lower levels for VOC and CO are being considered by NJDEP for Industrial, Commercial and Institutional (ICI) boilers as Maximum Achievable Control Technology (MACT).
86 http://www.state.nj.us/dep/baqp/woodburning.html
9-6
2. Industrial/Commercial/Institutional Boilers and Other Indirect Heat Exchangers (N.J.A.C 7:27-19.7)
The existing rule, N.J.A.C. 7:27-19.7 (g), requires annual tune-ups for any industrial/commercial/institutional boiler or other indirect heat exchanger with a maximum gross heat input rate of at least 10 million BTU per hour and greater, beginning in 2008, and expands to any unit of at least 5 million BTU per hour and greater, beginning in 2010. This rule will reduce organic carbon emissions. Revised rules adopted on March 20, 2009, reduce NOx emissions from certain boilers and furnaces. The revised RACT rule requires low NOx burners (LNBs) or other reasonable cost NOx technologies, and is expected to reduce NOx emissions by about 50 percent (%) from affected units between 25 and 50 million BTUs per hour. Larger boilers were previously required to implement such measures. 3. Diesel Idling Rule (N.J.A.C. 7:27-14.3) The existing rule removes exemptions in the previous rule and eliminates the sleeper berth exemption in 2010.
4. Diesel Retrofit Program (N.J.A.C 7:27-32) The existing rule requires the installation of retrofit emission control technology on certain garbage trucks, commercial buses and publicly owned on-road vehicles and off-road equipment. The retrofits are scheduled to occur between 2008 and 2015. These rules will reduce the emissions of fine particles. The program regulates publicly-owned and certain privately-owned fleets. As of 2009, an estimated retrofit population of 24,000 on-road vehicles and off-road equipment will be affected by the mandatory retrofit program. 5. Control and Prohibition of Open Burning (N.J.A.C 7:27-2) See Section 9.5.3.1 of this SIP revision for a discussion regarding New Jersey’s open burning rules. 6. Heavy Duty Trucks (N.J.A.C. 7:27-14)
On April 3, 2009, the NJDEP adopted rules that require tighter opacity limits to be used in the Inspection and Maintenance (I/M) program. This rule will reduce emissions of organic carbon. 7. VOC Measures
The State is implementing several VOC control measures that were adopted as discussed in the 2007 8-hour Ozone Attainment Demonstration SIP.87 Although the USEPA does not
87 NJDEP. State Implementation Plan (SIP) Revision for the Attainment and Maintenance of the Ozone National Ambient Air Quality Standard: 8-Hour Ozone Attainment Demonstration Proposal. New Jersey Department of Environmental Protection, June 15, 2007.
9-7

consider VOC as a PM2.5 precursor for SIP and conformity purposes, New Jersey anticipates some PM2.5 benefit from the implementation of these measures.
9-8

10.0 COMMITMENTS Attaining the 2018 Reasonable Progress Goal is contingent upon the continued implementation and enforcement of existing control measures, the implementation of a number of new State and Federal control measures, as well as the implementation of the “ask” reasonable measures by the contributing states and tribes. The remainder of this section summarizes New Jersey’s commitments, as well as New Jersey’s requests of the USEPA with respect to regional haze improvement, to reduce SO2, PM and NOx emissions. 10.1 Control Measure Commitments Table 10.1 provides a summary of control measure commitments by New Jersey necessary to achieve the Reasonable Progress Goal for visibility improvement in the Class I Areas based on the modeling and analyses put forth in this SIP. New Jersey expects that the control measure commitments in Table 10.1 will be in effect prior to the 2018 regional haze reasonable progress milestone. New Jersey will evaluate progress in implementing these measures and the reasonableness of additional measures necessary to meet the Reasonable Progress Goal as part of the mid-course review. For a detailed explanation of each of these control measures, see Appendix M.
Table 10.1: Regional Haze State Control Measure Commitments
Control Measures Status Notes EGU Consent Decrees (PSEG) Filed July 26, 2002; amended
November 30, 2006 PM, SO2 and NOx reductions
EGU-BL England ACO Effective January 24, 2006 PM, SO2 and NOx reductions
EGUs-Coal-fired Boilers Rule adopted March 20, 2009 PM, SO2 and NOx reductions
Industrial/Commercial/Institutional (ICI) Boiler Rule 2009*
Rule adopted March 20, 2009 NOx reductions
NOx RACT Rule 2006* Rule adopted September 8, 2005 NOx reductions Refinery Consent Decrees* (ConocoPhillips and Sunoco)
Filed (Final) PM, SO2 and NOx reductions
Soil Erosion and Sediment Control Standards
Existing Department of Agriculture standards
Low Sulfur Fuel Oil Strategy Rule Proposal anticipated in 2009 S-1** Strategy anticipated in 2014 S-2** Strategy anticipated in 2016
SO2 and NOx reductions
Best Available Retrofit Technology (BART)
NJDEP sent letters to facilities on March 3, 2009 regarding determinations. Expect to complete analysis in 2010
* Included in the BOTW modeling run ** See Table 8.2 for definition
10-1

The NJDEP has adopted several additional control measures as part of the efforts to reduce ozone and PM2.5, which will also help achieve the regional haze goals. These additional control measures for PM2.5, NOx or SO2 are included in Table 10.2. The VOC control measures can be found in the Departments ozone SIP.88
Table 10.2: Additional State Control Measures that Support Regional Haze Goals
Control Measures Status Notes Diesel Idling Rule Changes Rule adopted May 25, 2007 Direct PM2.5 and NOx
reductions High Electrical Demand Day units
Rule adopted March 20, 2009 SO2 and NOx reductions
Oil and gas Fired Electric Generating Units (EGUs)
Rule adopted March 20, 2009 NOx reductions
Sewage Sludge Incinerators Rule adopted March 20, 2009 NOx reductions Case by Case NOx Emission Limit Determinations (FSELs/AELs)
Rule adopted March 20, 2009 NOx reductions
Glass Manufacturing Rule adopted March 20, 2009 NOx reductions but most benefits will occur post-2010
Municipal Waste Combustor (Incinerator) NOx Rule
Rule adopted March 20, 2009 NOx reductions
Asphalt Production Plants Rule adopted March 20, 2009 NOx reductions Diesel Smoke (I/M Cutpoint) Rule Changes
Rule adopted April 3, 2009 PM2.5 and NOx reductions
Onroad New Jersey Low Emission Vehicle (LEV) Program
Adopted November 28, 2005 VOC, NOx, SO2, and direct PM2.5 reductions
Energy Master Plan Finalized October 22, 2008 The NJDEP anticipates proposal of additional control measures or programs which will also help achieve the regional haze goals. These additional strategies are included in Table 10.3.
88 State Implementation Plan (SIP) Revision for the Attainment and Maintenance of the Ozone National Ambient Air Quality Standard, 8-Hour Ozone Attainment Demonstration, Final, October 29, 2007; State Implementation Plan (SIP) Revision for the Attainment and Maintenance of the Fine Particulate Matter National Ambient Air Quality Standard, Fine Particulate Matter Attainment Demonstration, Proposal, June 16, 2008.
10-2

Table 10.3: Potential Future State Control Measures or Programs that Support Regional Haze Goals
Control Measures Status Notes
Fugitive Dust Emission Rule
Analysis Underway PM2.5 reductions
Open Burning Permit Rule Revisions
Analysis Underway PM2.5, VOC and CO reductions
Refinery Rules Analysis Underway PM2.5, SO2 and NOx, reductions
#6 Fuel Oil-Fired Boilers PM Limits
To be Evaluated PM2.5 reductions
Stationary Diesel Engines To be Evaluated PM2.5, and NOx reductions
Residential Wood Burning Strategies
To be Evaluated PM2.5, SO2, NOx, VOC and CO reductions
Greenhouse Gas Reduction Plan
Proposed
10.2 Other Commitments 10.2.1 Visibility New Jersey commits to continue carrying out the required review of proposed sources impact on visibility under 40 C.F.R. § 52.26 and 52.28, by implementing the Prevention of Significant Deterioration (PSD) permit requirements for new or modified major sources of air pollutants located within 100 kilometers of the Class I area, or within a larger radius on a case-by-case basis, in accordance with all applicable Federal rules for review of the impacts on Class I areas. New Jersey’s PSD program prevents new and modified sources from significantly impacting visibility. The PSD program includes a requirement that evaluates the new source's visibility impact on any nearby Class I areas (Brigantine in New Jersey’s case). In some cases, the Federal Land Manager may exempt smaller, more distant PSD sources from having to do the visibility analysis, but the larger sources with the greatest chance of adversely impacting visibility at Brigantine will have to address the issue. In addition, older sources are expected to shut down with time, and new source emissions are minimized, thereby improving air quality and enhancing visibility at Brigantine. The Federal Land Manager is expected to finalize guidance for determining whether a PSD source addresses visibility impacts in mid 2010. This will be part of a new guidance document known as Federal Land Managers' Air Quality Related Values Work Group 2 (FLAG 2). There will be an equation that adds the total NOx, SO2, sulfuric acid mix, and PM10 emissions in tons per year, and then divides by the distance to the Class I area in kilometers (km). If the result is greater than 10, a visibility analysis must be done. The non-PSD sources will be reviewed on a case by case basis depending on the emissions and the distance.
10-3

10.2.2 Consultation with Federal Land Managers New Jersey commits to coordinate on-going consultation with the appropriate Federal Land Manager and the USEPA regarding future progress reports and State plan revisions. 10.2.3 Monitoring The NJDEP commits to operate and maintain the monitoring site at the Brigantine Wilderness Area for the foreseeable future, although this is contingent upon continued Federal and State funding. Any network changes will be subject to a joint annual review process by both the NJDEP and the USEPA. 10.2.4 Emission Inventory New Jersey commits to update the emission inventory periodically in accordance with the requirements of the USEPA. 10.2.5 Comprehensive Periodic Implementation Plan Revisions New Jersey commits to revise and submit a regional haze implementation plan by July 31, 2018, and every ten years thereafter, in accordance with the requirements listed in Section 51.308(f) of the Federal rule for regional haze, contingent on the availability of Federal funds to support the regional organizations and MANE-VU. Section 51.308(f) requires that each state identified in Section 51.300(b) (3) revise and submit its regional haze implementation plan revision to the USEPA by July 31, 2018, and every ten years thereafter. Section 51.308(f) also states what the states are required to include in the SIP revisions. To meet this commitment, New Jersey expects to rely on the collaborative regional organization efforts which require continued Federal funding. See section 10.2.6.3. 10.2.6 State Requests of USEPA 10.2.6.1 IMPROVE Network As discussed in Section 4.1, the monitoring strategy for the State of New Jersey, as required by 40 C.F.R. § 51.308(d)(4), relies upon the continued availability of the IMPROVE network. New Jersey requests that the USEPA continue to provide support to the upkeep and maintenance of the IMPROVE network for the Brigantine Wilderness Area. 10.2.6.2 New Jersey’s Reliance on Other State Actions for Reaching Reasonable Progress
Goal For the Brigantine Wilderness Area to achieve reasonable progress by 2018, the contributing states must take action to implement reasonable control measures. New Jersey expects that the FLMs and the USEPA will monitor and ensure the emission reductions necessary to achieve this goal.
10-4

10.2.6.3 Federal Funding to Support Regional Haze Efforts and the Regional Organizations
New Jersey is relying on and expects that the USEPA will continue to provide funds to support Regional Haze efforts and the regional organizations, including MANE-VU. 10.2.6.4 Federal Requirement to Obtain Additional Air Pollution Reductions from EGUs, Industrial/Commercial/Institutional (ICI) Boilers and Other Major Sources New Jersey requests that the USEPA set performance standards for all EGUs, ICI boilers and other major sources to achieve substantially more emission reductions than the CAIR program. 10.3 Commitments for Mid-Course Review New Jersey commits to address the following in its Mid-Course Review report:
1. Address any uncertainties encountered during regional haze planning process. 2. Report on the progress of the BART analysis, determinations, and implementation. 3. Report on the progress of the Low Sulfur Fuel Strategy. 4. Report on whether additional potential actions listed in Table 10.3 will be
implemented and the status of those efforts. This commitment is contingent on the availability of Federal funds to support the regional organizations and MANE-VU or their successor.
10-5

11.0 PUBLIC PARTICIPATION New Jersey has documented the public participation process, including formal comments submitted to the State of New Jersey by the Federal Land Manager, the USEPA and ConocoPhillips in Appendix O of this SIP revision.
11-1