REPOR AD-A277 605 - dtic.mil · IThe final section of this report contains papers or posters...
137
REPOR AD-A277 605 I AGENCY USE ONLY (Leave IaFj , n, ... blank) T TYPE AN DATES CO'EREO IjAi,ýiNUAiL 01 Nov 92 TO 31 Oct 93 4 TITLE AND SUBTITLE 5 FCNDINý. NUMBERS PSYCHOPHYSICS OF COMPLEX AUDITORY AND SPEECH STIMULI F49620-93-1-0033 61102F 6 AUTHOR(S) 2313 AS Dr Richard E. Pastore 7 PERFORMING ORGANIZATION NAME(S) AND AOORESS(ES) * ,MNC0RGANZ;.1ICN Dept of Psychology L-J• NUMOER State University of New York P.O. Box 6000 AEOSR-TR 94 0 1 08 Binghamton, NY 13902-6000 9 SPONSORING MONITORING AGENCY NAME(S) AND ADDRESS(ES) 'C SPCNSC- %,' iYONI-CRiNG AGENCY FCP0;.7 NUM~BER AFOSR/NL 110 Duncan Avenue, Suite B115 Bolling AFB DC 20332-0001 C Dr John F. Tangeny 11 SUPPLEMENTARY NOTES O' STRIBUT(ON. DVAMIABIUIT1 SrAIIMENT -. 'S Approved for public release; g- - A1i ýTIC reprodumes distribution unlimited AO2 t*III b1 La &S.O am- 2 AESTRACT ;M3xmor m 200 6words) A major focus on the primary project is to use of different procedures to provide converging evidence on the natuge of perceptual spaces for speech categories. Completed research examined initial voiced consonants, with results providing strong evidence that different stimulus properties may cue a phoneme catcgory in different vowel contexts. Thus, /b/ is cued by a rising second formant (F2) with the vowel /a/, requires both F2 and F3 to be rising with /i/, and is inde- pendent o the release burst for these vowels. Furthermore, cues for phonetic contrasts are not necessarily symmetric, and the strong dependence of prior speech research on classification procedures may have led to errors. Thus, the opposite (falling F2 & F3) transitions lead somewhat ambiguous percepts (i.e., not /b/) which may be labeled Lonsistently (as /d/ or /g/), but requires a release burst to achieve high category quality and similarity to category exemplars). Ongoing research is examining cues in other vowel contexts, and isusing additional procedures to evaluate the nature of interaction between cuse for categories of both speech and music. C 0 ' • :• •.LA ,hCA] ~Th 18 SECURiTY CLASSIFICATION 19 SECUR Y CLA TS - *. , OF THIS PAGE O F A. STrA. . (C) ~~(U) ()(L 0 T)- ............... I....... ........ I i
-
Upload
truongkhue -
Category
Documents
-
view
218 -
download
2
Transcript of REPOR AD-A277 605 - dtic.mil · IThe final section of this report contains papers or posters...
REPOR AD-A277 605
I AGENCY USE ONLY (Leave IaFj , n, ... blank) T TYPE AN DATES CO'EREO
IjAi,ýiNUAiL 01 Nov 92 TO 31 Oct 93
4 TITLE AND SUBTITLE 5 FCNDINý. NUMBERS
PSYCHOPHYSICS OF COMPLEX AUDITORY AND SPEECH STIMULI F49620-93-1-0033
61102F
6 AUTHOR(S) 2313AS
Dr Richard E. Pastore
7 PERFORMING ORGANIZATION NAME(S) AND AOORESS(ES) * ,MNC0RGANZ;.1ICN
Dept of Psychology L-J• NUMOER
State University of New York
P.O. Box 6000 AEOSR-TR 94 0 1 08Binghamton, NY 13902-6000
9 SPONSORING MONITORING AGENCY NAME(S) AND ADDRESS(ES) 'C SPCNSC- %,' iYONI-CRiNG
AGENCY FCP0;.7 NUM~BER
AFOSR/NL110 Duncan Avenue, Suite B115
Bolling AFB DC 20332-0001 C
Dr John F. Tangeny
11 SUPPLEMENTARY NOTES
O' STRIBUT(ON. DVAMIABIUIT1 SrAIIMENT -. 'S
Approved for public release; g- - A1i ýTIC reprodumes
distribution unlimited AO2 t*III b1 La &S.O am-
2 AESTRACT ;M3xmor m 200 6words)
A major focus on the primary project is to use of different procedures to provide
converging evidence on the natuge of perceptual spaces for speech categories.
Completed research examined initial voiced consonants, with results providing
strong evidence that different stimulus properties may cue a phoneme catcgory
in different vowel contexts. Thus, /b/ is cued by a rising second formant (F2)
with the vowel /a/, requires both F2 and F3 to be rising with /i/, and is inde-
pendent o the release burst for these vowels. Furthermore, cues for phonetic
contrasts are not necessarily symmetric, and the strong dependence of prior
speech research on classification procedures may have led to errors. Thus, the
opposite (falling F2 & F3) transitions lead somewhat ambiguous percepts (i.e.,
not /b/) which may be labeled Lonsistently (as /d/ or /g/), but requires a
release burst to achieve high category quality and similarity to category
exemplars). Ongoing research is examining cues in other vowel contexts, and
isusing additional procedures to evaluate the nature of interaction between cuse
for categories of both speech and music.
C 0
' • :• •.LA ,hCA] ~Th 18 SECURiTY CLASSIFICATION 19 SECUR Y CLA TS - *. ,
OF THIS PAGE O F A. STrA. .
(C) ~~(U) ()(L0
T)- ............... I....... ........ I i

Psychoacoustics &Auditory Cognition
Laboratory
Department of PsychologySUNY - Binghamton
Binghamton, NY 13902
1993 Annual Progress Report
94-09338
AFOSR Grants F49609310033;-
Richard E. Pastore, Project Directoro
94 3 25 o56
[ 993 Aunual Ilkvgslt Ior AFI( ISH ( irants I'lt13ll)Iand J..l(9609111127,
O)rganization oif this RepoortI his ivlk it is intended to provide a sampling or snap-shot of the status of research programi siippxrtcd byv the Air Force Office
of Scientitic Vc-scairch unider (irant [419609310033 and supplemental AASER'Iaiwardt I'*96093 111327, Instead of preparing a special report describing each of the facels of the ongoing and completed research, thisriport is it #)nipoiation of manuiscripts describing the various major facets of the research. 'I'lesc documents have a generalorgi: ii ia non lwa~ed 11pon stat us in relation to piublicat ion in peer-reviewed journals.
Thei first section of this report contains one manuscript which currently is under review.11Wi secondi section contains four completedl manuscripts which are al~iot to bie submitted for review. 'l'ese manuscripts range
tii coiiipletion fromnicbing essentially readly to bie dropped in the mail (e.g.. C:ho et al.) to requiring a little more critical reading andlfine tuting before subimission (e.g.. Iliall ct al.).
The third section contains detailed reports on two on-going projects which are not dlescribued in any of the other four sections orthis repiort. T~hese reports provide a detailed introduction to the study, summarize the results obtained to dlate anti, provide adisc~ussion of those results. 'Ihese reports are intended to bie the basis of subisequent manuscripts describing the results.
IThe final section of this report contains papers or posters presented at professional meetings (Acoustical Socicty of America andPsvchonomic Society), where the research topic is not otherwise covered in any of the other sections of this repiort. For example,FeCature Integration Theory and Illli'ory Conjunctions are th:! focus of completed and ongoing research. Ilowever. since a manuscript
or detailed repo~rt is at least a month away from reaching a stage adequate for public access, the poster has been included. As acontrary example. the content% of the Acoustical Society papers by liail and biy Cha-MrMlSlhctblow) are covered thoroughly in thecompleted manuscripts which these individuals as first authors. Thercfore, no added effort wats made to provide a transcription of
these oral presentation.
,IMe manuscripts, reports, papers. and rxisters (cited aixave) describie primarily the current findings. but most also represent thebasic subject and approach to. continuing research.
Patent StatementThe research completed to date has not resulted in any finding% or dlevelopments which are appropriate for any type oIf patent
appul'cation. and ini such application has becen sought.
Research Overview"I hie major obtjectives of the ongoing research projects involved~the delineation of the nature of the processes which determine
the perception of conplpex acoustic stimuli. The research has not developed any new techniques for investigating perception. but isuinique in utiliiing a set of established procedures to provide a comprehensive picture of perception and converging evidence for thenature and role oif specific cues% in perception. TIhe selection of stimulus class (e.g.. speech. music, tones) for a given set (ifexperimnents is based upon being abule to most effectively address a given critical research question.
The manuscripts and specific reports contained in this d~cuiment attest to the success and the importance of not only thecompleted research. hut also the on-goint, projects. These statement- have been prepared in the forms appropriate for standardscientific pecer-review. If needed, this dlocuinent. or the next annual document, can bie modified to include the applied implications ofthe research findings.
Research Bibliography%lantiscruots Undter Review
'Li. X-l'.. & Ilastore. RI>. Perceptual Constan'cy of a Global Spectral Property: Spectral Slope D~iscrimination. Journal of theAcoustical Society of America, (accepted pending revisions).
%lainuiscri Ots auloiit 1(i bie submitted
':'Aclcr. 11.1 ... PIustore. RE.I.* & I lall, M.l).. Within-category dhiscrimination of musical chords: Perceptual magnet or anchor?Perception & Psycho hys~ics.
(hi L,. I lall. Ml.b.. & P~asto~re. R.E. Normaliiation of musical instrument timbre. Journal of E.xperimental PVcholm~:IHumani Perception & Performance.
Hall. Nl).D & l'.store. R.L., Effects (if stimulus complexity on the perceptiiual organization of musical tones. Journal ofIFxprinicntal P'sychology: I liiman Perceltion & Pierformance.
Iliuunig, W_. I lall. M.D.. & Pastore. R.E. Mapping percepts in the major variant of the octave ilusion. Perception &
I1 \I.I \1. &P I'tocr. R I ( 1993) Nn Anit Iitr, Anal (ie to I catinrr In tet'ratiion I'sst liniim~i ',,nwtv. V shingtin. 1)
I'aslie,r RI .(I)991) Impicitt assinn iptions in flhtncltng higher lend1 atinirory pressesC Jokirnal 0t the ActosiiCal Soit0t
America. 'L3. 230 h7J.\Itstr owif In' ied papeir I
li nanig. W , ]fll, \I I) ,& Vasucce. R I . ( 1991 An Ilhttstn btased on fichomt fusnion of harmonital~v related (tine% Ionirnal oftthe Acoustical Socictý 0i %rnerjtd9 1110 1, j A lstrctiw of Poster)
2(*hit, I_. H alf. MD I. & itashitre. R I , 193)y Stinlitlns prrttertices iiti~al iii niirtitlp/atti n oft instrnuent tinhibre Jounrnal ofii he Ac,,t~tsitaI .Soittiny (if - \ne it. Qt3 24i1 [i Abstract of it aperi
1 i. X-I. & (ho.3 (1991)Il An exploiration ofi phoneme strttcttiri antd moilelso ei iasstiictiitn for place ol artitilatitin loininail
oh the Acontiwtcl Swinitytof Atnrim-t.9i 2;91) Alistrait of Paprwr
Deotailedh Rent irts tin Wt irk in Pri iretis (when nit stintmarimel alto,,cI'asttre, RI I .. ii~ot S .& Jit!assa S Meamirn-In thle DI fohi idenimfiat ton of order of onset ftor cnomplexn audintor sirs it
Pastore. R.1 Acker, II . ho. I I I. X-I I & Iinicriodin. S I xplitrattion of the peroeptital strmi-titrc (if eines or pla ceiof
aMilk Ilatio n
- - - - - - - - - - - - - - - - -Iarniisurrpt inttitole Iin IIIts opitt
Iktpt-r presentattioin \01 tndmt htm in this repoirt. \Iorec omiplete tiescription oft woirk tndltttler in Iltls Itipit
MIajior aspect,% of this rcesart h is -mmitititni:
Ittearh Sal
Hthiari I I hticti lit It
\It( hael I hll \1l\ I itira Pissit
I1tarliara Ntchir BA'"Shanni in I .,rI mtlntiicI\
Nalni Lisal,
po st-dihiiitral toirk wsitht D r ( hirles \. ttsi ait Ittiatna I niserestw lie now is with the( ItepArltittil.o I Icenti d antd inpiienc
I ngin~t-irtim I hi 1Iiiii I Iipktits I ttsi
Inlctttlt ( hut iitrrcnth is .t tart-tim, hiuI-t lkteink its aci-op linit-rn) In tia `iNsa protiect I tilt IllI-h )tei,- HI oril-i In ti
Kihartur Aiker is slitpiirtuhlie i A \',I R I tatnil Slit isll uutiomlti ht-r MA iti [9911
'shinni n I anrliong i ,iiuukt-ut mIii li-tt it ii ii is t SIl \ih1 itltni itntergtiliitt anl its a Ilintithitti tim lI1 o'ie
S1 tjim .ltssa. ;t itr.iult, si Iit Ill in uintr lahialuttit isr iui (hits prop~i -t i r lit Sitntni- ,I lNItt

Spectral Slope D)iscrmination Page 1
Perceptual Constancy of a Global Spectral Property:Spectral Slope Discrimination
Xiaofeng U' and Richard L Pastore
Department of Psychologyand
Center for Cognitive and Psycholinguistic SciencesState University of New York at Binghamton
Running head: SPECTRAL SLOPE DISCRIMINATION •
•Currently affiliated with the Center for Speech Processing, Department of Electrical and Computer Engineering The Johns Hopkins
University
Abstract
The current study investigated the perceptuatl consmtacyof spect•al slope discrimination when She fundamental frequency and spectralshape of the stimuli were varied across to be discriminated stimuli on a single trial The three stimulus variablesi all of which wereglobal or emergent properties of a complex sound, represented two sound source properties and a filter property A stimulus wassynthesized by passing a source spectrum through a filter transfer function according to the source-filter model of complex soundproduction. Four experiments were conducted in this study. Experiment 1 examined the effect of the difference in overall stimulus Slevel on spectral slope discrimination Experiments 2 and 3 investigated, respectively the effects of variations in the fundamentalfrequency and a filter property on spectral slope discrimination Experiment 4 was designed to resolve two issues raised in thepreceding experiments The current study showed a significant performance decrement in spectral slope discrimination when a secondsource property-fundamental frequency-was varied However, little detrimental effect was observed when the filter property-spectralshape-was varied The study supported claims that listeners treat source properties as a unit which is relatively independent of filterproperties
PACS numbers: 43.66. Jh, 43.66. Ijloa~ssion For
"IT ::Z&IJoutL-rnal of the I f]",
Acoustical Society of , 2.. ___.-_
A me-rica -1Caccepted pi_•-dir-g i-revsiCr, 1', .4
Aij -t 4
i''5
- C',i . o -. .. ..
spex-smi ,,ope Page 2
One goal of psychoacoustics, research is to evaluate the important togical possibility that principles dioscred and rcsult,obtained from studies using simple stimuli (e.-g, pure tones and noise bursts) can be extended to explain speech perceptionUnfortunately; evidence has been accumulated over years indicating that, other than some very general findings ( e.g, simultaneousmasking, such efforts typicafly are not very successful ( Pastore, 1981; Watson, 1991; Watson, Qiu, Chamberlain, & Lt, 1993). For Sexample, Christopherson and Htumes (1992) examined the relationship between listeners' abilities to process a wide variety of simpleauditory stimuli and the abilities to identify and to discrnirmiate speech sounds, Although the abilities to process a battery of thesimple stimuli were found to be highly correlated among themselves, these abilities did not predict performance in speech perception
The failure of past psychoacoustics research to predict performance in speech perception tasks may be in part due to its useof very simp!e stimuli and concentration on the study of the processing of fine, rather than giobal, structure of complex auditorystimuli It is quite possible that the strategy used to selectively listen to acoustic details differs from that used to listen to globalaspects of speech and other complex nonspeech sounds To detect details of complex auditory stimul, listeners are instructed to focus Sattention on very specific stimulus properties Results from experimet.ts, using such procedures and designed to evaluate the limits onsensory processing obviously have made significant contributions to our understanding of the physiological mechanism of the cochlearin processing frequencies and intensities However, to understand speech, the auditory system may not have to resolve all details in aspeech signal; in fact, such detailed, focused processing might hinder more integrative, global processing Instead, the most relevantstimulus properties and the redundancy of various cues that exist in speech sounds may require listeners to capture global properties ofthe sounds Because, in a normal listening environment, the fine structure of speech sounds is seldom modified by variousenvironmental factors or by mixing with other sounds (including different speech sounds), such 'global structure' listening strategyseems to be more ecologically valid than the 'fine structure* listening strategy.
In contrast to earlier work, recent psychoacoustics research has reported that listeners can use broad frequency ranges ofinformation even when asked to detect a change in a local frequency component Examples of such research include studies of profileanalysi (e. g, Green, 1988), comodulation masking release (e.g , Hiall et at, 1984), comodulation detection difference ( McFadden,1987; Wright, 1990), modulation detection interference (Ycst & Sheft; 1989; Yost, et at, 1989), and correlational listening (Cohen &Schubert, 1987). These different types of research infers global processing based upon changes in the detection or ihb i.scriminationof frequency components The current study differs from these psychoacoustics research efforts in that it directly investigates iiorncnr"abilities to discriminate a global spectral property that has been identified as a major factor in determining speech quality
The global property investigated in the current study is the spectral slope of complex stimuli with the stimuli synthesizedwith a simple harmonic structure on the basis of the source-filter model of speech production (Fant, 1960). Like speech, a stimulus isproduced b, convoluting a source spectrum with a filter transfer function, In the current study, the source spectrum is composed ofthe first 20 harmonic frequencies of a given fundamental frequency, with the intensities specified by a decreasing spectral envelope.Besides varying in the slope of !he spectral envelope ( spectral slope), the stimuli also differ in terms of a number of other properties,including the fundamental freque.icy ( typically another property of the sound source) and the number of spectral peaks ( typically afilter or resonator, rather than source, property). Listeners are asked to discriminate spectral slope while ignoring irrelevant variationin the fundamental frequencies, spectral peaks, and overall stimulus intensity. The current study thus examines the perceptualinvariance of spectral slope in the context of variation in frequency composition ( fundamental frequency) and in spectral shape(spectral peaks).
The choice of the three variables (fundamental frequency, resonator characteristic, and spectral slope) is motivated by theresemblance of these properties to important aspects of speech sounds. The manipulation of these three stimulus variables(dimensions) thus captures important variations observed in speech sounds Speech produced by male and female speakers difterslargely in fundamental frequency. The pattern of spectral peaks defines formant structure, and perceptually differentiates linguisticcategories of speech sounds (e. g, vowels). Spectral slope, on the other hand, determines various paralinguistic characteristics of aspeaker (e. g, phonation, voicing style, etc, Monsen & Engebretson, 1977; also summarized in Stevens, 1989). For example, breathyvoice tends to have steeper spectral slope than modal voice, whereas creaky voice has shallower spectral slope than modal voice. Inaddition, spectral slope differs between speech sounds of different genders, with female voices typically exhibiting steeper spectralslope than male voices ( Klatt & Klatt, 1990; Monsen & I-ngebretson, 1977; Price, 1989). The three stimulus dimensions thereforerepresent two categories of information typically carred in a complex sound (e. g, speech), with both fundamental frequency andspectral slope defining source properties, and the structure of spectral peaks defining a resonator characteristic •
The use of the source-filter model in synthesizing the stimuli and examining the relationship between the source and filterproperties also is motivated by an ecological validity Specifically, a complex sound can be viewed as a sequential operation of theconvolution of a sound source and a filter transfer function; and listeners are believed to possess a highly developed ability to parsethe complex sound into the source and filter transfer functions on the basis of implicit knowledge acquired in life ((iaver, 1993; LkLogan, & Pastore, 1991; MeAdams, 1993; Woods & Colburn, 1992). The most familiar examples of the application of source-filtermodel are in studies of vowel recognition and speaker identification A vowel sound is produced by passing the glottal exciting sourcethrough the vocal tract which imposes formant structure on the spectrum Listeners are not only able to use formant structure to Sidentify the vowel category, but also able to uncover the speaker characteristics carried by the glottal source. T'he current study willevaluate the influence of variation in the filter property on listeners' ability to diLscriminati. the source property, and thus investigatethe perceptual relationship between the two (agne and Zurek (1988) examined effects of speech source upon formantdiscrimination, which thus represents a type of mirror image to aspects of the current study Because a complex sound can be thejoint effect of any sound source and any filter transfer function, all such studies in the extreme are bound to fatl. Ilowecer, hycarefully chx'nung the source and filter transfer function, such studies should help us to understand the perceptual interaction bcrccn
the prcriertes dercrmincd 1,N the source and filter transfer function Thus, the current study has uisd typical specth piramcete in i
dtfininc tlh amwktinks rrlie
! IIIII~ I~ll IIII
3 Spectral %lope D)iscrimination Page 3
Although little psychophy%ical research has directly examined perceptual invanance or constancy for global stimulusproperties of complex sounds, many speech studies have revealed a constancy in listeners' abilities to map phonetic category fromspeech sounds that vary significantly in waveforrm. Because nonlinguis- variations in speech sounds are hypothesized to be 'removed'or "partitioned out" prior to phonetic identification, this type of finding has been called 'normalization." The "normalization'processes typically are described as factoring out fundamental frequency ( intrinsic "normalizationri, the characteristics of the speaker(extrinsic "normalization", or both. Global invariant properties such as the formant structure of vowels or the spectral shape of stopconsonants (see blov4 are then easily extracted for identification of the phonetic category. However, listeners' abilities to "normalize"speech and other complex sounds hav'e been explored only superficially and mechanisms for the "normalization" processes are notunderstood The concept of "normalization" used in this study thus only refers to recovery of relational (sometimes also global),rather than absolute, properties in the recognition of an auditory event Evidence for the use of global properties in speech perceptionwas reported by Stevens and Blumstein (1981), who identified three types of global spectral shape from initial consonantal release asimportant cues for classification of stop consonants. Despite variability in the microstructure of consonantal spectra, Stevens andBlumstein (1978; Blumstein & Stevens, 1979) found that diffuse rising and diffuse failing spectral shape serve to cue, respectively,bilabial and alveolar consonantS, and spectral shape compacted in the mid-frequency range cues velar consonants
Speech sounds are not the only auditory event that involves the recovery of certain globa' prcpcrtie Mosic melodies, forexample, are recognized by relative frequency relations rather than absolute frequencies Changes in absolute frequencies have verylittle effect on listeners' abilities to identify a music melody as long as the relative frequencies among the components are preservedKidd and Watson (1989) used a sequence of five tones as stimuli to examine listeners' abilities to detect a frequency change in a targetcomponent when the tonal sequence was transposed in the absolute frequency, but the frequency relation among the tonal componentsremained constant It was found that surprisingly small amounts of frequency transposition (1-2 semitones) led to a very largeincrease in thresholds However, minimizing pattern uncertainty (by presenting the same pattern on every trial) resulted in dramaticimprovements in performance, and, in some cases, the thresholds were almost comparable to those for absolute frequency detection.This study suggests that listeners are able to extract a relational frequency property, at leask, from familiar patterns In a more directstudy of "normalization" of music sounds, Chc, Pastore, and Hall (1991) demonstrated that musically experienced listeners can factorout differences in instrument timbre, while perceiving chords
The current study consisting of four experiments will evaluate the discrimination of the global property of spectral slopec"lh discrimination of spectral slope requires that listeners rely on the intensity relationship across the spectrum to discriminatespectral slope. Experiment 1 examines a potential confounding variable that may be used by listeners when asked to discriminatespectral slope The remainder of the study has two major parts The first part ( Experiment 2) examines the effects on spectral slopediscrimination when the frequency composition of the stimulus is changed due to variation in fundamental frequency. This designreflects a type of analog to processing speech sounds in which the speaking characteristics remain constant despite variation in thefundamental fr"i4,ency. The second part of this study ( Experiment 3) modifies the microstructurc of the spectral envelope byimposing spectral peaks In understanding speech, listeners need to rely on the gross spectral filter transfer function acrossfrequencies regaroless of amplitude variation in local frequencies In identifying a voice, listeners need to rely on gross tendency insource properties( F0 and spectral slope) regardless of the filter properties imposed by the vocal tract Thus, the current designrepresents a type of investigation of the invariance of speaking characteristics in speech sounds produced by speakers despitedifferences in vocal tract configurations across phonemic categories Experiment 4 explores an issue not resolved from Experiments 2and 3.
Oereral Method
Stimuli
'Ihe200 ms stimuli were line spectra synthesized by digitally summing20 harmonic sinusoidal frequencies in a sine phase. Thedigital stimuli were shaped by 5 ms linear onset and offset ramps Following an A/ D conversion (12-bit at a 10 Khz sample rate), thestimuli were low-pass filtered at4 kllz (via a series of rIIACO Model4302 filters, yrelding48 di/octave) prior to being presentedbinaurally over TD|II49P headphones to subjects in an acoustic chamber For each stimulus, the intensity of a frequency componentwas specified mathematically for a given spectral envelope- For Experiments 1 and 2, (with the latter varying the F0 as the irrelevantdimension), each stimulus had a linear flat spectral envelope with a negative spectral slope, as shown in Figure I a and V4s• (1),
1,(,) = Slope ,(,a) + h (1)
where lI( 0 is the intensity of the ith frequency component (i = 1 to20) and b is the F' intensity. For a flat spectral slope stimulkhwas set to the maximum level (72 dl), which produced no clipping of the waveform Six levels of spectral slope were chosen in arange from 0.50 to -1.75 dB per frequency component in a step of 40.25 dli An example of these flat spectrum stimuli is illustratedin Figure I a
Inscrt Figure 1 about here
IEx pe riment 3 used a rcstnal ir (h.tr,it ifhc ii the rrele'ant dime nsw. tsI hc spct'rral envclope fp r ct(h ot iheasc sit1titll ;iistdetermined by convoluting a Olai sp•' r, id ýlopc snmtl us with a sinusoidal ( spdctraDl rcsonaa)r transfer fiunkIion We uwa i' s ac
I! 'Ill lllllll lllllll
Spectral lcp•e )iscnminatton Page 4
function to simulate a formant-like characteristic The resonator spectral envelope is specified as
1(1) = m * sin(2 k¢20), (2)
where I(i) is the weighting function applied to the amplitude of the ith frequency component This function specifies a resonatordepth (_n = 4 dB) and the number of resonator frequencies (_k = t&.c number of poles or spectral peaks). For these ripple spectrumsttmul, the F0 intensity (_b in Fq 1) was reduced to68 dB to avoid clipping An example of these stimuli is shown in Figure 1 b.This general type of resonator characteristic also was used by Berstein and Green (1987).
ProcedureBased apon a pilot study, an XAB discrimination task seemed to be more effective than an AX task, in fact, all subjects had a
great deal of difficulty in performing the AX version of the task On each trial, a standard stimulus ( X) was always presented in thefirst interval, followed by the A and B test stimuli One of the test stimuli was identical in spectral slope to the standard stimulus withthe other stimulus differing in spectral slope. Subjects indicated which of the two test stimuli matched the standard stimulus inspectral slope by prcing a button on a response box The correct response to both panels in Figure 2 should be stimulus R (Theexplanation for this figure is given below.) Trial-by-trial feedback was provided following the subjects' responses The three stimuli oneach trial were separated byO00 ms. There was an 800 ms inter-trial interval .
The current study employed two types of experimental conditions to examine the effects of variations in an irrelevant dimensionon the discrimination of a relevant dimension (spectral slope). On a single trial in a roving-irrelevant-dimension condition, twostimulus dimensions varied simultaneously, with listeners required to respond to the difference on the relevant dimension, but toignore the variation on an irrelevant dimension For this roving condition, the two test stimuli (A and B) on a single trial had thesame value on an irrelevant dimension that differed from that of the standard stimulus ( N. On a trial in a fixed-irrelevant-dimensioncondition, a single value of an irrelevant dimension was used for all three stimuli Figure 2 shows two roving conditions which differ inthe type of irrelevant dimensions: fundamental frequency (Fig 2 a) and number of spectral peaks (Fig 2 b). •
Insert Figure 2 about here
For each subject, a hit/ false-alarm matrix was constructed for each experimental condition as a function of differences in spectralslope. Discnmination indices (dl were then calculated from this matrix following the ABX response model suggested by Macmillan 5and Creelman (1991: also Pierce & Gilbert, 1958).
Sub ectsSiv SUNY-Binghamton students were paid for their participation in this study The subjects originally were naive to auditory
psychoacoustics tasks and all reported normal hearing
Expe nment 1
Spectral slope was defined in terms of a systematic decrease in intensity of a frequency component with an increase in frequency.Because the current study fixed the F, intensity, stimuli with a steeper spectral slope had lower intensity in high frequencies relative tothose with a shallower spectral slope. Thus, spectral slope co-varied with overall stimulus intensity(and intensity in the upper portionof the spectrum By definition, the manipulation of spectral slope must co-vary with the absolute intensity of some portions of thestimulus spectrum). As a result, instead of judging the global property of spectral slope the subjects might be able to perform thetask by companng either overall stimulus intensity or intensity in a specific high frequency region Experiment 1 explored the possibleuse of either of these alternative listening strategies in the spectral slope discrimination task Two experimental conditions were usedIn the fixed-level condition, the F0 intensity was equal for the three stimuli on a trial, and therefore, overall stimulus level wasdetermined solely by spectral slope (see Fq 1). In the roving-level condition, F0 intensity was determined randomly andindependently w,'r a range of 20 dB for each of the three stimuli on a trial, thus precluding an effective use of the absolute level inperforming the spectral slope discrimination task This roving of intensity procedure has been used in profile analysis studies toeliminate responding to the absolute level (Green, 1988; Mason, Kidd, Hanna, & Green, 1984).
There are three possible patterns of outcomes which could occur with the two conditions First, if subjects use the overall stimuluslevel as a cue, but cannot respond directly to spectral slope discrimination performance should be high in the fixed-level condition,and at chance in the roving-level condition. This finding would suggest that the current project should be discontinued Second, ifsubjects use information only about spectral slope, and thus, do not use the correlated intensity cue, equivalent discriminationperformance should he observed in the two conditions, and subsequent experiments then need not control for differences in overallstimulus level caused by varying spectral slope. Finally, if listeners use both types of information, discrimination performance shouldhe higher in the fixed-levcl condition than in the roving-level condition, with performance for both conditions above chance. The lastpossibhle outcome will require roving overall stimulus level to eliminate this correlated intensity cur-
*tiiTfml, d l•|'rinxcdure'it •inuhlt wcre svnihes•,/ed by using the six levels of spectral slope with a 170 1i1 funtamcntal Iretlucncv i,,r the ri,,tng-lcvsl
Ii III Iiiiiiiiiiiii
3 Spectral Slope Discrimination Page 5
condition, the overall intensity of each stimulus within a trial was determined randomly in a range of 20 dli in I dBi stcp.ý and thusthe 10 intensity was ranged from 52 to 72 dR Roving overall stimulus intensity was implemented using a Charytdis Model Dprogrammable attenuator Subjects completed 12 blocks of trials. The60 trials in a block were created by crossing each of the sixlevels of spectral slope with every other level and with equal assignment of the paired spectral slope values as the standard stimulus.The data collection began after720 practice tria.,
Results and DiscussionFigure 3 shows the individual discrimination performance for the two conditions as the function of slope differences Thc solid
curves with open circles show the results of the flxed-level condition, and the dotted curves with filled circles are those of the roving-level conditions These curves are essentially psychometric fun,.tions, plotting the discrimination ability as a function of the magnitude Sof spectral slope difference However' they differ from more standard psychometric functions in that each point along the abscissarepresents the pooling of all stimulus pairs that differ by the given magnitude of spectral slope The fited-level condition for allsubjectst and the roving-level condition for some subjects, reaches ceiling(d'> 6.0) at the largest slope differences In fact, even d'values of 5.0 or greater cannot be very accurate since all differences in z scores reflect extremely small changes in the upper5 % of thetail of the normal distribution. Moreovet; the d' values for the larger slope differences were based upon fewer stimulus pairs thatdiffered by the given magnitude than those for the smaller slope difference ( Esperiment 4 will examine the importance of unequalsampling) S
Insert Figure 3 about herm
With the exception of Subject 2, all subjects exhibited linear psychometric functions for both fixed- and roving-level conditions butwith a shallower slope for the roving-level condition. The shallower slope for the roving-level condition than for the ftxed-levelcondition indicates that the subjects were all using the absolute stimulus intensity information in the latter condition, but could stillperform the spectral slope discrimination task when the absolute intensity provided no valid information. Subject 2 was not able toperform the roving discrimination task to a reasonable level (e. g, d'> 1) at even the larlest difference in spectral slope, indicatingthat this subject was probably using only absolute intensity to perform the discrimination. The average psychometric functions( Figure 3 g) thus are based upon the five subjects who could perform the discrimination task under the roving condition ( L e, excludingSubject 2)
Both mean psychometric functions are highly linear before reaching ceiling with essentially zero intercepts (i2
= 0.99 for bothconditions). The two functions differ solely in the slope of the linear regression equations (7.6 for the fixed- and 4.9 for theroving-level condition). T1he ratio of these values is 1.55, which can be interpreted as the absolute intensity cue contributingapproximately 35 % of decision information to the fixed discrimination. An alternative interpretation of this ratio (adopting theformula from Macmillan, Braida, & Goldberg 1987) is that this roving intensity information increases the variability of perceptualaccision, with the ratio of variances being 1.40,? this interpretation is more appropriate for the later experiments where the rovingvariable clearly functions only by adding noise, rather than by also eliminating a correlated cue for discrimination
A 2 x 5 within-subject analysis of variance was performed on the d' values The significant main effect of 'he spectral slopedifference confirmed that discrimination improved as the spectral slope difference was increased (1(4,20) = 62.90, .p< .05), asexhibited by the linear psychometric functions The significant main effect of the conditions indicated better discriminationperformance for the fixed-level condition than for the roving-level condition (_F(1,5) = 33.96, p< .05). The interaction of the ( fixed-,.. rOV,,e,-lIC . ... . .':ion:; and hc ýpc, rai slope iffc,c, ',.•r.• z~grificant (_14,2) = 2.07, p > .05).
For the roving-level condition, discrimination performance was cleatlv above chance To appreciate this finding the reader isreminded that, on each trial in the roving-level condition, overall stimulus level was varied randomly across the three soimuli; thereforethe stimulus with the steepest spectral slope might have higher overall level ihan those with shallower spectral slopes It thus was notpossible for the subjects to make accurate judgment on the basis of overall stimulus level ( or absolute intensity in any portion of thespectrum). °his result indicates that the five subjects had to extract some sort of sound quality based on spectral slope from thesecomplex stimuli Ihowever compared with that in the fixed-level condition, discrimination performance was poorer in the roving-levelcondition This latter result indicates that all subjec). exploaicd -•,t'rill stimulii 1-cl am an a-. ýwicn-, ,re f - the difference in spectralslope, and thus requires that subsequent experiments eliminate the intensity cue in evaluating spectral slope discrimination. "lherefore,in the subsequent experiments, overall stimulus let always be varied randomly over a range of20 dB within a triaL (The fixedversus roving conditions in Experiments 2 4 will difler in terms of an irrelevant stimulus dimension, with both conditions in each
experiment rxiving overall stimulus level)
I-xpenment 2
Experiment 2 investigates the effects of variation in the fundamental frequency on spectral slope discrimination Bothfundamental frequency and spectral slope are considered as two sound source properties, it is quite possible that listeners will treat allsound source properties as a unit in a sound-produciig system Ihe two conditions in this experiment were used to examine thelistener's abilitv to extract spectral slope In the first condition, fundamental frequency was fixed within a toal, but randomly variedicr(ss trials ( the fixed cronditioin) In the scoind ciondition, fundamental frequency was randomly varied loih within a rial and acrossirial, (the rrovngconilitilri) I b rir ,rtimanic difCrCen•c bhe v.cen the iso o(fdtii(iit will :nid alc the manrltudc oil the adilcv. c ctot ,
It I I1 IIIIIII II |1IIII I
US
Spectral %kop IDiscrimination Page 6
of v'riat•on in the ftindamen!'l frequency upon spectral slope discrimination, and therefore, should shcd light upoxn the Ipcrceptualrelationship between the two source properties The research method is similar to what was used by l)urlach, Ian, Macmillan,Rabinowitz, and Braida (1989), and represents an accuracy-based version of the (iarner(1974) strateg-y ofr evaluating integral versus •separable dimensions
Stimuli and ProcedureThe six levels of spectral slope from Experiment 1 were combined with three levels of fundamental frequencies (150, 170, and 190
117) to create 18 stimuli These specific fundamental frequencies were chosen to guarantee no common frequency components for thestimuli differing in the fundamental frequency. In the fixed condition, the three stimuli on each rial shared a common fundamcntalfrequency, equally selected from the three fundamental frequencies In the roving condition, two different fundamental frequencieswere selected for the standard stimulus and the two test stimuli on each tmal TIhere were six possible combinations of fundamentalfrequency pairs by crossing the three fundamental frequencies with every other For each condition, the subjects completed 12 blocksof6O trialsi always preceded by720 practice trials ( Because of roving intensity undr all conditions, the fixed condition with the170-lIz F• is identical to the roving-level condition in Experiment 1.)
Results and DiscussionFigure 4 shows discrimination performance for each subject under the two conditions in which the fundamental frequency was
fixed ( solid curves with open circles) or randomly varied within a trial (dotted curves with closed circles). With the exception ofSubject 2 under the roving condition, the subjects under both conditions exhibited a generally linear growth in discrimination as afunction of an increase in the spectral slope difference Figure 4 g describes the mean d's across the five subjects (excluding Subject 2)For d' values under6.0, the two mean functions are linear (_2 = 0.99 andO.98 for fixed and roving condition.% respectively), withintercepts of -013 and 0.25. These results were confirmed by the presence of a significant main effect of the spectral slopedifference in a 2 x 5 within-subject analysis of variance (1"J4,20) = 62.51, .p< .05). The results clearly indicate that the subjects wereable to evaluate spectral slope despite variation in the fundamental frequency Consider the roving condition in which the stimulidiffered in the frequency components due to the change in the fundamental frequer.' Across both conditions in this experiment, theonly relational property that remains constant regardless of variation in the fundamental frequency (and in overall stimulus intensity)is spectral slope. Therefore the subjects had to rely on the relational (or global) properties defining spectral slope to make correctrerponses
Insert Figure 4 dhout here-
Poorer discrimination performance was found in the roving fundamental frequency condition compared with the fixed fundamentalfrequency condition (1(1,5) = 26.145, pn< .05). 11c adverse effect due to the variation in the fundamental frequency was evidentacross all the six subjects, indicating that the decision on spectral slope was influenced to some degree by the difference in thefundamental frequency' 3
There was a nearly significant interaction between the levels of the spectral difference and the two conditions(_14,20) = 2.57, _p < .06). Ignoring the highest levels of performance, the detrimental effect of roving fundamental frequency was interms of a change in the slope of the psychometric function (4.4 versus 3.6 for the fixed and roving conditions), which is consistentwith added noise due to the roving condition Substituting the slopes of the regression equations for d' in an adapted version of theformula in Macmillan, Braida and Goldberg(1987), it is estimated that the ratio of variance due to roving fundamental frequencyrelative to variance associated with spectral slope discrimination (with roving overall intensity) is 0.49. 1'hus1 for the specific range ofvalues in this experiment, roving fundamental frequency adds approximately 50 % more variability to the decision process
"]The results of this experiment indicate a moderate level (50% variance increase) of Garner interference which is said to occurwhen slower response time or lower accuracy is found for the stimuli with incongruent values on paired dimensions relative to stimuliwith congruent values(Garmer; 1974). Garner interference indicates a failure of selective attention tk. a iclcvant dimension due to Svariation in an irrelevat, dimension; thus the paired dimensions are considered as an integral perceptual unit iecause, in typicalstudies of Garner interference, researchers use highly discriminable binary values on paired stimulus dimensions, results from typicalstudies cannot be used to address the extent to which the perception of one dimension is influenced by the other Rather researcher,typically tend to draw more absolute conclusions about whether tne stimulus dimertsion iý p.-rceptually acersihle "ihe use of multipevalues on both relevant and irrelevant dimensions in the current study has allowed a more detailed evaluation of degree to which therelation between spectral slope and the fundamental frequency is separable from the fundamental frequency.
SExpeimenm t 3
In contrast to the use of two sound source properties (spectral slope and fundamental frequency) in Experiment 2, Experiment 3investigates the perceptual constancy of spectral slope in the context of variation in the number of spectral peaks ( which defines aresonator characteristic). 1ecause spectral slope and the resonator characteristic reflect different sound-producing components, thedetrimental effect of varying the irrelevant dimension may not occur in Ixperiment 3. Again, two conditions were used to determinethe effect of roving the resonator characteristic on spectral slope discimination In the fixed condition, the number of spectral peaksw;i, foed ýithin a trial, but varied across trials. In the r osjg ondition, the number of spcctral peaks was varied both within a tria,,?1,] .1r., ,,,, tri.l'K
1
3 Spectral S."pe Discriminatioa Page 7
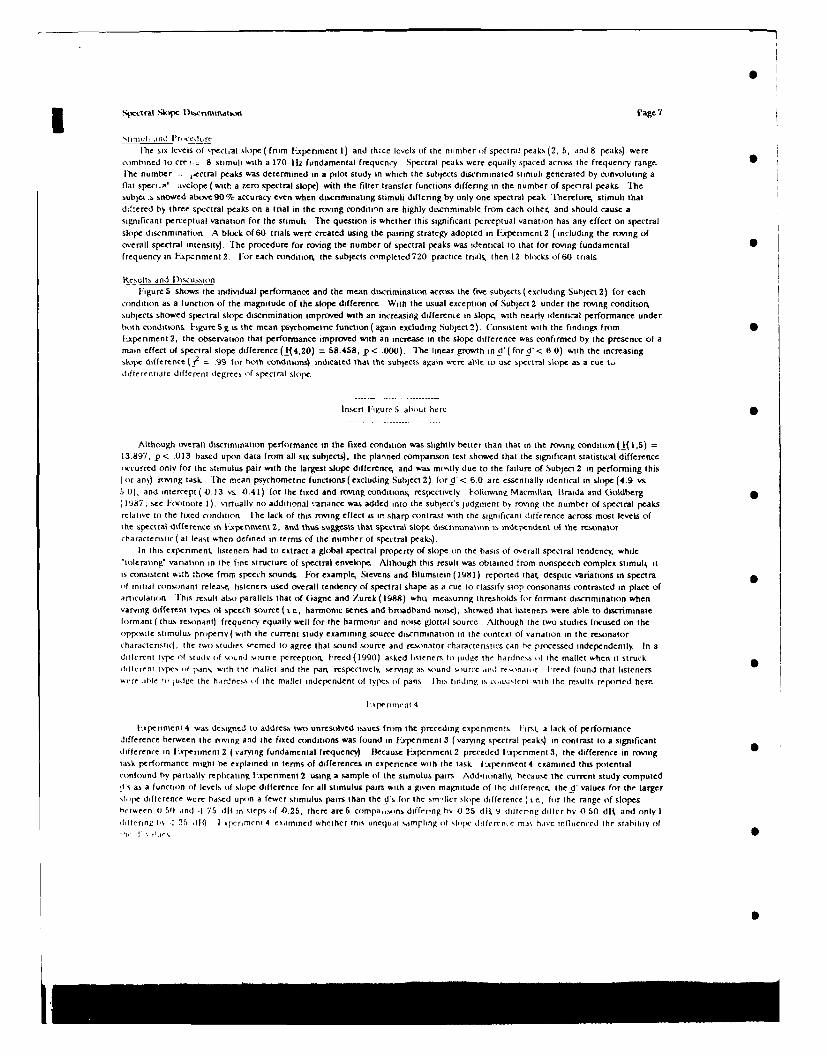
i in uhI i id nIr' I'C eurCI'he six levels of specctal slope ( from Experiment 1) and thice levels of the number of spectral peaks (2, 5, and 8 peaks) were
combined to crr:i.ý 8 stimuli with a 170 iHz fundamental frequency. Spectral peaks were equally spaced across the frequency range.rhe number . pectral peaks was determined in a pilot study in which the subjects discriminated stimuli generated by convoluting a
flat spect.?' •velope (with a zero spectral slope) with the filter transfer functions differing in the number of spectral peaks lhesubjeA s snowed abowe 9O% accuracy even when discriminating stimuli diffenng by only one spectral peak Therefore, stimuli that
dJiiered by three spectral peaks on a trial in the roving conditinn are highly discnminable from each other, and should cause asignificant perceptual variation for the stimuli Tlhe question is whether this significant perceptual variation has any effect on spectral
slope discrimination A block of 60 trials were created using the pairing strategy adopted in Experiment 2 ( including the roving ofoverall spectral intensity). lihe procedure for roving the number of spectral peaks was identical to that for roving fundamental Sfrequency in Experiment 2. For each condition, the subjects completed 720 practice tnals, then 12 blocks of6O itrals.
Results and i'-.cussionFigure 5 shows the individual performance and the mean discrimination across the five subjects (excluding Subject 2) for each
condition as a function of the magnitude of the slope difference. With the usual exception of Subject 2 under the roving condition,sutbjects showed spectral slope discrimination improved with an increasing difference in slope, with nearly identical performance underboth conditions Figure S g is the mean psychometric function (again excluding Subject 2). Consistent with the findings from SExperiment 2, the observation that performance improved with an increase in the slope difference was confirmed by the presence of amain effect of spectral slope difference (1(4,20) = 58.458, _p < .000). The linear growth in d' (for d'< 6.0) with the increasingslope difference (i
2 ý 99 fot both conditions) indicated that the subjects again were able to use spectral slope as a cue tw
differentiate different degrees of spectral slope,
Insert Figure S about here
Although overall discrimination performance in the fixed condition was slightly better than that in the roving condition (|11,5) =
13.897, p < .013 based upon data from all six subjects), the planned comparison test showed that the significant statistical differenceoccurred only for the stimulus pair with the largest slope difference, and was mostly due to the failure of Subject 2 in performing this
(sor any) ro-ing task [he mean psychometric functions (excluding Subject 2) for d' < 6.0 are essentially identical in slope (4.9 vs5 0), and intercept (40.13 vs .0.41) for the fixed and roving conditions, respectively. Following Macmillan, Braida and (oldberg(1987 ; see Footnote 1), virtually no additional variance was added into the subject's judgment by roving the number of spectral peaks
relative to the fixed condition: The lack of this roving effect is in sharp contrast with the significant difference across most levels ofthe spectral difference in xperinment 2, and thus suggests that spectral slpIt discrimination is independent of the resonatorcharacteristic ( at least when defined in terms of the number of spectral peaks).
In this experiment, listeners had to extract a global spectral property of slope on the basis of overall spectral tendency, while"toleraiing" variation in the fine structure of spectral envelope. Although this result was obtained from nonspcech complex stimulk it
is consistent wi:h drohe from speech sounds For example, Stevens and blumsiein (1981) reported that, despite variations in spectra,f initial consonant release, listeners used overall tendency of spectral shape as a cue to classify stop consonants contrasted in place of
articulation I[his result also parallels that of 6agne and Zurek (1988) who measuring thresholds for formant discrimination when
varying different types of speech source ( e., harmonic series and broadband noise), showed that listeners were able to discriminateformant ( thus resinant) frequency equally well for the harmonic and noise glottal source. Although the two studies focused on the
opprxsite stimulus pr)perty ( with the current study examining source discrimination in the context of variation in the resonator
characteristic), the two studies seemed to agree that sound source and resonator characteristics can le processed independently In adilferent type of study of ,otrnd sourne perception, Freed (1990) asked listeners to judge the hardnes,, of the mallet when it struckdilterenr types ,f panw with the mallet and the pan, respectively, serving as sound surce ,and reronator Freed found that listeners,-ere atle ,, judgle the hardness ,f the mallet independent of types of pans Ibis finding is ctisslrni s-ih the results reported here.
lxperinient 4
-.xperment 4 was designed to address two unremolved issues from the preceding experimens. lirst, a lack of performancedifference between the roving and the fixed conditions was found in Ex-penment 3 (varying spectral peaks) in contrast to a significantdifference in I'xpenrment 2 (varying fundamental frequency) Ifecause Experiment 2 preceded E.xperiment 3, the difference in roving
task performance might be explained in terms of differences in experience with the task Fxperiment 4 examined this potentialconfound by partially replicating Experiment 2 using a sample of the stimulus pairs, Additionally, because the current study computed
dts as a function of levels of slope difference for all stimulus pairs with a given magnitude of the ditference, the d' values for the larger.,,pe difference were based upon a fewer stimulus pairs than the d's for the sm',Iler slope difference (r e., for the range of slopeshetween 4) 50 and -1 75 dli in steps tof .0.25, there are S compas,,ns diffenng by 41 25 dii, 9 diitenng dltler by 41 50 dli and only Ihiiterinl' h, I 21F) d) I %pcrrncTi 4 examined whether this unequal sampling oii ,lotie hilferent e mai ho•te influenced the stability (if
Spectral %lvpe D)iscrimination age, 8
stimuli and Procedure
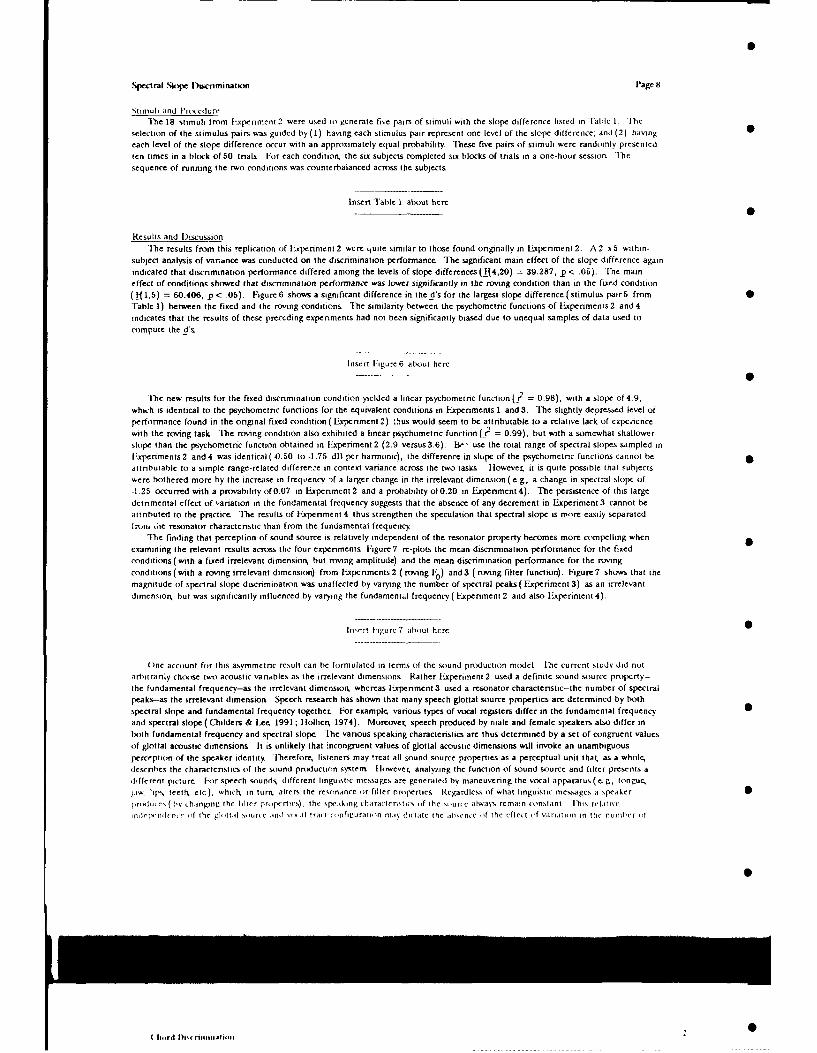
The 18 stimuli from .xperiment 2 were used to generate five pairs of stimuli with the slope difference listed in Table I. [Theselection of the stimulus pairs was guided by(1) having each stimulus pair represent one level of the slope difference; and (2) having
each level of the slope difference occur with an approximately equal probability. These five pairs of stimuli were randomly presented
ten times in a block of 50 trials For each condition, the six subjects completed six blocks of trials in a one-hour session. The
sequence of running the two conditions was counterbalanced across the subjects
[nsect Table 1 about here
Results and D)iscussion
The results from this replication of Experiment 2 were H4ute similar to those found originally in Experiment 2. A 2 x 5 within-
subject analysis of vantance was conducted on the discrimination performance. The significant main effect of the slope difference again
indicated that dtscrimination performance differed among the levels of slope differences (_114,20) = 39.287, p < .05). Ihe maineffect of conditions showed that discrimination performance was lower significantly in the roving condition than in the fixed condition
(T1 ,5) = 60.406, p< .05). Figure6 shows a significant difference in the d's for the largest slope difference (stimulus pairS from •Table 1) between the fixed and the roving conditions The similarity between the psychometric functions of Experiments 2 and 4
indicates that the results of these preceding experiments had not been significantly biased due to unequal samples of data used to
compute the d's,
Insert Figure 6 about here
The new results for the fixed discrimination condition yielded a linear psychometric function (_!2
= 0.98), with a slope of 4.9,
which ts identical to the psychometric functions for the equivalent conditions in Experiments 1 and 3. The slightly depressed level of
performance found in the original fixed condition ( Experiment 2) :hus would seem to be attributable to a relative lack of experiencewith the roving task The roving condition also exhibited a linear psychometric function (r
2 = 0.99), but with a somewhat shallower
slope than the psychometric function obtained in Experiment 2 (2.9 versus3.6). 13-- use the total range of spectral slopes sampled in
Experiments 2 and 4 was identical (.0.50 to -1.75 dB per harmonic), the difference in slope of the psychometric functions cannot beattributable to a simple range-related difffrer.ze in context variance across the two tasks H|owever it is quite possible that subjects
were bothered more by the increase in frequency if a larger change in the irrelevant dimension (e- g, a change in spectral slope of
-1.25 occurred with a provability of 0.07 in Experiment 2 and a probability of 0.20 in Experiment 4). The persistence of this large
detrimental effect of variation in the fundamental frequency suggests that the absence of any decrement in Experiment 3 cannot be
attributed to the practice. The results of Expriment 4 thus strengthen the speculation that spectral slope is more easily separated
frot, mie resonator characteristic than from the fundamental frequency.
The finding that perception of sound source is relatively independent of the resonator property becomes more compelling when
examining the relevant results across the four experiments Figure 7 re-plots the mean discrimination performance for the fixed
conditions (with a fixed irrelevant dimension, but roving amplitude) and the mean discrimination performance for the roving
conditions (with a roving irrelevant dimension) from Experiments 2 ( roving Fo) and 3 ( roving filter function). Ftgure 7 shows that the
magnitude of spectral slope discrimination was unaffected by varying the number of spectral peaks ( Experiment 3) as an irrelevant
dimension, but was significantly influenced by varying the fundamental frequency ( Experiment 2 and also Experiment 4).
Insi rt Fi:gurc 7 about here
line account for this asymmetric result can be formulated in terms of the sound production model T'he current study did not
arbiirarily choose two acoustic variables as the irrelevant dimensions Rather Experiment 2 used a definite sound source property-
the fundamental frequency-as the irrelevant dimension, whereas Experiment 3 used a resonator characteristic-the number of spectralpeaks-as the irrelevant dimension Speech research has shown that many speech glottal source properties are determined by both
spectral slope and fundamental frequency together. For example, various types of vocal registers differ in the fundamental frequenc"and spectral slope ( Childers & Lee, 1991 ; Ilollien, 1974). Moreovet, speech produced by sale and female speakers also differ inboth fundamental frequency and spectral slope. The various speaking characterstics are thus determined by a set of congruent values
of glottal acoustic dimensions It is unlikely that incongruent values of glottal acoustic dimensions will invoke an unambiguous
perception of the speaker identity Therefore, listeners may treat all sound source properties as a perceptual unit that, as a whole,describes the characteristics (if the sound production system Hlowever, analvying the function of sound source and filter presents a
different picture For speech sounds, different linguistic messages are generated by maneuvering the vocal apparatus (e. g, tongue,
Jl.w, hpN teeth. etc), which in ture, alters the re,.onance iir filler nriiperlies Regardlcss of what linguistic me:ssagcs a speaker Stri .,lue s ( bv changing the tilter proierties), the speaking characteru,.t% (if the sour(e alwass remain constant Ibis rehlt sc
inrl.-p'nulu-n- u if the glhital s 'ii a s ai dl tr;rat c(ulnf•gurallon mtiy dlt Nie the .uhcne' of the clleit of variatiou n in lihe nuiiler it
( hiird I)ism ritiigiiti.'ii
SSpectral Slope DLscrimination Pag. 9
spect ral peaks on ,pectral slope discrimination
General Discussion S
The current study was an attempt to utilize a psychophysicJl procedure to investigate the perception of 7omplec global stimulusattributes which would be neglected in the past psychoacoustics research. Evidence has suggested that the research that focuses ondetailed acrustic properties may not be able to successfully predict performance in perception of speech and other complex naturally-occumng sounds
Because the past psychoacoustics research focuses on the abilities of auditory peripheral s .emr to detet or disc'iminate changesin elementary acoustic properties such as, pitch, loudness, phase and duration of a signal, it is called the Fourier analysis approach( Gaveri 1993). Understanding listeners' abilities to process elementary acuustic properties has taught researchers a great deal aboutelemental aspects of perception and about the physiological underpinnings of auditory information processing However; our auditorysystem also needs to recover more global stimulus propertie. such as source characteristics of a sound-producing s)stem, throughlisteniig to the sound produced by the system (e. g, Freed, 1990; Gaveri 1993; Lk et at, 1992; Rep, 1987; Warren & Verbrugge,1984). It is doubtful that studying the processing of elementary acoustic properties is sufficient to promote a full understanding ofperception of naturally-occurmng sounds Although we do not agree with the extreme position that studying the processing ofelementary properties in the hope to understand perception of naturally-occurring sounds is as distant as studying the processing offeatures of letters in the hope to understand reading comprehension (Gaver, 1993), there clearly is merit to moving to a higher levelof analysis when trying to understand more global aspects of perception
The source-filpr analysis approach, used in the current study, provides one alternative to the Fourier analysis approach Ratherthan using elementary acoustic properties as stimulus dimensions, the source filter approach assumes that a complex sound,particularly, a naturally occurring sound, is produced by an interaction of sound producing cemponents such as power, oscillator,resonator, and coupler A scund is produced by vibrating the oscillatotr which is excited by the power The sound is then shaped bythe resonator where the spectrum of the source is tuned to the resonator characteristics Thus1 the acoustic (spectral and temporal)effects of these sound-producing components should be stimulus dimensions in a laboratory study of perception of naturally occurringsounds Although the source filter model describes sound production, the model also provides a guide for investigating perception ofcharacteristics of sound-producing components To implement this research scheme, two types of perceptual questions must be asked:(1) whether the acoustic effect of each component is perceptually accessible; and (2) what is the nature of perceptual interactionamong the components To investigate the first question, the physics of each component must be understood, and the acoustic effectof each component should be then examined by varying different physical parameters defining the component Because not everyacoustic effect is perceptually meaningful a perceptual investigation needs to follow the acoustic analysis Psychophysics analysis of the Sacoustic effect can help determine the mapping from the physical parameter of the sound-producing component to the acoustic effect,and then to the perceptual effect
The first question focuses on individual components of a sound-producing systen, including The current study attempted toanswer the second question of how the sound-producing components may be interacted to influence our perception of sourcecharacteristics We vaned two types of source properties and a filter property with the intent to understand the perceptual interactionbetween the source and filter properties Relative to the impact exerted by the fundamental frequency(another source property), thefilter property had less influence upon the perceptual resolution (discrimination) of spectral slope ( a source property). The resultssupported the ciaim that the source and filter property were relatively independent (at least for the types of source and filterproperties used in this study). Ilowever, it certainly remains unclear whether this finding can be generalized to the combination of anysource and filter properties Although it is likely that the validity of this finding depends on the type of source and f'ter properties(L e., transfer function) used in this study, the general research approach is certainly useful for studying the perception of complexsounds, especially, naturally-occurmng sounds For example in studying the gender judgment by listening to the sounds of humanfootsteps ( Li, et at, 1992) this approach can be ased to determine what proportions of shoe (source) and walking surface (resonator)factors contribute to the gerder judgment of a walker This rescareh is now underway in the Pas:ore's laboratory at SUN"Y- 5li ngha mtton
Although this discussion emphasizes the importance and necessity of the source-filter analysis approach, both the Fourier analysisand the source-filter analysis approaches represent important, but different levels of analysis in investigation of human audition Invision, Mart (1982) proposed three different levels of data structures: 1) the primal sketch, 2) the 2-) sketch, and 3) the 3-D modelAn audition analog of Marr's theory was developed by Richards(1988). The primal sketch is the waveform or spectrumrepresentation of the signaal l"e Fourier analysis approach certainly helps us to understand the resolution of various acousticproperties in such a representattonr While the 2 -D sketch consists of 'visible' surface properties in vision, in audition, the 2 -D sketchmay include sound localization and properties of source and filter(e.g, harmonicity source, noise source; cylindrical resonator anddrum; metat wood, and glass material, The source-filter analysis approach can be used to investigate the separation of source andfilter properties as well as the perceptual relationship among them Finally, the 3-D model is a vivid and coherent description of thesound in a 3--dimensional space This gross theoretical scheme may provide a direction for us to eventually understand the percepti nof complex naturally-occurnng sounds, and to organize what we have knov-n about the perception of complex sound, 'le specificityand the validity of this research skheme can be tested only by more empirical research and theoretical advancement.
i9
Spectral Slope IDiscrmmnation Page 10
References
13erinstein, L R, & (ireen, D. M. (1987). lDetection of simple and complex changes of spectral shape. Journal of the Acoustical0Society of Amenc, 82, 1587 -1592.
Ellumsteiis, S, E, & Stevens, K N. (1979). Perceptual invariance in speech production: Evidence from measurements of thespectral characteristics of stop consonants Journal of the Acoustical Society of Americ, 66, 1001 -1017.
Childers., DL U,. & Lee, C. K (1991). V- Al quality factors: Analysis, synthesisi and perception. Journal of the Acoustical.Society of Amecac 90, 2394 -2410.
Chq% I L, HIall, M. D., & Pastore, R E (1991). Normalization proceas in thehuman auditory system Journal of the AcousticalSociety of Americ, 89, pt. 2, 198P.
Christopherson, L A (1992). Some psychometric properties of the Test of Basic Auditory Capabilities (11ACQ. Journal ofSpeech and I earing Researcc 35, 929-035.
Cohen, M. E, & Schubert, E D. (1987). Th'le effect of cross-spectrum correlation on the delectability of a noise band Journal
DurlacNs N. 1, Tan, It Z, Macmillan, N. A, Rabinowitz, W. M., & Braida, L D. (1989). Resolution in one dimension withrandom variations in background dimensions Perception & Psychop)hysis, 46, 293-296.
Fant, Gi (196). Acoustic Theory ofSpeech Production Mouton: The Hague.
Freed, D. .1(1990). Auditory correlates of perceived mallet hardness for a set of recorded percussive sound events, Journal ofthe Acoustical Society of America, 87, 311-322.
Gagn; .1, & Zurek, P. NI (1988). Resonance-frequency discrimination. Journal of the Acoustical Society of Amenca 83,2293-2299.
Garnier, W. R. (113"4). The Processing oft Information and Structure. Potomaq MD: Erlbaunx
Gavet; W. (1993). What in the world do we hear? An ecological approach to auditory source perception. Ecololtcal Psycholony5, 1-29.
Green, D. M. (1988). Profile Analysis: Audtr Intensity Discriminations NY: Oxfcrd
I lall, I W., Haggard, N P., & Fernandes, M. A (1984). Detection in noise by spectro-temporal pattern analysis Journal of theAcoustical Society of Amenca 76, 50-66.
fi~llien, 1t1(1974). On vocal register. Journal of Phonetics , ,125-143.
Kidd, G R, & Watson, C. S (1L,39). Detection of relative-frequency changes in tonal patterns Journal of the Acoustical.Society of Amenca 86, S121.
Klatt, D. It, & Kiati, L C. (1990). Analysis, synthesis, and perception of voice quality variations among female and maletalkers. Journal of the Acoustical Society of Amenca 87, 820.857.
Lk X, Logan, R 1, & fP'store R E. (1991). Perception of acoustic source characteristics: Walking sounds, Journal of the-\coustical Society of Amenca 90, 3036 Z049.
Macmillan, N. A, Braida6 L D., & Goldberg R E. (1987). Central atid peripheral processes in the perception of speech andnonspeech sounds In NI F, It Schouten (ed). The Psydbopliysics ofSpechi Pceceptio Thle Htague: Nijhoff
Macmillan, N. A, & Creelman, C. D (1990). Detection Tbeorx,. A IUs,-es Cnide Cambnidge: Cambridge.
Mart, 1). (1982). Vision San Francisco: Freeman
Mason, C R, Kidd, G, Jr. lm, I Un 1.f-, & firern, 1). M. (1984). Prufile analysis and level %anations I Icanng Rescarcls 13,ir"') 275
3 Spectral Slope Iiscriminaton Page 1I
McAdams, S (1993Y Recognition of sound sources and events In S McAdams and E' tigand (eds), Th"linking in Sound: "1heCognitiv•e rs"hology of Iluman Audition NY: Oxford
McFadden, D. (1987). Comodulation detection differences using noise-band signals Journal of the Acoustical Society ofAmerica 81, 1519-1527.
Monsen, R H1, & Engebretson, A M. (1977). Study of variations in the male and female glottal wave. Journal of the AcousticalSociety of America, 62,981-093.
Pastore, R. E (1981). Possible psychoacoustic factors in speech perception. In P. D. Esmas and I Miller(Eds), Pespectives onthe Study of Speech lillsdale, NJ: Lawrence Erlbaum.
Pierce, I R, & Gilbert, E N. (1958)- On AX and ABX limens Journal of the Acoustical Society of America, 30, 593-595.
Price, D. Gi (1989). Male and female voice source characteristics: Inverse filtering results Speech Communication, 8, 261-277.
Repp, E H. (1987). The sound of two hands clapping. An exploratory study. Journal of the Acoustical Society of America, 81,1100-1110.
Richards, W. (1988). Sound interpretation. In W. Richards, (ed), Natura Computation Cambridge, MA: MIT
Stevens, K N (1989). On the quantal nature of speech Journal of Phonetics, 17, 3-45.
Stevens, K N, & Blumstein, S E (1978). Invariant cues for place of articulation in stop consonants Journal of the AcousticalSociety of America, 64, 1358-1365.
Stevens, K N, & Blumstein, S E (1981). The search for invariant acoustic correlates of phonetic features In P. D. Eimas andJ. Miller ( Eds), Perspectives on the Study of Speech HIillsdale, NJ: Lawrence Erlbauns
Warren. R, & Verbrugge, R. R. (1984). Auditory perception of breaking and bouncing events: A case study in ecologicalacoustics Journal of Experimental Psychology. Human Perception and Performance, 10, 704-712.
Watson, C S (1991). Auditory percetrtual learning and the cochlear implant The American Journal of Otolosy, Supplement
Watson. C S, Qiu, W. W., Chamberlain, M tM, & Li, X (1993). Auditory and visual speech perception: Confirmation of amodality-independent source of individual differences Journal of the Acoustical Society of Americs ( under review)
Wright, a A (1990). Comodulation detection differences with multiple signal bands Journal of the Acoustical Society ofAmerica, 87, 292-303
Woods, W. S, & Colburn, R. S (1992). Test of a model of auditory object formation using intensity and interaural timedifference discrimination. Journal of the Acoustical Society of America, 91, 2894-2902.
Yost, W. A, & Sheft, S (1989). Across-critical-band processing of amplitude-modulated tones Journal of the Acoustical Societyof America, 85, 848-857.
Yost, W. A, Sheft, S, & Opie, 1 (1989). Modulation interference in detection and discrimination of amplitude modulation.Journal of'the Acoustical Society of America, 86, 2138-2147.
Author Note
This research was supported inpart by the NSF and AFOSR grants awarded to Richard E Pastore, and facilitated by the Sassistance from the Center for Cognitive and Psycholinguistic Sciences at the State University of New York at Binwiamton. Thepreparation of this manuscript by the first author was funded by the NIH and AFOSR grants awarded to Charles S Watson at IndianaUniversity. Any opinions, findings, and conclusions expressed in this publication are those of the authors and do not reflect the viewsof the funding agencies The first author is currently affiliated with the Center for Speech Processing the Department of Electricaland Computer Engineering The Johns Hlopkins University Requests for reprints should be sent to Xiaofeng LI, The ('enter forSpeech Proc-ssin. the Department of EIlectrical and (omputer Engineering, The Johns Hopkins University, IBaltimore, MD21218
I1 Iiiiiiiiiiiiiiiiiiiiii
Spectral Skopc IDim cimination Page 12
Fo otnotcs
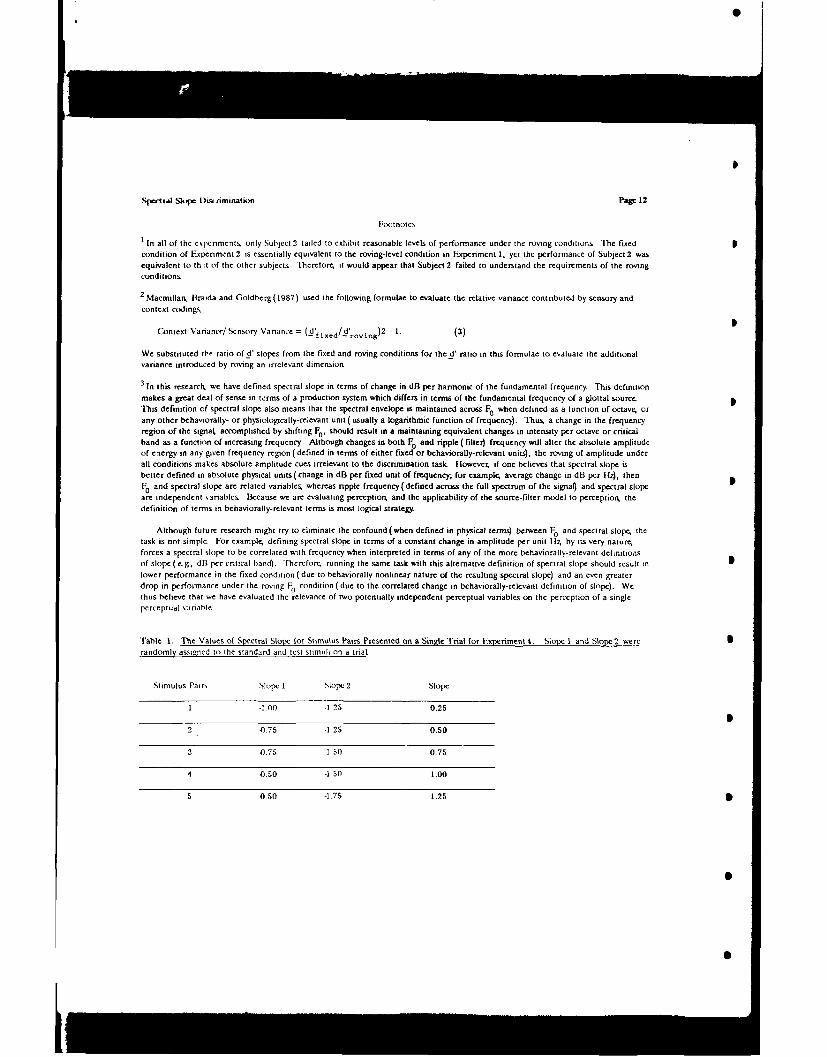
1 In all of the eperiments only Subject 2 failed to exlibit reasonable levels of performance under the roving conditions. The fixed
condition of E•xeriment 2 is essentially equivalent to the roving-level condition in Experiment 1, yet the performance of Subject 2 wasequivalent to th :t of the other subjects Therefore, it would appear that Subject 2 failed to understand the requirements of the roving
conditions
2 Macmillan, Braida and Goldberg(1987) used the following formulae to evaluate the relative variance contributed by sensory and
context codinAg
Context Variance/ Sensory Vanance = (..fied/..roving)2 -1. (3)
We substituted tfl ratio of d' slopes from the fixed and roving conditions for the d' ratio in this formulae to evaluate the additional
variance introduced by roving an irrelevant dimension
3 In this research, we have defined spectral slope in terms of change in dB per harmonic of the fundamental frequency. This definition
makes a great deal of sense in terms of a production system which differs in terms of the fundamental frequency of a glottal source.
This definition of spectral slope also means that the spectral envelope is maintained across F0 when defined as a function of octave, orany other behaviorally- or physiologically-relevant unit ( usually a logarithmic function of frequency}. Thus, a change in the frequencyregion of the signal, accomplished by shifting F0, should result in a maintaining equivalent changes in intensity per octave or critical
band as a function of increasing frequency. Although changes in both F0 and ripple ( filted) frequency will alter the absolute amplitudeof energy in any given frequency region (defined in terms of either fixed or behaviorally-relevant units, the roving of amplitude underall conditions makes absolute amplitude cues irrelevant to the discrimination task. However, if one believes that spectral slope isbetter defined in absolute physical units (change in dB per fixed unit of frequency; for example, average change in dB per R4), then
F0 and spectral slope are related vanable4 whereas ripple frequency(defined across the full spectrum of the signaQ and spectral slopeare independent •3riables Because we are evaluating perception, and the applicability of the source-filter model to perception, thedefinition of terms in behaviorally-relevant terms is most logical strategy
Although future research might try to eliminate the confound (when defined in physical terms) between F. and spectral slope, thetask is not simple. For example, defining spectral slope in terms of a constant change in amplitude per unit ||z by its very nature,forces a spectral slope to be correlated with frequency when interpreted in terms of any of the more behaviorally-relevant definitioas
of slope (e.g, dB per critical band). Therefore, running the same task with this alternative definition of spectral slope should result in
lower performance in the fixed condition (due to behaviorally nonlinear nature of the resulting spectral slope) and an even greaterdrop in performance under the roving F0 condition (due to the correlated change in behaviorally-relevant definition of slope). Wethus believe that we have evaluated the relevance of two potentially independent perceptual variables on the perception of a singleperceptual vanable
rable 1. The Values of Spectral Slope for Stimulus Pairs Presented on a Single Trial for Experiment 4. Slope 1 and Slope 2 were
randomly assigned to the standard and test stimuli on a trial
Stimulus Pairs Slope I Slope 2 Slope
1 -1 01 -1 25 0.25
2 0 75 -1 25 0.50
3 0.75 1 50 0,75
4 0.50 -1 50 1.00
5 0.50 -1.75 1.25
Ill I

S ,pectral Slope Disacimination Page 13
Figure Captions
Figure 1. Schematic representation of the stimuli. The panel consists of a 20 harmonically-related complex sound (shown by thevertical lines) with a decreasing spectral enveiopr. The abscissa is the harmonic number; and the ordinate is the spectral intensity.The bottom panel illustrates a stimulus produced by passing the stimulus in the top panel through a five spectral peak filter
Figure2. Illustration of the trial structure for Experiments 2, 3 and 4. The top panel is the trial structure for Experiment 2, whereasthe bottom panel is for Experiment 3. For each stimulus shown by a schematic spectrun, the vertical lines are the 20 harmonic toneswith the spectral intensity specified in the ordinatc For the detailed description of the trial structure, see the text
Figure3. Results for Experiment 1. The first six graphs are the results for the individual ýubjects The last graph is the mean acrossthe five subjects (excluding Subject 2). For each graph, the abscissa is the difference in spectral slope within a trial, and the ordinateis the d' value The solid curves with open circles are the results for the fixed-level condition, and the dotted curves with closed circlesare those for the roving-level condition.
Figure4. Results for Experiment 2. The solid curves with open circles are the results for the fixed irrelevantdimension (fundamental Sfrequency) condition, and the dotted curves with closed circles are those for the roving irrelevant dimension condition.
Figure 5. Results for Experiment 3. The solid curves with open circles are the results for the fixed irrelevantdimension ( the numberof spectral peaks) condition, and the dotted curves with closed circles are those for the roving irrelevant dimension condition.
Figure 6. Results for the replication of Experiment 2. The solid curves with open circles are the results for the ftxeoirrelevantdimension ( fundamental frequency) condition, and the dotted curves with closed circles are those for the roving irrelevant 5dimension condition
Fiure7. Comparison of decrements caused by variation in the irrelevant dimensions The left panel varied the fundamentalfrequency as the irrelevant dimension (Experiment 2), whereas the right panel varied the number of spectral peaks as the irrelevantdimension ( Experiment 3).
IS
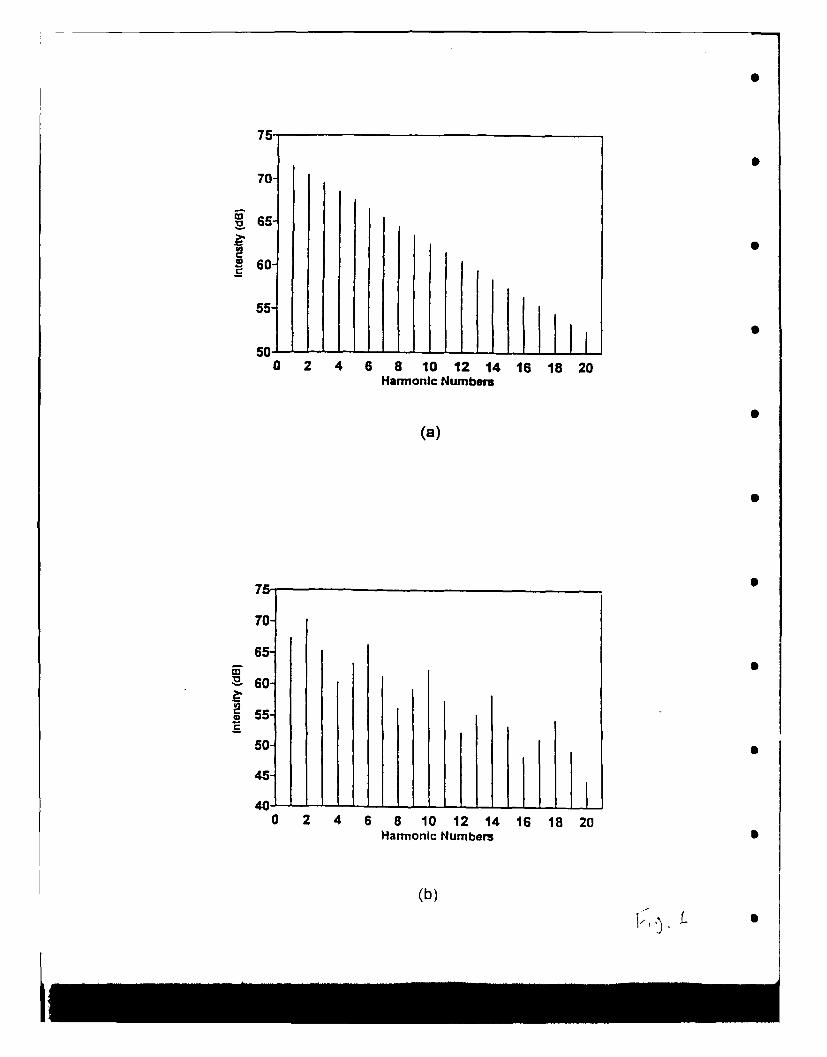
75
70-
S65-
S60-
55-
501 1 10 2 4 6 8 10 12 14 16 18 20
Harmonic Numbers
(a)
75
70-
65-
- 60-
55-
45-
0 2 4 6 8 10 12 14 16 18 20Harmonlc Numbers
(b)
1'k
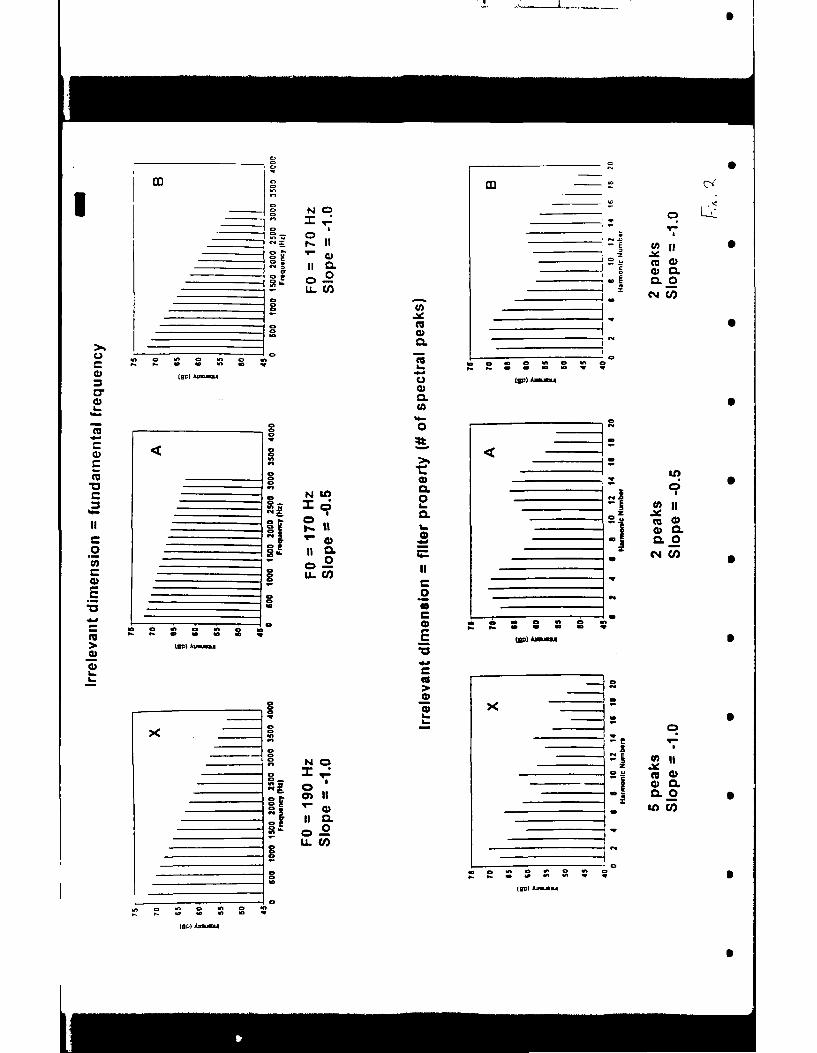
co co
277 0
CL
00
LLCIO
If ) V ,a) C
a CL 0 tCW
(Bif CLW U W)h)
0 03
4) 0.U
gi~CD
N Q.
0 w0. U)
(ff~l A)
IIto Am-L 0 .
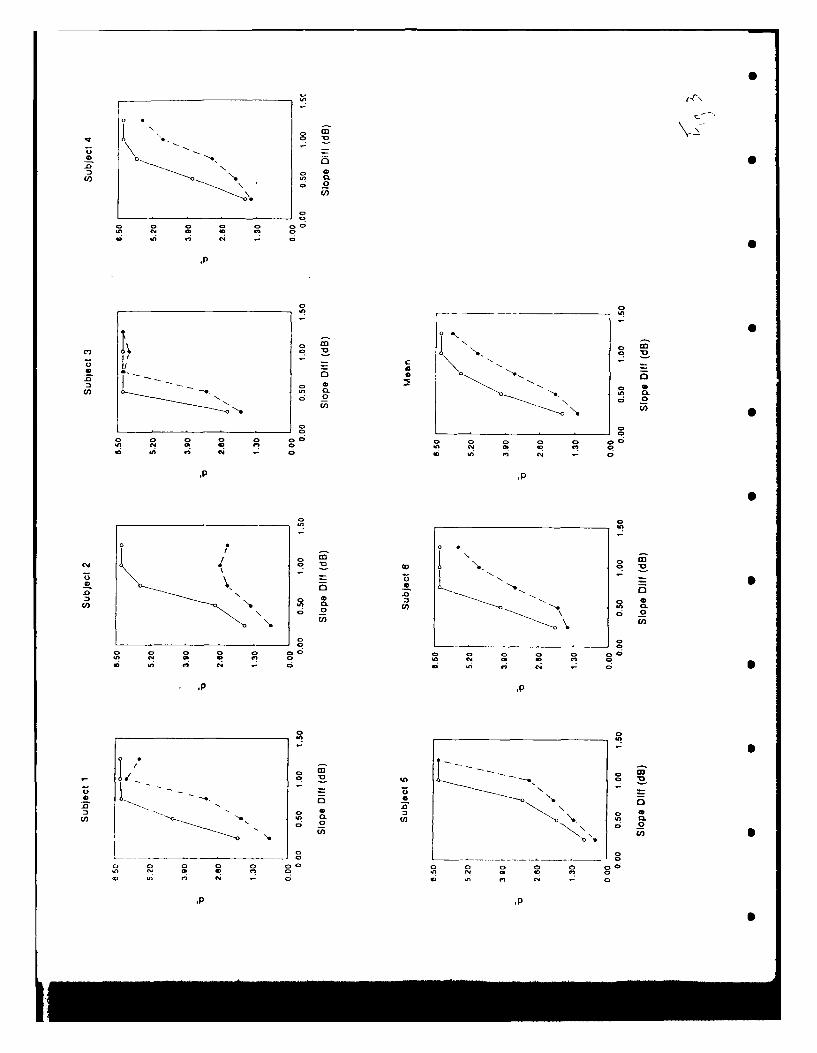
00
C.,)
a n ew 0 i
.P l
0 00
- c N
a 0 a
a 0 0 0 Ci N Ci
w 0 0C
.PC
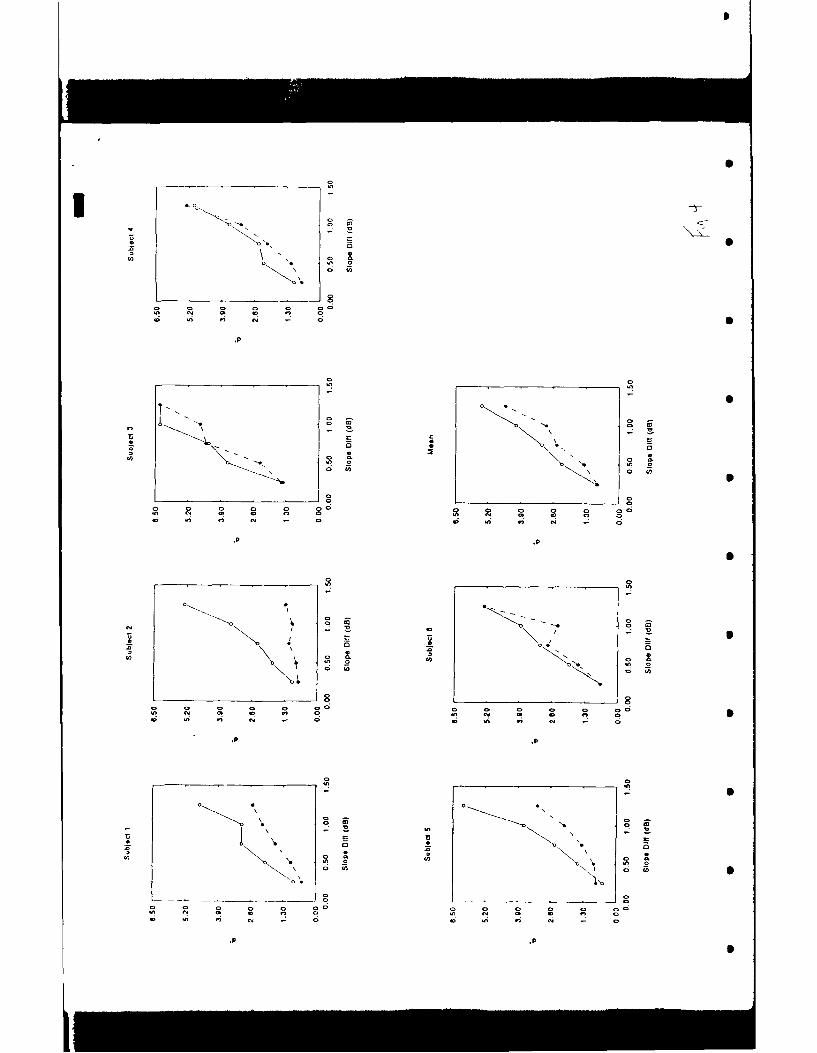
S
*0
t 0
0 - S3 5
C 0 0 0N 0 0
o o 0 0 0 000 N 0 C N oo Cc cc N - 0 5
0 0- 0 o
S0 0 *
0 0�
0- NTi - C N
0 - U.0 - a eS - 2 0w -� o a
0 0 a0 0 0 S
0 S0 00 0
o o 0 oa C c� 00
C 0 N N 0 0 0 0 C - 0
S
0- 0 -�0 0 -. 0 0N C / 5
* U -
.0 3 0S 0 -'02 o a cc o4 0 0 0 0
0 0 0 0
Ag0 0 0 0 0 00 0 0 0 0 0 00 50 N a C N 0 cc o S C N 0C 0 N N 0 a t cc o
S0 0
N. I -� 0�0 C 0 0* t 0
* - - 0Ti I N U
� '4 0 0 0* 5 N
N 0 0 0 0 S-ON.
0 0- - --- -- -�----- 0 - -.------.------- 00 0 0 0 0 00 0 0 0 0 0 000 N a C N 0 Cc N a o cc 0C 0 N N - 0 C 0 N N - 0
.1�
S
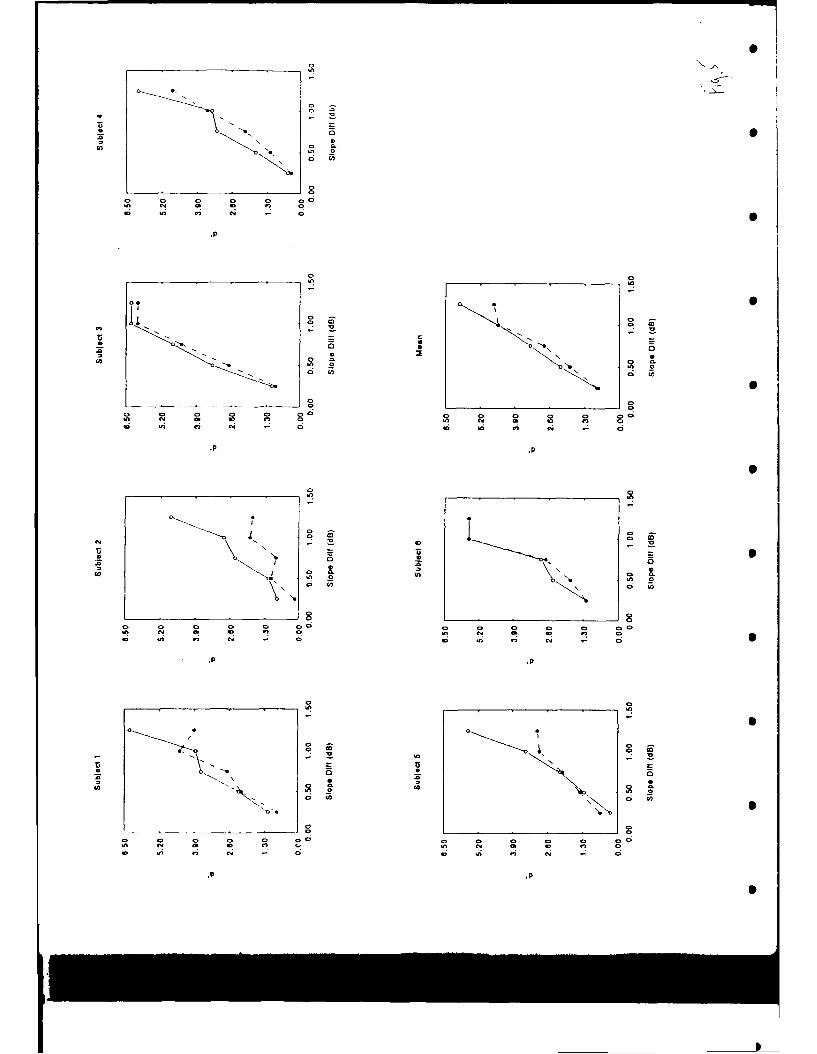
S
o �
0 5N C
U) 0 �U) 0
o U)
_____________________________ So 0 a o 0 00U) N C C C) 0o U) C) N - 0 5
0 0U) U,
0* S0 - 0 -o 0
* 0 o* N 0
U) N
0 U) N o
S0 0
- 0 __________________ 0o o 0 00 a 0 00U) N C C) 0 C) 0C U) C) N - 0 C U) C) N - 0
S
0�� I 0�-0 0 .0 0
N N Co N - - S* �
a /01 01
U) 0 C) .U) 0
0 U) 0W
________________ is ________________ S0 � o 0 0 00 0 a a 0 0 00U) N C C C) 0 U) N C C C) 0
SC U) C) N 0 C U, C) N - 0
0 0*0 U)
So U
/0 -� 0 -* 0 0 0 0
N) -. U)IN N
tU 0 ± 0S S U
0 U)NN 5'U
0 0-- .----- -,.----------------- 0 ____________________ 0
0 0 0 0 0 00 0 a o a 0 00U) N 0 C C) � U) N C C C) 0C U) C) N 0 C U) C) N - 0
S
I
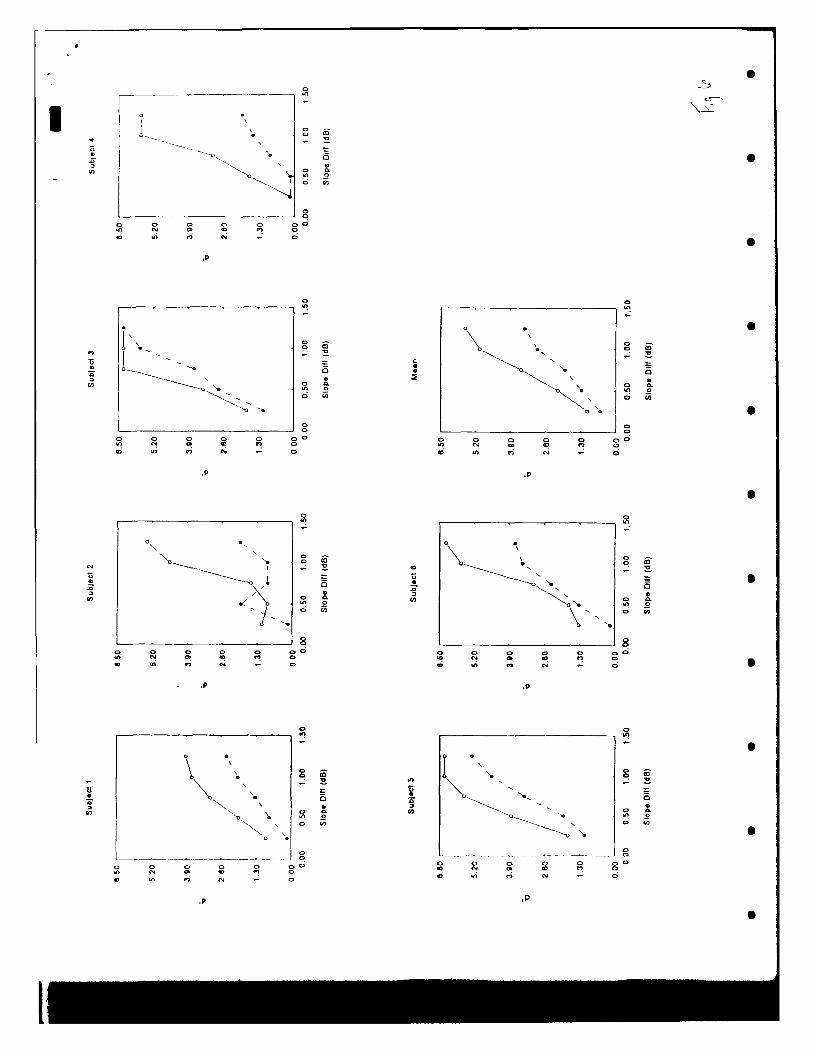
* 00
o0 00
0IN I ý Co0 Le0
a Q c 0
4 0 1!5 4-
00
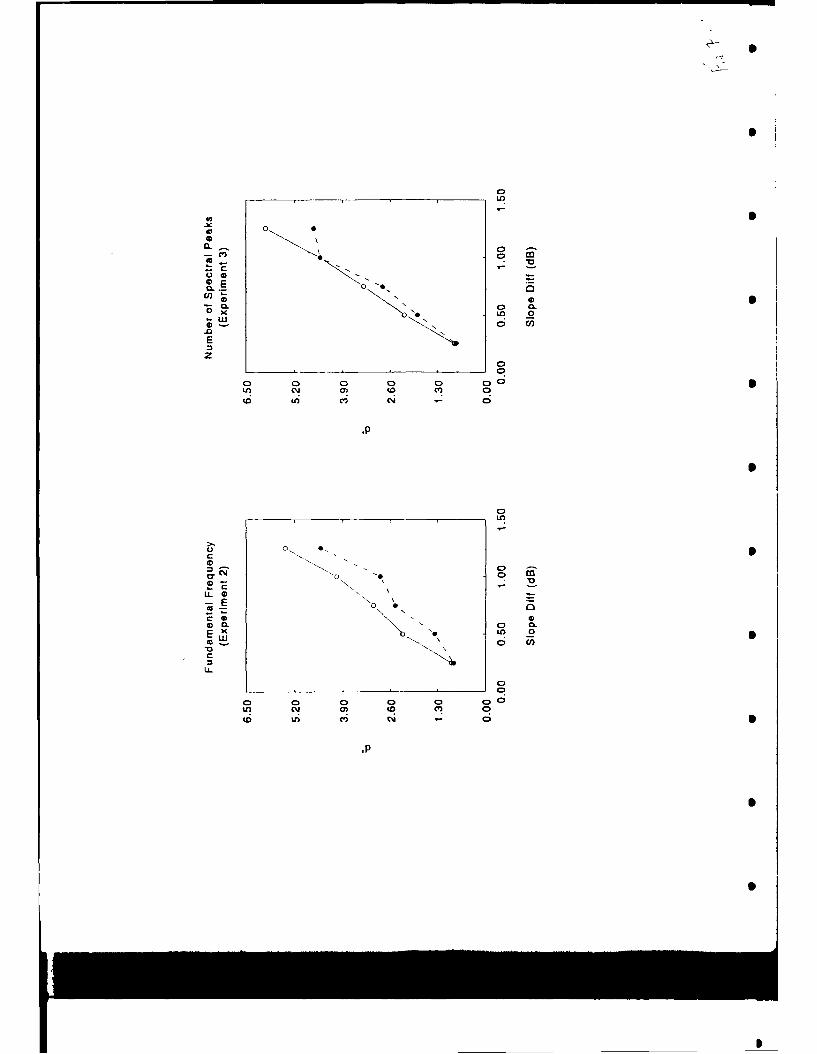
.t: c
0 0
.o o m
0 .P
0r 0
LL 0..
E
M CL c 0 0 00 CLE ) x U) 2cc U)J CN - 0
cS
CD C 0 a a CýVCC! C l ý Ctou0. I
0 -
3 Vs ~~~~~~illun,slsegssss dsscrsstssiatssn oii musical cloivr, P'erceptual inimi~ti ori .511C115
Htabaua 1: Aekes. Ridiard Iv l'astosc. sund Nlisliacl 1) Ilals
Abstract
Receisi speech research (e.g. L~auck-ner-Nlorano & Sussmnan, 1993, Lisvelv, 1993. Ksuhl. 199 1) has denmonstrated that the
presence of prottypes maybhe reflected in the internal structure of speech categories 'Me current study examines the function of
prototypes uit another natural, hut nssnspeech category. Prototype (P) and noflprtosype (\P) set% ol nmajor triad stimuli were conisitructed,
,.ith stimuli us the P set being more representative of the category than the N P stimuli. Nt[usseall~ rypernced Asubjects rated liistaimulimi
each set foir goodne-ss as a major triad, with the higheist rated stimulus serving as a prototype standard for a subsestent discrumnation task-
Results from the discrimination task demonstrated better performsance in the prototype context, Somte contrasting speech results (Kuhil,
199 1) instead found lower discrimtination in a vowel P context compared to a N P context, suggesting that a prototype lnay function as a
perceptual magnet, effectively decreasing perceptual distance, and thus, dtiscrunsahilitý. between stunuli[lie curretm ionspeech results
appear to follow predictions based on classification and perceptual models, and provide a natural. nonispeech contrast to speech lindings.
End oil Abstract
Runninig I lead Chord Disscrssimination
Although it has long been contectured that speech categorization may he based upon the use ol prototypes or exemplars, motst
speech perception research has ficused sin the location of category boundaries, with little attention given lit perceptual changes which.. in
tlscssr. should es,sst within categories that are based upon the use ol prototypes Ibis locus, on categos lxiouiidaries probiablsy is a car-) -over
from the notion~s of categorical perception which pos ited absolute recoding of perception in semris of discrete phlicsmtic categiirles. with any
wtthtn categor'c vai-iation disnrmissed as stimulus artifacts (Studdert-Kennedy, l.ibenrian., Iartris. & Cooper, 1971)) Ill corlixa~st to this long
tradition is lctegrits tde based isi labieling tasks, sonte recent research has begun to examinie the internal struceture of speecs
catergories (Kuhl, 1991. L~auckner-Misrano & Sussinan, 199.3, IA& Pastore, 1992, lAsselx1991. Sasituel. 1982, %')fllts & Miller. 1992)2
fit general. categ~ors membership is found ti lie qualitativel) graded, with KsuhlI (1991) providing csidence tOat qualit) sal sneisnber-slip is
reflected in the discrimnability between stimuli Qualitative grading and patterns oft discrimination silhin :dtepines arc probablsl
indicatiseot genseral catcg-rv structure and should also occur in iionspeeeh categories Rhe currenit iescass~li esaluates quahl ts it categisi)
siiessbesstssp and diserimissabiltit fir a mutsical categssr\. another natural, bet nonsspeecti :ategor\
P'rowt v3)e and Ee~a~sin
Prototype and exreiplar moidels are cur-rently the two torte predonsinrant approaches tos mosdelsing perceptual categsirs/atlort.
each asdlciren1g tie nature 4l catc~gssr nmentbers siniesslat diltteistlN Vrsitot.ýpe theitsr (c g Isissct & Isecic l')isX) a~ttulutes
cate'rgssnltson to tile coniparissin of intcoming stimuli to internal protoitypes sslach are .n soiteIirn sit a' stasges iii ideal arir
represcsstausssns Alulisugh tie exact nature ol a protostype ita\ dtiffer across modtels. there is ssliiii aegrecii cut that esp.. ciices, %kids a
particular cates's cssusribute tom definintg thc: categon' prototype, and that categorilatitsit usualkI is a'ssuisitcloi lie detennritsid tit teriis, sit
thle relAtise niatch (,r perceptual dfistance) between tie Iincoirtng stimulus and dive protisispe Aiss sus~ilart'i loile ptississispe dc,-iea~scs (t
as perceptual distance increases). thle qualNt sit cateirs nmembership decreases, and the psihahlntit sit assi suiset hi tire Vki cac itgiilN
shsuld sleireas Iturtheinnire. as stintul incerease in siminiarit\ to (and thus,. decrease in perceptual distaise tisisit tile ploltstslsc liii otheri
ussue.the jlitssiahliltý M s assiginmnit iw ,lier calgtepis eshsiouldt increase
I s1s1iplar theists( ge Mlesuls & Sclsljles.lq 7X. Nssiss1991)l prtitpi.se that \spFmi cn- as tie it scisessi anidS
sategsiss/atiis in is dcetensissd his tire set sit thc exeimplars elicited i\ thre uncIsiting sImtinuli I wcillixila'- "i V,- .11c ci .ts7's ie cit is
sssstansss sit a stimulus. rather thaii a singple, as eragest ieptre~eitatiost sit expersesised stinitils In iisllsz aitcesiit Iti",i thc.
stiiiU1lsi is assumned tss lise ategiiriecd acsiiiilsig t~i thle dettee (4t sinitlarit% hit)e slicsiresl esenipIirls Ii iis~st , ls11191 iclats1, fis. the Is
A exesisplair his a gis cii categsits. the siteiliusi stimiulus "ill lie assigisd toi that acatosrN cseuinplat sltlsssioud it hi- s 1-ei ic as psed that
categinsiatsiii titdidngs are hetter slecr-ilid hN' exemnplar, rather than proloiivpe insidels. most such researshi a lississ s-uwtit hilstd, sifteni
arlsticialls-delines categmires Ii & Pastore (11992) nite that differentiating heiseeti exemplar aiid pisitisispc sisskds for, stainsI sategusries
(c g stssp snstastlcaii lie vetsN difficult (also, see N-iolslss. Palnter., & MckmileN. 1991) lurthIernisicun 1, lirik Iills e acsscl tego"ri's
isuich as pttcs categusrtes tsr miusicians). assumning the stiirage isl menisiris tif all specilis istislausse appear-s Iss sequsite ;iii usst--asislc
isesosirs lisad and lerisgli scaruhs lirousssesý and is tlserelsir. sdilticult it) nmodel
h ite ieasiiiialilc .ifiltisil is cisest xetiipiIa ssitslins, absuit natuisI iii Iiglil Ican-es -.is.sc ,iildl lst. 1-s1 is, s,1it,
it i~i l elii cit, the pysshswhillitsist u i i \istlis s~ijlu It is ls,'us at Is. 111.iiuiu lis ,-I>.. isul
I It II, ,ss i- shi tst It , sIsII I. I1 tI5
sI IpIs- I stis d e .ijT t-I. I .tsIs I., i.
I Iss Ii visst . 5.'
Ch'ford Discrijitijiatioti 2
esaluatirii stlitiuli I'N sanilplill, tint a 1-1 ot stored exeittplai-s rather than bN cottipartsinti liiI proltiINpe
Sey era I ;tediclioit edo bie niade Ili regard to die pattern ol discrimtinatiot stn s a caiegor\ sttro ijid ar outnd a ptitotolfie
:,wed in tetns of the auditot' trceptitit model proposed bN Itraida. lint. lk'hrlitr. Di rlach. kahimttostt, & Park Is' V198) a protots pe
shottid functiont as alt tItterior anchtor Di ser:Tmittratton should be enithanced Ifor a prototype set ofl stintiuli (stat tuft neat a prototype) Ini
conttrast, a noniprototýpi, (NP) set should consist of' stimaul which, while from the samte natural category, are distant front die gisen
category prototype (and any alternative category prototypes) and axe poor examnples olfthe category. these %tittvuht should hale beent
experienced less frequend... and thus should have a sparse distribution of suinlar exemiplars which are inot comminon (tprescntatives. of the
category I'tteref ore, there is ito reasont to poit the formtatioun of anchors in a NP context Vlrus. i atteltors pros ide a basis lt
discTrirnuatton. the absence of an anchor tn a NP context should result in poor discrimination betvseert stintufi in a NIP wcatgril
Followinmg another line of reasoning. If- discrimination is modeled on the basis of perceptual distance front a standard (e.g a
prototype or anchor) and obeys, any sort of approximation to Weber's law, stimuli dtfliering b) a constant amount (A d) frontt each other
should he niot- discirintinafife d they, are similar to and thus, a small distance from the prototype (e.g with a constWan Ad, discrtittinatioii
should be An utverse function of d, the distance from the prototype). litus. stimuli around a prototype again siould be piedicted to be more
disc-nminable than thse sanripled at somei disance from a prototype.
Ithe proto"typ (P') and ntinprototvpe (NP) sets of stimuli in the current istudsN are cotistrueted withl a nuntbet of coittinot slinitult
"hiich can be used to evaluate differences- in the scale of goodness ratings for the P and NP sets tl slitiuita (Sec thle circles in Fig I Itor
exattiples ol colattioin stinitil ) Sonic genteral ideas from the Mlacmilflan, Iraida, & (ioldberg (I1987) model (it audittirv perceptiotn, basýed
upon trace and context lodfing concepts, would predict conitext differences in the goodness ratings of stunruli esannion to the I'atid NI' sts
thoodness ratings should be based upon comparisons mnaide with respect to the entire range of stituliu used titt the experittlent. Furtltertitore,
stitnoltinu a P context priibablv should reflect cotnsiderable prior knowledge and learning because they Include esrimiion., lreiueiitly
exeine.representatives till tie category. Ilii contrast, stimuli from a NP context would not reflect prior kitossledge and leanhiiig. a, dieN
are poor repirestitattee of a category and are not oftlen en~ounlereti Iliese expercittdial dfiferences should bie ret)lected Ili difletciii ratitig
tot ais titinuhli slti ate cotuinion ito both the P' and Nil contittxts
It isknosvi that ratiitgs.can lieallected by die range and distributiiit of stiiuliu (Pardueci & Keret.19711 AItlioughltlelIst.
sets1 MIl.xi ittili tilie cuarreint studx are equal in dlie siteitf phyvsic I ratnge, the distribut ott of pecfeiikd qualits refaitis to a ptiltoitpc
aticrt Qlild lit be equal Iftese dillerettees in 4uialttative distributions should result in the ditferential usec ot rtaingz scales aiirid~itti to
thv s''utlem hsich i, being tidgeif reflected Ili the diffeireiit ratitvigsif slimuli citnittion tol the I'anid Nil cottiests Iliaiot ular. a stitiulus
t'ied Iat,iloet\ ''"is i a I'cits hould be rated higher if piesetited in a NI' oittext. %%here it is cdtefas.k lsilc'i thali Owicothiet lieiiif'cis of
ie \ I' stittilusw 't lii sititiriar predictiriii% for gtoudnc'ss rat itgs titt a catecgor,, anti. ittle ditIlerentt r atutip a..ordii ig to eoriii tex. And
st's ral tfo1stticatioin nmodels predict tncreaseld discrimitinatioit Ili a ptrotoitype contettt
1,ti'.idcring teepredict ioi:. results frotm recettl spteeefi tscArelt (Kohl. 191)') l are osl,hitssfat itii\fsetecf ItI exati'initt ihit
intlteatl struictlire of A vowel categ.'r,, lit sititult consisting ol a coutittiuutt oft I olels dryng tugin 1-2 anid I I. IsaIlfI 9') I1 deinitt,iisttid a
Itet.eptiial iitFictn effect Kufil costrutocted tsso diflereiti sets of .I stuttufi. vsilt tile set of Stiiiiuli Iite f1C I') '111\jIet lciit [11,11C
1tpr-fit.'itjl "!i Ole I categ~ri thanl thle set ot sltithil In die (NV') cotlitexl Salijects rated tile Iiu l i -1 1.,t 111iC\1 1,i g'.di.sA, at.
%-lee. in.. Iditiw a sampling ilf stintuli cimmnin to boithi types of contexts Iflie theoretical Ptototls.'. lt,-sd ulsiti Iritol recaicli~ f 'eterstit
flinie f''j5as tfte highest rated stititilus across bothi die I' atid NP contests. atid &%a used As 1he stUtdardl loti a uit-qsoiiet
ssiii -ti' tIII iii a cont'tp. text [lte diserrittttattoi statidaurf for tile N P l'emttv k&as a 'Is, tied stlillutiti I h)11111111,11.t1 1'i
l1" ie, giseri context ssýs tmeasuired as a bundtiit of distanxceII fitetCeptui~l s11Aic. tdetiiie 111 11111 WWII t1,im ftc s1tiild.-Ii
"'I"Al distitite Ini tel tutu,. ilissct itoiritio't sa, fiend i'ft- fic e lil do ile titittittic elitisc t'' the noutin'ioi'ts iesiniiitfiits
"-t 'mie.iiitieefu teletitIng reduwcd diserttiniatili't Ili tile iellitt of tle. pitispo. Istfi tall Iic tt's' .i~iiit: is l a "~io'I ftIMf'tit~l
lierti-t d distlan~c l o'i te',lfsritigsinutitt
liii at ru t.itee..rte olitiltt tdels (Ifraida et al .1994, l'ardticct & f~erre. 19711 ir isý\cliiplissittl fiss (c ig\ Jw cli km, l Is stiiiiiitll et
af.'1-c is A tesil. several attemptis have beien mtade 10 replicat thle plerceptual tmagntet effect lot situels I ii els19)1); foundt if ta
sftie'. rawtv i (liittered across bo~th subijects atid contest Addititnittaf Ilit etnimtast tto a Timagitet effei. icls fouind slightils ficigliteitel
fis rt itimtat witi a r, mtitt ant "as terage" prototyvpe stanidard Whnidsdaprtitpssree sasattr.dstitiitiiisssiji
.. tttsI uiiickte-mklotanui & Sussnati 1f991 ;partially replicated the Isiklf stu~ify. I~, .1u..ti.'tedf lalssf tile 1-1stilis Ia sitial
AI 'oAt .If Ito''tl It'denttIIifiat["uti tas'k Ir's ktet ited ine estdettc dt tal~ l' Istfls oloo~ý ttiipitit j Il sItitif k.oU ll 11ise irsaf 1 s11, t'.d cefitita
III- IIoaI I n do to ill! II-."It llii I ofwl Iit t, I I, I. , itI I, I
Il II-cd ",otI , "" oo Iw, 11 11I' I 1, , II 1 , ,1,,"1 1 AI" I w
Chtiiid IDiscrimuinmt.iii 3
tioiie1 speech. ItIw resltii dtAire unireiit studs- Ileierlr ate iislvilaii In, e~l..Iain tie general ril i .It aego"irei foi r l. 4. iiit~i
"eIiecor-l arid ,,ii1 Ientg as onparisoi for die speech 'oorf
C ,eiieal ktlel-ir
Alassiiiipiion ofi priitiiype (and evemrplai) dicory is dial C545!tietice is iieeded Icr die loniiatieii of goiod cattegiit3
represeiitaiiiin (or a reasonable pool ofexeenplaes). Iflknossleige ofla particular category tis mnaijoal, experience with die category) is
probably insufficient to bave aormed a prototype. Th1erefore, we used 5 musically trained subjects who badul a mininiumn of I1l yeaersol
experience, with 2 su~bjects basing college-level training Subjects were paid S5rhour ber their participatian
Because the ennecepts of prototypes aid exemplars anticipate individual diflleenees, our musical ratIiig task, riiaiiitaied a within
subjects design, with each subject providing separate ratings for P and NP sets of stanut (hxpertnieni 1), and then performting a
discrimination task (Experiment 2). By using; a within suabjects design, the current study avoids potential individual ditkIrmene prsiblems
preserl nt tabetwveen subjecs design, previously used in some speech reseatrch (Kohlt, 199 1) For eauniple, if ratings were averaged acros
subijects tii a rating tas to determine a protoype standard, the aseraged prototype standard tony iiot ho representative oldihe prototype ol
ain individual subject, and the subsequent discriminatioin results may ttot accurately reflect die Individual's category structure relative to this
protoltvp In contrast, the use of individual prototype standards liii a discxruntnatton task should mocre aceural -ly reflect indisidual
categors stesietil.
Iwo sets of stimuli were rotttructmeld by generating individual sine tones (12 Fa,~ II] k~lo sample rate) and digitally misingdiem
to form indtms- based on a root position C major triad (see Figure I ), The initial (dieoretical) prototype stimulus was% a perfectly tuned C
major triad (C - 262 l1e, E = 3301 (3, 392 Wt.). The odier stintui were generated by% holding the C cotlistant and varying the b and GI
frequenciesý in biidi sharp aid flat directions in 2 111 inCreanentMIS, For Ii of die 30 stimuli, only dire 1. frequemncy var-ied, fot xiother 8I stimuli,
osls die Gl firequency varied positive ad negative diagonals were created by varying the EK anid I.; frequeticies sisiultameously with equal
steps in either the same (hoth flat or sharp) or opposite (oew flat, the other shiarp)( directions "Itaus, the prototype sitiniul ranged firont 322
IlI to 338 Ilie for the F aaid 384 lIe to 401 lIe for theGC Noniproýtotypestimuli. ssii~cb ,i-eccetedi~nasoia nf.iami-, wer based oii a
misýtuneilt majortriad(C-262 IL 1>338 Iiz,( (384 l1z)and rangedlrant 330]lIeto 34b6IL't,)r diel.,ad 376 ii/to 3921l1z.lie die
Gi I singdihss procedures, 30 stimuli differring in equal steps were created lot die prot'rispe and die initpratotypxelsae, as surniniart,'ed an
Figure] tfthe 311stiniai in eacb set, 7 occurred in both setsi(seecircles in Fig I) Hie sattipiig ofstimuli, genetally followed diat used
h, Isuild (199') Ij fo speech stimuli.
Itecause of die limnted firequenicy range, equal eban~ges, in Irequency priisuled a close- appreoxi'3'oi~iit) eqaal nmoig-s in
psvclv'pltssical distance. Tlherefore. the rents scale was not needed to equate: perceptual distance. All stintuli were I00 in s iii duration,
-iee 1,-s-p-,~ Filtered at 4811/,' and presented over 1I D1149 earphones at 78 dll(A lI Ii ciinitttecial sound cliatitbers
tisser figure II-
-spernictiet I
Ie gVIoal itlpEr~i-tent I was tol use gooidntess ratiings tii evaluate qaiiiegriiligii uialctgr In additin-iaL.it
toiltduals inghest rated stimulus was used tii ientiktyhdiir priitiitvpeinai nasl~qeidsntiaiots ~pnet2
Siiliiess %eire intisrscted ito rate [lie gisvhtesv ci eacthi si ittilus a= tilrsirilox,io s ifc I I- Il- Ill 75 )to e grlo)Raiting' iiee iiidicaiedlo - ttiin presses 'ii a telephonie keypad atid tr colle'I'dI" liipu' -nlnhr,11(Vsi'It
raii' subj-ts listeiied tii die 3ii stuoil, friiii a given ciintext iince tit rmIdoliri er w'lc siili'ii tessnidiiig All sIIIIIUil lhen ucre presetied
Iibre iii're tIie l privide pract -cc sitig the scale DIat final Is we, ccillecied titil 2ii aidriiod re 0iii'ise lIe sittilu~s t IlIe,
'seiii leu ua reeaed ii th itbe cnttstis ouxstic~r icierhbalmitcd a-i,ssulbieci,
I iiioness r-atings liir the musical ta~sk (a) declined systerntaally1 11,11i die iiidii. idualls lelinel (i e highest rateditrittulusi
peiixisji mid Ilb) Improved when moving from the nonriitoltvpe ocentr sintilss tossard [lie preotlIpe Ilir F atid NI' contests respectively.5
IHu4,16 Ij 3X ~. p -)000 1. F( 4,16) 49 72. p 11(101. see Figure 2. pattels A\ id lij ýAs I atile I sQos die highest rated stimulus
sarued a,~-r's subjects, hut alwsays occurrfed wide~n I or 2 ctyv block steps 12 or 4 11,1 i-uti fie perlecil, tond triad Ratings Ietweemi the
niiilitiul and tlteIrettea pr..utuutvpe are significantly di.t1ren I[-(1.4) 22 17. 1' O lul I ue ahusenteof prlecti tunuuug in eat-l indivýidual's
I,,-i-i 4.4%i i-is" ..... supteiel spri-ng, as ses-era stitiie last sh-,oi II-it iue',.liiaii .i, 'le .Iii 1 essd I kulco-ki. 1'97i,l
,-,1 ,I I oiir~ii 1991 F Word. l9s.1t Npeecl d reciIiIs.'ll, oh.' i -iila ri . rie o. 'ilei
I 'I II 111' 111 l Il' lotllcA,,- -,o I , '01" -', ,,[ 11ý 1 1 S
1"%i II-1 li, "I hatI'l 1-' I,. ....I II, l o~l I I1 `1- Ol II 1'." 1 p
(Churd thsrriniiiiitiiii 40
alo. izilcail driferent itens cortitxt IF( 1,4) 33 OX. p 0051. but overall, r [ei-s .loe ratings, luau. fie tlie,rit-i~ piriotvpe,
Heen cci pech rermre li ey 1993) alsi founl that ,-csl goienless rutinigs atsh.red stirrali ditlered acrirs esslIts
Insert lIlible I here
Itecatise subjects differred in the average and range of rating emnployed in tire P and NP conitexuts (reflecting dufleresice, ini tie use
of the scale), it wa~s difficult to legitimately either pool results arosiss subjects orto comapare resuilts across ccarditions (P or NP contexts). is
order ti bonterequate the ratings across subjects, individual ratings fix the P contest were normalized to yield a orean rutrirg of3 5 (ceniter
of rating range) and a standard deviation of 1.8 (selected to keep all ratings between 1 and 7). Thes nornmalizead data then were averaged
to yield the rating results shown in Figure 2. Thie individual data for thme NP ceinteru also wer normiahteed forunsmeani of2.03, thus
matching the rating of the theoretical prototype across the two cotntexts) and a stndards c viation ol i.d5
(ithe original SDi average across
all subjects in the NP contest). %k bile the noetnalroed results do not accurately rellect iobtained rating diflcinece between the theotretical
prototype and urraproitotype standards, they do reflect the relative rating tenidenicies both within and across contex's, with stimuli in the NP
contest being rated much lower than those in the P contest.
Inser Figure 2
Summary Individual diflierences in optimum stimulus ratings wore expected and can prohbalk be attributed to espe. ~aialfactors, such a~s differencs in the major instrument of study for the 5 subjects& In addition, most individual prototypses -cer slightly flat
ernpared to sthe theoretical prototype, This slightly flat mistuning is consistent withi the tradition of equal toanpermnent. uhich slightlr
comnpresses niajiir thirds and slightly stretches major [atits. Rating diflbrene-es for coimace tinrulim across contests, are coiisisteiit sitth
predictions ba~sed on the range and qualitatise distribution of'stimuli
Experimrent 2
FExperiment I denionstrated that musical categories are clearly qualitatively graded, with one stimulus always receiving a
distioctisels hrgher rating than the othr category members. (Thie specific, stinmulus optimum stimulus ria% va- b% unLitsdual
l-ruriheirrv 'no. the gordires ratings of st,,, i decrease in arelatively systematic fashion as a lunct'ion of distance from the Prototype Ii can
l-ie nerredl Irons these findri,,. stsat musical vasegones may be structured arouind prototypes or frequent es plars (i e, tIre higheri rate
stimnulusi Pierelore, a dfiss-rrmrratron task similar toi thatu used ini several speech studies) Kuohl, 199 1, 1 ivel. 1993) should lie able to
ellectivel evaluate fire lunetriw of a prontotvpe in this natural, notirspeech category Classification models (lhraida et a] , 1984) arid We lier's
lass predict that discrimination should Ire higher in a protiotype contest than in a nonprototype cointext
liesarise thre musicali rating task resealed individual dillerencos, we uv-d a wrthii-saltjects design tior a disernuiiiitiiiti task. s-1t1
vysing a o dir subjrects design comnes born I idyl (I993). where thre pattern of discrimiritior dhillred si~ghill\. depending on 1,Iither an
'ra ged protonspe or the rsdivrduafIs prisrorspe si-as used us a standard Sine, Ior nmostit oour subjects, the prrrtotpcn. is asivifur I city
bled, stp (2 Ie/) asia frim thre pelcilvl tuned tinad (which u-as--the center of the P stimrulus set), the nonproiutotpe siardard was selected
is, Ie one step Ior tire airersiot the NP stimulusw setInlrkethe pruttotype sanilaridardthen nirirolotype 1tandard haso rrspecial spigrirmav
othier thin re~trcserin a critrol cinditiroe, sir there was sinol is'd m,rslitx tre selected vtanidard for andi idual subject I hrlorrre. a single
tr'ij'i'ii - irulid sacuses lo Irsalsriet
lk c.i.. - Ksuhtl (1991) swanstedh to use a single procedurte lirr humtan inflants arid adults,. as wel ..s .rirrkey, sh, used a f;- r
I-dnic I�sss, Iis,, pros-edirrei highll sirtrv irsrepnirs bias A gui.ri-gm tas is essentially\ eqirisabut to ai WXl t,,C ard au
rercni shrsoI \ME diw-niririair vI sinirlr drawni frun a *orntrrrurtr beissenn riatrr arid its related rrrrr,r inksI (I Irsird. kr,sei,&
flot oa"ýr'sistuluis (2X repetitiriris lit each s~irrrrslus s-s 2 is fire (sub) (1991) discrinrination task) a d istich is bras-tree
Subj~ects heard twrr pairs oftriraus per trial, consistinig of a samirr and a differenit pair, Ii each parr. the standlard atssss- a
presened first In sa.mie pairs the statidard (P sir NI) wi~ss repeated [estrn tirlsi ~edltei ars-srnriiyslce
Itomtre 2) 'fier toads TIhe orderingit~tpairs ithin atrialwuasraridriniced Sbet niae ihaturripeswihtatcriaie
tne drileriteni c Irruk lireperimerit was rust iii t~witsesonss itti each sessirti csr rg both tireI'aid NI' rotesis SeIlecir'o nitial
-n1-1' rNI)isa o,-rmterhAanrced act,'s sybjects,, and the conrtext irittally prvestedrie ii,, tfeirsi mesri sia eeiedls iiii
,,tr . i.r..s..c.rsir~ etc-h triad a rotiI 20 rire
hr-i. rrii ii.Si i I. s '--i, rreis risli~i isiiiI isue I\' irrirrrII~niii),sri',,rI'-n-- hnns) s- 1ir ,vi-c,"s
(1hnrd lliscriulminatioli 5
3~ ~ ~ ~Il s triat 1red. Ssiipioiiic orprgt erpretperlir-inance (tit a ditfereiteeul tocit'c Irick steps (4 Ili change) hiorn the
stuidard lIn faci. oiiesuliject demontstrated virlualy per-fre~tdiscrimination ii dine P. hbui not NI'contest All of file,,- findings areconrlisitei
mctlr tile predictirirs froin categor-icaiion and percepitual models.
Insert Figure 3 liere
General Discussiolit
[lie current stud) investigated aspects of'perceptioit for stimuli varying systeiriaticals tin die liequenco ofvtiO steady-state
conmponents. Goodness ratiiigs revealed that tile theoretical musical prototype (the perf-ectly tuned triad) %sas never rated tile highest lin die
P contest and that the optintumn stimulus varied across aubjecta. but that all stimuli common to both set (P And NP) were rated higher in
die NP context As, discussed in the jntrcduxtioi., context eflects such asithese art consistent with at least two simiilar concepts. Pies-i
ratings have bieen shown to he afl'ected by the range aniddisti-ibution ofsttinui While die music stimuli contexts (P or NP) wer-e of equal
physical range, qualitative perceptual range was not equal. Therefore, differfent ratings for the same stimiuli enihedded in different coiltevs
awe expected Similarly. different ratiags for coemnon stimuli across different comtexts (P or NP) are consistent with context coding
coiicepts, whfere comparisons of stimuli are made with respect to the entire range of stimuli used in dhe ep~eriment, and thuos shiould hie a
fuinction of'stimulus set
Discrininnation for equal distances firom a standard in a musical category was butter- in a prototype context than lin a
nontprototvple context While in contrast to predictions based on a perceptual magnet, these discrimination finditigs froin a natural category
are consistent with typical psychophysical laws and confirm dicrmnaton is probably achieved with dile use of some font of anchors or
rekrence points (Braida et al., 19X14. Macmillan. Ifraida, & Goldberg. 19817).
(tntirinson toý Recent Speech Studies
Recent speech research investigating qualitative grading ina vowel category (Kohl, 1993. Lively. 1993) has showvn ratings of Soptimum stimuli to differ across individuals. Ibe current findings for a musical category, alonig with these recent speech results, indicate
that somne individual differences are probiablty typical of most general perceptual procese,ý and future research should insestigate die smnall
discrepancies betrs,nc truve individual prototspes and dicoretical prototypes.
liwvel (1993) firund ginidness ratings% ol'vowel stimuli common to both correxts (P anod NP) to he all rated highier in dile NI'
contest than the P context In econtrast, thre original vowel rating study (Kuthl, 199 1) did not demonstrate clear ratiing differences across
contests. and the same stimulus received the hiighrest rating in both contexts. Variable ratiligs acrosscontexts are erirsisterit ssili predictiotiisS
based oit the range and quialitative disitrilulion of stimuli, while consistent ratings across contestus are not
lThe drtfrences across the speech an,,' ntirspeech studies found in the goodness rating,% niay he a finictioin of sntimulus selectioin
Wh itle hie present situds' showss a consistent petter-nt of ratings for stimuli common to boti sets, it cairnot direclk esaluate die stability o1
ratinigs ir tire stiniuli sliicln sered as die actual prototype, stimulus irethe vaivius suliJectre Iue it) tfile corrsiructrori ofthde pnrrtot-pe
sirinaulusset brased upoln lie individual prototyl-es. which were tiever the theoretical prnitot)-pe. the actual Individual prototvpe was never
preentiiidi NI cnintstIt each individual's proz tvtyp had beeni pre-sent in the NI' curnlesýt. it is possible that tlus stimu~lusin miold rose
functioned asa pcrteptual aitclhnr thtus reins Ing range efles
lDnscrninialnion results fronti the currenut study differ friim die surrunarized speer findidngs Ikulil 11991)flundruidbter-
discrntinatnon in a NP contcxi thani a P conilievt and interpreted these- results ascdeinsinstratinigreduced per-f irnance iii the P conneies. ssitli
flie lrIo~irtpe escenulig a Intiaget effect on surrounding stinrul. aopiedtinhcdprlnrrIcin a NI'coinlts WhIftle die Iulul
uiLWIJi-oni is ItIi rf.r1inssteii 1situ eitheria \k slir- fiuntiotrn iir anrchoir and reference polint ntnitrns it scornsi, Iriet h-ied apri th), logical
assinripirrii lvii. other- laotirrs. bein quarl. perhirnniance dilferenices should bie attributed iii tile actioii of j prototype. rallier tmitr .iniic
u~lnoisni ta~ciri eihrmlvrrcr pcrlrnirain~c in the NP cointext Ihis logical reasoning leads 11r tile crrnJeClieId 'I-'CePiuIi nirAgiret' iet~neplor
Ili air Alieinripedl reph~lcot Viii ely ( 199)1 foud slightly. better discriminiatiomn in a P eroilests kith the prrtri,,isr la~iidiird dMilied try Kohul.
and ri eir rirdi lit,; N\rr e \%etre used asý a i:ndard, duscriirniiatiinn Was virtually equal oars, ciuiitcrt eriflirri discrnrrnaniri- r results
are -1oi1snstIntsrh rlossnticationi aiid perceptual innidels. which preict heightened discriiminationn in a 1' eririext. a forunid III tile current
X h% d6r thre iriisic results differ fro-ri ire original speech. es-ults in tenivs oI a perceptaal inatiet cliec hrit thc protIrirsx tone
I.-hsnrlt Is that nrusns air speech categoricaotint processes are qualitatively ditferemt Alte'tralivel\y it inis lie pIssile that Ksuhl 11991)rod acttnall\ found enhfaniced dnscrinoitiiionii n a NP cointext, nut red~ced diseruirunatnon inl a V' critest Aroted alss e I aircknei-toratu,
& Siissiio 191 wirries a lalnelirirt task to dernrrnstrate that IKuhl'sianginal speech niinprootyi~pe eoritiesi Iia\ros~ Iosriiloried Iisr
stirs It li ln,.i1r , ,is .ini accrte ass~esinter ni tne oiriginial NP cnerrrts srrsel strrnralv then IsNh sll111 O itrri hrdirig' iris nil Ihe
4~ .r 1c ,1 1r rirrici ec I In railr,r of irrliiih rlames discrIIjiniiotvnrI IrI tire frrirrrivctnetiliehrIiiricis
h-I., "ICA re., 1, is ý -,1*I .It .....~ ... Ii ... tlairlrir.l ~r,hdii ,jr-,tad, I..... t--j-r~l
('herd Discrimnijationi 6
References
ItraidaJA), lurlach, N I., Linm. J.S ,Ilerliner. J F. Rahitirrsiti. WA'.N1. & Ptirik, S.R. (1984) Intensity Perception. X111 Percepitialanchor model of context coding Journal 0] the Acoustical Societly ojArnenca. 76. 722-731
Humns, F.M.. & Ward, W.I. (N797). Categorical Perception - phenomenon or epiphenomeneon. Evidence from experiments tin the perception
of-melodic musical intervals. Journal of the Acoustical Society ofAinerica. 63. 456-468.
(kneser, D.1- & Kuhl, P.K. (1989). Categorization of speech by infants: Support for speech-sound prototypes. Developmental
Psychology. 25. 577-58&
Hall, M.D. & Pastore. R-E. (1992). Musical duplex perception: Perception of figurally good chords with subliminal
distinguishing tones. Journal of r'Lperimental Psychology: Human Perception and Performance, 18l, 752-762. 0
IlartnsannrA'.M (1993). On the origiti of tle enlarged melodic ct,-ave. Journal of the Acoustical Society ofArnerica, 93, 3400-3409.
Kuhl, P.K. (1991)- Human adults and human infants show a "perceptual nmagnet ekt" for the prototype of speech categories, monkeysdo not. Perception and Psyc hop hi-sics. 50. 93-107.
D~avis, K. & Kohl, P. (1993, May). Acoustic correlates of phonetic prototypes Velar siops. Poster presentted at the 125th meeting of the
Acoustical Society of America. Ottawa, Canada.
Lauckner-Morano, V., & Sussmnan, JEh. (1993, May). Identification and change/no-change disrim~uination of/i/ stimuli. Furthertests of the "magnet" effect Paper presentod at the 125th meeting ofSthe Acoustical Society of America Ottawa, Canada
Li, X & Pastore, R E. (1992). Evaluation of prototý-pes in perceptual space for a place contrast, lIt M.Ell. Schoutent (1d.) 7he
Auditory Processing ofSpeech. New, York: de (royter. 303-308
lively. S.E.(1993. Mav). An examination of the perceptual magntet effect. Paper presented at the 125th meeting of the Acoustical
Society of America. Ottawa. Caniada
lArcke. S,-& Kellar, L.(1973) Categorical prceptionit iiaotoitliitguisttcn mode Cortex. 9.355-369
Miacntillan. N A.. lraida. l.D -Godldberg. K (1987). Central and peripheral processing in the perception of- speech and nonspeeclisounds. In M FIf.11 Schouten (Ed). 7he l'svchophi-sics a] Speech Perceptron. IDordeeht, The Netherlands: MartinusNtjhofl Publishers.
kfedrn, l) . & Schallerr, M.M. (197X). Contest theori, ofeclassificationt learning. P5,rchological Review, 97, 225-252.
Nosofskv. K~M (1991) tests of an exemplar model for relating perceptual classification and recognition memory JournuicgLxperimental Psi'cholopt' I/swai~nl'erceptron and Performalnce. 17. 3-27.
Nosofskv. R.M . Palteneril P,.McKminey. (1993. Noeinber) Rule-Pl us-ELxcept ion model of classilicat ion learninug. Paperpresented at the 34th meeting of tlt. l'sycfnournuic Society, Washington D)C.
l'arducci, .. & Perret. I.ý F (197 1) Categors rating scales I-i Mets of relatisle spacing and frequency. Journal ofjLxperinuernalPl'cholo~v A lonoyiraphs. 89. 427-4s2.
llist.ore. Rt I . Schniuckler. MI A. R~osetilunim I .&S/c/c-.iril k (19X3) Duiplex perception with musical stiniuli l'ercept"'rr
aind llic hirphjtr ti. 33, 469-474
Ilcter-riir 6 1 . & Itarnet. If IL ) I ')2 C nrol,, neth-I us red tii a stud\ tit the toi let Jouirnarl oj the Acrrir4uticaltSiucfeti u/ .24. 17s-184
Iur-ner, \ I ,& keele.S %k (196X8) On the ceiesisoru abstract ideas, Jourrncrl at l..'.pertnrentrr) 'syvchologj. 773 53-303
Hakrrwlki. A (1 97
6) 'tuningort isolatedmuntiical interas a. Joutrnailof iheA.4LrrsSIrclC Secretli ofAmericri. 59,S55tJ(A)
Santuel.Ai ( )1992) l'hiwetic prrrtot,,pe I'r'rýep~trrrn ndlu'rlýhoph~srcr. 31,3(17-314
Jiga. A . & Siegal, W (19'77) Categrrrical percep~t ol ,r tonal ittersals fusicians can't tell sharp front flat l'erreptrrruuard
Pitrhuiphu srrs, 2 1. (199407
xuoidrrrretkururx.S .ibcrn".i iii N (I.Ifr, . 197o) \frt~rrtfurrsnI of Neech iperceplionu .5repklx to
xhiit,il tenice P-rh'.,,r.'.r 14 V)t
\11.I r<Sllc, I I iP-2 , 0 1 . ,,,?1x ut~rnr 'A" * .iflvnrl.ut 11nut pe, , .ikinr m, n t h mtii tirelll.................h,, 92 V
0
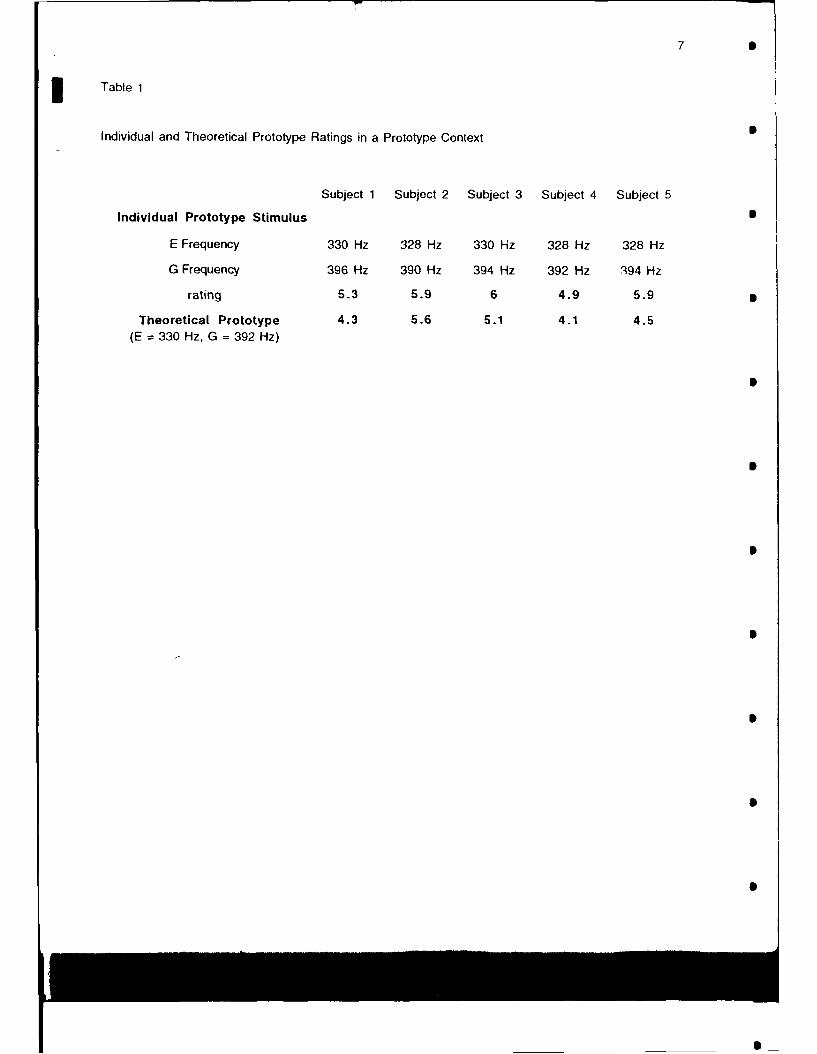
7 S
Table 1
Individual and Theoretical Prototype Ratings in a Prototype Context •
Subject 1 Subject 2 Subject 3 Subject 4 Subject 5
Individual Prototype Stimulus 5
E Frequency 330 Hz 328 Hz 330 Hz 328 Hz 328 Hz
G Frequency 396 Hz 390 Hz 394 Hz 392 Hz ,94 Hz
rating 5.3 5.9 6 4.9 5.9 0
Theoretical Prototype 4.3 5.6 5.1 4.1 4.5(E = 330 Hz, G = 392 Hz)
Chord Discrimination 8
This research was supported by grant F496209310033 and F49069310327 fromr the Air Force Oltice of Scientific Research.
The opinions expressed are those of the authors and do not necessarily represent those of the granting agency.
Figure Captions
Figure t: Perceptual space for C-major tnads.
Figure 2: Normalized goodness rating summary for the prototype and nonprototype contexts. This figure parallels the structure of figurc
1. and the shared stimuli are equivalent to the stimult represented by circles in figure I Bars represe•iting a ratuig of I do not appear
Figure 3 Discrnmination as a function ofdistance from a standard Because individual protot.pes were used, the same stuiuh do not
necessarily represent the same distances from individual prototypes Thereftre. sone oM the data points iir the prototype standard may not
iniludc all tiere subjects
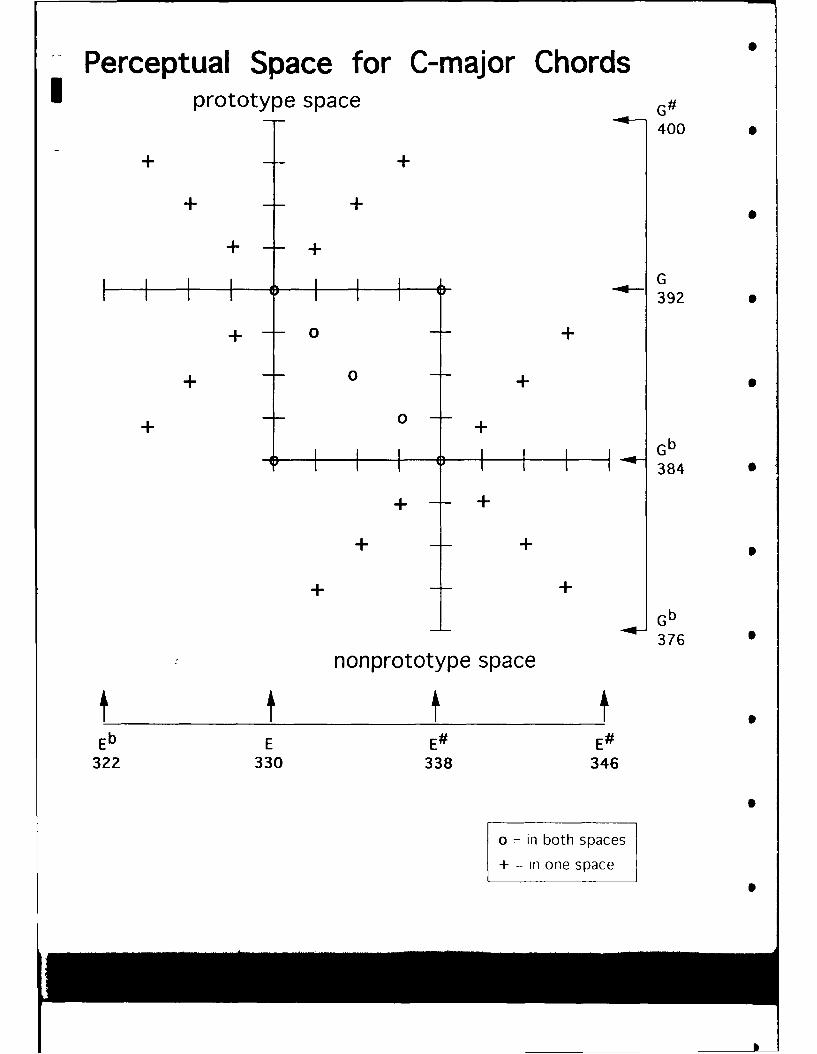
Perceptual Space for C-major Chordsprototype space G#
400
+ 0+
+ 0+
+ '- +
+ +Gb
Gb
376
nonprototype space
Eb E E# E#322 330 338 346
o = in both spaces
+ in one space
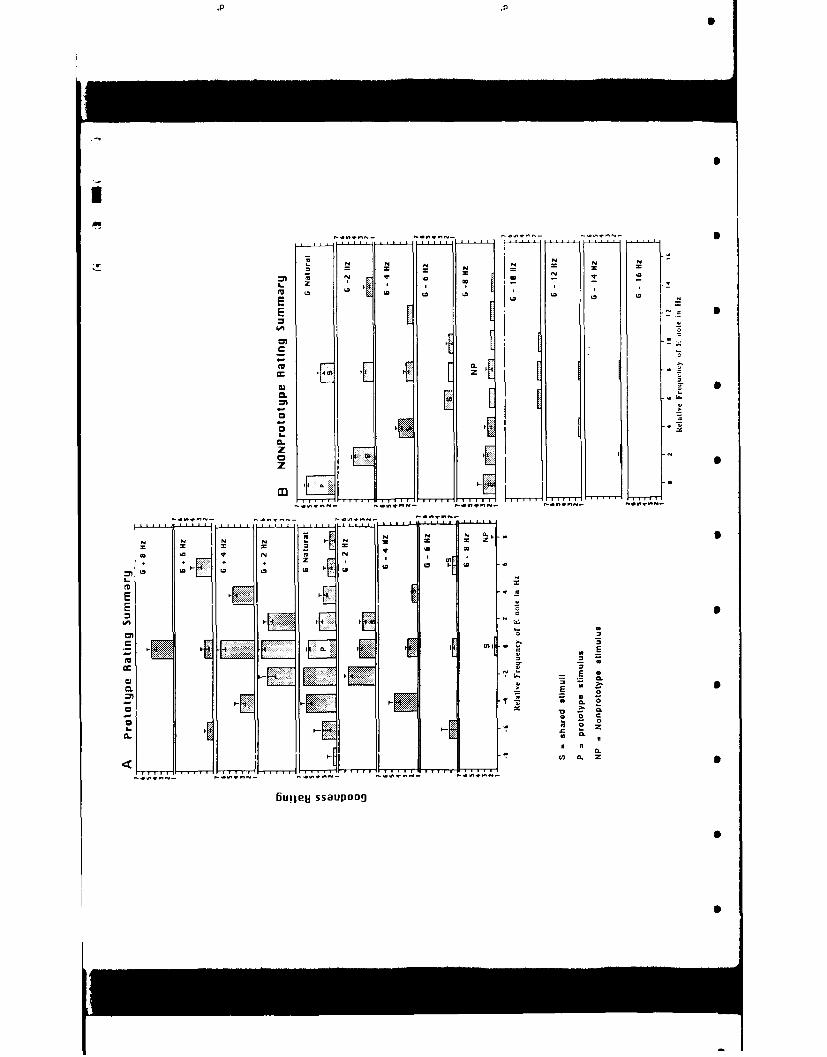
ZM N N NN N N
S0 c1
CLu
.. ."4W ....
03le S. 5oo
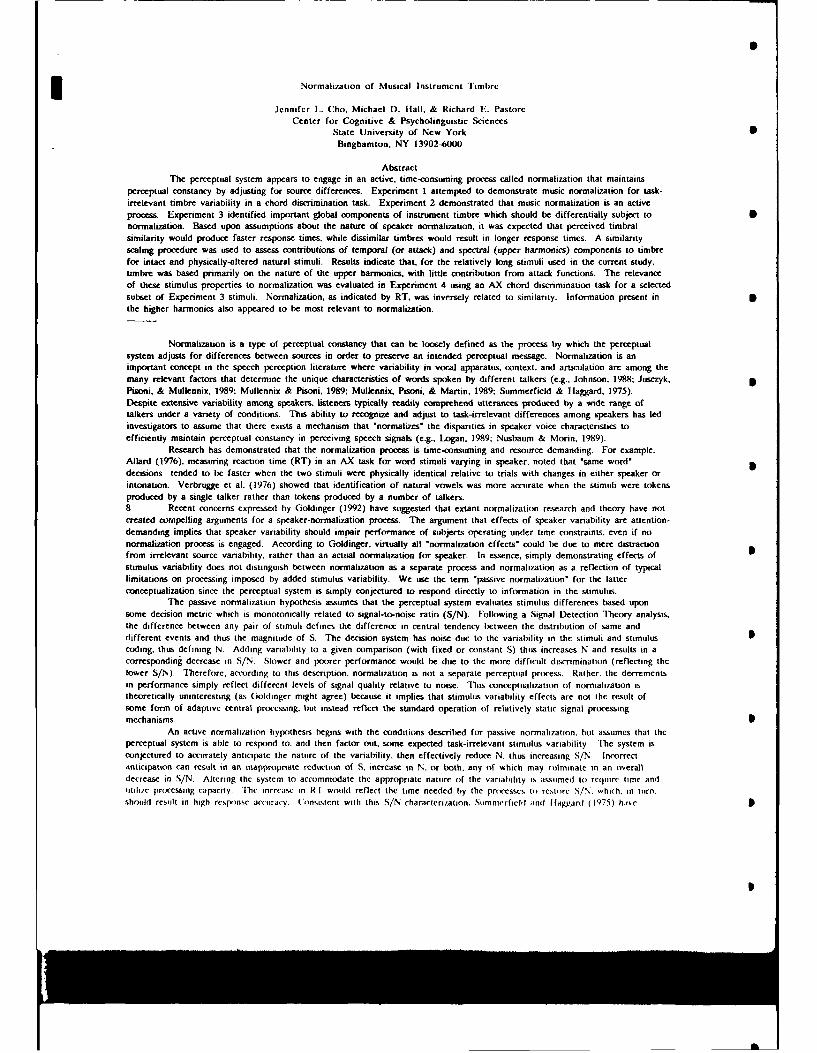
Normalization of Musical Instrument Timbre
Jennifer IL. Cho. Michael D. Hall, & Richard E. PastoreCenter for Cognitive & Psycholinguistic Sciences
State University of New York SBinghamton, NY 13902-6000
AbstractThe perceptual system appears to engage in an active, time-consuming process called normalization that maintains
perceptual constancy by adjusting for source differences. Experiment I attempted to demonstrate music normalization for task-irrelevant timbre variability in a chord discrimination task. Experiment 2 demonstrated that music normalization is an activeprocess. Experiment 3 identified important global components of instrument timbre which should be differentially subject to Snormalization. Based upon assumptions about the nature of speaker normalization, it was expected that perceived timbralsimilarity would produce faster response times, while dissimilar timbres would result in longer response times. A similarityscaling procedure was used to assess contributions of temporal (or attack) and spectral (upper harmoni•s) components to timbrefor intact and physically-altered natural stimuli. Results indicate that, for the relatively long stimuli used in the current study.timbre was based primarily on the nature of the upper harmonics, with little contribution from attack functions. The relevanceof these stimulus properties to normalization was evaluated in Experiment 4 using an AX chord discrimination task for a selectedsubset of Experiment 3 stimuli. Normalization, as indicated by RT, was inversely related to similarity. Information present in 5the higher harmonics also appeared to be most relevant to normalization.
Normalization is a type of perceptual constancy that can be loosely defined as the process by which the perceptualsystem adjusts for differences between sources in order to preserve an intended perceptual message. Normalization is animportant concept in the speech perception literature where variability in vocal apparatus, context, and articulation are among themany relevant factors that determine the unique characteristics of words spoken by different talkers (e.g., Johnson. 1988; Jusezyk.Pisoni, & Mullennix, 1989; Mullennix & Pisoni. 1989; Mullennix. Pisoni, & Martin. 1989; Summerfield & Haggard, 1975).Despite extensive variability among speakers, liteners typically readily comprehend utterances produced by a wide range oftalkers under a variety of conditions. This ability to recognize and adjust to task-irrelevant differences among speakers has ledinvestigators to assume that there exists a mechanism that "normalizes" the disparities in speaker voice characteristics toefficiently maintain perceptual constancy in perceiving speech signals (e.g., Logan. 1989; Nusbaum & Morin, 1989).
Research has demonstrated that the normalization process is time-consuming and resource demanding. For example,Allard (1976). measuring reaction time (RT) in an AX task for word stimuli varying in speaker, noted that "same word"decisions tended to be faster when the two stimuli were physically identical relative to trials with changes in either speaker orintonation. Verbrugge et al. (1976) showed that identification of natural vowels was more accurate when the stimuli were tokensproduced by a single talker rather than tokens produced by a number of talkers.8 Recent concerns expressed by Goldinger (1992) have suggested that extant normalization research and theory have notcreated compelling arguments for a speaker-normalization process. The argument that effects of speaker variability are attention-demanding implies that speaker variability should impair performance of subjects operating under time constraints, even if nonormalization process is engaged. According to Goldinger, virtually all "normalization effects" could be due to mere distractionfrom irrelevant source variability, rather than an actual normalization for speaker. In essence, simply demonstrating effects ofstimulus variability does not distinguish between normalization as a separate process and normalization as a reflection of typicallimitations on processing imposed by added stimulus variability. We use the term "passive normalization' for the latterconceptualization since the perceptual system is simply conjectured to respond directly to information in the stimulus.
The passive normalization hypothesis assumes that the perceptual system evaluates stimulus differences based uponsome decision metric which is monotonically related to signal-to-noise ratio (S/N). Following a Signal Detection Theory analysis,the difference between any pair of stimuli defines the difference in central tendency between the distribution of same anddifferent events and thus the magnitude of S. The decision system has noise due to the variability in the stimuli and stimuluscoding. thus defining N. Adding variability to a given comparison (with fixed or constant S) thus increases N and results in acorresponding decrease in S/N. Slower and poorer performance would be due to the more difficult discrimination (reflecting thelower S/N). 'herefore. according to this description. normalization is not a separate perceptual process. Rather. the decrementsin performance simply reflect different levels of signal quality relative to noise. 'his conceptualization of normalization istheoretically uninteresting (as Goldinger might agree) because it implies that stimulus variability effects are not the result ofsome form of adaptive central processing. but instead reflect the standard operation of relatively static signal processingmechanisms.
An active normaliziation hypothesis begins with the conditions described for passive normalization, bit assumes that theperceptual system is able to respond to. and then factor out, some expected task-irrelevant stimulus variability. The system is
conjectured to accurately anticipate the nature of the variability, then effectively reduce N. thus increasing S/N. Incorrect
dnticipation can result in an inappropriate reduction of S. increase in N. or both, any of which may culminate in an overalldecrease in S/N. Altering the system to accommodate the appropriate nature of the variability is assumed to require time and
utilihe processing capacity. The increase in R I would reflect the time needed by the processes to restore S/\. which, in turn.
should result in high response accuracy. tonsistent with this S/N characlcrizatton. Siimmerficlil and Ilagganl (,1975) hjce
I
Timbre Normalization 2
suggested that reaction time results may reflect the natural operation of the normalization process, whereas the decrease inaccuracy when responding to tokens produced by different sources may simply indicate that the normalization process may not
be perfect. Thus, the accuracy effects observed in the speech literature may reflect some degree of a failure of normalize. Inorder to provide a convincing argument for any normalization process, one must demonstrate that the listener actively uses
knowledge or memory of particular sources in adjusting for their variability.Normalization and Instrument Timbre
The present investigation attempts to demonstrate the existence of an active normalization process in perceiving musicstimuli. The use of music stimuli may offer an alternative forum in which to investigate the nature of normalization processes.
Also, the sometimes simpler structure of music stimuli (Handel, 1989) may enable us to gain a better understanding of theprocesses implicated in normalization.
In speech normalization, variations among speakers are normalized in the perception of words; if there is an analogousmusic normalization process, then variations in instrument timbre should be normalized in the perception of triads. Timbre isthe subjective attribute of source (instrument) that is based on invariant properties that uniquely characterize the tones producedby the source. Unfortunately, the pursuit of an adequate definition of timbre is both related to and dependent upon establishingwhich characteristics (or combination of characteristics) are important for perceptually determining an instrument's distinctivesound quality. As a result, existing 'definitions' of timbre tend to focus as much upon what does not constitute timbre as what
factors actually contribute to timbre. Thus, the American Standards Association (1960, p.45
) defines timbre only as "thatattribute of auditory sensation in terms of which a listener can judge that two sounds similarly presented and having the sameloudness are dissimilar."
In addition to determining the possible nature of normalization, the current research also seeks to identify someimportant global components of instrument timbre that may be differentially subject to normalization. Speech normalizationresearch to date has established that the auditory system adjusts for variability in the articulator (e.g.. a speaker's vocal tract)(Nusbaum & Morin. 1989). However, only limited research has been conducted to specify what kind of variability the system isanticipating. By determining the bases of listener expectations and their relations to physical characteristics of the signal, we mayalso utilize normalization as a tool for investigating perceptual processing. In the process, we also should be able to effectivelyaddress the issue raised by Goldinger about whether the loss in speed is simply the result of (passive) perceptual limitations, orsome active (normalization) process in which the system adjusts itself to factor out certain expected irrelevant properties.Relevant Pronerties of Music Stimuli
An implicit assumption in most of the speaker normalization research has been that listeners make some judgment orcomparison based on the similarity between two tokens (Logan. 1990). If the two tokens are highly similar, they should bejudged as originating from the same speaker and would not be subject to normalization processes. If the tokens are highlydissimilar, they should be judged as originating from different speakers and would be subject to normalization. Paralleling thislogic, the same assumption should apply for the postulated music normalization, substituting instrument timbre for speakers.However, in order to test this assumption, it becomes important to determine what stimulus properties define instrument timbre
for listeners.One promising approach to understanding the physical correlates of timbre has come from research on the perception
of systematically altered stimuli that has identified some attributes of waveforms that may be important in instrument
recognition. For each partial of synthetic stimuli (mc,,teled after natural stimuli). Grey (1977) identified an attack transient- and
intermediate steady-state, and decay. Removal of initial 20-50 ms segments of his 2.50 ms stimuli resulted in a significantimpairment in the ability to identify different instruments. Therefore, it would appear that onsets (or attacks) of musical tonesmay contain essential cues for identification and discrimination of instrument timbre. Grey's findings seem to confirm thesuggestion by Saldhana and Corso (1964) that onset cues appear to be more significant than offset cues in discrimination tasksfor music stimuli.
Multidimensional scaling (MDS) also has been an effective approach to understand the spatial representations of a
listener's similarity and difference judgments among a given stimulus set (Grey & Moorer, 1977). In MDS, perceived similaritiesor differences are used to represent subjective distance, and then to create a cognitive "map" that attempts to describe theperceptual relationships among stimuli. Plomp (1976) used MDS to investigate the perception of steady-state portions of ninesynthesized instruments playing the same note. Scaling of timbral similarity judgments was highly correlated with the pattern ofthe spectral (as opposed to temporal) envelope. Therefore, MDS research indicates that the physical pattern of energy in thespectrum seems to form a basis of timbre judgments. Generally, similarity clustering seemed to correspond to class membershipof the instruments (e.g.. strings, brass, woodwinds), indicating that timbre is largely determined by spectral composition.
In order to evaluate the importance of onset transitions and upper harmonics (thus temporal and spectral envelope) ininstrument timbre, the present study included an investigation of normalization for stimuli that have been physically altered. Ifnormalization processes exist for music stimuli, the prime factors contributing to instrument timbre should be differences inattacks and/or spectral composition among instruments. These considerations guided our selection of instruments for the presentinvestigation, and are the bases for the physical manipulations in later experiments.
Current Investigation
The current investigation was composed of three chord (triad) pIugment experiments and one similarity s.ahngexpenment. [xperiment I was a chord judgment study (patterned after speech normalization studies) that attempted todcnmonstrate normalh/atiin effects for synthetic music sitmllh I.(sperlms.ni 2 was a chorrd ilccn(iflcatton tildy that tiscd al a sul sit1)f ih •me smuli to evlusitC whcther nuirmail/aion is an active Pro•es.
I o•'rintunt "3 was imfuisil f ,i scrus (if si•heng indllr, it1n whi(h nm,iiral intriutictit 1,1,( llns wcr, ii-t In lt,(
Timbre Normalization 3
condition, natural and synthetic tokens were compared to assess generalizability of the results from Ils-xperiments I and 2 (where
synthetic instruments were used). Two other scaling tasks were used to identify the importance of attack and spectral
composition in defining instrument timbre for our stimuli. Experiment 4 was another chord judgment experiment where a 5selected subset of the natural and altered-natural stimuli were used to evaluate the predicted relationships between perceivedsimilarity and normalization. The information obtained from these studies begins to provide a better understanding of not onlythe nature of normalization, but also of which stimulus properties are "normalized."
Experiment IThe goal of Experiment I was to demonstrate normalization for music timbre, evaluating whether changes in
instrument alter the speed (but not the ability) of subjects to respond to the equivalence of triads in an AX task. If findings pthat characterize talker normalization also apply to music stimuli, judgment of triads should be faster when chords arc played bythe same instrument, Conversely. slower reaction times should be obtained when triads are played by instruments withsignificant timbral differences. Maintenance of performance accuracy in a multiple-source condition is critical to demonstratingthe operation of normalization processes for the reasons described above for the active normalization hypothesis.Method
Subiect. Twenty-five undergraduate students enrolled in psychology courses at Binghamton University participated inpartial fulfillment of course requirements. Since subjects needed to distinguish between major and minor chords, all subjects Swere asked to self-select based upon having at least minimal knowledge of music theory. Because of past experience with thehigh variability in both the ability and motivation of subjects in this pool, we always establish a 2rior criteria for inclusion ofsubject data. For the current study, the criteria was better than chance performance in all the conditions. Four subjects failedto meet this criterion. Data from one other subject was lost due to a computer malfunction. Thus, results for this experimentare based on data from the remaining 20 subjects.
Stimuli. The stimuli consisted of chords by five digitally sampled instrument sounds produced on a Roland synthesizerkeyboard. The five instruments were piano, harpsichord, violin, flute, and trumpet. These instruments were chosen on the basisof the characteristic physical properties of the stimuli they typically produce. Previous research seemed to identify the attacktransition as an important property in defining instrument timbre. Naturally produced stimuli from the piano, harpsichord, andbrass instruments are all characterized as having a quick attack and rapid decay, whereas woodwinds and strings have a relativelyslow attack and gradual decay (Fletcher, 1991). The piano, flute, violin, and trumpet were chosen because these instruments arereadily discriminable from one another. The harpsichord and piano served the role as possibly confusable instruments becauseof their similar timbres that may be based upon attack, partials. or overall waveform properties. If the harpsichord and pianoare indeed easily confusable, one should expect to find faster reaction times for comparisons across these instruments relative tocomparisons across discriminable instruments.
There were two 871.5 ms samples of each instrument recorded for each of four triaos: C-major (C-E-G). C-minor (C-E'-G). E*-major (E'-G-Bu). and E-minor (E--Gt-B). where possible, in the same octave above middle C'. This ordered chordprogression represents the degree of relatedness for any two given chords, with each listed chord differing from the immediatelypreceding chord by a factor of one note: i.e., C-major differs from C-minor by one note, from P-major by two notes, and 0 -minor by all three notes. The chords were recorded on a high-bias chrome cassette, then converted to a 12-bit digitalrepresentation at a 10 kHz sample rate with 4 kHz low-pass filtering. A 386-DOS computer was used on-line to randomize t<.lorder, present the stimuli, time events, and record responses. The stimuli also were 4 kHz low-pass filtered at presentation, andwere delivered binaurally over TDH-49 headphones in a commercial acoustic chamber.
Procedure. Experiment 1 used an AX chord discrimination task that was blocked for instrument condition. Subjectswere instructed to judge whether or not the two chords presented on a given trial were equivalent (consisted of the same notes),with emphasis placed on the need to disregard the instrument playing the notes. Following the procedures typically used innormalization studies, instrument variability was manipulated within subjects by presenting stimuli in two blocks representingunique instrument conditions: Single Instrument, and Mixed Instrument. The 120-trial Single Instrumei ctndition consist(_! ofstimuli from only a single instrument within each trial, but stimuli from different instruments across trials. The MixedInstrument condition consisted of chords played by different instruments both within and across the 480 trials. The order ofconditions wps counterbalanced across subjects. Subjects were informed of the exact nature of each condition prior to the block
of trials. Within each condition there was an equal (0.50) probability of same and different chord presentations.A trial consisted of presentation of the A stimulus, a 1500 ms ISI. the X stimulus, and a 3000 nis response interval.
Subjects were instructed to respond as quickly and accurately as possible: responses were indicated by pressing one of two keys(corresponding to same vs. different chord) on a response pad. All responses were recorded by the computer that measured RTusing a I ms time-base and prohibited any change in response.Results and Discussion
Based upon speech normalization findings, sjbfects should be faster (and possibly more accurate) in the SingleInstrument condition compared to the Mixed Instrument condition. Table I shows mean accuracy and RT results. The meanR I values across subjects were obtained from individual median R'I sc,)res for correct responses only. The full set of RT andaccuracy data were subjected to separate 2 x 2 ANOVAs. with instrument condition (Single vs. Mixed) and chord (same vs.differeni) ,erving as variables. The analysis of different chord comparisons was further broken down by the number of notesbtlween chords; discussion of this finer anadvsis of results will follow the separate discussion of general RI" and accuracy results.
Timbre Normalizatioi4
Insert Table I Here
The results in Table I show that subjects performed quite accurately in the Single Instrument condition and, incomparison, very poorly in the Mixed Instrument condition I[(l,19) = 164.78. R < ^.1011. This effect of instrument conditionoccurred for both same and different chord trials IF(1.19) = 134.03. p < 0.01, and [(1.19) = 65.20. p < 0.01, respectivelyl.
The reduced accuracy Ion both same and different chord trials] for judgments across instruments indicates that subjects wereseldom able to ignore irrelevant stimulus differences associated with instrument timbre. Although performance on singleinstrument trials was significantly faster than mixed instrument trials [F(I.19) = 17.85. p < 0.011, as hypothesized, the accuracydata appear to indicate a general failure to normalize, and therefore do not allow the use of RT to evaluate differences inprocessing (i.e.. normalization). However, two subjects performed at relatively high levels of accuracy under both Single andMixed Instrument conditions, and their data (which are discussed later) allow some evaluation of normalization for instrumenttimbre.
There was no main effect of same/different chord on accuracy [[(1.19) = 0.48, p < 0.101. but there was a significantchord by instrument condition interaction [[(1.19) = 17.66, p < 0.011. In the Single Instrument condition there was a significanttendency to respond 'same' [_(1.19) = 14.38, p < 0.011. whereas in the Mixed Instrument condition there was a tendency torespond 'different' iF(I.19) = 2.43, p < 0.14). Thus, it appears that subjects may have responded as much on the basis of
overall timbre as on the basis of equivalence of chords.Chord Analysis. Table 2 also summarizes the effects of note differences for different chord trials across Single and
Mixed lInstrument conditions. Discrimination of one-, two-, and three- note differences between chords represents increasing S.and thus increasing S/N. Accuracy should be expected to increase, and RT to decrease, with greater S/N. Thus, it is notsurprising that performance was better for discrimination of three note differences than one- or two-note differences, but the
absence of any differences in RT was not expected. The lack of note difference effects on RT may have been due to the higherror rates in the Mixed Instrument condition. There was a marginal main effect of same/different chord on RT [[(1,19) =3.95, p < 0.101. which is attributable to the significantly slower response times for different chord trials [[(1,19) = 5.98, p <0.051 in the Single Instrument condition (where accuracy was higher).
Instrument Analysis. Table 2 shows d' as a measure of accuracy for each instrument combination on the AX trials. d'was computed for each listener based upon probabilities that subjects responded *same" to equivalent (hit) and nonequivalent
(false alarm) chords. d' then was averaged across subjects (Pastore & Scheirer. 1974). Table 2 also shows RT for the
instrument comparisons.
Insert Table 2 Ilere
Based upon the summarized research on instrument timbre, it was expected that the similarity in attack, and possibly
upper partials, of the stimulus waveforms would have differential effects on response time. For example, a piano-harpsichordcomparison (where both instruments lhve quick attacks) should have been faster and more accurate than a piano-woodwindcomparison (where woodwinds have relatively slow attacks).
For both same and different chord trials. d' was always highest, and RT almost always fastest for single instrumentcomparisons. However, none of the expected effects based on instrument waveshape were found. One possible explanation forthe lack of instrument similarity effects may be that although the instruments were selected based upon expected differences inattack, attack may not have been extremely critical to distinguishing timbre in the tokens used. It is also possible that subjectswere not sufficiently experienced with music stimuli to effectively utilize specific timbral components such as attack; the lack ofnormalization for most subjects is consistent with this possibility. Also, in mixed instrument comparisons, d' was higher and RTfaster (with a few exceptions) when the second stimulus was played by the piano. It may be that subjects, in general, havemore exposure to piano timbre or chords played on the pion-, (:oclýr-,. o...... -"'t .'uments). and thus are more
efficient perceivers of this particular timbre. Other work from our laboratory is consistent with this conjecture (Hlall & Pastore.1993).Testing Musically Proficient Sub ects
Experiment I sought to demonstrate normalization in terms of increased response latencies, but not decreased accuracy.
in conditions where timbre differed within trials. Subjects performed quickly and accurately on single instrument chord
comparisons, and significantly slower, but also with considerably less accuracy, on mixed instrument chord comparisons. Theseoverall results have not produced support for a meaningful normalization process for music timbre. Although the subjects wereasked to self-select for participation based on musical experience, the accuracy results suggest that the majority of the participantswere not proficient musicians.
The results from ['xperiment I are consistent with suggestions that chord and timbre may be integral in the Garner(1974) sensel. If two dimensions are truly integral, then subjects should not be able to normalize for one dimension when
perceiving the second dimension. For example, Krumhansl and Iverson (1992) found that pitch (of isolated tones) and timbre dointeract to some degree (or are not perceived independently): subjects could not attend to the pitch of a tone without beinginfluenced by its timbre Musical experience may be a factor in the degree of integrality between pitch and timbre. Wolpiort(I 99oi obtained results that suiggested .umbrc is nioic salient than pitch for nfonmusicians than musicians: alternatively. it seemn ,rpussilIc that nonmisuultans may have the ability to separate chord from timbre. but have itifflt uiliv in understandiug whai isrequired ou them (' nsistent with th tvrypes o(t explanation%. Ileal ( 198S) rcjuortcd that noinniul'•iu'iln- found it more lih-ll
!!S
lTimbre Normalitation 5
than musicians to judge two chords as the same when they were played on different instruments. There also are a number ofother reports (e.g., Pitt, under review) that nonmusicians have difficulty separating pitch and timbre. Thus, music experience maybe important in the degree to which pitch and timbre interact.
Could the results of Experiment I have been due to the lack of reasonable musical experience for the subjects, or dothe results instead reflect limits on music perception processes that occur even for experienced listeners? Separate analyses ofdata for musicians and nonmusicians may be required to investigate this possibility that music experience differentially affected
timbre and pitch perception.Musical histories were known for 4 of the 20 subjects in Experiment 1. Two (Subjects 7 and 13), were proficient
musicians and performed very accurately in all conditions. Their data thus allow some evaluation of normalization. Subject 21had moderate musical experience. although to a lesser extent than Subjects 7 and 13. whereas Subject 2 had only about 1 year of Smusic experience.
Table 3 provides accuracy and RT data for the 4 subjects. Subject 7 performed at high levels of accuracy throughoutthe experiment, with 100 and % percent correct on same chord trials for Single and Mixed Instrument conditions, respectively.The R'[ data for this subject are somewhat consistent with normalization predictions, with increased variability in the differentinstrument conditions resulting in longer response times for same chord trials It(9)=.I.78, p>.101. Thus, it appears that Subject7 may have normalized for stimulus variability, maintaining accuracy at a cost to speed. Subject 13 also performed at 100percent correct for the same instrument conditions and at a good, but somewhat poorer level of 92 percent correct on differentinstrument conditions for same chord trials. Although RT was in the expected direction, the difference did not approachsignificance [t(9)=.84, p>S01. Subjects 2 and 21 performed at 97 and 100 percent correct, respectively, for Single instrumenttrials. However, performance for these subjects was poorer for the different instrument trials, at 55 and 68 percent correct.The RT data for these two subjects do follow the expected normalization patterns, where RT for different instrument - samechord trials were significantly longer than same instrument - same chord trials Jtu9)=3.52. p<.01, and t(9)=5.69. p<.002 forSubjects 2 and 21. respectively]. Based on the results from our musically experienced subjects (7 and 13). it is possible thattesting clearly experienced musicians may resolve the accuracy problem and provide stronger support for an active model ofnormalization. This was the primary goal of Experiment 2. which examines normalization as a function of musical proficiency.
Insert Table 3 Here
Experiment 2The logic behind the second experiment begins with the assumption that normalization is an active process. When a
comparison is to be made between two sequentially presented stimuli, the first stimulus then should set up expectations about theparameters or nature of the processes to utilize in analyzing the second stimulus. Furthermore, the first stimulus need not beauditory to generate expectations about a subsequent stimulus. Presentation of a visual cue for instrument should providesufficient information for the system to anticipate well-learned stimulus characteristics. One would expect valid cues (whichcorrectly cue expectations about the instrument playing the auditory stimulus) to produce faster response times than invalid visualcues (which set the processes for an incorrect instrument). If normalization instead is a passive process. then expectationsbecome irrelevant for stimulus processing. Thus, the nature of visual cues should not influence response times.
Following this logic. Experiment 2 used a Posner (1980) cross-modality cuing paradigm to determine whether theperceptual system can actively anticipate, or can only passively process, irrelevant stimulus (timbre) variability. Subjects withknown musical abilities were tested for reaction time effects with relatively high levels of performance accuracy. Since the visualcues should not directly alter the S/N ratio, there should be no effect of valid or invalid visual instrument cues on subsequentchord judgments if normalization only reflects a decrease in S/N. However, if normalization is an active process, then longerreaction times would be predicted for invalid cues, reflecting the perceptual system preparing for irrelevant (timbre) variabilityand/or determining that the expectations were inappropriate.
Method
Subiect. Six subjects participated in Flxperiment 2. With the exception of Subject 6, who had only studied aninstrument (piano) for approximately 1 year. most subjects had over 5 years of music experience. The 4 sublject.s with knownmusical histories from Experiment I also participated in Experiment 2. All subjects reported normal hearing.
Stimuli and Procedure The experimental design was a speeded, single-stimulus, major/minor chord labeling task. andemployed a cuing procedure adapted from the work on visual attention by Posner and colleagues (Posner. 1980; Posner, Snyder,& D)avidson. 1990). Subjects were presented with a 500 ms visual cue followed by an ISI that randomly varied between 1 and2.5 s in Y5() ms increments. Based upon the visual work, the varnable ISI was intended to cltminate general. i-mporally-related.anticipatory effects due solely to the presence of the visual cue. "|`he ISI was followed by a (n-major or C-minor chord fromExperiment 1 played by one of four instruments: piano. harpsichord. brass, or strings. The woodwind stimuli were not used inExperiment 2 because subjects in l:xpenment I often reported that the instrument sample did not sound characteristic of its
natural counterpart."The suilject.s' task was to ilentify each triad as major or minor by differential button presses un a keypad. (Ctes.
which were always orthogornal it) (and conveyed no infoirmation albuit) whether a chord was majoir or minor. were neutral. valid.otr invalid with respect it) the instrument playing the target 'Ihe rue "+ + 4 4" was neiutral with rc.spc.(-t to instrtumnt and was
pre•nicul with a proaibiity It f 1i 17 1 nstrument cites were fouur-charactcr reprcscltthons o fi a gucn instrument 1"s I Rt,"trunt,,,) "'l\t)" (pirnt). "IHR'," irr) or "tIIARI" (harp•-horirl)I. and ixiuirrid (in thc rctimmnr mi rot, (1i f)1
I
Timbre Normalization 6
Instrument cus. wheni pretented, were valid with a probability of 0.80, and this were valid with an overall probability of 0.66(p = 0.80 * 0.83) across all trials; instrument cues were invalid with an overall probability of 0 17 (p = 0.20 ' 0.83). Threeblocks of 200 trials were prescented.Results and Discussion
Figure I shows mean reaction times obtained from individual median scores for correct responses given valid, neutral,and invalid cue trials. In the figure subjects air ordered in terms of increasing RT for neutral cue conditions. Standard errorbars also art provided. A one-way ANOVA of RT revealed a significant main effect of cue validity [L(2.5) = 6.58, p < 0.051."This effect was primarily a result of consistently longer raction times to invalid trials relative to valid trials (Tukey-test p <0.50). Response latencies for neutral trials also were consistently longer relative to those for valid trials. but this difference didnot reach statistical significance (Tukey > 0.05). S
Insert Figure 1 Ihere
There were minimal differences in accuracy effects, with the two most highly practiced musicians (Subjects 1 and 3 inthe current experiment, and subjects 7 and 13 respectively, in Experiment 1) performing at essentially 100 percent correct, andwith Subjects 2. 4. 3nd 5 performing at better than 90 percent correct regardless of cue and target instrumenL These ceilingeffects were not viewed as a problem because we sought to demonstrate an active normalization process through RT effects inthe context of consistently high accuracy levels. Subject 6 (who was a relatively inexperienced musician and who had the leastamount of training of the 6 subjects) performed at approximately 79 percent correct and also was the only subject whoseresponses on valid cue trials were not significantly faster than invalid trials.
The relatively accurate responding of subjects across all conditions is consistent with Krumhansl and Iverson's (1992)conclusion that *the interaction between timbre and pitch of single tones does not imply that it is impossible to abstract andcompare pitches of tones with different timbres or timbres of tones with different pitches.. The increased reaction times in tasksrequinng this information to be abstracted indicates that this process requires additional time (p.74
9)."
It was anticipated (as in Experiment 1) that the relationship between the expected properties of cued instrumentwaveformn and the perceived properties (based on waveshape) of target instruments would influence RT and accuracy. Table 4
reports mean reaction times for each possible combination of cue and target instrument. Although no consistent effects ofwaveshape were obtained, there were some notable trends in the RT data. It appears that RT was fastest for the piano in bothvalid and neutral cue trials. For 8 of the 12 invalid cue comparisons, reaction times for tnris where both instruments had arapid attack were faster than trials with slower attack instruments. For instance, the piano-harpsichord comparison was fasterthan the harpsichord-string comparison. The results also show that the harpsichord-piano comparisons were, by far. the fastestof all invalid cue trials. These results might be due to the similar attack functions of the piano and harpsichord, but might alsobe due to a combination of high familiarity with the piano as a chord instrument and to similar overall waveshape propertiesbetween the harpsichord and piano. The fast reaction times for harpsichord-piano comparisons also provide an important basisfor later experiments which investigate the role of perceptual sumitarity in normalizatonm based upon an implicit assumption fromdemonstrations of speaker normalization (Logan. 1990). similar tokens should be processed faster than dissimilar tokens.
Insert 'Table 4 Ilere
The results of Experiment 2 clearly provide evidence that normalization is an active process. Subjects were
significantly slower when the visual cue was invalid than when the cue was either valid or neutral, indicating a cost forinappropriate perceptual expectations. 'bis cost is an increase in processing time due to inappropriate expectations, resulting in aneed to identify the inaccurate perceptual setting, then to readjust for prover source variability."The use of digitally sampled. rather than natural instiument tokens may have limited the observance of consistentwaveshape effects. Subjects in both expenments often reported that the harpsichord samples did not sound characteristically likethe natural instrument; such unnatural timbre had already been identified as a problem for the woodwind samples te ExperimentI. and was the basis for not using those stimuli in V'xpeinment 2. Therefore, it is possible that some stimulus propertiescontributing io timbre in our synthetic tokens may have prevented consistent normalization to expected stimulus properties thatotherwise could have been in evidence Thuts. such additional properties may have limited the already significant main effects o•f
citing in Experiment 2. This possibility will be investigated in FExperiment 3 by using natural instrument tokens. In addition,waveform maiapulatiins of natural tokens may help identify the salient components of timbre, which shoild. in turn, biimportant for normalization.
Experiment 3If normalization is to be considered an active prcess, a pertinent question becomes what physical siimulus propertics
are actually being factored-out or normalized'? The goal of Experiment 3 was to identify global stimulus properties thatcontribute to the characteristics of particular instrument timbres, and thus form the basis for perceived instrumcni varilalulty that
may bhe sul)jert to normaltization. A numlber of stidties (see the introdu•icson) have indicated that attack functions, and ls.ibliv
spectral ctimp•.ston. are largely respi •nsble for inmrumcn timbre. Ixperimeni 3 provides an evaliation of the uittnp dm1c 0iu(la, and spet(ral rOitpfoiititun (in t(emns of upper p<irtals1) in lefutning the stuuilrnt) (or converslV, t•lc disitui iiventlss) i')l
in•si iln ni f linrlir
l i-t~rum~nin 1,)kc-n% wtcrt phv%-l illv illc-1'r i, r cvahltu ( 1 -,lh~v tri ll c)ll ents in In,(, , lll l fl ~ IT( ]
Timbre Normalization 7
types of physical alterations were applied to the natural stimuli: (1) removal of the attack portion of each stimulus, and (2)removal of all higher-order partials. l-xperiment 3 thus utilized 3 sets of 'natural" stimuli: 1) full (intact) vcrs:,,ns of the naturaltokens, 2) tokens with the attack portions removed ('cut-atudck'), and 3) filtered tokens. The manipulated stimuli representextremes, in that attack transitions and most partials were completely eliminated. Thus, if the attack and/or upper partials playsignificant roles in instrument timbre, eliminating the g ven property should result in stimuli which are highly similar to eachother and dissimilar to the original, unaltered stimuli.
A similarity scaling procedure was used to evaluate the importance of the attack and upper partials as components ofinstrument timbre. Subjects were randomly assigned to one of three conditions. In Condition I the synthetic stimuli fromExperiment I were compared to their intact natural counterparts& This comparison allowed us to assess the generalizability ofthe Experiment 2 results obtained using synthetic stimuli to natural instrument tokens. In Condition 2, natural instrument tokenswith the attack portions removed were compared to intact natural stimuli. If the attack component of a chord is a significantcomponent of timbre, instrument tokens with missing attack transitions should be perceived as highly similar to each other andnot very similar to intact versions of the same instrument In Condition 3, low-pass filtered natural tokens were compared tonatural intact stimuli. Using the logic from Condition 2, if the higher-order partials are significant components oi` timbre, filteredstimuli should be perceived as highly similar to each other and not very similar to intact versions of the same instrument.Method
Sub.ect. Forty-two students enrolled in psychology courses at Binghamton University served as subjects (14 subjectsfor each of the 3 conditions) in partial fulfillment of course requirements. All subjects reported normal hearing and had at least2 years of musical experience.
Stimuli. The stimuli consisted of chords produced by five natural instruments. The instruments were the same asthose used in Experiment 1. A practiced musician with a given instrument produced the isolated notes C. E. Eb, and G. eachapproximately 870 ms in duration. The samples were recorded on a half-track tape recorder (Tandberg TD 20A operating at 15ips) using a B&K Model 4135 microphone. The recorded stimuli were digitized (12-bit with 10 kltz sample rate and 4 kiltz low-pass antialiasing filter). The stimuli were then digitally mixed to produce C-major chords using a 386-DOS computer. Thus, allchords were created as though three musicians simultaneously played the component notes, even if the full chord could havebeen played on a single instrument ( %g.. piano or harpsichord).
The cut-attack stimuli consisted of intact stimuli which were digitally edited to remove the attack functions. The mostintense portion of each token was identified to determine the length of the attack function. The attack (the stimulus portionprior to and including peak amplitude) then was excised from the waveform at a waveform zero-crossing. In order to preventany sudden onset transients, each cut-att-ck stimulus then was amplitude-weighted by imposing a constant, brief (30 ms) linearOnfset
The filtered stimuli consisted of intact chords that were low-pass filtered at 500 1i,, with a 72 dB/octavc skirt. Forthese stimuli, most of the higher-order partials were removed, leaving the fundamental plus, at most, one partial from the C noteand. possibly, one partial from the E note. Individual tokens were attenuated to equate overall peak amplitude across stimuli.Time varying spectrograms for each of the stimuli were examined to confirm the effectiveness of the temporal and spectralmanipulations performed on the stimuli. Spectrograms showed that the onset portion of each waveform was absent for all thestimuli in the cut-attack manipulation. Similar analyses for the filtered stimuli showed that most of the higher harmonics wereremoved. Obviously, both manipulations eliminated the relative onsets of the upper partials, which is a potential interactive cuefor timbre.
Procedure. Subjects were instructed to jidge the similarity of the two stimuli presented on each trial. A 7-point scalewas used, with '"l indicating minimal similarity and "7" indicating maximal similanty. Each condition was composed of threeparts. In Part 1. all stimuli in the experiment were presented sequentially to give the subjects an idea of the range of thedifferent instrument tokens. In Part 2, subjects were given an example of a very dissimilar and a very similar pair of stimuli.Different stimulus pairs were used as examples. depending on the condition. These examples were not expected to producedemand characteristics since the subjects were told that the pairs should not be considered as the maximally similar or dissimilarcomparisons on which to base their later judgements, but rather. just as examples of similar and dissimilar items. No data werecollected in these initial familiarization sections of the experiment. In Part 3. similarity ratings were collected on each of 450trials. A trial consisted of the first stimulus, a 1500 ms ISI. and presentation of the second stimulus. Subjects were asked torespond within a 3000 ms response interval by pressing keys corresponding to 1-7 on a response pad: these responses wererecorded by the computerResults and Discussion
For every condition, the average similarity rating was calculated across subjects for each of the 90 stimulus pairs. Themean similarity ratings were submitted to a multidimensional scaling program (Systat) using a I'uclidean metric [Mmkowskimetric with r = 2). which is appropriate for integral dimensions (Garner 1974). I1Mean ratings were also analyzed using a city-block metric (f = 1) •,,..ch is appropriate for separable dimensions. Since both metrcs yielded highly similar solutions, only theIluiclidcan solution is presented and discu.ssed.I
FIor Condition 1, where full versions of the natural and synthetic stimuli were compared, a 2-dimensional solutton wasobtained (stress value of 01.014) Panel A oif Fligure 2 shows the MI)DS space based on dimensions I and 2: "lablc S provides aderixing of the instrument labels used in thr figure With the possil•le exception ilf the harplichorlt and wiidwindls (lhtle).where similarity still is quiir high. oc r;ull similarity lIetwccn tlte natural instrilmr nis and their sy nihetl( i ,'lintcrli,irts wis SrtvhiL
Timbre Normalization
Insert Figure 2 and Trable 5 Here
Dimension I was related to the resonant properties of the instruments; in other words, the wind instruments(flute/woodwind and trumpet/brass, whose sounds emanate from a tube) were grouped together, while the string instruments(violin, piano, harpsichord) also occupied a similar space. Dimension 2 appeared to be related to degree of spectral fluctuation.For example, flutes tend to have upper harmonics that rise in amplitude (at onset) and decay (at offset) in close alignment,whereas strings and brass instuments (which grouped separately along Dimension 2) tend to have varied amplitude patterns forindividual partials at onset and offset (see Grey. 1977).
With the exception of the woodwind (flute) and harpsichord (both noted as unnatural stimuli in Experiments I and 2),the synthetic instrument samples appear to have been adequate Aamples of their natural instrument counterparts. Table 6verifies this assertion by providing mean similarity ratings for comparisons of synthetic and natural instrument counterparts.Although the synthetic and corresponding natural tokens were generally very similar, the finding that they were not maximallysimilar to each other suggests that there are at least some subtle, but perceivable differences between the two types of stimuli.This finding indicates that the results from Experiments 1 and 2 are reasonably valid, but also support our rationale for usingnatural instruments in the remainder of this and in the last experiment.
Insert Table 6 Here
Condition 2 (natural intact vs. natural cut-attack) resulted in a 2-dimensional solution (stress value of 0.068) which is
shown in panel B of Figure 2. Each cut-attack stimulus was highly similar to the intact version from which it was derived. Infact, the trumpet (Tn and Tc) stimuli were maximally similar to each other. Based upon the position of the groupings in theperceptual space, Dimension 1 appeared , be related to resonant properties of the instruments, while dimension 2 was related todegree of spectral fluctuation (both summarized above). S
It dd not appear that the cut-attack manipulation of the stimuli had any significant effect on similarity compared totheir intact counterparts. Panel A of Figure 2 (which illustrates the MDS space for the intact stimuli) and panel B of Figure 2(which depicts the MDS space for intact and cut-attack stimuli) show approximately equivalent similarity spaces for the intactand cut-attack tokens, with the elimination of the attack not meaningfully affecting the similarity of the altered stimulus to itsoriginal counterpart. This finding is contrary to the conclusion by Grey that onset functions are important in instrumentidentification. Although it is possible that some aspect of the synthetic nature of Grey's stimuli may have contributed to thegreater importance of attack noted in his study, it is unlikely given that his stimuli were based directly on natural tokens using 5an analysis-by-synthesis approach. A more likely reason for this difference in results could be related to the lengths of thestimuli, as suggested by Handel (1989) Grey's stimuli, which were synthetic single tones, ranged from 250-500 ms, whereas inthe current study the natural chord stimuli were a,)proximately 870 ms. The onset transitions in the current study thus couldhave constituted a much less significant portion of the stimuli than those used in the Grey study. If this conjecture is valid,then removal of the attack functions should lead to significant decrements in instrument identification for shorter stimuli. Wewill address this argument more completely in the general discussion.
Condition 3 (natural intact vs. natural filtered) also resulted in a 2-dimensional solution (stress value of 0.048). PanelC of Figure 2 provides the MDS space for the filtered and intact stimuli based on dimensions I and 2. Dimension 1 wasrelated to the presence/absence of higher overtones of the tokens; the filtered stimuli were all highly similar to e.!ch other andminimally similar to their intact versions. Dimension 2 was related to the resonant properties of the instruments (as discussedabove). Based upon spectrograms of the intact tokens of the flute stimuli, which verified that the flute is characterized by veryweak higher harmonics, the filtering procedure was not expected to (and did not) have a dramatic effect on timbre.
Experiment 4In order to better establish the relationship(s) between listener expectations and physical characteristics of stimuli.
l-,xpenment 4 used the intact and the two sets of physically-altered stimuli in a major/minor chord discrimination task. If sometype of normoalization process (that is based upon adjusting for differences between two stimuli) is indeed invoked, instrumentcomparisons that resulted in !'iw similarity ratings should result in increased reaction times. Conversely, instrument comparison%that were judged to be very similar should result in a mvnimal increase in S/N and thus, a minimal need for normalization, asdemonstrated by faster reaction times. The results of !'xperiment 3 will directly evaluate the roles of the described globaltimbral properties (derived in Experiment 3) in normalization.Method
Subjects. Twelve subjects from MIqfhu hton University, each with at least 5 years of music experience, served assubjects for this erperiment. All subjects reported normal hearing and were paid S5 per hour for their participation.
Stimuli and Procedure. C-major and C-minor chords were used as stimuli. Experiment 4 used a chord discriminationtask similar to the one used in Experiment 1. Full. intact stimuli were paired with full, cut-attack, and hiltered stimuli from thesame instniment or from different instruments. In order to limit both the number of total trials nd stimulus uncertainty. thefirst chord presented was always a C-major chord This standard stimulus was followed, after a 1500 ms ISI. by either a C-major or (-minor chord The experimcnit consisted of 7201 trials with irief resi periotds provided between cach bloick if 120)trials Subtjects were instrtiutcd toi rcsn d ls a% qmcklv and ao(''urately as Fsililc. A maximitim of 30)1) nu was all iwedl it prcssonc' of lw4 ki"v-. mu rresr•smlintng it) pmlgnients oI "•is mmi alndt "it1fferenti" chord. un a respmx)ns, pad All resj'i,,•nsus wrc rm icrdm'
10
limbrc Normalization 9
on-line by a computer that measured RT' with I-ms accuracy.Results and Discussion
Subjects performed at high levels of accuracy, averaging 94 percent correct. Rcaution times were obtained fromindividual median scores for correct responses only. A linear regression analysis was performed on the scaling data obtainedfrom Experiment 3 and reaction times for the corresponding stimu!us pairs from Experiment 4 to demonstrate possiblesystematic changes in RT as a function of stimulus similarity. The linear regression line resulted in an r' of 0-532. and indicatedthat as similarity increases there is a corresponding, and fairly consistent. decrease in RT. It appears that this significantcorrelation would have been higher were it not for two outlying scores. Both cases involved comparisons of a full stimulusfollowed by a cut-attack stimulus. Reaction time for these comparisons were faster than what was predicted. Since these twocomparisons were different instrument conditions, slower reaction times had been predicted. It is suspected th-.t the cut-attackmanipulation, when presented as the second stimulus, may have speeded RT to some extent because peak amplitude would bereached at a much earlier point for these stimuli. Thus, critical information necessary to identify a certain timbre may havebeen obtained earlier by the listener.
To investigate the possibility that subjects were able to respond more quickly to the cut-attack stir , another brief.additional chord judgment experiment (similar to Experiment 4) was conducted, using only the full and cut-attack stimuli andmanipulating the order of presentation. On any given trial the cut-attack stimulus could be presented as the first or secondstimulus. As suspected, a one-way ANOVA revealed that there was a significant predicted effect of order of presentationIE(3,4) = 628. 2 < 0.01l. Based on this information, a second linear regression was computed using the original data, but •omitting the two conditions where a cut-attack instrument token was presented as the first stimulus. Figure 3 shows the resultsof the second regression, where the new value of r' (0.689) is indeed higher than that obtained in the first regression.
Insert Figure 3 Here
The results of Experiment 4 demonstrate that timbral similarity of two items is an important predictor of processingtime for normalization. Furthermore, timbre is primarily dependent on the information that is present in the upper harmonies ofinstrument tokens (Experiment 3). Increases in processing time are reflective of the degree to which timbral differences betweenstimuli are factored-out. Highly similar tokens are processed faster since there is less variability to adjust. Correspondingly.additional time is required to normalize greater stimulus variability.
General DiscussionThe current investigation has shown that normalization processes for task-irrelevant source variability are not unique to
speech. Thus. the present nonspeech finding of timbre normalization in chord identification suggests that normalization mayreflect a general auditory perceptual mechanism. We note from experience (e.g., Hall & Pastore, 1992) the difficulty inproviding a strong empirical evaluation of claims concerning whether of not speech is mediated by a specialized, biologicalmechanism for processing speech (Liberman & Mattingly, 1985. 1989; Whalen & Liberman. 1987). We therefore simplyacknowledge attempts of previous normalization studies (Pisoni, Carriel, & Gans. 1983) to address that issue, and focus ourdiscussion on implications of normalization for the nature of perceptual processing.Implications for Perceptual Processing
The perceptual system appears to have the ability to factor ouL or at least partition, information associated withirrelevant features prior to complete identification of the relevant features. By providing a demonstration of such partitioning ofinformation, the current series of experiments provides some important insights into general aspects of perceptual processing.particularly in terms of attention to specific features.
Experiment 1 showed that variation in timbre results in significant performance decrements for both accuracy and RT.These results may reflect a failure on the part of most subjects to effectively normalize, with only two highly practiced musiciansdemonstrating a cost to RT without a decrement in accuracy when instrument was varied (see "Effects of Music Experience".below). Thin, normalization may reflect the use of acquired knowledge in an efficient, possibly automatic fashion. Experiment2 demonstrated that there is an active, anticipatory component to normalization rather than being a phenomenon solely basedupon a passive response to increased stimulus variability (or decreased S/N ratio). In this active process, it appears that theperceptual system does not simply evaluate each attribute by combining the values of the limited set of relevant features, butrather seems to actively engage first in setting some processing parameters (based on expected stimulus properties), and thenevaluating the adequacy of the setting. If the settings are incorrect, the system can modify the setting. but with a loss of time.This loss of time is reflected in a greater cost for an invalid cue than an advantage for a valid (relative to a neutral) cue: thisasymmetry of cost to benefit has been reported often by Posner (1980) for visual stimulus processing. 'lTherefore, normalizationhas been demonstrated to be an active, adaptive type of stimulus processing. By the same token, it may be reasonable toconjecture that limits of time or processing capacity would result in decreases in accuracy resulting from the perceptual systemresetting processing parameters or utilizing a more global processing strategy, either of which should result in an increase in N.and thus a decrease in S/N ratio.
The perceptual system may always perform a survey of the stimuli, and determine the appropriateness of the existingsetting/algonthm (from a previous trial or from a cue). If the system has determined the necessity to change the normalizationalgorithm, there may be a cost in tinic and processing resources. Prior to activation of the appropriate algorithm, there must he
a disengagement of any inappropriate algorithm. The notion and ctt of a disengagcment proces. also has been discribed in the%,i al icnhi(in literature hy 'osncr (I lO' . alJso se I xperinicnt 2)
Timbre Normalization 10
Conceptualizing normalization as a central form of adaptive processing provides some possible accounts for the
significant RT cost for invalid cues in Experiment 2. First, in the initial appraisal of the stimuli, the system should be able to
perceive dissimilar stimuli more quickly, activating a faster change in setting, and resulting in a minimization of response time.However, our empirical results refute this possibility. Second. for highly similar stimuli, the system may retain the existing
setting (i.e.. there is no normalization). with some added noise due to even small differences in the stimuli. In this case. slower
response times and decreased accuracy would be expected, however, the systematic changes in RT as a function of similarity that
were found would not be predicted. Third. the time to disengage an algorithm should not differ as a function of similarity.
This possibility is also refuted by the results of Experiment 4, where reaction time is inversely related to similarity. Tius. the
most plausible explanation of the normalization process is that time/effort for adjustment to an appropriate algorithm or settingis a function of similarity. Perceptually similar tokens are processed faster since there is less variability to partition or factor
out. Conversely. greater time and effort is required to normalize larger stimulus variability.Effects of Music Exoerience
The degree to which algorithms are effectively utilized during normalization seems to be a function of the amount ofexperience with a particular class of stimuli. For example, performance was faster and more accurate in conditions that includeda piano stimulus, and many of our subjects were pianists. Possessing greater formal knowledge of the theoretical
structure/underpinnings on which the stimuli are based may be an important factor in stimulus processing in timbre
normalization.Highly practiced subjects should have available efficient algorithms to normalize for the effects of instrument
variability. A highly related alternative to this conceptualization is that musicians may use different types of knowledge (that
nonmusicians may not possess) to invoke imagery or schema-based representations in performing certain tasks. Most subjects inExperiment I tended to have limited musical experience. These subjects thus may have had relatively inefficient, and possibly
inaccurate, normalization algorithms that probably functioned moem on immediate experience with stimuli than on knowledge ofchords and instruments. Following this conceptualization, speed and accuracy could have been superior in the Single Instrument
condition because the subjects applied the same (possibly incomplete and inaccurate) normalization algorithm to the A and X
stimuli, resulting in equivalent normalization errors for A and X stimuli. Those same errors would not have been equivalent forA and X stimuli in the Mixed Instrument condition, where different algorithms must be applied to stimuli. The result would bean increase in the perception of differences in the pitch attribute, and the observed increase in errors in the Mixed Instrumentcondition.Comparisons with Imagery
The normalization process might well involve some form of auditory imagery or schema. For example. Subject Ireported anticipating a rapid stimulus onset when cued for the piano. Subject 5 (Experiment 2) also reported attempting toanticipate the complete chord played by the cued instrument- These anticipations are consistent with the use of some form of 0imagery, and may reflect the typical nature of expectancies for at least some subjects in the music normalization process.
An excellent study by Crowder (1989) on auditory imagery for timbre used the same basic strategy as our first twoexperiments, but with somewhat different goals and results. Experiment I of the Crowder study attempted to demonstrate theeffects of instrument variability on pitch judgments for single tones, establishing a basis for demonstrating positive and negativeeffects of imagery in the second experiment. Crowder obtained a main effect of instrument (with significantly faster RTs onsame instrument trials), thus. in effect, demonstrating normalization. However, these normalization results were limited by asignificant instrument by pitch interaction, such that the main effect of instrument was observed only on same-pitch trials. Thus. Sas with our normalization results (e.g., Experiment 1). instrument variability resulted in increased response latency. Crowder also
had some problems with subject accuracy, as we did in our Experiment 1. Data from 3 subjects in the Crowder study (whoperformed significantly below chance) were discarded in order to obtain the predicted effects of timbre variability.
In his Experiment 2. Crowder used a cuing technique that also involved a self-paced AX task (the fixed trial structurein cur Experiment 2 used a single interval identification task with a visual cue). The subjects were instructed to imagine thepresented sine tone being played by a certain instrument. After the subjects had indicated the formation of an image, aninstrument tone was presented, whereupon a *same/different instrument" judgment was made. Crowder olutained a similar
interaction of pitch and imagined timbre to that found in his first experiment. with the expected effect of instrument vanabilityobserved only for same-pitch trials. Thus, it appears that subjects can actively image timbre, with processing costs (slower RI)for (imagined) properties that are not consistent with subsequently presented stimuli. These results are compatible with thenormalization findings in our Experiment 2. where subjects appeared to actively engage in setting parameters based on expected
stimulus properties. Thus, although our subjects in Experiment 2 were not specifically instructed to use auditory imagery. ourresults are consistent with evidence for the use of timbral imagery. In contrast to our Experiment 2, the subjects in E-xperiment
I need not have actively generated from memory an internal representation of an expected auditory stimulus. but rather mayhave compared a trace (or echoic image) of the first stimulus with the second stimulus.
Tlimbral Contributions of Spectral Characteristics and AttackExperiment 3 demonstrated that upper harmonics, but not attack functions, play a significant role in the timbral
chararteristics of instruments, and thus should be most subject to normalization processes in the discrimination of chords.Similarly. Pitt and Crowder (1992) demonstrated an inability to image rise time (loudness). a salient component (if attack
functions. and concluded that timural imagery is based primarily on spectral properties.['he role of dynamic onset properties in timbre representation may be a function of the length of the st nuui1- (v g.
, Ie hlandel. 199).) For example. in order for the attack functions. to influence performance in any AX task (as in ourI wpx rimrnus I. 3. and 4). s•hlfclts mnll uomparu. the X stimulus atta(k with some form of reproiscnitatvio v)1 the A suintiulirs
IS
5 Timbre Normalization 11
attack. This representation could be a trace (or type of echoic image). or. alternatively, an encoded version of the attack.
These possible representations are respectively equivalent to what have been called *trace coding' and "context coding" processes
(e.g., Macmillan. Braida. and Goldberg, 1987).A trace memory will decay rapidly over time. The vast majority of estimates suggest that trace decay should be
complete within 1-2 s (e.g., Darwin, Turvey, and Crowder, 1972; Treisman and Rostron. 1972). As ISI approaches or exceeds
this 1-2 s limit, context coding becomes the more viable strategy.
let us temporarily assume that our approximately 1 second stimuli include a 100 ms attack portion. With an ISI of
1.5 s, the functional delay for comparing the attack function of A and X stimuli therefore becomes I(ls-100 ms) + 1.5 sl, or 2.4
s. Thus, even in the absence of masking from the final portion of the A stimulus (which also may occur), an adequate trace of
the attack function of the A stimulus will no longer be available for comparison with the X stimulus. The only attack Sinformation for the A stimulus thus must be some form of context coding.
There also are several reasons to expect that context coding of attack information be poor in longer stimuli. For
example, if context coding is capacity limited, then encoding should be best for simpler, more salient, stimulus properties. In
longer stimuli, like those used in the current experiments, long-lasting, static information is (generally speaking) consistently
available after a relatively brief and more complex attack. Thus, following the logic based on limited capacity, static properties
(rather than attack properties) should be encoded. Furthermore, if context coding requires processing time to acress memories
for particular stimuli, then encoding of stimuli must be weak in instances where there is an adequate trace (as demonstrated Sabove for the attacks of the current stimuli).
As a result of both trace and context coding, attacks should have little influence on comparisons of timbres given long
stimuli and/or IS!. It then should not be surprising that eliminating attacks had little influence on similarity judgments in
Experiment 3, and the normalization task of Experiment 4. In summary, attack functions can easily be argued to be more
salient features of timbre in shorter stimuli (as opposed to those used in the current experiments). where attacks are better
represented in (trace) memory.Identification of the physical properties relevant to normalization may provide important implications in understanding 5
how the perceptual system processes auditory information. In a commentary on talker normalization, Pisoni (1990) indicated that
the inability to identify the nature of source variability has hindered researchers from making significant advances in solving the
problem of mapping invariant attributes of the physical signal onto abstract linguistic units. Experiments 3 and 4 address thisconcern in two ways for music stimuli. First, possible sources of variability were identified through stimulus alteration whose
perceptual relevance was evaluated using similarity scaling procedures. Experiment 4 then provided evidence that the overtones
were the timbral components most subject to normalization. Second, a possible relationship between perceived stimulus similarity
and reaction time was obtained that indicated additional time was required to process signals that were judged to be moredissimilar. This increase in reaction time for dissimilar items seems to reflect the degree of adjustment that is necessary for the
system to correct" for inappropriate expectancies. We do realize that the physical alterations performed on our stimuli were
rather extreme, and it thus is possible that there may be other, more subtle sources of spectral variability contributing to timbre
and normalization, such as detailed aspects of upper partials (e.g.. intensity patterns. decay properties).
ConclusionsIn addition to providing further insight about normalization, the present study has important implications in the
auditory attention domain. One new way to characterize normalization is as a manipulation of a listener's attention to stimulus
features. When attending to inappropriate stimulus properties, the listener must redirect attention to appropriate settings beforethe relevant processing can occur. The present findings of active normalization are con.-istent with selective attention processes
where the perceptual system is able to set up to receive and process certain expected stimulus properties.
The present investigation has shown that normalization can be used as an important tool in identifying and defining
critical auditory features utilized in signal perception. Experiment 4 demonstrated a high correlation between judged similarityand the critical parameters used in processing music timbre. Future research in normalization, whether for music or for speech.
should not be limited to only demonstrating different types of normalization, but instead should focus on determining bases of
listener expectations and their relations to physical characteristics of the signal. The nature of normalization then wdl be better
established, as will a reason for why the human auditory system sometimes cannot ignore certain task-Trrelevant properties of thesignal.
:!S
Timbre Normalization 12
ReferencesAllard. F. (1976). Physical and name codes in auditory memory. Quarterly Journal of Experimental Psvchologv. 2L8.
475-482.American Standards Association (1960). American Standard Acoustical Terminoloxy. New York.
Beal. A.L. (1985). The skill of recognizing musical structures. Memory & Cognition, 13. 405-412.
Crowder, R.G. (1989). Imagery for musical timbre. Journal of Experimental Psychology: Human Perception and
Performance, 15, 472-478.Darwin. Ci., Turvey. M.T., & Crowder, R.G. (1972). An auditory analogue of the Sperling partial report procedure:
Evidence for brief auditory storage. Cognitive Psychology, ., 255- 267.
Fletcher, N.iH. (1991). The Physics of Musical Instruments. New York: Springer-Verlag.
Garner, W.R. (1974). The Processing of Information and Structure. NY: Wiley.
Goldinger, S.D. (1992). Words and voices: implicit and explicit memory for spoken words. Research on Speech
Perception: Progare Report No. 7 (Indiana University), 1-128.Grey, J.M. (1977). Multidimensional perceptual scaling of musical timbres. Journal of the Acoustical Society of
Ame6ri 61. 1493-1500.Grey, J.M., & Moorer. JA. (1977). Perceptual evaluations of synthesized musical instrument tones. Journal of the
Acoustical Society of America, 62, 454-462.
flail. M.D., & Pastore, R.E. (1992). Musical duplex perception: perception of figurally good chords with subliminal
distinguishing tones. Journal of Experimental Psvcholoev: Human Perception and Performance. 18. 752-762.
HalL M.D., & Pastore, R.E. (1993). An auditory analogue to feature integration. Published Program for the 34th
Annual Meeting of the Psychonomic Society, 16 (Abstract #174).
Handel. S. (1989). Listenin . Cambridge: MIT Press.
Johnson, K. (1988). Intonational context and lF) normalization. Research on Speech Perception: Progress Report No.
14 (Indiana University). 81-108.
Jusczyk, P.W., Pisoni, D.B.. & Mullennix, J.W. (1989). Effects of talker variability on speech perception by 2-month
old infants. Research on Speech Perception: Pro'ress Report No. 15 (Indiana University). 133-161.
Krumhansl, C.L., & Iverson, P. (1992). Perceptual interactions between musical pitch and timbre. Journal ofExperimental Psycholo2y: Human Perception & Performance. 18, 739-751.
Liberman, A.M.. & Mattingly. 1.G. (1985). Motor theory of speech perception revisited. Conition, 21, 1-36.
Liberman, A.M., & Mattingly, I.G. (1989). A specialization for speech perception. Science. 243, 489-494.
L.ogan. Ri. (1990). Talker normalization and speaker recognition by humans: one mechanism or two? Unpublisheddoctoral dissertation. SUNY-Binghamton. Binghamton, N.Y.
Macmillan. N.A., Braida, L.D., & Goldberg. R.F. (1987). Central and peripheral processes in the perception of speechand nonspeech sounds. In M.E.H. Schouten (Ed.). The Psychophvsics of Speech Perception (pp. 28-45).
Dordecht. the Netherlands: Martinus Nijhoff.
Mullennix. J.W., & Pisoni, D.B. (1989). Detailing the nature of talker variability effects in speech perception. Journal
of the Acoustical Society of America. 85. YYl4.
Mullennix, J.W., Pisoni, D.B.. & Martin, C.S. (1989). Some effects of talker variability on spoken word recognition.
Journal of the Acoustical Society of America, 85, 365-378.Nusbaum. 1tC., & Morin. I.M. (1989). Perceptual normalization of talker differences. Journal of the Acoustical
Society of America. 85, S125.
Pastore. R.E.. & Scheirer. CJ. (1974). Signal detection theory: Considerations for general applications. Psycholoncal
Bulletin, 81. 945-958.Pisoni. D.B. (1990). Comments on talker normalization in speech perception. Research on Speech Perception: Progress
Report No. 16 (Indiana University), 413-422.
Pisoni. D.B.. Carrell. T.D.. & Gans, Si. (1983). Perception of the duration of rapid spectrum changes in speech and
nonspeech signals- Perception & Psychophysics. 34, 314-322.Pitt. M.A. (udder review). Individual differences in the perception of pitch and timbre Perception & Psychophysics.
Pitt. M.A.. & Crowder. R.(i. (1992). The role of spectral and dynamic cues in imagery for musical timbre. Journal of
Experimental Psychology: Iluman Perception & Performance, 18, 728-738.Plomp. R. (1776). Aspects of tone sensation. New York: Academic Press.
Posner, MI. (1980). Orienting of attention. Quarterly Journal of Experimental Psychology. 32. 3-25.
Posner. M I., Snyder. C.R., & Davidson, HJ. (1980). Attention detection signals. Journal of Experimental PsycholoirvS
(Ocneral. 2. 160-174Saldanha. El... & (Crso, J.l. (1964). Timbre cues and the identification of musical instruments. Journal of the
Acoustical Society of America, 36, 2021-2026.
Siummerfueld. A.O.. & Ilaggard. M.P. (1975). Vocal tract normalization as demonstrated by reaction times In (i0 1ant
and M.AA latham (Eds.) Auditory Analysis and Perception of Speech london: Academic Press.Verhrt gge. R.R . Strange, W. Shanklweter. D).P., & Edman. T.R. (1976). What information enables a listener to map a
talkers vouwel spaci' i Jiiurnal of the Acoustical Society of America. 6( 198-212
W'ha',cn. I). & I tlwrmun. A %1 (19 8 7) Speech perception takes precedence over nonspeech perception Suienpc. 237.
i1,1. 171

Iimhre Normalization 13
Wolport, R.S. (1990). Recognition of melody, harmonic accompaniment, and instrumentation: Musicians vs.
nonmusicians. Music Perception, 8, 95-106.
AcknowledgmentsThis research was supported by grant F4%209310033 from the Air Force Office of Scientific Research and grant
BNS8911456 from the National Science Foundation. Opinions, findings, conclusions, and recommendations are the authors' and
do not necessarily reflect views of the granting agencies.
Footnotes1. tecause the octave location vn the synuioestcr L,.rrc.sponded to ii differcnr frequency range for the woodwinds, the chords
produced by the woodwinds were lower in frequency (approximately one octave) compared to the other instruments.
2. Context coding should be richer given extensive experience with stimuli. Thus, listeners with greater music experience could
be conjectured to additionally have adequate encoding of more subtle stimulus properties, like the attack functions of our stimuli.
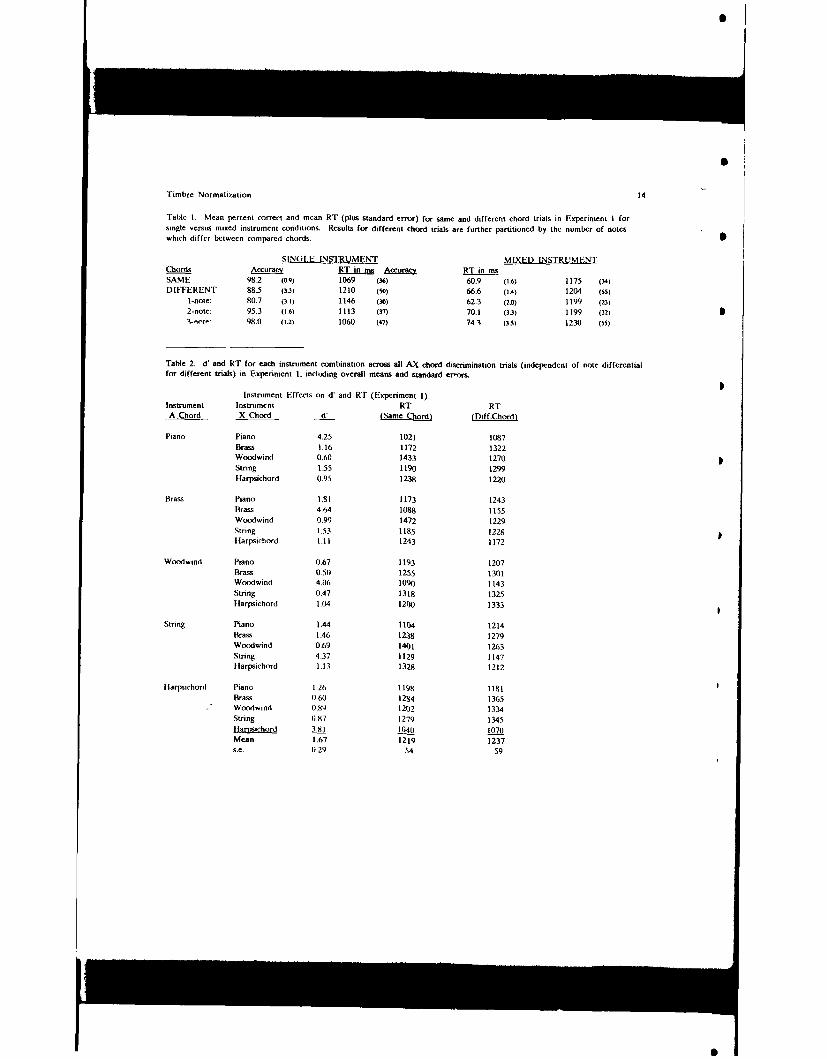
LS
Timbre Normalization 14
Table 1. Mean percent correct and mean RT (plus standard error) for same and different chord trials in Experiment I forsingle versus mixed instrument conditions. Results for different chord trials are further partitioned by the number of noteswhich differ between compared chords.
SINGLE INSTRUMENT MIXED INSTRUMENTChords Accuracy RT in Cris Acufrc RT in msSAME 982 (0.9) 1069 (36) 60.9 (.6) 1175 (34)DIFTERENT 88.5 (33) 1210 (50) 66.6 (.4) 1204 (55)
1-note: 80.7 (3.1) 1146 (30) 62.3 (20) 1199 (23)2-note: 95.3 (1.6) 1113 (37) 70.1 (33) 1199 (32)1•3nitf 98.0 (1.2) 1060 (47) 743 (3.5) 1230 (55)
Table 2. d' and RT for each instrument combination across all AX chord disaimination trials (independent of nowe differentialfor different trials) in Experiment 1. including overall means and standard errors.
Instrument Effects on d' and RT (Experiment 1)Instrument Instrument RT RTA Chord X Chord d' (Same Chord) (Diff.Chord)
Piano Piano 4.25 1021 1087Brass 1.16 1172 1322Woodwind 0.60 1433 1270String 1.55 1190 1299Harpsichord 0.95 1238 1220
Brass Piano 1.81 1173 1243Brass 4.64 1088 1155Woodwind 0.99 1472 1229String 1.53 1185 12281 larpsichord 1.11 1243 1172
Woodwind Piano 0.67 1193 1207Brass 0.50 1255 1301Woodwind 4.06 1090 1143String 0.47 1318 1325Hlarpsichord 1.04 1200 1333
Strng Piano 1.44 1104 1214Brass 1.46 1238 1279Woodwind 0.69 1401 1263String 4.37 1129 1147Harpsichord 1.13 1328 1212
Itarpsichord Piano 1.26 1198 1181Brass 0.60 1284 1365
-" Woodwind 0.89 1202 1334String 0.87 1279 1345
Slarmichord 3.81 1040. 1070Mean 1.67 1219 1237s.c. 0.29 54 59
Ia
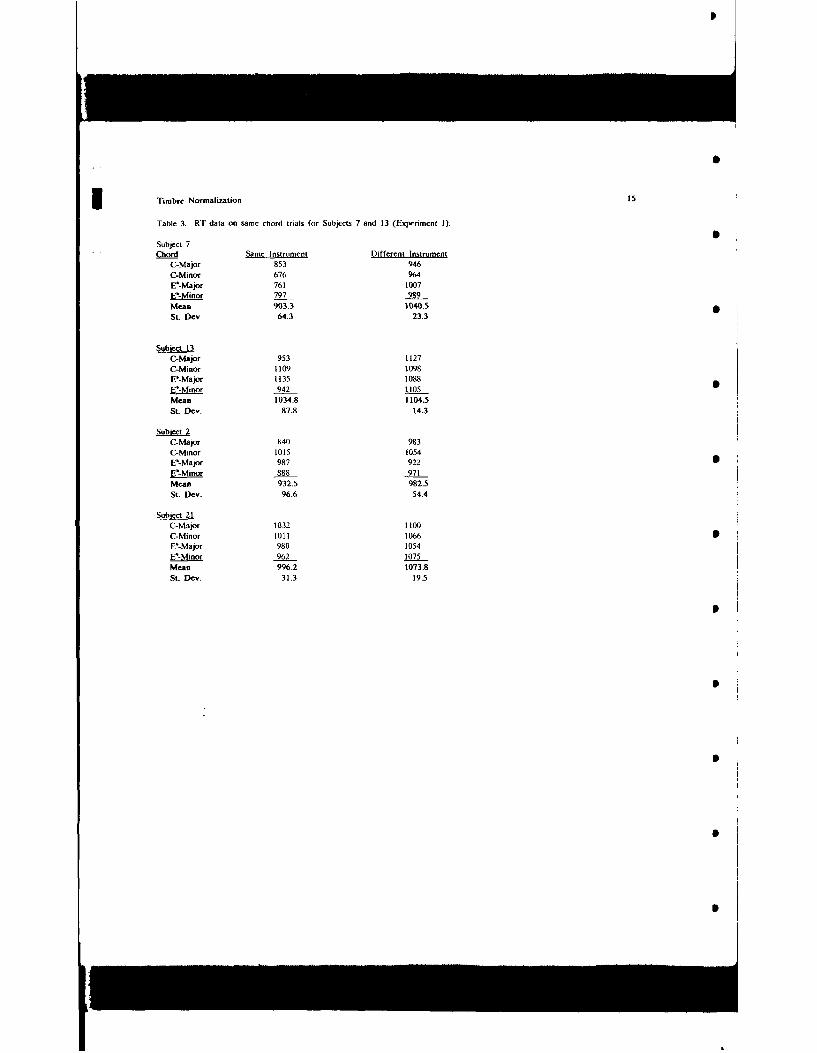
Timbre Normalization
Table 3. RT data on same chord trials for Subjects 7 and 13 (Experiment 1).
Subject 7Chord Same Instrument Different Instrument
C-Major 853 946C-Minor 676 964E-Major 761 1007E-Minor 797 989
Mean 903.3 10405
St Dev 64.3 23.3
Subiccl 13C-Major 953 1127C-Minor 1109 1098E
5Major 1135 1088
E-Minor 942 1105Mean 1034.8 1104.5St. Dcv. 87.8 14-3
Subiect 2C-Major 840 983C-Minor 1015 1054E-Major 987 922E.Min 888 971Mean 932.5 982.5
SL Dev. 96-6 54.4
Subiect 21C-Major 1032 1100C-Minor 1011 1066E
5-Major 980 1054
EMin 962 1075Mean 996.2 1073.8St. Dev. 31.3 19.5
Lp
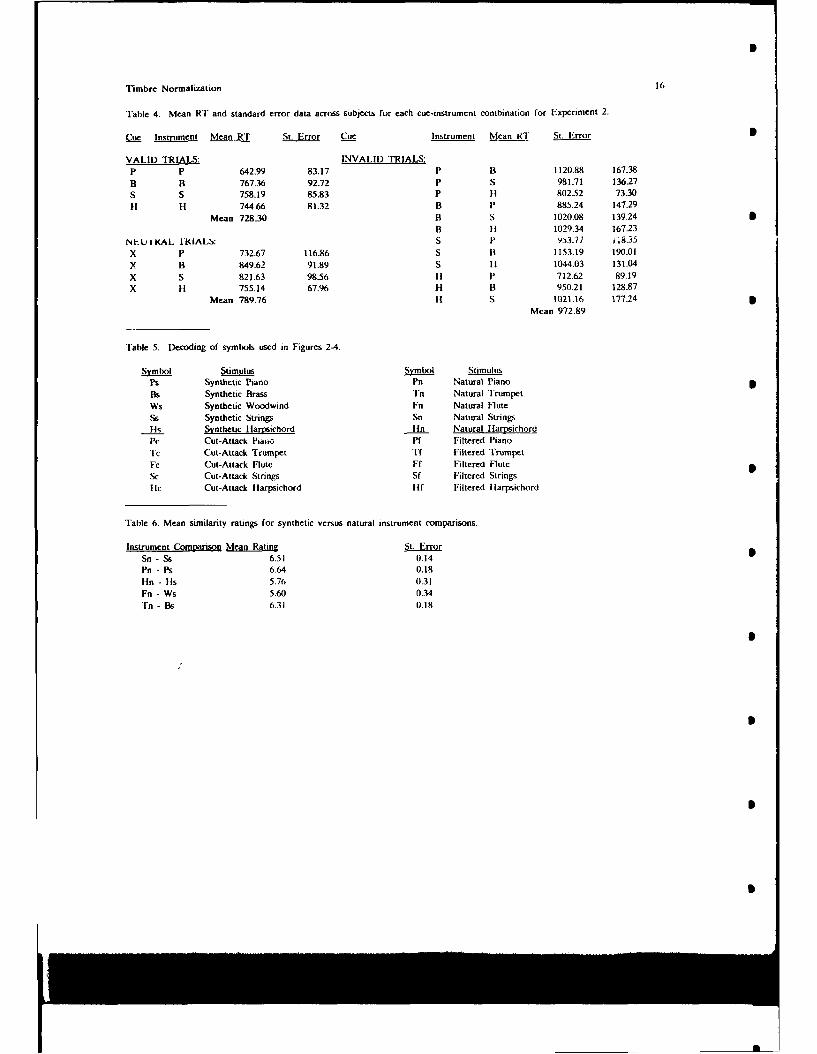
Timbre Normalization 16
Table 4. Mean RT and standard error data across subjects for each cue-instrument combination for Experiment 2.
Cue Instrument Mean RT St. Error Cue Instrument Mean RT St. Error S
VALID TRIALS: INVALID TRIALS:
p P 642.99 83.17 P B 1120.88 167-38
B B 767.36 92.72 p S 981.71 136.27
S S 758.19 85.83 P if 802.52 73.30
t IT 744.66 81.32 B P 885.24 147.29
Mean 728.30 B S 1020.08 139.24 SB II 1029.34 16723
NEU iRAL IR(IALLS: S P 933.77 i 18.35
X P 732.67 116.86 S B 1153.19 190.01
X B 849.62 91.89 S ii 1044.03 131.04
X S 821.63 98.56 If P 712.62 89.19X i1 755.14 67.96 H B 950.21 128.87
Mean 789.76 IT S 1021.16 177.24 5Mean 972.89
Table 5. Decoding of symbols used in Figures 2-4.
Symbol Stimulus Symbol StimulusPs Synthetic Piano Pn Natural Piano SBs Synthetic Brass Tn Natural TrumpetWs Synthetic Woodwind Fn Natural FluteSs Synthetic Strings Sn Natural StringsIts Synthetic Hlarpsichord lin Natural lHarpsichordPc Cut-Attack Piano Pf Filtered PianoTc Cut-Attack Trumpet Tf Filtered TrumpetFc Cut-Attack Flute Ff Filtered FluteSc Cut-Attack Strings Sf Filtered Stringslic Cut-Attack Harpsichord HIf Filtered Ilarpsichord
Table 6. Mean similarity ratings for synthetic versus natural instrument comparisons.
Instrument Comparison Mean Ratin St. ErrorSn - Ss 6.51 0.14Pn - Ps 6.64 0.18Tin - lls 5.76 0.31Fn - Ws 5.60 0.34
'Tn - Bs 6.31 0.18
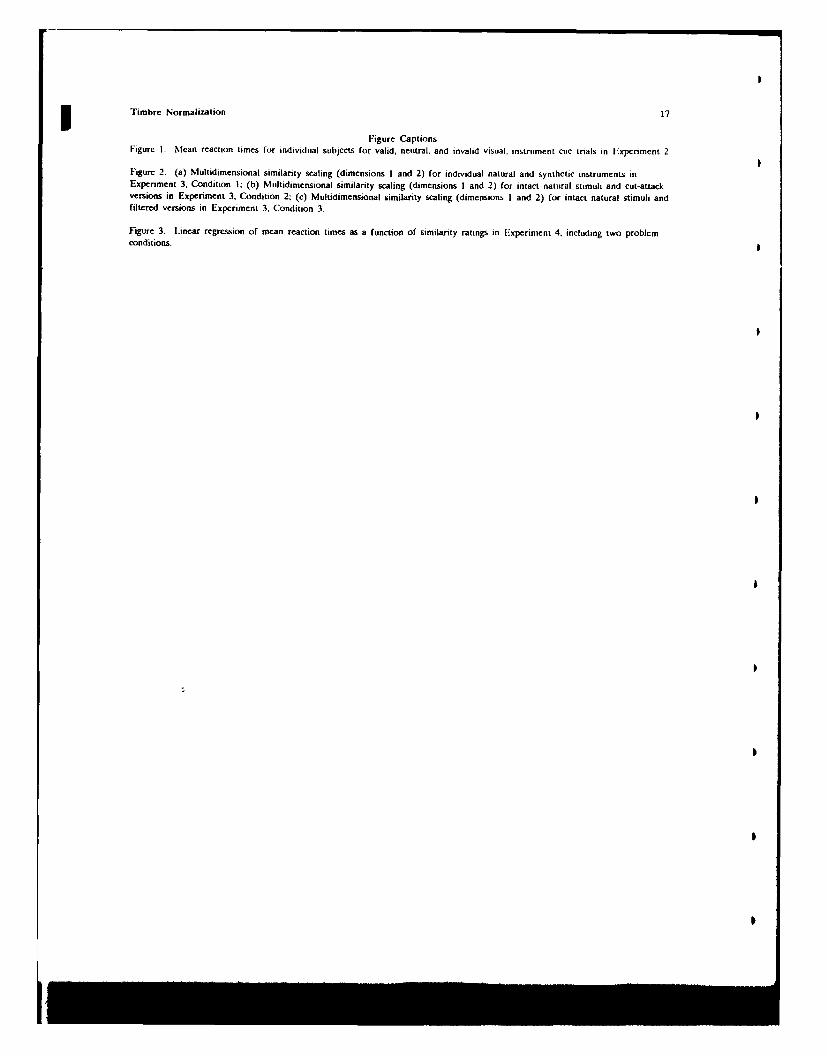
Timbre Normalization 17
Figure CaptionsFigure 1. Mean reaction times for individual subjects for valid, neutral, and invalid visual. instrument cue trials in Experiment 2.
Figure 2 (a) Multidimensional similarity scaling (dimensions I and 2) for individual natural and synthetic instruments inExperiment 3. Condition 1; (b) Multidimensional similarity scaling (dimensions I and 2) for intact natural stimuli and cut-attackversions in Experiment 3, Condition 2: (c) Multidimensional similarity scaling (dimensions 1 and 2) for intact natural stimuli andfiltered versions in Experiment 3. Condition 3.
Figure 3. Linear regression of mean reaction times as a function of similarity ratings in Experiment 4, including two problemconditions.
iI
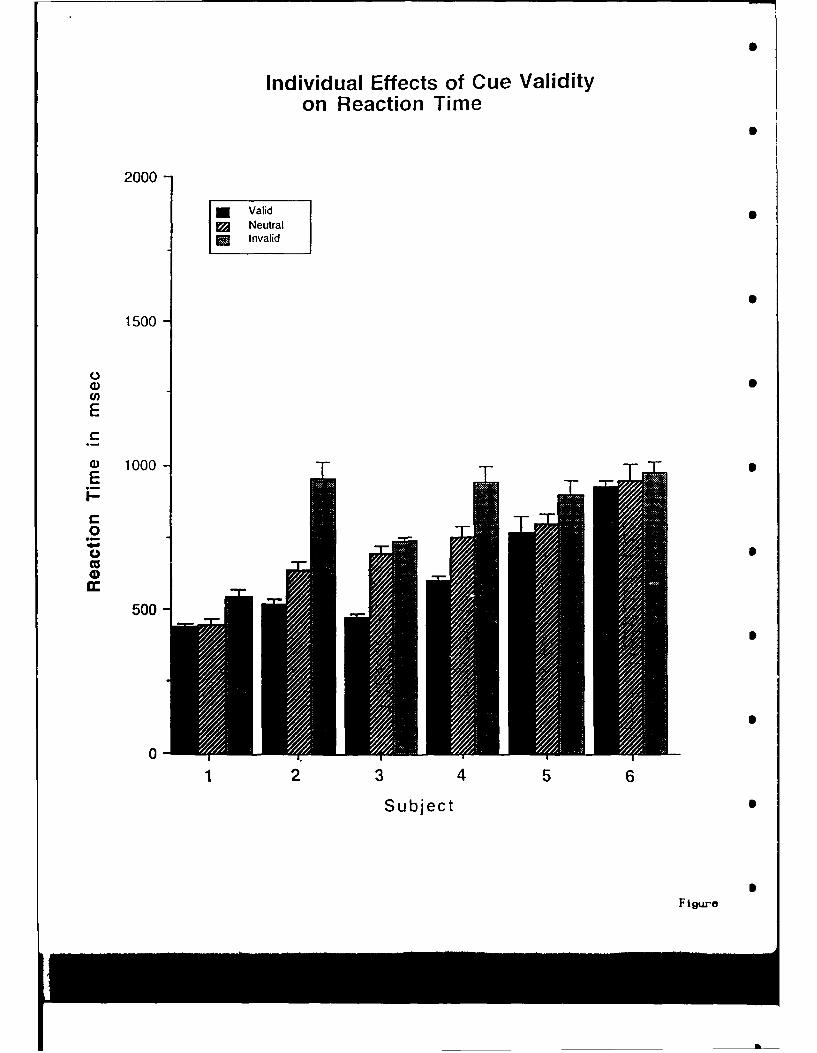
Individual Effects of Cue Validityon Reaction Time
2000
* Valid[] Neutral*] Invalid
1500
E
0 1000-E
0o S
cc4)IM
500
01 2 3 4 5 6
Subject
Figure
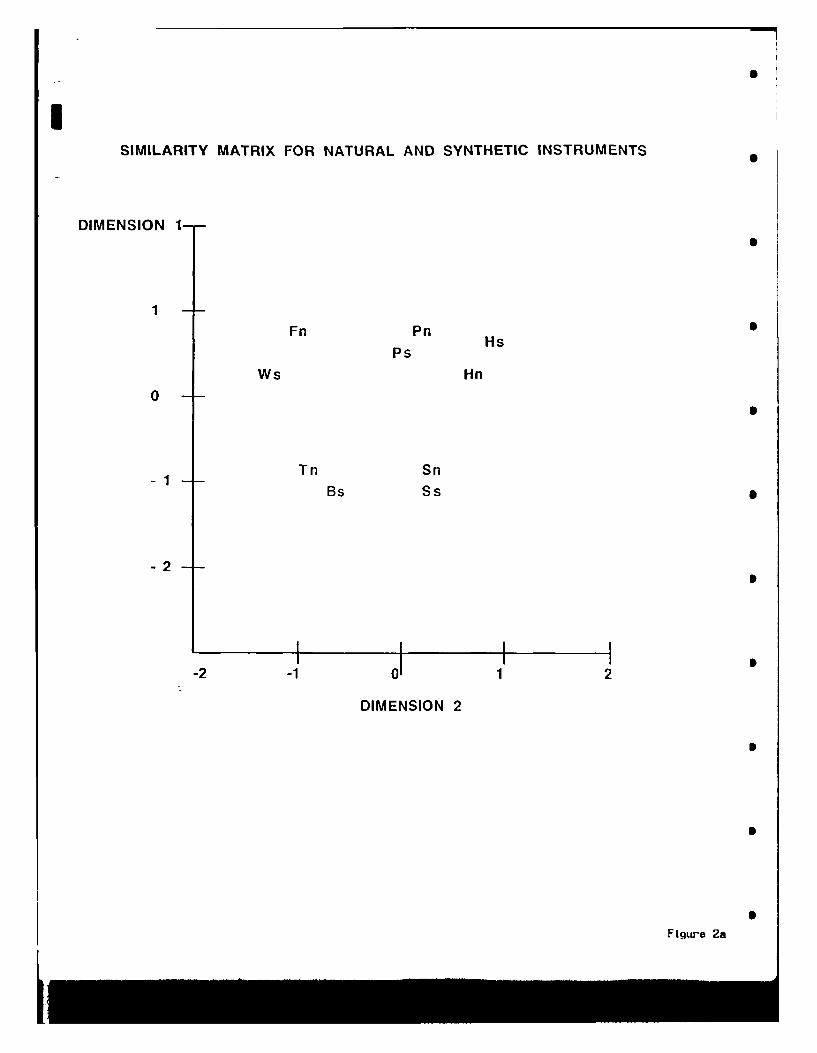
I.
SIMILARITY MATRIX FOR NATURAL AND SYNTHETIC INSTRUMENTS
DIMENSION 1--
1 -
Fn Pn HHsPs
Ws Hn
0
Tn Sn-1
Bs Ss
-2
I I ii I.-2 -1 0 1 2
DIMENSION 2
Figure 2a
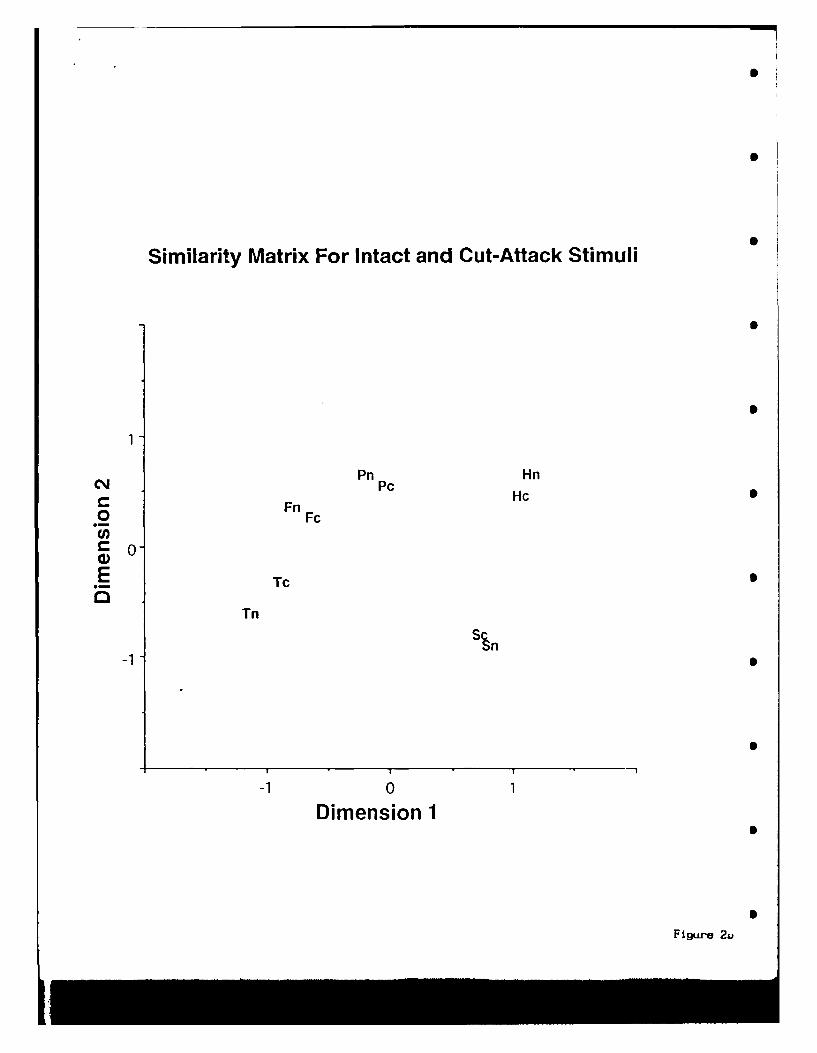
Similarity Matrix For Intact and Cut-Attack Stimuli
Pn Hn
C F Pc Hc S
"0 FcCo0)
E Tc
Tn
-1
S&S
-I 0 1
Dimension 1
Figure 2u
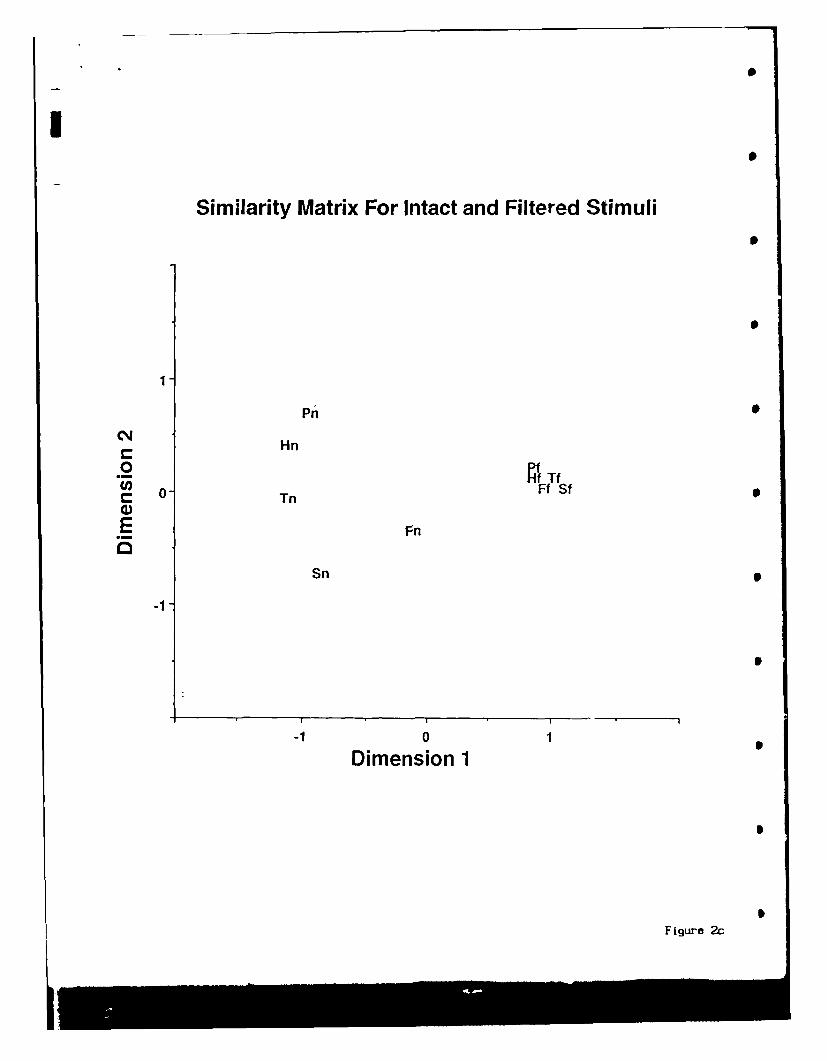
I
Similarity Matrix For Intact and Filtered Stimuli
1I
Pnr
C*41Cq Hn
00-T Ff Sf•• Tn
Sn
-1
I I I
-1 01
Dimension 1
Figure 2c
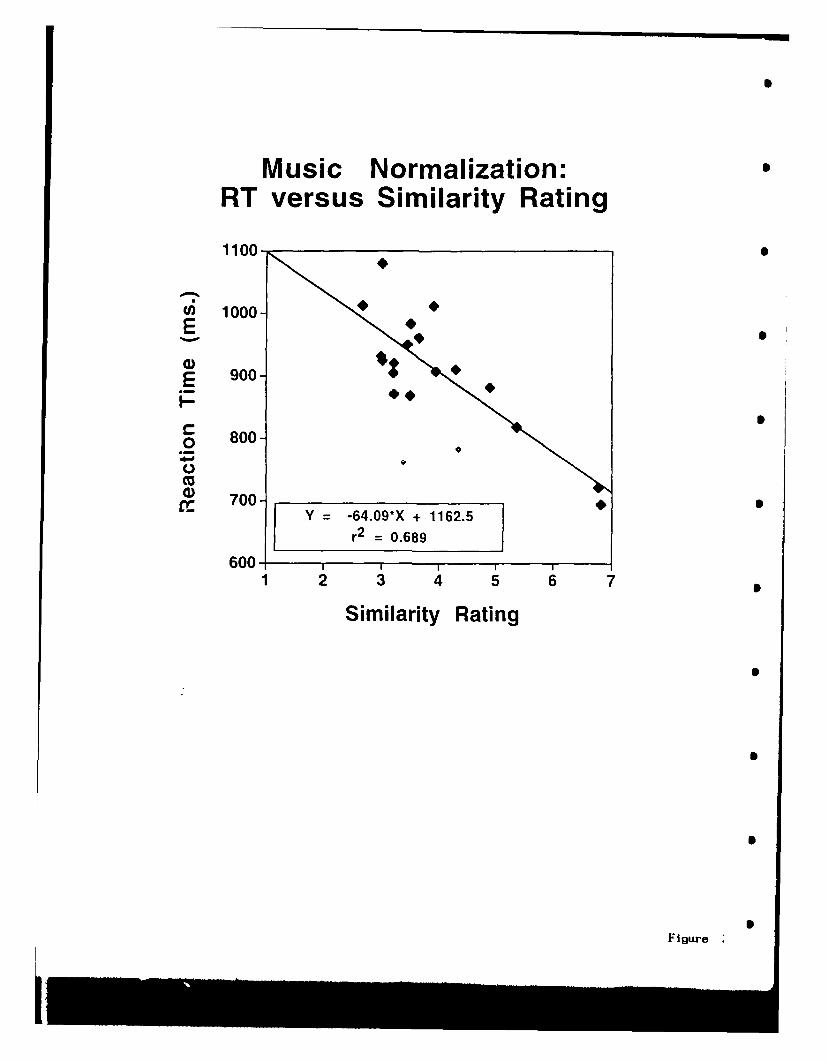
Music Normalization:RT versus Similarity Rating
1100-
W 1000-.E.
E 900°
PS
0 800-
'C" 700- IcY 64.O9*X + 1162.5
70 =r 2 0.689
600 , ,1 2 3 4 5 6 7
Similarity Rating
F
Figure"
S
Effects of Stimulus Complexity on thcPerceptual Organization of Musical Tones
Michael D. Hall and Richard E. PastoreCenter for Cognitive and Psycholinguistic Sciences
State University of New York at BinghamtonBinghamton, NY 13902-6000
Abstract
Duplex perception (DP) occurs when one stimulus or stimulus component contributes simultaneously to two distinctpercepts. Two AX discrimination experiments were conducted to quantitatively evaluate the effects of one factor, stimulus
complexity (by manipulating the number of frequency components common to major and minor chords), which would bepredicted by Gestalt principles of perceptual organization to affect incidence of fusion in DP stimuli. Experiment Idemonstrated frequent fusion of bases with a contralateral distinguishing tone. Data from both experiments first provide someindirect evidence against the claim made by some supporters of speech modularity that musical DP research is really
demonstrating triplex perception (i.e.. perception of base, tone. and chord). The experiments further revealed that whenmajor/minor chords are presented contralateral to a different distinguishing tone, chord ear perception was altered. Thesealterations, which included perceptual migrations and fusion of contralateral distinguishing tones, did not depend on stimulusposition within a trial and was a direct function of stimulus complexity. The results are discussed in terms of the relationshipbetween stimulus complexity and figural goodness, and are evaluated as possible examples of stimulus dominance and illusoryfeature conjunctions.
One major goal of auditory perception research is to identify general principles of perceptual organization. This goalfrequently has taken the form of establishing the stimulus variables critical to the perception of complex stimuli. Much of thisliterature has concentrated on laboratory phenomena involving stimuli which consistently give rise to ambiguous or illusorypercepts [e.g., the octave illusion (Deutsch. 1974)1. One such laboratory phenomenon, duplex perception (DP). typically has been Sdemonstrated with speech stimuli. In DP one stimulus, or stimulus component. simultaneously contributes to two distinctpercepts. DP is claimed to represent a violation of the rule of disjoint allocation (derived from the Gestalt principle ofbelongingness), which states that one stimulus/component can or'y contribute to one perceptual stream (Bregman. 1987; Mattingly& Liberman. 1989; but see Bregman, 1990).
The following experiments with musical stimuli evaluated one factor which might affect the incidence of fusion in DP.In addition to addressing an existing skepticism about the validity of musical DP. the results of the experiments are consistentwith the illusory conjunction of auditory features, and thus raise questions about the role of attention in tonal stimulusprocessing. Before reviewing the current experiments, a brief history of DP research will be presented. including a briefevaluation of theoretical issues OP has been used to address.DP Phenomena and the Claim for a Phonetic Module
DP was first demonstrated by physically splitting components of synthetic versions of /da/ and /ga/ syllables whichdiffer in place of articulation (Rand. 1974). A common form of DP for speech (DPS) entails the (dichotic) presentation of thethird formant (F3) transition and the remainder of the syllable (or base) to separate ears (e.g., Mann, Madden, Russell, andLiberman, 1981). The isolated "3-transitions are perceived as chuips. The F3-transitions also distinguish between /da/ and /ga/. •with bases presented in isolation often only heard as somewhat ambiguous or neutral syllables (i.e., usually not consistently
labelled as either /da/ or /ga/). When presented dichotically at normal listening levels, the result is two simultaneousperceptions, with the transition playing a critical role in each: (1) perception of the transition as an isolated chirp in one ear.and (2) perception of a complete /da/ or /ga/ syllable (base plus transition) in the base ear.
DPS is cited extensively by Liberman and colleagues (e.g., Liberman. Isenberg. and Rakerd. 1981; Liberman andNMattingly. 1985. 1989a. b: Whalen and Liberman. 1987) as evidence for the existence of a specialized, biologically significant.phonetic module. This argument presumes that l)PS percepts are the result of two. separate. distinct types of processingperformed on the transition. Chirp perception reflects the common nonspeech operation of a general. open, auditory modulewhere perceptyon corresponds relatively directly to the physical properties of the signal (pitch. loudness, and timbre). Processingby the closed speech module instead results in the perception of a CV' syllabic where stimulus and perception do not directlycoincide except in terms of phonetically relevant stimulus properties.
D)P replications with analogous nonspeech stimuli, including demonstrations using musical tones (Collins. 1985; Hall andtPastore. 1992: Pastore. Schmuckler. Rosenblum. and Szezesiul, 1983) and door slamming sounds (Fowler and Rosenblum, 1990).have questioned DP-based conclusions for modularity, minimally demonstrating the operation of other auditory modules in DPwhich mirror processing by the speech module. We believe that such nonspeech onditions reveal that D)P findings to date canbe addressed equally well from modular and general auditory perspectives. Musical D)P was first obtained by Pastore. et al.(I19883. and later replicated, with reduced inodence, by Collins. 1995). A tone distinguishing a major from minor chord (l or F".which is presumed to play a role analogous to the transition in l)PS) was dichotically presented with the remainder of the chord.the (ortespoudlng fifth interval (the C-(i base). Many musically trained suijccts rehahly identufied hearing both the is.olated1unc in the appropriate ear and a complete, fused, major or minor chord in the Itisc car As with isolated transitions in I)1'S.
p,-iidit Iine,. w ere la lIlllcd Ihss aiciiratlev than chords il.prccveld by integreation I[ ionc. and N.c I hiis. the muisical base
Pcrceptual Organization 2
seems to act as a harmonic frame of reference upon which judgments on the distinguishing tone can more easily lIc made.
Findings of musical D)P have been criticized by phonetic modularity supporters as not having ruled out triplex, rather
than duplex, perception (Mattingly and Liberman, 1988). Triplex perception (TP) presumes that subjects accurately hear boththe distinguishing tone and base at their respective physical locations, and additionally perceive the integration of these stimuli as
a centrally localized chord. However, we are not aware of any empirical evidence which suggests that TP exists for any stimuli.
In fact, both musical and speech DPI subjects generally report hearing stimuli at only two locations. As a secondary issue, the
present experiments investigate the likelihood of TI with musical stimuli.Gestalt Notions and DP
If both speech and nonspeech DP stimuli are processed in a singular manner, then speech and nonspeech DP need not
necessarily reflect the operation of distinct modules. For example, according to Gestalt terminology (e.g.. Wertheimer, 1958).
syllables and chords both should represent "good' (simple, organized, unified perceptions of stimuli consisting of severalcomponents that frequently occur together), 'strong" (resisting analysis into separate components) figures. These good. strong
figures are thus more easily perceived with less information (e.g.. stimulus energy or impoverished components) than is required
to separately perceive components critical to their perception (e.g.. transitions or chord-distinguishing tones), resulting in "closure"
(see below) and thus the apparent precedence-taking DP findings.Bregman (1987. 1990) has suggested that both speech and nonspeech DP arise when there is sufficient conflict between
cues used to segregate and to integrate two stimuli. Differential localization or quality is a major cue for segregating base and
distinguishing component which could compete against integration cues which reflect either Gestalt principles of perceptual
organization (e.g.. good continuation and frequency/temporal proximity) or stimulus-specific, schema-based properties. Fusion toperceive chords or syllables then would presumably result from (1) the synchronous presentation of components, (2) the end
frequency of the transition corresponding to the initial steady state frequency in the base in DPS. and (3) the tone and fifth
maintaining simple integer frequency ratios in musical DP. Motivated by such an analysis. Ciocca and Bregman (1989) have
demonstrated the weakening of DP for speech syllables when the contralateral distinguishing component (transition) is part of acoherent stream reflecting the principles of similarity and good continuation. The Gestalt conceptualization should not onlyencompass both speech and nonspeech auditory examples, but also has been suggested by Bregman as generalizing acrossmodalities.
Motivation for Current ResearchDP research cannot at present (and probably can never) provide unequivocal evidence in support of a postulated
phonetic (and/or musical) module. In focusing on modularity, previous DP research has often overlooked critical perceptual
issues which the DP paradigm is well suited to address. Perception of stimuli used in studies of DP can provide a uniqueopportunity to evaluate the contribution of specific variables to auditory perceptual organization. by (1) revealing the conditionsnecessary for perceptual integration. (2) evaluating the relative saliency of organizational cues, and (3) specifying the nature of
attentional and perceptual limits of the auditory system.The strength of general perceptual (e.g.. Gestalt) explanations of processes underlying D1P can be evaluated by
revealing the various conditions necessary for frequent fusion with both speech and nonspeech stimuli. In so doing, we will gaina better understanding of (1) the critical cues for integration and segregation of stimuli, and (2) how these cues operate in the
presence of other consistent or conflicting sources of information for grouping stimuli. After the separate conditions for fusion
in speech and nonspeech DP are established, analogous speech and nonspeech conditions might be investigated in a more realistic
attempt to resolve the phonetic modularity issue for DP research. Then. if analogous stimuli always provide similar patterns ofperception, DP might reflect the operation of general auditory principles. If. however, significantly different perceptual
tendencies are obtained for analogous speech and nonspeech stimuli, the natie of distinct modes of processing could begin to be
established.Some stimulus variables critical to the incidence of D1'S have been determined. Characterizing DP as a form of
spectral/ temporal fusion, Cutting (1976) evaluated the effects of several variables on fusion of speech stimuli. Fusion in IRSwas relatively insensitive to changes in intensity (also see Whalen & Liberman. 1987) and frequency. but diminished with
increasing asynchrony of component stimuli. Similar evaluations of possibly critical stimulus variables for musical D)P have been
lacking.' [he present experiments represent an initia: attempt to evaluate stimulus factors which may be critical to fusion inmusical D)P. .Base complexity (defined as the number of invariant iase components shared between at least two labellingcategories) was selected as one variable which could affect the incidence of fusion For the present purpxoscs. increasing musical
base complexity will lie defined as adding tones of different chroma to the original C-6i (fifth) base.Gienerally, western music listeners have not been presented the base in isolation. The lbase also cannot be resolved as
a major or minor chord. which represent more commonly heard chord structures. Therefore. buecause of the unusual nature ofthe base. it is argued that the bases used in the current experiments all represent open forms. Manipulating the complexity ofthe base should alter the figural goodness of the chord resulting from the fusion of distinguishing tone and base (see below)
As a result, we will use the term "base complexity" not only to describe our dichotuc stimulus manipulation. hut also to refer toalterations in stimulus (chord) complexity
l.a.%c complexity represents one factor which long-standing (icstali principles of percp:uial organi/aitin would prehict to
influnrce the rate of perceptual integration. 'he ("estalt principle of closure is defneid as the perceptual tendency to complete(lost ) physi(ally incomplete (op, n) forms, resulting in the perception of g(xil strong figures instead if pooir. weak figures
'rml'nf n(' it u-mini withun a; rlisi~l fo rm are perceived as belonging ii d more ihlikle represelxtiwo, u than if spr•iratcly p.crcviscd SN ItIIi It'it4.') Amiutg dliai thel lu lu in IDl' is a relativcly open f(,i m strniihlis pi-,•erh's wishh inciun.uli' e iiilIiess inid
.i~lh i, i m r , ii- i run- , ll rd r ldd Iml regardvil ,is in•rcasxg I Th ut-ul, n, .i I l•us,,-'- ii- rj•ipon fhe luisii i I ;l'
!S
Perceptual Organization 3
and base. In other words, dichotic configurations which are more readily fused and thus closed (or less open) could be assumedto represent better articulated, more stable forms. Our major interest in determining the likelihood of any given perceptualorganization (e.g.. fusion) as a function of complexity was that such a determination may reveal the nature of the relationshipbetween stimulus complexity and figural goodness for the current musical stimuli.
Does increasming base complexity of musical stimuli result in more open or more closed stimuli? The Gestalt principlesof good continuation and (both frequency and temporal) proximity suggest that chords with many tones may represent stronger,more figurally good forms than chords consisting of fewer tones (Wertheimer. 1958). Given the perceptual tendency to perceivegood. strong figures, distinguishing tones then should be more easily integrated with bases of greater complexity. The tendencyto fuse a tone and base in the base ear then should increase as the number of tones in the base increases.
Alternatively, because the frequency ratios between component tones cease to be in simple integer ratios (Dowling andHlarwood, 1986). increasing the number of tones decreases the overall consonance of chords. As a consequence, increasingcomplexity instead may decrease figural goodness for base stimuli and bases fused with distinguishing tones. Thus, fusion oftone and base may become less likely with the addition of more tones to the base. Therefore, we cannot make explicitpredictions regarding the probability of fusion with varied base complexity, but rather leave this issue as an important perceptualquestion for which the present research can provide an empirical answer.2
EXPERIMENT 1: Establishing Effects of Base ComplexityExperiment I estimated the probability of many distinct perceptual organizations as a function of changes in stimulus
(base) complexity. These organizations included not only the probability of fusion and TP, but also perceptual configurationscommon to other (speech and visual) stimuli.Method
Some of the current methods were motivated by DP findings. Although used in previous musical DP demonstrations(Pastore, et al., 1983; Collins, 1985). major/minor chord labelling performance is not equally good across subjects, even when thesubjects are musicians. This lack of consistent performance across subjects complicates the understanding of whether or notfusion is in evidence for some subjects. Most people without extensive musical backgrounds, however, can reliably perceivedifferences between major and minor chords, even if some of these individuals cannot consistently apply appropriate labels toeach chord. Since ability to discriminate chords produced solely by fusion is strong evidence for fusion, an AX procedure wasused.
ud Subets. All subjects had studied at least one musical instrument (although not always an instrument capable ofproducing chords) and thus, in theory, understood the distinction between major and minor chords. Ilowever. because weaccurately expected that musical expertise of possible subjects would vary widely, an # 2orio performance criterion of better thanchance performance for binaural chord discrimination was adopted in both experiments to insure that all subjects had a workingunderstanding of the perceptual difference between major and minor chords. Since failure to accurately discriminate binauralchords made evaluation of dichotic perceptual organization impossible, we discarded the data from any subject who did not meetthe a prior criterion. In Experiment 1, 11 SUNY-Binghamton undergraduates who met the a gorio lperformance criterionparticipated as subjects in partial fulfillment of course requirements.' The experiment lasted approximately 45 minutes.
Materials. Stimuli were generated from digitally sampled piano tones (Yamaha AWM Sound Expander EMT-10),recorded on cassette tape, and digitized (12-bit, 30 kiz sample rate) for on-line computer presentations (with 4 kltz antialiasingfilter). All tones were of equal length (1424 ms), and were from an equi-tempered interval scale with the following tone chromaand frequency in Ilz: C (266). IE (316), E (335). G (398). A (447), B (501), and D (597). Tones then were digitally mixed toproduce the various base complexes and chords. All stimuli were presented over TDII-49 headphones at 75 dB SPI. peakamplitude.
E and E' tones always distinguished chords as major (e.g. C-E-G) or minor (C-E5
-G). Chords were additionallydistinguished by the number of tones (2. 3. or 4) constituting the base in dichotic trials: the 2-. 3-. and 4-tone bases wereC-(i. C-G-A, and C-G-D-I). respectively.
IProcedure: Binaural l)iscrimination. Upon consent, subjects ran a block of 80 randomized binaural same-different(AX) discrimination trials intended as a baseline measure of subject performance for subsequent dichotic trials derived from thesame stimui.'. Both binaural and dichotic trials consisted of the A (standard) and X (comparison) stimuli separated by a 1500 msISI. and ended with a 2 s response interval.
Each of 6 possible chords was presented as the A stimulus on 10 trials. The chords were: U-major (C-F-G), C-minor(C-I--G). C-major 6th (C-iK-(i-A). C-minor 6th (C-l.'-Gi-A). (C-major 9th ((-1-ti-t-I)). and C-mrinor 9th (C-1-
5-(i-lt-l). Each A
stimulus (e.g.. a major or minor C 6th chord) was paired equally often with itself and its alternative (minor or major 6th) chordas X stimuli. The remaining (20) trials were designed to insure that subjects also could reliably distinguish isolated I: and E,tones, presenting each tone as the A and the X stimulus with an independent probalility of 0.5. These binaural conditions alsoprovided the empirical qualification criterion for subjects through a direct quantification of "ame"/"different" response tendenciesfor each condition and level of base complexity. 'Ihese results later will be used to correct estimated perceptual probabilities forresponse tendenciesI)uchotlic D)iscrimination: Stimuli After a short break, subjects began a blocxk of 240i dlchotlc trials. Sublects were instructed toliltl each AX stimulus pair as "me or different only with rcspcct to the car in which Iasies or complete chords were presented(henrceforth. the target car) anil it ignore the information presented to the oither car (he neforth. the contralateral car) I argercar asi•nrni remained const~ant fioir a given siitujetli b as coilrntcrlualaniccd atcroS siubujects•
a, I sinfiaru.eI . the (fiiht i stiull h i h nc_, with 1 susulblc npuiiscriutuu ii Wr(eiiath l uurgmiii/,,liin. t (i . pcrl'ej iiiit.

Perceptual Organization
differing from the physical configuration of tones) for each stimulus used. In summarizing the conditions throughout tibith tables
and text, only 2-tone base components will be presented. Stimuli for 3- and 4-tone bases can be obtained by respectively adding
A and B-D tones to the C-G base. Target ear (i.e.) tones will always be displayed to the left of double vertical lines, with 5contralateral car (c.e.) tones presented to the right.
Insert Trable 1
The nonveridical percepts critical to our original hypotheses are instances of fusion (displayed in column 2 of Table I).
Fusion arises when subjects integrate a contralateral distinguishing tone with target car information to perceive a single, unifiedpercept in the target ear. For demonstration purposes, fusions are displayed as instances of DP, with the simultaneous
perception of the distinguishing tone as a separate event. If chords with many tones represent better-articulated figures, thenfusion should occur more frequently as base complexity increases when presented the base and a distinguishing tone to
contralateral cars. If increasing complexity instead decreases figural goodness, then fusion of tone and base should decrease with
increasing complexity. When two distinguishing tones are presented dichotically (one physically mixed with the base), fusion
should result in the perception of a chord (consisting of both E and Eb tones) that is neither major nor minor, which should be
an unstable (dissonant) figure. Thus, such fusiorn should not occur frequently. Additionally, if increasing complexity increases
figural goodness. fusion of contralateral distinguishing tones should decrease as a function of increasing complexity. Conversely,
if increasing complexity decreases figural goodness, fusion of distinguishing tones should increase as a function of increasing
complexity.Another plausible, nonveridical percept (shown in column 3 of Table 1) is *migration'. Migrations were proposed to
occur only when subjects were contralaterally presented different chord-distinguishing tones (E and E', one of which was mixed
with the base). In these instances, both distinguishing tones would be perceived, but contralateral to their physical locations.While intuitively improbable, migrations, like fusions, maintain the unified perception of a figurally strong chord in the target earand a contralateral chord-distinguishing tone. Such invalid assignment of feature locations has been demonstrated in the visual
attention literature (e.g.. Treisman. 1990), and should be likely to occur in audition; we will later describe how notions from the 5visual domain might apply to musical stimuli.
Column 4 of Table I depicts another nonveridical percept which has been demonstrated with speech stimuli. Repp
(1978a, b, and c) identified which of several dichotic pairs of CV syllables fused perfectly, giving rise to the perception of asingle syllable. Labelling of these stimuli often exhibited patterns of stimulus dominance, a '. . . tendency of one stimulus in aspecific dichotic pair to receive more oorrect responses than the other stimulus, regardless of the ear in which it occurs (p. 133)."
A dominant stimulus element therefore contributes to perception regardless of where it is presented.Stimulus dominance could occur only when two dichotic distinguishing tones were simultaneously presented, one of
which was physically mixed with the base (e.g., C-E-G 11 Es). Dominance would result in the perception of the isolated
distinguishing tone in both ears, preventing perception of the other distinguishing tone (i.e., C-E'-G 0 E'). While responses for
any singular condition cannot distinguish between migration or stimulus dominance, comparisons across conditions (addressed inthe general discussion) will allow an evaluation of the likelihood of both percepts.
Possible triplex percepts are shown in column 5 of Table 1. Due to a lack of any evidence for TI, TI was
hypothesized not to occur. If TP occurs in a manner consistent wi?,i the postulations of Liberman and colleagues (e.g., Mattingly
and Liberman. 1989), subject responses should be equivalent to those given veridical target ear perception. If, on the otherhand, subjects ignore the instructions to respond on the basis of target ear perception, and, instead, are "distracted" to respond to
the triplex percept at a central. abstract position, then responses based on TP would be indistinguishable from instances offusion. Therefore, the incidence of TP cannot exceed the joint probability of veridical perception and distraction. Although it isimpossible to directly evaluate distraction to a postulated triplex percept, we did test for "distraction" to respond to contralateralear information in Experiment 2. If such distractions are rare, then responses reflecting an integration of tone and target earinformation (base or chord) would be more consistent with fusion than TP.
l)ichotic Conditions. All conditions were generated using the stimuli summarized in column I of Table 1, but withvarying levels of base complexity. The various conditions were designed to (I) assess subject tendencies to fuse both, one, or
neither (A. X,) stimuli as a function of component arrangements and levels of complexity, and (2) to minimize possible overallresponse biases. In each of four conditions 60 randomly mixed trials were presented. with 20 trials for each level of basecomplexity. Ten trials presented one configuration of distinguishing tone(s) and base; the other 10 trials substituted 1: for I"and vice versa.
A listing of dichotic conditions for both experiments, including responses expected for each possible perceptualorganization, is provided in Table 2. Only one configuration of distinguishing tones is listed; the alternative configuration can ie 5obtained iy substituting 1: for E' and vice versa. Conditions arc discussed in the order in which they appear in the table so
that the table may ie used as a reference throughout description of conditions and response predictions.
Insert Tabile 2
Ituch ron•itiuiOn was. dcsigned to evaluate the pcrieptual organl/Ation indicated by the conditioun lael. I[or example. ihc
I (I SI -1 1111f R ( itnution is an exclusiuc (X()R) condition for fusmon, where "different" rce.spnses wilt result from fuistion •
either the A ior X ,tirm i•iti. hut not thith All other percepts wiilit result in "same" responss• Since thr physucil conf-•n i•rilion
of thu .A .inI X y ", ih l crc d( lntit~i in titus (cinuiitil ",intic" rccspuons' were tuypuuthesu/eu toi prcdtimmuuuatu
iS
3 Perceptual Organization 5
"Mhe FLISl'-NI1•ITIIR Condition was generated by substituting the alternative distinguishing tonc in the X stimulus ofthe IUS--F.TIII<R Condition. Only by appropriately perceiving target ear information in both stimuli would subjects produce"same" responses, fusing either (or both) distinguishing tone(s) would instead result in nonequivalent percepts. Given thedemonstrated tendency to fuse these musical Stimuli (e.g,, Pastore, et al., 1983), high ratts of 'different" responses werehypothesized. If chords consisting of many tones represent better-articulated figures, we would predict an increased frequency of"different" responses with increasing base complexity. Conversely, if chords with many tones represent worly articulated figures,"different' responses should decrease with increasing base complexity.
The remaining conditions involved dichotic presentation of both distinguishing tones (one physically mixed with thebase), and thus allowed evaluation of migration or dominance. The FUSE-i Condition was designed to determine theprobability of fusing only the X stimulus. 'Same' responses only would be obtained when subjects appropriately perceived targetcar information in the A stimulus and fused the X stimulus (both resulting in the target ear perception of C-E-G in theexample). Due to the expected high rate of fusion of the X stimulus (similar to the FUSE-NEITHER stimuli above).predominantly *szme" responses were hypothesized. Because fusion of contralateral distinguishing tones (or TP) would result tnthe perception of a dissonant, unstable form, and migration would require mislocating two component tones, a low probability ofaltered target ear perception was expected for the A stimulus. Furthermore, if increasing complexity increases figural goodness"same" responses should increase as a function of increasing complexity (and, conversely, if increasing complexity decreasesgoodness same" responses should decrease).
Finally, the FUSE-BOTH Condition could reflect the likelihood of fusing contralateral distinguishing tones of bothstimuli to perceive figurally poor, weak chords (e.g., C-E"-E-G), which would result in "same" responses. As noted for theFUSE-1 Condition, neither fusion nor migration of these stimuli was expected. However, migration or dominance ofdistinguishing tones for either the A or X stimulus also would result in 'same" responses. Other perceptions would result in"different" responses, including the hypothesized veridical perception.Results and Discussion
Binaural (Baseline) Discrimination. Mean accuracy in terms of percent correct (with standard errors) on binauraldiscrimination trials is shown in the top panel of Table 3. All subjects discriminated isolated tones (E and E) with perfectaccuracy, and discriminated chords at high levels of accuracy. If we assume that dichotic fusion provides the same underlyingbasis for perception as presentation of physically mixed stimuli, then mean accuracy rates for binaural discrimination shouldprovide a baseline of chord discriminability for evaluating dichotic results.!
Chord discrimination results were analyzed in a 2 X 3 ANOVA, with chord (same and different trials) and complexity(number of tones) as the respective factors. The only significant effect was the chord X complexity interaction ([12,201=5.344,p=.0138). The nature of the interaction can be seen in the table of means. Accuracy slightly increased with increasingcomplexity for same chord trials (revealed by a nonsignificant simple main effect, F12201=1.477. p=2
5 2). However. accuracy
significantly decreased on dlifereui chord trials with increasing complexity (simple effect, F[2201 =4.045. p =.033). Thisinteraction suggests that with increasing chord complexity, there may be an increase in overall perceived similarity between majorand minor chords, with the processing of chord distinguishing tones becoming more difficult. Later, these binaural results werelater used to adjust mean performance on dichotic trials (below) to assess the probability of fusion in each condition.
Dichotic Discrimination: Overall. Mean percentage of 'same" responses for each dichotic condition and level of basecomplexity are shown in the lower panel of Table 3. An initial 4 X 3 ANOVA was conducted with dichotic condition and basecomplexity as respective factors. As expected, all effects were significant, including the mdiii effects of base complexity(F[2201=23.269. p<.0001) and condition (F133101=26.144, p<.0001). plus their interaction (F[16.601=7.96. p<.0 0
01). Effectswithin conditions are included below in the context of individually evaluating the perception of contralateral tone and base, aswell as contralateral tone and chord.
Insert Table 3
Because the combination of perceptual organizations leading to a response were different across conditions, it waspisustile to solve for the probability of particular organizations using a set of simultaneous probability equations based on dataacross condititins. Iherefore. where applicable, the dichotic means from Table 3 also were submitted to a series of probabilityformulae These formulae also used .he binaural chord discrimination results to adjust for the tendency to perceive chords moresimilarly with increasing complexity.
The formulae were based on a few reasonable simplifying assumptions, the validity of which was verificd for similarstimuli in an earlier musical DP study (Hall and Pastore, 1992). First. incidence of a given type of perceptual organization wasassumed not to vary for isolated E and E' distinguishing tones. Thus, results were collapsed with respect to distinguishing toneswithin each (stimulus and) condition. Second, since there is no basis for comparison at the time the A stimulus is presented.perception of the A stimulus should not depend on the nature of the X stimulus. ihuis. incidence of a given type of perceptualorganization was assumed to be equivalent across conditions for A stimuli of similar structure. Finally, for condutuons hasedsolely upon stimuli containing a contralateral distinguishing tone and base (i.e., "USE-l-lITIIHR and FtUSI-NIITIIER('ondiiuns). equal, independent probabilities of fusion were assumed for A and X stimuh. "hc results of prohahlility formulacfir Iv•th experiments are shown in Table 4. calculated individually for each type of stimulus and each level of base complexivt)criveisnis oi fornuilc are f-ind in the Appendix
Ft i i
Perceptual Organization
Insert Table 4
Perception of Contralateral Tone and Base. Simple effects of base complexity were not significant for the FUSE-EITHER and FUSE-NEITHER Conditions (F=.018, p<.9
0 0, and F=2.144, p<.143, respectively). As a reminder, the high
incidence of "same" responses op FUSE-EITHER trials could reflect either fusion or veridical perception of both A and Xstimuli, or both. The moderate rate of 'different* responses on FUSE-NEITHER trials was consistent with the fusion of toneand base in one or both stimuli.
Means from both conditions were submitted to probability formulae to estimate the incidence of fusion and veridicalperception of contralateral tone and base. The probability of fusing both stimuli in the FUSE-EITIIER and FUSE-NEITHERConditions (calculated using Appendix Eq. 3'), displayed in the first panel of Table 4, was moderately high, with a slightdecrease from 2- to 3-tone levels of base complexity. Assuming equal. independent probabilities for fusing A and X stimuli, weobtain tne probability of fusing either stimulus (see Table 4), which occurred at a substantial rate (pp=0.65 to 0.75).
Perception of Contralateral Tone and Chord. Significant simple effects of base complexity were obtained for theFUSE-I and FUSE-BOTH Conditions (F[2.201=12.891, p<.0001, and F=22.044, p<.00
01. respectively), such that *same"
respornses incrased with increasing base complexity. In the FUSE-I Condition the complexity effect was consistent with an
increased tendency to veridically perceive the A stimulus base car information while fusing tone and base in the X stimulus.The FUSE-BOTH Condition effect was consistent with an increased tendency to either fuse both A and X stimuli, or veridically 5perceive one stimulus with migration/dominance of the other stimulus.
The minimum rate of veridical target ear perception for the A stimulus (a contralateral tone and chord) in the FUSE-I and FUSE-BOTH Conditions was estimated (using Appendix Eq. 4) to increase as a function of increasing base complexity(top of second panel. Table 4). This also represents a minimum estimate for fusing contralateral tone and base in the Xstimulus of the FUSE-I Condition, which, as expected, is below the estimated rate of fusion for similar stimuli in the FUSE-EITHER and FUSE-NEITHER Conditions. Rather than make additional, potentially invalid assumptions to allow theestimation of a range of probabilities of potential fusion and migration/dominance of contralateral distinguishing tones in theFUSE-I and FUSE-BOTH Conditions, conditions designed to reflect the operation of a unique perceptual organization wereincluded in Experiment 2 to evaluate these probabilities. Clearly, however, the results of both FUSE-1 and FUSE-BOTHICG.ditions indicate the frequent nonveridical perception of contralateral distinguishing tones, the nature of which will be exploredin greater detail in Experiment 2.
Conclusions. A few conclusions can be drawn from the results of Experiment 1. First, subjects frequently fused baseswith a contralateral distinguishing tone. Due to the use of binaural chord discrimination results to correct for subject guessing,Experiment I is argued to provide a reliable quantification of the rate of fusion for musical DP stimuli. In addition, if TP Srather than fusion had given rise to the "different" responses obtained in the FUSE-NEITHER Condition, subjects must haveignored location in making their responses (i.e., must have responded to a chord percept at an abstract position between theirears). Therefore. . - we cannot eliminate this possibility, TP seems to be, at best, very unlikely. However, the tendency torespond based upon an inappropriate location will be evaluated in Experiment 2.
The simple effects of base complexity in the FUSE-I Condition could be attributable to (1) an increasing tendency toappropriately perceive target ear information in the A stimulus with increasing target ear complexity, and (2) a similarlyincreasing tendency to fuse distinguishing tone and base of the X stimulus in the target ear. "Altered target ear perception" inthe form of either migration, dominance, or fusion of contralateral distinguishing tones also was demonstrated in the FUSE-BOTHl Condition to change as a function of base complexity. Although migration and dominance were not expected perceptualconditions and thus were not directly evaluated in our initial focus on fusion, altered target ear perception in the FUSE-BOTHCondition frequently might have been due to either of these perceptual tendencies, and thus warranted further investigation inExperiment 2. These instances of altered target ear perception suggest parallels with visual attention research which hasinvestigated how people attend to and analyze stimulus features under varying degrees of stimulus complexity. These parallelswill t•e discused in the general discussion section.
EXPERIMENT 2: Investigating Mislocalization of Component TonesI xperiment 2 further investigated the unexpected effects of base complexity from the I:L SE-I and FIUSE-BOTll
(ondiions of Experiment I. No explicit empirical test existed in Expertment I to evaluate possible differences in altered target
car perception depending on stimulus position (A or X) within a trial. The results from the FLSI--I Condition suggest thattarget car perception of the X stimulus was more readily modified to match veridical perception of the A stimulus. Thus. the Astimulus may often serve as a perceptual template which alters schema-driven aspects of the perception of the X stimulus.Experiment 2. therefore, included conditions designed to separately assess the likelihood of a given perceptual organization(fusion. migration, or dominance) for A and X stimuli.
Eixperiment I also did not determine whether subjects fused contralateral distinguishing tones to perceive figurally bad.dlissonant chords: such perception only was originally assumed on theoretical grounds to be highly unlikely. In Experiment 2.additiinal figiurally pMir. dissonant binaural and dichotic conditions were inctuded in which ioth I and VI' distinguishing tones.crc presented irpiltcrally D)ichotic conditions involving one such stumulmu, enabled cstnimalionut (it tlhc pfilubbility of fusion for,litrrn,iu•vc stimul, involving dichotlec distinguishing tones (one (if which was physicallN mixcd with the hlic) Similarly, conditionswieFt flrui•de't it, det-rmine the probability of stimulus migratiton or dominance lhv pairinig slim•tih (o)liuaning ,onltralaictral tone
.w-! ,' h- .0h r n!nii lril niipur/minor chord I"inally. t, lKitcr addw%,s, th' inliek<0 )xn ilflu ''1 11' 11"17 1 xuiuc'iim uul 1.
Perreptual Organi.ation
conditions also were included to evaluate whether subjects were distracted in ,xpcriment I to respond to an inappropriatelocation.Method
Subiects. Musical history and performance criteria were the same as those of Experiment I.' The subjects were fiveSUNY-Binghamton undergraduate introductory psychology students who were participating in partial fulfillment of courserequirements. The first author served as a sixth subject
Materials. In addition to the distinguishing tones, bases, and chord stimuli of Experiment 1, dissonant chords weregenerated by physically mixing both distinguishing tones (E and E) with bases of varying complexity (C-G, C-G-A. or C-G-B-D)-
Procedure: Binaural Discrimination. In addition to the 80 AX binaural discrimination trials from Experiment 1, 45randomly distributed dissonant chords trials were included to evaluate subject ability to discriminate major or minor chords fromchords which included both distinguishing tones. Thirty of these trials consisted of I of the 6 major/minor chords fromExperiment I (e.g.. C-E-G-A. a C-major 6th chord) as the A stimulus, followed by a dissonant chord of similar complexity (C-Ei-E-G-A) as the X stimulus. Five repetitions of each AX combination were included. In the remaining 15 trials each of the 3dissonant chords served as both A and X stimuli (5 repetitions each).
Dichotic Discrimination Stimuli. Upon completion of the binaural discrInmination trials, and after a short break,subjects performed a block of 400 randomized dichotic discrimination trials. Target ear assignment was again counterbalancedacross subjects. Most stimuli were those of Experiment 1, constructed from dichotic combinations of one isolated distinguishingtone with either a base, or a chord determined to be major or minor by the inclusion of the alternative distinguishing tone.Bases and chords were of varied complexity. The remaining stimuli were monaural versions of the dissonant chords (of equallyvarying complexity) used in binaural discrimination; therefore, dissonant chords without simultaneous dichotic tones.
Possible perceptual organizations for each of these individual trial stimuli are again listed in Table 1. Each dichoticcondition was designed with the expectation that a particular perceptual organization would result in a unique pattern ofresponses across conditions. In this way. dichotic conditions could be used to evaluate the tendency toward particularorganizations. Only perceptual configurations of interest and corresponding responses will be discussed in the text. A completelisting of expected responses for all possible perceptual organizations and conditions (displayed for 2-tone bases and oneconfiguration of distinguishing tones) is additionally provided in Table 2. Derivations of these responses can be obtained usingTable I and the following description of dichotic conditions,
Dichotic Conditions. Sixty AX trials were randomly presented for each of 6 experimental dichotic conditions. Withineach experimental condition, 20 trials were presented at each level of complexity. Within each level of complexity, 10 trialsemployed one configuration of distinguishing tones for A and X stimuli (e.g., C-E-G I E'); the other 10 trials used the oppositeconfiguration (i.e., C-E-G It E). Two additional control conditions of 20 trials each were included to evaluate response bias; inthese trials there again was an equal probability (p = "05) for either configuration of distinguishing tones. To limit the numberof dichotic trials, control conditions only involved the simplest level of target ear complexity. We now review predictions forconditions in the order of which they appear in Table 2.
The MIGRATE-IST and MIGRATE-2ND Conditions evaluated the likelihood of subjects migrating contralateraldistinguishing tones (or. alternatively, exhibited stimulus dominance effects) in the A or X stimulus, respectively. Since the Xstimulus in the kIK!' `oTE-IcT Condition and th,, A stimulus in the MIGRATE-2ND Condition both represent good figures(major or minor chords) with no tones presented to the contralateral ear, they were assumed to be perceived veridically. "Same"responses then would be obtained if subjects migrated contralateral distinguishing tones in the remaining stimulus. If alteredtarget ear perception by fusion or migration of distinguishing tones occurs more frequently for X stimuli in order to matchveridical target ear perception of the A stimuli, then *same" responses should occur more frequently in the MIGRATE-2NDCondition (and should increase with increasing base complexity for this condition). On the other hand, 'same' responses in bothconditions should similarly increase with increasing complexity if incidence of tone migration does not depend on stimulusposition or order
The DISTRA(MI-NOFUSE and DISTRACT-FUSE.2NI) Conditions evaluated the remote possibility that subjects inE'xperiment I were distracted, responding inappropriately to perception of tones they received other than in the target ear (e.g..responding tcý the oontralateral ear). Distraction was evaluated by presenting bases or chords of AX stimuli to the contralateralear rather than to the target ear. Both the DISTRACf-NO.FlISE and the DISTRACT-FULSI .2NDJ Conditions wire generatedby reversing the ears to which tones were presented in other dichotiu conditions (Experiment Is [USI -NI:IT 11"R Conditionand Experiment 2's DISSONANT-FUSE.2ND Condition described below, respectively). "Same" responses in the DISTRACT1-NO.FUS-; Condition presumably would result only if subjects attended to and veridically perceived the tone complex presentedto the contralateral ear. 'Same" responses in the DISTRACT`-FUSE.2N1) Condition were thought to primarily reflect respondingto the contralateral ear and fusion of distinguishing tone and chord in the X stimulus. In this condition. "same" responses alsocould theoretically reflect (1) migration or dominance of the isolated distinguishing tone in the A stimulus, or (2) TP of the Xstumuplus Ilowever. tone migration in the A stimulus seemed unlikely since it was more likely that subjects were aware that notones were presented to the target ear. TP was also unlikely for reasons already discussed in I.xperiment 1.
[he final twi experimental conditions, the l)ISSONANT-l"SI-.1ST and I)ISSONA\ 1-1- SISE.2NI) DConditions,evahliuited the ihkelhh(wi i of suhitct.s fusing contralaicral distinguishung tones Io per(uisc dissonant chords. I 'he evaluation wasi-nitiiitd individiually fir A and X stimuli biy reversing the iirder of timuli acr(os the two (iunltiiinns Asisuming veridical •per•cepiin of ther i h('r trial stuntiiu. %tiname" responses wotild Ix- olutauned if silijecis fiseld Ihr uutrulateral ilist ingukishing tone,itd ih-,i Io( -I'•s lIkely cuhlii ,I IV) 4f (I) the A siitniiliis ut hi Dll'-(N\A\ I I I SI, I ( l, n. anid (2) II" X stiuntl•uis
Perceptual Organization 8
in the I)ISSONANTF-"US-.2NI) Condition Based upon the previoiusly cited Gestalt literature on figural goodness, "same"responses were not expected to occur frequently. As previously noted, increases in "same" responses as a function of increasingcomplexity would be consistent with decreasing figural goodness as base complexity increases; the reverse pattern should beobserved if figural goodness increases with increasing complexity.
In the above experimental conditions, almost all (likely) perceptual organizations would result in "different" responsesby subjects, and those organizations which would be reflected by "same" responses were not hypothesized to occur frequently.The final two dichotic conditions, therefore, were designed to consistently result in "same" responses, thus lowering the likelihoodof consistent 'different" responding, and acting as control conditions to determine if subjects were exhibiting a response bias.The DISTRACT-CONTROL Condition was generated from the FUSE-EITHER Condition stimuli of Experiment 1. butpresented bases to the contralateral ear and distinguishing tones to the target ear. Subjects presumably would not respond"*different'. since such responses would reflect not only distraction to the contralateral ear, but also fusion of either the A or theX stimulus (not both).
In the NO.FUSE-CONTROL Condition, the same chord was presented to the target ear for both A and X stimuli,along with a dissonant contralateral distinguishing tone in the A stimulus. 'Different" responses only would be obtained ifsubjects (1) were distracted to the contralateral ear, or (2) exhibited fusion or TP of the A stimulus, neither of which washypothesized to occur.
Results and DiscussionBinaural Discrimination. Mean subject accuracy (in percent correct) is shown for each binaural condition and level of
complexity in the upper panel of Table 5. Subjects again discriminated isolated tones with perfect accuracy and maintained highaccuracy levels of chord discrimination.
Chord discrimination results initially were analyzed in a 4 X 3 ANOVA, with condition (same and different trials forboth major/minor and dissonant chord disctrimination) and complexity (number of tones) as the respective factors. The maineffect of condition was not significant (1I`3.151=.514, p=.6
7 90). There was a significant main effect of complexity
(F[2,10j=7.398. p=.0107), as well as a marginal condition X complexity interaction (1`"6.301w2.141, p=.0
776).
The table of means reveals that both the complexity main effect and the marginally significant interaction can beattributed primarily to decreasing accuracy with increasing complexity on different chord trials. This trend was revealed by ananalysis of simple main effects of complexity for each condition, which were significant, or approached significance, for differentchord trials (F12,10l=3.879, p=.057 for major/minor chord discrimination; Fl2.10ý=5.309, p=.02
7 for dissonant chord
discrimination), but failed to approach significance for same chord trials (F[2.101 = 1404, p=.290 for major/minor chorddiscrimination; F12.101 = 1.400, p=.291 for dissonant chord discrimination).
These results are consistent with the binaural findings of Experiment I in indicating an increased difficulty inperceptually isolating individual tones as the number of tones present in a complex stimulus increases. Binaural chorddiscrimination performance again was used to provide error rates for dichotic discrimination performance, enabling what, intheory, should be an accurate evaluation of dichotic perceptual organization.
Dlichotic Discrimination. Mean percentage of *same" responses for each dichotic condition and level of complexity isshown in the lower panel of Table 5. A 6 X 3 ANOVA with experimental dichotic condition and complexity as respectivefactors was first conducted. All effects were significant; the main effect of complexity (F[2,101=13.364, p=.0015). the maineffect of conoition (U5.251=40.0utic, p<.0001). and their interaction (Fl10.50]=6.671. p<.0001).
Insert Talile 5
The main effect of base complexity and the interaction can be attributed to the conditions evaluating migration,dominance or fusion of contralateral distinguishing tones, reflected by significant simple main effects of complexity for theMIGRATE-IST (F[2,10=13=527, p<.001), MIGRATE-2ND (F12.101 11.740. p>.002). and DISSONANT-FUSF.IST Conditions(F[2.101=4 137. p=.04
9). 'he simple main effect of complexity failed to reach significance for the DISSONAN'I'-FUSE.2N1)
Condition (F12.101=2.41i =.139). The simple effects reveal significant overall increases in percent "same" responses withincreasing complexity (; Jecreases in "same* responses with increasing complexity did not reach significance by "'Iukey-tests).
As 6xpecctc, lects almost exclusively responded "same" on DISTRACT-CONTROL trials, where all target earcomponents for A ane timuli were identical. Therefore. subjects seemingly were not responding "differents on the basis of asimple response bias, n( were they responding to percepts at inappropriate locations, in the experimental dichotic conditions.Ilhe unexpectedly frequent "different' responses on NO.FUSE-CONTROL trials are attributed to a tendency to fuse
contralateral distinguishing tones (see below),As expected. the simple main effects of base complexity did not approach significance in the DISTRA(7I'-NO.FLUSE
and DISTRA(I'-FtUSE.2ND Conditions (F12.101=.301. p=.7 4 7
, and F1'2.101=1.189. p=.344, respectively). Therefore, response(distraction) to the contralateral ear seldom occurred and was not made more likely by increasing complexity. Incidence ofdistraction across all levels of complexity, furthermore, always was within the mean error rates for subjects on binauraldriy'riminatilin trials, indicating that sulijects were not distracted to respond on the basis of contralateral or mislocalizedinfiirmation Ihese resuilLi are important because the incidence of IT should not exceed the rate of responding to mislocahi/ednfivrm~itium
l skcy comparisons for the NTI(NiA I- -l I ini NIl(iRA I -2ND) Condilions revcal that the simple elte1is were 5Siriljita.ib1c tu) significant increa.e, in %ime" resp l-i-e us oimplexutv increaused from 2-tone toi 3-tonc las.,s Ihe proilxililtie-
,,I n gr.ilin fim-in.i •, flr A anid X %11iiuil with -ipin g i iun tjlcniiu showrln ,i punul 3 n4 table 4. were i hul-ait'd IlliIl
M
Perceptual Organi/.ation 9
Appendix Fq. 5a') to increase substantially from 2- to 3-tone complexity, but then to decrease slightly at the highest level of
complexity. This same pattern of results was observed for both A and X stimuli. Thus. regardless of when stimuli arepresented on a trial, increased migration or dominance with increasing complexity may asymptote when the number of tones islarge enough to make it difficult to perceptually isolate individual tones-.
Because they would indicate either TP or fusion of contralateral distinguishing tones to perceive figurally bad chords."same' responses in the DISSONANT-FUSE.IST and DISSONANT-FUSE.2ND Conditions (as well as in the NOFUSE-CONTROL Condition) were not hypothesized to frequently occur. The high percentage of *same* responses obtained acrosslevels of complexity was unexpected, as was the similar tendency to respond "different" on roughly half of all trials in theNOFUSE-CONTROL Condition. The accompanying increased tendency to respond *same" with increasing complexity onDISSONANT-FUSE trials (which was significant for the DISSONANT-FUSE IST Condition) further suggests that fusionincreased with increasing complexity. "Same" responses in the DISSONANT-FUSE.IST and DISSONANT-FUSE.2NDConditions again could not have been due to TP unless subjects responded to the location of the triplex percepts rather thanveridical target ear perception. However, we already have noted that subjects exhibited extremely low probabilities forresponding to inappropriately localized percepts. Subjects therefore were most likely responding to target ear rather than triplexpercepts. If we assume that TP is an unlikely alternative to musical DP, we can calculate the probability of fusing contralateraldistinguishing tones (using Eq. 5b) to perceive a dissonant chord. As shown in panel 4 of Table 4, these probabilities, averagedacross A and X stimuli, increased from 2- to 3-tone levels of base complexity and remained stable at the 4-tone level nf basecomplexity (0.65, 0.80, and 0.79, respectively).
Means from both MIGRATE and DISSONANT Conditions from Experiment 2 were submitted to a probabilityformula (Appendix Eq. 6) to calculate the overall likelihood of altered target ear perception. Probabilities were calculatedindividually for A and X stimuli at each level of complexity and are displayed in the bottom panel of Table 4. Stimulusposition (A or X) did not seem to play a critical role in target ear perception of the current stimuli, since no overall systematicbias for altered target ear perception of the X stimulus was found.
The obtained probabilities were averaged across stimulus position to obtain overall probabilities of altered target earperception for each level of complexity. These probabilities were 0.68 for 2-, 0.93 for 3-, and 0.90 for 4-tone bases. Ascomplexity increases, so does the likelihood of altered target ear perception. The probabilities at the two higher levels ofcomplexity are comparable to the accuracy rates for binaural discrimination trials and are therefore essentially at ceiling.
General DiscussionIlaving quantified the probabilities of various perceptual organizations (i.e. fusion, migration. dominance, TP.
distraction). we must provide an explanation of not only why specific organizations occurred, but also why their probabilitieschanged as a function of stimulus complexity. The following discussion develops general perceptual explanations for theincreased tendency to alter target ear perception with increasing complexity. These include (I) an application of Gestaltpi,.oj;.cý,• (2) an c.ilu.tion of the relative salience of contralateral tones based on related speech research, and (3) a comparisonwith a well-known attentional model which addresses similar findings with visual stimuli.
The observed probabilities of altered target ear perception cannot be due merely to subjects comparing the overallperceived similarity of stimulus configurations. If responses were based solely on the perceived similarity of A and X stimuli,then sufficient increases in complexity should have resulted in an increasing tendency to perceive different stimuli as similar.Similarity then should have affected perception of binaural and dichotic stimuli in an equivalent manner; increases in "same"responses for dichotic conditions would have been comparable to or less than the measured decrease in binaural discriminationperformance for similar stimuli. This, however, was clearly not the case. Altered target ear perception in dichotic trialsapproached a maximal rate, whereas error rates on binaural different-chord trials remained quite low.
Alternatively, one could argue that the effects of complexity or. altered target ear perception are attributable tomemory decay. The current discrimination task probably does involve a strong memory component. Subjects must compare theX stimulus with a memorial representation of the A stimulus. This representation could be either (1) a trace (or image) of A.or (2) an encoded version of A. respectively equivalent to the product of "trace" and "context coding" processes (Braida andI)urlach. 1986. as summarized by Macmillan. Braida. and Goldberg. 1987). Short ISIs and relatively simple stimuli (e.g.. with fewcomponents) are required for maintaining an adequate menmory trace; otherwise, the trace will substantially decay. Since pianotones rapidly achieve a steady-state spectral composition which remains relatively stable (apart from gradual amplitude decay)until offset, the current task would minimally require subjects to compare spectral properties at X stimulhs onset with analogousproperties at A stimulus offset. The minimum memory interval therefore becomes the 1.5 s 1S1. Since this interval iscomparable to estimates of the upper bound of echoic memory (e.g.. Darwin. '1 urvey, and Crowder, 1972; I'retsman and Rostron.1972). the A stimulus trace could have sufficiently decayed to hamper its comparison with the X stimulus. Trace decay ofveridical perception thus could appear as altered target ear perception. Furthermore. due to an increase in the number ofstimulius components. trace decay should be more pronounced as base complexity increases.
Since its effectiveness is not influenced liy ISI, context coding would he the more viable memory strategy. Hlowevcr,ointcxi coding also should tic more difficult as stimulus complexity increases. Thus, effects of increasing stimulus (base)eimplcxtiy are predicted not only by a greater likelithood of trace decay, but also hy inappropriate context cxding,
Implicitly, this memory model predicts. that context coiding shoild bc casier for figiirally giood, anti thus more easilycniuhed simruil Indeed. figurially goxod stimuli acc generally arguile toi rctpiirc Ic.,. informalnit to 1w rccprcsented, while ilsoilnw n,_, more resist,int to altcrcd pcrccptlion 'I race dci-av, rcfleiting onc ncchan Sm if alitered owrPcption. therefore should Ihe i'"
hi(i It i i ulIi he' pcricptuoin of ftgir~illv guxuit [iiniiil I hlli-,. ni'i'uisH•,eiN - .iý ici pirt iiv i(t(l v f i a miaiiinl of explin ,tiiin%
It
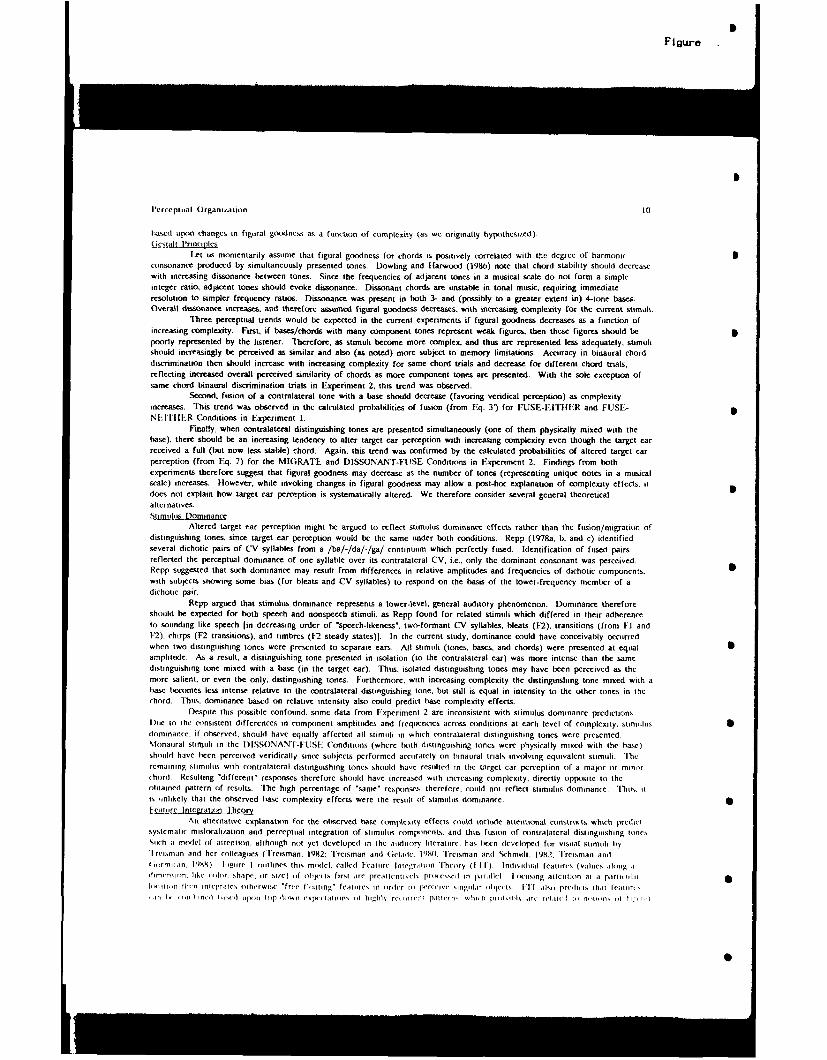
S
Figure
Perccptoal Organization 10
based upon changes in figural goxoness as a function of complexity (as we originally hypothesized).(iestalt Principles
Let us momentarily assume that figural goodness for chords is positively correlated with the degree of harmonicconsonance produced by simultaneously presented tones. Dowling and Ilarwood (1986) note that chord stability should decreasewith increasing dissonance between tones. Since the frequencies of adjacent tones in a musical scale do not form a simpleinteger ratio, adjacent tones should evoke dissonance. Dissonant chords are unstable in tonal music, requiring immediateresolution to simpler frequency ratios. Dissonance was present in both 3- and (possibly to a greater extent in) 4-tone bases.Overall dissonance increases, and therefore assumed figural goodness decreases, with increasing complexity for the current stimuli.
Three perceptual trends would be expected in the current experiments if figural goodness decreases as a function ofincreasing complexity. First, if bases/chords with many component tones represent weak figures, then these figures should bepoorly represented by the listener. Therefore, as stimuli become more complex, and thus are represented less adequately, stimulishould increasingly be perceived as similar and also (as noted) more subject to memory limitations. Accuracy in binaural chorddiscrimination then should increase with increasing complexity for same chord trials and decrease for different chord trials,reflecting increased overall perceived similarity of chords as more component tones arc presented. With the sole exception ofme chord binaural discrimination trials in Experiment 2, this trend was observed.
Second. fusion of a contralateral tone with a base should decrease (favoring veridical perception) as complexityincreases. This trend was observed in the calculated probabilities of fusion (from Eq. 3) for FUSE-EITIIER and FUSE-
NEITHIER Conditions in Experiment 1.Finally, when contralateral distinguishing tones are presented simultaneously (one of them physically mixed with the
base). there should be an increasing tendency to alter target ear perception with increasing complexity even though the target earreceived a full (but now less stable) chord. Again. this trend was confirmed by the calculated probabilities of altered target earperception (from Eq. 7) for the MIGRATE and DISSONANT-FUSE Conditions in Experiment 2. Findings from bothexperiments therefore suggest that figural goodness may decrease as the number of tones (representing unique notes in a musicalscale) increases. However, while invoking changes in figural goodness may allow a post-hoc explanation of complexity effects. itdoes not explain how target ear perception is systematically altered. We therefore consider several general theoreticalalternatives.
Stimulus DominanceAltered target ear perception might be argued to reflect stimulus dominance effects rather than the fusion/migration of
distinguishing tones, since target ear perception would be the same under both conditions. Repp (1978a, b. and c) identifiedseveral dichotic pairs of CV syllables from a /ba/-/da/-/ga/ continuum which perfectly fused. Identification of fused pairsreflected the perceptual dominance of one syllable over its contralateral CV, i.e.. only the dominant consonant was perceived.Repp suggested that such dominance may result from differences in relative amplitudes and frequencies of dichotic components. ,with subject. snowing some bias (for bleats and CV syllables) to respond on the basis of the lower-frequency member of adichotic pair.
Repp argued that stimulus dominance represents a lower-level, general auditory phenomenon. Dominance thereforeshould be expected for both speech and nonspeech stimuli, as Repp found for related stimuli which differed in their adherenceto sounding like speech lin decreasing order of "speech-likeness", two-formant CV syllables, bleats (F-2). transitions (from Fl and1F2). chirps (i2 transitions), and timbres (F2 steady states)]. In the current study, dominance could have conceivably occurredwhen two distinguishing tones were presented to separate ears. All stimuli (tones. bases, and chords) were presented at equalamplitude. As a result, a distinguishing tone presented in isolation (to the contralateral ear) was more intense than the samedistinguishing tone mixed with a base (in the target ear). Thus, isolated distinguishing tones may have been perceived as themore salient, or even the only. distinguishing tones. Furthermore. with increasing complexity the distinguishing tone mixed with abase becomes less intense relative to the contralateral distinguishing tone, but still is equal in intensity to the other tones in thechord. Ii'hs, dominance based on relative intensity also could predict base complexity effects.
Despite this possible confound, some data from Experiment 2 are inconsistent with stimulus dominance predictionsD)ue to the consistent differences in component amplitudes and frequencies across conditions at each level of complexity, stimulus Sdominance, if observed, should have equally affected all stimuli in which contralateral distinguishing tones were presented.Mionaural stiMiui in the D)ISSONAN'I-FUSI Conditions (where both distinguishing tones were physically mixed with the base)shouild have been perceived vendically since subjects performed accurately on binaural trials involving equivalent stimuli. 'lheremaining stimulus with contralateral distinguishing tones should have resulted in the target car perception of a major or minorchord. Resuhling "different" responses therefore should have increased with increasing complexity, directly oppotite to theobtained pattern of results. The high percentage of 'same" responses. therefore. could not reflect stimulis dominance. 11hus. itis unlikely that the observed base complexity effects were the result of stimulus dominance. S1-calirc Iniccration Theory
An alternative explanation for the observed base complexity effects coUld include attentuonal constructs which predictsystematic muslocalh/ation and perceptual integration of stimulus comrponentls. and thus fusion of contralateral distinguishing tonesSuehh a model of aitenti•n, although not yet developed in the atidtocy literature, has been developed for visual stimuli byI reuisman and her colleagues (Treisman, 1982; Tretsman and (icladc. 1980. Trcusman and Schmidl. 1982, Ilreusman anti
(Iormilin. 19") 1 ig)ire I rouiiiincs this model. called Featurc InteCruition "'thcory (l I) Iniidivitdual features (values along iininm u n.. likc (ilor shape, iir sizcI of ofbj(.tis first are preattcniti-l1 lru•i•.,cst in putivllcl I tunsing altetictili at ia lriti iilti
vin,r vht n int.igrates otlhe-rwise "free floiting" fealltres in irdir tw f'r(cevi ,inguil.ur o•ljitis I'II also prc(dlus thlt Icittiret+in t." otniu'l isl pot•l l~iopupo esn i tvanon, of highls ruin t1'. titulift1. iinll .101 pioV•Nitl ýi til,ileol to f tiunon, 0f
Perceptual Organization II
Insert Figure I •
One source of critical evidence for FIT assertions is the nature of perceptual errors and the circumstances in which
they arise. Attention becomes overloaded when the number of presented items, and thus the number of features, is large. Ifsearching an array of many items for an object based on a conjunction of features, then "illusory conjunctions", incorrectcombinations of existing features, are likely to result. These errors are argued to represent either random couplings of featuresor violations of expectations and have been shown to occur far more frequently than errors in which a feature is conjoined with
one not present in the array (Treisman and Schmidt, 1982). Furthermore, subjects are not aware of these frequent illusory
conjunctions.In order to apply FIT to the current finding of tone migration. some loose assumptions must be made about what
qualify as musical features. Let us assume that our auditory analyzers can preattentively identify all relevant information fromthe "musical array" in parallel, i.e., pitches, timbres, durations, intensities, and locations of individual tones, as well as harmonic
relational information between tones. According to FIT, at lower levels of complexity (i.e.. when the number of presented itemsis small), subjects should be relatively successful at integrating features to veridically perceive the appropriate chord in the target
ear. However, if complexity is high (i.e., given many components), attention may become overloaded. Subjects then would
group components along shared features in an attempt to approximate the presented stimulus configuration. One shared featureis that both E and El distinguishing tones share a strong harmonic relationship with the tones in the base. combining with thebase to respectively produce a major and minor chord. If grouped along this shared feature, mislocalization of E and E tones
would then be likely, resulting in illusory conjunctions in the form of migrations.Fusion of contralateral distinguishing tones could be considered another form of illusory conjunction.! If the
dissonance created by the simultaneous presentation of adjacent chroma (E and E) is coded as a feature, then such coding mayresult in perceptual fusion. Since base tones at higher levels of complexity also share dissonance and increase attention load, thelikelihood of fusion would be expected to increase with increasing complexity.
Illusory conjunctions represent objects which have been resynthesized from feature labels. This seems initially
contradictory to the Gestalt principles, which stress holistic perception. However. Treisman (see above) has suggested that withsufficient experience, particular combinations of primitive features (e.g., simple. highly recurring figures) are processed asemergent features. It is reasonable to assume that figurally good (e.g., major/minor) chords could act as prototypic features.Without this assumption. it is possible that the A stimulus would always act as a basis for search for the X stimulus. Subjectsthen would have more frequently altered target ear perception in the X stimulus than in the A stimulus. However, in theabsence of any such observed tendencies, this alternative seems unlikely. Thus, figurally good chords may represent emergentfeatures. If so, chords would be less likely to act as features at high levels of complexity, based on the instability of chordscontaining dissonances. Altered target ear perception yet again would seem more likely with increasing complexity.
While initial FIT applications to effects of musical complexity are far from straightforward. FIT can account for the
migration and fusion of contralateral distinguishing tones, the former of which is operationally identical to visual demonstrationsof illusory conjunctions. In a future submission, we intend to present results which more directly verify the applicability of FITto audition using tasks similar to those typically used in vision. Continued investigations within the framework of FIT shouldprovide a better specification of musical features. Invoking FIT also may allow many auditory findings to be analyzed from anew attentional perspective.Applications and Summary of Findings
The current study suggests that research using DP stimuli can evaluate much more about auditory processing than
simply addressing claims for or against modularity. Fusion incidence can be used to identify variables (e.g.. complexity) whichare critical to perceptual organization. as well as to reveal necessary conditions for various illusory percepts to occur.
The results represent a quantification of the probabilities of various perceptual organizations for musical stimuli as afunction of stimulus complexity. Data from several conditions verified that fusion occurs at a substantial rate in musical D)Pstimuli, and was inconsistent with the postulation of IT' by phonetic modularity supporters. FIurthermore, the incidence ofnonveridiral perception seems to be determined in part by the figinral goodness of both the fused and base percepts. and mayreflect organizational tendencies which were originally demonstrated in vision. Migration and fusion of chord distinguishing toneswere demonstrated to increase as a function of increasing complexity Taken in conjunction with the slight decrease in fusion of
contralateral base and tone (to perceive a major/minor chord) as a functmon cf complexity, migration/fusion of distinguishingtones is consistent with the notion that increasing complexity decreases figural goodness. Decreasing figural goodness, therefore,is argued to decrease the likelihood of veridical perception, Furthermore, migration and fusion are consistent with featureintegration as conjectured by -Il"
The application of FIT to the current results suggests a generalized attentional basis for future (DP) studies of
auditory perceptual organization Attentional factors also may affect perceptual organization in the presence of variation alongother stimulus variables (e.g. component duration, intensity. or relative frequency position). which merit further research.
Rcfcrcnccs eI , 19)42) An cx[s'rluuentail sliuty of ith,' phrinmcnu (if yusuorc iv ,, thruc-sholl Iu tintllir Jouurnal ol
S)
Figure 2u
l'crceptual Orgainia.Lion 12
liregman. A, s. 11987) Fhe mearnin of duiplex perception: Sounds and transparent otbject~s. In NI FI It Schouten(I.0.). i-c l'sychophysics of Speech Perception. Boston: Slartintis Nijhoff NAlIO-ASI Se-ries
firegman. A S. (1990), Auditory seine analysis: TIhe perceptualorganization of sound. Cambridge, NIA M IT P'ress,
Ctocca, V. & Bregnnan. A. S. (1989). The effects of auditory streaming ott duplex perception. Perception &Psychophysics. 46(l). 39-48.
Collins, S. C. (1985). Duplex perception with musical Stinmuli: A further investigation. Perception & Psychophysics.38, 172-177.
Cutting. J. 1:F. (1976). Auditory and linguistic processes in speech perception: Inferences from six fusions in dichoticlistening. Psychologricat Review, 83. 114-140.
D~arwin, C. J.. Turvey. MI. T,. & Crowder. R- Gi. (1972). An auditory analogue of the Sperling partial reportprocedure: Evidence for tinef auditory storage. Cognitiv'e Psychology. 3. 255-267.
D.eutschs. D. (1974). An auditory illusion. Nature. 251, 307-309.D~owling, W. J. & Harwood. D. L. (1986). Music Ccignition. New
York: Academic Press.Fowler. C. A. & Rostrnblum. L. 1). (1990). Duplex perception:
a comparison of monosyllables and slamming doors. Journalof Experimental Psycholozy: Human Perception and Performance, L6~(4), 742-754.
Hall. M. D7. & Passore. R. E. (1992). Musical duplex perception: Perception of figurally good chords with subliminaldistinguishting tones. Journal of Experimental Psychology: Human Perception and Pecformanc. 18(3). 752-762.
Liberman, A. M-I. senbierg. D. & Rakerd. B. (1981). Duplex perception of rues for stop consonants: Evidence for aphonetic mode. Percep~tion & Psychop~hysics. 30. 133-143.
L~ibertnan, A. %I. & Maitingly, 1. GI. (1989a). A specialization for speech perception. Science. 243. 489-494.Liberman. A. '.I. & Mattingly. I. (G. (1989bi). Motor theory of
speech perception revisited. Cognition. 21. 1-36.Macmillan. N. A.. Braida. L. 0. and Goldberg, R. F. (1987). C~entral and peripheral processes in the perception of
speech and nonspeech sounds. In M. E'. Hl. Schouten (I1d).Lj. Psycholphysics of Speech Perception (pp.28-45). Boston: Niartinus Nijhoff NATO-ASI Series.
Mlann. V. A.. Miadden. J., Russell. J. NI., & ~ibierman. A. M. (1981). Further investigation into the influence of preceding liquidson stop consonant perception. Proeceditrips of th L101st meeA~ngof the Acoustical Society of Amcijia, 69(01). S91(A).
Mattingly. N. A. & Libernnan. A. M. (1988). Speech and other auditory modules. Haskins Laboratories Status Repriortin Speech Research #1;R-93/94. 67-84.
Niisbaum. If.. Schwab. E., & Sawtmch. J. (1983). The role of "chirp' identification in duplex perception Perception &Ps cho~nhys'sc 33(4). 323-332.
Pastore, R. E.. Schmucliler. M. A.. Rosenbluim. L.. & Szezesiul. R. (1983). Duplex perception with musical stimuli.Perception & Psychophysics. 33. 469-A74.
Rand. T. C. (1974). D~ichotic release from masking for speech.Journal of the Acoustical Society of America. 55, 67H-690.
Repp, B4. II. (1978a). Stimulus dominance in fused dichotic syllables. Haskins L~aboratories Status Report onSpeech Resecarch ISR-55/5fi. 133-148.
Repp. B. HI. (1978b). Categorical perception of fused dichotic syllables. Hlaskins Laboratories Status Report onSpeech Research #SR-S5556. 149-16il.
Repp. HI. II. (1978c). Stimulus dominance and ear dominance in fused dichotic speech and nonspeech stimuli. HilasknsLabioratories Status Report on Spech Research #SR-55/56. 163-179.
Rcpp. B. If. Mlilburn, C.& Ashkenas. J. 11983). Duiplex perception: Ciinfirmatiou of fusion. Perception A
Psychop~hysics 33.,33.3-357.1 reisman, A. 11982), Perceptual grouping and aittention in visual search for featiircs anil for obiject.%. Journal of
Uxpeimental Pisychologzy: Huiman pierception and Performance. 8, 194-214.I rvusman. A. 019(10) Variations tin the theme of feature integration Reply to Navuin (19910). P'sychological Rcvic~s
`L73). 4601-4631 reisman. A. & (irlade. 6i. (1980). A featiire-intcgratuon theory of aittention. Ccw-nitie P'sychology. 12. 97-136.I reisman. A. & Schmidt. It, (1982). Illusoury conjunctions in th? oerception of objects. Cognitive Pscooy 14.
10i7.141I reusmin. A & (iormican. S (0988) 1-cittuire analysis in earli, ucilence friim search asymmcrirc%
Psycholoiuical Reviucw. 95(1), IS48.I r,,,,mas. \I & Rustron. A. B. (19721 ltrief audlutury storaige A m-ii fiaittuun of) Spe-riugs paradigrn applied to
aiiuutiunr Au-ia Psych'uluunicd L6. 161 170Vuurrtuumcr \1 I 19S'%) lriciuplcs (if ficrccptuutl uurg~inu/imun It 1) liarulslec & \1 Wurubcuniri rI if, ) kc.olins,
us ci~ioeunn l'runs-ct'u %iii \i'.i,inl tCinpainy. lIn,A1,1-In I 1) A ulnltrm-,in A %I (191 l'itý(h 1,c-l at ints titus
21ý 10
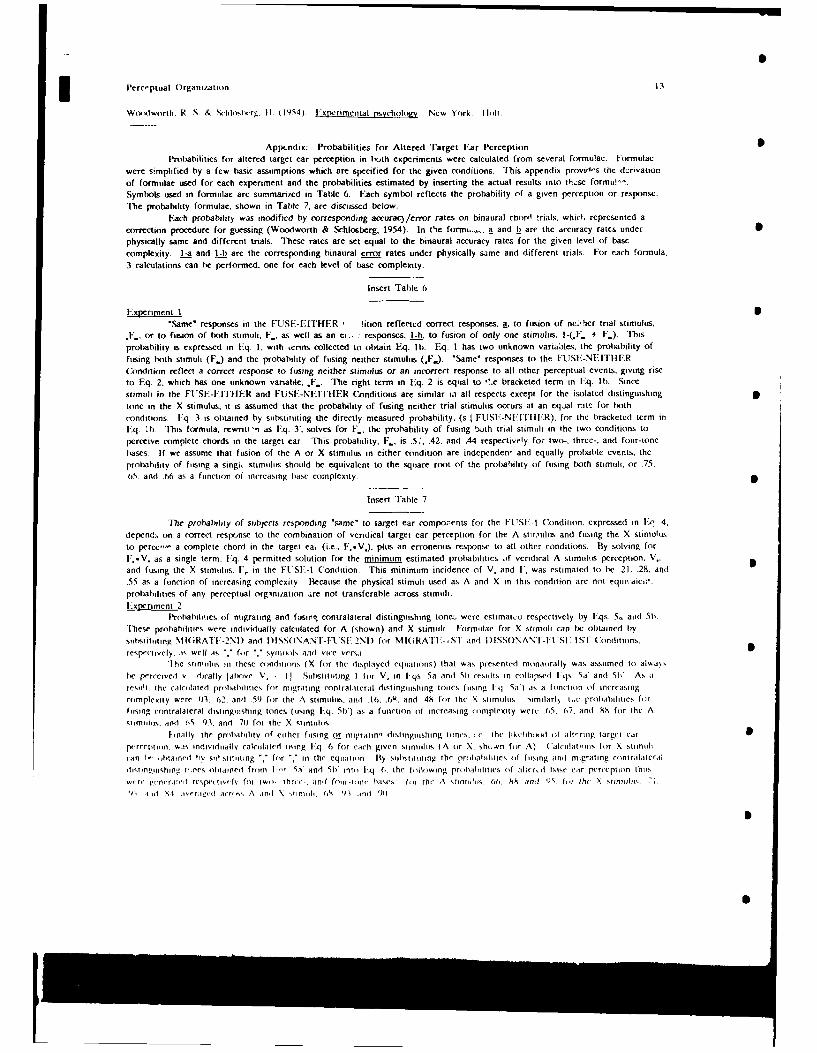
I'erc,-ptual Organization 13
Woo•dworth. R S. & ,'hloslw'rg. II. (1954) IExperimental Msvcholox.. New York. holt.
Apptndix: Probabilities for Altered Target Ear Perception 5Probabilities for altered target ear perception in twith experiments were calculated from several formulae. Formulae
were simplified by a few basic assumptions which are specified for the given conditions. This appendix providrs the dcrivationof formulae used for each experiment and the probabilities estimated by inserting the actual results into these formul, -.Symbols used in formulae are summarized in Table 6. Each symbol reflects the probability of a given perception or response.The probability formulae, shown in Table 7, arc discussed below.
Each probability was modified by corresponding accurac)/error rates on binaural chorM trials. whicl, represented acorrection procedure for guessing (Woodworth & Schlosberg, 1954). In Ime formu.i,.. a and b are the accuracy rates under Iphysically same and different trials. These rates are set equal to the binaural accuracy rates for the given level of basecomplexity. I-a and 1-b are the corresponding binaural error rates under physically same and different trials. For each formula,3 calculations can he performed, one for each level of base complexity.
Insert Table 6
Expesriment I S'Same' responses in the FUSE-EITHER , lition reflected correct responses, a, to fusion of ne.'uer trial stimulus,
.F.. or to fusion of both stimuli. F.., as well as an ei., . responses, L-b, to fusion of only one stimulus, I-G.F. + F..). Thisprobability is expressed in Eq. 1, with terms collected to obtain Eq. lb. Eq- 1 has two unknown variaýbles, the probability offusing both stimuli (F.) and the probability of fusing neither stimulus (y..). "Same* responses to the FUISE-NEITHERCondition reflect a correct response to fusing neither stimulus or an incorrect response to all other perceptual events, giving riseto Eq 2. which has one unknown variable, *F.. The right term in Eq. 2 is equal to Oe bracketed term in Eq. lb. Sincestimuli in the F'SE-EITHER and FUSE-NEITHER Conditions are similar in all respects except for the isolated distinguishing 5tone in the X stimulus, it is assumed that the probability of fusing neither trial stimulus occurs at an eqsal rite for bothconditions. [:q 3 is obtained by substituting the directly measured probability. (s I FUSE--NEITHER), for the bracketed term in|-:q. :b 'his formula. rewriti,• as E',q. 3, solves for F. the probability of fusing both trial stimuli in the two conditions to
perceive complete chords in the target ear. This probability, F., is .5:, .42. and .44 respectively for two-. three-, and four-tonebases. If we assume that fusion of the A or X stimulus in either condition are independen, and equally probable events, theprobability of fusing a singi. stimulus should be equivalent to the square root of the probability of fusing both stimuli, or .75..6,5. and .66 as a function of increasing base complexity
Insert Table 7
Dhe probability of subjects responding "same" to target ear components for the FUSE1 Condition. expressed in E"u, 4.depend:. on a correct respomse to the combination of vendical target ear perception for the A stmiuluus and fusing the X stimutlusto perc,,,, a complete chord in the target ca, (i.e.. F..-V.). plus an erroneous response to all other conditions. By solving forF.. V. as a single term. l'q. 4 permitted solution for the minimum estimated probabtilities of veridlcal A stimulhs perception. V..and fusing the X stimulus. F,. in the FUSE-I Condition. This minimum incidence of V. and 1'. was estimated to be .21. .29. and.5', as a function of increasing complexity Because the physical stimuli used as A and X in this condition are not equvi aicIV.probabilities of any perceptual orginuzation .ire not transferable across stimuli.I-Experiment 2
Probtahbilues of migrating and fusinq contralateral distinguishing tonec, were estumatct respectively by IEqs. 5a aiid 5b.'hese probabilities we-c individually calculated for A (shown) and X stimuli Formu~lae for X stimuih can be obtained by
substituting N¶I(iRATI-2NI) and DISSONANI-FUSI 2ND) for MlI(iRAT--, S and I)ISSONAN.I-FUSI-1.1 SI Conditions.respectively, as well as "' for "." symrixiNs aid vice vcrsi
"Che stmimlls in these conditions (X for the displayed equations) that was presented monaurally was assumed to alwas
bie perceived v dirally jalove V, II Substittiuing I for V. in I-qs 5a and 51b results in collapsed I-qs 5a and 5;b' As a
resill . the cailoilated prulslilihtcs for migrating contraliteral distinguishing ttuic% fusing I-q Sa) is a iunction of increa•ing
complexity were -13. (2. and 5;9 for the A stimultus, and .16(.0(u. and 48 for the X slimults Si ,slarlk. i .c prob ahlities for
fusing contralateral distinguishing tones (using Fq 5I') as a function of increasing complexity were .65. 67. and .M, fir thc A
stimulus. and (5i . 93. and 711 for the X stimulus.
I-i ally the prohahilitv of either fusing wr niiigratin, distinguishing inres, i c the hikcIihoxxl ol alt,lring target car
[x'reptiin. was individuallv calculated iusing I'st. 0 for each given siirnlhts IA or X. sho, n for A) (alhiilationrus for X stimuhican 1-. obtainerl hv stiliSlitlng "', for ". in the equation By suln.tuluing the pruilial•lilus oif husing anti migrating coitralatcral
(tislingmutihing Iir es o(tlained from I,,, Sa and SIt tnt,, I.q 6. the following prolihiblies •f altie, if lase car pe.rceptiun thus
,crv vg'nerilt, respcq lve-lv fur i, .tIo- hr, -. andl f rlinc-<)i( tase%(S i (,if (hr A mfnmlirs. 66. Xs ,i•I 9S. lie thc X stlinrl i%. 7)
9, .li "I i-4 r.iiI wr(-s A ainI X siniitli l'S 9; .inI 901
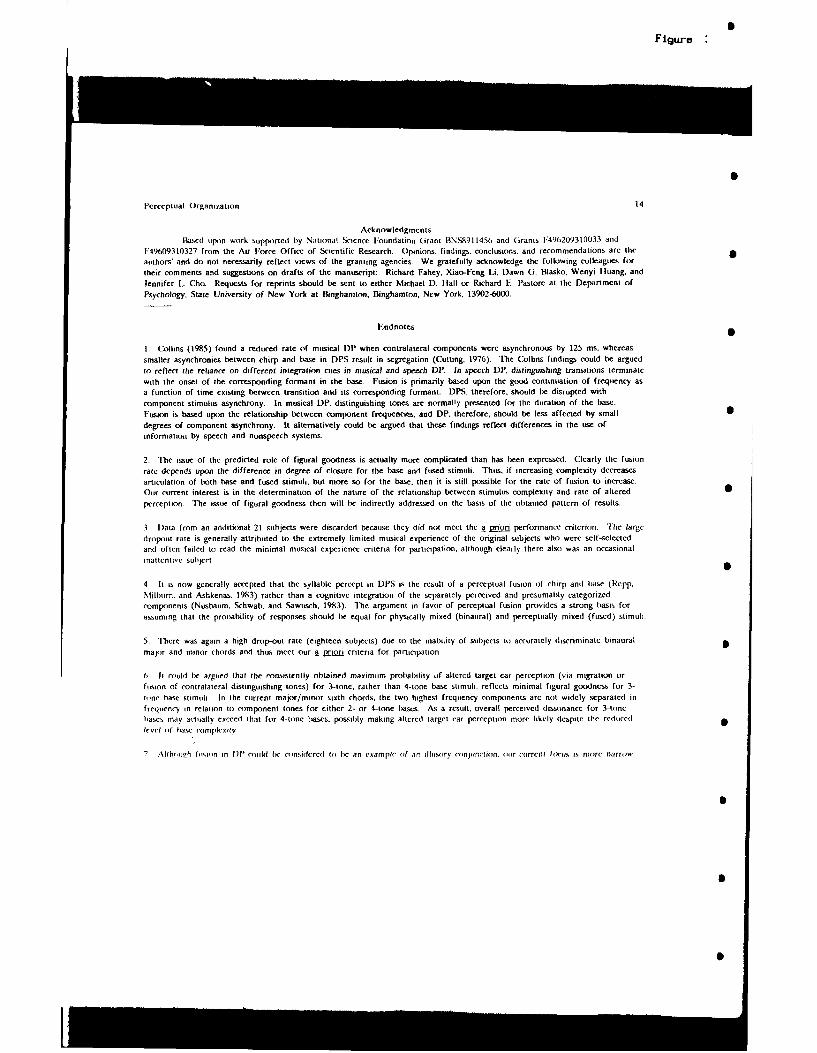
iS
SFigure
Perceptual Organization 14
AcknowledgmentsBased upon work supported by National Science Foundation Grant BNS8911456 and (irants 1496209310033 and
F49609310327 from the Air Force Office of Scientific Research. Opinions, findings, conclusions, and recommendations are the
authors' and do not necessarily reflect views of the granting agencies. We gratefully acknowledge the following colleagues fortheir comments and suggestions on drafts of the manuscript: Richard Fahey, Xiao-Feng Li. Dawn G. Blasko, Wenyi Hluang, andJennifer L. Cho. Requests for reprints should be sent to either Michael D. Hall or Richard F, Pastore at the Department of
Psychology. State University of New York at Binghamton, Binghamton, New York, 13902-6000.
Endnotes
1. Collins (1985) found a reduced rate of musical DP when contralateral components were asynchronous by 125 ins, whereassmaller asynchronies between chirp and base in DPS result in segregation (Cutting, 1976). The Collins findings could be argued
to reflect the reliance on different integration cues in musical and speech DP. In speech DP. distinguishing transitions terminatewith the onset of the corresponding formant in the base. Fusion is primarily based upon the good continuation of frequency asa function of time existing between transition and its corresponding formant. DPS, therefore, should lie disrupted with
component stimulus asynchrony. In musical DP. distinguishing tones are normally presented for the duration of the base.Fusion is based upon the relationship between component frequencies, and DP, therefore, should be less affected by small 5degrees of component asynchrony. It alternatively could be argued that these findings reflect differences in the use of
information by speech and nonspeech systems.
2 The issue of the predicted role of figural goodness is actually more complicated than has been expressed. Clearly the fusionrate depends upon the difference in degree of closure for the base and fused stimuli. Thus, if increasing complexity decreases
articulation of both base and fused stimuli, but more so for the base. then it is still possible for the rate of fusion to increase.Our currrent interest is in the determination of the nature of the relationship between stimulus complexity and rate of altered
perception. The issue of figural goodness then will be indirectly addressed on the basis of the obtained pattern of results.
3 Data from an additional 21 subjects were discarded because they did not meet the a porin performance criterion. The largedropout rate is generally attributed to the extremely limited musical experience of the original subjects who were self-selectedand often failed to read the minimal musical experience criteria for participation, although clearly there also was an occasionalinattentive subject
4 It is now generally accepted that the syllable percept in DPS is the result of a perceptual fusion of chirp and tibase (Rcpp.Milburn. and Ashkenas. 1993) rather than a cognitive integration of the separately perceived and presumably categorizedcomponents (Nusbaum. Schwab. and Sawusch. 1983). The argument in favor of perceptual fusion provides a strong basis for
assuming that the protability of responses should be equal for physically mixed (binaural) and perceptually mixed (fused) stimuli
5. There was again a high drop-out rate (eighteen subjects) due to the inability of subjects to accurately discriminate binauralmajor and minor chords and thus meet our a rion criteria for participation.
6 It riuld tue argued that the consistently obtained maximum probability of altered target ear perception (via migration or
fiLsion of contralateral distinguishing toners) for 3-tone, rather than 4-tone base stimuli, reflects minimal figural goodness for 3-
tone base stimuli. In the current major/minor sixth chords, the two highest frequency components are not widely separated infrequency in relation to component tones for either 2- or 4-tone bases. As a result. overall perceived dissonance for 3-tonebases may actually exceed that for 4-tone bases, possibly making altered target car perception more likely despite the reducedlevel of base complcxitv
7 Althr,2h f.uin n P could lbe considered toi le an example of an llu0sory "Ynjuinction. our current fi•ns is mnore narro%,
I'S
iS
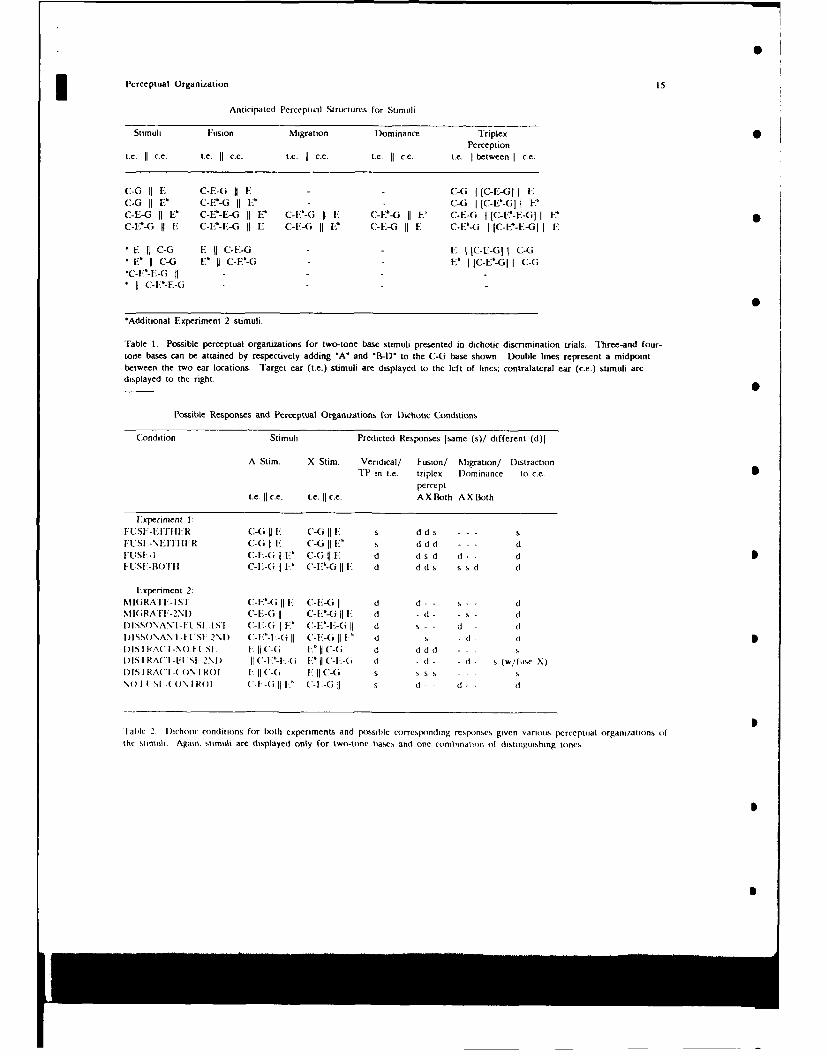
Perceptual Organization is
Anticipated Perceptual Structures for Stimuli
Stimuli Fusion Migration Dominance Triplex SPerception
tI. c.c. i.e. II c.c. .Ic. c.c. L.C. II c-e. t.e. I between I ce.
C-6 II E C-E-( F -- C-6 I [C-E-6I I FC-G II c'7 (-L"- I" E: C-6 I IC-E'-GI I E-C-E-C II E -C-b-E-G b F C-F-C II F, C-F"-G IE ' C-E- I IC-?-F-GI I E,C- F-G II E C-Eb-E-C II F C-F-C E F" C-E-G II E C-E-( I lC-F"-E-Cj I E
E 1 C-1 F II C-F-C- E I IFC-E-GI C-(i• E' II C-C F" II C-E'-G E' I IC-E'-GI I C-C
*- (- "-E-G 1 - - -C l(-Eý-E-G;
"Additional Experiment 2 stimuli.
Table 1. Possible perceptual organizations for two-tone base stimuli presented in dichotic discrimination trials. Three-and four-tone bases can be attained by respectively adding "A* and 'B-D" to the C-G base shown. Double lines represent a midpoint
between the two ear locations. Target ear (t.e.) stimuli are displayed to the left of lines; contralateral ear (c.e.) stimuli aredisplayed to the right.
Possible Responses and Perceptual Organizations for Dichotic Conditions
Condition Stimuli Predicted Responses Isame (s)/ different (d)[
A Stim. X Stim. Veridical/ Fusion/ Migration/ D)istraction
"T'P in t.e. triplex Dominance to ce..
percept
t.e. 11 c.e. t.e. 11 c.e. A X Both A X Both
Experiment 1:
FIUSE-EITIIFR C-(i [[I C-( [ !: s d d s - - - sFUSI.-NEITIII- C-R I F C-F I(i F- s d d d - - - d
FUSII.I C-F-( I F." C-(C I.. d d s d d - - d
UL Si-1-B'lli C-F-(i [1 "" C-'1-C II F d d d s s s d d
Iuxpenment 2.
MI(iRATi.-ISi c-IL- II I- C-F-C II d d - - s - - dMI(iRAI'-2ND C-I-- II c-E I-(i I-1 d - d - - s- d
DlSO\ANl-FL SI.ASI C-F.(i F' C" -F-F--ic d s- - d - dl)ISSO\ANI- 4L SiF 2Ni) C-EiL-"iL- II C-E-(I 111" d - s - d - 0l)IS I RA("I -N ) It SI I': II (-(i I: II C-(i d d d d - - -DISI RA(C'I-LtSt-2NI) I (.-1 -I-(i I'tC--, -( i - d- - d - s (w/fusc X)
DISIRA("[-(0)1ROI E.11 (-(6 I: I C-(i s s s - . - sM()1 I •, ( " I A () I Ro I ('-I.-(o I11.- (,-1-( e I s d - - (I - - (I
Sable 2 l)ichiau contlitions for Woth experiments and possible corresponding responses given various perceptual organi/ations (ifthe stimuli. Again. stimuli are displayed only for two-tone bases and one combination of distinguishing toncs
I
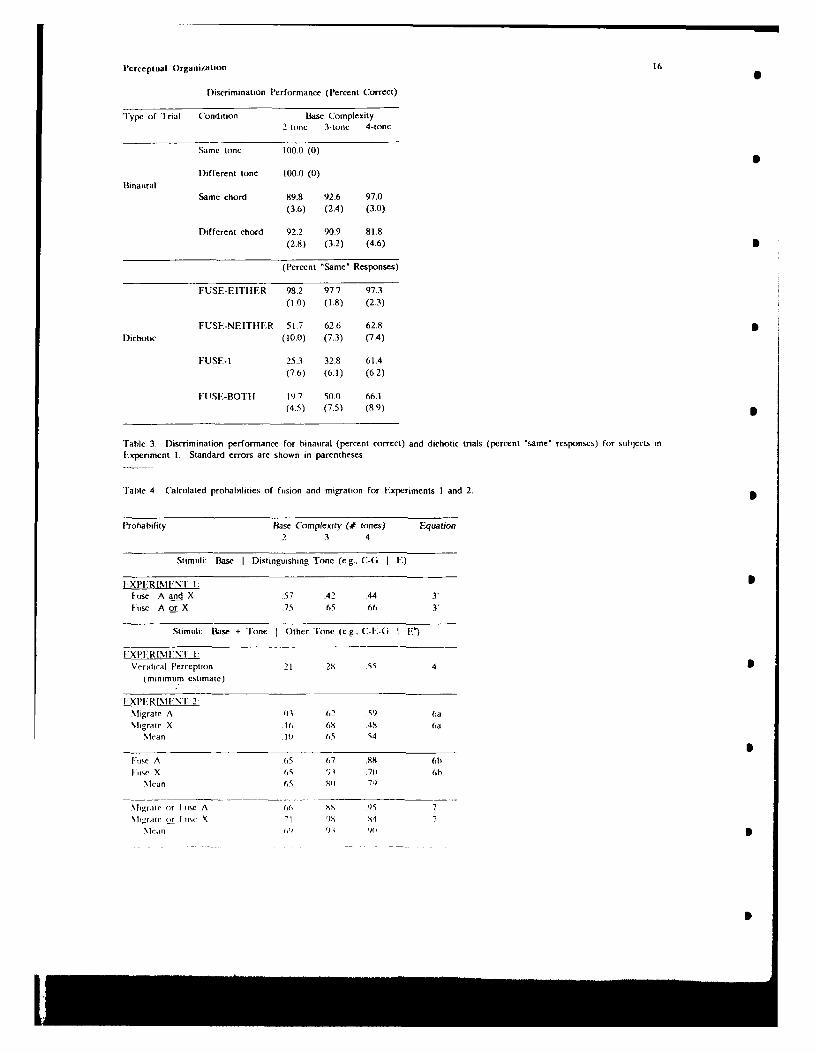
Perceptual Organization 16
Discrimination Performance (Percent Correct)
Type of Trial Condition Base Complexity2-tone 3-tone 4-tone
Same Lone 100.0 (0)
Different tone 1000 (0)
BinauralSame chord 89.8 92.6 97.0
(3.6) (2.4) (3.0)
Different chord 92.2 90.9 81.8
(2.8) (3.2) (4.6) •
(Percent "Same" Responses)
FUSE-EITHER 98.2 97.7 97.3
(1.0) (1.8) (2.3)
FUSE-NEIThlER 51.7 62.6 62.8
Dichotic (10.0) (7.3) (7.4)
FUSE-I 25.3 32.8 61.4
(7.6) (6.1) (6.2)
FUSE-BOTII 19.7 50.0 66.1
(4.5) (7.5) (8.9)
Table 3. Discrimination performance for binaural (percent correct) and diehotic trials (percent "same" responses) for subjects in
EIxperiment 1. Standard errors are shown in parentheses.
"lable 4. Calculated probabilities of fusion and migration for Experiments 1 and 2.
Probability Base Complexity (# tortes) Equation
2 3 4
Stimuli: Base I Distinguishing Tone (e.g.. C-G I E)
LXPI:RIM EN'T 1:
Fuse A and X .57 .42 .44 3Fuse A or X .75 .65 .66 3
Stimuli: Base + Tone I Other Tone leg. C-I'-G I |-)
IXPII'IMINT 1:Veridical Percrepiion 21 .28 .55 4
(minimum estimate)
FIXIP.RIM;NT 2:
Migrate A 01 .62 .59 6a
Migrate X .16 .68 48 (a%lean A0 .65 54
[iuse A .65 .67 .88 61i
1 uc X 65 1; .71 0 6b
Mean 6S .80 7)
51tgrate or I ise A 66 9S 95 7
NNrumh e h.r I uiv X '1 iS 54 7
%lein 6, 9 90
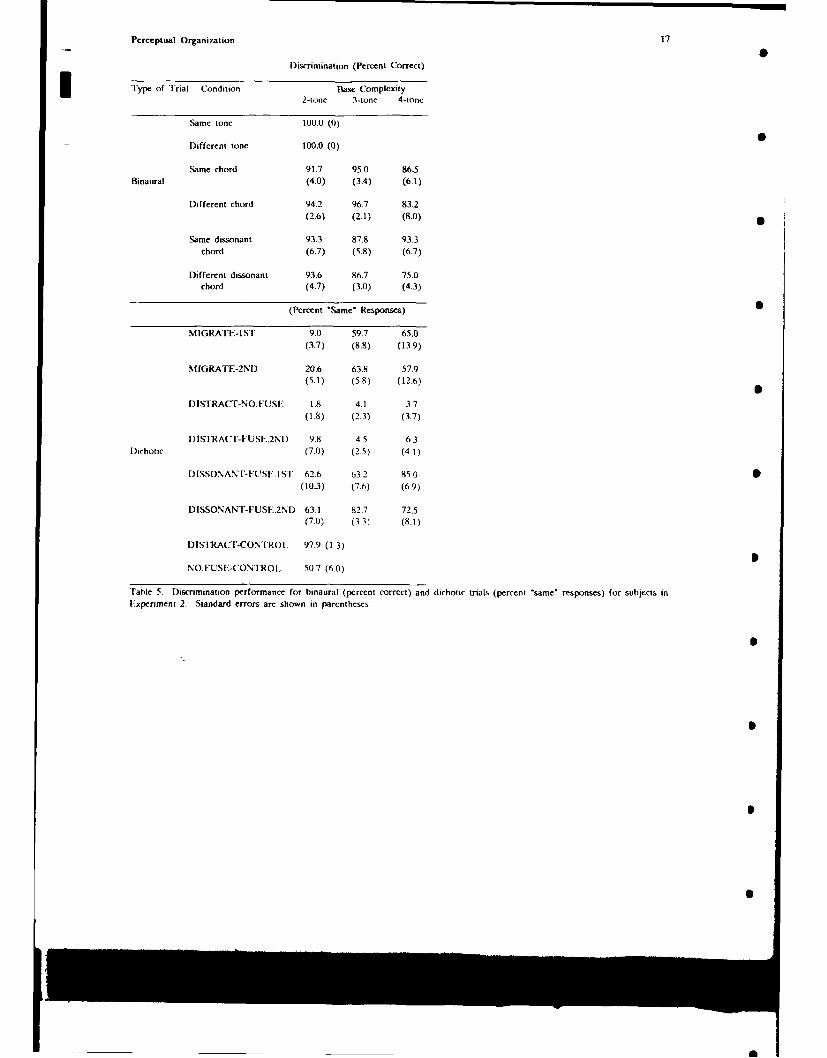
Perceptual Organization 17
Discrimination (Percent Correct)
l'ype of Trial Condition Base Complexity2-tone 3-tone 4-tone
Same tone 100.0 (0)
Different tone 100.0 (0)
Same chord 91.7 95.0 865Binaural (4.0) (3.4) (6.1)
Different chord 94.2 96.7 83.2(2.6) (2.1) (8.0)
Same dissonant 93.3 87.8 93.3chord (6.7) (5.8) (6.7)
Different dissonant 93.6 86.7 75.0chord (4.7) (3.0) (4.3)
(Percent 'Same' Responses)
MIGRATE-IST 9.0 59.7 65.0(3.7) (8.8) (13.9)
MIGRATE-2ND 20.6 63.8 57.9(5.1) (5.8) (12.6)
DISTRACT-NOFUSF 1.8 4.1 3.7(1.8) (2.3) (3.7)
DlISTRAC7I'-FUSFI.2ND 9.8 4.5 6.3Dlichotic (7.0) (2.5) (4 1)
DISSONANT-FUSF.IST 62.6 63.2 85.0 S(10.3) (7.6) (6.9)
DISSONANT-FUSE.2ND 63.1 82.7 72.5(7.0) (3.3) (8.1)
DIST.RACTS'-CONTROI. 97.9 (1.3)
NO.FUSI-CONTROI. 50.7 (6.0)
Table 5. Discrimination performance for binaural (percent correct) and dichotic trials (percent 'same' responses) for subjects inExperiment 2. Standard errors are shown in parentheses.

Perceptual Organization 18
Table 6. Symbols i"scd in probability formulae.
Key to Equation Symbols
Probability Symbol (Probability of) EventF fusion PF. fusion of A stimulus*F. fusion of X stimulusF_ fuse both A and XXF no fusion.F. no fusion of AYF. no fusion of X,F. fuse neitherM migration (or dominance).M no migrationV veridical perception
s I Condition same response I Conditiond I Condition different response I Conditiona binaural accuracy, identical chord trials pb binaural accuracy, different chord trials
*Subseripts for A and X stimuli also apply to migration and veridical perception.
Table 7. Probability formulae for determining the likelihood of various perceptual organizations for the given conditions inExperiments I and 2.
E_.•uaticn FormulaeI (s I FUSE-ErIIER) = a(.F. + F.) + (l-b)Il - (.F. + F_)]
lb (S F FUSE-EIrIER) = Ia.,f". + (l-b)(l-.F-j) + (a+b-l).F,
2 (s FUSE-NEITIIF'R) = a.l". + (l-b)(1 - F.)
3 (s I FUSE-EITiHER) = (s I I"USl-NEIIIIER) + (a+b-l)F.
31 F. = (s FUSE-FITIIER - s I FUISE-NEITIIER)/(a+b-I)
4 (s FUSE-I) = aF.V, + (l-h)(l- F,*V.)
Sa (s I MI(iRATE-IST) = a.I..V. + (1-11)(l - \1..V,)
5b (s I DISSONANT-FESE.IST) = a.|*..V, + (1-b)(I - F..V.)
sa, (s MIGRATE-IST) = a.NI + (l-b)(I - NQ)
sb' (s D l)ISSONANI-FUSII.1SI) - a*. 4 (1l-b)(l -I1,)
6 ([.,or M.) - U. + M. - I..-M,
Figure Caption
Figure 1 Proposed processes leading to object identification according to Feature Integration Iheory. including preattcntitvcindependent feature abstraction and attentive conjoining of features.
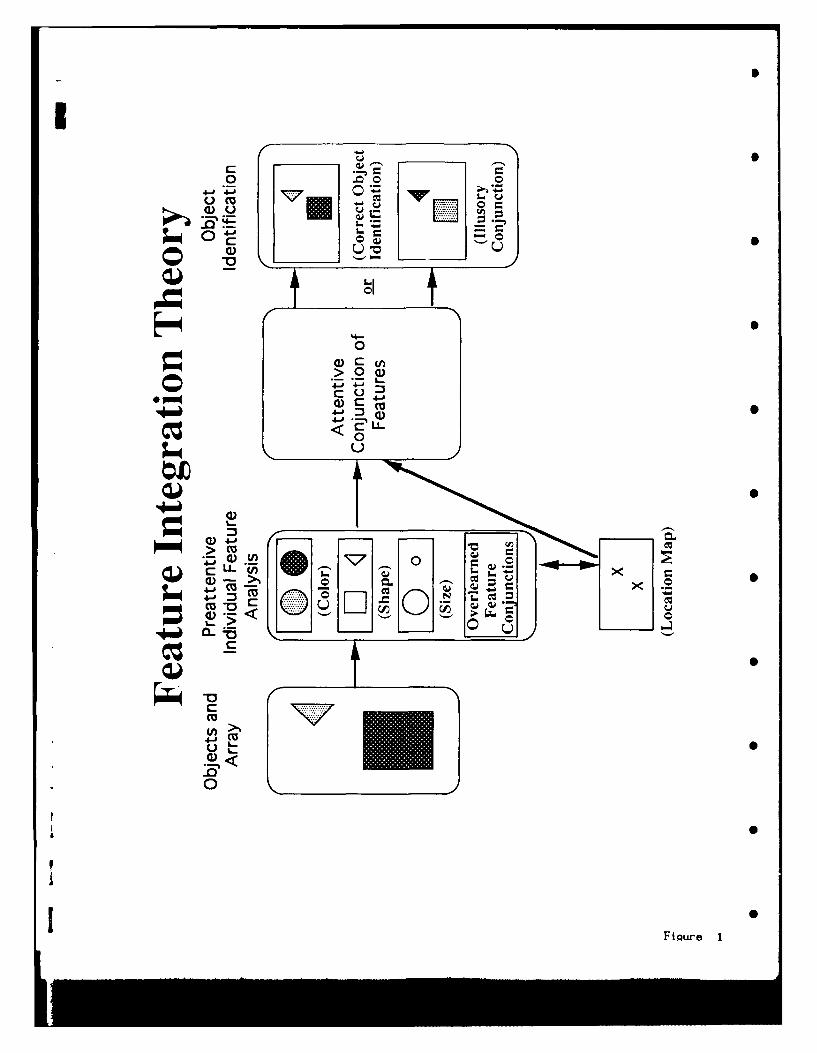
'S7
00
-e-S
4- 5
00
oo
<g.
0U
Fiur
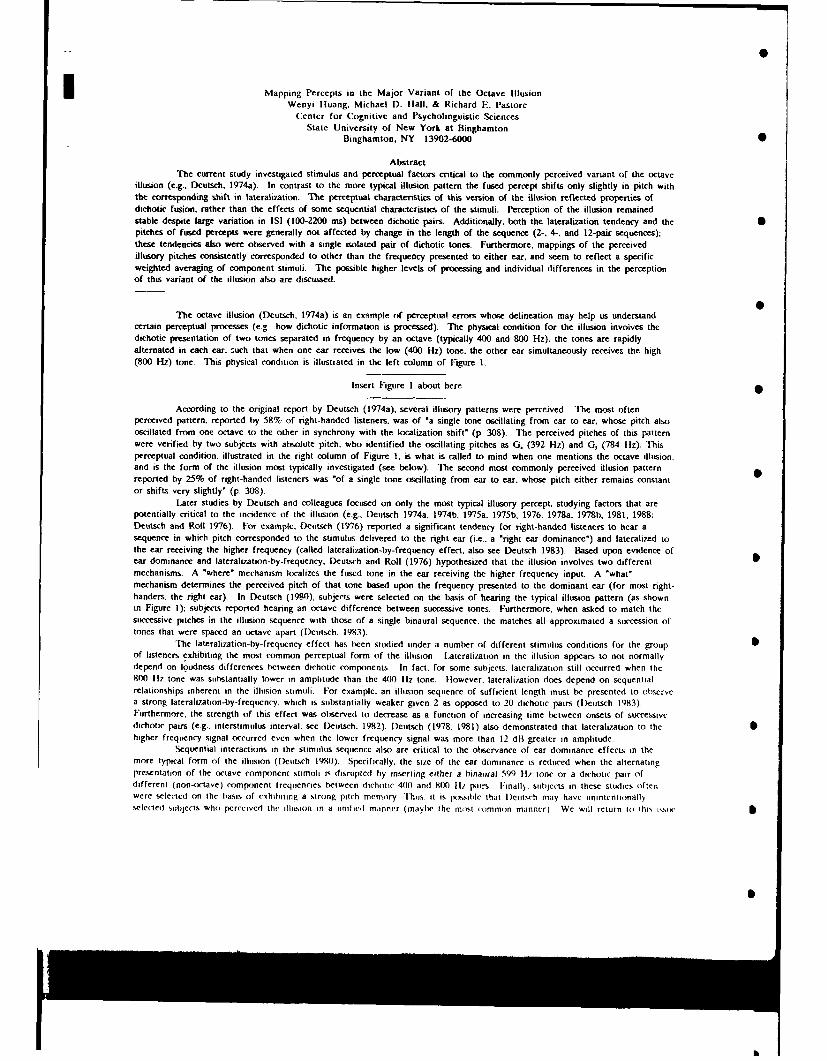
Mapping Percepts in the Major Variant of the Octave IllusionWcnyi Iluang, Michael D. Hall, & Richard E.. Pastore
Center for Cognitive and Psycholinguistic SciencesState University of New York at Binghamton
Binghamton. NY 13902-6000 •
AbstractThe current study investigated stimulus and perceptual factors critical to the commonly perceived variant of the octave
illusion (e.g., Deutsch, 1974a). In contrast to the more typical illusion pattern the fused percept shifts only slightly in pitch withthe corresponding shift in lateralization. The perceptual characteristics of this version of the illusion reflected properties ofdichotic fusion. rather than the effects of some sequential characteristics of the stimuli. Perception of the illusion remainedstable despite large variation in ISI (100-2200 ms) between dichotic pairs. Additionally, both the lateralization tendency and the Spitches of fused percepts were generally not affected by change in the length of the sequence (2-, 4-. and 12-pair sequences);these tendencies also were observed with a single isolated pair of dichotic tones. Furthermore, mappings of the perceivedillusory pitches consistently corresponded to other than the frequency presented to either ear, and seem to reflect a specificweighted averaging of component stimuli. The possible higher levels of processing and individual differences in the perceptionof this variant of the illusion also are discussed.
SThe octave illusion (Deutsch. 1974a) is an example of perceptual errors whose delineation may help us understand
certain perceptual processes (e.g. how dichotic information is processed). The physical condition for the illusion involves thedichotic presentation of two tones separated in frequency by an octave (typically 400 and 800 Hz); the tones are rapidlyalternated in each ear. such that when one ear receives the low (400 liz) tone. the other ear simultaneously receives the high(800 Hz) tone. This physical condition is illustrated in the left column of Figure 1.
Insert Figure I about here
According to the original report by Deutsch (1974a), several illusory patterns were perceived. The most oftenperceived pattern. reported by 58% of right-handed listeners, was of *a single tone oscillating from ear to ear. whose pitch alsooscillated from one octave to the other in synchrony with the localization shift" (p. 308). The perceived pitches of this patternwere verified by two subjects with absolute pitch, who identified the oscillating pitches as G. (392 Hz) and G, (784 Liz). Thisperceptual condition, illustrated in the right column of Figure 1. is what is called to mind when one mentions the octave illusion,and is the form of the illusion most typically investigated (see below). The second most commonly perceived illusion patternreported by 25% of right-handed listeners was 'of a single tone oscillating from ear to ear. whose pitch either remains constantor shifts very slightly' (p. 308).
Later studies by Deutsch and colleagues focused on only the most typical illusory percept, studying factors that arepotentially critical to the incidence of the illusion (e.g.. Deutsch 1974a. 1974b, 1975a. 1975b, 1976, 1978a. 1978b, 1981, 1988:Deutsch and Roll 1976). For example. Deutsch (1976) reported a significant tendency for right-handed listeners to hear asequence in which pitch corresponded to the stimulus delivered to the right ear (i.e., a "right ear dominance") and lateralized tothe ear receiving the higher frequency (called lateralization-by-frequency effect, also see Deutsch 1983). Based upon evidence ofear dominance and lateralization-by-frequency. Deutsch and Roll (1976) hypothesized that the illusion involves two differentmechanisms. A "where" mechanism localizes the fused tone in the ear receiving the higher frequency input. A "what"mechanism determines the perceived pitch of that tone based upon the frequency presented to the dominant ear (for most nght-handers. the right ear). In Deutsch (1980), subjects were selected on the basis of hearing the typical illusion pattern (as shownin Figure 1): subjects reported hearing an octave difference between successive tones. Furthermore, when asked to match thesuccessive pitches in the illusion sequence with those of a single binaural sequence, the matches all approximated a succession oftones that were spaced an octave apart (l)eutsch, 1983).
The laterali7ation-by-frequency effect has been studied under a number of different stimulus conditions for the group Sof listeners exhibiting the most common perceptual form of the illusion. Lateralization in the illusion appears to not normallydepend on loudness differences between dichotic components. In fact, for some subjects. lateralization still occurred when the800 Ilz tone was substantially lower in amplitude than the 400 Ilz tone. However. lateralization does depend on sequentialrelationships inherent in the illusion stimuli. For example. an illusion sequence of sufficient length must be presented to observea strong lateralization-by-frequency. which is substantially weaker given 2 as opposed to 20 dichotic pairs (Deutsch 1983).Furthermore, the strength of this effect was observed to decrease as a function of increasing time between onsets of successivedichotic pairs (e.g.. intcrstimulus interval. see l)eutsch. 1982). Deutsch (1978. 1981) also demonstrated that lateraliZation to the Shigher frequency signal occurred even when the lower frequency signal was more than 12 dB greater in amplitude.
Sequential interactions in the stimulus sequence also are critical to the observance of ear dominance effects in themore typical form of the illusion (D)eutsch 1980). Specifically, the size of the car dominance is reduced when the alternatingpresentation of the octave component stimuh is disrupted by inserting either a binaural 599 Wl, tone or a dichotic pair ofdifferent (non-octave) component frequencies between dlichotic 400 and 800 II/ pairs Iinall). stubjects in these studies oftenwere selected on the basis of exhibiting a strong pitch memory Thus. it is porssible that l)etitsch may have inintentionallyselected subjects who perceived the ilhlslorn in a unified manner (maybe the mst common manner). We will return to h hi% z1zut
S
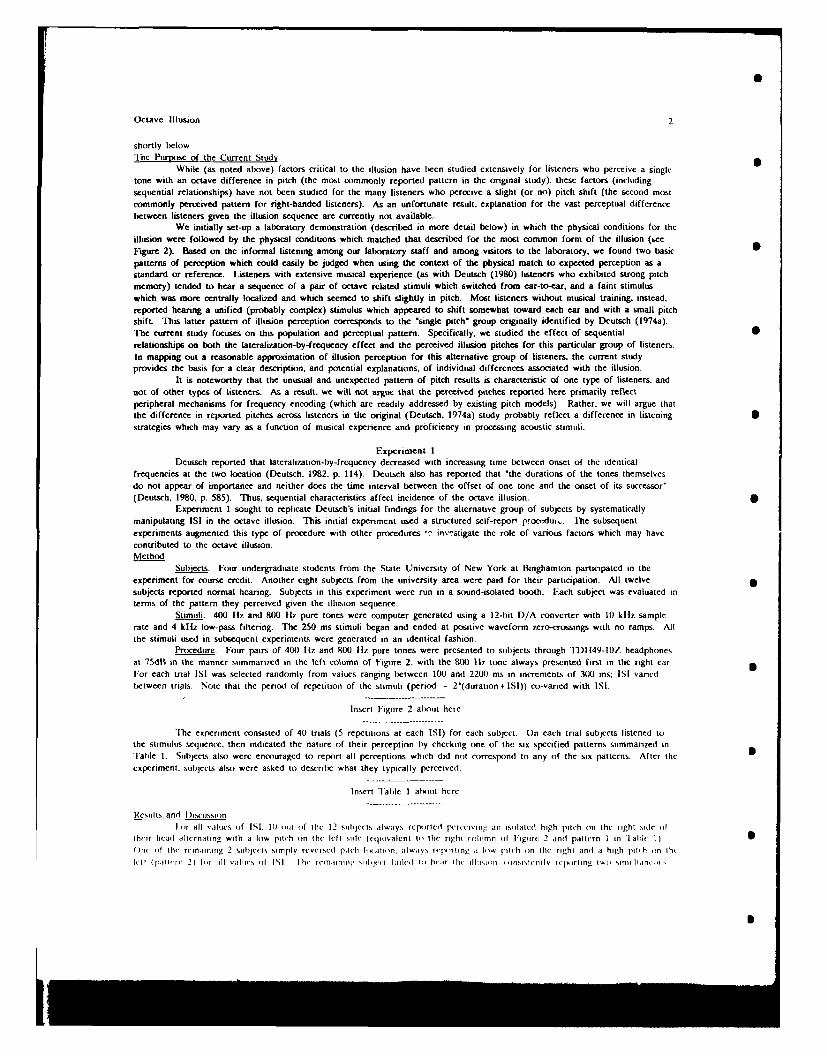
Octave Illusion 2
shortly below."Inc Purpiose of the Current Study
While (as noted above) factors critical to the illusion have been studied extensively for listeners who perceive a singletone with an octave difference in pitch (the most commonly reported pattern in the original study). these factors (includingsequential relationships) have not been studied for the many listeners who perceive a slight (or no) pitch shift (the second mostcommonly perceived pattern for right-handed listeners). As an unfortunate result, explanation for the vast perceptual differencebetween listeners given the illusion sequence are currently not available.
We initially set-up a laboratory demonstration (described in more detail below) in which the physical conditions for theillusion were followed by the physical conditions which matched that described for the most common form of the illusion (seeFigure 2). Based on the informal listening among our laboratory staff and among visitors to the laboratory, we found two basicpatterns of perception which could easily be judged when using the context of the physical match to expected perception as astandard or reference. Listeners with extensive musical experience (as with Deutsch (1980) listeners who exhibited strong pitchmemory) tended to hear a sequence of a pair of octave related stimuli which switched from ear-to-ear, and a faint stimuluswhich was more centrally localized and which seemed to shift slightly in pitch. Most listeners without musical training, instead,reported hearing a unified (probably complex) stimulus which appeared to shift somewhat toward each ear and with a small pitchshift. This latter pattern of illusion perception corresponds to the 'single pitch" group originally identified by Deutsch (1
974a).
The current study focuses on this population and perceptual pattern. Specifically, we studied the effect of sequential Srelationships on both the lateralization-by-frequency effect and the perceived illusion pitches for this particular group of listeners.In mapping out a reasonable approximation of illusion perception for this alternative group of listeners, the current studyprovides the basis for a clear description, and potential explanations, of individual differences associated with the illusion.
It is noteworthy that the unusual and unexpected pattern of pitch results is characteristic of one type of listeners, andnot of other types of listeners. As a result, we will not argue that the perceived pitches reported here primarily reflectperipheral mechanisms for frequency encoding (which are readily addressed by existing pitch models). Rather, we will argue thatthe difference in reported pitches across listeners in the original (Deutsch, 1974a) study probably reflect a difference in listening Sstrategies which may vary as a function of musical experience and proficiency in processing acoustic stimuli.
Experiment IDeutsch reported that lateralization-by-frequency decreased with increasing time between onset of the identical
frequencies at the two location (Deutsch. 1982. p. 114). Deutsch also has reported that "the durations of the tones themselvesdo not appear of importance and neither does the time interval between the offset of one tone and the onset of its successor"(Deutsch, 1980, p. 585). Thus, sequential characteristics affect incidence of the octave illusion. S
Experiment 1 sought to replicate Deutsch's initial findings for the alternative group of subjects by systematicallymanipulating IS[ in the octave illusion. This initial experiment used a structured self-reporn proceduT,. lhe subsequentexperiments augmented this type of procedure with other procedures *" in",ostigate the role of various factors which may havecontributed to the octave illusion.Method
Subjects. Four undergraduate students from the State University of New York at Binghamton participated in theexperiment for course credit. Another eight subjects from the university area were paid for their participation. All twelvesubjects reported normal hearing. Subjects in this experiment were run in a sound-isolated booth. Each subject was evaluated interms of the pattern they perceived given the illusion sequence.
Stimuli. 400 Hz and 800 Hz pure tones were computer generated using a 12-bit D/A converter with 10 kliz samplerate and 4 kllz low-pass filtering- The 250 ms stimuli began and ended at positive waveform zero-crossings with no ramps. Allthe stimuli used in subsequent experiments were generated in an identical fashion.
Procedure. Four pairs of 400 IHz and 800 Ilz pure tones were presented to subjects through '11)149-10Z headphonesat 75dB in the manner summarized in the left column of Figure 2. with the 800 Itz tone always presented first in the right earFor each trial ISI was selected randomly from values ranging between 100 and 2200 ms in increments of 300 ms. ISI vanedbetween trials. Note that the penrod of repetition of the stimuli (period = 2'(duration+ ISI)) co-varied with ISI.
Insert Figure 2 albout here
The experiment consisted of 40 trials (5 repetitions at each ISI) for each subject. On each trial subjects listened tothe stimulus sequence, then indicated the nature of their perception iy checking one of the six specified patterns summarized inTable 1. Subjects also were encouraged to report all perceptions which did not correspond to any of the six patterns. After theexperiment. subjects also were asked to describe what they typically perceived.
Insert Table I about hcrc
Results and l)iscussionuor all "ahicis of ISI. II) •ulit of INh 12 suilujert' always rr ported prrcetvung an isoilatcd high pitch on the right side of
their hradl altcrnaing with a low pitch on Ihr Irhf siide (eluitvalent tuu the right (i•himn of I lgiirr 2 and pattern I in I ablt. Ifu')" u'f th( rcmiinuni 2 stiijectis %imply revi'r',sed pitch iotatlion. alway', rcp'rting a low pil(h on the right and i high poth on ihc
1lt1 (p.iutturrn ') [r all %il of uol I, I hc rctnmilning 'ld faje l iled tI huir li- lb' i , u..i.t'lty ti-pul in' uiu s ui llurt-n, two'.
iS
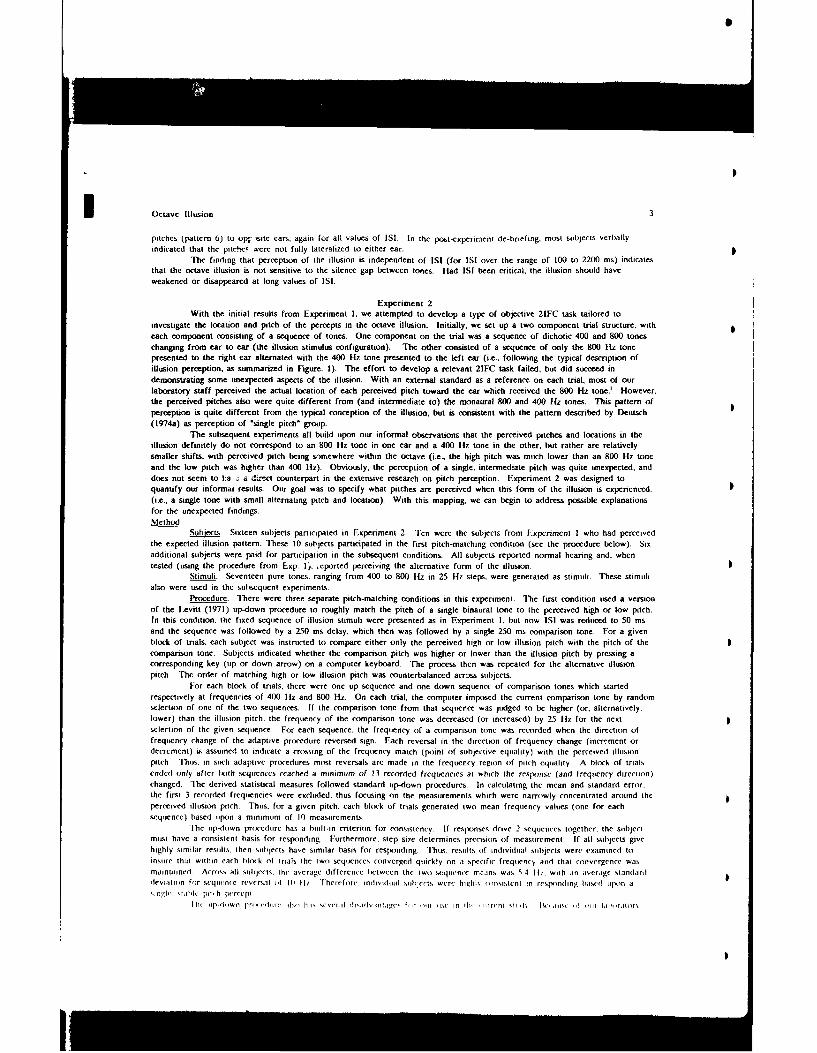
Octave Illusion
pitches (pattern 6) to opr ,site ears, again for all values of IS. In the post-experiment de-briefing, most subjects verbally
indicated that the pitchev wcre not fully latcralized to either ear.The finding that perception of the illusion is independent of ISI (for ISI over the range of 100 to 2200 ms) indicates
that the octave illusion is not sensitive to the silence gap between tones. Had ISI been critical, the illusion should haveweakened or disappeared at long values of ISI.
Experiment 2With the initial results from Experiment 1, we attempted to develop a type of objective 21FC task tailored to
investigate the location and pitch of the percepts in the octave illusion. Initially, we set up a two component trial structure, with
each component consisting of a sequence of tones. One component on the trial was a sequence of dichotic 400 and 800 toneschanging from ear to ear (the illusion stimulus configuration). The other consisted of a sequence of only the 800 Htz tonepresented to the right ear alternated with the 400 Hz tone presented to the left car (i.e., following the typical description ofillusion perception. as summarized in Figure. 1). The effort to develop a relevant 2IFC task failed, but did succeed in
demonstrating some unexpected aspects of the illusion. With an external standard as a reference on each trial, most of ourlaboratory staff perceived the actual location of each perceived pitch toward the ear which received the 800 Hz tone.' However.the perceived pitches also were quite different from (and intermediate to) the monaural 800 and 400 Ilz tones. This pattern ofperception is quite different from the typical conception of the illusion, but is consistent with the pattern described by Deutsch
(1974a) as perception of 'single pitch" group.The subsequent experiments all build upon our informal observations that the perceived pitches and locations in the
illusion definitely do not correspond to an 800 Hiz tone in one ear and a 400 Hz tone in the other, but rather are relativelysmaller shifts, with perceived pitch being somewhere within the octave (i.e., the high pitch was much lower than an 800 Hz toneand the low pitch was higher than 400 Hz). Obviously, the perception of a single. intermediate pitch was quite unexpected, anddoes not seem to l:a ý a dice-ct counterpart in the extensive research on pitch perception. Experiment 2 was designed toquantify our informat results. Our goal was to specify what pitches are perceived when this form of the illusion is experienced.(i.e., a single tone with small alternating pitch and location). With this mapping, we can begin to address possible explanationsfor the unexpected findings.Method
Subiec . Sixteen subjects participated in Experiment 2. Ten were the subjects from Experiment I who had perceivedthe expected illusion pattern. These 10 subjects participated in the first pitch-matching condition (see the procedure below). Sixadditional subjects were paid for participation in the subsequent conditions. All subjects reported normal hearing and, when
tested (using the procedure from Exp. 1). ieported perceiving the alternative form of the illusion.Stimuli. Seventeen pure tones, ranging from 400 to 800 Hz in 25 Hz steps. were generated as stimuli. These stimuli
also were used in the subsequent experiments.Procedure. There were three separate pitch-matching conditions in this experiment. The first condition ised a version
of the Levitt (1971) up-down procedure to roughly match the pitch of a single binaural tone to the perceived high or low pitch.In this condition, the fixed sequence of illusion stimuli were presented as in Experiment 1. but now ISI was reduced to 50 msand the sequence was followed by a 250 ms delay, which then was followed by a single 250 ms comparison tone. For a givenblock of trials, each subject was instructed to compare either only the perceived high or low illusion pitch with the pitch of the
comparison tone. Subjects indicated whether the comparison pitch was higher or lower than the illusion pitch by pressing acorresponding key (up or down arrow) on a computer keyboard. The process then was repeated for the alternative illusionpitch. The order of matching high or low illusion pitch was counterbalanced across subjects.
For each block of trials, there were one up sequence and one down sequence of comparison tones which startedrespectively at frequencies of 400 Hz and 800 Hz. On each trial, the computer imposed the current comparison tone by randomselection of one of the two sequences. If the comparison tone from that sequence was judged to be higher (or. alternatively,lower) than the illusion pitch. the frequency of the comparison tone was decreased (or increased) by 25 |Iz for the next
selection of the given sequence. For each sequence, the frequency of a comparison tone was recorded when the direction offrequency change of the adaptive procedure reversed sign. Each reversal in the direction of frequency change (incr-ment ordecrement) i. assumed to indicate a crossing of the frequency match (point of subjective equality) with the perceived illusionpitch Thus. in such adaptive procedures most reversals are made in the frequency region of pitch equality. A block of trialsended only after ioth sequences reached a minimum of 13 recorded frequencies at which the response (and frequency direction)changed. The derived statistical measures followed standard up-down procedures. In calculating the mean and standard error.the first 3 recorded frequencies were excluded, thus focusing on the measurements which were narrowly concentrated around the
perceived illusion pitch. Thus. for a given pitch, each block of trials generated two mean frequency values (one for eachsequence) based upon a minimum of 10 measurements.
The up-down procedure has a biiilt-in criterion for consistency If responses drive 2 sequences together, the subjectmust have a consistent basis for responding. Furthermore. step size determines precision of measurement. If all subjects givehighly similar results, then subjects have similar basis for responding Thus. results of individual sibjects were examined to
insure that within each bltx-k of trials the two sequences converged quickly on i specific frequency and that convergence wasmaintained AC'ruus all siiljeets. Ihc average differennce tetween the iwii veqwienec mean% was st II,. with in average standarddleviation for seqiuentc reversal of I0 lli TIhrefore. Indlivhidual Suibjects were high; consistent in responding liscd uilu-in as. t-,m I . sIthl pi t, h 1i 'rcpi
lIh ,1.i wu prou,, - ,i .l-i h-i .. 'I ris't-iii lcr- i r ii use 11, - in v , ,rrt-ni it It- lluc ,, I it ii lahiritlirs
I1
Octave Illusion 4
structure. we could only run one subject at a time. Furthermore, because of hardware constraints, the subject had to be seatednear the computer and thus in the laboratory control room (rather than in a sound chamber), shutting-down the rest of the
laboratory. Therefore, for the remainder of the study we utilized a different procedure with multiple subjects beingsimultaneously run in sound chambers.
The second pitch-matching condition again evaluated the perceived high and low pitches in 4-pair illusion sequences.
this time using the method of constant stimuli. In addition to the pragmatic concerns summarized above, there were two reasons
to run this condition. Although the method of constant stimuli lacks an inherent internal standard for reliability, the shape and
slope of the psychometric function of each individual can provide basis for evaluating reliability and precision of measure. Thus,the method of constant stimuli allows an alternative evaluation of the stability of perception in terms of the slope of
psychometric function of each individual subject (computed by linear regression of z-score transformed data). Also, we could
compare results across methods to determine if the obtained pitch matches depend upon the psychophysical method used.
The task for the subjects in all conditions was to report whether the pitch of the comparison tone was higher or lower than
the designated (high or low) pitch in the illusion sequence. Subjects indicated their response by pressing one of two
corresponding buttons. In this condition the comparison stimulus for each trial was randomly selected from the full octave range
(400-800 Hz), not just a narrow range of comparison frequencies determined by previous trials. (Pilot work with both methods
also had utilized stimuli outside of the octave, but the pitch of these stimuli was clearly highly discrepant from any illusion pitch,and their inclusion decreased the amount of relevant data which could be collected from each individual subject. The •comparison stimuli thus were limited to the octave range). A third pitch-matching condition was run with method of constantstimuli to evaluate the possibility that the perceived difference between high and low pitches was a function of sequence length.This third condition used 12 pairs of illusion stimuli.Results and Discussion
The pitch comparison results from the first condition (adaptive procedure) are summarized in Figure 3. which plotsfrequencies of tones matched to the high versus low pitch for each subject The two axes of this scatter-plot represent the full
range of the octave. Most of the data are concentrated in the lower half of the octave, showing that the perceived high and Slow pitches were more toward 400 lt7 than 800 11z. The regression line has a slope of 0.91 (r2=.78), indicating a relatively
constant difference between high and low pitch matches and consistency of data across subjects. The mean frequencies of high
and low pitch mateh," were SSO and 501 I-,, respectively, resulting in a mean difference of 49 'lz.
Insert Figure 3 about here
Under the method of constant stimuli, the psychometric functions of each individual subject in the 4- and 12-pair 5conditions exhibited very steep slopes: the mean frequency change for the inter-quartile range (middle 50% of a psychometricfunction) was only 10 Ilz. The steep slope of the individual psychometric functions indicates that the perceived frequency ofthe high and low pitches in the octave illusion was highly stable for each subject.
The scatter-plotted results for the method of constant stimuli are summarized by the filled symbols in Figure 4 (theopen symbols are the results from a subsequent experiment). The filled circles and filled squares represent the data for 4- and12-pair sequences respectively. The pitch-match data for both sequences again are concentrated in a very narrow range offrequencies in the lower half of the octave, revealing that most subjects perceived highly similar pairs of pitches. In fact. the
range of perceived pitch across subjects is too narrow to compute a meaningful regression line for the full data set. With the 4-pair sequence, respective mean frequencies of the high and low pitch match across subjects were 548 and 510 Itz when computedfrom the psychometric function using a linear regression based upon frequency (or 546 and 507 l11 when based upon logarithmicfrequency). resulting in a mean difference of 3A Itz. With the 12-pair sequence. the mean frequencies for high and low pitcheswere 538 and 497 Hz (or 536 and 495 lIz when based upon logarithmic frequency). resulting in a mean difference of 41 lfzi(The lack of differences between matches obtained from regressions based on linear and logarithmic frequency reflects the steepslopes of the individual psychometric functions.) The difference between perceived high and low pitches within each conditionwas statistically significant in all three pitch-matching conditions [4-pair adaptive procedure. t(9)=5.96, p<.fL: 4-pair constantstimuh procedure, t(5)-5.24. p<01t. and 12-pair constant stimuli, t(5)=5.20, p<.011.
Insert Figure 4 aliu here
(hven the significant overlap of the pitch-matching data for 4- and 12-pair constant stimnli cinditions. it is notsurprising that the t-test of the perceived pitch difference between the 4-pair and 12-pair sequence was far from being
statistically significant It(5)= 2(1, p>.501 Perceived pitch. therefore, was not a function of sequencc length, at least for thesequences studied. Furthermore. the difference between the perceived pitches measured using the adaptive procedure (firstcondition) did not differ from that measured using the method of constant stimuli (second condition) lt(14)-.94. p>.21. showingthat method is not important in the precision of pitch measurement Witth procedures consistently indicate pitches correspond tonarrow range between approximately 5O(1O and 550 II,. and definitely a less than the 400 Ili defining the full octave, Therefore.similar pattern of percepis were olbserved in either methodl The following two exlprimenLs used a single mnethitl. the methodof cuintant simuhii
We ito not claini that owr siihije(ts. who ire relatively nmiisiially naive, are perceiving u singiilai tional qilahty It is
uitil [wiusitle that -he siulbjects lro hi itinL ii a onihlux so tihmls which his a distinct' ptclh qliilat and that this pith h ulcurlk d(o'.
not.. i u rre[sr nd Ito th, pit.h of (.lii i, I Ow l ,rign, al sIi mi hlt si li l -isii ut slihijeui's ue uri' rlt -Id i 'tl ig u 1 c iiihts 1"1 -t 1
Octave Illusion 5
intermediate between the original frequencies and which were skewed toward the low-frequency end of the octave. Tihe pitchmatch results seem to suggest that our perceptual system is performing some type of weighted average of the dichotic frequencyinputs, resulting in the perception of a fused stimulus of intermediate pitch. A quantification of this averaging process will bepresented in the general discussion along with a discussion of the possible nature of the pitch percept.
Experiment 3A reviewer on an earlier version of this manuscript suggested that our subjects were actually hearing stimuli an octave
apart, with the pitch results reflecting a lack of ability of musically naive subjects to perform the matching task. With this lackof subject ability, the two procedures were conjectured to exhibit a regression toward an intermediate frequency, rather thanproviding separate measure of the same percepL This reviewer further suggested that the use of a broader range of comparison •stimuli probably would result in different pitch matches. A second reviewer conjectures that the intermediate pitch results mightbe artifacts of having used linear rather than log frequency for the psychometric functions. Therefore. in this experiment weagain will present both solutions. Experiment 3 represents a control to verify that the pitch results are reasonable, and notartifacts.Method
Subect. Ten subjects participated in Experiment 3. Nine were undergraduate students who participated in fulfillmentof course requirements. The first author also participated.
Stimuli. The comparison tones were generated in the same fashion as in the earlier experiments. The frequencies ofthe comparison tones ranged from 350 to 850 Hz with a 25 Hz sep size.
Procedure. Two conditions were run using the method of constant stimuli. In the first condition, subjects matched thehigh or low pitch of a 4-tone monaural sequence consisting of alternating 400 and 800 Hz tones, thus mimicking the most typicalillusory pattern of pitches reported by Deutsch (1974a). The second condition instead used the 4-pair illusion sequence ofExperiment 2 as stimuli.Results and Discussion
The pitch-match results from both conditions are shown in Figure 5. The open symbols represent the pitch matchesfrom the monaural condition; the filled symbols represent pitch matches from the illusion sequence. There is no overlap ofmatches between the two conditions. The dark asterisk represents the mean pitch matches obtained in Experiment 2 for the the4-pair illusion using the method of constant stimuli. This reference point is well within the range of results for the replicationof this condition.
The mean pitch match for the monaural 400 and 800 liz tones were 444 l1z and 739 1t7, respectively: the differenceof 295 Hz between high and low pitches is significant it(9)=13.25, p<.Ol. In the illusion sequence condition, the mean matchesfor the high and low pitches were 528 and 479 l1z respectively; the difference of 49 Hz between pitches is also significant/t(9)=3.68. p<.01J. Clearly, the actual pitch matches and the magnitude of differences between high and low pitches differsignificantly across the two conditions 1295 vs. 49 Hz- t(9)=9.44, p<.01i.
Differences between pitch matches from regressions based upon linear and log frequency psychometric functions didnot exceed I liz in the monaural condition, and 3 Hz in the illusion sequence condition. Again, this lack of difference indicatessteep slopes for the individual psychometric functions, and thus the consistency of pitch judgments. If the obtained matches tothe illusion sequence merely reflected subjects attending to the frequency of either component in isolation (i.e., sometimesperceiving a 400 Hz pitch and other times perceiving an 800 Ilz pitch), as a reviewer suggested, then steep psychometricfunctions would not have been obtained. Thus, these matches appear to reflect the stable perception of pitch based upon somesort of averaging of the dichotic components.
As with all subjects, the three subjects who most accurately matched the 400 and 800 Ilz tones in the monauralcondition (represented by open circles in Figure 5) also gave illusion pitch matches which closely approximated the mean resultsfrom Experiment 2 (the filled circles in Figure 5). Except for the one subject who could not accurately perform the monauralpitch-matching task (open square), most subjects provided relatively accurate monaural performance. Such relatively accuratematches indicate that most subjects were capable of providing reasonable pitch matching. and all subjects provided very differentpitch matches, for the illusion and control conditions. Thits. the reported pitches for these subjects in the illusion conditionshould reasonably reflect perception foi these subjects, not merely a procedural artifact
Insert Figure 5 aliout here
Experiment 4In I xperuments I and 2. incidence of the alternative octave illusion was not greatly affected by either ISI (ir sequence
length (4-pairs vs 12 pairs). We thus wanted to evaluate the incidence of the illusion with shorter sttmiuli sequences.I-xperiment 4. therefore. evaluated the perception of pitch and lication for a minimal illsioni sequence of the dichotic 40(0 and9001 II/ tones It r . 2 dichoitc pairs. and thus I illusion cycle).
MethodSiec Sisixteen silhjei(ts pi.rtp•uicd in I sxp'rument 4 I leven were undergradiites partici'tpiutn 1g itr ti iursc credlil
ii)ur others. were paid for their partlicipation I 'he first lautho r also servc'd as i stii '(ctu
l'rvetdir I here were iwo tonditii,,ns in this expernmentr In the first nlii-n Wnu the Iw-� fitnr ilh•i.n swlp-ni 'cwire preicnt-,ul with the t00t1 II tome ;ilw.uy. in the right i~ir [it- th litrst putr Aý in I s.l-rnti-nit 2, Oh riit-,uii Ion (it,lt p11t[

Octave Illusion 6
was 250 ms and the interval between two pairs was 50 ms. On each trial subjects reported whether one or two tones wereperceived for both the first and second dichotic pairs presented. If perceiving one pitch per dichotic pair, subjects also reportedthe location of the percept and which stimulus (1st or 2nd) was higher in pitch. The report procedure for this first conditionwas similar to that used in Experiment 1. Subjects who perceived the typical variant of the illusion subsequently participated inthe second condition, which consisted of separately matching the high and low illusion pitches using the method of constantstimuli.
Results and DiscussionThirteen subjects perceived the typical variant of the illusion. Two of the remaining 3 subjects repurted hearing the
identical pattern of localization, but with the low (rather than the high) pitch firsL The remaining subject perceived twosimultaneous pitches for each dichotic pair. Therefore, the rate of perception of the illusion pattern with a minimal illusionsequence of two dichotic pairs is as high as found for any of the longer illusion sequences studied in the earlier experiments.Once again the data showed that sequence length is not critical to the incidence of illusion.
The pitch match results for the 13 subjects who perceived high pitches toward the right ear are shown in Figure 4 asopen squares. This scatter plot again indicates that the perceived pitches were distributed over a narrow range of frequencies inthe lower half of the octave. The mean frequencies for perceived low and high pitches were 508 and 535 Hz (505 and 533with log regression solution). Therefore. the mean difference in perceived pitch was 27 Hz. A t-test revealed that thedifference between the matches to the perceived high and low pitches was statistically significant it(12)=4.19 p<.01 . Although Sthere is more variability in these results relative to the 4- and 12-tone sequences (filled symbols), the general trend in the resultsis quite similar.
The results of Experiment 4 indicate that the nature of pitch perception in the illusion persists even with a minimallength sequence. Although the absolute differences between high and low pitches may be somewhat smaller than found forlonger (2- and 6-cycle) sequences. The results still demonstrated that sequence length is not critical to the illusion. However,we do not reject the notion that the sequence length may have effect on the perceived difference. Although not significant. theperceived pitch difference in 4- and 12-pair sequence was greater than that in 2-pair sequence. Conversely, with most subjects in SExperiment 4 perceiving illusion percepts in a single cycle sequence, dichotic fusion would seem to be a contributing factor to theoctave illusion, as was preposed by Bregman (1990. p 306).
Experiment 5Experiment 4 suggested that fusion could be the critical factor in the octave illusion. If so. then subjects sholid still
perceive a single fused tone even if only one pair of dichotic 400 and 810 Hz tones is presented. Furthermore, if pitch matchesto fused tone pairs (differing in the presented location of the 400 and 800 Hz components) are similar to those found in theearlier experiments, then fusion could be argued to provide a basis for the perception of this alternative form of the octaveillusion. Given the role of other stimulus and listener characteristics in fused stimuli, the central question concerning the illusionthen would become why the perceived pitch toward the right ear is different (usually higher) than that toward the left ear?"The two plases of the curment experiment thus evaluate the nature of perception. including the possible location and pitchpercepts of fused stimuli associated with a single pair of 400 and 800 lIz tones. The first phase of the experiment evaluatedthe number of pitches perceived a id. If a single pitch was perceived, the subjects were asked to also report the location of theperceived pitch. The second phase evaluated the frequency of the perceived pitch. (assuming the perception of a single tone).
There is one major conceptual difference between pitch matching for the current and the earlier experiments. In theearlier experiments subjects heard a sequence of at least two stimuli and thus could logically be instructed to match the higher orlower pitch with the pitch of the comparison stimulus. With only a single stimulus, the relative concept of 'higher' or 'lower^pitch is meaningless. In this experiment we can only evaluate the pitch perceived for a specific condition of stimuluspresentation (e.g.. 800 Hz presented to right vs to left car). With this inherent difference in task, the pitch matching results willie discussed in the general discussion section.
MethodM Subtect. Twenty undergraduate students from SUNY-Bunghamton participated as a course requirement. All subject%
reported normal hearing and participated in both phases of the experiment.Pr edure. In the first phase of the experiment following presentation of a pair of dtchotic 400 and 8(m4 II; tones,
suuiJects pressed a button to indicate whether they perceived one or two tones If one tone was perceived, subjects, alsoindicated the location of the tone (left ear, left side. middle, right side, and right car). There were 20 randomized trials in thisphase of the experiment. For 10 trials, the 800 Ili time was presented to the right ear: in the other I0 trials, the W) III tonewas presented to the left ear.
"The second phase of the experiment was the pitch-matching task using the method of constant stimuli in which a single apair of 400 and 800 Itz pure tones was diehotically presented for 250 Ms. followed by a 250 ms silence interval, then a 2511 mscuompanson tone. Sutuje(`s pressed one of two buttons to indicate whether the comparison tone was higher or lower in pitch
than the initial tone
(rsillts and I)sisUsiuOnlahle 2 smmmaruzes the reults of the fir', phase oit the rxperiment When the 81)I II/ tine was presentcd to the left
car. slubjects reported hearing one tone on 9217, of all trials. A single fused tone was pi.ercivedt either in the Iclt car or t, o irdthr left side of the head on 47%s of trials, at a central tixalt n on I' ; r uts,,%. and either tuuwar,
1 !h,' -,ght side of the had (,t
,hrmeilv in the right ear on only 13f7 of trials A ihi-supire test (ontiriucd thm,1 when i,00 If/ was prcescnted to the Icli cr ihcIr1l v. nu • i k els T( be wre'cived tlowalrd ti l Ih ( ((hi (0 1,0 , 1, ,W \th(i III, SOi, II/ 1 ' iu,nui wins 1 rrui' l ii blur ilt" i the t .1
Octave Illusion 7
a single tone was perceived on 9(60/ of trials. A singular pitch was perceived toward the right side or ear on 68% of trials, at
central location on 20% of trials, and to the left side or ear on only 8% of the trials (the remaining 4% representing dual-pitch
perception). 'The location of the perceived tone was significantly more toward the right side when 800 lHz was presented to the
right ear (chi2
=63, p<.01). Furthermore, the incidence of fusion and the pattern of perceived locations for the fused tone was
quite consistent across individu ' subjects. The results of phase one therefore demonstrate that fusion occurs for a single
dichotic pair of harmonic stimuli, and that the fused tone is more likely to be perceived toward the ear receiving the high
frequency input.
Insert Table 2 about here
However, this tendency was stronger when the higher frequency was presented to the right ear, indicating that the lateralization-
by-frequency effect is additionally influenced by a type of right ear dominance. We realize that this conceptualization only
descTibes the findings, and does not provide an explanation of results. However, possible contributing factors for lateralization
are discussed in more detail in the general discussion.
The pitch-match results for the 20 subjects, shown in the open circles of Figure 4, are highly similar to the resultsfrom the 2-. 4-, and 12-pair sequences from our earlier experiments. These data again are concentrated in the lower portion of
the octave range, but they are distributed sufficiently to compute a reliable regression line (rf2
=.82). The slope of this line is
.87. which is close to that found with the initial 4-pair sequence (Figure 3). The slope approaching I and the high correlation
coefficient respectively indicate that there is an approximately constant difference in frequency for the high and low pitchmatches. When the right ear received the 800 Hz tone, the mean pitch was 524 l1z (521 liz for log frequency); when the left
ear received 800 Hiz tone, the mean pitch was 503 Hz (501 Hiz for log frequency). The perceived difference is 21 Hz. A t-test
showed that the perceived lifference between these means was statistically significant jt(19)=4.38. p<.011. Thus, not only did
fusion occur for a single pair of diehotically presented 400 and 800 Hz tones, but the pitch perceived when the 800 H|z tone was
presented to the right ear was significantly higher than when 800 Hz was presented to the left ear. Although smaller than the
38 to 41 liz difference for the 4- and 12-pair sequences, the difference is quite similar to the 27 Hz difference for the 2-pair
sequence.
These findings provide a strong basis (i.e.. the nature of fusion tinder different presentation conditions) for why in theoctave illusion a single tone is perceived, with pitch and location changing with the change of ear presentation. Taken as a
whole. 'xps. 1-5 provitie support for the argument that the dichotic fusion of octave-related tones is the cr.,ical factor in the
octave illusion
General DiscussionThe octave illusion has three distinctive perceptual characteristics: (1) perception of one tone at a time, 2) the
perceived fused tone tends to be lateralized toward the ear receiving the higher frequency input, and (3) the tone perceived to
each side(right vs left) has a different pitch. We will itisdwdually addre.s each of these shree characteristics below.Perception of one tone at a time
Subjects in Experiment 1-4 must have fused the dichotic stimuli to perceive a single pitch; if (as found with a few
musically trained subjects) two simultaneous pitches had been consistently perceived, the illusion would not be possible. Taken inconjunctuon with the demonstration in Experiment 5 of frequent dichotic fusion for only a single pair of octave-related tones, thedata reveal that the perception of one tone at a time in at least the alternative form of the octave illusion can be attributed to
the dichotic fusion of the octave-related tones. The occurrence of dichotic fusion may be due to some form of special
relationship between harmonically-related, and. more specifically, octave-related stimuli McAdams (1982) has demonstrated that
subjective fusion is much higher for harmonic (shared fundamental) than for inharmonic stimuli. More recently, Buell and
Hafter (1991) demonstrated an inability to segregate such harmonically related stimuli even when there is significant lateraldisplacement of the tones.
Although there is a perceptual affinity for harmonically related tones, we have known from at least the time ofIlelmholti that octaves represent the most consonant of stimulus relationships and exhibit the highest tendency for fusion Morerecent, empirical findings include those of Ward (1954), who. asking listeners to adjust a tone to match a specific pitch
relationship to a presented tone. found that listeners most reliably matched the ,' tdve Ward concluded that the saibjecttvec'tave should be the most stable musical pitch relationship
A special, central nature of perception of octave-related tones has been dr,,tcissed by lerhardti (1974) and has beendemonstrated recently by l)emany and colleagues (l)emany and Semal 1988. 19911; Demany. Semal, and (.arlyon 1991). Demany.
et al (1988) diehotically presented two simultaneous, sinutsoidal frequency-modulated tones to listeners, listeners were instructed Sto detect phase differences between the modulated tones. D)emany. et al fouinid that the just noticeable values of phase
diiferences were at a minimum when the tones' center frequencies differed bv clouse to 1200 cents (one otýave). I'hese. andsimilar residis have led to the concluion that octave relationships are special in tennis of perception anti are central in origin
I atcrai•,Ation of the fused tone
lic fiiseid tone tended to hxe lateralt/ed Iowird the car receviing the higher frecqlincv input. IHIwever. might suchIili/uition l, d uc to differences in lowlness rather thin frequencv' Ifhire uis some indh •i ruoin that bIth relative frequicncy ani
lInusýi are tmlvri.nu to the fixation ifl a pitch percept with each l' ncung rc.ltiu \ clN 1llvl'er itilcs in different stimulus settings •
, rvun, ( wtim-n 11)7(,) I)elesli (1978,. 1181l) showed thur the laterahii •,in to th," high Itru-quruis(v cir eveni when the anplhitude ol
1h, t l,hi'r I! , p., n, , ll u ii •1uulv" ir a id lilly liwer tht-ti the .niu hi idc i ,I t(I.i'l It h , l I iii .lo"I lm d (lit. I " lN) , I dl
Octave Illusion If
that the location of fused dichotic tones tend to tie lxated to the side :eceiving the louder stimulus In contrast to these earlierstudies, our ýwo frequencies (400 and 800 ilz) were equal in intensity and thus should differ in loudness by no more than 3
phones (Fletcher & Munson, 1933). One can obtain perceptible changes in laterahzation with interaural differences of one dB orless, but this is more typical for higher frequencies than were the frequencies used in the current study. Therefore. it is still anopen question whether the significant lateralization effects in the current study were the result of loudness differences. Thus.although there is insufficient evidence to draw a final conclusion on whether the location of a percept is determined by relativefrequency, rather than by relative loudness or by both, the preponderance of eYsting results tend to favor the relative frequencyhypothesis. experiment S also demonstrated a relatively stronger tendency to lateralize the fused tone toward the right sidewhen the higher frequency was presented to the right ear relative to the tendency to lateralize to the left side when presentedto the left ear. This finding suggests that the right ear has some advantage in lateralizing the fused tone. Further analyses ofour results (below) will allow us to estimate the relative magnitude of such ear advantage.
Perceived pitch differenceThe pitch-mstel-tng results of Experiments 2-5 are consistent with the notion that the auditory fystem performs some
type of weighted averaginI, -f octave-related dichotic inputs to determine the pitch of the fused percept.' Thus, we can make nospecific claims concerning wh, isrmet -f nitch were studying. Furthermore, the pitches we measured in the current studyseemed to be relatively consister,. across subjects. The frequency of the fused pitch, F,. then might be described by the simpleformula:
F,= RIF, + L*F, (1)In this formula R and 1, are relative weighting factors for the stimuli presented to the right and left ears; these weights are
assumed to always sum to unity (i.e.. R = 1 - L). F, and F, respectively are the frequencies presented to the right and leftears ii' the current study F, and F, were either 800 or 400 IlL If the perceived pitch was determined solely by the input tothe dominant ear, then the value of R in FEq. I must be 1. Clearly it is not the case here for the form of the illusion studied.
Our results demonstrate a very strong. but not universal, tendency for subjects to hear a relatively higher pitch whenthe higher frequency (800 It|) was ,resented to the right ear for sequences of 2. 4, and 12 dichotic pairs. It thus seemed morereasonable to initially focts the formula on relative frequency. rather than on ear of presentation. To accomplish this change offocus. Eq. 2 is analogous to Eq 1. but with the modification to reflect weights for the higher and lower frequency tones.
F, I I I'l". + lF, (2)F. and F, again are 800 and 400 117 (now independent of ear of presentation): II and i. are the respective weights for 800 and400 llz tones and again must sum to unity. Since Eq. 2 assumes the perceived pitch to be a function of the presented locationof the 800 I17 tone, we must solve 'Iq 2 using a different pair of high and low frequency weights for each of these twopresentation conditions.' The two pairs of weights should therefore reflect the perceived higher and lower pitches when 800 II1wa, presented to either the right or left ear. with the difference in weights reflecting the contribution of ear advantage.
Insert Table 3 about here
Table 3 s'immanzes the II and I weight, from Eq. 2 as a function of sequence length and percei, :d pitch. Theweights II and L are consistent across different sequence lengths: the means for II and L respectively were U.36 and 0.A4 whenthe higher pitch was perceived, and 0.26 and 0.74 when the lower pitch was perceived. These weights provide quantification thatthe perceived pitch is a product of combination of frequencies presented to two ears
"The I-pair pitch match results (Experiment 5) were based solely on presentation condition and not on -clative pitch.Experiment 5 indicated that there was a strong. but not absolute tendency for the location of a fused tone to be correlated withthe ear receiving the higher frequency tone as reported by D)eutsch (1978. 1981). If these measurements ot localization tendencyreflect similar tendencies for underlying pitch process (e.g., if perceived pitch and location are highly correlated), then we shouldbe able to use the results summarized in [able 3 to predict the pitch-matches for the one pair condition. Our new formulasubstittites the mean values of II and I (from I able 3) into l q 2 for each of the two perceived pitches [he p|ition of theformula for each pitch then is weighted bty the proluability of localization toward each ear ['he resulting formula is
I, - P,'J' •,*,1 . 4 tA4"l 1 + 11,1126<'1 . 4 74"1.,1. 1•)where P, andY1, are the relative pruillatilitV Of ixal/iatuon towird each ear, as determined in I xperiment i I.q 3 huilst lieapplied separately for each oif the tw, presentation coundituiouns (i,0it l/ ito right or left ear). lhc value's ol I are "I ;i•ni '.4biIli (a 27 IlI difference)I K0th mitiil nie.ian pitch nvitcher, were asli li1) I/I higher than predicted HIo wesecr. in this valrian iIOctave illusion, listeners perceived consistent diflerenee in frequency between the two pitches, but vary in the alisiuhiuic ".alue's oiithe pitches Thus, the difference in pitch may be more 'mpiurtant than the individual frequencies of eithe, the perceived high orlow pitches The otnserved freqliency, difference of 24 II, is sufficiently similar to the predicted 27 Iz diflerence tee Ssuggest that fusion of a single pair of octave-rclated toners relctL, the weighted combination of inputs to both ears and thatfiusi• in seems Ito be the mot critical contrilbtinltg t iutur itO the Octave illhmi.,in
P'ihe weighLs in 'Iable I al.s- reflect the rel itisve i. mntributton (if fusioi and ear ili n' nant' I he weight II was ti !ihwhen W•8t I17 was prer.ented to Ithe right ear ant 112f, "wt-hn kl0uh If/ %;i.s presented hie the tclt ear Hiku. tih uinlpe 1,,thi tightvir always is weighed nlmire heivily Iv 0 1 than t(ie inpiit I(0 itht Iti e ii I his weihting (.11 It " iui.ed is thti i, di i i I'ti
le.tailel- qeemuntfiatai-n tee a.....ii.t feet hir I riijei' ifi. i it the hare l'se..t iiii ee l, tiau ,se the w ,uhl', -e In , ilnl' it ,'r
the reights tve pere-.ntu e.) Av'i. 1 '' li+re l.d ii h ,iln I1i rvi ...t , 0 ie.. .cii , is h li et 2u' iti th' ,lihtii Otf qici, s , i.t .'n ;
hewrr lreepecne-v ant Iii'; ee the Irt•v ii'slq . pru'.enield tee th e" ihl h. u Irt exunmpl t when huht II, tii, . i, i i t•tt• i n
,,v h I. l, i ' , I It10 1 11 ' - ' + i ,in , t , 1," I 11 t ' l ." .. ... ! plll 1 , 1rt . . ,~v l , Il th ll
IOctave Illusion 9
1, - .26'800 +.6A"4*00 4.10"800. (4)
yielding a predicted F, of 544 Ili. Using the same equation. F, is 504 lIz when 400 I1z tone is presented to the right ear (with
a predicted 40 Ilz difference). The actual means of the perceived pitches of 543 and 504 Ilz (39 liz difference) are consistent
with these computed frequencies and are independent of sequence length.The estimated weights (It and L) are important not in terms of their specific values, but rather in terms of the
processing they reveal. Weighted averaging of inputs is consistent with a large literature that suggests a central mechanism which
is sensitive to octave-related stimuli (e.g.. Demany & Semal 1988, 1990, Demany. Semal & Carlyon 1991). Ear difference in
tonal input weighting also has been reported. For example. Ward (1954) found that two ears of a single observer gave
different pitch match results with one ear consistently giving relatively higher pitch matches for a specific tone (e.g.. binaural
diplacusis).
Existing pitch modelsThe nature of fused pitches in the illusion cannot be easily explained by models of pitch perception of complex tones:
the focus of these models is the explanation of the residue and other pitch percepts in complex stimuli where pitch does not
correspond to place along the basilar membrane. For reasons to be discussed below, we feel that the pitch percepts studied in
the current research represent a very different type and level of processing than that addressed by such models. There are two
broad classes of such modern models concerning complex pitch perception: Pattern Recognition and Temporal models. Pattern
recognition models assume that the pitch of a complex tone is based upon neural signals corresponding to primary sensation. e.g..
the pitches of the individual partials. Goldstein's optimum processor theory (1973), Terhardt's (1972a.b, 1974) pitch perception
theory, and Houtsma and Goldstein's central pitch processing theory belong to this group. Goldstein's model (1973) predicts that
the pitch of a complex tone corresponds to the 'best fit' of the harmonic series in the complex tone while Terhart's (1974)
model suggests that the perceived pitch of a complex tone would always be a subharmonic of a dominant partial (resolvable
partials), rather than the lowest partial. We are describing a single pitch percept for stimuli which should be resolvable (in
terms of mtical band differences) even if presented to one ear and whose partials should be perfectly coincident.
Temporal models assume that the pitch of a complex tone is based upon the time interval between corresponding
points in the fine structure of the signal close to adjacent enve' - maxima (Schouten, Ritsma. & Cardozo, 1962; Wightman,
1973). Schouten's theory suggested that the pitch of a comple. tcne corresponds to the most prominent component in that
sound. Wightman's pattern-transforniation theory was not aimed to predict pitch-match data. However. because one of our
stimuli is .he harmonic of the other, there is no simple, predictable fine temporal structure among potential particles which does
not correspond to the temporal properties of one of the original stimlit ll1owever, the pitch models all were developed to
address very different concerns related t, pitch perception. Furthermore, the uniqueness of the octave relationship is probably
providing the perceptual system with an unusual, and most-likely modified sensory information. It would be interesting to
evaluate the pitch of dichotic, octave-related stimuli which are above 5 kllz where most models, and evidence, indicate that the
coding of pitch is known to operate on a different basis.Individual differences in perLceyion
As reported by Deutsch (1974. 1980. 1983a). we consistently observed individual differences in the perception of the
reported variant of octave illusion, with many listeners usually perceiving the illusion, but with some listeners seldom perceivingthe illusion. Furthermore. we typically found that extent of musical experience seemed to be negatively correlated withperception of the specific variant of the illusion.
The difference'" in perceptual tenuencies between musicians and nonmusicians in the illusion may be due to the nature
of musical training Musicians are trained to listen to music in an *analytic" fashion, with many trained to be akulc to recognile
ioth tone location and what instruments were playing them. This training may account for why musicians often are aware of
two simultaneous tones in an illusion sequence The notion that musical training produces behavioral differences that have been
well documented (eg. Hlelmholtz. 1863, lioutsma and Goldstein. 1972: lloutsma. 1979: Cross and Lane. 1963) Ilelmholt.z
(1863) repiirted that complex periodlii soinuds can be perceived "synthetically' or "analytically" (i.e.. perceiveil as one sound or in
terms of indivii•ual partials) ( roe% and ilane (19(63) reported that listening "synthetically" anti "analytically" can lic controlled by
previoui, training, and I liottsma (1979) has suggested that musically experienced listeners have a much stronger tendency to
perceive complex soinds analytically than miusically naive listeners. Although not addressed in the current research. it also is
poissuible that .iu fh an "analytic-holihtic" diistin• tiin may reflect either differences in hemispheric dominance (c g. l)icutsch 19K2)or. alternatively dilleren'ces in the etlfitenc- of enidling component stimuli
In (ontrast ti otir niuts(-ally Itimed %siijcetis. reslts obitained with mursically naive hustenetr ilniac at hI hulilt percept inwhich pitch seem% s to renect a weighted averaging of bx)th components Clearly. such an averaging itf dichotic intormntion ntiusireveal processing that Is occurring at a more central level, rather than at (or directly derived from the operat..)n of) the sensorN
mechanism We nite that musiin• fm., if- en rep•rt perteiving an additional fused percept shifting in lucalh/ation. which
probably is the output froim a central. (.tave-related mechanism respinsible foi fusion I xisting pitch models are Iua•ucd diiu•.,tls
on the inuipiat iof the latter I periphertl) fvixt of processing. and thius are not designed to addres,, such a weighting of intiirmitiii
for a gll.hal peruepi•e this% iOmni that iOM reSultCSiý f u ltirlesng a ulillt-in type and level ot proxe sing than ai (cenhiry 40 tinil t
revearih un the manner in which lihenr.m n'm-linv fx ucue pitch In luct. we 1'lieve thau ouir indting., and thuul of Ic'tsth(fi*,uf n thu.. 1a) r ,, r .nini f h .i.f...l.. r. i is.-: i. -Ith pC .Iif r' ilfit u, un mulului I,, s•eg•i• it " ant i a.liah u Iiuiiiu ,i ,it
%',nillh f i--ii 'r thi.u g1 ri( l , 4 le I i ' inI ... t urfl1' , rii C, flC I iutflu ns i , l i hei-ciiry I-• li ucf xi, t f %,vIi I i 0 in, i n !,ik
nilC' 'C ifubI. C , i CC.! i ih f I~'l l Ci " Ii,,l ,f '1Cih I,CC 'lilf n . htif ,i n 1Ilii s uIhI .......I fpoii . '1!,iu i ii i"l di. .ii.f. II
, • 1111 ,11. ..
Octave Illusion 10
We thus believe that we have been investigating an attentional limit based on the analytic-holistic distinctionAdditional support for such notion comes from the fact that musicians also reported a type of holistic percept, which shifted in
laterahzation with the alternation of stimuli. Although it may be difficult for musicians to map pitch for this weak holisticpercept (having to additionally ignore the strong pitches of perceptually isolated components). it is conceivable that the holisticpercept, in fact. may be similar in nature to the illusory percept commonly reported by our musically naive subjects. Thus, thevariant of the illusion also could potentially reflect frequency averaging in musicians, and ments some attempt at furtherresearch. Currently, however, regardless of the types of processing which are reflected by individual differences in the variant ofthe octave illusion, it is cler that existing evidence indicates that musical experience is negatively correlated with perception ofthis variant of the illusion.Summary
The current study indicates that the critical contributing factor to the octave illusion is dichotic fusion, which providesthe basis for the perception of one tone at a time. A secondary contributing factor is a right ear advantage for weighing input:it is the ear advantage which contributes to the slight shift in pitch for this variant of the illusion.
The underlying processing of dichotic pairs of octave-related stimuli in terms of the perception of pitch and location isnot easily explained by current models of pitch perception whose goals and focus are not on such simple stimuli. As has beenconjectured for pitch, there does appear to be a central mechanismn responsible for frequency averaging of octave-related dichotictones for the current listeners. However. it is not obvious whether such a mechanism is restricted to octave-related stimuli.Since fusion, the primary contributing factor to this illusion, is not limited to octaves, it is _,'ssiljle that the illusion could beproduced under a wide variety of stimulus conditions. In a future submission, we also will present data which demonstrates asimilar illusion based upon frequency components that are not octave-related.
ReferencesAkerboom, S.. Hoopen. G., & Knoop, A. (1985). Does the octave illusion evoke the interaural tempo illusion? 0
Perception & Psychophysics. 38(3). 281-285.Bregman. A.S. (1990) Auditory Scene ýnualysis. The MIT press. Cambridge. Massachusetts.Cross. D.. and Lane. H. (1963). Attention to single stimulus properties in the identification of complex tones.
Experimental analysis of the control of speech production and perception. University of Michigan ORA Rep.No 0561
3-1-p.
Cutting, J. (1976). Auditory and linguistic processes in speech perception: inference from six fusions in dichoticlistening. Psychological Review. 83(2). 114-140. 5
l)emany, 1L. and Semal, C. (1988). Dichotic fusion of two tones one octave apart: -vidence for internal octavetemplates. Journal of the Acoustical Society of America, 83. 687-695.
I)emany. L. and Semal, C. (1990). Harmonic and melodic octave templates. Journal of the Acoustical Society ofAmerica. 88, 2126-2135,
l)emany, I... Semal. C.. and Carlyon. R. (1991). On the perceptual limits of octave harmony and their origin. Journalof the Acoustical Society of America, 90. 3019-V4,27.
l)eutsch. 1) (1974a). An auditory illusion. Journal of the Acoustical Society of America. 55, S18-S19.D)eutsch. I) (I!(P4h). An auditory illusion. Nature. 251, 307-309.I)eutsch. 1) (1975a). Musical illusion. Scientific American. 233, 92-104.I)eutsch. I) (1975h). Two-channel listening to musical scales. Journal of the Acoustical Society of America. 57. 1156-
1I (it)D)eutsch. I) (1976) lIateralization by frequency in dichotic tonal sequence as a function of interaural amplitude and
time difference. Journal of the Acoustical Society of America. 60. %50(a)
D)eutsch, 1) (1978a). Binaural integration of tonal patterns. Journal of the Acoustical Society of America. 64. S146(a)
I)cwth. I) (1918b) lateralihation by frequency for repeating sequence of 41)0-lz and 800-l,/ tones. Journal of theAciustical Society of America. 6
3. 184-186.,
l)eiplirh. ID The octave illusion and auditory perceptual integration (19 8 1 ). In J V I olias anti I.D. Schubert (I-ds).
Ilearmny Research and Iheuory (Volume 1) Acadvtml Prmss, New York.
l)eDji h 1). & Roll. I L. (1976). Separate "what" and 'where" decision mechanisms in processing a dichoiic tonalsequence Journal of Ixperimental Psychotltgy IHIman I'crception and I'crforniancc. 2. 23-29
Detituh. 1) (1998), Iateralization and sequential relationships in the octave illusion Journal of the Acoustical Society
ttf Amenria. 831!l). 10-1.691I fron R. and Yund. I W (1974) I)Dichoitc -i mpeillion of simiiltaneous tone bIrstLsi of different frequency I
I )isxiatton itf pitch Irum lateralu t n ani ind hodness. NeujrtŽypchologla. 12, 249-256,I Itrn IP ant Yund. I W (197S) Iichutut -ompuItiluon of simultaneutit, time bursts of dilferent frequency Ill lhc
effe(t otf stmiutls parameters on siupprcssito and tear donminance function. •ctirtosy( hoŽlopia. 13. I SI-Ill
I le ,r II intl H land % sn. W A f 1911) 1 iP1Itn(si, os idtfinttion nuca•trcnuen and fl, tulaiion Journ.l lt the
.5 i, ii . rt~ly oft -Ame-r, i 6) S 1t,ii VI I -! ' I (]'J--it Nn tll allttiu r lr %ti 5 th thiti" Itr lit thne ti Iulmormii n, ! i ith It hi f oitt picxlt, tints .l,'itirnil
.,• t• •({•t', ptI '%,. l r2 , l ,t~n ¢'H l l ( I1'¢, • 1,
SI 1
S Octave Illusion 11
Ilioutsma. A. J. M (1979). Musical pitch of two-tone complexes and predictions by modern pitch theorics, Joiurnal ofthe Acoustical &ociety of America, 66, 87-99.
Iloutsma, A. I. M., and Goldstein, J. 1.. (1972). T'he central origin of the pitch of complex tones: Lvidencc frommusical interval recognition, Journal of the Acoustical Society of America. 51(2)., 520-529. 0
Schouten, J.F., Ritsma. RJ.. and Cardozo, B.L. (1962). Pitch of the residue. Journal of Acoustical Society of America,34, 1418-1424.
Terhardt, E. (1972a). Zur "'Tonhohenwahrenhmung von Klangen. 1. Psychoakustische Grundlagen. Acustica 26. 173-186.Terhardt, E. (1972b). Zur Tonhohenwahrenhmung von Klangen. 11. Ein Funktionsschema. Acustica 2.6, 187-199.Terhardt, E. (1974). Pitch. consonance and harmony. Journal of Acoustical Society of America, 55. 1061-1069.Von Hlelmholtz. It. L. F. (1863). Die lehre von den tonempfindungen als physiologische Grundlage fur die theorie der
musik (F. Vieweg & Sohn. Braunschweig). -Ward, W.D. (1954). Subjective musical pitch. Journal of The Acoustical Society of America. 26. 369-381).Wightman, FL. (1973). The pattern-transformation model of pitch. Journal of The Acoustical Society of America. 54.
407-416
AcknowledgmentsBased upon work supported by National Science Foundation Grant BNS8911456 and Grant F496209310033 from the
Air Force Office of Scientific Research. Opinions, findings, conclusions, and recommendations are the author-' and do notnecessarily reflect views of the granting agencies.
Indnotes
I. ltighly practiced musicians tended to hear two sin' dltaneous complex sounds which were toward, but not in, each ear and whosepitches, while different from each other, seemed to be intermediate to the physical stimulus.
2. Although there are several different pitch-related percepts, our purpose was to study the pil•h changes associated with perceptionof the illusion, and we did not make any attempt to explain or explicitly instruct the subjects to respond to any specific aspect ofperccived pitch,
S3. In a sequence of stimuli we cannot perfectly correlate a specific perception with the presentation of stimuli to a specific car. butcan determine whether the subject is responding to the higher or lower pitch, and we do know that such pitch perception is highlystable with individual subjects. We therefore must apply the formula based upon perceived pitch. assuming a difference in the Itand I. weights for the two percepts We are faced with the opposite problem when we present a single pair (half cycle) of stimuli:here we know what was presented on each trial, but not which pitch was perceived-we only know the overall pitch average for eachpresentation condition
.S
S
I I s ,an ammummnumm mmm mu B~. ml--=.m m . ura
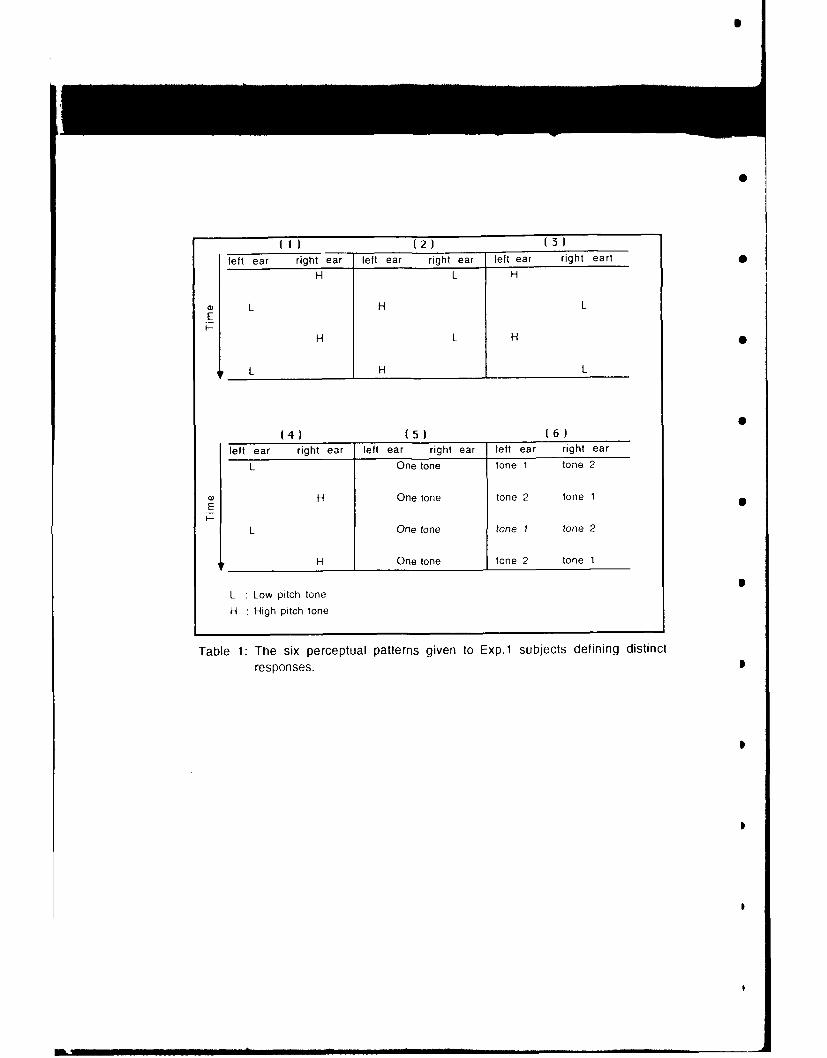
2S
(1) (2) (3)
left ear right ear left ear right ear left ear right eart
H L H
L H LEI-
H L H
L H L
(4) (5) (6)
left ear right ear left ear right ear left ear right ear
L One tone tone 1 tone 2
SH One tone tone 2 tone 1E
L One tone tone - tone 2
H One tone tone 2 tone 1
L : Low pitch tone
H High pitch tone
Table 1: The six perceptual patterns given to Exp.1 subjects defining distinct
responses.
Inu
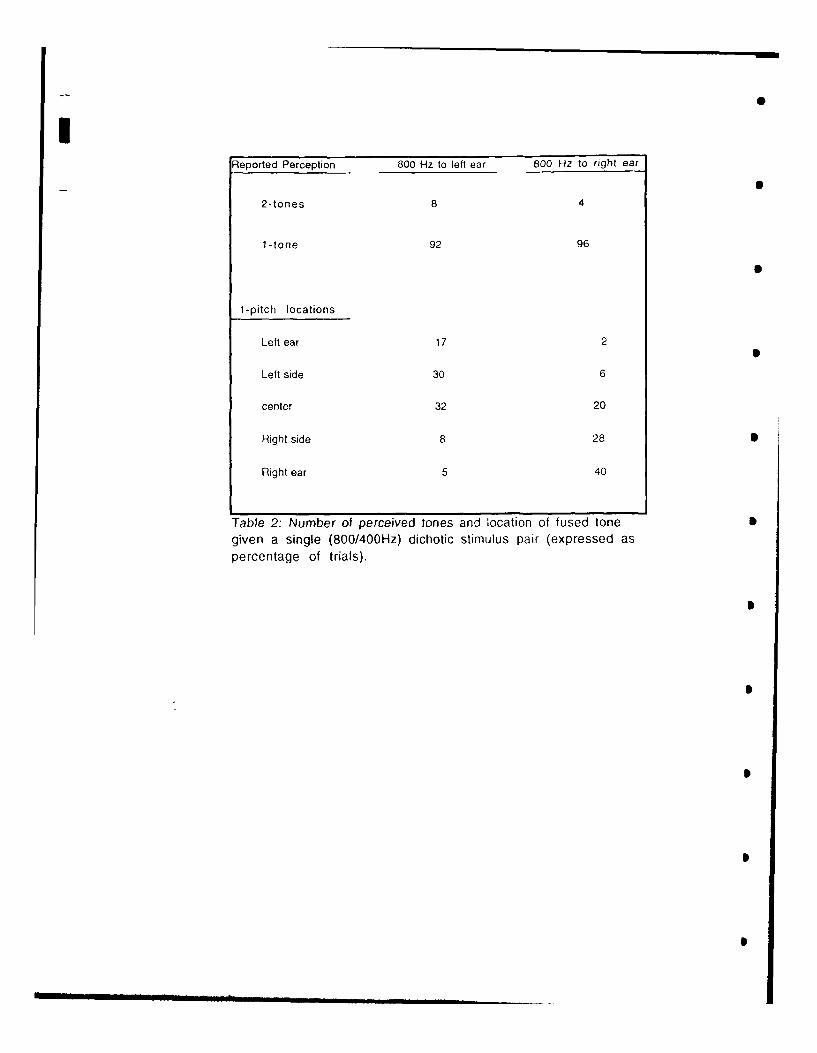
!0
Reported Perception 800 Hz to left ear 800 Hz to right ear
2-tones 8 4
1-tone 92 96
1-pitch locations
Left ear 17 2
Left side 30 6
center 32 20
Right side 8 28
Right ear 5 40
Table 2: Number of perceived tones and location of fused tone S
given a single (800/400Hz) dichotic stimulus pair (expressed as
percentage of trials).
II
S. . . . • II I II I - -- I I II I u .. .
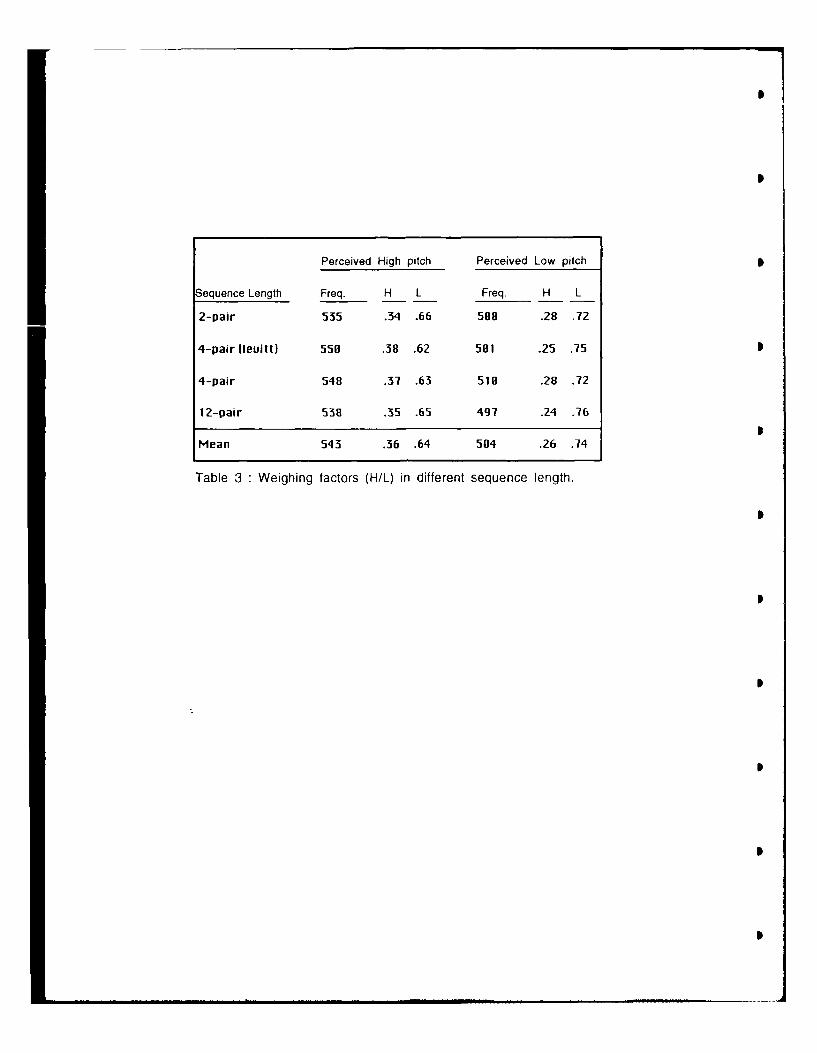
0
I
Perceived High pitch Perceived Low pitch
Sequence Length Freq. H L Freq. H L
2-pair 535 .34 .66 508 .28 .72
4-pair (levitt) 550 .38 .62 581 .25 .75 0
4-pair 548 .37 .63 510 .28 .72
12-pair 538 .35 .65 497 .24 .76
Mean 543 .36 .64 504 .26 .74
Table 3 Weighing factors (H/L) in different sequence length.
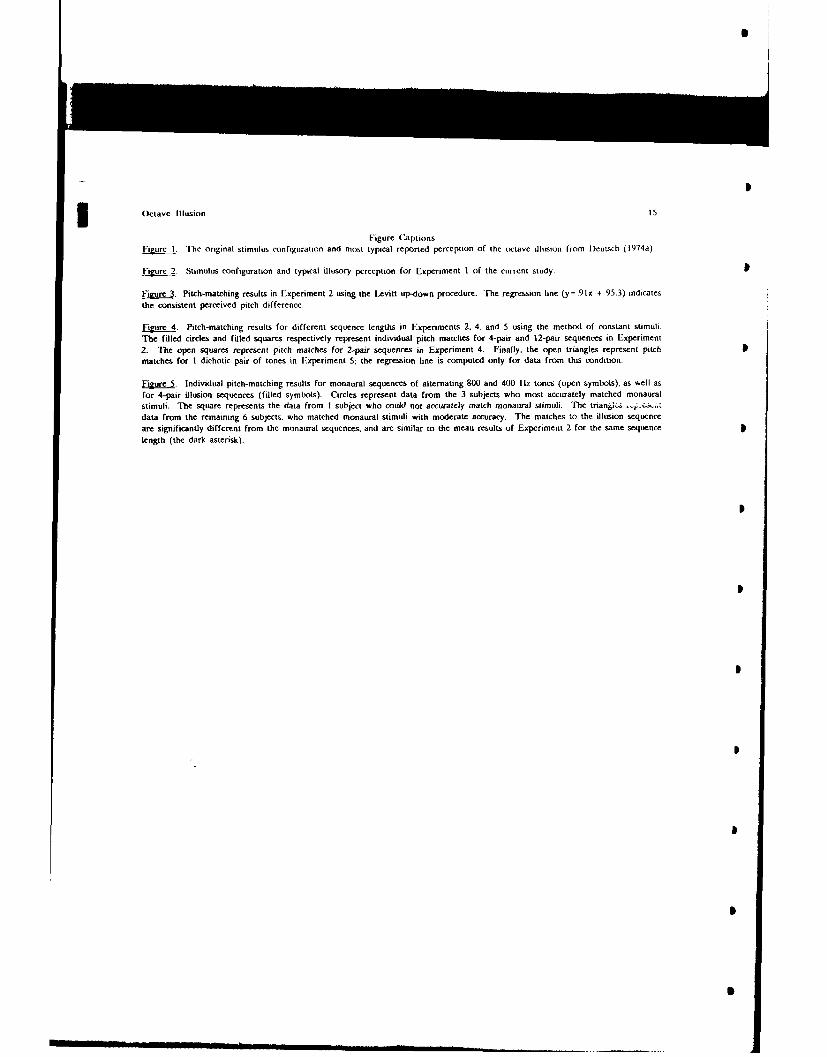
Octave Illusion 15
Figure CaptionsFigure 1. The original stimulus configuration and most typical reported perception of the octave illusion from Dcutsch (1974a)
Figure 2. Stimulus configuration and typical illusory perception for Experiment I of the current study.
Figure 3. Pitch-matching results in Experiment 2 using the Levitt up-down procedure. The regression line (y = .9
1x + 95.3) indicates
the consistent perceived pitch difference.
Figgre 4. Pitch-matching results for different sequence lengths in Experiments 2. 4, and 5 using the method of constant stimuli.
The filled circles and filled squares respectively represent individual pitch matches for 4-pair and 12-pair sequences in Experiment
2. The open squares represent pitch matches for 2-pair sequences in Experiment 4. Finally, the open triangles represent pitch
matches for I dichotic pair of tones in Experiment 5; the regression line is computed only for data from this condition.
Figure 5. Individual pitch-matching results for monaural sequences of alternating 800 and 400 Htz tones (open symbols), as well as
for 4-pair illusion sequences (filled symbols). Circles represent data from the 3 subjects who most accurately matched monaural
stimuli. The square represents the data from I subject who could not accurately match monaural stimuli. The triang,"- . .j .
data from the remaining 6 subjects, who matched monaural stimuli with moderate accuracy. The matches to the illusion sequence
are significantly different from the monaural sequences, and are similar to the mean results of Experiment 2 for the same sequence
length (the dark asterisk).
p
l [] I . .. .•
II I ll [ " Il

Stimuli Perception
Left ear Right ear Left ear Right ear
ES
400 800 800cQJ
800 400
400 800
800 400 .E40I-
jFigure 1
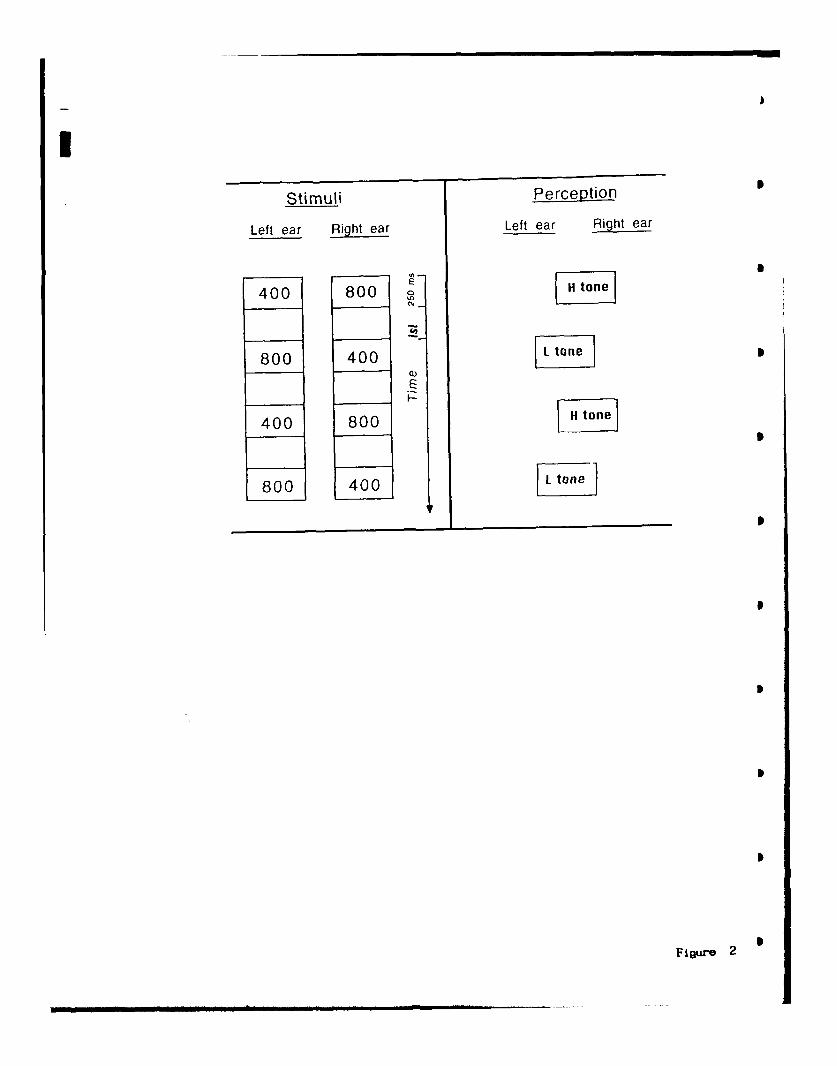
5
!
Stimuli Perception
Left ear Right ear Left ear Right ear
400 800 oLH ton
800 400 •°°'i,E
400 800 t
800 400
Figw-a 2
nil_..._I__nI1________UnIn_.. . .___....._"_... .
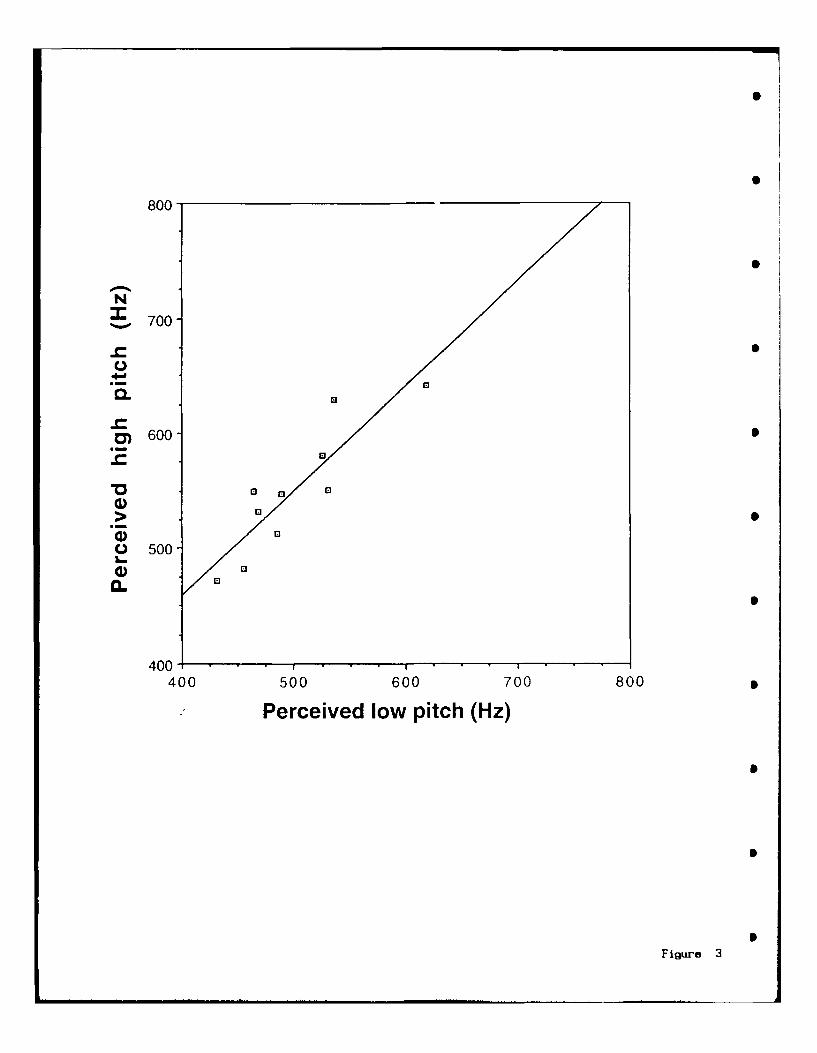
800
N
700
0. []
600 S
>0
.0 °
0o 500
CL
400 . . ,400 500 600 700 800
Perceived low pitch (Hz)
F
Fitgur'e 3
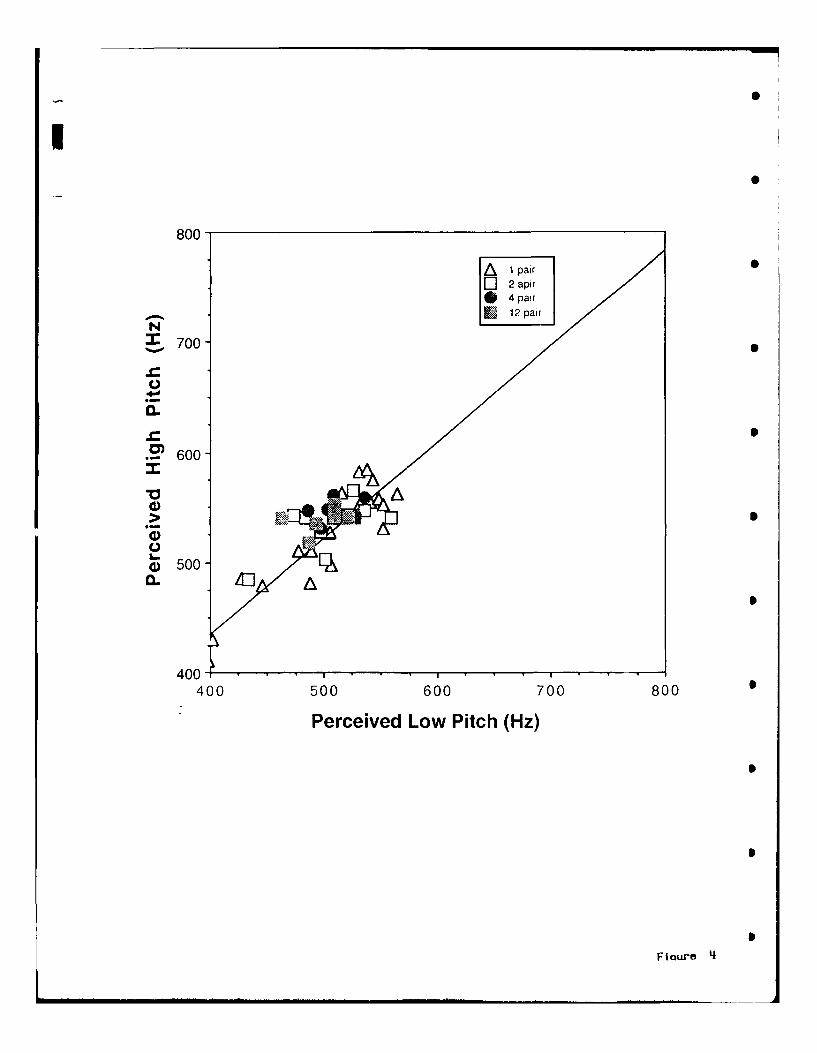
I
800
AI pair2 apir4 pair
S12 pair
S700
U
C-
.-- 600-!.-A
V A
500
C.)i__500 "[Aa. A
S
400400 500 600 700 800 5
Perceived Low Pitch (Hz)
FRour-O
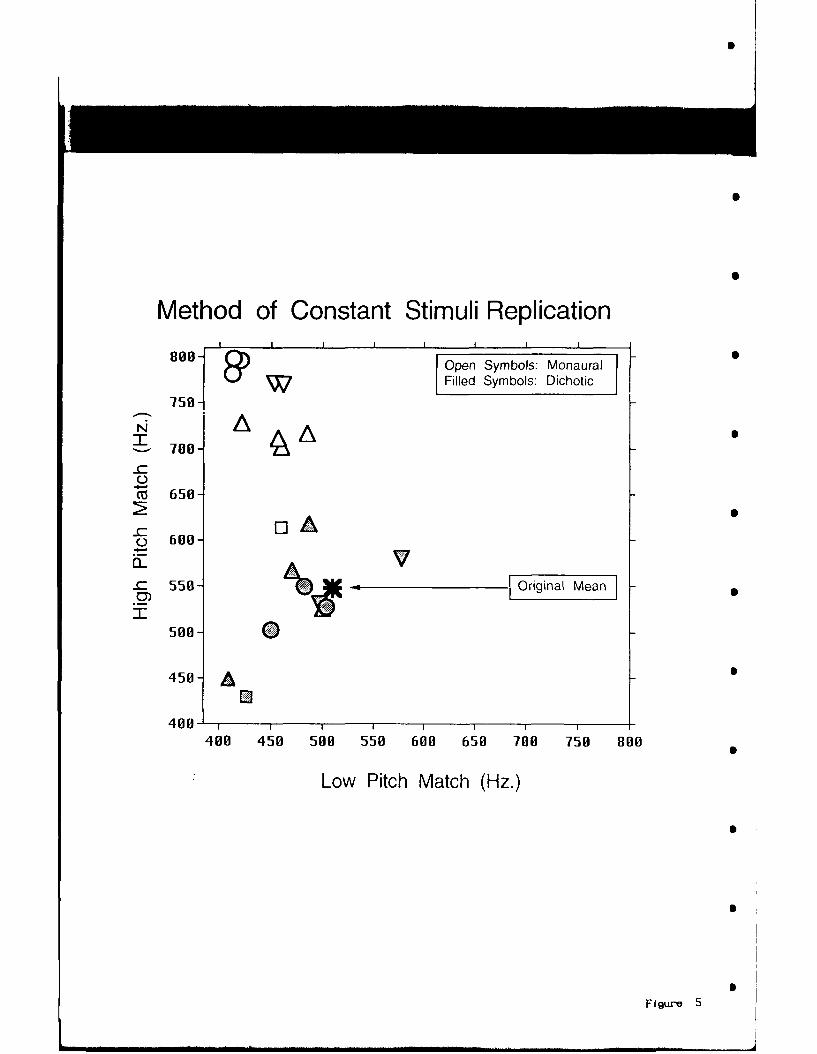
Method of Constant Stimuli ReplicationI I I I I I I
80-8] Open Symbols: Monaural
I Filled Symbols: Dichotic
750-]
N A A700 -r
"- 650
o Ao 600 c_ VX-~ 550- Original Ma
500O
450- A
488 450 580 550 600 650 780 750 800
Low Pitch Match (Hz.)
Figure 5
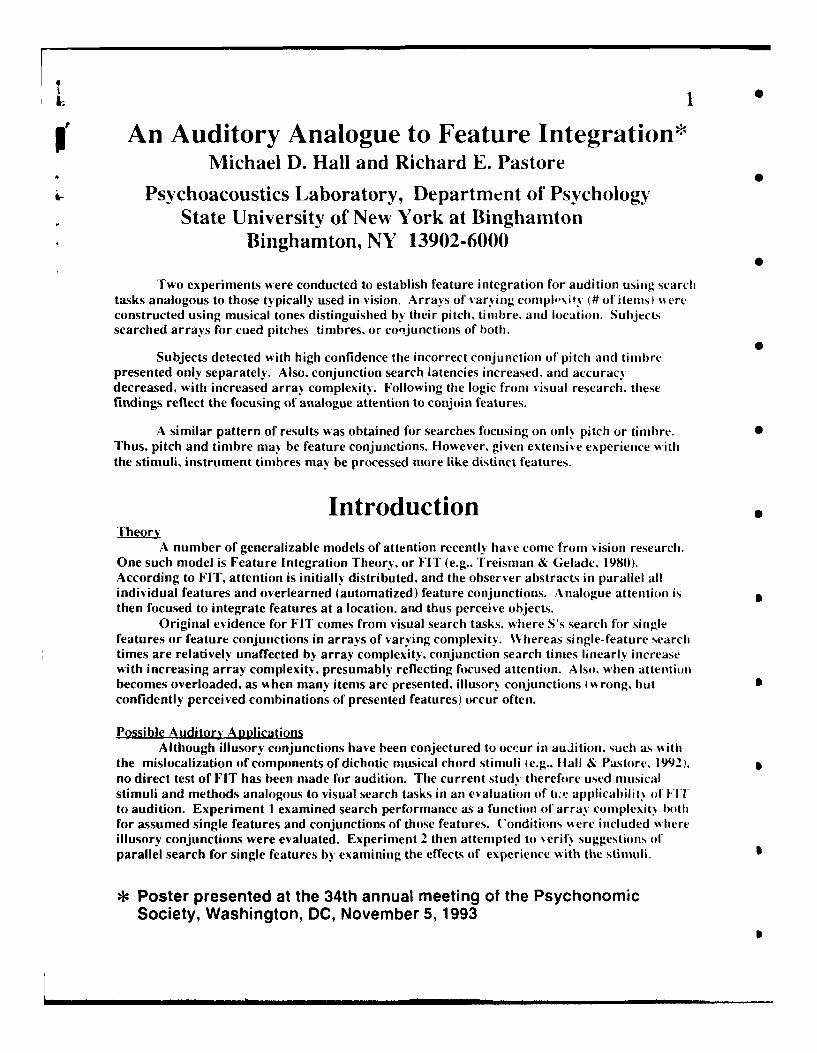
p' An Auditory Analogue to Feature Integration*Michael D. Hall and Richard E. Pastore
Psychoacoustics Laboratory, Department of PsychologyState University of New York at Binghamton
Binghamton, NY 13902-6000
Two experiments were conducted to establish feature integration for audition using searchtasks analogous to those typically used in vision. Arrays of varying compl-6xyi (# of items) N ereconstructed using musical tones distinguished by their pitch, timbre, and location. Subjectssearched arrays for cued pitches timbres, or conjunctions of both.
0Subjects detected with high confidence the incorrect conjunction of pitch and timbre
presented only separately. Also. conjunction search latencies increased, and accuracydecreased, with increased array complexity. Following the logic from %isual research, thesefindings reflect the focusing of analogue attention to conjoin features.
A similar pattern of results was obtained for searches focusing on only pitch or timbre. 0Thus, pitch and timbre may be feature conjunctions. However, given extensive experience " iththe stimuli, instrument timbres may be processed more like distinct features.
Introduction oTheory
A number of generalizable models of attention recently have come from vision research.One such model is Feature Integration Theory, or FIT (e.g., Treisman & Gelade, 1980).According to FIT, attention is initially distributed, and the observer abstracts in parallel allindividual features and overlearned (automatized) feature conjunctions. Analogue attention isthen focused to integrate features at a location, and thus perceive objects.
Original evidence for FIT comes from visual search tasks, where S's search for singlefeatures or feature conjunctions in arrays of varying complexity. Whereas single- feature searchtimes are relatively unaffected by array complexity. conjunction search times linearly increasewith increasing array complexity. presumably reflecting focused attention. Also. when atteotionbecomes overloaded, as when many items are presented, illusory conjunctions (wrong. butconfidently perceived combinations of presented features) oc.cur often.
Possible Auditory ApplicationsAlthough illusory conjunctions have been conjectured to occur in audition. such as with
the mislocalization of components of dichotic musical chord stimuli (e.g.. Hall & Pastore. 1992).no direct test of FIT has been made for audition. The current study therefore used musicalstimuli and methods analogous to visual search tasks in an evaluation of tw:e applicabilitl of FIITto audition. Experiment I examined search performance as a function of array coniplexitN bothfor assumed single features and conjunctions of those features. Conditions " ere included Nhereillusory conjunctions were evaluated. Experiment 2 then attempted to verify suggestions ofparallel search for single features by examining the effects of experience with the stimuli.
*Poster presented at the 34th annual meeting of the PsychonomicSociety, Washington, DC, November 5,1993
i - "I I III 'i l I I I II III " " III II iI
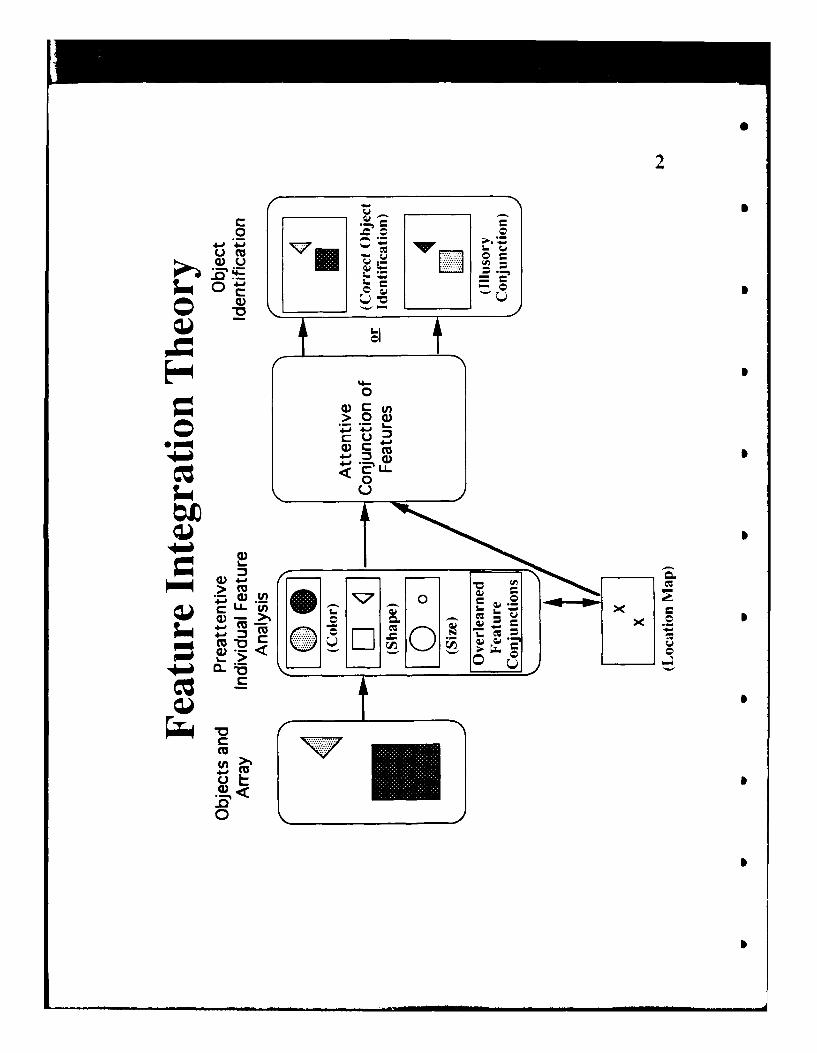
C0
wu -
*0 PO
(D 4-
>0
- LA4-j i

3
General Method(1) Search Cues
Single-Feature Single-Feature ConjunctionTimbre P of Features
"Violin" 0
Presentation
0000 0
0 0
CI
(2) Cues and Arrays = 2.0cs each; IS] =.5rs
(3) Array Presentation
(Violin) (piano) (tronmbone (flute)
0 0 Array, Complexity2-tone (Near)
-12-tone (Far)
Indicates flat mistuning from indicated pitch.
(4) Question: "Was the cued target in array."(a) "Yes' or "No" Response
(b) Confidence Rating (conjunction trials only)1 2 3 4 5 6 7
confident yes unsure confident no
I Il lll I . ... . . . . L . .. . . I .. . .. . . . . . I I I I I I I I I I I
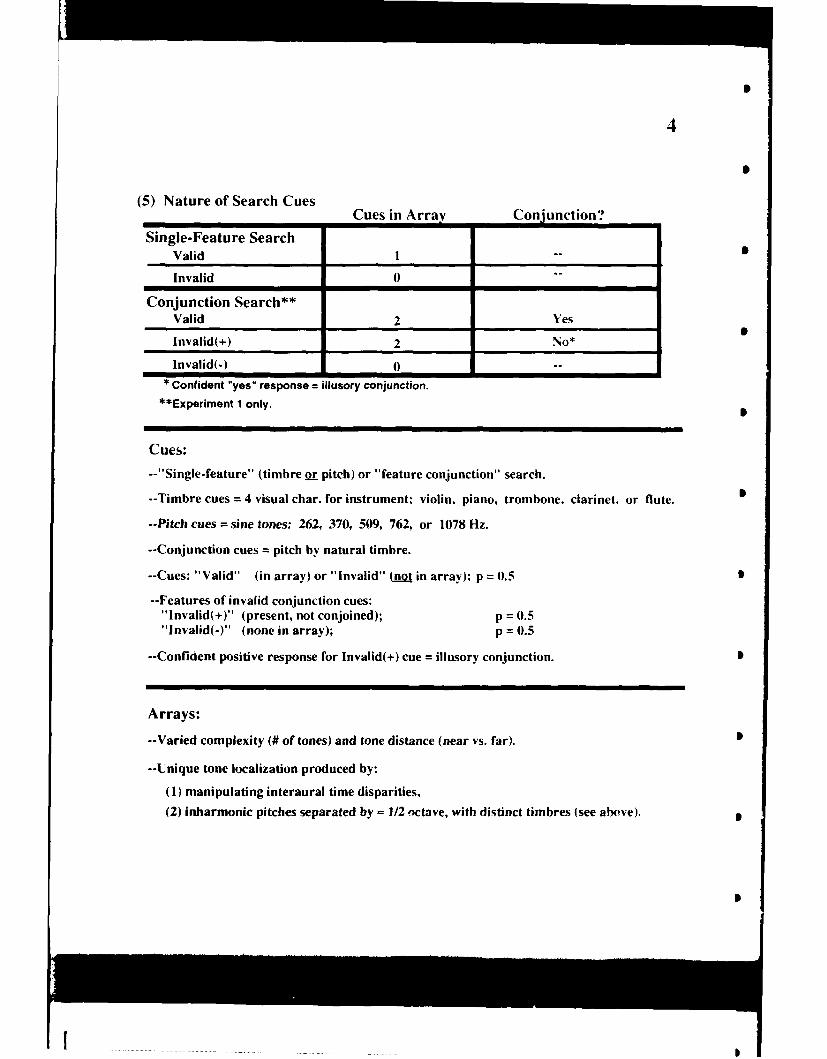
4
(5) Nature of Search Cues
Cues in Array Conjunction?
Single-Feature SearchValid I "
Invalid 0"
Conjunction Search**Valid 2 Yes
Invalid(+) 2 No*
Invalid(-) 0 --
' Confident "yes" response = illusory conjunction.
"**Experiment 1 only.
Cues:
--"Single-feature" (timbre or pitch) or "feature conjunction" search.
--Timbre cues = 4 visual char. for instrument: violin, piano, trombone, clarinet, or flute. 0
--Pitch cues = sine tones: 262, 370, 509, 762, or 1078 Hz.
--Conjunction cues = pitch by natural timbre.
--Cues: "Valid" (in array) or "Invalid" (DA1 in array); p = 0.5 9
--Features of invalid conjunction cues:"Invalid(+)" (present, not conjoined); p = 0.5"Invalid(-)" (none in array); p = 0.5
--Confident positive response for Invalid(+) cue = illusory conjunction. 9
Arrays:
-- Varied complexity (# of tones) and tone distance (near vs. far). 0
--Unique tone localization produced by:
(1) manipulating interaural time disparities,
(2) inharmonic pitches separated by - 1/2 octave, with distinct timbres (see above).
I
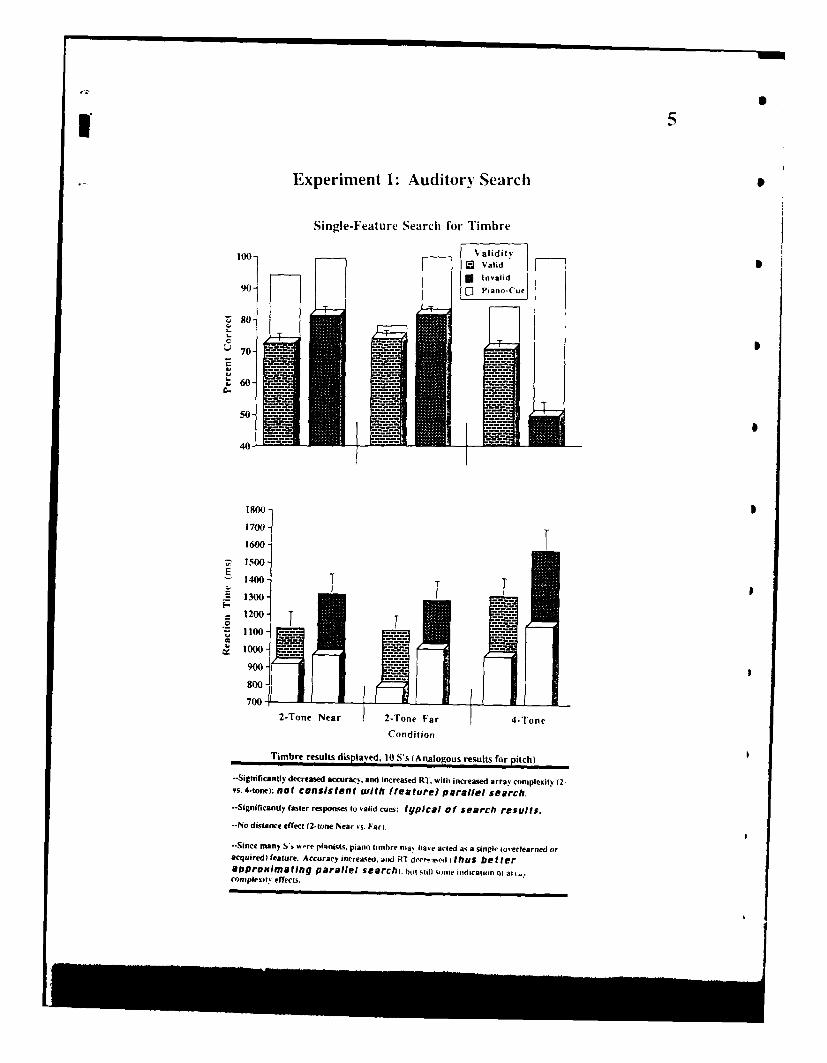
5
Experiment 1: Auditory Search I
Single-Feature Search for Timbre
90 5 Pan-u
Z; 80-
70-
~60-
40-
1800
1700
1600
;-1500E
1400E1300 T
1100-
S1000- ---
8900 -1
800
700M2-Tone Near 2-Tone Far 4-Tone
Condition
Timbre results displayed, 101 S's (Analogous results for pitch)
--Significantly decreased accurac,, and increased RI, will, increased array comnplexitý (2-vs. 4-tone); not( consis ten t with (fea ture) parallel sea'rch.--Significantly Caster responses to valid cum; typical of search results.--No distance effect (2-lone Near % s. F-ar).
--Since mainy Ss 5.'Are pislnists, piano tinitre nia. thas e acted as a single (otertearned oracquired) feature. Accuracy increased. ;ind RI dccr.o'd (th us be t terappromime ting p aralielI s earchi. bitt still somle i ndICa1tion oi at,
Cornplexitv effects.
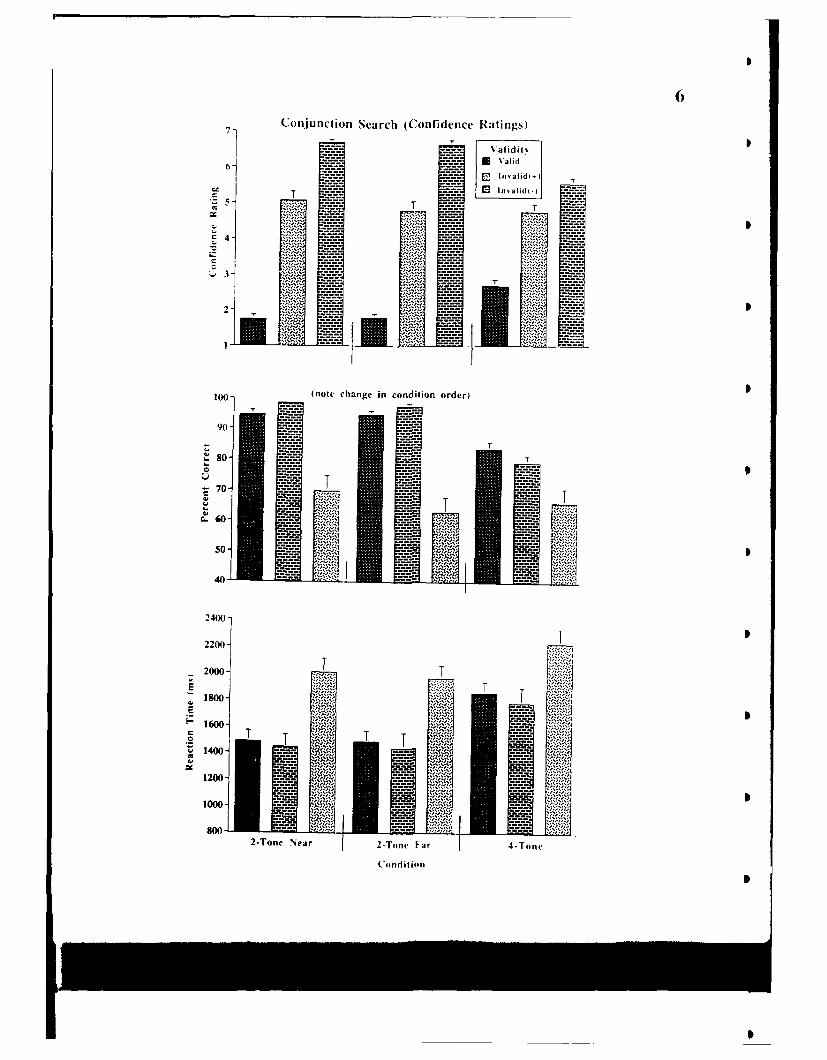
7 Conjunction Search (Confidence Ratings)
T T
WOo (note change in condition order)
90
T
-70 T
50-
40
2400-
2200 T
TT
12000
1s000
800114002-T.n Ner2T n -Fr4T n
Codiio
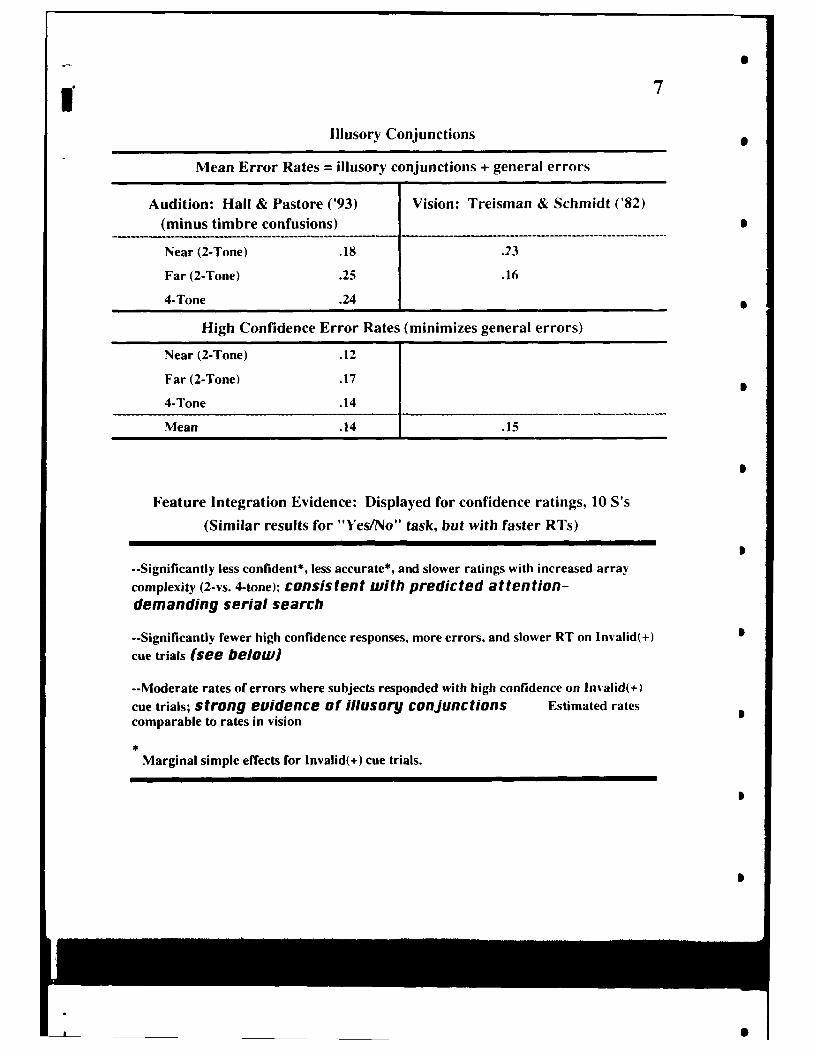
7
Illusory Conjunctions
Mean Error Rates = illusory conjunctions + general errors
Audition: Hall & Pastore ('93) Vision: Treisman & Schmidt ('82)(minus timbre confusions)
Near (2-Tone) .18 .23
Far (2-Tone) .25 .16
4-Tone .24
High Confidence Error Rates (minimizes general errors)
Near (2-Tone) .12
Far (2-Tone) .17
4-Tone .14
Mean .14 .15
S
Feature Integration Evidence: Displayed for confidence ratings, 10 S's
(Similar results for "Yes/No" task, but with faster RTs)
--Significantly less confident*, less accurate*, and slower ratings with increased arraycomplexity (2-vs. 4-tone); consistent with predicted attention-demanding serial search
--Significantly fewer high confidence responses, more errors, and slower RT on Invalid(+)cue trials (see below)
--Moderate rates of errors where subjects responded with high confidence on Invalid(+)cue trials; strong euidence of illusory conjunctions Estimated ratescomparable to rates in vision
Marginal simple effects for Invalid(+) cue trials.
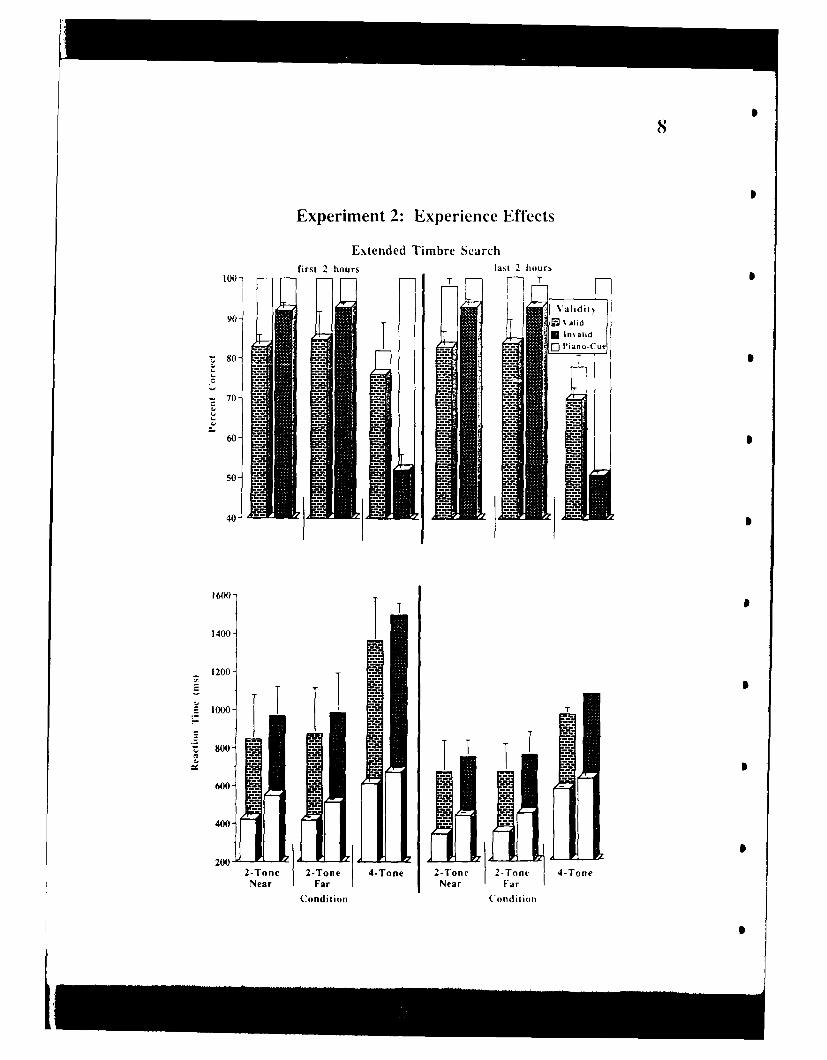
Experiment 2: Experience Effects
Extended Timbre Search
1001first 2 hours last 2 hours
90! 2D Iidit
60-
50
40-
1600-
1400 I1200 -
1low- T I T
80 I IM
600:!9=
400
2002-Tone 2-Tone 4-Tone 2-Tone 2-Tonv 4-ToneNear Far Near Far
Condition Conditioo
Li 9
Displayed for 2 pianists (Similar tendency for other 2 S's)
Accuracy:
--Significantly decreased overall accuracy with increased array complexity (marginal for pianocue trials).
--No practice effects.
--Reduced difference for piano cue trials (ceiling effect?)
RT:
--Significantly increased overall RT with increased array complexity, consistent with serial search.Also, significantly faster on valid cue trials (i.e., self-terminating search)
--Marginally significant reduction of RT withpractice.
--Reduced effects of array complexity given more practice, especially on piano cue trials.reuealing trend toward automaticity
Conclusions & Future Directions
(1) Evidence for serial search and illusory conjunctionsargue for feature integration in audition.
(2) Timbre and pitch each appear to represent conjunctionsof primitive features.
(3) With extensive experience, a timbre (e.g., piano) can beprocessed more automatically (i.e., akin to a single-feature).
(4) The single-feature search task can be used to defineauditory (e.g., timbral) features.
10
References
Hall, M. D. & Pastore, R. E. (1992). Effects of base complexity in musical duplex perception.Proceedings of the 123rd Meeting of the Acoustical Society of America, 91(4, pt. 2).2339 (abstract 2SP7).
Snodgrass, J. G. & Townsend, J. T. (1980). Comparing parallel and serial models: Theory andimplementation. Journal of Experimental Psychology: Human Perception andPerformance, 6(2), 330-354.
Treisman, A. (1982). Perceptual grouping and attention in visual search for features and forobjects. .ournal of Experimental Psychology: Human Perception and Performance. 8,194-214.
Treisman, A. (1992). Perceiving and re-perceiving objects. American Psychologist, 47(7),862-875.
Treisman, A. & Gelade, G. (1980). A feature-integration theory of attention. CognitivePsycholog, 12., 97-136.
Treisman, A. & Schmidt, H. (1982). Illusory conjunctions in the perception of objects. CognitivePsychology, 14, 107-141.
Work supported by AFOSR grantsF496209310033 and F496209310327,and NSF grant BNS8911456
Implicit assumptions in modeling higher level auditory processes
kirlihd E. PastoreCenter for Cognitive & Psyholinguistic Sciences •
Binghamton UniversityBinghamton, New York 13902-6OO(
Abstract
"There has been growing interest in the investigation of auditory stimulus processing at levels considered to be clearly beyondor above the limits imposed by the peripheral auditory system. Efforts to investigate such higher levels of processing of complexstimuli are nearly always based upon assumptions about perceptial and decision processes that limit the range of reasonably validconclusions. Such assumptions are usually implicit and often not immediately recognized. To illustrate the critical role played by suchimplicit underlying assumptions, existing and new research on the perception of formant transitions in speech will be examined interms of basic assumptions whose recognition can modify (and sometimes strengthen) conclusions about higher levels of perceptualprocessing. Discussion will focus on the implications of fundamental assumr, -ons for the identification and demonstration ofimportant prirciples of perceptual organizing (e.g., Gestalt, feature integration) and for testing hypotheses about alternative perceptuaumodels, modes, or modules. [Research supported in part by NSF and AFOSR.]
Invited Paper piesented at Acoustical Society of America,Ottawa, Ontario, CanadaMay 17, 1993 (2pMU3)
This paper is a little different than the preceding u, papers in this session (Bregman, 1993; Darwin, 19193). Al Bregmanprovided a summary of the nature of modem auditory organization research as illustrat,.d by some of the exceellent, influential researchconducted in his laboratory and bv others. Chris Darwin then provided a summary of his creative research demonstrating the role ofauditory organization principles in the perception of complex signals, including sneech and music. I will shift focus to spend some timeaddressing some potential problems and pitfalls in modern research on auditory organization, and then suggest some possible solutionsto the problems. I should note that in examining potential problems, one also can more fully appreciate the elegance of the researchjust described by Bregman and Dar-Nin.
Much of the recent effort to evaluate the higher level processing of complex signals has beeii couched in terms of generalperceptual principles derived by Gestalt researchers early in this century. This is a noble effort and the five sessions at this meetingspeak to the modern importance of these efforts. However, there are sorne important limitations to this approach which must be keptin mind in attempting to draw strong conclusions.
Although working primarily with visual stimuli, Gestalt researchers faced several problems which can exist in modemauditory research efforts. One major problem was that the Gestalt research was based upon the analysis of static visual stimuli, andsome of the Gestalt conclusions did not always readily generalize to dynamic stimuli. This problem is enhanced in attempts to applyGestalt principles to audition, with the researcher often beginning with predictioný (,)r even assumptions) based upon an analysis of astatic visual representation of the auditory stimulus displayed in terms of time, frequency, and intensity. The visual representation ofauditory stimuli makes the initial analN 7- potentially even more removed from perceptual reality than the early Gestalt work on visualperception. Thus, the predictions using general perceptual principles may sometimes be based upon artificial, static ýp:-esentations ofthe waveforni which have not taken into account critical, perceptual limitations or important dynamic perceptual properties.
The second, and somewhat related problem with modem research applications, reflects a basic premise of the Gestaltapproach. The Gestalt school developed as the reaction to previous research efforts which had made •trong assumntiuns about mtenature of the critical units of sensation and perception. One basic premisc of the Gestalt approach is that the rsearcher needs toalloA perceptual results to define the basic units of perception. This essential feature of the Gestalt approach is in contrast to theresearcher making assumptions about those basic unsits and then proceeding as though those assumptions were valid. However, theGestalt approach also can leave the researcher open to an inherent circularity where the identified principles are used on a post hocbasis to define the basic units used to demonstrate the principles. As a positive counter-example, I note that much of the work byBregman, and the work referenced in Bregman's esrellent book (Bregman, 1991) is careful about letting perception define thevariables while avoiding the inherent problem of circularity.
Whwt I hope to accomplish today is first to demonstrate (using speech research) some important examples of howassumptions about features or basic units of perception can lead to erroneous cornflusions. I then will focus on some important newprocedures which might be used tw test notions about basic units of perception and thus avoid the problem of circularity.
In 1971 Mattingly and his colleagues published an important paper whlch has often been cited as a basis for cc -astbetween the perception of speech (e.g., phonemes in CV context) and analogous nonspeech stimuli. I will spend a few minutessummarizing this study and its findings because, with the significant advantage of hindsight, that paper provides a basis tounderstanding what may, or may not, be perceptually analogous conditions, and allows us to begin to come to grips with adequatedefininfis of perceptual features or units.
The top portion of FIGURE I provides a summitry of the stimuli used ii' the Mattrngl' parip. The stiiuli were twOfoartrst snthctir CV syllables which stried in the onset frequency, and thus the natlre of thc second foriimilu tiir•sition. Subjtcis"a(ri e asked to label the stimuli and to perform an oddity discriminration task between pairis of stimuli difiering im nmminrall s equal step-siim. hlie findings were f',rilv ,Npical rif the raregnrical merception lirer-atre. rhe abieling firitiorlnWrldapharl ;as i the o•igitral paper
S)
Pasture- Acoustical Society. 2pMt'3. May 1993 - 5/16193 2
for one , uhject) exhibits relativels discrete labeling boundaries between the three caterories of "b," "d," and "g.' The discriminationfunction (as in the onginal study, pooled across subjects) exdhibits peaks which roughly cor-respond to the location of the category
boundarieý."Ihne only part of the physical stimuli which varied was the second formant transition. Thus, analyzing foe visual
represenatcricn of the pl.vsical stimuli, it seemed obvious that any perceptual, nonspeech basis for the phonetic contrast mitt be carriedby the transitions; all other parts of the stimuli were held constant. Subjects asked to label and to discriminate the isolated transitionsfailed to exhibit categorical perception; these findings were interpreted as supporting .:., notion that the identical stimulus componentis perceived differently by speech and non-speech systems. Mattingly, et a]. have made an implicit assumpton that it is the isolatedglide wh,.h is the most likely basic perceptual unit for the phonetic continuum. This assumption is intuitively appealing, but clearlyignores the basic premise of the Gestalt approach.
Notice that the Mattingly subjects might be percerving a relative, rather than absolute, change in frequency across time.That is, perception may require the incorporation of the subsequent steady-state portion of the stimulus represented by the vowelformant. An ASA paper by Ralston and Sswusch (1983), and a more recent publication out of my laboratory. (Pastore, Li, & Layer,1990) demonstrated that subjects experienced with sinewave stimuli yield relatively continue us perception for isolated transition, butcategorical perception results when a following steady-state component is added. The three types of stimuli and the results for theshort bleat stimuli are summarized in FIGURE 2. Notice that the patterns labelieg and discrimination results closely parallel thes,'1able results reported by Mattingly. Therefore, it would appear that the critical perceptual component of stimuli varying in place ofarticulation may be a change in frequency leading into the relatively steady-state component. The notion of relative movement orchange in forman{ frequency as being an important cue for place cf articulation is something that Ken Stevens has been talking aboutfor a iLimtler of year's.
A number of early studies on glides or transitions built upon the procedures utilized in the pioneering study by Brady,Stevens, &' House ( 1961), evaluating the pitch corresponding to isolated FM glides. The studies usually matching the pitch of a toneto the pitch of a previously presented FM glide. Typical results are that perceived pitch tends to be carried more by the offsetfrequenc'v, with there being some differences between rising and falling glides. Notice that these studies parallel the original Mattingly,et al. assumption abooi the importance of isolated transitions (or chirps) as critical features, but have the additional assumption thatthe major acoustic role of a glide is in terms of an overall, stqtrc pitch quality.
A paper later in this sess on by Michael Hall (3pr ,US) will present results of research with sinessave analogs. Pilot
conditions (which Mike will not present) indic Ore that if one reverses the ordering of stimuli in a pich matching study, matching a tu,,eto a subsequent, rather than prerious, glide, subjects will tend to match pitch based more on the onset, rather thran offset frequenciesin the glides. In oi nir words, subjects seem to match pitch on the basis of the most temporally e fniguous portions of the stimulus.Such a conclusion also implies that, when listening to glides, subjects are perceiving more than simply a single overall pitch quality, and
may not even hear an overal pitch quality. The former conclusion is generally consistent with often ignored aspects of the earlyfifndings of Brad., House, and Stevens (1%1). A later paper by Nabelek and Hirsh (1969) indicates thdat not rc, Y do subjects tend toperceive continuous changes in frequents, but they even impose perception of a glide when given a short time period between twosteady-state stimuli differing sonr"what in frequency. Therefore, perceptual results seem to argue that srn important pC- eptualcharacteristic of glides is something more than, or different than, ovee4ll pitcii quality'.
Looking at the physical stimuli from Mattingly (FIGURE 1), notice that we appear to ha.e good continuation between theglide and the followine steJv-state. Agaii,, we need to be careful in not drawing conclusions about basic units of perception usi,-onl, the static visual representation of the auiditory stimulus. I don't want to steal too mAch from Mike !ral's later paper, but one ofthe questions is whether or not the presence of physical good continuation in the sisuua representation of the phssical srimuli i,
equivalent to perceptual goidl continuation.As shown i•i F:I(iIRF 3, one can somewhat offset the ending freouencs' of the trns;, 'on relative to the steady-state portion
"is.rhout disitriptig the rendesno to perceive the transition as approp, iate for tre phioneme normallk definied in terms of contin tity withthe following portion if the stimults. In Fig. 3 the rising (falling) transitions are perceived as equitialeit even though the centerfrequencs of ose trunsitioti is equal to the starting frequency of the other. These risults get hack to the notion that an irtri antfeature for some crnsorants nra'; be related to a perception of motion (or change) in frequency, wtth direction being inmportant.
llowve.er, ws nel't to nll a qualifieation, siure Schouten (1986) found that the ability to perceive the diret-rion of transitions many bequite lirrted, and that percei.ied direction need not correspond to physical direction of frequcncy change (ireinfrciring the point about
letting perception define riles).]'he notion of good continuation may still apply, but only when defined in perceptual. rather than plhysical, terms.
Systematic research h, Schhouten (ift.iý 19S6; Schouten & Pols. 1984), as weli as a number of recent papers or perceptual limits for
transitions maNl begin ti provide some insights into when sonic aspects of transitions might begin tn change it) perceptual nature(IlIliott et or , 1991: Iule,ý', & Moore, 19&S; von Wieringen & Pals, 1991). Vie suspect thai, as (Chris l)au"ss'in has demionstrated forsimilarity hixsed ipotn funrlament,) frequency for vowel formant , a sufficient discreparinc' in continuation cat) becotie perceptually
salie, , il- is leading to segregation, rather than integration of perceptual elements. In fact, an earl her studch h Repp antI Pentin(19841 although nitripitreid sonuieshai differently. demonstrated that, with sufficient freq rielcs olfftt, transitions (to begin tip'it-pc tu ills seg ip,.;, n f li, t te ttu;iirin lt'i of the synthetic (V syllables.
\Ve (I nt, ri• t -he largcr issue of defining critical aspects of petreption--ith the ;l nitnlnrot i, jlu iirirs of perception mayre a frnctiri' of i ,f-I f p'rp(eotual anatlu,,i. One problem is a relative absence f tesr;u'lr innl for dtintrirninig p '"sitile basic units
,if pr.reption, it o .r ' h , eptiro l fcu:turus of complex aundirorl stimuli. 'Ihis issue" is iih u tu'io r, if itit lef lt 1 1i uthr " talk.
SIS
It
Pastore- Acous.nrtc Society. 2pMU3, May 1993 - 5/16/93 3
h, speech perception there is a phenomenor called normalization which has been explored by Pisoni and his colleagues.Normalization is really a modem analog of the classic notion of perceptual constancy. In speech it has been noted that perception of a(V syllable or a word persists despite changes in talker, speaking rate, and a number of other properties of the source event.!.ikewise, in music, one can perceive the equivalence cf chords, or sequences of chords, played by d;fferent ins-ruments. In the speec&literature, normalization is argued to be an active process which takes tine to implement. Irrelevant changes in speaker or instrumentcould be represented as added variability or noise, and thus lower signal-to-noise ratio, which should slow processing, but also reduceaccuracy. In normalization, the perceptual sysstm is assumed to be able to evaiaate, and possibly even anticipate the nature of theirrelevant variability. The system then fact -rs ort the irrelevant variability, thus restoring accuracy, or imnosing constancy, onperception. Notice that an anticipatory normalization process could potentially involve imagery. In fact, Crowder's excellent work onmusical imagery is based upon the perceptual system retrieving some sort of an internal representation of an irrelevant stimulusproperties which is to be factored out.
In order to effec-tiely investrg•te normalization, the researcher really needs to begin with a reasonable conceptualization ofthe critical perceptual elements or features which are constant and those elements which are factored sut. Alternatively, one might usenormalization as a tool to begin to evaluate conjec•tures about essential perceptual features of auditory stimuli. This Friday, JenniferCho (SaMUS) will present a paper which looks at he relative roles of the attack at d the upper partial in timbre normalization fornatural and edited music stimuli. As part of this study, Jennifer evaluated the relationship between perceived similariw betweenstimuli defining instrument timla e and the normaliration of instrument differences for the perception of cho :'. I-FGURF 4 shows thereaction time measures for not ma'zation was an inverse function of perceived similarity. Thus similarity sca,,ig and normal~zationrepresent two very different procedures which can provide converging evidence in beginning to identify important perceptual featuresof music and speech.
Finally, I wish to turn to a model frost cognitive psychology which was developed for visual stimuli, but which has potentia;implic .tions for our understanding of auditory perceptual processing, and which is definltely related to the issue of the definition offeatures. In the early 1980s. Ann Treisman proposed her Feature Integration Theory (FIT) of perception. FIGURE 5 summarizes thistheory. In the basic task a number of different stimuli are presented simultaneot I,: to subjects. Stimuli exhibit different comtoinationsof values along several dimensions such as size, shape, color, and location. Accoiumg to FIT the values of featurre- are preattentivei,extracted independently and in parallel, with rough tags (in a master map) for location. Therefore, search for single features among astimulus array occurs in parallel and ti.as should be e.xremely rapid. For example, a yes-no task for the presence of a red or oraigestimulus should occur very quickly and should be ver, little affected by the number of stimul in the anray (as kcng as the subjects arenormal Trichromats and there is more than a few stimuli). Attention then is requir,.d for tlU,. serial task of conjoining the individualfeatures to result in the perception of objects at different locations. However, the search for a conjunction of features. such as a red0, should be slower, especir.. v as the number of stimuli is increased. Furthermore, when processing capacity is taxed, .ch as with alarge number of stimuli, one stould oficn find the perceptual system erroneously conjoining features presented at separate locations inthe array. Ar, illusory conjunction is the perception of an of.ject whose features appear in the stimulus array, LuI -I.ver together.
Mike Hall. Wenyi Huang, Bsrba a Acker, and I have just completed a ztucd (which we will report at a future meeting) usingmusical stimuli varying in instrumt at, pitch played, and the lateralizd ponition in the head. Our results have the patterns of reactiontime described by Treisr.in for conjoined feature searches. We also fi ,'d illusor, conjunctions of features at rates and levels ofsubject confidence which :Ire equivalent to those reported by Treisman for visual stimuli.
Notice the FIT relies upon the appropriate definition of features, and that features are processed in a master different thanperreptial elements which are really conjoined features. In fact, sone aspects of our results are best interpreted as our using complex,Lonjoined features, rather than b,.sic perceptual features, for some of the "single-feoure" pitch and instrument searches. Although it isinteresting, and riot really surprising, that one should find similar higher level processes for both visual and auditory (specificallyMrILriC) stimuli, tkt -chniques used to demonstrate FIT repres._ it another approach to beginning to identify perceptu. I features.
I now return to nm, initial point thvt Gestalt researchers .arned that proper conclusions about principles of perception ncedto •egin with the identification of peric prual units defined by the perceptual system, and not simply by the researcher's intuition.I'Vhen such units of perception have bee r defined properly. ,e will best understand those aspects of Gestalt principles which describethe perception of speech and mrnsic stimuli. hlie important point is that an adequate identification of the basic features of per-eptioni, critical for the development and ev-luation of all models of cornple.x auditory perception. In this paper we have looked at recentresearch development .. i provide a riunber of new techniques which can be used to evaluate potential definitions of feat,ires andwhich can provide converging evidence in support of that type of evaluation.
Acknc ledgecnient
Research described in this paptr twas supported in part by grants F4%20%10033 and 1`49620l9310327 frnm Air Force Officeof Scientific Rese,,rli and grant BNS8qI 1456 front the National Science Foundation. Tile opinions, results, and onclisions ae thoseof the a•othlt rin Ifo) not nriersarlils leprr esent thoive of either glinnit rig egrnrv.
I). Ii ... ( J... ( (,: liei. R l I. Si ,,7) l'ritptuinii ,Iepruu t•ri i spctli t i ii coi r eri it soriuds. ri .1cl tsiltrs. N l .11 (1 dI I lire
0S
Pastore- Acoustical Societv. 2pNIU3. May 1993 - 5116/934
Dooley. G.J.. & Moore, B.C.J. (1988). "Detection of linear frequency glides as a function of frequency and duration."Journal of the Acoustical SociMt of America,84, 2045-2057.
Elliott. LL., Hammer, MA., & Care[], T.D. (1991) 'Discrimination of Second-fonnant-like frequency tr-assitions,"Perception & Psychophysics, 50, 1-6.
Mattingly. 1IG., Liberman, A.M., Syrdal, A.K.. & Haiwes. T. (1971). Discrimination in speech and nonspeech modes. CognitivePsch oz2, 131-157.
Nabelek, V., Nabelek. A.K., & Hirsh, IiJ. (1970). Pitch of tone bursts of changing frequency. Journal of the Acoustical Societ ofAmer!c .48, 536-553.
Pasture. R.E. (1981). Possible psychoacoustic factors in spech perception. In P.D. Eimas & J.L Miller (Eds.). Per'spectives in theStudy of Srtech. Hillsdale, NJ: Eribaum. Chap S.3
Pastore, WE.. Li, X.-F., & Layer. J.K. (1990). Categorization of chirpt and bleats; their similarity to speech. Perception &Psychorphysics. 48, 151-1%6.
Porter, RiJ., Cullen, ilK., Collins, MiJ., & Jackson. D.F. (1991) "Discrimination of formant transition onset frequency.Psychoacoustic cues at short, moderate, and long durations," Journal of the Acoustical Society of America, 90,1298-13108.
Repp, BHI-.. & Elentin, S. (1984). Parameters of spectral/temporal fusion in speech perception. Perception & Psychophysics, 3-6, 523-5311,
Schouten. NI. ( 19M.). Itdettification and discrimination of sweep tones. Perception and Psychophysics, 37, 369-376.
Schouten, NI. (19M). Three-way identification of sweep tones. Perception and Psychophysics, 40, 359-361.
Schouten, M., &Pols. L. (1984). Identift'-tion and intervocalic plosive consonants: The importance of plosive bursts vs. vocalictransitions. In M. van den Broeck & A. Cohen (Eds.). Proceedings of the 10th International Congress of Phonetic Sciences,Forts Publications, Dordrre.ht, 464-468.
T reisman. A.M., and Gelade, G. (1980). A feat ure-integration theoty of attention. Cognitive Psycholo y 12, 97-136.
\kertheimer, M. ( 1958). Principles of perceptual organi-ration. In D.C. Besrdslee & M. Wertheimer (Eds.). Readings in Perception,115-135. Ntýs Y5urk: s-an Nostrand.
%ýierrtgeri. A. v-an, & Pols, I,.C.\,\. (1991). Transition rate assa cue in the perception of one-forosant speech-like synthetic stimuli.Proceedines of the Xilth International Congress of Phonetic Sciences, Aix-en-Provence, Vol. 3, 446-449.
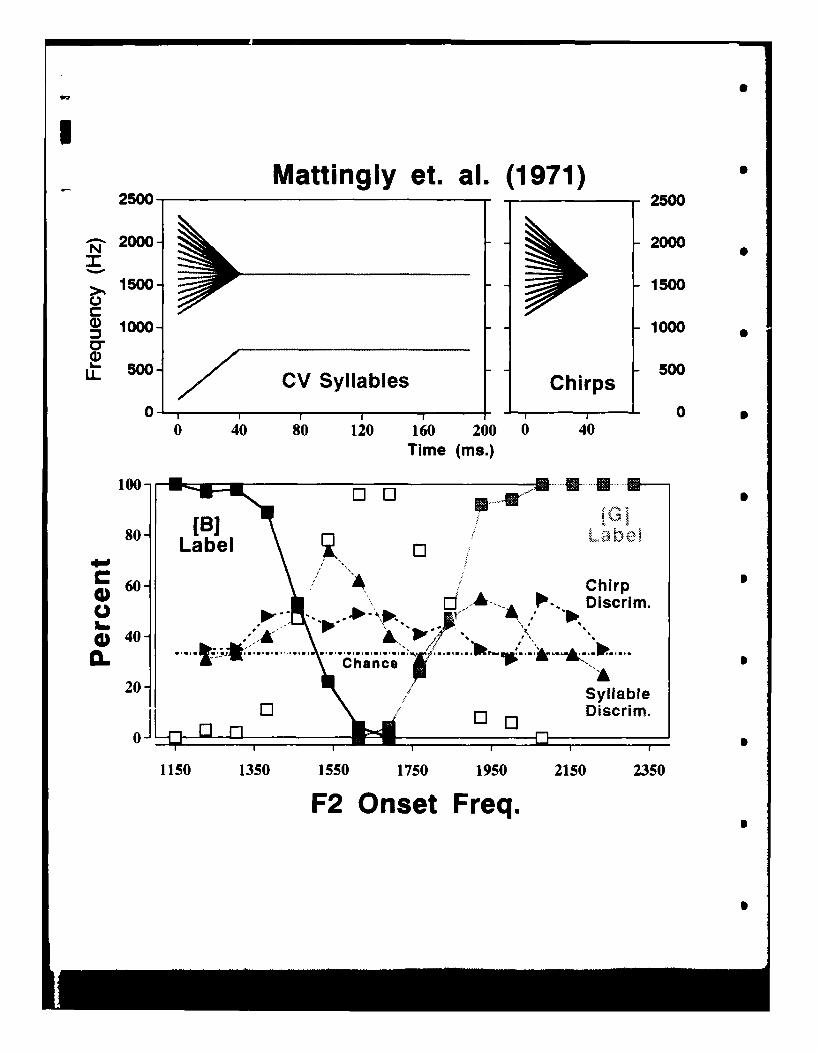
!S
Mattingly et. al. (1971)2500 2500
N2000 2000
>, 1500 1500
0~ S1000-5 1000
LL 500 CV Syllables Chirps
01 1 0
0 40 80 120 160 200 0 40Time (ms.)
100- L E-'G80 7[B] JGbb
Label
60 " ChirpS- ,E D iscrim .
40 A
20 .Syllable
E] i Discrim.
1150 1350 1550 1750 1950 2150 2350
F2 Onset Freq.
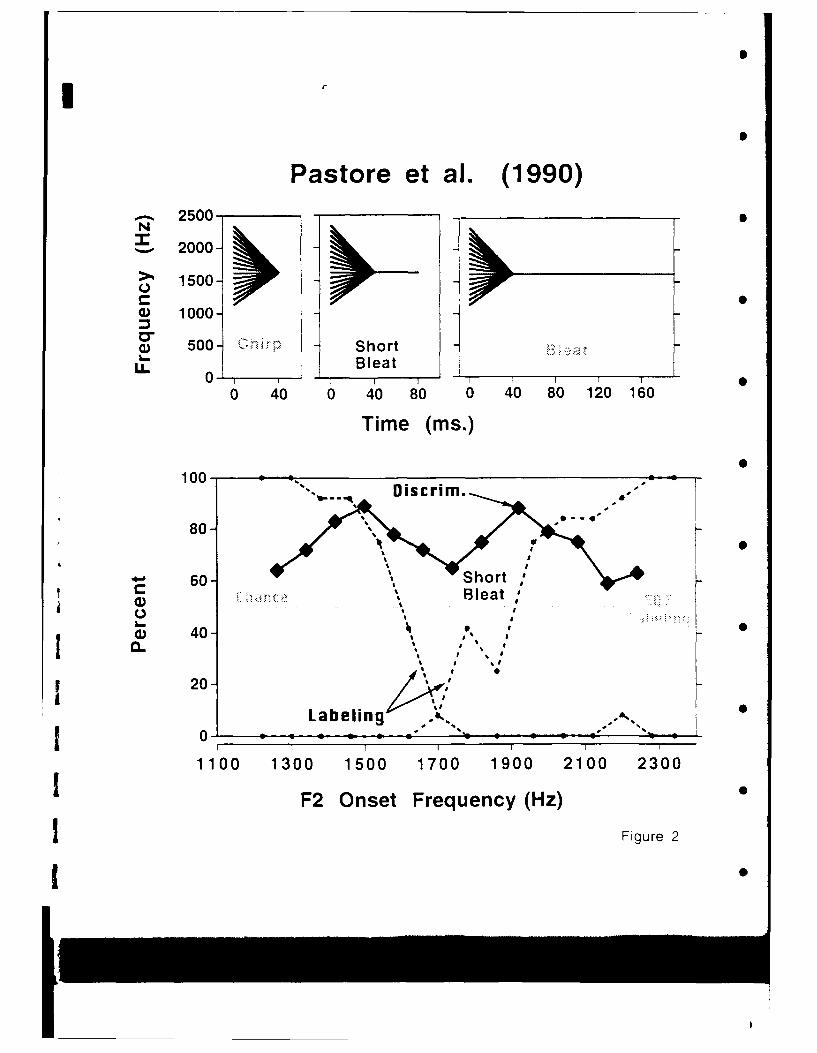
I
Pastore et al. (1990)2500 -
N
%-w 2000-
>" 1500-
a) 1000-
S500- ShortL- 0 BleatS0 , I ,i I I. , 0
0 40 0 40 80 0 40 80 120 160
Time (ms.)
100- ."- l~~iscrim, .
80.
400
60-
II
S400
Labeling/ .. ..00-
I II I
1 100 1300 1500 1700 1900 2100 2300
1 ~F2 Onset Frequency (Hz)
S~Figure 2
I I °
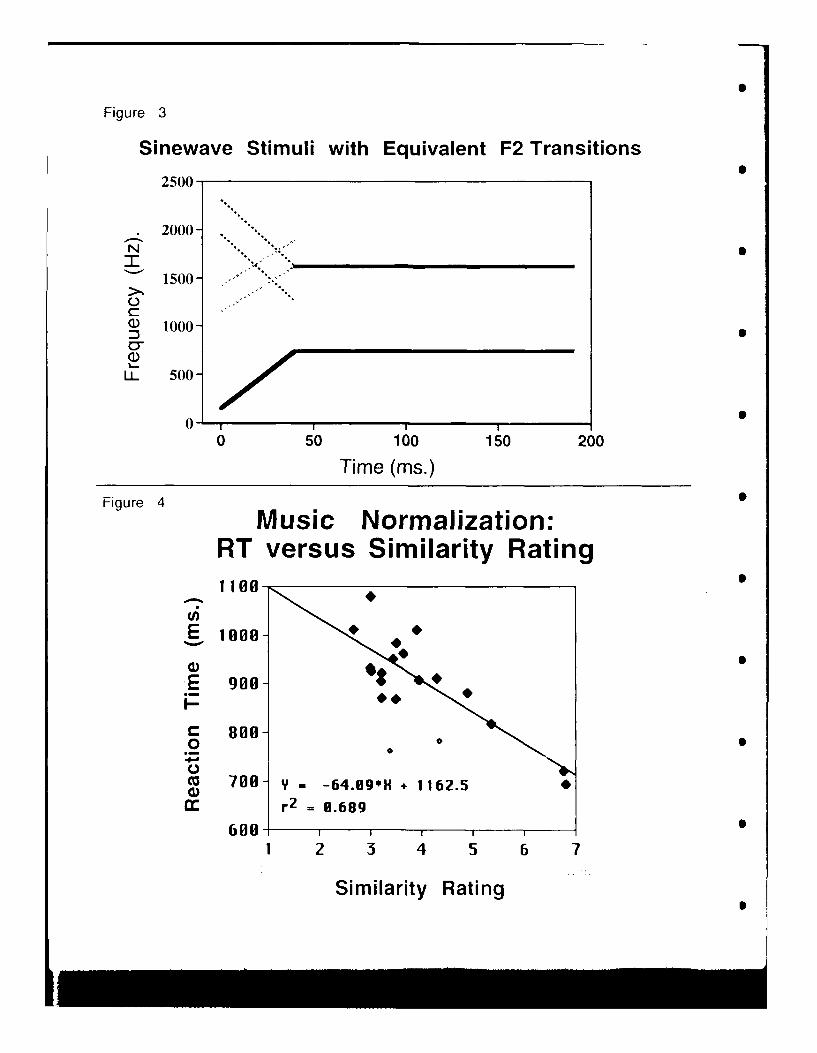
[S
Figure 3
Sinewave Stimuli with Equivalent F2 Transitions
2500-
2000-
T--'
1500-
S1000-
0ILi.. 500-
0- 050 100 150 200
Time (ms.)Figure 4 5Music Normalization:
RT versus Similarity Rating
E IoeO8 -
% .1- #
go@
S700] Y = -64.89*H + 1162.5icc r2 0 .689
60 V
1 2 3 4 5 6 7
Similarity Rating
90
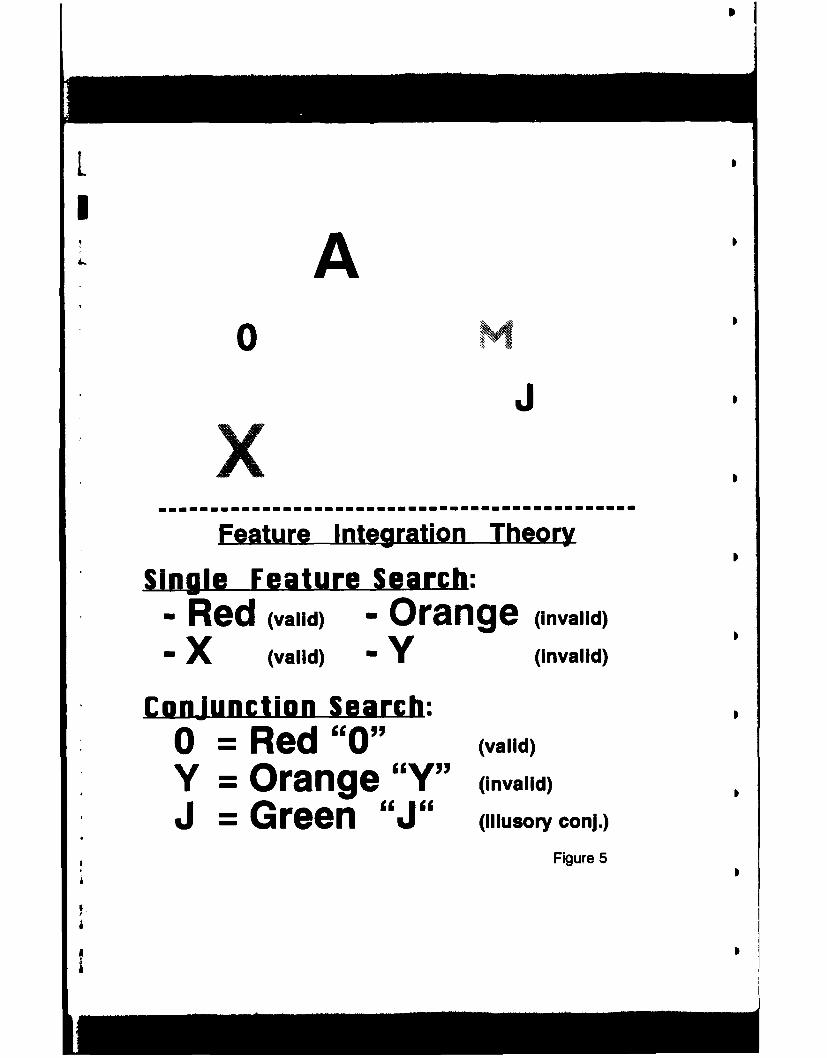
LmS~A
0
JxFeature Integration Theory
Single Feature Search:- Red (valid) w Orange (invalid)
"m X (valid) m Y (invalid)
Conlunction Search:
0 = Red "0" (valid)
Y = Orange "Y" (invalid)
J = Green "J" (,ilusory conj.)
Figure 5
ip
0
Measuring the DL for Identification of Order of Onset for Complex Auditory Stimuli
Richard Pastore, Shannon Farrington, and Sajni Jassal
Abstract
Discussion of the approximately 20 ms. threshold for the identification of the order of onset of components of auditorystimuli has ranged from consideration of the absolute threshold (RI) as a possible factor contributing to the perception of voicing
contrasts in speech to claims that the threshold is a methodological artifact. The current research investigates the identification ofthe temporal order of onset in terms of the Difference Umen (DL) for complex stimuli (modeled after CV syllables) which vary in
degree of onset. The results provide clear evidence that the DL at relatively short onset differences (less than 25 ms) followspredictions based upon a perceptual threshold or limit. Furthermore, the DL seems to be a function of context coding of stimulusinformation, with both the DL and RL probably reflecting limits on the effective perception and coding of the short-term stimulusspectrum.
End of Abstract
Running Head: DL for Order Onset Identification
Somewhat over three decades ago Hirsh reported new findings on some temporal limits of perception which has run a
full circle from being ignored to being widely cited, then often misunderstood, and finally again largely ignored. Hirsh (1959) foundthat there are a series or hierarchy of temporal limits on perception. For monaural (or diotic) presentation conditions, a differenceof approximately 2 msec was required for detecting an onset ansychrony of two auditory stimuli (defining a threshold forsimultaneity), but a difference of approximately 20 msec in onset was required to identity which of the stimuli had an earlier onset(defining a threshold for order of onset). This later Temporal Order Threshold (TOT) can be contrasted with a threshold of severalhundred msec for correctly assigning the order labels to a sequence of four or more stimuli repeated in sequence (Warren, 1982).Moving in the other temporal direction, a difference of only a few microseconds is required to detect a difference in onset for theidentical stimuli presented to the two ears, with this threshold really reflecting a difference in lateralization (Hirsh, 1974). Each ofthese thresholds has been replicated a number of different times by different researchers using a variety of psychophysicalprocedures. Hirsh's major point was that there are a number of different types of temporal limitations, with the two shorterthresholds probably reflecting sensory limitations, and the longer limits reflecting perceptual or even memory limitations on theprocessing of stimuli. These observations are important in their own right.
The focus of the current research is approximately a 20 msec threshold for TOT which, for a number of years, had beenof extra interest because of its potential relationship to the perception of initial position stop consonants of English which arecontrasted in voicing. Hirsh (1959) had observed that such stop consonants typically exhibit a labeling or categorization boundarywhen voicing onset is delayed by approximately 20 msec relative to the release or onset of the syllable. Hirsh (1959) conjecturedthat the TOT limitation may be an important underlying basis for voicing contrast. This conjecture makes a great deal of sense; thethreshold implies that although subjects may be able to detect a difference in onset for various components of the complex signal(e.g., speech), an onset difference of at least 20 msec (in ideal laboratory situations) is required to reliably identify which componenthad an earlier (or later) onset. Thus, an initial consonant is voiceless if the higher frequency or asperated components are perceivedas having an onset before either the lower frequency (Ft) or the voiced components. Later research demonstrated categoricalperception along a temporal onset continuum for noise buzz stimuli (Miller, Wier, Pastore, Kelly, and Dooling, 1976) and for pairsof tones (Pisoni, 1977). The pattern of categorical perception for the stimuli was fairly similar to that reported earlier for syntheticspeech stimuli varying in Voice Onset Time (VOT). Thus, the 20 msec TOT was of interest both as one of a limited set of temporallimits on perception and because of its potential role in voicing contrast, the latter defining the TOT hypothesis.
Criticisms of the TOT HypothesisThe first major criticism of the TOT hypothesis as the auditory basis for the perception of voicing contrast was based upon
a systematic study by Summerfield (1982). Hirsh (1959) had found that TOT was independent of stimulus type. A number of laterstudies had demonstrated that the VOT boundary for American English syllables was a function of place of articulation, varying from24-28 msec for labial stops to 28-52 msec (or more) for velar stops (for review, see Pastore, 1987a). Summerfield built upon theseobservations, demonstrating that TOT for tones and noise-buzz stimuli was relatively constant, and thus independent, of many ofthe frequency parameters which have been demonstrated to be important for changes in place of articulation. Furthermore, the TOTboundary was at a much shorter duration than reasonable.
if one adopts an extreme view about the TOT hypothesis, positing that voicing contrast is based solely upon whether ornot the listener can perceive the order of onset of specific components, then the Summerfield study represents clear evidenceagainst this hypothesis. However, a weaker version of the TOT hypothesis is still reasonable. According to the weaker version ofthe hypothesis, perception of an order of onset is an important contributing factor or cue for the perception of voiceless quality, butit is not the only cue. This multiple cue notion has a reasonable basis in the general findings that all speech categories are basedupon the contribution of a number of different features or cues, with the perception of voicing contrast reflected in the action of upto 16 differem cues (Lisker, et al., 1977). If voicing contrast, or any other phonetic contrast, were based upon any single factor orthreshold, thon the decades of research by outstanding scientists would have long ago succeeded in identifying the singular factordetermining a phonetic contrast. Furthermore, there are logical grounds for conjecturing that temporal order limitation is a 3contributing factor to the perception of voicing contrast. Specifically, production with English stop consonant studies have founddistributions of voiced stimuli which are skewed toward simultaneity, with very few tokens having VOT values even approaching theapproximately 20 msec TOT, and with the distribution of voiceless tokens skewed toward higher VOT values, again avoiding the
/S
DL. for Order Onset Identtflcatt-nn2
ambiguous region near the TOT chreshold limitation. One critical question, then, concerns what specific components of the stimuli
might be perceived in an ordered fashion.AJthough if ia not necessary/for voicing contrast to be based upon the ordered perception of the same limited set of
stimulus components for all categories of place of articulation, a logical single starting point for a common temporal contrast would
be the F1 cutback in which there is no activation of the low-frequency first formant resonance until after the onset of voicing, withthe higher formants being activated within a very brief period following the release of the consonant. An alternative candidate mightbe whether or not the release burst is perceived as occurring clearly before the onset of voicing. The current research will focus on
the first of these two conjectures.,Following the work of Summerfield (1982), several studies demonstrated that the TOT can be a function of stimulus
parameters, especially when those stimulus parameters are consistent with stimulus properties exhibited in natural and syntheticspeech stimuli. Hillenbrand (1984) demonstrated some variation in TOT for stimuli with dynamic changes in frequency at onset,thus mimicking with tonal stimuli the frequency changes associated with Fl, F2, and F3 transitions. Pastore, et el. (1981; 1988)demonstrated significant changes in the TOT for stimuli with dynamic frequency transitions at onset coupled with variation in risetime and the presence of an initial release burst. For stimuli with slow rise times (typical of speech stimuli) and strong initial releasebursts, TOT, measured usirg a two alternative force choice procedure, was found to be ss long as 40 msec for certain types of
stimuli, especially those patterned after velar stimuli contrasted in voicing. These results would all seem to support the weak version
of the TOT hypothesis.
Recent Criticisms of TOTIn the late 1980s there were two new criticisms of the TOT hypothesis, both of which argued against the existence of an
approximate 20 msec threshold for temporal order identification. The argument by Rosen and Howell (1987) is a theoretical one
based upon methodological issues. The argument by Kewley-Port, Watson, and Foyfie (1988) is based upon empirical work underminimal uncertainty conditions. In addition, the excellent text on hearing by Moore (1989) simply does not recognize a limitationon temporal order, instead citing only the 2 msec boundary for simultaneity and the 200 msec boundary for labeling the individual
components in a S'rquence of stimuli. These arguments about the absence of a 20 msec temporal order threshold ignore the
replication of the threshold using a number of different psychophysical procedures. However, the heart of each of the majorcriticisms will be addressed before summarizing the current research effort.
Hirsh MethodolooyRosen and Howell (1987) argue that the Hirsh (1959) procedure is really a labeling task, and that when the original Hirsh
results are replotted in terms of labeling, one obtains a 50% category boundary at approximately onset synchrony (0 msec onset
difference), with no indication of any threshold or limitation at approximately 20 msec.Hirsh used standard psychophysical methodology from the time to measure a difference threshold (Difference Uimen or
DL). Understanding the assumptions underlying the measurement of a DL, and the limitations with which Hirsh (1959) had to deal,one sees that the Rosen and Howell argument is based upon the implicit and testable assumption that the relevant DL does notexist. Relevant notions about measuring the DL can be found in the important text from the time of Hirshas research (e.g., Osgood,1953; Woodworth and Schlosberg, 1954) and are summarized in Figure 1 (panel A). According to classic notions, there is a region
around the Point of Objective (or Physical) Equality (POE) within which subjects perceive an equivalence to the standard or cannotreliably identify a difference from the standard. This region of perceptual equality is called the interval of uncertainty, its midpointis called the Point of Subjective Equality (PSE), and the DL is half of the size of the interval of uncertainty. In the case of the researchby Hirsh (1959), there really are two regions of uncertainty surrounding temporal onset synchrony. There is a very narrow region
for the perception of synchrony (this interval of uncertainty equals 4 msec( and a broader region within which subjects cannot reliablyidentify the order of onset (this interval of uncertainty equals 40 mnsec). Beyond this region in each direction subjects can reliably
discriminate stimulus differences, As with any threshold, there is a statistical distribution of response probabilities, rather than aquantum or discrete change in the probability of response.
One, method for measuring the DL is to ask subjects to adjust the stimulus magnitude either from a state of clearperceptual difference to an initial state of equality, or by beginning with the stimulus of physical equality and ask the subjects to
adjust the stimuli until they can first perceive the designated perceptual difference (e.g., order of stimulus onset). Either methodof adjustment would define the two limits of the interval of uncertainty which define the boundaries between three response regions
(perceptually lower, perceptually equal, and perceptually higher). Unlike thresholds defined in terms of intensity, a TOT requires
a discrete trial situation where it is difficult to manipulate onset difference, especially using the technology available in the 195Os.Hirsh thus was forced to use the method of constant stimuli. For methods of constant stimuli the three response regions can be
mapped using either a 3-category or a 2-category method (Osgood, 1953).
Insert Rigure 1 about here
Fig lA shows typical results for measuring the DL using a 3-category version of the method of constant stimuli. The
abscissa ;epre~unts an arbitrary designation of the stimulus continuum, with zero being the stimulus standard (POE). In the caseof a temporal order continuum, zero would represent onset synchrony, with the continuum representing (in totally arbitrary units)
the relative onset of the two components to the stimulus (eg9., lower frequency having an earlier, versus later, onset). The three
curves, each representing an assumed underlying category, are plotting the relative probability for responding to category A or B
SI I I II
L S
DL for Order Onset Identification 3
(discriminable differences) and the uncertain (or equality) category. In this hypothetical illustration the three response probabilitiesare actually based upon normal (uncertain category) and cumulative Normal or Gamma (categories A and B) distributions, with therelative proabilities scaled to sum to unity for each stimulus. Using classic psychophysical methodology, the interval of uncertaintycan be estimated in terms of the stimulus values yielding 50% identification for categories A and B, with the DL being half of thisinterval. Since the illustration in Figure Ia has plotted an ideal interval of uncertainty which is symmetric around the POE (i.e., PSE= POE), the value of the stimulus at the upper limit represents the DL, and is so indicated in Fig. IA.
However, in measuring TOT the separate threshold for simultaneity represents a major problem in defining allowableresponses for subjects. On a conceptual basis, as one increases the onset difference (in either direction) from onset synchrony,perception changes from (1) synchrony to (2) asynchrony coupled with an inability to identify order of onset, and finally to (3) a clearordered onset. The simplest and most understandable instructions to the subjects is to indicate the order of onset, measuringthreshold based upon correctness of response. This approach, which was used by Hirsh (1959), follows the standard 2-categorymethod for measuring the DL (Osgood, 1953). In the case of Hirsh's Temporal Order study, the targeted middle category is not oneof simultaneity (4 ms wide), but rather the broader (40 ms) range for inability to correctly perceive order of onset; the middleresponse category cannot indicate equality of onset, but rather a failure to accurately identify order of onset. Thus, the 3-categoryprocedure therefore could not be effectively implemented.
Insert Figure 1 about here
The logical, alternative procedure (e.g., Osgood, 1953) is to use only two-response categories (the "low" and "high'categories from Fig. la). The resulting psychometric functions, derived from the three distributions found in Fig. Ia, are plotted inthe lower panel (b) of Fig. 1). The "low" responses should occur either when the subject perceives a "low" event (reflected in thep (low) curve in Fig. la) or when the subject jointly fails to perceive either category (reflected by the uncertain or neither categoryin Fig. Is) and guesses "low." Assuming an equal probability of guessing sampling from the uncertain or neither category, theprobability of responding "low" for any given stimulus therefore can be derived from Fig. ia and should be equal to the p (low) plusone-half of p (neither). The resulting 2-category psychometric functions have been plotted in Fig. lb. Notice that the twopsychometric functions no longer resemble a cummulative Normal distribution, but rather have distinctive deviations (e.g., areshallower, rather than steep, in slope) for stimuli falling within (and near) the interval of uncertainty. The 50% point for these 2-category psychometric functions represents the point of subjective equality (PSE) which, (by definition) should at least approximatethe POE, and thus onset synchrony.
Because the 2-category procedure forces guessing, the points which had been represented by the 50% performance valuesin Fig. 1 A now must be estimated from the 75% points in Fig. 1B (e.g., 50% correct responding plus 50% guessing for the remainingtrials). The 75% criterion for the 2-category procedure yields the same DL estimate as the 50% criterion with the 3-categoryprocedure (as illustrated in Fig. 1). Rosen and Howell (1967) have made an implicit assumption that the middle category (intervalof uncertainty) does not exist and have taken as supporting evidence the correspondence between the PSE and POE.
The functions in Fig. 1B also provide us with an important insight into the category structure being used by subjects. Thedeviation from a reasonable cummulative Normal distribution found in Fig. lb can be interpreted as a clear indication that thesubjects have an additional, intervening category which they are distributing between the two allowable response categories. Hirsh(1959) used the 2-category procedure and his results (scaled in terms of Z-scores) to exhibit this critical characteristic (a linearfunction with a bend or elbow). The Hirsch findings thus indicate the existence of the implied intervening category. [It also shouldalso be noted that it is fairly typical to find such deviations from a reasonable cummulative Normal distribution in the labeling resultsfor a number of different speech continua.
Sensory or Perceptual UmitKewfey-Port, Watson, and Foyle (1988) have argued from a different perspective that there is no temporal order threshold,
at least not at the limits of sensory capabilities. Their study reports on a lack of evidence for any temporal order limit ofapproximately. 15 to 20 msec under minimal uncertainty conditions using highly practiced subjects. The Kewley-Port, et al. studyis a solid research project on perception under minimal uncertainty conditions. Although we have questioned whether there is trulya lack of evidence in their results for a threshold at approximately 15 to 20 msec (Pastore, 1988; see also Watson & Kewley-Port,1988), the important issue for the current study is that Hirsh (1959), and other subsequent research on temporal order perception(e.g., Miller, at al., 1976), have clearly argued that the temporal order limitation is perceptual, and does not represent a sensorylimitation (we will return later to the issue of the nature of such a perceptual limitation). Therefore, the issue of whether or not onefinds evidence for a temporal order identification threshold of approximately 15 to 20 msec at the limits of sensory capabilities,although interesting in its own right, is really irrelevant to perceptual research focusing on this threshold, and its possible role in theperception of voicing contrasts. Furthermore, when a finding has been often replicated under a wide variety of more naturalconditions, a single failure to replicate under extreme conditions cannot falsity the more typical findings.
Kewley-Port, et al. also addressed temporal order perception (under minimal uncertainty conditions) in terms of the sizeof the Weber fraction; this represents an important approach to studying TOT. If there is no TOT then the function relating t to tshould reflect a Weber function, and thus shall be linear with a positive slope corresponding to the Weber constant. From aseparate, theoretical basis, Pastore (1987b) had also addressed the nature of TOT as an absolute perceptual threshold, incorporating Sthe notion of a Weber fraction. This analysis conjectures a two stage function relating I to ý. For relatively small (below threshold)onset time differences, the size of a just noticeable difference in temporal order of onset, I, should equal the difference between
6S
DL for Order Onset Identification 4
the given stimulus, t, and the absolute threshold for order discrimination, to (e.g., any subliminal stimulus should be just
discriminable from the stimulus which first exceeds threshold). This relationship is described by the formula
=(to = -) + c (for 1 < t) (1)
There really are two different values of t. One value of to represents the threshold for simultaneity and isapproximately 2 msec. The other value is the temporal order identification threshold which, for relatively stationary stimuli suchas those used by Hish (1959), Pisoni (1977), and Miller, et al. (1976) would be approximately 20 msec. However, with dynamic Sstimuli similar to those used by Pastore, et al. (1988), to would be at a larger temporal order difference, possibly up to 45 msec.In this equation the constant, c, represents noise or variability in the system. This formula based upon quantal notions ofabsolute threshold, predicts that the size of the just noticeable change in temporal onset should decrease linearly (slope of -1.0)for temporal onsets up to to, the threshold for temporal order identification. Because we are dealing with a psychophysicalprocedure based upon probability distribLuions, we ran a simulation of observer behavior in a 21FC task measuring I. Thesimulation assumed that judgement is based upon whether or not threshold (1,,) is exceeded (as in Eq. 1). In this simulationunderlying Gaussian distribution of noise was assumed, with the stimuli spaced at equal Z-score distance. The additionalconstraint on the simulation was that subjects would guess (p =0.5) when stimuli were both either below or above threshold(there is the added implicit assumption that two compared supra-liminal stimuli differs by less than the DL for supra-liminalstimuli]. Psychometric functions were generated, then used to estimate the 75% estimate of t for each value of ii up to a valueof t. The simulation indicated that the measurement procedure should result in a linear function, but with a slope ofapproximately -0.5 and with t=0 at a value of ; which exceeds by a small amount theoretical value of ti.
This derivation provides one contrast in predictions: whether the function relating I to ý (for smaller values of ý) hasa slope of -0.5 or less (threshold model) or has a positive slope (Weber function). If we assume the validity of Weber's law fortemporal differences above this threshold, then the remainder of the differential sensitivity function should follow the equation:
I =k(;-to)+c (for; >to) (2)
In Eq. 2. k is the Weber constant, with all of the other parameters being equivalent to those in Eq. 1. Both equations for thethreshold notion predict that the difference threshold should reach a minimum value of c when the standard, ;, approximates to.Eq. 1 predicts a linear decrease in the size of the just noticeable difference up to to, with Eq. 2 predicting a linear increase in thesize of the DL for values of ; > t0 . Thus, the second major difference in predictions is that the threshold model requires twolinear functions with an intersection representing a minimum value of t near threshold (tI), whereas the no threshold mode!based upon a Weber fraction predicts a single linear function with a positive slope,
There are a number of different issues to be addressed in the current resparch. The first issue is whetherdiscrimination results for the perception of order of onset follow the pattern predicted by the functioning of an absolutethreshold. The second issue relates to the degree to which context coding plays a role in the identification of order of onset.This issue builds upon notions which were originally developed by Durlach and Braida (1969) and have been more recentlyapplied to speech in the work of Macmillan, Braids, & Goldberg (1987; Uchanski, Millier, Reed, and Braida, 1992). This secondissue is of interest not only in its own right, but also because recent work by Schouten and van Hessen (1992) reported resultsfor the discrimination of phonemes contrasted in place of articulation which seem to indicate a lack of trace coding (thus, use ofonly context coding), with a lack of differences predicted on the basis of the psychophysical task employed.
General MethodsSubjects
A total of eight subjects were hired for this task. All had normal hearing and were native speakers of English. All werestudent age and considered participation to be a part-time summer position. Subjects were run in commercial sound chambersand listened to-the binaural stimuli over TDH-49 earphones.
StimuliTwo sets of stimuli were synthesized (10 kHz sample rate, 12-bit converter). The stimuli were sinewaves, with both
frequency and amplitude changing as a function of time in a manner which was consistent with that described for the CVsyllables used by Volitas and Miller (1992). All of the stimuli had two major components which corresponded to the F1 and F2resonances. The F1 component began at 180 Hz and rose linearly to a steady state of 330 Hz over the first 20 ms of the tonalportion of the stimulus. The frequency of this low frequency (Fl) component remained at 330 Hz for 180 ms, then declined to300 Hz over the last 100 ms. The frequency of the higher frequency (F2) component followed a similar temporal pattern offrequency change. ft either rose from an initial frequency of 1800 Hz to a steady-state frequency of 2200 Hz, or fell from aninitial frequency of 2400 Hz to the same steady-state frequency. Therefore, the two types of stimuli (Rising and Falling F2stimuli) differed in terms of the onset frequency of the higher frequency component. A given subject only listened to the tworising or the falling type of stimuli (Rising or Falling F2), and ran under both fixed and roving discrimination conditions.Therefore, we used a within subject design for stimulus type.
The amplitude of the original F1 stimulus and the F2 stimuli rose as a linear function of duration over the first 45 msAfter maintaining a steady-state amplitude for 155 ms, the amplitude fell to zero (ground) over the last 100 ms A basic onset
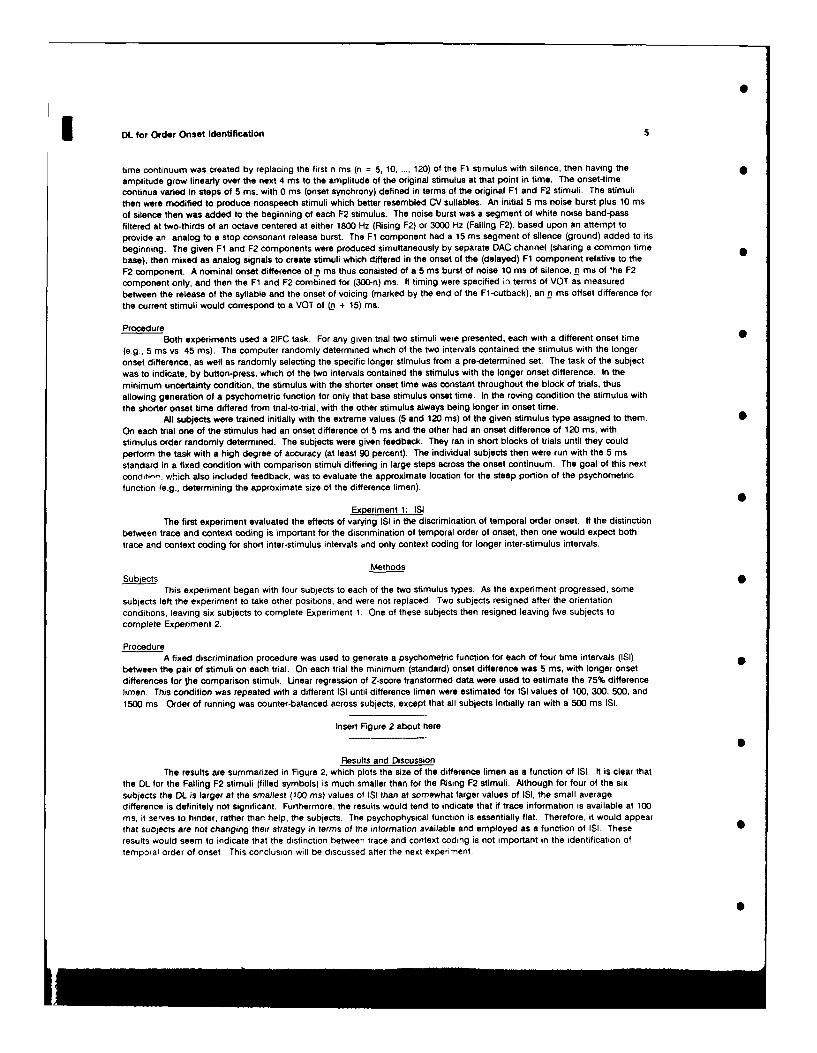
DL for Order Onset Identification
time continuum was created by replacing the first n ms (n = 5, 10, ..., 120) of the F1 stimulus with silence, then having the
amplitude grow linearly over the next 4 ms to the amplitude of the original stimulus at that point in time. The onset-timecontinua varied in steps of 5 ms, with 0 ms (onset synchrony) defined in terms of the original Fl and F2 stimuli. The stimuli
then were modified to produce nonspeech stimuli which better resembled CV sullables. An initial 5 ms noise burst plus 10 ms
of silence then was added to the beginning of each F2 stimulus. The noise burst was a segment of white noise band-passfiltered at two-thirds of an octave centered at either 1800 Hz (Rising F2) or 3000 Hz (Falling F2), based upon an attempt toprovide an analog to a stop consonant release burst. The F1 component had a 15 ms segment of silence (ground) added to itsbeginning. The given F1 and F2 components were produced simultaneously by separate DAC channel (sharing a common timebase), then mixed as analog signals to create stimuli which differed in the onset of the (delayed) F1 component relative to the
F2 component. A nominal onset difference of n ms thus consisted of a 5 ms burst of noise 10 ms of silence,_n ms of 'he F2component only, and then the F1 and F2 combined for (300-n) ms. If timing were specified in terms of VOT as measured
between the release of the syllable and the onset of voicing (marked by the end of the Fl-cutback), an n ms offset difference for
the current stimuli would correspond to a VOT of Ln + 15) ms.
ProcedureBoth experiments used a 21FC task. For any given trial two stimuli were presented, each with a different onset time 0
(e.g., 5 ms vs. 45 ms). The computer randomly determined which of the two intervals contained the stimulus with the longer
onset difference, as well as randomly selecting the specific longer stimulus from a pre-determined set. The task of the subjectwas to indicate, by button-press, which of the two intervals contained the stimulus with the longer onset difference. In the
minimum uncertainty condition, the stimulus with the shorter onset time was constant throughout the block of trials, thusallowing generation of a psychometric function for only that base stimulus onset time. In the roving condition the stimulus withthe shorter onset time differed from trial-to-trial, with the other stimulus always being longer in onset time.
AJI subjects were trained initially with the extreme values (5 and 120 ms) of the given stimulus type assigned to them.
On each trial one of the stimulus had an onset difference of 5 ms and the other had an onset difference of 120 ms, withstimulus order randomly determined. The subjects were given feedback. They ran in short blocks of trials until they couldperform the task with a high degree of accuracy (at least 90 percent). The individual subjects then were run with the 5 msstandard in a fixed condition with comparison stimuli differing in large steps across the onset continuum. The goal of this next
conditi-!. which also included feedback, was to evaluate the approximate location for the steep portion of the psychometricfunction le.g., determining the approximate size of the difference limen).
Experiment 1; ISIThe first experiment evaluated the effects of varying IS] in the discrimination of temporal order onset. If the distinction
between trace and context coding is important for the discrimination of temporal order of onset, then one would expect both
trace and context coding for short inter-stimulus intervals ,nd only context coding for longer inter-stimulus intervals.
MethodsSubiects
This experiment began with four subjects to each of the two stimulus types. As the experiment progressed, somesubjects left the experiment to take other positions, and were not replaced. Two subjects resigned after the orientationconditions, leaving six subjects to complete Experiment 1. One of these subjects then resigned leaving five subjects tocomplete Experiment 2.
ProcedureA fixed discrimination procedure was used to generate a psychometric function for each of four time intervals (ISI)
between the pair of stimuli on each trial. On each trial the minimum (standard) onset difference was 5 ms, with longer onsetdifferences for the comparison stimuli. Linear regression of Z-score transformed data were used to estimate the 75% differencelimen. This condition was repeated with a different ISI until difference limen were estimated for ISI values of 100, 300, 500, and1500 ms Order of running was counter-balanced across subjects, except that all subjects initially ran with a 500 ms ISI.
Insert Figure 2 about here
Results and DiscussionThe results are summarized in Figure 2, which plots the size of the difference limen as a function of ISI. It is clear that
the DL for the Falling F2 stimuli (filled symbols) is much smaller than for the Rising F2 stimuli. Although for four of the sixsubjects the DL is larger at the smallest (100 ms) values of ISI than at somewhat larger values of ISI, the small averagedifference is definitely not significant. Furthermore, the results would tend to indicate that if trace information is available at 100ms, it serves to hinder, rather than help, the subjects. The psychophysical function is essentially flat. Therefore, it would appearthat subjects are not changing their strategy in terms of the information available and employed as a function of ISI. Theseresults would seem to indicate that the distinction between trace and context coding is not important in the identification oftemporal order of onset This conclusion will be discussed after the next experiment.
iS
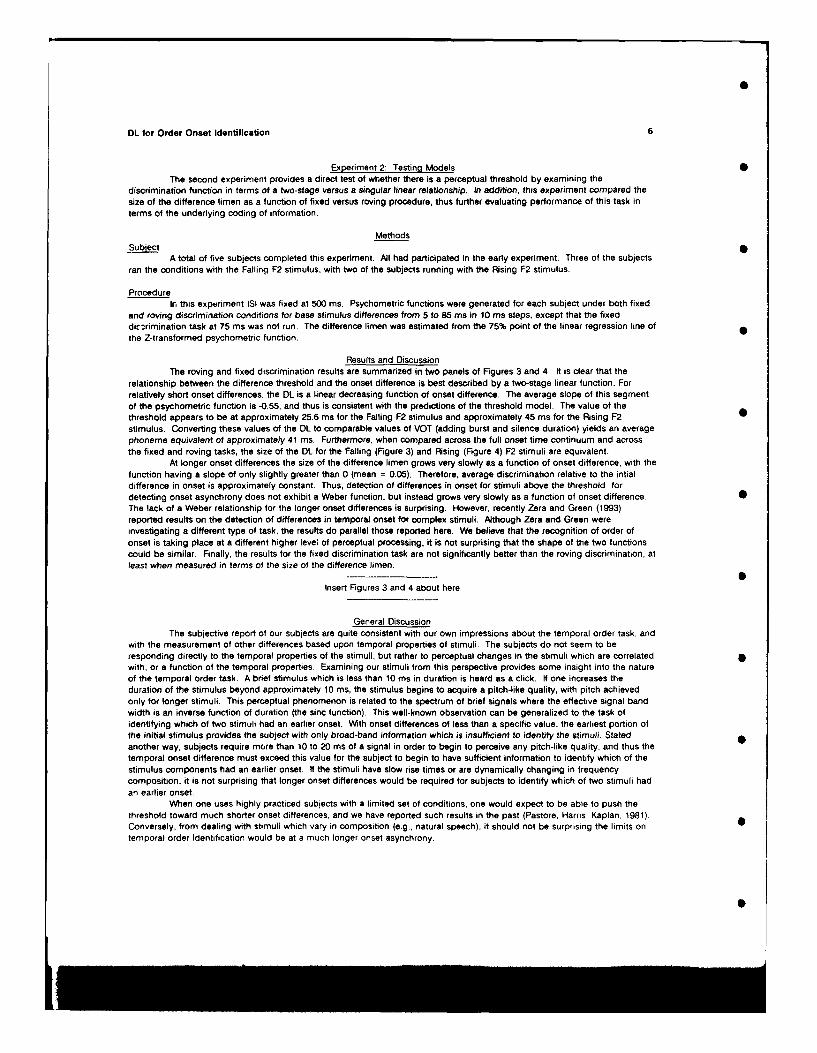
DL for Order Onset Identification 6
Experiment 2: Testing Models
The second experiment provides a direct test of whether there is a perceptual threshold by examining thediscrimination function in terms of a two-stage versus a singular linear relationship. In addition, this experiment compared thesize of the difference limen as a function of fixed versus roving procedure, thus further evaluating performance of this task interms of the underlying coding of information.
MethodsSubiect
A total of five subjects completed this experiment. AMl had participated in the early experiment. Three of the subjectsran the conditions with the Falling F2 stimulus, with two of the subjects running with the Rising F2 stimulus.
ProcedureIn this experiment ISI was fixed at 500 ms. Psychometric functions were generated for each subject under both fixed
and roving discrimination conditions for base stimulus differences from 5 to 85 ms in 10 ms steps, except that the fixeddcirrimination task at 75 ms was not run. The difference limen was estimated from the 75% point of the linear regression line ofthe Z-transformed psychometric function.
Results and Discussion
The roving and fixed discrimination results are summarized in two panels of Figures 3 and 4. It is clear that therelationship between the difference threshold and the onset difference is best described by a two-stage linear function. Forrelatively short onset differences, the DL is a linear decreasing function of onset difference. The average slope of this segmentof the psychometric function is -0.55, and thus is consistent with the predictions of the threshold model. The value of thethreshold appears to be at approximately 25.6 ms for the Falling F2 stimulus and approximately 45 ms for the Rising F2stimulus. Converting these values of the DL to comparable values of VOT (adding burst and silence duration) yields an averagephoneme equivalent of approximately 41 ms. Furthermore, when compared across the full onset time continuum and acrossthe fixed and roving tasks, the size of the DL for the Falling (Figure 3) and Rising (Figure 4) F2 stimuli are equivalent.
At longer onset differences the size of the difference limen grows very slowly as a function of onset difference, with thefunction having a slope of only slightly greater than 0 (mean = 0.05). Therefore, average discrimination relative to the intialdifference in onset is approximately constant. Thus, detection of differences in onset for stimuli above the threshold fordetecting onset asynchrony does not exhibit a Weber function, but instead grows very slowly as a function of onset difference.The lack of a Weber relationship for the longer onset differences is surprising. However, recently Zera and Green (1993)reported results on the detection of differences in temporal onset for complex stimuli. Although Zera and Green wereinvestigating a different type of task, the results do parallel those reported here. We believe that the recognition of order ofonset is taking place at a different higher level of perceptual processing, it is not surprising that the shape of the two functionscould be similar. Finally, the results for the fixed discrimination task are not significantly better than the roving discrimination, atleast when measured in terms of the size of the difference limen.
Insert Figures 3 and 4 about here
General DiscussionThe subjective report of our subjects are quite consistent with our own impressions about the temporal order task, and
with the measurement of other differences based upon temporal properties of stimuli. The subjects do not seem to beresponding directly to the temporal properties of the stimuli, but rather to perceptual changes in the stimuli which are correlatedwith, or a function of the temporal properties Examining our stimuli from this perspective provides some insight into the natureof the temporal order task. A brief stimulus which is less than 10 ms in duration is heard as a click. If one increases theduration of the stimulus beyond approximately 10 ms, the stimulus begins to acquire a pitch-like quality, with pitch achievedonly for longer stimuli. This perceptual phenomenon is related to the spectrum of brief signals where the effective signal bandwidth is an inverse function of duration (the sinc function). This well-known observation can be generalized to the task ofidentifying which of two stimuli had an earlier onset. With onset differences of less than a specific value, the earliest portion ofthe initial stimulus provides the subject with only broad-band information which is insufficient to identity the stimuli. Statedanother way, subjects require more than 10 to 20 ms of a signal in order to begin to perceive any pitch-like quality, and thus thetemporal onset difference must exceed this value for the subject to begin to have sufficient information to identify which of thestimulus components had an earlier onset. If the stimuli have slow rise times or are dynamically changing in frequencycomposition, it is not surprising that longer onset differences would be required for subjects to identify which of two stimuli hadan earlier onset.
When one uses highly practiced subjects with a limited set of conditions, one would expect to be able to push thethreshold toward much shorter onset differences, and we have reported such results in the past (Pastore, Harris, Kaplan, 1981).Conversely, from dealing with stimuli which vary in composition (e.g., natural speech), it should not be surprising the limits ontemporal order identification would be at a much longer onset asynchrony.

DOL for Order Onset Identification 7
In the very real sense, threshold for temporal order identif'cation could be considered a perceptual, or even cogniuve, 5limit on performance. In the temporal order identification task a subject must acquire sufficient information about the stimuluswith the earlier onset to be able to consistently apply the appropriate label to the stimulus. Although the threshold is specified
in terms of temporal duration, the real goal for the subject is the acquisition of sufficient stimulus specification to perform theidentification task. With the longer values of TOT, the limits on perception of pitch is no longer relevant. Instead, subjectsprobably are required to make a judgement based upon the temporal duration of the initial stimulus component. For theselonger stimuli, the temporai order task becomes equivalent to the temporal discrimination task studied by Zera and Green(1993).
Using this conceptualization, we can now turn to the issue of context versus trace coding, It was highly doubtful thatsubjects can store trace representation of the onset of the initial stimulus for a sufficient duration so that it may be compared
directly with the onset of the second stimulus. In addition to masking or interference from the later portion of the first stimulus,
the task of the subject for short onset differences would be equivalent to attempting to compare the trace of two clicks or tonepips. Once the duration of the onset difference is sufficient, subjects can apply a label to the stimulus in terms of the onsetdifference, and then can perform the discrimination based upon whether or not the second stimulus falls in the same perceptualcategory. Therefore, subjects really are using only context coding, and are not using trace coding in performing the
discrimination task at least for onset differences up to threshold.
BibliographyBlumstein, S.E., and Stevens, K.N. (1981). The search for invariant acoustic correlates of phonetic features. In P.D. Eimas and
J.L. Miller (Eds.), Perspectives in the Study of Speech. Hillsdale, N.J.: Erlbaum.Hillenbrand, J. (1984). Perception of sine-wave analogs of voice onset time stimuli. Journal of the Acoustical Society of
America 75, 231-240.Hirsh, I. J. (1974). Temporal order and auditory perception. In H. R. Moskowitz, B. Scharf & J. C. Stevens (Eds.). Sensation S
and measurement (pp. 251-258). Dordrecht, Holland: ReidelHirsh, I.J. (1967). Information processing in input channels for speech and language: The significance of serial order of stimuli
In Brain Mechanisms Underlying Speech and Language. (NY: Gruene & Stratton). 21-39.Hirsh, I.J., and Fraisse, P. (1964). Simultarsii* et succession de stimuli htlwrogenes. L'anrne Psychologique,_64, 1-19.
Hirsh, I.J. (1959). Auditory perception of temporal order. Journal of the Acoustical Society of America 31, 759-767.Kewley-Port, D., Watson, C.S., and Foyle, D.C. (1988). Auditory temporal acuity in relation to category boundaries: Speech and
nonspeech stimuli. Journal of the Acoustical Society of America. 83, 1133-1145. SLi, X-F., and Pastore, R.E. (1992). Evaluation of prototypes and exemplars for a phoneme place continuum. In M.E.H. Schouten
(Ed), Audition, Speech and Language, Berlin: Mouton-De Gruyter, 303-308.
Lisker, L., Liberman, A.M., Erickson, D.M., Dechovitz, D., and Mandler, R. (1977). On pushing the voice-onset-time (VOT)
boundary about. Language and Speech, 2•, 209-216.Macmillan, N.A., Braida, L.D., and Goldberg, R.F. (1987). Central and peripheral processing in the perception of speech and
nonspeech sounds. In Schouten, M.E.H. (Ed.) The Psychophysics of Speech Perception. Nijhoff: Boston, 28-45Miller, J D, Wier, CC., Pastore, R.E., Kelly, W.J., and Dooling, R.J (1976) Discrimination and labeling of noise-buzz sequences
with varying noise-lead times: An example of categorical perception. Journal of the Acoustical Society of America.
60, 410-417.
Moore, B.C.J. (1989). An Introduction to the Psyfhoiogy of Hearing. (NY: Academic Press).
Osgood, C.E. (1953), Method and Theory in Experimental Psychology. (NY: Oxford)Pastore, R.E. (1988). Burying straw men without graves: A reply to Kewley-Port, Watson, and Foyle (1988). Journal of
the Acoustical Society of America, 84, 2262-2266Pastore, RPE., Layer, J.K., Morris, C.B., and Logan, R.J. (1988). Temporal order identification for tone/noise stimuli S
with onset transitions. Perception & Psychophysics, 4_4, 257-271Pastore, R.E. (J987a). Possible acoustic bases for the perception of voicing contrasts, In M.E.H. Schouten (Ed.).
Psychophysics of Speech Perception, (Boston: Martinus Nijhoff), 188-198Pastore, R.E. (1987b). Categorical perception: Some psychophysical models. In S Hamad (Ed.). Categorical
Perception. (New York: Cambridge University Press) Chap 1.Pastore. R.E., Harris, L.B., & Layer, J.K. (1981). Temporal order identification: Some parameter dependencies. Journal of the
Acoustical Society of America, 71, 430-436.Pastore, R.E. (1981). Possible psychoacoustic factors in speech perception, In P D Eimas and J.L. Miller, (Eds.)
Perspectives in the Study of Speech, (Erlbaum, Hillsdale, N.J.), Chap 5.
Pastore, RE., Harris, L.8, and Kaplan, J.K. (1981). Temporal order identification: Some parameter dependencies.
Journal of the Acoustical Society of America, 71, 430-436Pisoni, D B. (1977). Identification and discrimination of the relative onset time of two-component tones: Implications for voicing
perception in stops. Journal of the Acoustical Society of America, 61. 1352-1361.
Rosen, S, and Howell, P (1987). Is there a natural sensitivity at 20 ms in relative tone-onset-time continua? A reanalysis ofHirsh's (1959) data. In M H.E Schouten (Ed.), Psychophysics of Speech Perception Boston: Nijhoff 199-209
Sawusch. JR (1992) Auditory metrics for phonetic recognition In M E H Schouten The Auditory Processing ofSpeech From Sounds to Words NY Mouton de Gruyter. 315-321
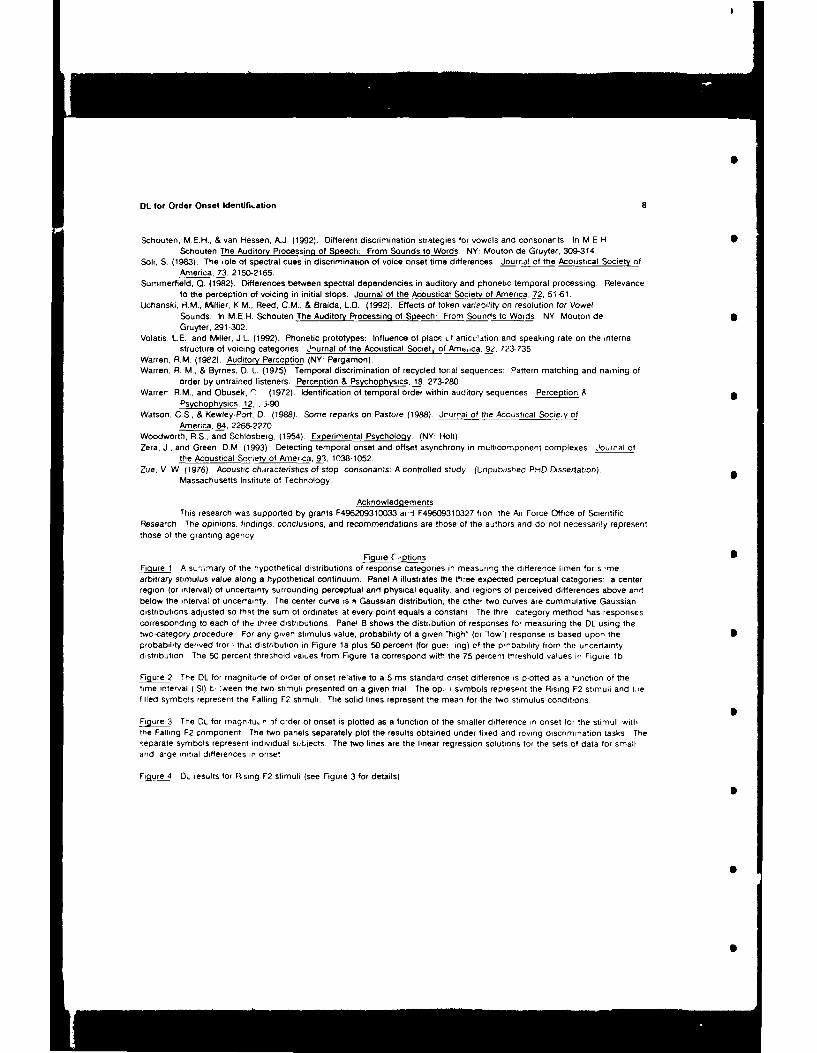
DL for Order Onset Identiflikation 8
Schouten, ME.H., & van Hessen, A.J. (1992). Different discrimination strategies for vowels and consonants In M.E HSchouten The Auditory Processing of Speech: From Sounds to Words NY: Mouton de Gruyter, 309-314.
SoIl, S. (1983). The ole of spectral cues in discrimination of voice onset time differences. Journal of the Acoustical Society ofAmerica, 73, 2150-2165.
Summerfield, 0. (1982) Differences between spectral dependencies in auditory and phonetic temporal processing: Relevanceto the perception of voicing in initial stops. Journal of the Acoustical Society of America, 72, 51-61.
Uchanski, R.M., Millier, K M., Reed, C.M., & Braida, L.O. (1992). Effects of token variebility on resolution for Vowel
Sounds. In M.E.H. Schouten The Auditory Processing of Speech- From Sounds to Words. NY Mouton deGruyter, 291-302.
Volatis. L.E., and Miller, J.L. (1992). Phonetic prototypes: Influence of place it articu'ation and speaking rate on the internalstructure of voicing categories. Jnurnal of the Acoustical Societ of Ameica, 92. 723-735
Warren, R.M. (19e2). Auditory Perception (NY: Pergamon).Warren, R. M., & Byrnes, D. L. (1975) Temporal discrimination of recycled tonal sequences: Pattern matching and naming of
order by untrained listeners. Perception & Psychophysics, 18, 273-280.
Warre¢ R.M., and Obusek, "- (1972). Identification of temporal order within auditory sequences Perception ItPsychophysics, 12, j-90.
Watson, C.S, & Kewley-Port, D. (1988). Some reparks on Pasture (1988). Journal of the Acoustical Socie.v)._fAmerica, 84. 2266-2270.
Woodworth, RS.. and Schlosberg, (1954). Experimental Psychology. (NY: Holt)Zera, J.. and Green, D.M (1993) Detecting temporal onset and offset asynchrony in multicomponent complexes Journal of
the Acoustical Society of America, 93, 1038-1052Zue, V W (1976). Acoustic characteristics of stop consonants: A controlled study (Unpublished PHD Dissertation).
Massachusetts Institute of Technology.
AcknowledgementsThis research was supported by grants F496209310033 asiI F49609310327 frorr the Air Force Office of Scientific
Research The opinions, findings, conclusions, and recommendations are those of the authors and do not necessarily represent
those of the granting agency
Figure CýptiuinsFigure A sL-n,,nary of the hypothetical distributions of response Categories in measuring the difference limen for s-me
arbitrary stimulus value along a hypothetical continuum. Panel A illustrates the three expected perceptual categories: a centerregion (or interval) of uncertainty surrounding perceptual and physical equality, and regions of perceived differences above andbelow the interval of uncerainty. The center curve is C Gaussian distribution; the other two curves are cummulative Gaussiandistributions adlusted so that the sum of ordinates at every point equals a constant The thre category method has responsescorresponding to each of the three distributions. Panel B shows the distribution of responses for measuring the DL using thetwo-category procedure For any given stimulus value, probability of a given "high" (or "low") response is based upon theprobability derived fror i that distribution in Figure la plus 50 percent (for gue. ing) of the prnbability from the uncertaintydistribution The 50 percent threshold values from Figure la correspond with the 75 percent threshold values in Figure lb
Figure 2 The DL for magnitude of order of onset relative to a 5 ms standard onset difference is plotted as a function of thelime interval (ISI) t- :ween the two stimuli presented on a given trial The op, i symbols represent the Rising F2 stimuli and tiefilled symbols represent the Falling F2 stimuli. The solid lines represent the mean for the two stimulus conditions
Figure The DL for msagntu, •f order of onset is plotted as a function of the smaller difference in onset for the stimuli with
the Falling F2 component The two panels separately plot the results obtained under fixed and roving discrimi-,ation tasks Theseparate symbols represent individual suLects. The two lines are the linear regression solutions for the sets of data for small
and large initial differences in onset
Figure DL results for Rising F2 stimuli (see Figure 3 for details)
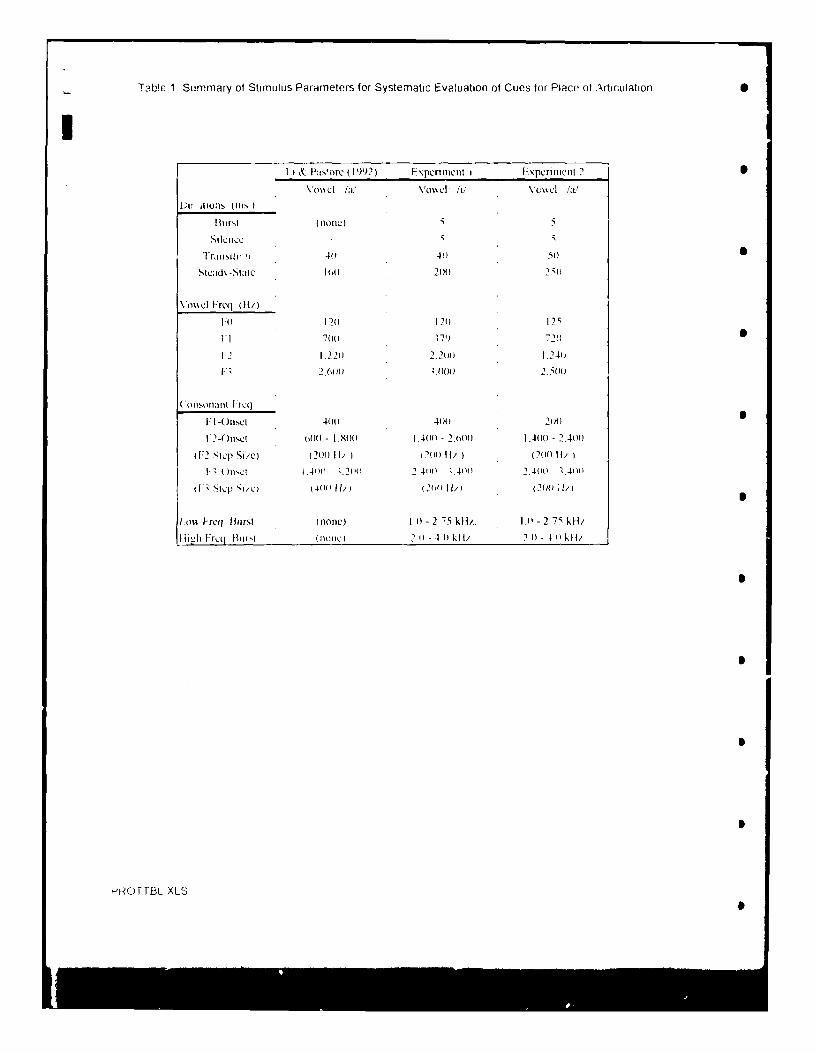
Table 1 Summary of Stimulus Parameters for Systematic Evaluation of Cues for Place of Articulation S
I[,I & Pas'orc (1992) F\pcruricnl I Fxpcrinicnt 2
V'ox\cl /a.,' \'o\ l /iil \'cci /a[;U ,ilOus (Ilip,
Buirst (noti) +
Trl...su,,,, 440 40 51) S
Stc:ad\ -Stltc 1601) 20 0I) 2 5i
\'w\cl Frcq (It/)
I.1 1201 120 12SF' I 7(ii ]79 72)) 0
1"2 I 22o 2.200 1.241
1:i 2is60.)i 2, 5 0u
-1 -()1tIsc 401) 400 20011
1"2-O)nsCt 600 - I.X•) 1.400 - 2.(00i 1.400 - 2.400
IF-' SIcp Sie)( (211 H/ 1 02 t1/) (2111 I/ t
I:" ()p1ct 1.4111w .2lll 241001 -400(l 2.400 141101
If". (iI ,/d 400 If/) (2-loo I I/ (20o ; I/)
1,o'. Freq Birsl (none) I1 - 2 75 kH/. l.p - 2 75 kHi
i,,l l:rctq mim ,tI (llionc) 2 1 - .1 0 kil1 2 0 - II k0 1/
f'iO -IBL XLS
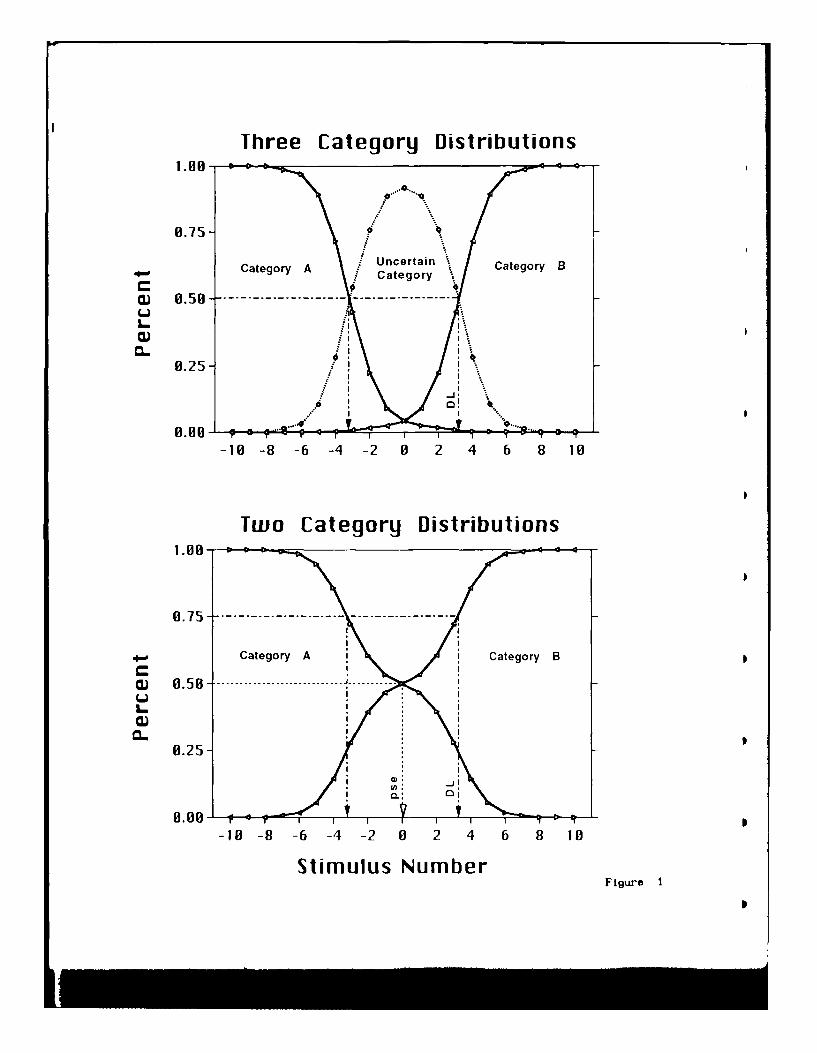
Three Category Distributions1.88- • • •.o "--•
0.75- •"
Uncertain -Category A .Cteor a
0 8.58 .. ..............
1.00
0.25-
8.88 "- - - - r """
-18 -8 -6 -4 -2 0 2 4 6 8 18
Two Category Distributions
,* Category A I Category B
W 8.58 ....................... J..
L I
8.25
I *.,
8.08-p-10 -8 -6 -4 -2 0 2 4 6 8 10
Stimulus NumberFigure
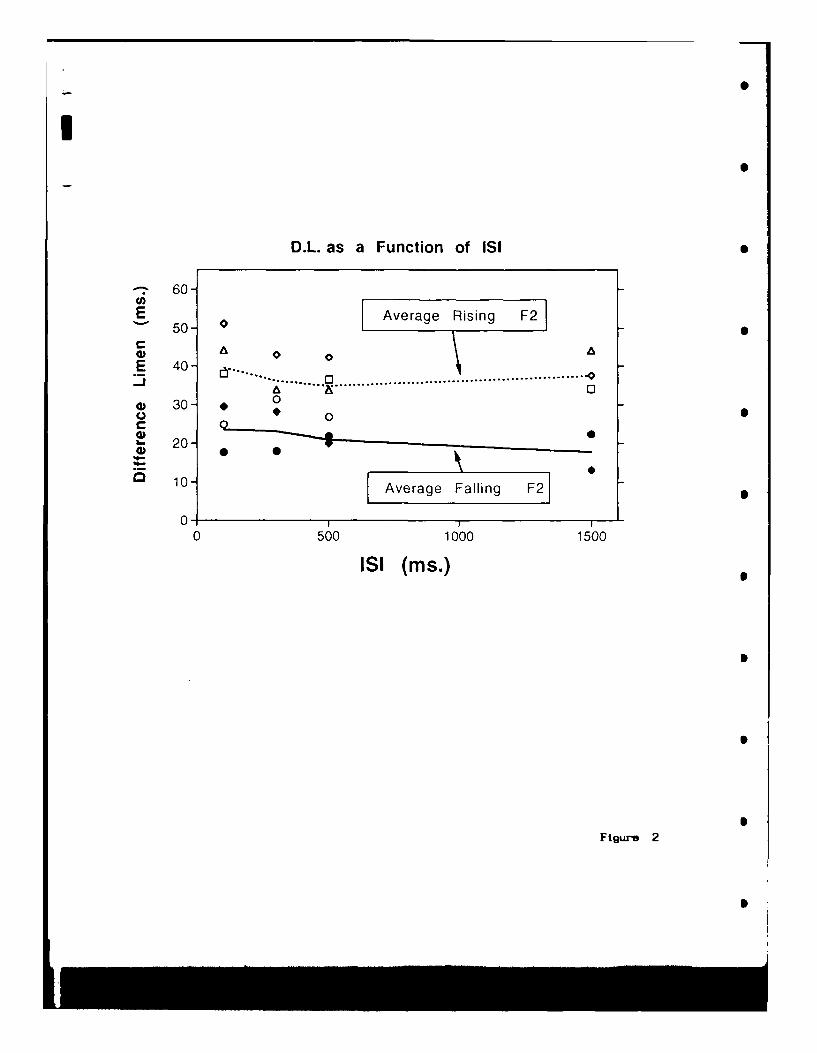
!S
D.L. as a Function of ISI
-- 60-
E 5 Average Rising F2
, 0 ........................... ......................................... 0
0 30- 0
20-
S10- Average Falling F2
0-0 500 1000 1500
ISI (Ms.)
Figure 2
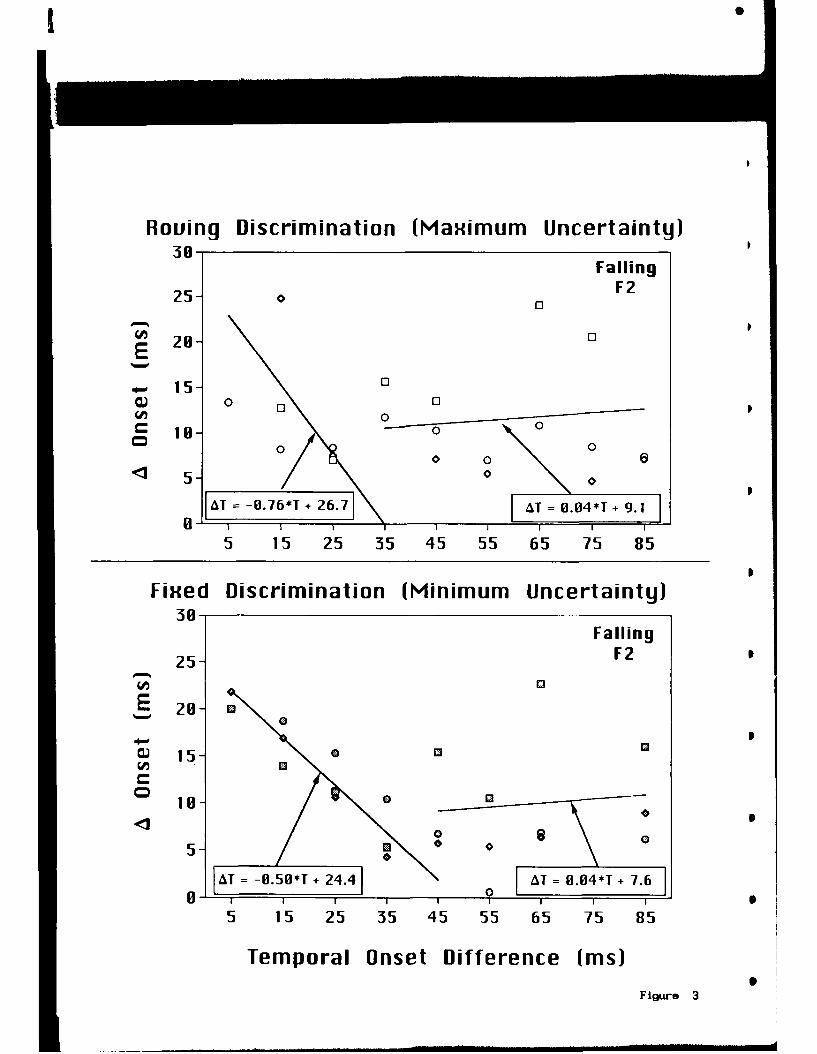
Roving Discrimination (Maximum Uncertainty)30-
FallingF225- 0 []
E 20
4- 15- 00 0 0
0
o 0
00 0 0
I 5- 00
0-Ik3F,76*i6 AT 0 .04T(1 1 E
5 15 25 35 45 55 65 75 85
Fixed Discrimination (Minimum Uncertainty)30-
Falling
25- F2
E 20-a0
a) 13
U, a00
TT = F.5* 2. T = .04*T + 7.6]
5 15 25 35 45 55 65 75 85
Temporal Onset Difference (ms)
F igure 3
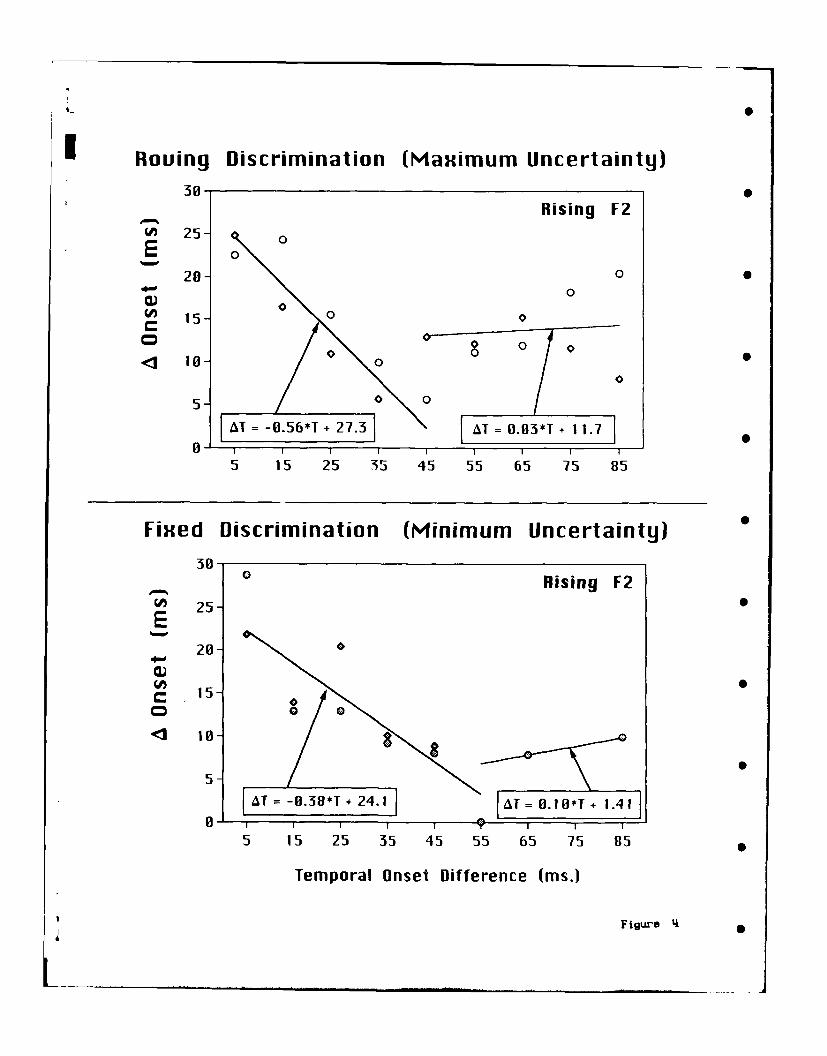
U Roving Discrimination (Maximum Uncertainty)
380Rising F2
5 250
E 028o
0 0
4 15 0 0
0 8 0.<1 18- 0
0
51 0 7F
AT -0.56*T - 27.3 " = o"83*T + 11.78 - i I I I I I I I
5 15 25 35 45 55 65 75 85
Fixed Discrimination (Minimum Uncertainty)
30-0 Rising F2
S25 -E
280U,°
• 15-0 0
~l 10-
5-AT =-0.38*T + 24.1 1T = 01T +1.41
5 15 25 35 45 55 65 75 85
Temporal Onset Difference (ins.)
Figure4d,

I ,ploralli ni of tIhe phonetii sirl'liir iof( ties for place of ari(lilIiation
Richard Pastore. Xlao',feng I I. Jennifer (hio, lkarhara Acker. and Shannon Iarrington
Abstratl
A nlutii-task, niilti-diniensional approach was used to evaluate the nature of perceptual space and the relative impiortance (ifauitiory cues for the perception of initial positiin voiced stop consonant% of English, For each of several different vowel contexts. stimnul
varying systematically in F2- and 1|3-onset time and the nature of an initial release burst are examined from a ninitier of differentperslpclives. For each vowel, a within subject design is used, evaluating the stimuli in terms of classification, speeded classification.
gootiness for each of the possible phoneme categories, and similarity scaling. The scaling results are then sumutted to a multi-dumensionat
scaling analysis. Each of the tasks and stimulus parameters have been the focus oa prior investigations ot phoneme categories, but have
never been combined to provide a complex. systematic picture of perceptual space to provide converging evidence for the nature of cites
for phoneme categories.Eind of Abstract
Running Itading: Phonctic Structure lxploratuon
%list resmarch m-'nstiginihg tire cý,c for ;pecif l pl nencre :!lcogrie, •uch a, place of articiulatuoni. has tended to focas on the
location of category x)oundaries defined along a single physical continuum, largely ignoring the nature, quality, and extent of perception
within phonetic categories. More recently. some studies sometimes have been expanded to demonstrate "trading relations," which are really
only the simple interaction of a limited range of values for two different physical continuina. with the critical dependent variaule again
heing the location of the category otmndary dlefined along one of the two dimensions.
Although this research is relatively simple to conduct, the results of such limited focLus research cannot lie expected to significantly advance
our knowledge aliuut the critical cues which define the perception of speech categories.Among the more promising alternative approaches to investigating the nature of phonetic perceptual space is the
mditidlimensional scaling of similarity ratings of stimuli (e.g.. Poils. van der Kemp. & Plonip. 1969; Carroll & Chang. 1970): Soi., 1989.: Bladen
& Lindblom. 1981). Ilowever. even multidimensional sealing studies have tended to use relatively limited sets of stimulus dimensions.
In recent years there also has been a growing interest in the posiible role of prototypes or exemplars in defining phonetic categories (e.g..Satmuel. 1982; Kihl. 199!: Volatis & Miller. 1992; Sussman. 1993). These prototype-oriented studies have begun to use several different
measures (e g.. guxxdness rating. discrimination. or selective adaptation) to provide the beginnings of an evaluation iof the perccptualstructure of stimuli falling within and across phonetic categories. Despite this trend, very few stities have evaluated perception as a
fin(t ion of a numbler of different siimiilus dimensions,['he related studies iy Htoffman (1958) and Harris. I Hoffman, I)elattre. and Cooper (1958) arc an excellent exanmple of the
evaluation of the perception of place of articulation as a function of several different physical properties. specifically i-2-onset frequuncy.
13-onset frequency, and initial onset bursts. These early studies provide an excellent delineation of the limits (lwiuundaries) of each
perceptual category as a function of the three important stimulus variables. Somewhat more recently, Stevens and Itloomsteun (1978)cvaluatcd similar variailes in the perception of place of articulation, defining the variables more precisely and in terms of more dynamic
pr,"pertics[he current research uses a numlhur of different types of measures anti techniques to provide a mtre detailed specifiCation of
the nature of phoneme perceptual space for categories of initial position voiced stop consonants varying in place of articilation. All ofthe various measures utilized in this research have been employed separately in past investigations of phonenie perception, but never incombtinatuon. and never have wecn used to provide converging evidence for strong conclusions alionit phoneme perceptton. I urthcrniore.
all the basic physical properties of the stimuli also have Ib:en subject to extensive investigation. but not at the level ote detail of the current
research.The current research evaluates the natuire of the perceptual space for the phoneme categories definced by //. /di/. ani /1g,
I he stimuli vary in 12- and Fl3--onset frequency, the presence and nature of an initial burst. and the specification of the following vowel
t hese varialucs were identified as important cues tn early research by [)elattre. ct aL (1955). and by ttoffnian (1958: 1loffman. ct al
I9S) More recent important investigations Include those by Stevens and hlluinstein (1978). Kewlcy-Port (1982. 1983). "searey and
Shammass ((1987) Stevens ( 1992). andt Sussman. Mc(affrey, & Matthews ( 1 i)) 1 I In the current study. th, stimuli first are evaluated in
terms ol specded classification, thus allowing specification of the locIation and extent of each phonetic category •xundar , as well asobtai;iunung reaction time measures for applying labels. I hese results also allow for direct cuomparisons oif the current finding with the mni,
puthlishcd stiu(lies focuising on category iouindary loxatlion along one of the various dimensions investigated rI he complete set of stimulithen are evaluated in terms of the relative gixxdness of the labcls "b." "d," and "g." I'snally. a subset of stimuli ssubjected to the ratingof similarity hctween all poissible pairings of stimuli, thus allowing the use of multidimensional scaling techniques to evaluate the underlying
dlimensiinality iof perception. 'The correspondence, or consistency. among the various measures provides an indication of the degree to
whit-h the various measures are indicating similar, or different. underlying processes Fiurthermore, the nature and shape of the dclnedperceptual space provide strong indication not only of the critical underlying stimulus dimensions anit the symmetry of the pecrceptual
decision mechanism. hut also the relavence of prototype vermsus exemplar (or alternative) moxdels of caieguuri/ation
I arier Rcscar(hf i and iastore (1992) prcecnl the int al work in this research prolc(I I his silitly svstermaticalls vaerid the I 2- and I 1 i-uounst
tr'p ucnicv for a set of synthetic ( V svllailes Iwithoiti initial hursti hiased nuon the vowel /ai/ Ih slie ttulinur pti.m;nctcr fifr this stuil,flonii t ilh tlhose trum I aperitntcni I and 2) are suinitari/cul in lable I Ihu et stwi uuse(, an i pcn-etidcil liblihng task. and a slicidud
hlulealt(solin thsk on the |lll sei iif •stntiihi pils a g•idxlncs ra•llite task. indil at siilaris raling task on a slubetl i tie shinilih 1il0 Irsi ptoisilc
,i -,srill p, rsx.isit, I the pcr .'cpual spaui, tr thuN plhonicli i,th•ig •.n s /1, . j III (u• pI his isIp ....linc ill• I t -h , , s Ii , Ic
I
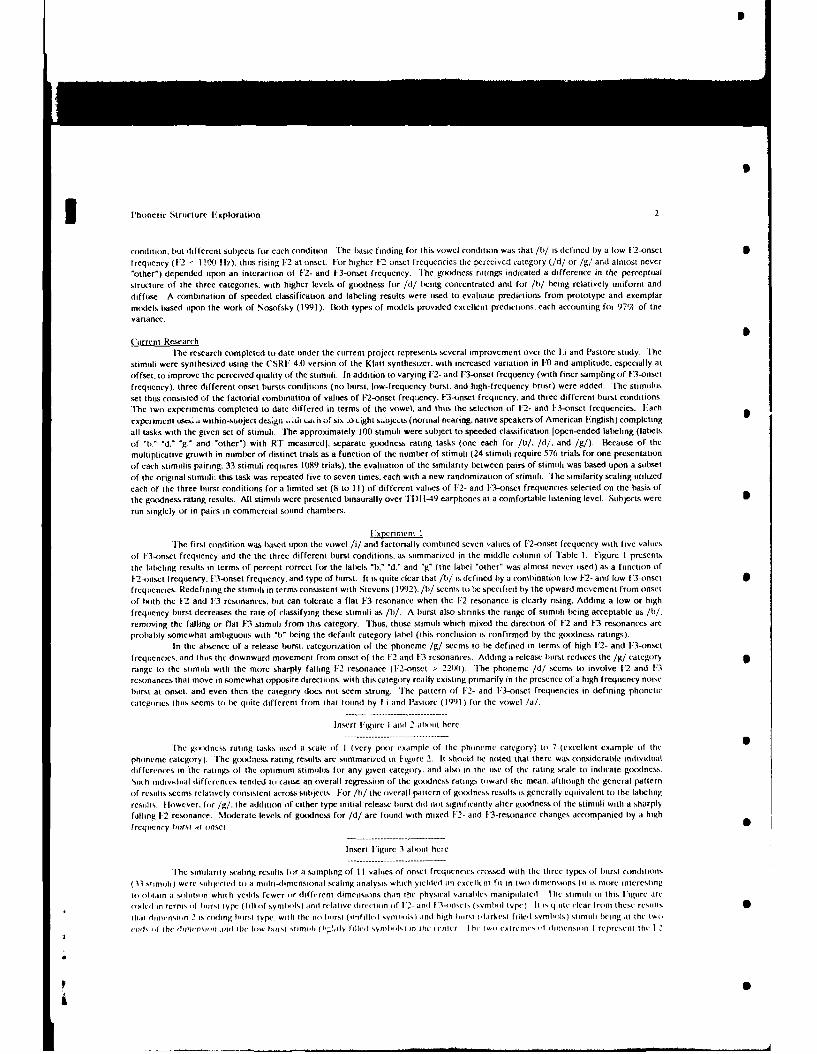
P Phonetic Structure Elixploration 2
condition, but diflerent subjects for each condition. [he basic finding for this vowel condition was that /b/ is defined by a low 12-onsctifrequency (F2 1 1100 IHz); thus rising 1P2 at onset. For higher 1'2-onsct frequencies the perceived category (/d/ or /g/ and almost nevcr
"other*) depended upon an interaction of F2- and 1.3-onset frequency. [he goiodncss ratings indicated a difference in the perceptualstructure of the three categories, with higher levels of goodness for /d/ bieing concentrated and for /b/ being relatively uniform anddiffuse. A combination of speeded classification and labeling results were used to evaluate predictions from prototype and exemplarmodels based upon the work of Nosofsky (1991). Both types of models provided excellent predictions, each accounting for 97% of thevariance.
Current Research'[he research completed to date under the current project represents several improvement over the Li and Pastore study. 'The
stimuli were synthesized using the CSRI 4.0 version of the Klatt synthesiier. with increased variation in 10 and amplitude, especially atoffset, to improve the perceived quality of the stimuli. In addition to varying F2- and F3-onset frequency (with finer sampling of "3-onset
frequency), three different onset bursts conditions (no burst, low-frequency burst, and high-frequency brust) were added. The stimulusset thus consisted of the factorial combination of values of P2-onset frequency, 1'3-.onset frequency, and three different burst conditions.Mhe two experiments completed to date differed in terms of the vowel, and thus the selection of F2- and F3-onset frequencies. Each
experiment useo..a within-subject de.guu ..i.h eu ih of six :o Light sbbjeuts (noruial hearing, native speakers of American English) completingall tasks with the given set of stimuli, The approximately 100 stimuli were subject to speeded classification [open-ended labeling (labelsof "b." "d." "g." and "other") with RT measuredj, separate goodness rating tasks (one each for /b/. /d/. and /g/). Because of themultiplicative growth in number of distinct trials as a function of the number of stimuli (24 stimuli require 576 trials for one presentationof each stimulis pairing; 33 stimuli requires 1089 trials), the evaluation of the similarity between pairs of stimuli was based upon a subsetof the original stimuli: this task was repeated five to seven times, each with a new randomization of stimuli. The similarity sealing utilizedeach of the three burst conditions for a limited set (8 to 11 ) of different values of 12- and 13-onset frequencies selected on the basis ofthe goodness rating results. All stimuli were presented binaurally over TYDI1-49 earphones at a comfortable listening level. Subjects wererun singlely or in pairs in commercial sound chambers.
Ilnocrimcnt IThe first condition was based upon the vowel /i/ and factonally combined seven values of P`2-nset frequency with five values
of F34nmsct frequency and the the three different burst conditions, as summarized in the middle colimn of Table I. Figure 1 presentsthe labeling results in terms of percent correct for the labels "b," "d. and "g' (the label 'other" was almost never used) as a function of12-onset frequency. 13-onset frequency, and type of burst. It is quite clear that /b/ is defined by a combination low 1f2- and low P.3-onset
frequencies. Redefining the stimuli in terms consistent with Stevens (1992). /b/ seems toi be specified by the upward movement from onsetof hoth the F2 and 13 resonances, but can tolerate a flat "3 resonance when the 12 resonance is clearly rising. Addinp a low or highfrequency burst decreases the rate of classifying these stimuli as /h/. A burst also shrinks the range of stimuli Ibeing acceptable as /b/.removing the falling or flat 1.3 stimuli from this category. Thus, those stimuli which mixed the direction of F2 and 1:3 resonances areprobably somewhat ambiguous with "b" being the default category label (this conclusion is confirmed by the goxodness ratings).
In the albsence of a release burst, categorization of the phoneme /g/ seems to ibe defined in terms of high P2- and F3-onsetfrequencies. and thus the downward movement from onset of the 12 and 1-3 resonances. Adding a release burst reduces the /g/ categoryrange to the stimuli with the more sharply falling 1F2 resonance (12-onset > 22t01t). [he phoneme /d/ seems to involve [2 and F'3resonances that move in somewhat opposite directions, with this category really existing primarily in the presence of a high frequency noiseburst at onset, and even then the category does not seem strong. The pattern of 12- and 1.3-onset frequencies in defining phoneticcategiries thus seems to be quite different from that found by Li and Pastore (1991) for the vowel /a/.
Insert J-igure I and 2 alhuit here
The goxulncss rating tasks used a scale of I (very prx)r example of the phoncmc category) to 7 (cxcellent example of the
phoneme category). Ihe gxx~nes&s rating results are summarized in Figure 2. It shoiiuld Ie noted that there was considerable individualdifferences in 'the ratings of the optimum stimulus for any given category. and also in the use of the rating scale to indicate goixlness.Suich individual iliffcrcntes tended to cause an overall regression of the goodness ratings toward the mean. although the general patternof remuhls seems relatively consistent across stlujects. For /b/ the overall pattern (if godlness results is generally equivalent to the labeling
results. Ilouwever. for /g/. the addition of either type initial release burst did not significantly alter goxlness of the stimuli with a sharply
falling 1-2 resonance. Moderate levels of goxolness for /d/ are found with mixed 12- and 13-resonance changes accompanied by a highfrequency bturst at onsel
Insert F"igure 3 alioui here
[he similarity scaling results for a sampling of I I values of onset frequencies crossed with the three types of burst conditions(31 sImilih) were Siiljecied iii a multi-dimensional scaling analysis which yielded an excellent fit in two ihimernsiins (it is more interesting
ti oitlain a sohiitin which yeilds fewer oir diffe rent dimensiins than the physcal variahies manipulated
[hc simiuli in this IFigurc arc
couled in terms ,[ hbur, type (fill of synlluls) and relative direcuitin f 12- and I.'-onscis (•snultxl vp' h It is quuit' -lear fromn thcsc resuihs
ihait dtniunsiun 2 i, tooing liirsl ivype. with the no hburst (infullhlcd s.mhoIst adn high luri fdarlkcst filled svmluuls) stimuhli iing at the Isso
wkU'I ihi dtuimuns m ri thu ' l tu t lo nc-i su11m lism ll) (i.'l fl l et s tnl vJ I.4 ) in i)te u-niter I hi u ci uxtrcrnu, I tinicnio I rcprcscnt Inc I 2
p S,i
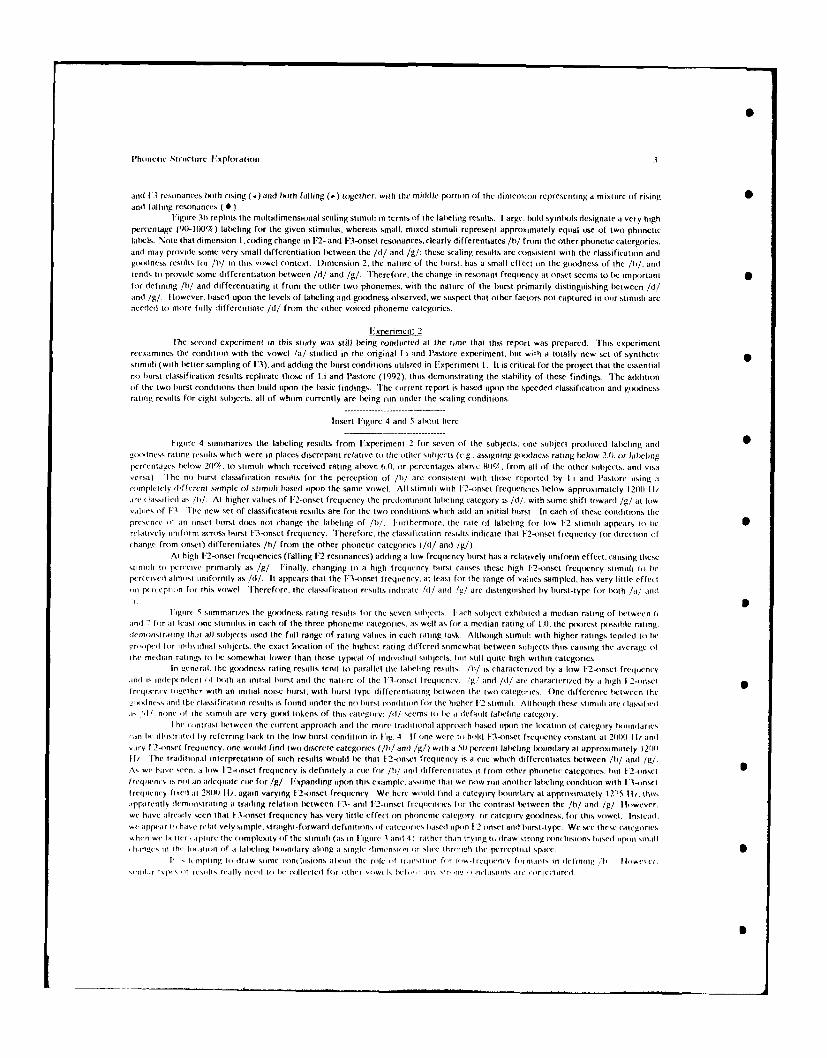
Phonetic Structure Ixplotation 3
and V-3 resonances taitli rising (4) and Itath falling (.) together, tvithI the middlle portion of the dimenstion representing a mixti re oif risinganil falling resonances ( 4 .
Figuire 31t replots the multidimensional scaling stimuli in terms oif the labeling results. I arge. Itild symbols designate a very highpercentage (90-100%) labeling for the given stimuluts, whereas small, mined stimuli represent approximately equal use of two phoneticlabels. Note that dimension 1, eixling change in [2- and [3-onset resonances, clearly differentiates /b/ fronm the other phonetic catergories.and may provide some very small differentiation between the /d/ and /g/: these sealing resuilts ace ronsistent with the classification andgoxuiness results for /I,/ in this vowel cointext. D~imension 2. thc natiire of the burst. has a small effect uin the goodness of thc /hi/. unittendls tot priovide some differentiatiiin between /d/ and /g/. 'herefore, the change in resonant frequiency at oinset seems to bie importantfor dtefining /b/ antI differentiating it froim the tither two phonemes. with the nature of the burst primarily distinguishing buetween /dI/and /g/. I lowever. biasedl upon the levels of labeling and goodness obiserved. we suspect that other factors not captured in iiiir siiniiili arcneedeid to inure fully lifferentiate /d/ fruim the other voiiced phoineme categoiries.
Innperimcnt 2The second experiment in this study was still becing conducted at the time thai this report was prepareid. [his experiment
reexamine,, the ronditiiin with the voiwel /a/ stiudied in the oiriginal I i aind Piastore experiment. but with a toitally new set oif syntheticstimuli (with bietter sampling oif 11). and adding the burst coinditioins iitilized in [soperiment 1. It is critical for the project that the essentialno buirst classificatioin results replicate thoise of Li and Pastore (1992). thuis demonstrating the stabiility oif these findings. The adiliition(of the twoi hurst conditions then build upcon the biasic findings. The cuirrent report is biased uipon the speeded classification antI goodnessrating results for eight siubijects. all of whom currently are bteing run tinder the scaling conditions.
Insert 1-ugtire 4 antI S altotut here
1-ugire 4 siimmari/es the labeling results from Experiment 2 for seven of the subject: one suibject prodiucetd laluelung antIuitivlness rating resuilts which were in places discrepant relative toi the otihler stuidqcts (e~g.. assigning gixxtness rating beclow 2.0. or labelingpecrcentages tuclow 201%. to stimuli which received rating above 6ill, tie percentages alsoisc 90c/, friim all of the other sujbjects, and visatversa). I[he nit husrst classification results for the perceptioin iif /hi/ are ciinsistent with thuise reported biy Vi aind P'astore Iusing atcompletelY fiffi-rent sample iif stimuli itaseit upon the same voiwel- All stimuit with 12-onset frequencies beclow apprioximately 120(1 H/~.ire ladssficl Tdas /h/. At higher salutes tif 1-2-onset frequnency the preidominant taltelng categotry is /ut/. with sonic shift toiwardt /g/ at lowethijcs if 1:3 [-he new set tif classificatioin resuilts are for the twii contditions which add an initial hutrst. In each tif these cuinditions theprcscncc it an (Inset lhurst doces not change the lalielung oif /bi/. l-uurthermore. the rate tof labeling fur low [2 stimuli appears it, liercl~ituvely titiftfrit across huirst 1-3-onset frequency. Therefore, the classification results intdicate that 1-2-onset frequency (tic directiton ofthange frttm unset) differentiates /it/ frtom the other phonetic categouries (/(i/ antI /g/).
At high [-2-onset frequiencies (falling F-2 resonances) adlding a loiw frequnency hutrst has a relatively untiform effect. catising thesestinitiltii peoo wcive primarily as /g/, finally, changing tit a high freqliency burst causes these high [2-onset frequency stimuli tti 1wpcri-cisci alm-ii iiniftormly as /it/. It appears that the F1-3onset frequency, at least fur the range of values sampled, has very little effectot prcet cftion fu~r this votwel. I'herefuire. the elassi ficatiitn results i ndicate /(i/ aiti /g/ arc distinguished lyiv hurst-type fur boith /a/' anul
1 9I igitre: 5 siummarizes the gixidness rating results fur the seven sitlijects. I- ach stubject exhibtitedt a median rating tof bietween ft
icnl -, for at least tine stimulus, in each tif the three phioneme categotries; as well as fur a meditan ratingif11.tepost poshlhaig
tltnvontstrating that all subjects used the full range tif rating values in each rating task. Although stimuitt with higher ratings tendeid to liesmritipel (tric niivititual stilijeets. the enact location of the highest rating differedl soumewhat between stitijects thus. caus~ing the average (11the meidian ratings toi 1w somewhat ltiwer than those, typical oif indivttltil suibjects. Ititi stitll quiae high within categiories.
In t-wneral. the goidxness rating resuiths tendt to parallel the lahieling resniti /hi/ is characteci/eti by a loiw [:2-onset frequecncyanil is incl~epe-ni (ot f Is toh an initttalI hurst unit t hr nattier tif the I 3-unset frcq itenes 'g/ intl /it/ are character~iic b ity high I 2-tinsltreiltent-v ii gell her with an initiaul nioise hutrst. with biurst type idifferentitati ng huetween the twit categotries. One differentce ibetween t he
til nrs intl the classificuttion results is fouind titder the nit hurst coindittion for the highcr F12 stirmuli. Althiough these sti mitl are classifiettis1 'it/ nirl tueit the %t imitli are very goodt tokens iif this categoriy: /it/ seems to f lieate dfauilt lalteling categotry.
I lie-itint cast twt wren the ciurrent approtach anti the nurtur traditio tnal approtach biaseud uipon the loicatuion oif categoury 1istiunuaruesmii lie titt stirmiei by referring back iio the loiw burst c-onuditiin in lug. 4, If tine were tii hiolut 1-3-onset frequency coinstant at 211011t If/ antI
sirs I 2-onset freuuiency. tine woiutld finud twit discrete categoierus f/bt/ anti ,'gl) with a 50t perc-nt labeling ixuunuflary at approximately 12i0tiIf/ ['he tradititounal interpretation uif such results would bec that 1-2-onset frequtency is a cue which diffecrentiates% between /ib/ and /g/-As we hauve seen. a loiw I 2-inset frequienty is dlefinitely it ctic ftc /ht/ anti dittfferentiates it frtim tither phounetic categories, bit I-2-onsetI rct~tu-ntv Is, riii an adeqiluate cix- fur /g/. Fixpandung utripn this example. assumer that wie niw ruin anoither labueling condititun with [ 3-i nsetI rcquwi~iy fiteil it( 2801)1[/II. again varying [-2-onset frequiiemcy. We here witulid fundt a categoury tiouundary at approxnimately 1275 It/. fbiusuipparetitly tiemionst rating a trailing relattion bietween F-3- anti I 2-tinset frecqutencies ftr the c-intrast between the /b/! anti /g/ HoIIwever.we haivc aircativ seen that I- 1-onset frequecncy has very little effeut tin photnenme categotry. our category goodness, fur this voiwel. Insteadt.,e apricar ii his-c relativity simple,- siraighi-furwirul ilefirnittions i f ategwic tresI sei tupo n 12 unsert ant i hrst-type We see these categotriesa it-n a-i lucticr 1ifiptiure the coimplexity iof the slunitut (ats in Fugitre Iantl 1) r~ithu-rthin trying i, uraiw strutuig etuni-luistins Isisit lpiun stiu~lllinu i i li iiý%II h ituiuutn of at l~ilwlung ixuindary aloing a single dinicninsu orti sluice ttruitith thec purcepitual spice
It c Is mii-uing to outruw somne u-unt-liusuuns attuiuu thu role- if iranumnsii lot ia -fruiut-cnis- ft it uuts in (itlntim,' /Ii I Fia-u" I
simltutr Toolvs-I ri-stilts nitty icdtt-iti hei iuledutei ,Iuiltior vt-i-Is loci,,u,- -ilt %IT i--i tuf- Itstit s ToI%'1 art-u I~nci-tu
3 Phonetic Sitrictiirc lxpioralion 4
Other I iomrimrnlsUpon completion of the similarity scaling conifjtionl for F 'xperiment 2 we will ( I Icollect similar xdata for the /nt/ vowel ion text
and re-examine the context of the /t/ vowel us:ing a new set of stimuli to attempt to obtain better exemplar% of /dl/ At that point we
will have sampledl vowels from three majtor front-back locations. At that time we will prepare a major manuscript describing the results
obtained to dlate. In addition, we will explore the perceptual space for these phonetic contrasts (/b/. /dt/, antI /g/) in the context of other
vowels, and for other poussibile cutes ftor phoneme contrast.
lBibhlouearhy
Ilet, .(I .. Miirrtingietto. B., and Robson, H. (1981). Perceptual equivalence of acouistic cutes in speech andl nonspeech perception.
Percention and Psychophysics. 29). 191-211.-Illation. H.A., anti Lindbilom. Rt (1981). Modeling the juidgement of vowel quality tlifferences. Journal of the Acoustical Society of
America. 69. 1414-1422.
Bliimsirin. S.1 .. Isaacs. FK., anil \ertiis. 1. (1982). The role of the gross spectral shape as a perceptual ctic to place if articiilatiiux in initial
stop consonants. Journal of the Acoustical Society of America, 72. 43-W0
Bliimstein. ST1. anil Stevens. K.N. (1919). Acoustic invariance in speech production: IEvidlencc from measurements of the spectral
characteristics of stop consonants. Journal of the Acoustical Society of America. 66. l1001-1i017.
Carroill. 4.1).. and (hang.J.1.. 119701). Analysis uuf individlual differences in miiltitlimensionat scaling via an N-way generalizatio~n (if "Fckart-
Yoiung" tccompcisituon. l'sychometrika, 35. 283-319.
lDelattre. P.C.. I iberman. A.M., and Coouper. F'. S. (1955). Actunstic loci and transitional cites for consonants. Journal of the Acoustical
Society of America, 27, 769-773.
H arris. K.S.. IHouffman. IuS.. Iliberman. A.M.. lDelattre, P.C.. anti Cooiper. I-S. (1958). Effect of third-formant transitioins on the
perception oif the voiuccd stop consonants. Journal of the Acoustical Society of America. .30. 122-126.
Iluiffman. I1.8. (195S). Study ofstume cues in the perception of the voticedt stop consonants. Journal oif the Acotistical Society ouf America.
311, 1i135-11i4l1.
Kcwley-I'iri. 1). 119821. \leasirenxent oif forniant transitions in natural ly produiedu stoip consi xant-vuiwcl syl labiles. loinrnal of the
Aciiusltial Soucit of America. 72. 379-389.Iscwley-IS ci. 1) (1983). imie-varying featuires as coirrelates iif place of articiilatiiin in stop cuunsonani, .lotucnal oif the Acoustical S-ociety'
of America. 73.3122-13S,Kiihi. 11 K 11991 ). II liman adil ts and h imian infants show a "percepitial magnet effect" for the protoitvpes of speechcteris miunkcvs
(lo not. Perce pttion dnit Psycltxiruhsic . 50. 93-1017.1 .X..l ,. and l'asiurc. HI. 1 1992)1 I aitiatiiin of prototypes anil exemplars% for a phoneme )ildc c ininitiiiiii In %I I I I
Schoiuten (lit). Auixtioin, Speech and lAnguave. Ilkerin: Mouiton-IDe (iriyter. 30)3-30S8
ScareY. I A\l . andl Shammass. S I , ( 1987)1 Eu rmant transitions as partly distinctive invariant properties iii the ident ificaiioin oif iccdi
stops Can. Acoi si . I5)S). 17-24.
\i siufskv. HR\ NIt (V0,u, Attenition. similarity, anit the ileni ifical iin-categoirization relatioinshi p. Journal of I stuerimental PýVcholoiuuv
\i siutkY. H.AI (19911. I eits of) an exemplar modtel for relating percept ial classif)icatioin and) recognitio, n memoniry. Journcal of)
1 xreriuxental l'sychuitLvn I liiian P'erception and P'erfocnmance. 17, 3-27
I' I. I I. W . van dler Kemp. 1 .1. Fh . and l'lomp. H. (1969). perceptual and physical space iof vo wel s-i ds, Jouirnal of the Aciuistuu a)
Sotciy of Anmerica. 40. 45S-4(,7.
Rcpp. 11 If 19)82). l'hineti tradling relations andl context effects: New experime ntal eviutence: lo it speech mod xe utf
pe-rceptionx Psychiuloii~al Builletin, 92. S1-I 10.
Hepp. It. [I (I 93). I railing, Helat ions Amo ng Acioiist ic Cuies in Speech P'erceptiiin are I argcly a resiult I if oneti iIc I aiegi ri/atiiin SpeechI
(rnnuiniciiinaion. 2, .341 -102Samiuel. A G~. ( 19S2) Morehneti pci i ut pes. P'erceptioin and Psychophysics. .31, 307-1314
Sol. 11983) - I he rile of spex teal ucur in idiscrimination oxf voice onset lime udlffrences. ii nirnal it lie Auuvi'istuui Soiicety tif Aierica.
73. 2)50- 2105
Stevens. K \ . and IBimnsiein SI I 1178). Invariant cies fur place of articuilaliiin in) ,lip consounani, .Liiinal I) the Auiiisiuial Stuicts
tif America. 64, 1 ISS-I 308
Stevens, K N.. awld Bltiistei n S.1 11981 ) [ he search for invariant acouistic ci rrelaicsi f phi unctic fetrtices. In V' 1) 1 mdv unit J L. Miller
(I (is.)1. Perspectives ion the Study of Speech. Iliii lsdale. NJ: FI rliatimn.
Stevens (1992)i) Uoioii i tiiim at (i irnel I I nisersity. March 1)92Stiiiilderi-Kennitcly. MI.. l~ironian. A.\l.. llarris. K.S.. anti (tuxper. I.S. (19710). Moitoir theory (it sicilth pciieptiiii A reply toi I ines
critical rtview. l'sychi.>uuical Review, 77. 234-249.
Siissman. If \1 . \lcC iffrey. 11 A . anil \altihews, S.A. (1991). An investigation oif linus equiatuionsj is a uuitce (it relationail invariance for
stiop Plait: idrguiri/at ion Jouiirnal of the Acoiustical Societey tf America. 90.) 1109-132 S5iissman. .1 I 1191))) A preliminirv tx-si of priotiiype theorey for a ItiaIl-t-IdaI (iininiuuit juuicniI iil the Atouuutital Sotciy if Anmer(a.
93. 2 192 1 .81 ri( cii)t. ulaiis. I I inid Mullti-c 1.1 19921)1 l')oiiuuictiuuuollypecs: Influe-nit tif plait-eu o cif ri-Lmtii aind spcikim-, rilm -iih, uiicrimnl itrwitiu,
,. ii) viuiiigu~i~ici .Imiiiu ol the A~oiistiiaI Socetey if America. 92 - 3
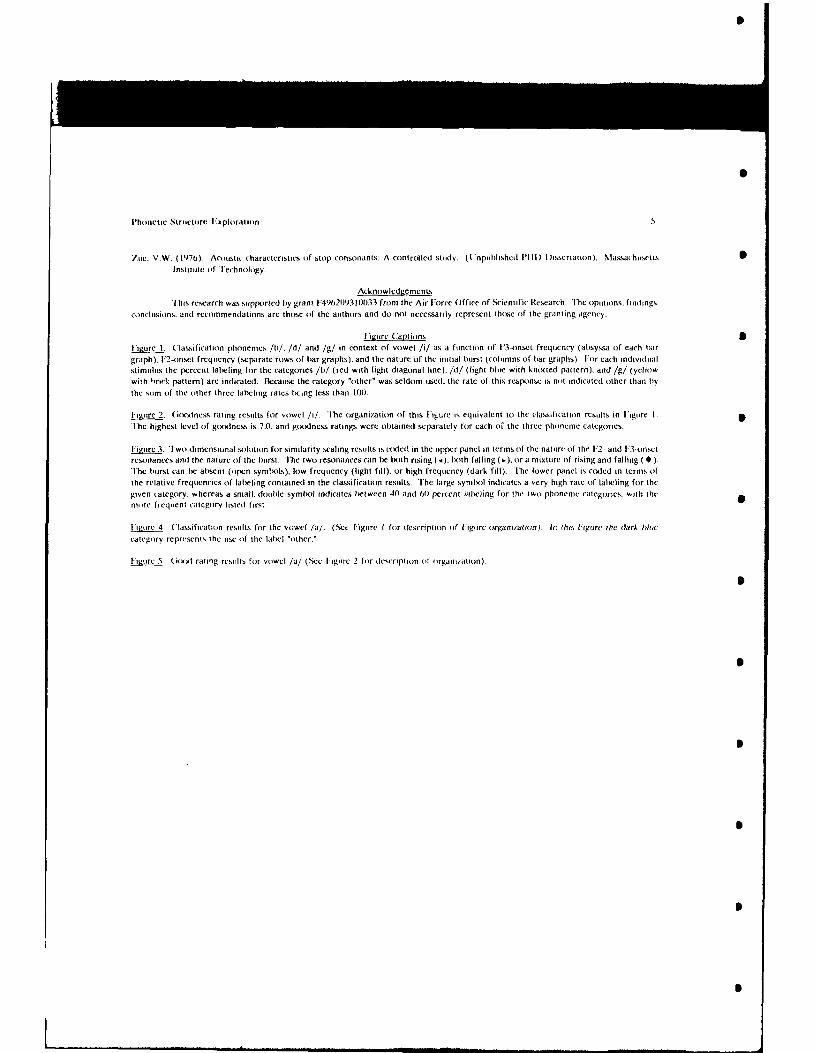
Phonetic Structure IExploration
Zue. V.W. (1976). Acoiusttc characteristics of stop consonants: A controlled study. (Unpublished PIl) l)issertation), Nlassa(husetLW
Institute of Technology.
AcknowlediemenrL
This research was supported by grant F4621093100133 from the Air Force Office of Scientific Research. lhe opinions, findings.
conclusions, and recommendations are those of the authors and do not necessarily represent those of the granting agency.
'icure Captions SFigure 1. Classification phonemes /b/. /d/ and /g/ in context of vowel /i/ as a function of "3-onset frequency (absyssa of each bar
graph). F2-onset frequency (separate rows of bar graphs), and the nature of the initial burst (columns of bar graphs) For each individualstimulus the percent labeling for the categories /b/ (red with light diagonal line). /d/ (light bilue with knotted pattern), and /g/ (yellow
with hrirk pattern) are indicated. Because the category "other" was seldom used. the rate of this respomse is not indicated other than by
the sum of the other three labeling rates being less than 100.
-Iunure 2. (iGoolness rating results for vowel /i/. The organi/ation of this Figure is equivalent to the classification results in Figure I.Ihe highest level of goodness is 7.0. and goxolness ratings were obitained separately for each of the three phineme categories.
Fiance 3. Two-dimensional solution for similarity scaling results is coded in the upper panel in terms of the nature of the F2- and 13-onsetresonances and the nature of the burst. 1he two resonances can be both rising (.). Ixth falling (I), or a mixture of rising and falling ( * ).The hurst can be absent (open symbxols), low frequency (light fill). or high frequency (dark fill). The lower panel is rcided in terms of
the relative frequencies of labeling contained in the classification results. The large symtlx) indicates a very high rate of lalbling for the
given category, whereas a small, douile symlxtl indicates luetween 40 and ,t0 percent labeling for the two phoneme categories. with themore frequent category listeid first.
Fiiure 4. Classification results for the vowel (a/. (,See Figure 1 for dtescription of figurc organiat•iort) In th•is I "gure the dark blit'category represents the use of the label "other."
fiiure 5 (xxji rating results for vowel /a/ (See I ugurce 2 for description of organi/ation )
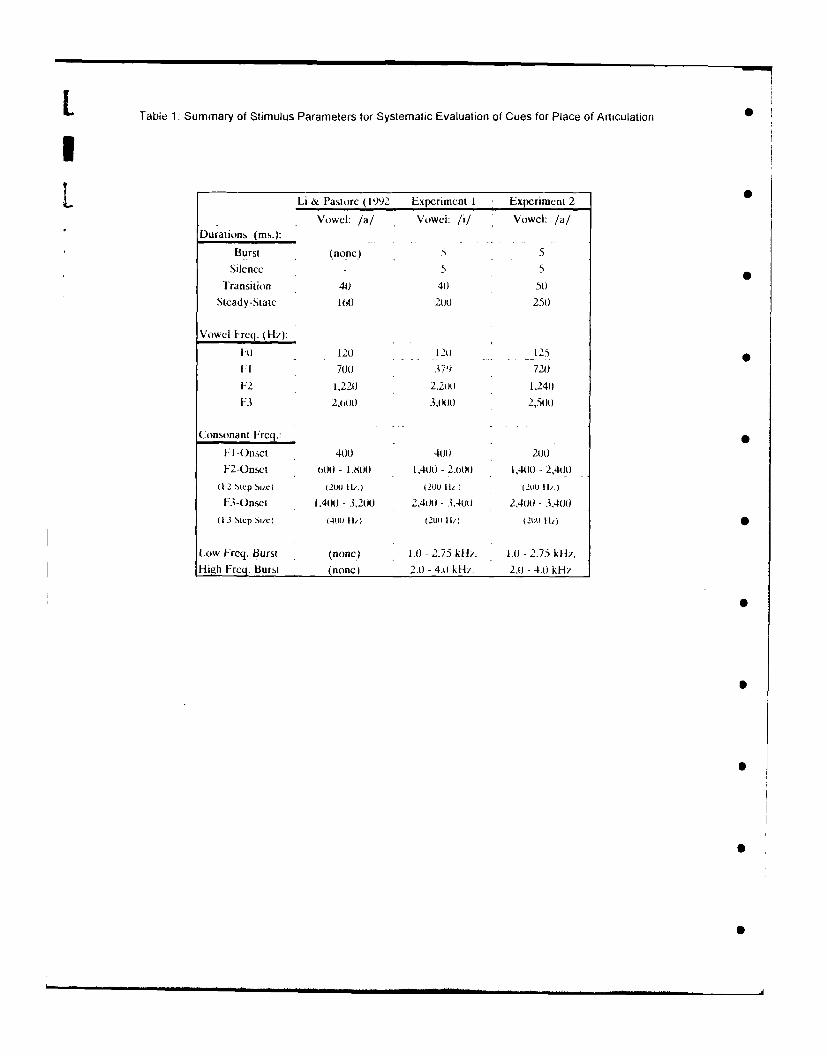
L Table 1: Summary of Stimulus Parameters for Systematic Evaluation of Cues for Place of Articulation 0
I
Li & Pastore (1992 Experiment I Experiment 2
Vowel: /a/ Vowel: /i/ Vowel: /a/Durations (ins.):
Burst (none.) 5
Silence - 5 5 0
Transition 40 40 50
Steady-State 100 2100 250
Vowel Freq. (Hz):
[1 120 12u 125
FI 700 37,) 720
[:2 1,220 2.2i)o 1,240
[3 2,0110 3,01t) 2.5110
Consonant Freq.:
F1 -Onset 400 400 200
F2-Onset 100 - 1,80011 1,400 - 2,tOt 1,4001) - 2,400
(12 Step SZ) (2UU tt IL) i2UU 11z2 1 (200 It.)
[,-Onsct 1.41110 - 3,2100 2,40) - 3.4.A1 2,400 - 3.400
(13 Step Suc) (41)(1 I1/) t2UO II/) 12Uu it,)
Low Freq. Burst (none) H.) - 2.75 kliz. 1.1) - 2.75 kliz.
High Freq. Burst (none) 2.1) - 4.11 kHz. 2.1o - 4.11 kHi
L _ . . . . .. . . ... ,. .. • . ... . .. . . S

2-d Solution for Vowel Al/
1.5
1.0
0.5 •
c0 >< S
0.0G>
E.• -0.5- < <
-1 .0
-1.5 -1.0 -0.5 0,0 0.5 1.0 1.5
Dimension 1
1.5 - I •
1.0 DC," D DC '.0 0.5 B o
4 B G GGGDGE B BB G GGE G
-0.5 B B GG
-1.0 _GG
-1.5 , , , , ,
-1.5 -1.0 -0.5 0 0.5 1.0 1.5 S
Dimension 1
Figure 3
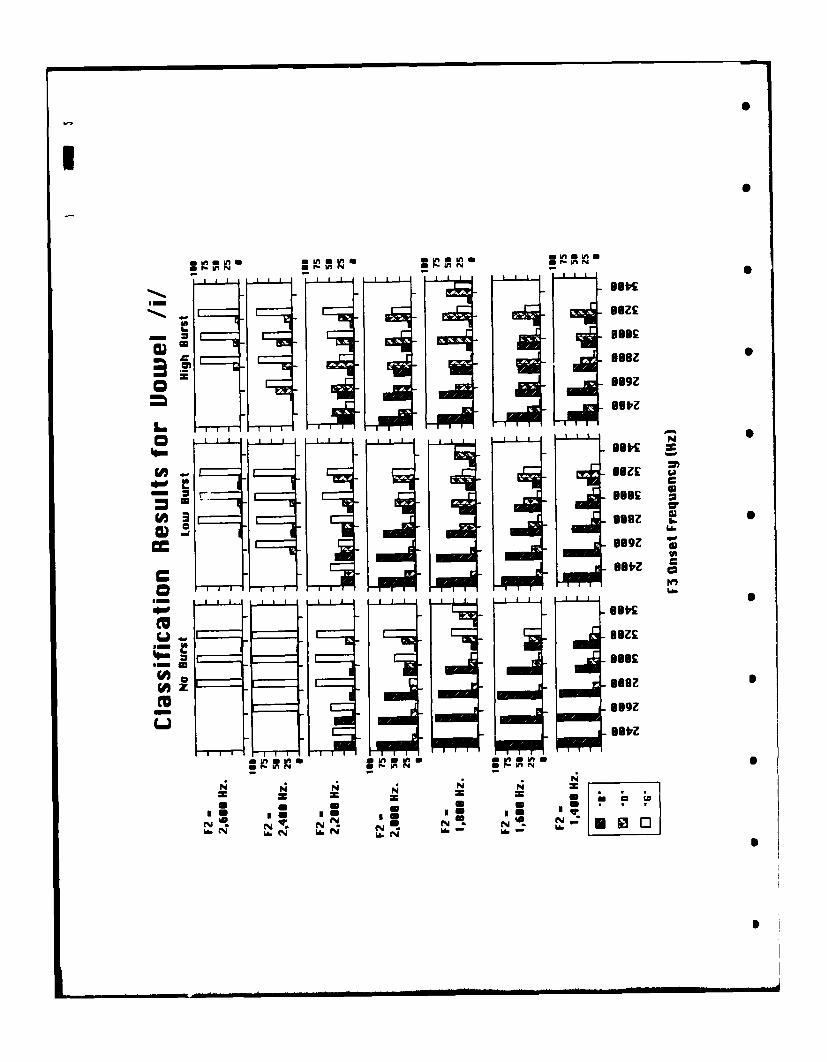
I
4o- u •001•
aBae
= Ugstl'l
NC
- • O0. I K998Z .
~~s z Igo •sn
o hi gGO•L
sew
I- . -U_ .• - •- i [
- .a .. . . ... u..
N NBaez
= = = U = =
a &V
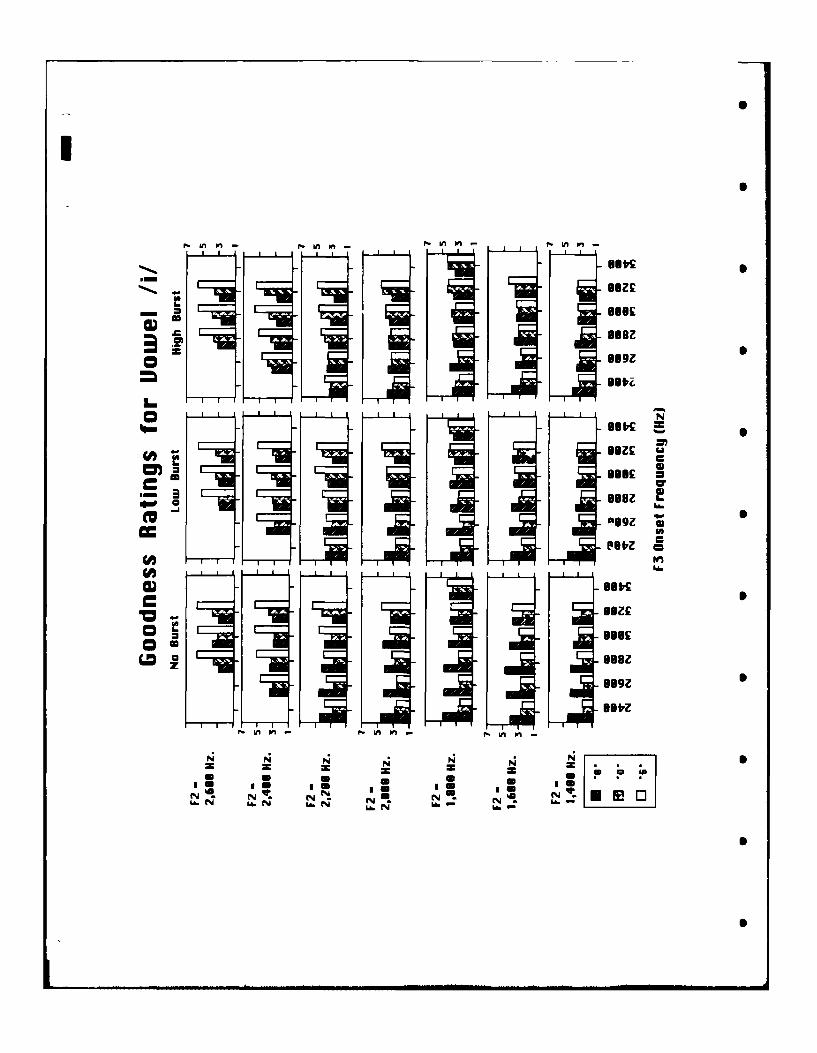
F- uuz
WJ: Baez
BOU
CMC
CL) lK 0
-0 Beer
CD ggLO ZO Bae
999
eutlz0 PM I
U, Ff414 6.w 3*frVY
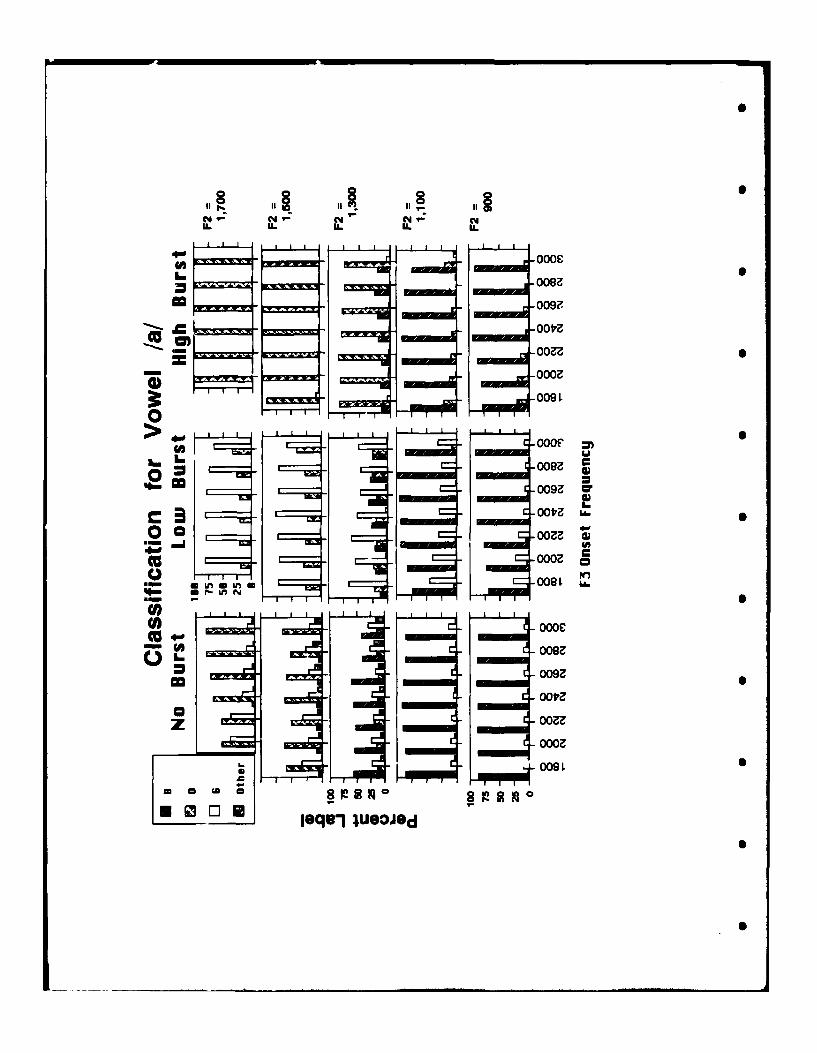
18 18 11~ 11 11C4 C4cm
owmm ooez
0092,~
tic 0017Z
i oaoe ,
009Z
009Z c
00 oozz
A 000CccU ~008IZ
009
U) oooz-~ 008~
06 D0 .a QC0 0 0 oqu-1 0OO9~
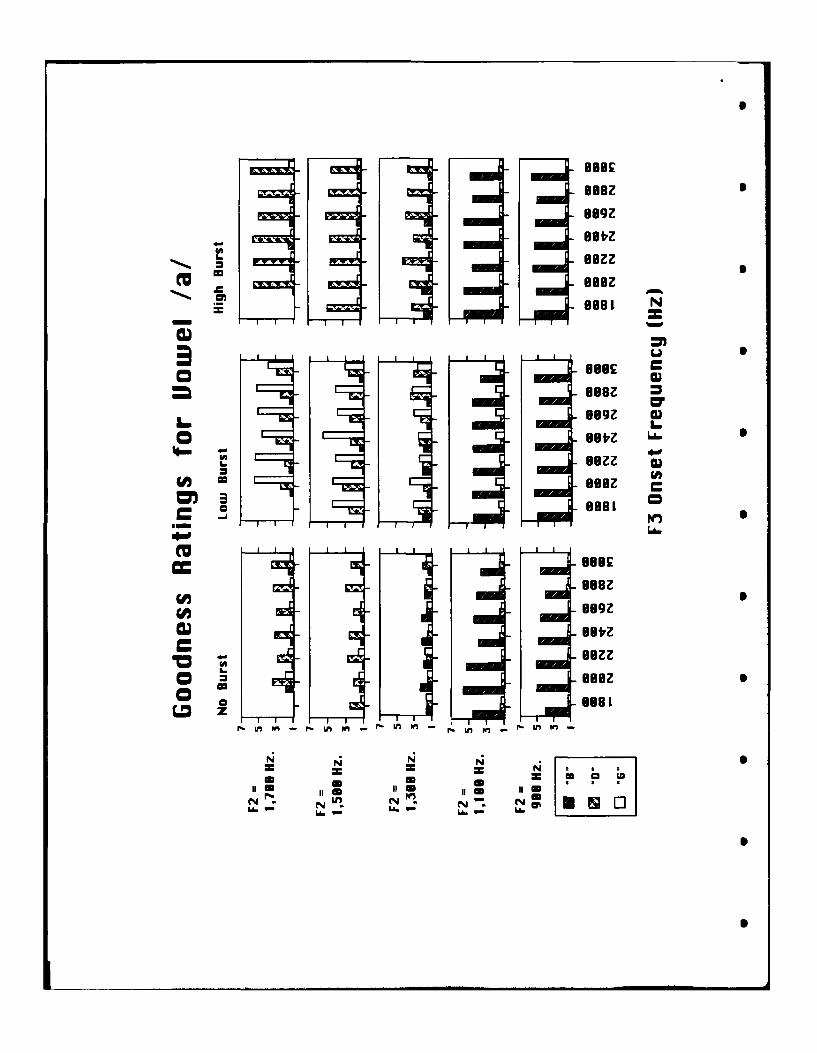
OBOEBaez889z
BuzzBaez
cn N
U Uo w•
OBOEL 9"-19'- 1- 88
mLO u etz '6 5
~6 - _
BezzBaez
t oa.- n a 9U909
S1
U3.
uu81
CU Betz
C maz
B
ZI III I IImL LM P- -- LM PM - m
LA 0
•m m .. •m ,m•L• S