Reopening the Economy: What Are the Risks, and What Have ...
23
Research Brief Reopening the Economy: What Are the Risks, and What Have States Done? Enghin Atalay Federal Reserve Bank of Philadelphia Research Department Shigeru Fujita Federal Reserve Bank of Philadelphia Research Department Sreyas Mahadevan Federal Reserve Bank of Philadelphia Research Department Ryan Michaels Federal Reserve Bank of Philadelphia Research Department Tal Roded Federal Reserve Bank of Philadelphia Research Department July 2020 https://doi.org/10.21799/frbp.rb.2020.jul
Transcript of Reopening the Economy: What Are the Risks, and What Have ...

Research Brief
Reopening the Economy: What Are the Risks, and What Have States Done?
Enghin AtalayFederal Reserve Bank of Philadelphia Research Department
Shigeru FujitaFederal Reserve Bank of Philadelphia Research Department
Sreyas MahadevanFederal Reserve Bank of Philadelphia Research Department
Ryan MichaelsFederal Reserve Bank of Philadelphia Research Department
Tal RodedFederal Reserve Bank of Philadelphia Research Department
July 2020https://doi.org/10.21799/frbp.rb.2020.jul

1 Reopening the Economy: What Are the Risks, and What Have States Done?July 2020Federal Reserve Bank of Philadelphia Research Department
Research results and conclusions expressed are those of the authors and do not necessarily reflect the views of the Federal Reserve Bank of Phil-adelphia, the Federal Reserve System, or the Federal Reserve Board of Governors. We thank Roc Armenter, Mike Dotsey, and Jeff Lin for helpful com-ments during the early stages of this project.
Patrick T. HarkerPRESIDENT AND CHIEF EXECUTIVE OFFICER
Michael DotseyEXECUTIVE VICE PRESIDENT AND DIRECTOR OF RESEARCH
Adam SteinbergMANAGING EDITOR, RESEARCH PUBLICATIONS
Brendan BarryDATA VISUALISATION MANAGER
Natalie SpinglerGRAPHIC DESIGN/DATA VISUALISATION INTERN
Reopening the Economy: What Are the Risks, and What Have States Done? by Enghin Atalay, Shigeru Fujita, Sreyas Mahadevan, Ryan Michaels, and Tal Roded
The process of reopening economies battered by the COVID-19 pandemic has been the subject of considerable deliberation in recent months. It is generally agreed that accurate and timely monitoring of the pace
of coronavirus spread is of the utmost importance in managing reopening. In addition, the discussion of reopening has often been framed by an assess-ment of the health risks posed by each economic sector. Some sectors, for example, involve especially close and protracted interaction among custom-ers and employees, which can facilitate COVID-19 transmission. Accordingly, the sequence in which sectors are opened can have significant public health implications. For instance, by delaying the reopening of higher-risk indus-tries, states can buy more time to augment their public health (i.e., testing and tracing) capacities.1
In this note, we develop a comprehensive dataset that combines measures of industry risk with information on states’ stay-at-home policies. In addi-tion, we carefully track how reopening has been undertaken across states and industries between late April and early July.2 Our database can then be used to characterize the health risks of those nonessential industries that were largely shut down in the initial phase of the pandemic and have recently (partially) reopened. The dataset can thus aid in assessing current reopening policies. Furthermore, note that the economic impacts of the pandemic could persist well beyond the period during which states’ stay-at-home orders are in place, inevitably forcing restructuring of some indus-tries and reallocation of workers across industries.3 The risk measures we provide in this note can also be useful in understanding the future evolu-tion of the industry structure.
Since the onset of the virus outbreak, researchers have proposed various measures for assessing the risk from reopening certain sectors. Generally
1 CDC (2020) summarizes its initiatives in this regard and lays out the roadmap for reopening along with detailed guidance on infection control and contact tracing.
2 We make this dataset publicly available and plan on continuously updating it to incorporate any new executive orders on reopening. The dataset is available at https://reopeningdata.github.io.
3 For example, Kozlowski et al. (2020) point out the possibility that the pandemic triggers changes in people’s beliefs about future extreme negative events, resulting in long-term negative impacts on eco-nomic activities, even after the immediate health crisis is resolved.

2 Reopening the Economy: What Are the Risks, and What Have States Done?July 2020Federal Reserve Bank of Philadelphia Research Department
speaking, these measures quantify the degree to which employees come into contact with one another and with customers in the course of performing their jobs. Clearly, the virus is more likely to spread in these “contact-intensive” sectors. The three measures of contact intensity that have typically been used are the following: (1) a “teamwork” index that captures interaction among workers, (2) a “customer contact” index that measures interaction between workers and customers, and (3) a “proximity” index that measures the phys-ical closeness of individuals in the workplace. We compute these three mea-sures as well as the share of workers that can work from home (WFH) within each industry. All of these measures are available at the detailed industry level. Using these measures, we evaluate the health risks posed by industries that were designated as nonessential by states' stay-at-home orders and thus subject to closure.4
The exercise reveals which industries can be reopened relatively safely and which industries are subject to larger risks. The former group includes various manufacturing industries, since they can operate with relatively little physical contact. Although the majority of manufacturing industries were initially classified as essential in most states, there are some industries within manufacturing that many states designated as nonessential. On the other hand, leisure and hospitality industries, which were widely deemed nonessential, are subject to greater risk.
In addition, another factor to keep in mind is that older individuals are subject both to higher health risk from COVID-19 and tend to be employed in low-physical-contact industries. Thus, even if low-contact sectors are prioritized in the reopening process, policymakers may want to consider targeting assistance toward older workers in these industries so they can pursue lighter work schedules and mitigate health risks.5
Overall, we find that states have indeed applied more extensive restrictions to high-contact industries. These industries were far more likely to be desig- nated as nonessential in states' original stay-at-home orders. However, states, on average, did not significantly draw out the reopening of high-contact sec-tors. Since their activity was initially more restricted, this timetable meant that high-contact sectors actually reopened at a faster pace even if their level of activity was diminished relative to other industries throughout the reopening period.
Industry Risk Measures
Option to Work from HomeWe use the American Time Use Survey (ATUS), a dataset developed by the Bureau of Labor Statistics, to measure workers’ potential to work from home;
4 We appreciate that by applying stringent safety precautions, workers can mitigate virus spread even in workplaces where proximity has been, in the past, high. If these mitigation measures are widely adopted and effective, the mapping between our “contact intensity” measures and health risk will be attenuated.
5 See Fujita et al. (2020) for specific policy proposals that tailor furlough subsidies, wage subsidies, and unemployment insurance to worker age.
3 Reopening the Economy: What Are the Risks, and What Have States Done?July 2020Federal Reserve Bank of Philadelphia Research Department
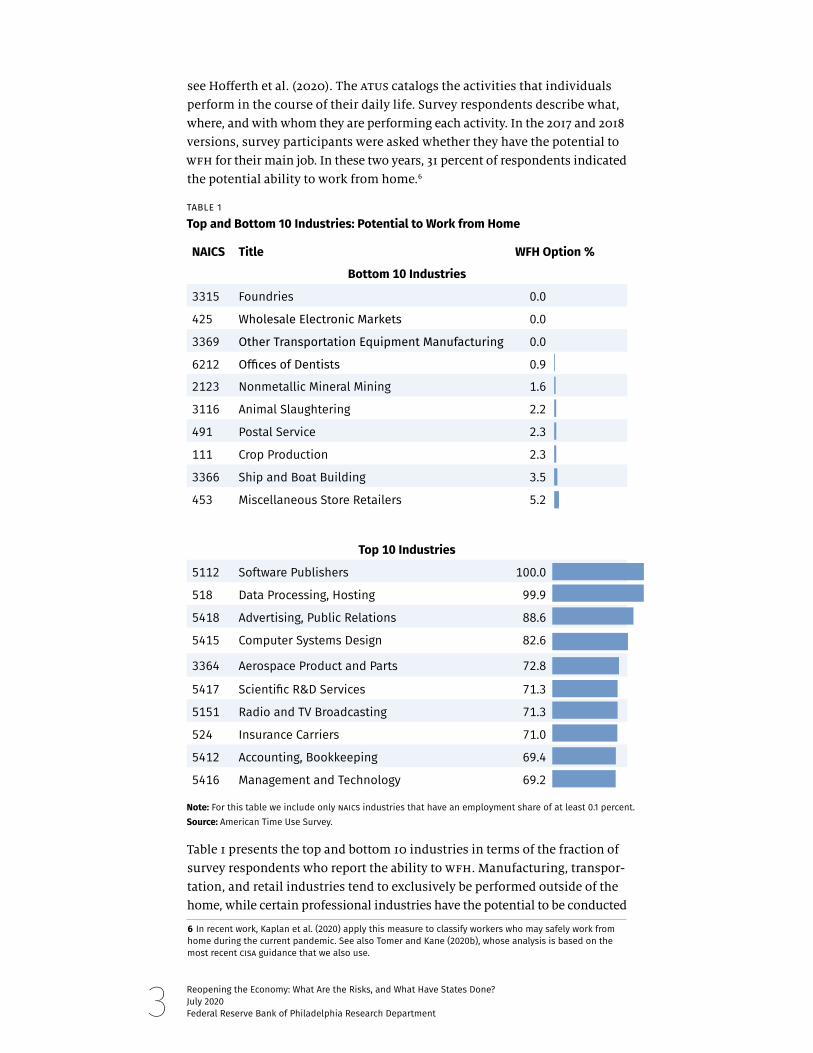
see Hofferth et al. (2020). The ATUS catalogs the activities that individuals perform in the course of their daily life. Survey respondents describe what, where, and with whom they are performing each activity. In the 2017 and 2018 versions, survey participants were asked whether they have the potential to WFH for their main job. In these two years, 31 percent of respondents indicated the potential ability to work from home.6
Table 1 presents the top and bottom 10 industries in terms of the fraction of survey respondents who report the ability to WFH. Manufacturing, transpor- tation, and retail industries tend to exclusively be performed outside of the home, while certain professional industries have the potential to be conducted
6 In recent work, Kaplan et al. (2020) apply this measure to classify workers who may safely work from home during the current pandemic. See also Tomer and Kane (2020b), whose analysis is based on the most recent CISA guidance that we also use.
NAICS Title WFH Option %
Bottom 10 Industries
3315 Foundries 0.0
425 Wholesale Electronic Markets 0.0
3369 Other Transportation Equipment Manufacturing 0.0
6212 Offices of Dentists 0.9
2123 Nonmetallic Mineral Mining 1.6
3116 Animal Slaughtering 2.2
491 Postal Service 2.3
111 Crop Production 2.3
3366 Ship and Boat Building 3.5
453 Miscellaneous Store Retailers 5.2
Top 10 Industries
5112 Software Publishers 100.0
518 Data Processing, Hosting 99.9
5418 Advertising, Public Relations 88.6
5415 Computer Systems Design 82.6
3364 Aerospace Product and Parts 72.8
5417 Scientific R&D Services 71.3
5151 Radio and TV Broadcasting 71.3
524 Insurance Carriers 71.0
5412 Accounting, Bookkeeping 69.4
5416 Management and Technology 69.2
TABLE 1
Top and Bottom 10 Industries: Potential to Work from Home
Note: For this table we include only NAICS industries that have an employment share of at least 0.1 percent. Source: American Time Use Survey.

4 Reopening the Economy: What Are the Risks, and What Have States Done?July 2020Federal Reserve Bank of Philadelphia Research Department
from home. The one exception in the former group of industries, aerospace manufacturing, employs an especially high fraction of engineers, mathema-ticians, and computer scientists, workers who have a high potential to WFH.
Contact Intensity IndicesWe draw on information from the Department of Labor’s Occupational Information Network (O*NET) database to compute industries’ intensity in physical contact.7 The O*NET database contains a wide variety of measures of the tasks workers perform in their job, the environments in which they work, the tools and technologies they use at work, and other work concepts. In particular, we compute three indices of occupations’ physical contact intensity: a teamwork index, a customer interaction index, and a proximity index. Drawing on Koren and Peto (2020), the first two indices are constructed as the average of five O*NET task measures and the third one is directly avail- able in the O*NET database. The teamwork index is the average of the following five task measures: (1) working with a group or team, (2) providing consulta-tion and advice to others, (3) coordinating the work and activities of others, (4) guiding, directing, and motivating subordinates, and (5) developing and building teams. The customer interaction index is the average of (1) dealing with external customers, (2) performing for or working directly with the public, (3) assisting and caring for others, (4) providing consultation and advice to others, and (5) establishing and maintaining interpersonal relations. The proximity index represents the extent to which the job requires the worker to perform job tasks in close physical proximity to other people.8
We standardize each measure underlying the indices such that it has mean 0 and standard deviation of 1. Thus, a value of “1” for the teamwork or customer- contact index indicates that its underlying measures are, on average, 1 standard deviation above their respective means. Note also that the O*NET measures are occupation based. We aggregate these occupation-based measures within each industry by taking the occupation-employment-weighted average.
Tables 2, 3, and 4 present the top and bottom five industries for the three contact intensity measures. Health-related industries are relatively high in all three measures. Industries in the transportation sector are near the bottom of the teamwork and proximity ranking, while manufacturing industries tend to cluster at the bottom of the customer interaction index.
7 We build on a fast-growing literature that uses O*NET to classify occupations’ exposure to the current pandemic; see Dingel and Neiman (2020), Kaplan et al. (2020), Leibovici et al. (2020), Koren and Peto (2020), Wardrip and Tranfaglia (2020), and Mongey et al. (2020), among others. A common theme in many of these papers is that occupations that are intensive in physical contact and cannot be conducted at home tend to employ workers who are less educated and have weaker balance sheets.
8 Note that the underlying components of the teamwork index do not necessarily imply close physical contact between the team members, since at least some of those tasks can be performed online or while keeping a safe distance. The proximity index, on the other hand, directly captures the necessity of close contact with other people, thus complementing the teamwork index.

5 Reopening the Economy: What Are the Risks, and What Have States Done?July 2020Federal Reserve Bank of Philadelphia Research Department
NAICS Title Customer Contact Index
Bottom 5 Industries
313 Textile Mills –0.94
314 Textile Product Mills –0.83
315 Apparel Manufacturing –0.82
3315 Foundries –0.78
623 Leather and Allied Product Manufacturing –0.73
Top 5 Industries
6212 Offices of Dentists 0.79
6219 Other Ambulatory Health Care Services 0.78
6211 Offices of Physicians 0.75
6214 Outpatient Care Centers 0.74
622 Hospitals 0.73
TABLE 3
Top and Bottom 5 Industries: Customer Contact Measure
Source: Authors’ calculation from the O*NET database.
NAICS Title Proximity Index
Bottom 5 Industries
113 Forestry and Lodging –1.73
5411 Legal Services –1.18
111 Crop Production –1.06
5412 Accounting, Bookkeeping –0.77
484 Truck Transportation –0.74
Top 5 Industries
6212 Offices of Dentists 1.47
6216 Home Health Care Services 1.26
6241 Individual Family Services 1.23
6219 Other Ambulatory Health Care Services 1.08
623 Nursing and Residential Care 1.05
TABLE 2
Top and Bottom 5 Industries: Proximity Measure
Source: Authors’ calculation from the O*NET database.

6 Reopening the Economy: What Are the Risks, and What Have States Done?July 2020Federal Reserve Bank of Philadelphia Research Department
State-Level Designation of (Non)Essential IndustriesBeginning in mid-March, states began to restrict economic activity in order to mitigate the spread of COVID-19. As part of this effort, many states issued lists of essential businesses: If a firm's sector was included in the list, its establishments could continue to operate. Sectors left off the list—the nonessential industries—were subject to closure if their activities could not be performed remotely.9 By early to mid-April, virtually every state had identified a list of businesses subject to closure.
We have processed lists of essential industries for all 50 states plus Washington, D.C., as of late April 2020. In addition, the Cybersecurity and Infrastructure Security Agency (CISA)—a recently established federal agency, part of the Department of Homeland Security—has provided a list of 16 “critical infra- structure industries.”10 This list has undergirded many states’ own lists of essential industries. Since we want to know industries' essential classifications just prior to reopening, we use the CISA guidance issued on April 17, just prior to the first wave of reopenings. We map from the textual description of economic activities in the CISA guidance to NAICS sectors. In the Appendix, we outline our procedure to construct measures of essentiality by industry and state.
9 To be clear, then, the designation of nonessential meant that operations at the physical establishment were highly restricted, not that operations had to necessarily cease. Later, we will examine the potential to work from home within nonessential industries.
10 Barrot et al. (2020) also construct lists of essential industries by state. They find that higher essential and teleworking shares of employment imply smaller increases in unemployment. Tomer and Kane (2020a) classify essential industries according to the CISA’s guidelines and show that these sectors employ relatively low-skilled workers. Finally, Baek et al. (2020) exploit variation in the timing (though not scope) of stay-at-home orders, finding that this heterogeneity can account for a modest share of variation in unemployment.
NAICS Title Teamwork Index
Bottom 5 Industries
491 Postal Service –1.46
492 Couriers and Messengers –0.91
485 Transit and Ground Passenger –0.84
316 Leather and Allied Product Manufacturing –0.74
484 Truck Transportation –0.72
Top 5 Industries
622 Hospitals 0.52
5416 Management, Scientific, and Technical Consulting Services
0.49
5616 Investigation and Security Services 0.47
6219 Other Ambulatory Health Care Services 0.47
5112 Software Publishers 0.43
TABLE 4
Top and Bottom 5 Industries: Teamwork Measure
Source: Authors’ calculation from the O*NET database.

7 Reopening the Economy: What Are the Risks, and What Have States Done?July 2020Federal Reserve Bank of Philadelphia Research Department
Figure 1 presents a heat map of states’ lists of essential industries. Each cell presents the fraction of employment within the state-industry cell that is classified as essential.11 Establishments in government, finance and insurance, utilities, farming and forestry, extraction, and health are nearly uniformly classified as essential, while the fraction of essential establishments is lowest in entertainment, food, and accommodation; administrative support; and other services. In between, there is considerable difference in the extent to which states have classified manufacturing, wholesale, retail, and real estate as essential.
Figure 2 presents the national-level result. The light blue bar represents the share of essential workers within each major NAICS industry. These shares are based on our state-level lists. The dark blue bar, on the other hand, represents the same employment share when we simply apply the federal government’s CISA classification. One can see significant differences between the two bars at least for some industries.
In Figure 3, we depict the county-level data, namely, the fraction of employ- ment that belongs to essential industries in each county. South Dakota, Nebraska, Iowa, North Dakota, and Wyoming have the highest fraction of employment in essential industries; Kansas, Vermont, Pennsylvania, Washington, D.C., and Michigan have the lowest. While much of the variation in essential shares occurs between states, there is substantial within-state variation as well. These differences largely are due to differences in the industrial mix across counties. In addition, within certain states—including California, Missouri, and Texas—urban counties have placed additional restrictions compared to the rest of their states.
11 We use the 2017 County Business Patterns to measure the number of establishments and employment in each industry and in each county. While Figure 1 lists 19 industries, our initial categorization of which industries are essential involves a much finer classification of NAICS industries. For this reason, the figure contains values that are strictly between 0 and 1.
AL AK AZ AR CA CO CT DE DC FL GA HI ID IL IN IA KS KY LA ME MD MA MI MN MS MO MT NE NV NH NJ NM NY NC ND OH OK OR PA RI SC SD TN TX UT VT VA WA WI WV WY
FarmingMining
UtilitiesConstruction
ManufacturingWholesale
RetailTransportation
InformationFinance, Insurance
Real EstateProf. ServicesManagement
AdministrativeEducation
HealthRec., Food, Accom.
Other Serv.Government
FIGURE 1
National-Level Share of Employment Classified as Essential in Major NAICS Industries
Source: Authors’ calculation from states’ executive orders complemented with other information. See the Appendix for details.
86–90%91–95%96–100%
61–75%76–80%81–85%
0–0.9%1–40%41–60%

8 Reopening the Economy: What Are the Risks, and What Have States Done?July 2020Federal Reserve Bank of Philadelphia Research Department
FIGURE 2
National-Level Share of Employment Classified as Essential in Major NAICS Industries
Source: Authors’ calcu-lation from states’ executive orders com-plemented with other information. See the Appendix for details.0% 20% 40% 60% 80% 100%
States’ Lists CISA
Farming
Mining
Utilities
Construction
Manufacturing
Wholesale
Retail
Transportation
Information
Finance, Insurance
Real Estate
Prof. Services
Management
Administrative
Education
Health
Rec., Food, Accom.
Other Serv.
Government
FIGURE 3
County-Level Share of Employment Classified as Essential
86–90%91–95%96–100%
61–75%76–80%81–85%
0–0.9%1–40%
No data
41–60%
Source: Authors’ calculation from states’ executive orders complemented with other information. See the Appendix for details.
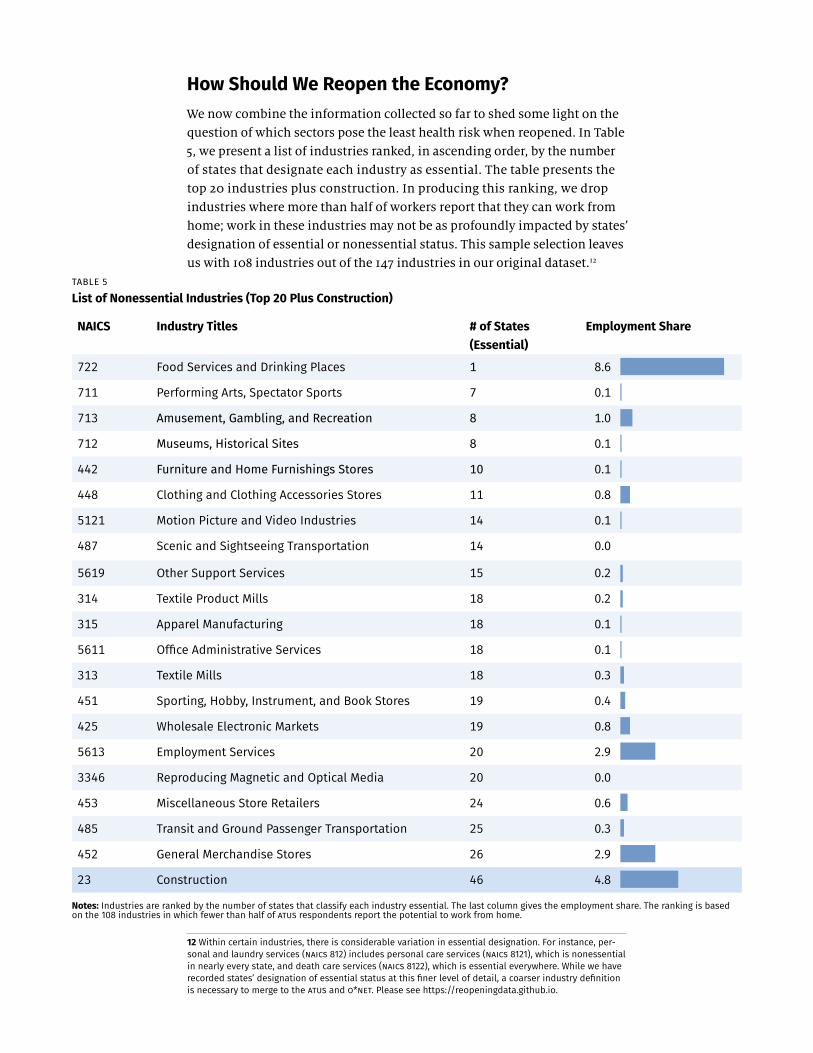
How Should We Reopen the Economy?We now combine the information collected so far to shed some light on the question of which sectors pose the least health risk when reopened. In Table 5, we present a list of industries ranked, in ascending order, by the number of states that designate each industry as essential. The table presents the top 20 industries plus construction. In producing this ranking, we drop industries where more than half of workers report that they can work from home; work in these industries may not be as profoundly impacted by states’ designation of essential or nonessential status. This sample selection leaves us with 108 industries out of the 147 industries in our original dataset.12
12 Within certain industries, there is considerable variation in essential designation. For instance, per-sonal and laundry services (NAICS 812) includes personal care services (NAICS 8121), which is nonessential in nearly every state, and death care services (NAICS 8122), which is essential everywhere. While we have recorded states’ designation of essential status at this finer level of detail, a coarser industry definition is necessary to merge to the ATUS and O*NET. Please see https://reopeningdata.github.io.
NAICS Industry Titles # of States(Essential)
Employment Share
722 Food Services and Drinking Places 1 8.6
711 Performing Arts, Spectator Sports 7 0.1
713 Amusement, Gambling, and Recreation 8 1.0
712 Museums, Historical Sites 8 0.1
442 Furniture and Home Furnishings Stores 10 0.1
448 Clothing and Clothing Accessories Stores 11 0.8
5121 Motion Picture and Video Industries 14 0.1
487 Scenic and Sightseeing Transportation 14 0.0
5619 Other Support Services 15 0.2
314 Textile Product Mills 18 0.2
315 Apparel Manufacturing 18 0.1
5611 Office Administrative Services 18 0.1
313 Textile Mills 18 0.3
451 Sporting, Hobby, Instrument, and Book Stores 19 0.4
425 Wholesale Electronic Markets 19 0.8
5613 Employment Services 20 2.9
3346 Reproducing Magnetic and Optical Media 20 0.0
453 Miscellaneous Store Retailers 24 0.6
485 Transit and Ground Passenger Transportation 25 0.3
452 General Merchandise Stores 26 2.9
23 Construction 46 4.8
TABLE 5
List of Nonessential Industries (Top 20 Plus Construction)
Notes: Industries are ranked by the number of states that classify each industry essential. The last column gives the employment share. The ranking is based on the 108 industries in which fewer than half of ATUS respondents report the potential to work from home.

10 Reopening the Economy: What Are the Risks, and What Have States Done?July 2020Federal Reserve Bank of Philadelphia Research Department
Not surprisingly, the first four industries are in the leisure and hospitality sector, more specifically, either in accommodation and food services (NAICS 72) or arts, entertainment, and recreation (NAICS 71). Almost all states desig-nate these industries as nonessential. As is consistent with this list, the BLS reported that employment of the first four industries fell by more than 40 percent in April. Finally, given its size, we have also included the construc-tion sector. Although construction is classified as essential by most states, there are a few notable exceptions: Michigan, New Jersey, New York, Pennsylvania, Washington, and Vermont have classified certain industries within the construction sector as nonessential.
NAICS Industry Titles Teamwork Customer Contact
Proximity Combined Ranking
WFH Option
Share of 50+
722 Food Services and Drinking Places 83 78 100 87 0.07 0.16
711 Performing Arts, Spectator Sports 62 72 75 70 0.23 0.33
713 Amusement, Gambling, and Recreation 15 87 92 65 0.17 0.26
712 Museums, Historical Sites 70 82 65 72 0.25 0.32
442 Furniture and Home Furnishings Stores 37 85 74 65 0.32 0.35
448 Clothing and Clothing Accessories Stores
40 100 83 74 0.11 0.25
5121 Motion Picture and Video Industries 92 90 94 92 0.30 0.19
487 Scenic and Sightseeing Transportation 24 79 90 64 0.00 0.29
5619 Other Support Services 64 62 69 65 0.15 0.32
314 Textile Product Mills 6 2 39 16 0.20 0.47
315 Apparel Manufacturing 5 3 44 17 0.36 0.41
5611 Office Administrative Services 94 71 11 59 0.23 0.32
313 Textile Mills 7 1 34 14 0.06 0.44
451 Sporting, Hobby, Instrument, and Book Stores
46 98 82 75 0.13 0.30
425 Wholesale Electronic Markets 63 68 13 48 0.00 0.44
5613 Employment Services 25 46 68 46 0.33 0.30
3346 Reproducing Magnetic and Optical Media
54 40 33 42 0.44 0.43
453 Miscellaneous Store Retailers 31 92 78 67 0.05 0.36
485 Transit and Ground Passenger Transportation
3 66 101 57 0.13 0.42
452 General Merchandise Stores 48 94 87 76 0.06 0.29
23 Construction 93 42 76 70 0.17 0.32
TABLE 6
Ranking of Risk Measures
Notes: Industries are ranked by the number of states that classify each industry essential. The ranking is based on the 108 industries in which fewer than half of ATUS respondents report the potential to work from home.

11 Reopening the Economy: What Are the Risks, and What Have States Done?July 2020Federal Reserve Bank of Philadelphia Research Department
We rank our 108 sectors with a WFH share of less than 0.5 according to our three measures of contact intensity; high values indicate high levels of physical contact. Table 6 presents these rankings for the relatively nonessential industries listed in Table 5. The combined ranking listed in Table 6 is based on the averages of three individual rankings. The fifth column presents the share of workers within each industry who have the WFH option. Note that the least essential sectors (e.g., food services, spectator sports) also tend to rank high according to our risk measures. Moreover, workers in these indus- tries tend to have a more limited WFH option. These results are not surprising but do suggest the importance of various precautionary measures, such as effective allocations of personal protective equipment (PPE) and the enforce-ment of strict social distancing policies, when states do reopen these industries. On the other hand, the list in Table 6 also shows that a number of manufac-turing industries (NAICS 31–33) that tend to be deemed nonessential rank near the bottom in terms of the contact risk measures. This is, also, not too surprising, given that manufacturing is generally more capital intensive. It is nevertheless worth noting that these nonessential sectors pose seemingly little health risk by our metrics.13
In the last column of Table 6, we present the share of workers older than 50 for each industry.14 This demographic information can be important in the context of reopening since the severity of COVID-19 tends to increase with age.15 It turns out that all three contact-intensity measures are highly (negatively) correlated with the share of workers who are age 50 years or older. To illustrate this pattern, Figure 4 plots each of the three risk mea-sures against the shares of older workers. Each dot represents an industry, including only the 108 industries in which fewer than half of ATUS respon-dents report the potential to work from home.
The negative correlations shown in Figure 4 indicate that riskier industries by each of the O*NET-based indices tend to have younger workforces. For instance, the share of workers who are age 50 years or older in bars and restaurants (NAICS 722) is the lowest among our sample of 108 industries. On the other hand, several manufacturing industries identified as immediate candidates to be reopened tend to have older workforces. The (negative) correlations are −0.19 (teamwork), −0.34 (proximity), and −0.38 (customer contact), respectively. Thus, even if low-contact sectors are prioritized in the reopening process, policymakers may want to consider targeting assistance toward older workers in these industries so they can pursue lighter work schedules and mitigate health risks.
13 One may be concerned that—because of input-output relationships—decisions on which industries should be “open” or “closed” should be interconnected. To give an example, one might think that opening up apparel manufacturing in a given state will have little impact if apparel stores in the same state are closed. In practice, though, the manufacturing and wholesale industries that we have identified within Table 6 as relatively safe to reopen produce relatively tradable products: The output produced by these industries can be shipped to downstream industries in areas less affected by COVID-19.
14 The shares are calculated from the 2018-19 Annual Social and Economic Supplement of the Current Population Survey (Flood et al. (2020)).
15 See, for example, Verity et al. (2020) and Williamson et al. (2020).

12 Reopening the Economy: What Are the Risks, and What Have States Done?July 2020Federal Reserve Bank of Philadelphia Research Department
FIGURE 4
Scatter Plot of the Contact Intensity Indices Against Share of Workers Age 50 Years or Older
Source: Current Population Survey and O*NET.
−2.00 −1.00 0.00 1.00 2.00
Accomodation and Food ServicesManufacturingTransportation and WarehousingConstructionArts, Entertainment, and RecreationInformationAdministrative Support, Waste Management, and Remediation Services
Retail
Other
Correlation: −0.38
0.10
0.20
0.30
0.40
0.50Share of Age 50+ Workers
−1.00 −0.50 0.00 0.50 1.00Customer Contact Index
Correlation: −0.34
−1.50 −1.00 −0.50 0.00 0.50
Proximity Index
0.10
0.20
0.30
0.40
0.50Share of Age 50+ Workers
Correlation: −0.19
Teamwork Index
0.10
0.20
0.30
0.40
0.50Share of Age 50+ Workers

13 Reopening the Economy: What Are the Risks, and What Have States Done?July 2020Federal Reserve Bank of Philadelphia Research Department
How Has Reopening Occurred?Beginning in late April, individual states and counties have allowed economic activity in certain sectors to resume. We have compiled reopening orders in all 50 states (and Washington, D.C.) through July 10, 2020. In this section, we first illustrate how the pace of reopening has varied across major sectors and in the largest states. Then, we ask whether these reopening plans have in fact targeted low-contact-intensive activities.
Figure 5 illustrates the path of reopening, by sector (left panel) and state (right panel).16 At the height of states' restrictions on economic activity, approximately 28 percent of employment was in a “closed” industry. By early July, this figure had fallen to 3 percent. Restrictions were initially most pre- valent in accommodation, entertainment, and food (NAICS 71, 72), other services (NAICS 81), and retail (NAICS 44, 45). While retail and accommoda-tion, entertainment, and food have reopened relatively quickly, reopening of personal services (NAICS 812) is still far from complete in many states. In the right panel, we plot the reopening shares for the five most populous states. Among these states, New York and Pennsylvania had the highest share of employment initially closed. Florida, on the other hand, had a lower than average share of employment in “closed” industries, as of mid-April. Not only the initial level of restrictions on economic activity but also the pace of reopening varies across states. As of early July, New York (especially so in New York City) has retained many of its business closures. In contrast, all but one of Pennsylvania's counties—Philadelphia County—are in the state's
“green” phase (the least restrictive phase) of its reopening plan.
16 Our characterization of the reopening process assigns industries to be either “open” or “closed.” In reality, states' and municipalities' restrictions on economic activity may fall between complete closure and no restrictions. For example, retail and food establishments may be subject to capacity constraints, may be required to operate outdoors only, or may be restricted to curbside pickup. We abstract from these distinctions. We assign establishments to be closed if they are restricted to curbside pickup only, and assign establishments to be open if they face capacity constraints or if they are required to operate outdoors.
FIGURE 5
Share of Employment in “Open” Industries, by Sector or State
Notes: The left panel presents the share of employment in “open” industries, by sector, for five of the 19 industries listed in Figure 1. The “Average” line depicts the overall share of employment in “open” industries, averaging over all industries in the U.S. In the right panel, we depict the share of employment in “open” industries, both the national average and that for the five most populous states.
Percentage Open by Sector Percentage Open by State
0%
20%
40%
60%
80%
100%
4/17 5/1 5/15 5/29 6/12 6/26 7/10
Average ManufacturingWholesaleRetail
Rec., Food, Accom.Other Serv.
Average CA FLNY PA TX
0%
20%
40%
60%
80%
100%
4/17 5/1 5/15 5/29 6/12 6/26 7/10

14 Reopening the Economy: What Are the Risks, and What Have States Done?July 2020Federal Reserve Bank of Philadelphia Research Department
Our dataset also allows one to explore state-by-industry variation in the pace of reopening. In Figure 6, we present the sectoral paths of reopening for two states, New York and Texas. Comparing the two states indicates, first, that New York initially had fewer industries “open,” especially in manufacturing and in other services. Second, restrictions were relaxed more gradually in New York.17 In contrast, recreation and food services were reopened rather abruptly in Texas; the share of employment in open industries shot up from roughly 10 percent to nearly 100 percent by the end of May. Similarly, other services in Texas reopened relatively swiftly. Finally, unlike New York, Texas has partially reversed its reopening. On June 26, Governor Greg Abbott ordered bars in Texas to close. This is apparent in the dark blue line in the right panel of Figure 6.18
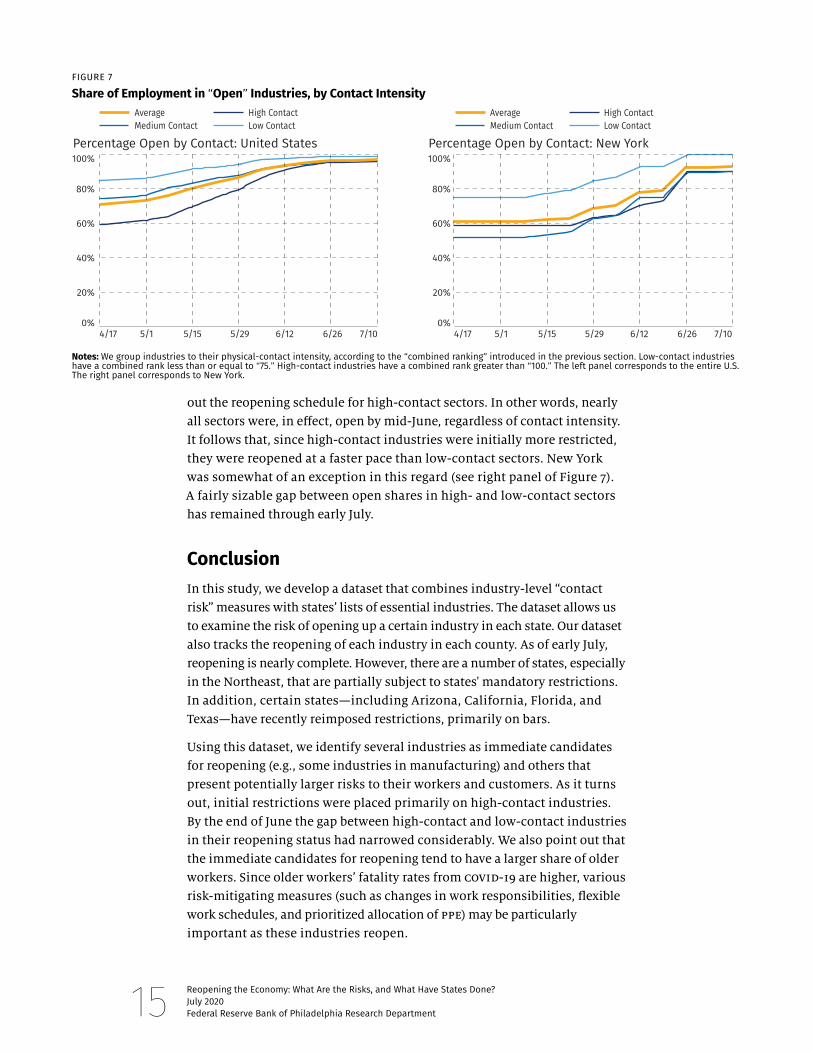
Have low-contact industries reopened earlier? To address this question, we split our sample of 147 industries into three groups, based on the “combined ranking” discussed in the previous section. For each of the three groups of industries, we compute the (employed-weighted) fraction that is allowed to be open. Figure 7 illustrates a few important results for the U.S. as a whole (left panel) and New York specifically (right panel). First, high-contact indus- tries were initially more restricted. As of mid-April, just under 60 percent of employment in high-contact industries was allowed to work on-site, compared to 85 percent in low-contact industries (left panel of Figure 7). Second, although high-contact industries have faced greater restrictions during reopening, the gap between high- and low-contact industries closed gradually during May and June. The difference between them is now negligible: As of this writing, less than 0.7 percent of employment in low-contact industries are closed; 3.2 percent are closed in medium-contact industries; and 3.7 percent are closed in high-contact industries. Third, on average, states did not draw
17 Like several other states, New York phased its reopening process on a region-by-region basis. New York City, accounting for approximately two-fifths of the population of its state, had substantial restric-tions on industry activity up to the beginning of July.
18 Figures for all 50 states plus Washington, D.C., are provided at https://reopeningdata.github.io/figures.
FIGURE 6
Share of Employment in “Open” Industries: New York and Texas
Notes: Each panel presents the share of employment in “open” industries, for five of the 19 industries listed in Figure 1. The “Average” line depicts the overall share of employment in “open” industries, averaging over all industries in the state. The left panel corresponds to New York, the right to Texas.
Percentage Open by Sector: New York Percentage Open by Sector: Texas
0%
20%
40%
60%
80%
100%
4/17 5/1 5/15 5/29 6/12 6/26 7/100%
20%
40%
60%
80%
100%
4/17 5/1 5/15 5/29 6/12 6/26 7/10
Average ManufacturingWholesaleRetail
Rec., Food, Accom.Other Serv.
Average ManufacturingWholesaleRetail
Rec., Food, Accom.Other Serv.
15 Reopening the Economy: What Are the Risks, and What Have States Done?July 2020Federal Reserve Bank of Philadelphia Research Department
out the reopening schedule for high-contact sectors. In other words, nearly all sectors were, in effect, open by mid-June, regardless of contact intensity. It follows that, since high-contact industries were initially more restricted, they were reopened at a faster pace than low-contact sectors. New York was somewhat of an exception in this regard (see right panel of Figure 7). A fairly sizable gap between open shares in high- and low-contact sectors has remained through early July.
ConclusionIn this study, we develop a dataset that combines industry-level “contact risk” measures with states’ lists of essential industries. The dataset allows us to examine the risk of opening up a certain industry in each state. Our dataset also tracks the reopening of each industry in each county. As of early July, reopening is nearly complete. However, there are a number of states, especially in the Northeast, that are partially subject to states' mandatory restrictions. In addition, certain states—including Arizona, California, Florida, and Texas—have recently reimposed restrictions, primarily on bars.
Using this dataset, we identify several industries as immediate candidates for reopening (e.g., some industries in manufacturing) and others that present potentially larger risks to their workers and customers. As it turns out, initial restrictions were placed primarily on high-contact industries. By the end of June the gap between high-contact and low-contact industries in their reopening status had narrowed considerably. We also point out that the immediate candidates for reopening tend to have a larger share of older workers. Since older workers’ fatality rates from COVID-19 are higher, various risk-mitigating measures (such as changes in work responsibilities, flexible work schedules, and prioritized allocation of PPE) may be particularly important as these industries reopen.
FIGURE 7
Share of Employment in “Open” Industries, by Contact Intensity
Notes: We group industries to their physical-contact intensity, according to the “combined ranking” introduced in the previous section. Low-contact industries have a combined rank less than or equal to “75.” High-contact industries have a combined rank greater than “100.” The left panel corresponds to the entire U.S. The right panel corresponds to New York.
Percentage Open by Contact: United States
Average High ContactMedium Contact Low Contact
Percentage Open by Contact: New York
Average High ContactMedium Contact Low Contact
0%
20%
40%
60%
80%
100%
4/17 5/1 5/15 5/29 6/12 6/26 7/100%
20%
40%
60%
80%
100%
4/17 5/1 5/15 5/29 6/12 6/26 7/10

16 Reopening the Economy: What Are the Risks, and What Have States Done?July 2020Federal Reserve Bank of Philadelphia Research Department
Unfortunately, economic impacts of the pandemic are likely to persist well beyond the initial reopening phase: Some industries may face significantly lower demand for a prolonged period, which inevitably forces restructuring of those industries, while new businesses could emerge in other industries. Going forward, we plan to study this job reallocation process by complementing the current dataset with other relevant information such as job openings, unemployment estimates, and unemployment insurance policies.
17 Reopening the Economy: What Are the Risks, and What Have States Done?July 2020Federal Reserve Bank of Philadelphia Research Department
ReferencesBaek, ChaeWon, Peter McCrory, Todd Messer, and Preston Mu, “Unemploy-ment Effects of Stay-at-Home Orders: Evidence from High Frequency Claims Data,” 2020. Unpublished Manuscript.
Barrot, Jean-Noël, Basile Grassi, and Julien Sauvagnat, “Costs and Benefits of Closing Businesses in a Pandemic,” 2020. Unpublished Manuscript.
CDC, “CDC Activities and Initiatives Supporting the COVID-19 Response and the President’s Plan for Opening America Up Again,” May 2020.
Dingel, Jonathan, and Brent Neiman, “How Many Jobs Can Be Done at Home?” 2020. Becker Friedman Institute White Paper.
Flood, Sarah, Miriam King, Renae Rodgers, Steven Ruggles, and Robert Warren, Integrated Public Use Microdata Series, Current Population Survey: Version 7.0. IPUMS 2020.
Fujita, Shigeru, Giuseppe Moscarini, and Fabien Postel-Viney, “The Labour Market Policy Response to COVID-19 Must Leverage the Power of Age,” VoxEU column 2020.
Hofferth, Sandra L., Sarah M. Flood, Matthew Sobek, and Daniel Backman, American Time Use Survey Data Extract Builder: Version 2.8. IPUMS 2020.
Kaplan, Greg, Ben Moll, and Gianluca Violante, “Pandemics According to HANK,” 2020. Unpublished Manuscript.
Koren, Miklos, and Rita Peto, “Business Disruptions from Social Distancing,” 2020. Unpublished Manuscript.
Kozlowski, Julian, Laura Veldkamp, and Venky Venkateswaran, “Scarring Body and Mind: The Long-Term Belief-Scarring Effects of COVID-19,” May 2020. Unpublished Manuscript.
Leibovici, Fernando, Ana Maria Santacreu, and Matthew Famiglietti, “How the Impact of Social Distancing Ripples through the Economy,” 2020.
Mongey, Simon, Laura Pilossoph, and Alex Weinberg, “Which Workers Bear the Burden of Social Distancing Policies?” 2020. Unpublished Manuscript.
Tomer, Adie, and Joseph W. Kane, “How to Protect Essential Workers During COVID-19,” Brookings Institution Report, 2020a.
Tomer, Adie, and Joseph W. Kane, “To Protect Frontline Workers During and After COVID-19, We Must Define Who They Are,” Brookings Institution Report, 2020b.
Verity, Robert, Lucy Okell, Ilaria Dorigatti, Peter Winskill, Charles Whit-taker, Natsuko Imai, Gina Cuomo-Dannenburg, Hayley Thompson, Patrick Walker, Han Fu, Amy Dighe, Jamie Griffin, Marc Baguelin, Sangeeta Bhatia, Adhiratha Boonyasiri, Anne Cori, Zulma Cucunuba, Rich FitzJohn, Katy Gaythorpe, Will Green, Arran Hamlet, Wes Hinsley, Daniel Laydon, Gemma Nedjati-Gilani, Steven Riley, Sabine van Elsland, Erik Volz, Haowei Wang,

18 Reopening the Economy: What Are the Risks, and What Have States Done?July 2020Federal Reserve Bank of Philadelphia Research Department
Yuanrong Wang, Xiaoyue Xi, Christl Donnelly, Azra Ghani, and Neil Fergu-son, “Estimates of the Severity of Coronavirus Disease 2019: a Model-Based Analysis,” The Lancet Infectious Diseases, 2020.
Wardrip, Keith, and Anna Tranfaglia, “COVID-19: Which Workers Will Be Most Impacted?” Federal Reserve Bank of Philadelphia, COVID-19: Equity in Recovery Series, 2020.
Williamson, Elizabeth J., Alex J. Walker, Krishnan Bhaskaran, Seb Bacon, Chris Bates, Caroline E. Morton, Helen J. Curtis, Amir Mehrkar, David Evans, Peter Inglesby, Jonathan Cockburn, Helen I. McDonald, Brian MacKenna, Laurie Tomlinson, Ian J. Douglas, Christopher T. Rentsch, Rohini Mathur, Angel Y. S. Wong, Richard Grieve, David Harrison, Harriet Forbes, Anna Schultze, Richard Croker, John Parry, Frank Hester, Sam Harper, Rafael Perera, Stephen J. W. Evans, Liam Smeeth, and Ben Goldacre, “OpenSAFELY: Factors Associated with COVID-19 Death in 17 Million Patients,” Nature, 2020.

19 Reopening the Economy: What Are the Risks, and What Have States Done?July 2020Federal Reserve Bank of Philadelphia Research Department
AppendixIn this appendix, we outline our procedure for classifying industries as essen- tial or nonessential. Localities' methods of identifying industries vary. Some states (e.g., Texas) follow CISA guidelines closely. There is one state, South Dakota, which has placed no restrictions on firm activity. A third set of states have provided a short list of industries that are nonessential. Finally, a fourth set of states have provided an expansive list of industries that are essential.
We first describe our method for determining which industries are “critical,” according to CISA. Our coding of CISA guidance is broadly similar to Tomer and Kane (2020a), who were the first, to our knowledge, to publish a list of essential sectors derived from CISA. Our coding is done independently just to be sure that it is consistent with our coding of states' essential business orders. We then outline our methods of classifying essential industries within each of the aforementioned sets of states. One complicating factor is that, within certain states, individual cities and counties have promulgated more restrictive stay-at-home orders than their home states. We describe these cases below.
CISA guidance is incorporated into many states' essential business lists. First released March 19, CISA guidance was subsequently revised twice. The second revision, issued March 28, was the most substantial. A few more adjustments were made in the April 17 release. Our analysis is based on the third, and final, release, so that our list reflects the essential designations as of the start of reopening. Our understanding is that, with a few exceptions, states that incorporated initial CISA guidance into their essential business lists updated their orders in light of revisions to the CISA memorandum.19
Based on our reading of CISA guidance, we assign an essential designation to 577 NAICS sectors. This list consists of a mix of four-, five-, and six-digit industries, where the level of detail is, in general, chosen to most closely match the textual description of critical, or essential, economic activities described in the guidance. For instance, it is abundantly clear from the CISA memorandum that oil and gas extraction is considered essential, so the corresponding 4-digit sector (2111) is classified accordingly. By contrast, CISA singles out pharmacies (44611) but not cosmetics (44612), so essential designations are made separately for each 5-digit industry within the 4-digit sector encompassing health and personal care stores.
Whereas most sectors can be assessed in this manner by merely following the text, the essential status of certain manufacturing and wholesale sectors is less immediate. In such cases, an essential designation is rendered based on the principle, introduced in the second (March 28) release, that an indus-try is essential if it manufactures “parts or equipment that supports contin-ued operations for any essential services.” For example, even if the guidance does not comment on mechanical power transmission equipment (333613),
19 Michigan is the clearest exception, since its essential list mirrored the March 19 CISA guidance, but the Governor's office explicitly said that its list was not to be revised based on subsequent CISA memoranda. Two other states, New Hampshire and Washington, also clearly derived their essential business lists from the March 19 CISA memorandum, but they neither identified CISA in their orders nor issued any update after CISA revisions. Accordingly, we did not apply subsequent CISA revisions to these states.
20 Reopening the Economy: What Are the Risks, and What Have States Done?July 2020Federal Reserve Bank of Philadelphia Research Department
input-output tables published by the Bureau of Economic Analysis (BEA) imply that nearly 60 percent of its output is sold to transportation equip-ment makers, most notably motor vehicle producers. Since the latter is essential, the former must be as well.20
Second, five states—Delaware, Minnesota, Oklahoma, Pennsylvania, and Vermont—have provided lists of NAICS industries that are essential. We treat the lists as definitive. Accordingly, none of the judgments that we make for the other states regarding essential designations are applied to this set of five states.
Third, at the state level, South Dakota has placed no restrictions on which firms may operate. For this state, all industries are classified as essential.
Fourth, 13 states—Arkansas, Georgia, Iowa, Nebraska, Nevada, New Jersey, North Dakota, Oregon, Rhode Island, South Carolina, Utah, Virginia, and Wyoming—described businesses that are nonessential. For these states, it is relatively straightforward to directly map each phrase to an individual NAICS industry. We take the union of these NAICS industries as the list of nones-sential industries, and the residual as essential industries.21
Fifth, the remaining 29 states and the District of Columbia have provided textual descriptions of essential industries. These states include Alabama, Alaska, Arizona, California, Colorado, Connecticut, Florida, Hawaii, Idaho, Illinois, Indiana, Kansas, Kentucky, Louisiana, Maine, Maryland, Massachusetts, Michigan, Mississippi, Montana, New Mexico, New Hampshire, New York, North Carolina, Ohio, Tennessee, Washington, West Virginia, and Wisconsin. In addition, in the case of a few states, the statewide order came well after orders by the largest counties within the state. The states in these cases are Alaska, Florida, Missouri, Texas, and Utah. The counties whose orders we use are the following: Anchorage, Alaska; Austin, Texas; Bexar County, Texas; Broward County, Florida; Clay County, Missouri; Dallas County, Texas; Harris County, Texas; Hillsborough County, Florida; Jackson County, Missouri; Miami-Dade County, Florida; Orange County, Florida; Salt Lake City, Utah; St. Louis County, Missouri; and Tarrant County, Texas.22 The keywords are based on our reading of each state order and are applied to all orders in order to enforce consistency. For these localities, we define lists of key-words to search for corresponding to each (usually 4-digit, but sometimes 5-digit or 6-digit) NAICS industry. For instance, for the 4-digit NAICS code corresponding to postal service (NAICS 49110), we search for the following words: “postal,” “post office,” “mail service,” “mailing service,” “mail and
20 To be exact, we used the 2012 BEA input-output tables as well as its 1997 Capital Flow table to guide our essential designations in these cases. The two sources complement one another: The input-output table identifies the buyers and sellers of intermediate inputs, whereas the Capital Flow table tracks sales through to final demand.
21 Nevada actually provided descriptions of both essential and nonessential businesses. We have used the latter, since the state explicitly ordered these businesses to close.
22 How state and county information should be combined varies state by state. In Missouri, the state has allowed localities to impose additional restrictions on industries, but not to relax restrictions that the state government has imposed. In Florida, the state's order overrides counties' initial restrictions.

21 Reopening the Economy: What Are the Risks, and What Have States Done?July 2020Federal Reserve Bank of Philadelphia Research Department
shipping,” and “mailing and shipping.”23 As a second example, for the 4-digit NAICS code corresponding to vocational rehabilitation services (NAICS 6243), we search for the following words and phrases: “delivery of human services,”
“needy individuals,” “vocational,” “job training,” “finding employment,” “disabilities,” “disabled,” and “economically disadvantaged.” If within states' descriptions of essential industries, any word/phrase from our list appears, we assign the corresponding NAICS industry to be essential.24
In addition, we include a set of keywords aimed specifically at recovering references to certain manufacturing activities. Most state orders include a section on manufacturing, but it is typically very terse. For instance, Ohio's order refers to manufacturers in “technology” and “transportation.” These words are far too imprecise to use elsewhere in the order, so we apply them only to the manufacturing section. Finally, mirroring our treatment of CISA guidance, we assign keywords to certain manufacturing and wholesale sec-tors based on what we know about the end-use of their products. To return to our example from earlier, state essential lists do not generally reference power transmission equipment even if automobile production is essential. Accordingly, we will assign keywords to the transmission equipment indus-try designed to capture references to the auto sector.
In a sixth step, we make adjustments to individual groups of industries.Certain states omit the government sector (NAICS codes beginning with a “9”) and the management sector (NAICS codes beginning with a “55”) in describing which industries are essential or nonessential. We assume that all government industry establishments are essential in each state. By the same logic, we treat primary and secondary schools (NAICS 6111) and junior colleges (NAICS 6112) as essential. Next, we treat management of companies (NAICS 55) as universally essential. This designation seemed like the most defensible, since so many sectors in their entirety—for instance, health, public utilities, financial activities, and transportation—are typically deemed essential.25 Furthermore, with slightly different phrasing, nearly all states have listed restaurants and bars (NAICS 722) as open only for takeout. With the exception of South Dakota (the only state with no initial state-level re- strictions on economic activity), we categorize these industries as nonessential.
Finally, the keyword-based approach that we had primarily followed was not applicable in a few exceptional industries. These include construction (NAICS 23), auto sales (NAICS 4411), child care (NAICS 6244), and hotels (NAICS 7211). In some cases, the orders were highly qualified and difficult to summarize in a few keywords. For instance, hotels in several states were treated as
23 Our matching allows for a certain degree of fuzziness, meaning that in our postal service example, either “courier” or “couriers” would count as a match.
24 St. Louis City, Missouri, has provided a relatively concise list of essential industries. For these indus-tries, it is relatively straightforward to directly map each phrase to an individual NAICS industry. We take the union of these NAICS industries as the list of essential industries, and the residual as nonessential industries.
25 Management contains the following three 6-digit NAICS industries: 551111 (offices of bank holding com-panies), 551112 (offices of other holding companies), and 551114 (corporate, subsidiary, and regional man-aging offices). The first two of these reference managers in banking, insurance, and public utilities, which are almost universally deemed essential. NAICS 551114 is the one for which we had to render a judgment.

22 Reopening the Economy: What Are the Risks, and What Have States Done?July 2020Federal Reserve Bank of Philadelphia Research Department
essential only if they admitted a certain cross section of tenants, including emergency health care personnel and/or COVID-19-infected residents. In other cases, the language could be highly imprecise. For these four sectors, we rely on additional sources to fill in essential designations. For construc-tion, these sources include the Journal of Light Construction and Engineering News-Record. For auto sales, we drew on information from cars.com. For child care, we used information from Child Care Aware of America and The Hunt Institute. For hotels, we searched through states' essential order lists. If states indicated that hotels may only be used for COVID-19 mitigation, then we treat hotels as if they are shut down, i.e., nonessential.