Renold plc (‘Renold’ or the...
22
1 Renold plc (‘Renold’ or the ‘Group’) Interim results for the half year ended 30 September 2017 (‘the Period’) 14 November 2017 Renold, a leading international supplier of industrial chains and related power transmission products, announces its interim results for the half year ended 30 September 2017. Financial highlights • Revenue grew 8.0% on H1 prior year; underlying 1 by 2.7% • Strong improvement in order intake, up 15.7% on H1 prior year; underlying up by 9.9% • Chain division delivered organic growth in underlying revenue of 1.9% • Machine break-downs and increased raw material costs reduced Chain division adjusted 2 operating margin to 8.0% (2016: 12.0%) • Torque Transmission division demonstrated improved performance with underlying revenue up 6.1% and adjusted operating profit increased by 100% • Continued investment in capital projects and revenue expenditure to support STEP 2020 • Leverage ratio 1.2x (0.8x at 31 March 2017; 1.3x at 30 September 2016) Financial Summary Half year ended 30 Sept 2017 £m 31 Mar 2017 £m 30 Sept 2016 £m Reported interim results Revenue 95.4 95.1 88.3 Operating profit 4.5 6.2 4.8 Underlying adjusted interim results 2 Underlying revenue 95.4 93.6 92.9 Underlying adjusted operating profit 6.0 7.4 7.6 Profit before tax 2.4 4.0 2.7 Basic earnings per share 0.8p 1.2p 0.9p Adjusted earnings per share 1.8p 2.3p 2.3p STEP 2020 strategic plan progress • Completed the final stages of the consolidation of UK Torque Transmission couplings businesses; delivering improved performance • Completed the closure of the sub-scale manufacturing facilities in China (Torque Transmission) and New Zealand (Chain); both locations now focused on sales and distribution • Commenced construction of our new Chain China factory; relocation programme on-plan • Roll-out of standard IT systems across the Group continues 1 “Underlying” adjusts prior period results to the current period exchange rates to give a like for like comparison. 2 See overleaf for reconciliation of reported, underlying and adjusted figures.
Transcript of Renold plc (‘Renold’ or the...
1
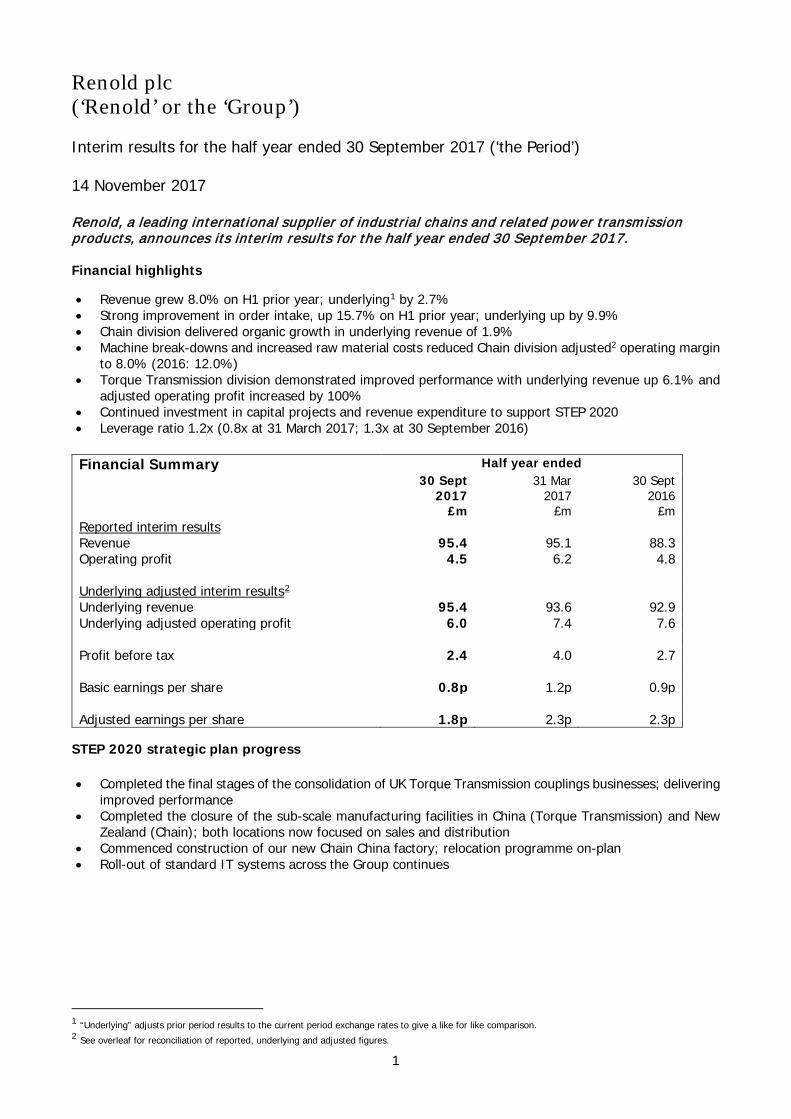
Renold plc (‘Renold’ or the ‘Group’) Interim results for the half year ended 30 September 2017 (‘the Period’) 14 November 2017 Renold, a leading international supplier of industrial chains and related power transmission products, announces its interim results for the half year ended 30 September 2017. Financial highlights • Revenue grew 8.0% on H1 prior year; underlying1 by 2.7% • Strong improvement in order intake, up 15.7% on H1 prior year; underlying up by 9.9% • Chain division delivered organic growth in underlying revenue of 1.9% • Machine break-downs and increased raw material costs reduced Chain division adjusted2 operating margin
to 8.0% (2016: 12.0%) • Torque Transmission division demonstrated improved performance with underlying revenue up 6.1% and
adjusted operating profit increased by 100% • Continued investment in capital projects and revenue expenditure to support STEP 2020 • Leverage ratio 1.2x (0.8x at 31 March 2017; 1.3x at 30 September 2016)
Financial Summary Half year ended 30 Sept
2017 £m
31 Mar 2017
£m
30 Sept 2016
£m Reported interim results Revenue 95.4 95.1 88.3 Operating profit 4.5 6.2 4.8 Underlying adjusted interim results2 Underlying revenue 95.4 93.6 92.9 Underlying adjusted operating profit 6.0 7.4 7.6 Profit before tax 2.4 4.0 2.7 Basic earnings per share 0.8p 1.2p 0.9p Adjusted earnings per share 1.8p 2.3p 2.3p
STEP 2020 strategic plan progress
• Completed the final stages of the consolidation of UK Torque Transmission couplings businesses; delivering improved performance
• Completed the closure of the sub-scale manufacturing facilities in China (Torque Transmission) and New Zealand (Chain); both locations now focused on sales and distribution
• Commenced construction of our new Chain China factory; relocation programme on-plan • Roll-out of standard IT systems across the Group continues
1 “Underlying” adjusts prior period results to the current period exchange rates to give a like for like comparison. 2 See overleaf for reconciliation of reported, underlying and adjusted figures.

2
Robert Purcell, Chief Executive of Renold plc, said: “Whilst the first half of the year was a disappointing period for profit delivery, the issues in Chain are being resolved, and we are seeing distinct signs of improvement in our end markets.
“During the period we have continued to build the commercial and operational platform from which to deliver improved performance. Our efforts are starting to bear fruit: our order intake demonstrates significant progress, and we are also seeing the benefits of our actions in the enhanced results of Torque Transmission.
“We continue to believe that our STEP 2020 strategy is the right path to deliver a more robust, higher margin business. We are confident of delivering improved performance in the second half.”
Reconciliation of reported, underlying and adjusted results
ENQUIRIES: Renold plc
Tel: 0161 498 4500
Robert Purcell, Chief Executive Ian Scapens, Group Finance Director Arden Partners Tel: 020 7614 5917 Chris Hardie Instinctif Partners Tel: 020 7457 2020 Mark Garraway Helen Tarbet Rosie Driscoll
NOTES FOR EDITORS Renold is a global leader in the manufacture of industrial chains and also manufactures a range of torque transmission products which are sold throughout the world to a broad range of original equipment manufacturers, end users and distributors. The Company has a well-deserved reputation for quality that is recognised worldwide. Its products are used in a wide variety of industries including manufacturing, transportation, energy, steel and mining. Further information about Renold can be found on the website at: www.renold.com
Revenue Operating Profit
H1 2017/18
£m
H2 2016/17
£m
H1 2016/17
£m
H1 2017/18
£m
H2 2016/17
£m
H1 2016/17
£m
Reported 95.4 95.1 88.3 4.5 6.2 4.8
Exchange impact - (1.5) 4.6 - (0.1) 0.6
Underlying 95.4 93.6 92.9 4.5 6.1 5.4
Exceptional items - - - 0.6 0.3 1.4
Pension administration costs - - - 0.4 0.4 0.3
Amortisation of acquired intangible assets - - - 0.5 0.6 0.5
Underlying adjusted 95.4 93.6 92.9 6.0 7.4 7.6

3
Chief Executive’s Statement The first half of the year was a disappointing period for profit delivery. Good progress has been made in developing the Group’s commercial capabilities, positioning the Group to benefit from improving market conditions. Underlying revenue grew by 2.7% compared to the first half of the prior year. This growth delivered the expected profit improvement in the Torque Transmission division where underlying adjusted operating profit doubled to £2.4m. However, raw material price increases and costs related to machine break-downs resulted in reduced profitability in the Chain division. As a result, the Group’s underlying adjusted operating profit reduced to £6.0m (2016: £7.6m). Despite these challenges, which we believe to be short-term in nature, we continue to make progress in executing our strategy and the fundamentals of that strategy remain unchanged. Improving order intake combined with the benefits of the implemented sales price increases and increasing output at Einbeck, Germany give confidence for an improved performance in the second half. Strategic Plan Progress Review Phase 1 – ‘Restructuring’ In the latter part of the prior year, we merged our UK Couplings manufacturing operations to a single facility in Cardiff. The consolidated business has been operating from the single location from the start of the financial year and is a key element in the improved trading performance of Torque Transmission. Order intake remains strong, and the decision to focus manufacturing in one location, justifying investment in state-of-the-art production equipment, has been well received by key customers. At the year end, we announced the closure of the sub-scale Torque Transmission manufacturing facility in China, which completed in the early months of the current financial year. More recently, we have closed the Chain division’s manufacturing operations in New Zealand, which largely manufactured non-core, non-chain products. Again, this was a sub-scale manufacturing unit. We retain a strong sales presence in the New Zealand market with technical and sales capability in territory, supported by our manufacturing facilities in Australia and South-East Asia. We previously set out plans to relocate our Chinese chain manufacturing facility to a purpose-built facility near Changzhou in Jiangsu province. This is a significant factory move which will take around 18 months to two years to complete. During the period, having received all required licenses and approvals, we commenced construction. The project remains on plan, with the new facility expected to open towards the end of the year ending 31 March 2019. Phase 2 – ‘Organic Growth’ During the Period, we have delivered organic growth across both our Chain and Torque Transmission divisions. We have been investing in the development of our commercial and sales teams and this is now delivering positive results with underlying order intake growth of 9.9% in the period. In Chain, organic growth has been achieved in all geographic regions other than Australasia which continues to experience reduced demand from mining and associated industries. A product and sector focus for the commercial teams is delivering results, particularly in Europe and the Americas. In Torque Transmission, organic growth is largely coming from UK Couplings. In the period, UK Couplings won a major multi-year order from the marine industry, which will generate revenue in future periods. Other Torque Transmission units are experiencing more stable revenues, although there are some promising order trends, particularly in the US. Phase 3 – ‘Acquisitions’ We have outlined three types of acquisition that are strategically attractive:
• New products or sectors – expanding Renold’s reach into new customers • New geographies – providing a platform for existing products into new territories • Consolidation – to improve performance through consolidation of manufacturing activities
In the early years of STEP 2020 we deliberately adopted an opportunistic approach to acquisitions. The acquisition of the Tooth Chain business in January 2016 was such a transaction.

4
The global chain market remains fragmented and Renold is well placed to become a market consolidator. We continue to seek and review acquisition opportunities on a proactive basis and have employed a corporate development director to accelerate our work in this area. Business and Financial Review Group Results
Trading performance in the period was mixed. Underlying revenue improved and was supported by underlying order intake which was ahead compared with the same period in the prior year. However, cost increases in the Chain division, arising as a result of raw material costs and machine break-downs, were a drag on profitability and underlying adjusted operating profit declined to £6.0m in the period (2016: £7.6m). Reported revenue was up 8.0% (£7.1m), benefitting from foreign exchange movements between half years. Underlying revenue increased 2.7% (£2.5m) in the Period through organic growth in both the Chain and Torque Transmission divisions. Order intake in the period grew by 15.7% (9.9% on an underlying basis). Order intake includes a large multi-year order won by UK Couplings in the period. Excluding the element of this order which extends beyond the current financial year, underlying order intake increased by 6.1%. On the same basis, the book to bill ratio for the period was 104% (that is, order intake in the period was 4% higher than revenue) which suggests revenue in the second half may see some improvement. Despite the improved revenue performance, underlying adjusted operating profit declined by £1.6m to £6.0m (2016: £7.6m), with the decline largely a result of increased costs from raw material price increases and costs incurred in mitigating the impact of machine break-downs. Chain Revenue in the Chain division improved with underlying revenue up 1.9% (£1.4m) to £76.3m. Strong underlying order intake through the second half of the prior year supported underlying revenue growth of 8.2% in the first quarter of the current financial year. However, major machine break-downs at our Einbeck, Germany facility in the second quarter of the year temporarily reduced manufacturing capacity, resulting in reduced availability of key lines. Underlying revenue declined by 4.5% (£1.8m) in the second quarter of the year. Across the period as a whole, regional performance was mixed. Underlying revenue increased in Europe and the Americas, with both experiencing stronger growth in the first quarter, with reduced product availability in the second quarter having a negative impact on revenue. Underlying sales declined in Australasia in the period, most notably in Australia, where order intake has remained slow. China and India both experienced growth in underlying revenue, with China’s growth coming from both the domestic market and from demand in other Renold regions. Whilst the Chain division delivered growth in revenue, cost increases have resulted in a fall in underlying adjusted operating profit which declined to £6.1m (2016: £9.0m). These cost increases have arisen in two key areas. The Chain division experienced sustained increases in raw material costs, notably in respect of steel, and sales price increases have been implemented to pass on these cost increases. Due to the time lag in negotiating these increases and for new orders at the increased rates to pass through the order book, the benefit was limited in the first half.
Underlying Revenue Underlying Adjusted Operating Profit
Adjusted Operating Margin
First half year 2017/18
£m 2016/17
£m 2017/18
£m 2016/17
£m 2017/18
% 2016/17
%
Chain 76.3 74.9 6.1 9.0 8.0 12.0
Torque Transmission 19.1 18.0 2.4 1.2 12.6 6.7
Head office costs - - (2.5) (2.6) - -
Total 95.4 92.9 6.0 7.6 6.3 8.2

5
The second area of cost increases relates to the actions taken by the business to mitigate the impact of the machine break-downs on key customers. This included increased maintenance costs and higher levels of shipping costs as air-freight was used to reduce disruption to customer supply. Despite the production issues, underlying order intake strengthened during the second quarter of the year, growing at 9.0%, resulting in an overall growth for the first half of the year of 5.3% and a book to bill ratio for the Chain division of 102%. The increasing order book positions the division for revenue growth in the second half of the year, combining with margin improvements following the actions taken to address the cost issues impacting the first half results. Torque Transmission Trading improved as expected for the Torque Transmission division, sustaining the improved performance delivered in the second half of the prior year. Underlying revenue increased by 6.1% to £19.1m from £18.0m in the prior year, with the growth being delivered by the merged UK Couplings business unit. The other business units were broadly unchanged from the prior year. Underlying order intake increased by 27.4%, and benefited from the win of a major multi-year order for UK Couplings to provide large Hi-Tec couplings for marine applications. Excluding the element of this order which extends beyond the current financial year, underlying order intake for the period increased by 9.1%, with a corresponding book to bill ratio of 113%. This level of order intake strongly positions the division for further organic growth in the second half of the year and arises not only in UK Couplings, but encouragingly, in our US Torque Transmission business which has suffered from low order levels for a sustained period of time reflecting US energy market conditions. Underlying operating profit margin increased from 6.7% to 12.6% as the operating profit benefit from the revenue growth in UK Couplings combined with cost reductions. Exceptional items During the period, we completed the final elements of the transfer of Halifax operations to Cardiff, to form the UK Couplings business unit. We also closed and transferred the manufacturing element of the China Torque Transmission operations. As these programmes were both announced prior to 31 March 2017, the expected costs were charged to the profit and loss account in 2016/17, although a significant element of the cash cost (£0.8m) was incurred in the first half of the current year. Additional costs of £0.1m were charged in the income statement in the first half of the year as these projects were finalised. Following the closure of the Halifax site, the property was sold in June 2017 for net proceeds of £0.5m resulting in a gain on disposal of £0.2m. The early stages of our programme to move our chain factory in China incurred £0.4m of exceptional costs in the first half of the year. Various other smaller levels of costs were incurred, the largest of which was £0.1m relating to the closure of manufacturing operations in New Zealand. The total exceptional charges of £0.6m (2016: £1.4m) are detailed further in Note 4 to the Interim Financial Statements.

6
Cash Flow and Net Debt
Cash of £1.4m was generated by operations before legacy pension costs. Net debt in the period since 31 March 2017 increased by £8.6m. This is a £0.2m reduction from the position at 30 September 2017. Payments of tax increased in the period as German tax losses are now fully utilised, resulting in increased payments of prior year taxes in addition to increases in payments on account for the current year. The largest element of movement in provisions is the cash payments of exceptional costs of £1.3m relating to the closure of the Halifax and China Torque Transmission facilities which were charged to the income statement in the year to 31 March 2017. Capital expenditure increased to £6.4m, which includes £2.3m to acquire the land for the new factory in China and £1.8m of payments for capital creditors outstanding at 31 March 2017. Net debt reduced by £0.2m to £26.0m at 30 September 2017, representing a leverage ratio of 1.2x (0.8x at 31 March 2017; 1.3x at 30 September 2016). In the period since 30 September 2017, we have exercised the accordion facility on our Multi-Currency Revolving Credit Facility. The facility has increased to £61.5m with HSBC joining our existing lender syndicate of Lloyds and Handelsbanken. The increased facility creates additional headroom for opportunistic acquisitions as and when they arise. Pensions The Group has a number of defined benefit pension schemes (accounted for in accordance with IAS 19 Employee benefits). The Group’s retirement benefit obligations decreased from £102.0m (£84.8m net of deferred tax) at 31 March 2017 to £100.9m (£83.8m net of deferred tax) at 30 September 2017. The main reason for the change was the increase in UK corporate bond yields which have in turn led to higher discount rates being applied to future pension liabilities. The discount rate applied to the UK scheme was 2.6% (30 March 2017: 2.5%). The decrease in future liabilities arising from the increased discount rate was partially offset by an increase in the inflation rate applied, which increased from 2.2% at 31 March 2017 to 2.3% at 30 September 2017.
Half year to 30 September 2017/18
£m 2016/17
£m
Adjusted operating profit 6.0 7.0
Add back depreciation and amortisation 3.5 3.1
Adjusted EBITDA 9.5 10.1
Net working capital movement (2.3) (2.6)
Pension cash costs (3.0) (3.1)
Movements in provisions (1.7) (0.4)
Income taxes paid (3.4) (0.5)
Other operating cash flows (0.7) (1.5)
Net cash flow from operating activities (1.6) 2.0
Capital expenditure net of disposal proceeds (5.9) (3.6)
Deferred consideration paid for acquisition (0.5) -
Net financing costs (0.7) (0.7)
Other net impacts on net debt (0.1) -
Impact of foreign exchange 0.2 (0.4)
Change in net debt (8.6) (2.7)
Net debt (Note 11) (26.0) (26.2)

7
US discount rates experienced a fall in the Period from 3.8% at 31 March 2017 to 3.55% at 30 September 2017. The impact of the fall in US discount rates was partially offset by strong asset performance and exchange gains as a result of the strengthening of Sterling against the US dollar. The aggregate expense of administering the pension schemes was £0.4m (2016: £0.3m) which is included in operating costs but is excluded in arriving at adjusted operating profit as it relates to closed legacy pension schemes which bear no relation to the ongoing business and its performance. The net financing expense (a non-cash item) on pension scheme balances was £1.2m (2016: £1.3m). It is similarly excluded when calculating adjusted EPS. Dividend In light of the continuing investment in capital and revenue expenditure to improve the performance of the business, the Board has decided not to declare an interim dividend. The dividend policy will remain under review as margin and cash flow performance continue to develop. Going concern The directors have a reasonable expectation that the business has adequate resources to continue in operational existence for the foreseeable future. Thus, they continue to adopt the going concern basis in preparing the condensed consolidated interim financial information. Risks and uncertainties The principal risks and uncertainties affecting the business activities of the Group, as well as the risk mitigating controls put in place, remain those detailed in the 2016/17 Annual Report and Accounts. These include macro-economic and political uncertainty risks as well as various risks relating to Group treasury activities. Key operational risks are raw material prices and other input cost prices. During the period, foreign exchange rates have continued to be volatile, but have operated in a smaller range than in the prior year. The significant step change in foreign exchange rates following the weakening of Sterling after the Brexit vote in the prior year has had a favourable translation impact on Group revenue and a similar impact on operating profit when compared to the same period in the prior year. As the step change in rates occurred in the first half of the prior year, with rates more stable since then, the translation effect is expected to be significantly reduced for the second half of the year. The valuation of retirement benefit obligations can be significantly impacted by changes to the market based yields on corporate bonds and inflation prospects. The schemes investment strategies provide a partial hedge against these risks, and other de-risking strategies are employed where sensible. However, it should be noted that the actual cash flows to support the pension scheme are more stable and subject to long term funding plans which are reviewed every three years. The next triennial valuation for the UK scheme will take place with an effective date of 5 April 2019. Outlook Increasing levels of order intake and strengthening book to bill ratios across both the Chain and Torque Transmission divisions in the first half of the year provide the platform for improving performance during the second half. Specific factors impacted upon profitability in the Chain division during the first half of the year. These factors are being addressed. Sales price increases have been implemented to off-set the effects of sustained higher raw material costs and are visible for future orders. Production output from our Einbeck facility has been improving progressively following the machine breakdowns, increasing availability of product and reducing overdue orders. As a result, we expect margins in the Chain division to improve over the second half of the year. The Torque Transmission division continues to make progress, exhibiting strong growth over the first half of the prior year. Whilst levels of growth are expected to moderate, reflecting a stronger second half comparator, improving order intake supports continued growth through the second half.

8
The adjusted operating margin delivered in the first half of the year was a disappointment. However, the issues were short-term in nature and the actions to correct them are being implemented. We continue to make progress on the STEP 2020 programme and the benefits of the Organic Growth phase are starting to be delivered. We continue to believe that the STEP 2020 strategy is the correct approach to delivering a more robust, higher margin business. We are confident of delivering improved performance in the second half. Statement of directors’ responsibilities The directors confirm that to the best of their knowledge:
• the condensed set of financial statements has been prepared in accordance with IAS 34 Interim Financial Reporting as adopted by the European Union;
• the interim management report includes a fair review of the information required by:
(a) DTR 4.2.7R of the Disclosure and Transparency Rules, being an indication of important
events that have occurred during the first six months of the financial year and their impact on the condensed set of interim financial statements; and a description of the principal risks and uncertainties for the remaining six months of the year; and
(b) DTR 4.2.8R of the Disclosure and Transparency Rules, being related party transactions that
have taken place in the first six months of the current financial year and that have materially affected the financial position or performance of the Group during that period; and any changes in the related party transactions described in the last annual report that could do so.
The directors of Renold plc are listed in the Annual Report for the year ended 31 March 2017. A list of current directors is maintained on the Group website at www.renold.com. By order of the Board Robert Purcell Ian Scapens Chief Executive Finance Director 14 November 2017 14 November 2017

9
Consolidated Statement of Comprehensive Income for the six months ended 30 September 2017
First half 2017/18 (unaudited) First half 2016/17 (unaudited) Full year 2016/17 (audited)
Note Statutory Adjustments Adjusted Statutory Adjustments Adjusted Statutory Adjustments Adjusted
£m £m £m £m £m £m £m £m £m
Revenue 3 95.4 - 95.4 88.3 - 88.3 183.4 - 183.4
Operating costs (90.9) 1.5 (89.4) (83.5) 2.2 (81.3) (172.4) 3.5 (168.9)
Operating profit 4.5 1.5 6.0 4.8 2.2 7.0 11.0 3.5 14.5
Operating profit is analysed as:
Before adjusting items 4.5 - 4.5 4.8 - 4.8 11.0 - 11.0
Exceptional costs 4 - 0.6 0.6 - 1.4 1.4 - 1.7 1.7
Amortisation of acquired intangible assets - 0.5 0.5 - 0.5 0.5 - 1.1 1.1
Pension administration costs - 0.4 0.4 - 0.3 0.3 - 0.7 0.7
Operating profit 4.5 1.5 6.0 4.8 2.2 7.0 11.0 3.5 14.5
Financing costs (0.8) - (0.8) (0.7) - (0.7) (1.7) - (1.7)
Net IAS 19 financing costs (1.2) 1.2 - (1.3) 1.3 - (2.5) 2.5 -
Discount on provisions (0.1) 0.1 - (0.1) 0.1 - (0.1) 0.1 -
Net financing costs 5 (2.1) 1.3 (0.8) (2.1) 1.4 (0.7) (4.3) 2.6 (1.7)
Profit before tax 2.4 2.8 5.2 2.7 3.6 6.3 6.7 6.1 12.8
Taxation 6 (0.6) (0.5) (1.1) (0.6) (0.5) (1.1) (1.9) (0.4) (2.3)
Profit for the period 1.8 2.3 4.1 2.1 3.1 5.2 4.8 5.7 10.5
Earnings per share (pence) 7
Basic 0.8p 1.0p 1.8p 0.9p 1.4p 2.3p 2.1p 2.5p 4.6p
Diluted 0.8p 1.0p 1.8p 0.9p 1.4p 2.3p 2.1p 2.5p 4.6p

10
Consolidated Statement of Comprehensive Income for the six months ended 30 September 2017
First half 2017/18 (unaudited) First half 2016/17 (unaudited) Full year 2016/17 (audited)
Note Statutory Adjustments Adjusted Statutory Adjustments Adjusted Statutory Adjustments Adjusted
Other comprehensive income/(expense): £m £m £m £m £m £m £m £m £m
Items that may be reclassified to the income statement in subsequent periods:
Net gain/(loss) on cash flow hedges 0.1 - 0.1 (0.1) - (0.1) - - -
Foreign exchange translation differences (4.2) - (4.2) 7.5 - 7.5 9.8 - 9.8
Foreign exchange differences on loans hedging the net investment in foreign operations
0.5 - 0.5
(0.6) - (0.6)
(0.9) - (0.9)
(3.6) - (3.6) 6.8 - 6.8 8.9 - 8.9
Items not to be reclassified to the income statement in subsequent periods:
Re-measurement gain/(losses) on retirement benefit obligations
0.3 - 0.3
(28.4) - (28.4)
(19.0) - (19.0)
Tax on re-measurement (gains)/losses on retirement benefit obligations
(0.5) - (0.5)
4.0 - 4.0
2.1 - 2.1
(0.2) - (0.2) (24.4) - (24.4) (16.9) - (16.9)
Other comprehensive income/(expense) for the period, net of tax
(3.8) - (3.8)
(17.6) - (17.6)
(8.0) - (8.0)
Total comprehensive income/(expense) for the period, net of tax
(2.0) 2.3 0.3
(15.5) 3.1 (12.4)
(3.2) 5.7 2.5
Attributable to:
Owners of the parent (2.0) 2.3 0.3 (15.5) 3.1 (12.4) (3.2) 5.7 2.5
Non-controlling interests - - - - - - - - -
(2.0) 2.3 0.3 (15.5) 3.1 (12.4) (3.2) 5.7 2.5

11
Condensed Consolidated Statement of Financial Position as at 30 September 2017
Note 30 September 2017
(unaudited) £m
30 September 2016
(unaudited) £m
31 March 2017
(audited) £m
Assets Non-current assets
Goodwill 24.7 25.0 26.4 Other intangible fixed assets 9.1 10.0 9.7 Property, plant and equipment 48.2 48.6 47.2 Deferred tax assets 20.3 21.7 20.9 102.3 105.3 104.2 Current assets Inventories 40.7 41.2 40.4 Trade and other receivables 38.1 34.1 36.8 Derivative financial instruments 0.1 - - Cash and cash equivalents 11 9.5 10.2 16.4 88.4 85.5 93.6 Non-current asset classified as held for sale - 1.0 0.3 88.4 86.5 93.9 Total assets 190.7 191.8 198.1 Liabilities Current liabilities Borrowings 11 (2.2) (0.7) (0.8) Trade and other payables (40.9) (39.3) (41.9) Current tax (1.3) (2.1) (4.2) Derivative financial instruments - (0.1) (0.1) Provisions (2.4) (3.1) (3.6) (46.8) (45.3) (50.6) Net current assets 41.6 41.2 43.3 Non-current liabilities Borrowings 11 (32.8) (35.2) (32.5) Preference stock 11 (0.5) (0.5) (0.5) Trade and other payables (0.1) (0.2) (0.3) Deferred tax liabilities (0.3) (0.4) (0.3) Retirement benefit obligations 8 (100.9) (112.4) (102.0) Provisions (3.6) (2.8) (4.1) (138.2) (151.5) (139.7) Total liabilities (185.0) (196.8) (190.3) Net assets /(liabilities) 5.7 (5.0) 7.8 Equity Issued share capital 12 11.3 26.7 26.7 Share premium 30.1 29.9 30.1 Currency translation reserve 8.5 10.2 12.2 Capital reserve 15.4 - - Other reserves 1.1 0.9 1.0 Retained earnings (63.4) (75.4) (64.9) Equity attributable to owners of the parent 3.0 (7.7) 5.1 Non-controlling interests 2.7 2.7 2.7 Total shareholders’ equity 5.7 (5.0) 7.8
12
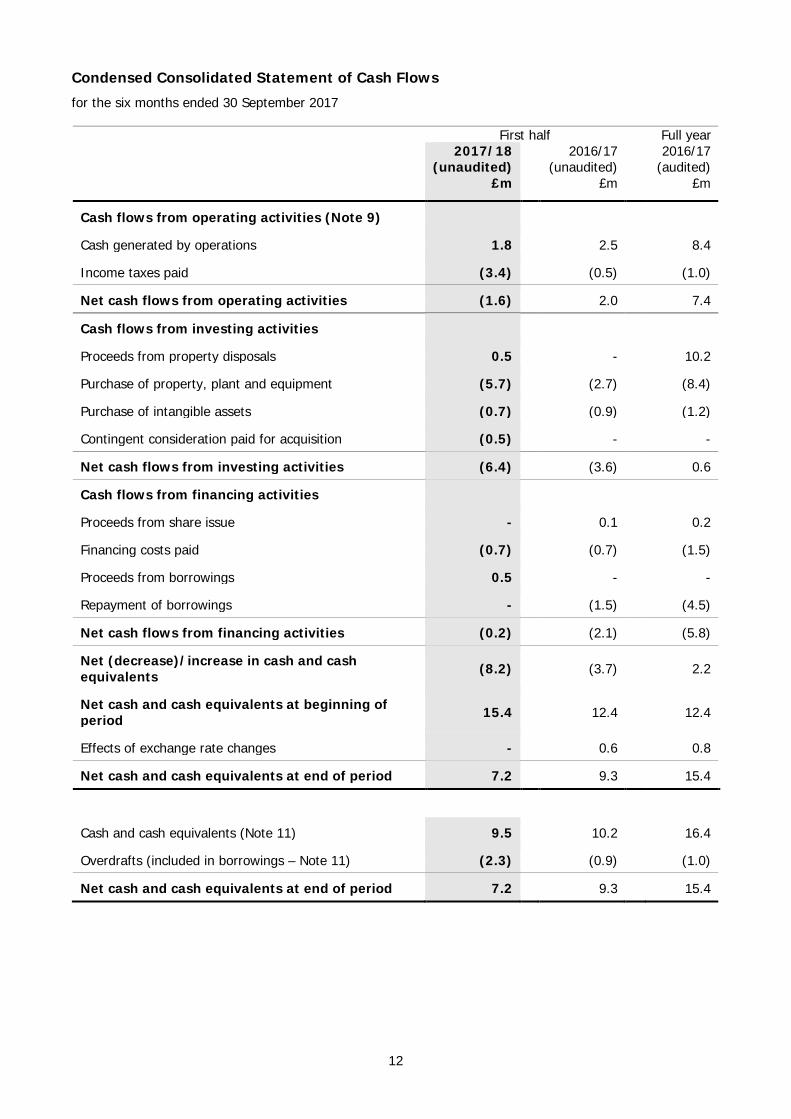
Condensed Consolidated Statement of Cash Flows for the six months ended 30 September 2017
First half Full year
2017/18 (unaudited)
£m
2016/17 (unaudited)
£m
2016/17 (audited)
£m
Cash flows from operating activities (Note 9)
Cash generated by operations 1.8 2.5 8.4
Income taxes paid (3.4) (0.5) (1.0)
Net cash flows from operating activities (1.6) 2.0 7.4
Cash flows from investing activities
Proceeds from property disposals 0.5 - 10.2
Purchase of property, plant and equipment (5.7) (2.7) (8.4)
Purchase of intangible assets (0.7) (0.9) (1.2)
Contingent consideration paid for acquisition (0.5) - -
Net cash flows from investing activities (6.4) (3.6) 0.6
Cash flows from financing activities
Proceeds from share issue - 0.1 0.2
Financing costs paid (0.7) (0.7) (1.5)
Proceeds from borrowings 0.5 - -
Repayment of borrowings - (1.5) (4.5)
Net cash flows from financing activities (0.2) (2.1) (5.8)
Net (decrease)/increase in cash and cash equivalents (8.2) (3.7) 2.2
Net cash and cash equivalents at beginning of period 15.4 12.4 12.4
Effects of exchange rate changes - 0.6 0.8
Net cash and cash equivalents at end of period 7.2 9.3 15.4
Cash and cash equivalents (Note 11) 9.5 10.2 16.4
Overdrafts (included in borrowings – Note 11) (2.3) (0.9) (1.0)
Net cash and cash equivalents at end of period 7.2 9.3 15.4

13
Condensed Consolidated Statement of Changes in Equity for the six months ended 30 September 2017
Share capital
£m
Share premium account
£m
Retained earnings
£m
Currency translation
reserve
£m
Capital reserve
£m
Other reserves
£m
Attributable to equity
holders of parent
£m
Non-controlling
interests
£m
Total equity
£m
Balance at 1 April 2016 26.6 29.9 (53.0) 3.3 - 1.0 7.8 2.7 10.5
Profit for the year - - 4.8 - - - 4.8 - 4.8
Other comprehensive income/(expense) - - (16.9) 8.9 - - (8.0) - (8.0)
Total comprehensive income/(expense) for the year - - (12.1) 8.9 - - (3.2) - (3.2)
Proceeds from share issue 0.1 0.2 - - - - 0.3 - 0.3 Employee share options: - value of employee services - - 0.2 - - - 0.2 - 0.2
Balance at 31 March 2017 26.7 30.1 (64.9) 12.2 - 1.0 5.1 2.7 7.8
Profit for the period - - 1.8 - - - 1.8 - 1.8
Other comprehensive income/(expense) - - (0.2) (3.7) - 0.1 (3.8) - (3.8)
Total comprehensive income/(expense) for the period - - 1.6 (3.7) - 0.1 (2.0) - (2.0)
Reclassification for cancellation of deferred shares (15.4) - - - 15.4 - - - - Employee share options: - value of employee services - - (0.1) - - - (0.1) - (0.1)
Balance at 30 September 2017 11.3 30.1 (63.4) 8.5 15.4 1.1 3.0 2.7 5.7
Balance at 1 April 2016 26.6 29.9 (53.0) 3.3 - 1.0 7.8 2.7 10.5
Profit for the period - - 2.1 - - - 2.1 - 2.1
Other comprehensive income/(expense) - - (24.4) 6.9 - (0.1) (17.6) - (17.6)
Total comprehensive income/(expense) for the period - - (22.3) 6.9 - (0.1) (15.5) - (15.5)
Proceeds from share issue 0.1 - - - - - 0.1 - 0.1 Employee share options: - value of employee services - - (0.1) - - - (0.1) - (0.1)
Balance at 30 September 2016 26.7 29.9 (75.4) 10.2 - 0.9 (7.7) 2.7 (5.0)

14
Notes to the Interim Condensed Consolidated Financial Statements
1. Corporate information The interim condensed consolidated financial statements for the six months to 30 September 2017 were approved by the Board on 14 November 2017. These statements have not been audited or reviewed by the Group’s auditor pursuant to the Auditing Practices Board guidance on the Review of Interim Financial Information. Renold plc is a limited liability company, incorporated and registered under the laws of England and Wales, whose shares are publicly traded. The principal activities of the Company and its’ subsidiaries are described in Note 3 and the performance in the half year is set out in the Interim Management Report. These interim condensed consolidated financial statements do not constitute statutory accounts of the Group within the meaning of Section 434 of the Companies Act 2006. The statutory accounts for the year ended 31 March 2017 have been filed with the Registrar of Companies. The auditor’s report on those accounts was unqualified, did not contain an emphasis of matter paragraph and did not contain any statement under Section 498(2) or Section 498(3) of the Companies Act 2006. 2. Accounting policies Basis of preparation The interim condensed consolidated financial statements for the six months ended 30 September 2017 have been prepared in accordance with the Disclosure and Transparency Rules of the Financial Services Authority and with IAS 34 “Interim Financial Reporting” as adopted by the European Union. It does not include all of the information and disclosures required in the annual consolidated financial statements, and should be read in conjunction with the Group’s annual consolidated financial statements for the year ended 31 March 2017. The accounting policies, presentation and methods of computation applied by the Group in these interim condensed consolidated financial statements are the same as those applied in the Group’s latest audited annual consolidated financial statements for the year ended 31 March 2017. Significant accounting judgements, estimates and assumptions The preparation of these interim condensed consolidated financial statements, the significant judgements made by management in applying the Group’s accounting policies and the key sources of estimation uncertainty were of the same type as those applied to the annual consolidated financial statements for the year ended 31 March 2017, namely;
• assumptions used to evaluate the potential impairment of non-financial assets; • recognition and valuation of deferred tax assets; and • assumptions used in the valuation of retirement benefit obligations.
Financial risk management The Group’s financial risk management objectives and policies are consistent with those disclosed in the consolidated financial statements for the year ended 31 March 2017.
15
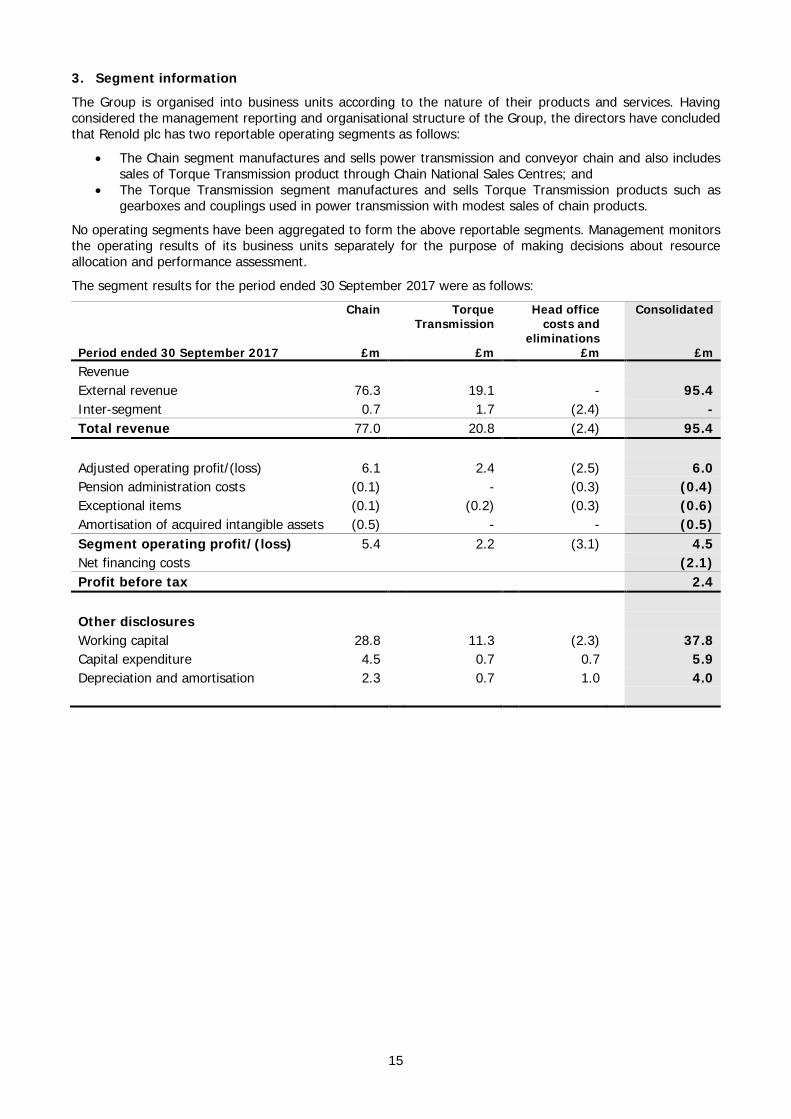
3. Segment information The Group is organised into business units according to the nature of their products and services. Having considered the management reporting and organisational structure of the Group, the directors have concluded that Renold plc has two reportable operating segments as follows:
• The Chain segment manufactures and sells power transmission and conveyor chain and also includes sales of Torque Transmission product through Chain National Sales Centres; and
• The Torque Transmission segment manufactures and sells Torque Transmission products such as gearboxes and couplings used in power transmission with modest sales of chain products.
No operating segments have been aggregated to form the above reportable segments. Management monitors the operating results of its business units separately for the purpose of making decisions about resource allocation and performance assessment. The segment results for the period ended 30 September 2017 were as follows: Period ended 30 September 2017
Chain
£m
Torque Transmission
£m
Head office costs and
eliminations £m
Consolidated
£m Revenue External revenue 76.3 19.1 - 95.4 Inter-segment 0.7 1.7 (2.4) - Total revenue 77.0 20.8 (2.4) 95.4 Adjusted operating profit/(loss) 6.1 2.4 (2.5) 6.0 Pension administration costs (0.1) - (0.3) (0.4) Exceptional items (0.1) (0.2) (0.3) (0.6) Amortisation of acquired intangible assets (0.5) - - (0.5) Segment operating profit/(loss) 5.4 2.2 (3.1) 4.5 Net financing costs (2.1) Profit before tax 2.4 Other disclosures Working capital 28.8 11.3 (2.3) 37.8 Capital expenditure 4.5 0.7 0.7 5.9 Depreciation and amortisation 2.3 0.7 1.0 4.0

16
The segment results for the period ended 30 September 2016 were as follows: Period ended 30 September 2016
Chain
£m
Torque Transmission
£m
Head office costs and
eliminations £m
Consolidated
£m Revenue External revenue 71.1 17.2 - 88.3 Inter-segment 0.1 2.3 (2.4) - Total revenue 71.2 19.5 (2.4) 88.3 Adjusted operating profit/(loss) 8.4 1.2 (2.6) 7.0 Pension administration costs - - (0.3) (0.3) Exceptional items (0.8) (0.6) - (1.4) Amortisation of acquired intangible assets (0.5) - - (0.5) Segment operating profit/(loss) 7.1 0.6 (2.9) 4.8 Net financing costs (2.1) Profit before tax 2.7 Other disclosures Working capital 29.5 10.0 (3.7) 35.8 Capital expenditure 1.8 1.0 0.8 3.6 Depreciation and amortisation 2.1 0.6 0.9 3.6
The Board also reviews the performance of the business using information presented at consistent exchange rates. The prior year results have been restated using this year’s exchange rates as follows:
Period ended 30 September 2016
Chain
£m
Torque Transmission
£m
Head office costs and
eliminations £m
Consolidated
£m Revenue External revenue 71.1 17.2 - 88.3 Foreign exchange 3.8 0.8 - 4.6 Underlying external sales 74.9 18.0 - 92.9 Adjusted operating profit/(loss) 8.4 1.2 (2.6) 7.0 Foreign exchange 0.6 - - 0.6 Underlying adjusted profit/(loss) 9.0 1.2 (2.6) 7.6

17
The segment results for the year ended 31 March 2017 were as follows: Year ended 31 March 2017
Chain
£m
Torque Transmission
£m
Head office costs and
eliminations £m
Consolidated
£m Revenue External revenue 146.1 37.3 - 183.4 Inter-segment 0.3 4.1 (4.4) - Total revenue 146.4 41.4 (4.4) 183.4 Adjusted operating profit/(loss) 16.6 3.9 (6.0) 14.5 Pension administration costs - - (0.7) (0.7) Exceptional items 1.5 (3.1) (0.1) (1.7) Amortisation of acquired intangible assets (1.1) - - (1.1) Operating profit/(loss) 17.0 0.8 (6.8) 11.0 Net financing costs (4.3) Profit before tax 6.7 Other disclosures Working capital 26.5 10.0 (1.5) 35.0 Capital expenditure 5.8 4.0 1.1 10.9 Depreciation and amortisation 4.9 1.2 1.8 7.9
The prior year results have been restated using this year’s exchange rates as follows: Year ended 31 March 2017
Chain
£m
Torque Transmission
£m
Head office costs and
eliminations £m
Consolidated
£m Revenue External sales 146.1 37.3 - 183.4 Foreign exchange 2.7 0.4 - 3.1 Underlying external sales 148.8 37.7 - 186.5 Adjusted operating profit/(loss) 16.6 3.9 (6.0) 14.5 Foreign exchange 0.5 - - 0.5 Underlying adjusted operating profit/(loss) 17.1 3.9 (6.0) 15.0

18
4. Adjusting and exceptional items
First half Full year 2017/18
£m 2016/17
£m 2016/17
£m Included in operating costs: STEP 2020 restructuring costs 0.6 1.2 4.3 Acquisition costs – Renold Tooth Chain - 0.2 0.3 Net gain on sale of Australian property - - (2.9) Exceptional items 0.6 1.4 1.7 Pension administration costs 0.4 0.3 0.7 Amortisation of acquired intangible assets 0.5 0.5 1.1 Adjusting items 1.5 2.2 3.5
First half Full year 2017/18
£m 2016/17
£m 2016/17
£m Included in net financing costs: Discount unwind on onerous lease provision 0.1 0.1 0.1 Net IAS 19 financing costs 1.2 1.3 2.5 1.3 1.4 2.6
Various restructuring costs were incurred in the period as part of the STEP 2020 Strategic Plan. Redundancy and restructuring costs of £0.1m were incurred finalising the transfer of the HiTec Couplings business from the Halifax facility to the existing facility in Cardiff. This enabled the sale in June 2017 of the Halifax facility for net proceeds of £0.5m resulting in a gain on disposal of £0.2m. Also in the period, £0.4m was incurred in relation to the multi-year project to transfer the China Chain manufacturing facility to a purpose-built facility in Jintan, near Changzhou. Additional exceptional costs of £0.3m have also been incurred including redundancies and moving costs as the business continues the restructuring of our operating footprint in line with the STEP 2020 Strategic Plan. Prior year exceptional costs As part of the acquisition of the Renold Tooth Chain business completed in 2015/16, the Group was obliged to pay for some transitional services provided by the Seller’s Group until the business migrated to Renold IT systems. Costs of £0.3m were incurred until migration was completed in December 2016 and have now ceased. Prior year STEP 2020 redundancy and restructuring costs of £4.3m included costs of £0.4m in relation to the multi year China relocation project (see above), £2.5m incurred transferring the HiTec Couplings business (see above), £0.6m incurred for the closure of the China Couplings facility with manufacturing moving to Cardiff and South Africa and £0.6m incurred for the relocation of the European distribution centre from Lille, France to Uslar, Germany. Additional STEP 2020 restructuring costs of £0.2m were incurred in the year. Also in the prior year, a £2.9m gain on disposal was recognised following the sale of the Mulgrave manufacturing facility in Australia for net proceeds of £9.3m. As part of the sale agreement, Renold can remain as a tenant and retain full use of the facility until March 2020 at which point the property must be vacated.
19
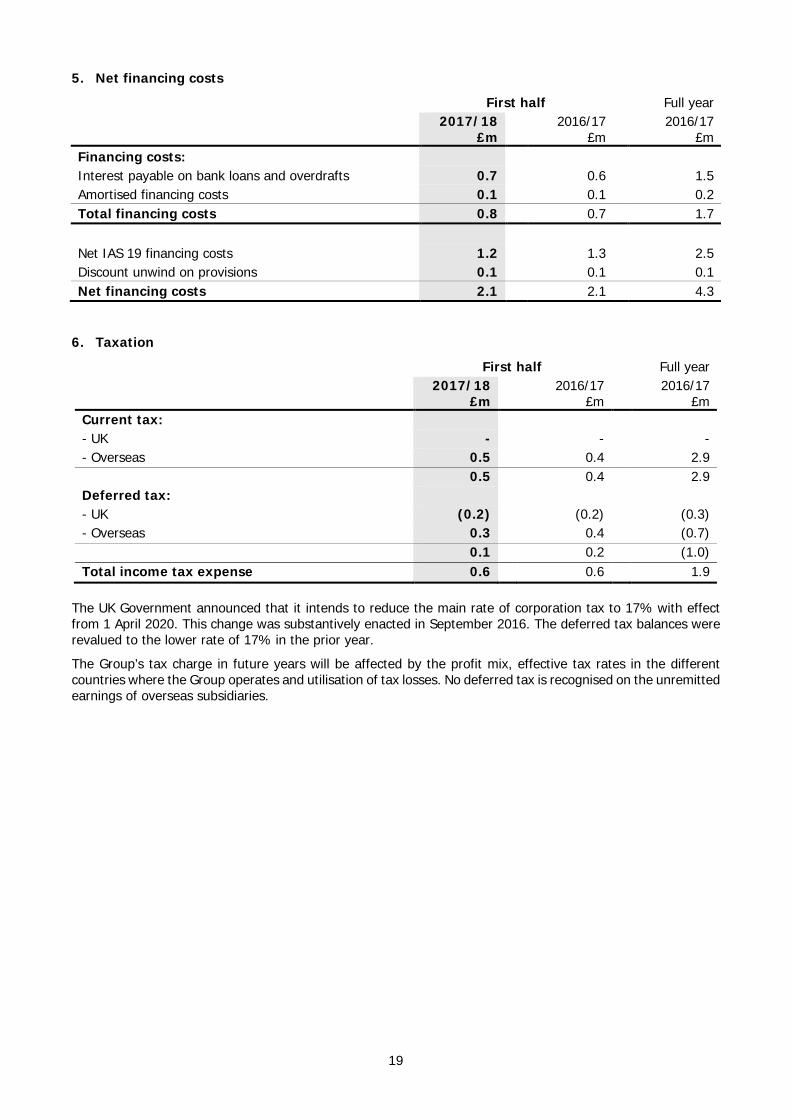
5. Net financing costs
First half Full year 2017/18
£m 2016/17
£m 2016/17
£m Financing costs: Interest payable on bank loans and overdrafts 0.7 0.6 1.5 Amortised financing costs 0.1 0.1 0.2 Total financing costs 0.8 0.7 1.7 Net IAS 19 financing costs 1.2 1.3 2.5 Discount unwind on provisions 0.1 0.1 0.1 Net financing costs 2.1 2.1 4.3
6. Taxation
First half Full year
2017/18 £m
2016/17 £m
2016/17 £m
Current tax: - UK - - - - Overseas 0.5 0.4 2.9 0.5 0.4 2.9 Deferred tax: - UK (0.2) (0.2) (0.3) - Overseas 0.3 0.4 (0.7) 0.1 0.2 (1.0) Total income tax expense 0.6 0.6 1.9
The UK Government announced that it intends to reduce the main rate of corporation tax to 17% with effect from 1 April 2020. This change was substantively enacted in September 2016. The deferred tax balances were revalued to the lower rate of 17% in the prior year. The Group’s tax charge in future years will be affected by the profit mix, effective tax rates in the different countries where the Group operates and utilisation of tax losses. No deferred tax is recognised on the unremitted earnings of overseas subsidiaries.

20
7. Earnings per share Basic earnings per share is calculated by dividing the profit for the period by the weighted average number of shares in issue during the period. Diluted earnings per share takes into account the dilutive effect of the options and awards outstanding under the Group's employee share schemes. The calculation of earnings per share is based on the following data:
First half Full year 2017/18
Pence per share
2016/17 Pence per
share
2016/17 Pence per
share Basic EPS 0.8 0.9 2.1 Diluted EPS 0.8 0.9 2.1 Adjusted EPS 1.8 2.3 4.6 Diluted adjusted EPS 1.8 2.3 4.6 £m £m £m Profit for calculation of adjusted EPS Profit for the financial period 1.8 2.1 4.8 Effect of adjusted items, after tax: - Exceptional items in operating costs 0.6 1.4 2.3 - Pension administration costs included in operating costs
0.4 0.3 0.6
- Discount unwind on exceptional items 0.1 0.1 0.1 - Amortisation of acquired intangible assets 0.3 0.4 0.7 - Net pension financing costs 0.9 0.9 2.0 Profit for the calculation of adjusted EPS 4.1 5.2 10.5 Thousands Thousands Thousands Weighted average number of ordinary shares For calculating basic earnings per share 225,418 223,849 224,830
Inclusion of the dilutive securities, comprising 6,942,000 (2016: 6,074,000) additional shares due to share options does not change the amounts shown above (2016: no change). The adjusted earnings per share numbers have been provided in order to give a useful indication of the underlying performance of the business by the exclusion of exceptional items. Due to the existence of unrecognised deferred tax assets, there was no associated tax credit on some of the exceptional charges and in these instances exceptional costs are therefore added back in full.

21
8. Retirement benefit obligations The Group’s retirement benefit obligations are summarised as follows:
At 30 September
2017 £m
At 30 September
2016 £m
At 31 March 2017
£m Funded plan obligations (232.3) (241.6) (236.4) Funded plan assets 158.0 158.1 160.6 Net funded plan obligations (74.3) (83.5) (75.8) Unfunded obligations (26.6) (28.9) (26.2) Total retirement benefit obligations (100.9) (112.4) (102.0)
Analysed as follows:
Non-current liabilities Retirement benefit obligations (100.9) (112.4) (102.0) Net retirement benefit obligation (100.9) (112.4) (102.0) Net deferred tax asset 17.1 19.8 17.2 Retirement benefit obligation net of deferred tax (83.8) (92.6) (84.8)
The decrease in the Group’s pre-tax liability from £102.0m at 31 March 2017 to £100.9m at 30 September 2017 primarily reflects a slight increase in yields on corporate bonds which impact the discount rates applied to the future pension liabilities and strong asset gains in the period. In the UK (92% of the total funded scheme liabilities), the discount rate increased by 0.1% from 2.5% at 31 March 2017 to 2.6% at 30 September 2017. This was partially offset by an increase in the inflation rate assumption in the UK. The deficit in the overseas schemes improved slightly (£0.2m) despite a decrease in the US discount rate from 3.8% to 3.55% offset by the impact of stronger Sterling when compared to the US dollar and strong asset gains in the period. The unfunded German scheme deficit increased by £0.6m mainly as a result of the translational impact of weaker Sterling when compared to the Euro. 9. Cash generated by operations
First half Full year 2017/18
£m 2016/17
£m 2016/17
£m Operating profit 4.5 4.8 11.0 Depreciation and amortisation 4.0 3.6 7.9 (Increase) in inventories (1.4) (1.7) (0.4) (Increase) in receivables (2.2) (1.2) (3.4) Increase in payables 1.3 0.3 1.3 Decrease in provisions (1.7) (0.4) (0.5) Movement on pension plans (2.6) (2.8) (5.1) Movement on derivative financial instruments (0.1) - - Loss on disposal of plant and equipment - - 0.3 Exceptional gain on sale of Australian property - - (2.9) Equity share plans - - 0.2 Treasury shares (Employee Benefit Trust) - (0.1) - Cash generated by operations 1.8 2.5 8.4

22
10. Reconciliation of the movement in cash and cash equivalents to movement in net debt
First half Full year 2017/18
£m 2016/17
£m 2016/17
£m (Decrease)/increase in cash and cash equivalents (8.2) (3.7) 2.2 Change in net debt resulting from cash flows (0.5) 1.5 4.5 Non-cash movement – amortisation of refinancing costs (0.1) (0.1) (0.2) Foreign currency translation differences 0.2 (0.4) (0.4) Change in net debt during the period (8.6) (2.7) 6.1 Net debt at start of period (17.4) (23.5) (23.5) Net debt at end of period (26.0) (26.2) (17.4)
11. Net Debt
At 30 September
2017 £m
At 30 September
2016 £m
At 31 March 2017
£m Cash and cash equivalents 9.5 10.2 16.4 Borrowings: Bank overdrafts (2.3) (0.9) (1.0) Capitalised costs 0.1 0.2 0.2 Sub-total – current borrowings (2.2) (0.7) (0.8) Bank loans – non-current (33.1) (35.6) (32.9) Capitalised costs 0.3 0.4 0.4 Preference stock (0.5) (0.5) (0.5) Total debt (35.5) (36.4) (33.8) Net debt (26.0) (26.2) (17.4)
12. Called up share capital
At 30 September
2017 £m
At 30 September
2016 £m
At 31 March 2017
£m Ordinary shares of 5p each 11.3 11.3 11.3 Deferred shares of 20p each - 15.4 15.4 11.3 26.7 26.7
At 30 September 2017, the issued ordinary share capital comprised 225,417,740 ordinary shares of 5p each (2016: 225,417,740 shares) and nil deferred shares of 20p each (2016: 77,064,703). The deferred shares noted above have had no value or voting rights since the Rights Issue in late 2009 and these have been cancelled following approval at the 2017 AGM. The balance has been transferred to a non-distributable Capital Reserve.
Ends