Grid integration of large-capacity Renewable Energy sources and ...

NREL is a national laboratory of the U.S. Department of Energy, Office of Energy Efficiency and Renewable Energy, operated by the Alliance for Sustainable Energy, LLC.
Renewable Grid Integration Research in the U.S.
Barry Mather Ph.D.
NREL- Distributed Energy Systems Integration Group
UNSW – IEA PVPS Task 14 Workshop Sydney, AU
November 26th, 2013

NATIONAL RENEWABLE ENERGY LABORATORY
Presentation Overview
Photovoltaic solar integration on distribution
systems in the U.S. • High-penetration PV grid integration projects • Advanced screen development for distribution
interconnection Wind and solar integration on the U.S.
Western Interconnection • WWSIS II • WWSIS III
IEEE 1547 revisions • IEEE 1547a • Future full revision

NATIONAL RENEWABLE ENERGY LABORATORY
NREL/SCE Hi-Pen PV Project
Project Background: •SCE is installing 250 MW of PV by 2015
•Most are large rooftop systems (1-5MW)
•All are connected to the distribution system
•Accelerating and disseminating the experiences gained from high-penetration PV integration on the SCE system to the wider distribution engineering community would accelerate the rate of PV interconnection in a safe, reliable and cost-effective manner
Project Motivation:

NATIONAL RENEWABLE ENERGY LABORATORY
Comparison of Quasi-Static Time-Series and Transient Simulation Analysis Techniques
• Evaluated quasi-static time-series analysis results at multiple time steps over a 16 minute period
• Analysis run times are on the order of 5 hours for PSCAD and 5 seconds for OpenDSS
4
PSCAD OpenDSS
5s 10s 15s 30s 40s 50s
Load tap changer
Max 5 6 5 5 6 5 5 Min 4 5 5 5 5 5 5
# of actions 1 1 0 0 1 0 0
Reg. #3
A Max 7 6 6 6 6 6 7 Min 4 3 3 3 3 4 4
# of actions 7 6 7 5 8 2 7
B Max 4 4 4 4 4 4 4 Min 1 2 1 1 1 2 1
# of actions 8 5 6 5 6 2 7
C Max 2 2 1 1 1 1 1 Min -1 -1 -1 -1 -1 0 0
# of actions 8 6 6 4 8 1 4 Cap. #1 Opening time (s) 489 495 - - 470 - 150
IEEE 8500 node test feeder model
See: D. Paradis, F. Katiraei and B. Mather, “Comparative analysis of time-series studies and transient simulations for impact assessment of PV integration on reduces IEEE 8500 node feeder,” IEEE PES GM, Vancouver, Canada, July, 2013

NATIONAL RENEWABLE ENERGY LABORATORY
Inclusion of PV Mitigation Controls
5
0 2 4 6 8 10 12 14 16 180.94
0.96
0.98
1
1.02
1.04
1.06
1.08
Distance from substation (km)
Vol
tage
(PU
)
Phase A Voltage Profile
No PV50% PV, PF=-0.9550% PV, PF=1
• A snapshot analysis is shown for three voltage profiles of the 8500 node test feeder with varying PF control implemented

NATIONAL RENEWABLE ENERGY LABORATORY
Inclusion of the Control Dynamics
6
1000 1100 1200 1300 1400 1500 1600 1700 1800 19001.01
1.02
1.03
1.04
1.05
1.06
1.07
1.08
1.09
Time (Second)
Vol
tage
(PU
)
PV 1 Interconnection Point Voltage
Phase APhase BPhase C
1000 1100 1200 1300 1400 1500 1600 1700 1800 19001.02
1.03
1.04
1.05
1.06
1.07
1.08
Time (Second)
Vol
tage
(PU
)
Voltage at Voltage Regulator #2
Phase APhase BPhase C
1000 1100 1200 1300 1400 1500 1600 1700 1800 19001.035
1.04
1.045
1.05
1.055
1.06
Time (Second)
Vol
tage
(PU
)
Voltage at Capacitor #1
Phase APhase BPhase C
NATIONAL RENEWABLE ENERGY LABORATORY
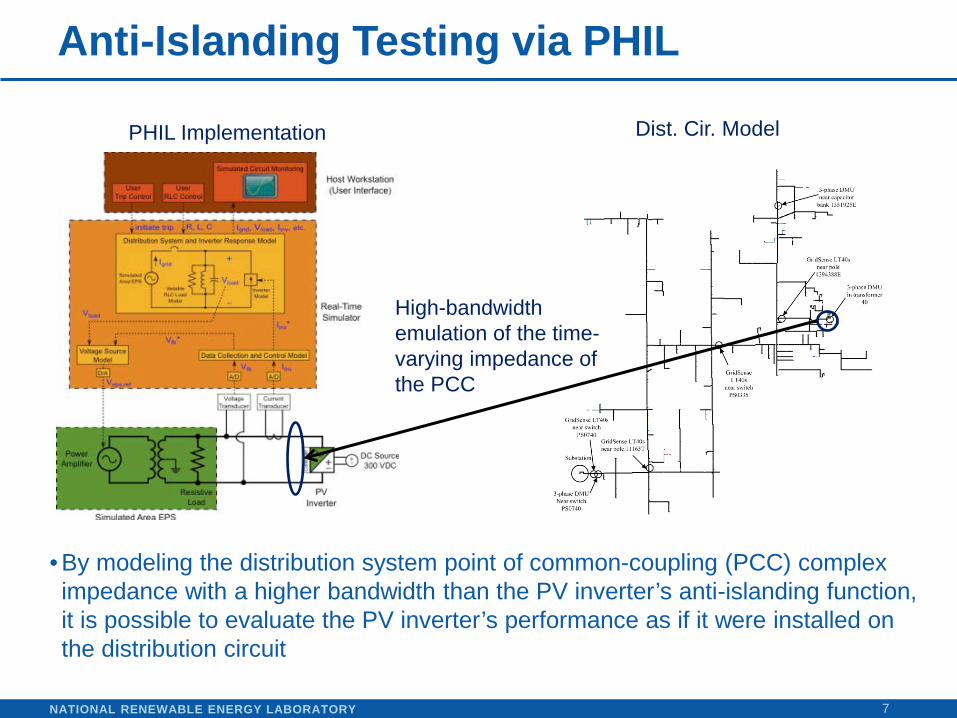
Anti-Islanding Testing via PHIL
7
High-bandwidth emulation of the time-varying impedance of the PCC
• By modeling the distribution system point of common-coupling (PCC) complex impedance with a higher bandwidth than the PV inverter’s anti-islanding function, it is possible to evaluate the PV inverter’s performance as if it were installed on the distribution circuit
PHIL Implementation Dist. Cir. Model
NATIONAL RENEWABLE ENERGY LABORATORY
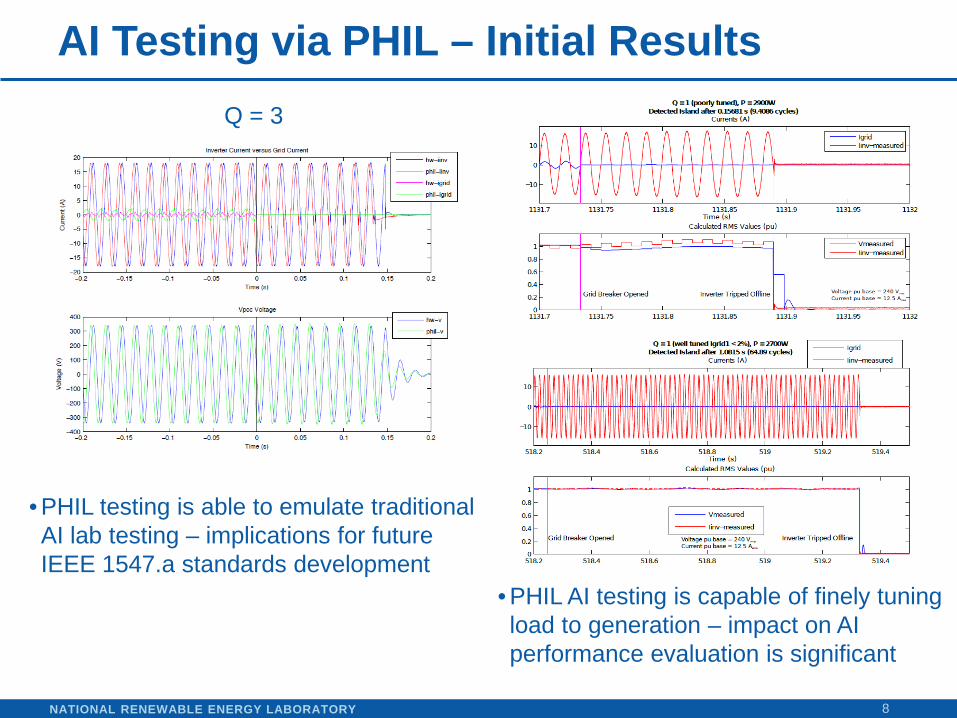
AI Testing via PHIL – Initial Results
8
• PHIL testing is able to emulate traditional AI lab testing – implications for future IEEE 1547.a standards development
• PHIL AI testing is capable of finely tuning load to generation – impact on AI performance evaluation is significant
Q = 3

NATIONAL RENEWABLE ENERGY LABORATORY
• Collaborative project with EPRI, NREL, SNL and CA utilities to develop advanced screening methods for distributed PV grid interconnection
• Advanced screens will inform CA Rule 21 and will allow more PV to be interconnected quickly when those systems will not adversely effect the interconnected system and will reduce utility interconnection queue
Dev. of Adv. PV Interconnection Screens
9
15%

NATIONAL RENEWABLE ENERGY LABORATORY
California Rule 21 Initial Review Screens 1. Not a secondary network 2. Not exporting across PCC 3. Certified equipment 4. <15% of peak load in line
section 5. Starting voltage drop within
limits 6. <=11 kVA nameplate rating If > 11 kVA rating … 7. Nameplate and short circuit
contribution ratio within limits 8. Compatible transformer
connection
10
If project passes all screens, interconnection agreement approved
Source: SCE Rule 21 – Generating Facility Interconnections, August 2004
Review of Utility Interconnection Screens

NATIONAL RENEWABLE ENERGY LABORATORY
Western Wind and Solar Integration Study 2 (WWSIS2)
Generation 5-min. dispatch for high solar scenario - July Energy Penetration: 25% Solar (PV & CSP), 8% Wind

NATIONAL RENEWABLE ENERGY LABORATORY
Western Wind and Solar Integration Study 3 (WWSIS3) – in progress
WWSIS3 includes the bulk system response to large amounts of DG (mostly PV) – is the contingency case now the loss of all the DG?
• 2022 - outlook • 10.3 GW of PV • 21.6 GW of
Wind • Light Spring
System Loading

NATIONAL RENEWABLE ENERGY LABORATORY
IEEE 1547 Basics – after amendment “a”
13
• IEEE 1547 has been a successful and useful DG interconnection standard for over 10 years
• Is technology agnostic – applies for any type of DG, not just PV inverters
• Describes the minimum requirements for DG interconnection at the point of common coupling (PCC)
• Voltage and frequency ride-through is allowed, not mandatory • Active voltage regulation at the PCC is allowed, not mandatory

NATIONAL RENEWABLE ENERGY LABORATORY
Technical Tradeoffs: Transmission vs. Distribution
14
• At low DG penetration, impacts on transmission level operations were considered minimal
• At the higher levels of DG seen, or soon to be realized, it is worthwhile to discuss what changes need to be considered
• Example: unintended transmission level impacts due to Germany’s 50.2 Hz issue
NATIONAL RENEWABLE ENERGY LABORATORY
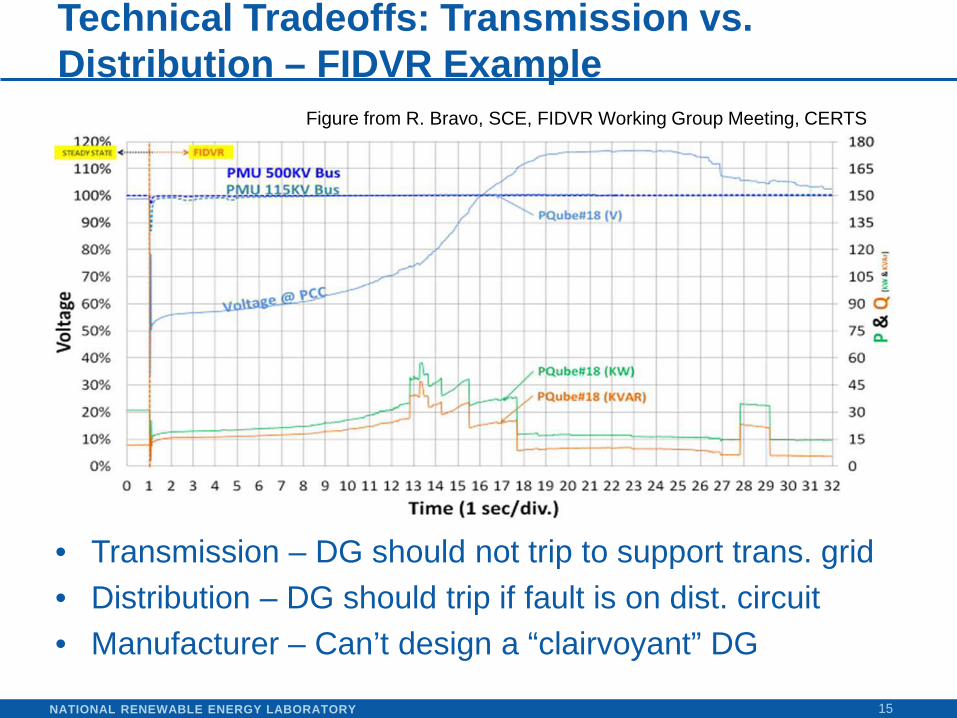
Technical Tradeoffs: Transmission vs. Distribution – FIDVR Example
15
• Transmission – DG should not trip to support trans. grid • Distribution – DG should trip if fault is on dist. circuit • Manufacturer – Can’t design a “clairvoyant” DG
Figure from R. Bravo, SCE, FIDVR Working Group Meeting, CERTS

NATIONAL RENEWABLE ENERGY LABORATORY
IEEE 1547 Revisions
16
• What: Workshop for the full revision of IEEE Std 1547: Standard for Interconnecting Distributed Resources (DR) with Electric Power Systems (EPS)
• When: December 3rd & 4th, 2013 • Where: Piscataway, NJ (IEEE HQ) • What: Working Group Meeting for IEEE 1547.1a • When: December 5th, 2013 • Where: Piscataway, NJ (IEEE HQ)
IEEE 1547 – Base Standard Revision
IEEE 1547.1a – Conformance Test Proc.
• Who: All stakeholders • How: http://grouper.ieee.org/groups/scc21/

NATIONAL RENEWABLE ENERGY LABORATORY
Thank you for your attention
Contact: Barry Mather Ph.D. National Renewable Energy Laboratory [email protected] +1-303-275-4378

NATIONAL RENEWABLE ENERGY LABORATORY
Current Status of PV in US
Source: SEPA, updated Q4, 2012, Photo: Agua Caliente 290MW – Courtesy of First Solar, Inc.
• 1231 MW of centralized solar installed in 2012 • California added 330MW, Arizona added 470MW • Over 80% of the installed MW were sold as power purchase agreements • Estimates are that about 3GW will be installed in 2013 (includes
significant CSP)

NATIONAL RENEWABLE ENERGY LABORATORY
Agua Caliente, Arizona – 262 MW
• 262 MWac operational as of mid of 2013
• Complete project build out is 290 MWac
• Located between Phoenix, AZ and Los Angeles, CA
Photos: Agua Caliente 290MW – Courtesy of First Solar, Inc.