Renewable Electricity Futures - Department of Energy€¦ · · 2011-07-28Renewable Electricity...
23
Renewable Electricity Futures Activities & Status Electricity Advisory Committee October 29, 2010 Sam Baldwin, Walter Short (Maureen Hand, Trieu Mai, Greg Brinkman, Ryan Wiser, et al .)
Transcript of Renewable Electricity Futures - Department of Energy€¦ · · 2011-07-28Renewable Electricity...
Renewable Electricity FuturesActivities & Status
Electricity Advisory Committee
October 29, 2010
Sam Baldwin, Walter Short (Maureen Hand, Trieu Mai, Greg Brinkman, Ryan Wiser, et al.)
Objectives for Today
2
• Provide a high-level overview of the Renewable Electricity Futures study, • current status• modeling approach • key questions.
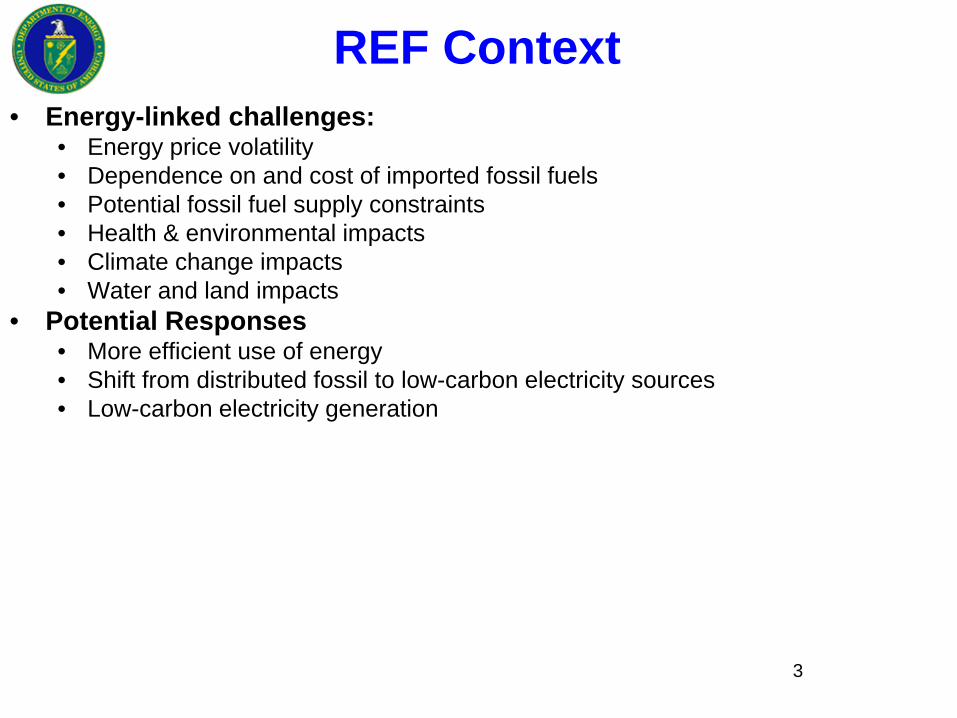
REF Context• Energy-linked challenges:
• Energy price volatility• Dependence on and cost of imported fossil fuels• Potential fossil fuel supply constraints• Health & environmental impacts• Climate change impacts• Water and land impacts
• Potential Responses• More efficient use of energy• Shift from distributed fossil to low-carbon electricity sources• Low-carbon electricity generation
3
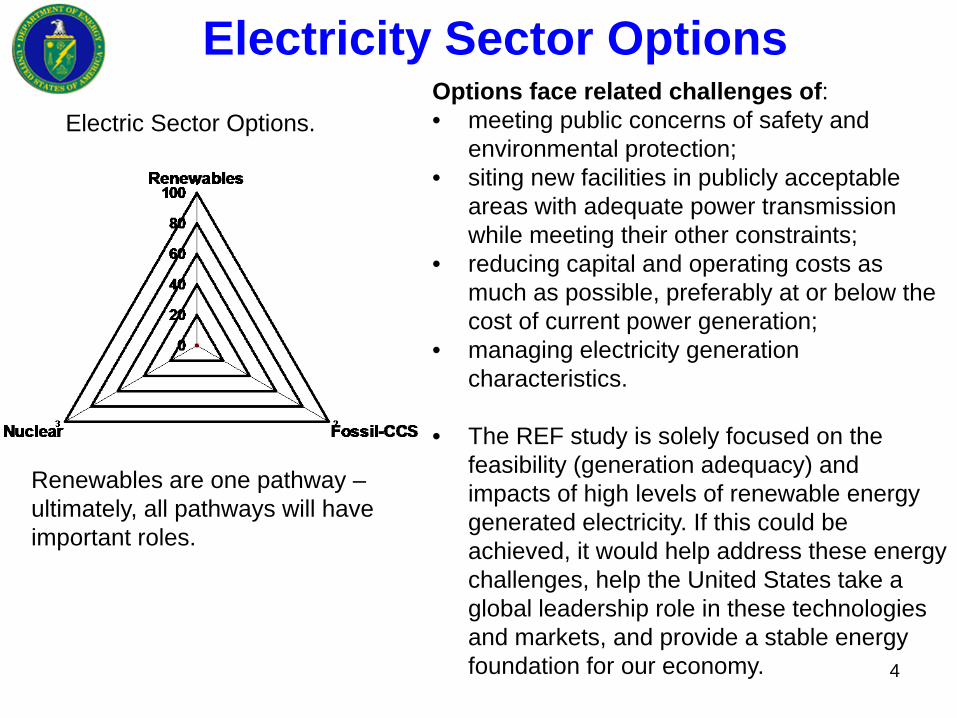
Electricity Sector Options
Renewables are one pathway –ultimately, all pathways will have important roles.
4
Options face related challenges of: • meeting public concerns of safety and
environmental protection; • siting new facilities in publicly acceptable
areas with adequate power transmission while meeting their other constraints;
• reducing capital and operating costs as much as possible, preferably at or below the cost of current power generation;
• managing electricity generation characteristics.
• The REF study is solely focused on the feasibility (generation adequacy) and impacts of high levels of renewable energy generated electricity. If this could be achieved, it would help address these energy challenges, help the United States take a global leadership role in these technologies and markets, and provide a stable energy foundation for our economy.
Electric Sector Options.
5
Opportunity• Renewable Energy: Abundant, diverse, distributed. • Vision: Develop a detailed bottom-up evaluation of what can be achieved and at
what cost, what constraints need to be addressed, and what RD3 and policy pathways are needed to approach it.
• Flexible: Analysis of a high renewable penetration grid requires conceptualization of an electric system designed to be highly flexible both in supply and demand. This system will utilize a variety of renewable generation, demand response, and storage technologies, and goes well beyond current analyses of renewables integration into the electric system.
• Possible Synergies: Large-scale use of renewables may benefit from synergies, possibly including daily/seasonal correlations in different resources, sharing energy storage systems; linking supply with active load shifting; smart grid benefits... etc.
Challenge• Use of renewable energy requires technical, economic, environmental, & institutional
solutions designed to reflect the unique characteristics of renewable energy.– Site specificity;– Resource intensity;– Variability;– Energy storage;– Fuel costs.
6
The Renewable Electricity Futures Study• Goals of the REF Study:
o Explore large-scale renewable technology deployment in the continental US electric sector and its implications:
• Renewable resource potential and geographic distribution;• RE technology RD3 pathways and expansion to achieve these options;• Seasonal to hourly generation adequacy• Economic costs, secondary impacts/benefits• Electric system operation and expansion challenges• Sensitivities: Impacts of constraints on transmission, grid flexibility, resources, etc.
• REF is NOT:o A detailed transmission and integration study
• Typically focused on specific geographic region with high-resolution time series representation of system—frequency response, stability, etc..
o An integrated model of carbon mitigation pathways or other specific environmental issues• Typically regional/global energy sector focus to assess policy
o A renewable energy vision• Typically conceptual, using high-level heuristic tools
o A projection of response to particular policy efforts• Typically sector response to specific legislation or policy
o The last word or final study on high RE generation• Need economic and policy analysis• Need optimization analysis; analysis of robust, no-regrets pathways, etc.• Need subhourly response analysis• And much more….

General Assumptions for REF• Large-scale deployment is based on RE technologies available today with expected
evolutionary development; no technology breakthroughs are required. Some future anticipated technologies (EGS, ocean) are examined in one case; many possible options are not considered in scenarios.
• Electricity demand can be reduced through aggressive energy efficiency measures.• Some transportation energy requirements shifted to electricity such that overall
electricity demand exceeds that achieved through EE demand reduction, but less than demand projections at historical growth rates.
• Biomass contribution to fuel sector carbon mitigation is not quantified• Electric system operation strategies and markets enhance their flexibility both in
electricity end-use and supply.
7
• Transmission infrastructure in place today largely remains in 2050.
• No specific carbon policies are considered.
• Today’s policies continue or end per current statute.
7

Project LeadNREL/MIT
DOE – EERE/OE
SteeringCommittee
Renewable GenerationTechnology Chapter Teams- Biopower- Geothermal Energy- Hydropower- Ocean Energy- Solar Energy- Wind Energy
Electric SystemChapter Teams- End-Use Electricity- Electric Power System Operation and Transmission
- Storage Technologies
Supporting Analysis
RE Futures Study Organization
• Over 140 Individuals from over 50 Organizations (Selected List):– National Laboratories: INL, LBNL, NREL, ORNL, PNNL, SNL– Industry: Midwest Independent System Operator, Western Interstate Energy Board,
Deutsche Bank, Xcel Energy, Vestas Wind Systems, RES Americas, Black and Veatch– Universities: Massachusetts Institute of Technology, University College Dublin, University of
Colorado, Virginia Polytechnic Institute and University, Texas Tech– NGOs: Electric Power Research Institute, Environmental Defense Fund, American Council
for an Energy-Efficient Economy, Energy Foundation8
REF Scenario Matrix
• Demand: Low, High• RE Penetration: Business-as-usual to very high• Constraints: Transmission, Flexibility, Resources• Technology Advance: Limited, Current R&D, New Techs• Fuel Prices: Low, Medium, High• Conventional Technology Cost: Low, Medium, High
9

Modeling Framework
10
REF Core Cost
REF Advanced Cost
PerformanceResource availabilityDemand Projection
Grid OperationsTransmission costs /
characterizations
Black & Veatch
RE technologies
Flexible Resources
End-Use Electricity
System Operations
Transmission
SolarDS(rooftop PV Market Penetration Model)
ABB inc. GridView
(hourly production cost model)
electricityprices
rooftop PVpenetration
2050 mixof generators
does it work hourly?
ImpactsGHG Emissions
Water UsageLand Use
Capacity & Generation 2010-2050
11
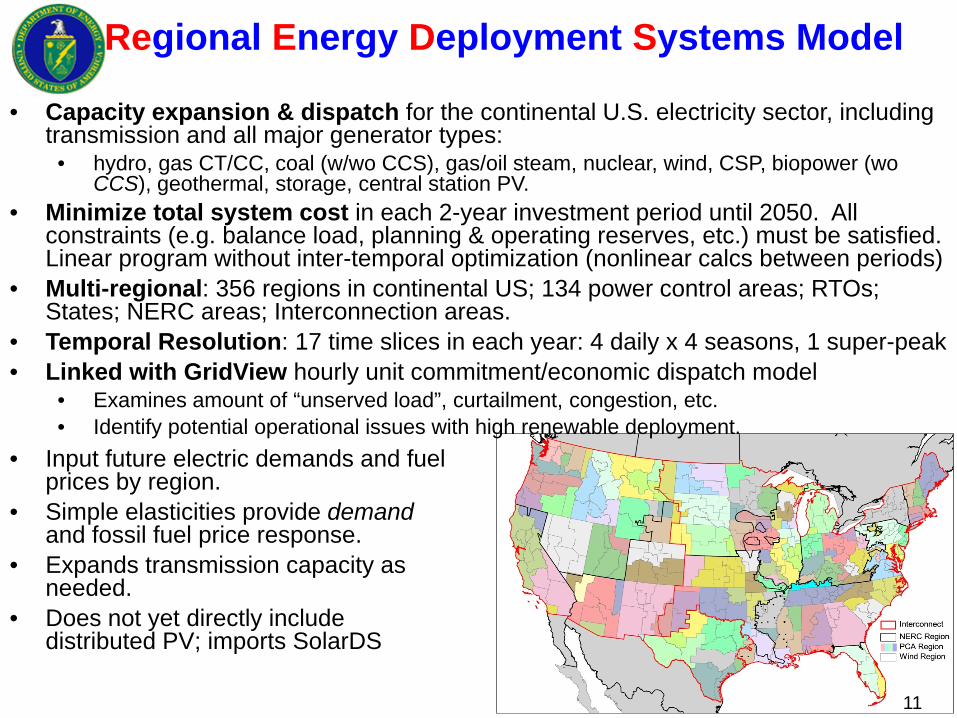
Regional Energy Deployment Systems Model
• Capacity expansion & dispatch for the continental U.S. electricity sector, including transmission and all major generator types:
• hydro, gas CT/CC, coal (w/wo CCS), gas/oil steam, nuclear, wind, CSP, biopower (woCCS), geothermal, storage, central station PV.
• Minimize total system cost in each 2-year investment period until 2050. All constraints (e.g. balance load, planning & operating reserves, etc.) must be satisfied. Linear program without inter-temporal optimization (nonlinear calcs between periods)
• Multi-regional: 356 regions in continental US; 134 power control areas; RTOs; States; NERC areas; Interconnection areas.
• Temporal Resolution: 17 time slices in each year: 4 daily x 4 seasons, 1 super-peak• Linked with GridView hourly unit commitment/economic dispatch model
• Examines amount of “unserved load”, curtailment, congestion, etc.• Identify potential operational issues with high renewable deployment.
• Input future electric demands and fuel prices by region.
• Simple elasticities provide demandand fossil fuel price response.
• Expands transmission capacity as needed.
• Does not yet directly include distributed PV; imports SolarDS
11
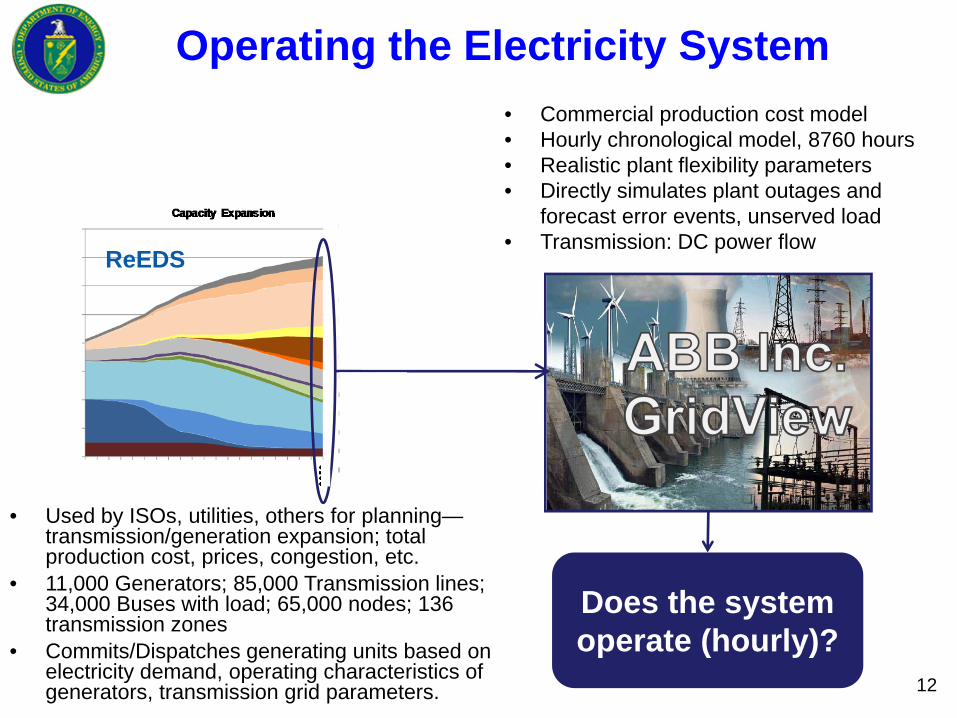
Operating the Electricity System
12
ReEDS
• Commercial production cost model• Hourly chronological model, 8760 hours• Realistic plant flexibility parameters• Directly simulates plant outages and
forecast error events, unserved load• Transmission: DC power flow
Does the system operate (hourly)?
Core 80% REF • Used by ISOs, utilities, others for planning—transmission/generation expansion; total production cost, prices, congestion, etc.
• 11,000 Generators; 85,000 Transmission lines; 34,000 Buses with load; 65,000 nodes; 136 transmission zones
• Commits/Dispatches generating units based on electricity demand, operating characteristics of generators, transmission grid parameters. 12
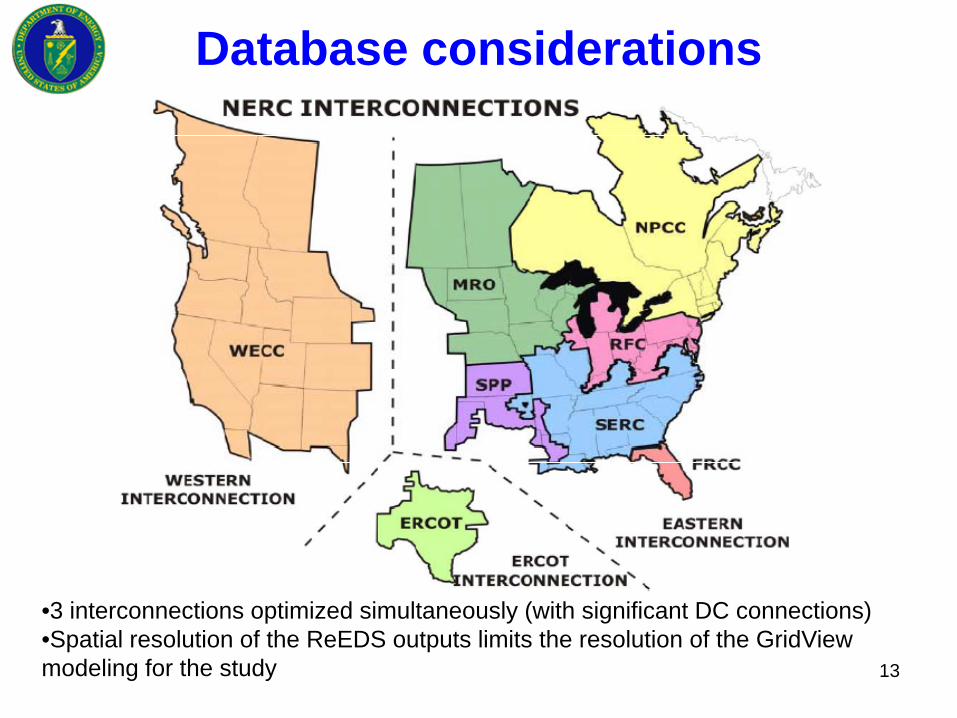
Database considerations
•3 interconnections optimized simultaneously (with significant DC connections)•Spatial resolution of the ReEDS outputs limits the resolution of the GridViewmodeling for the study 13
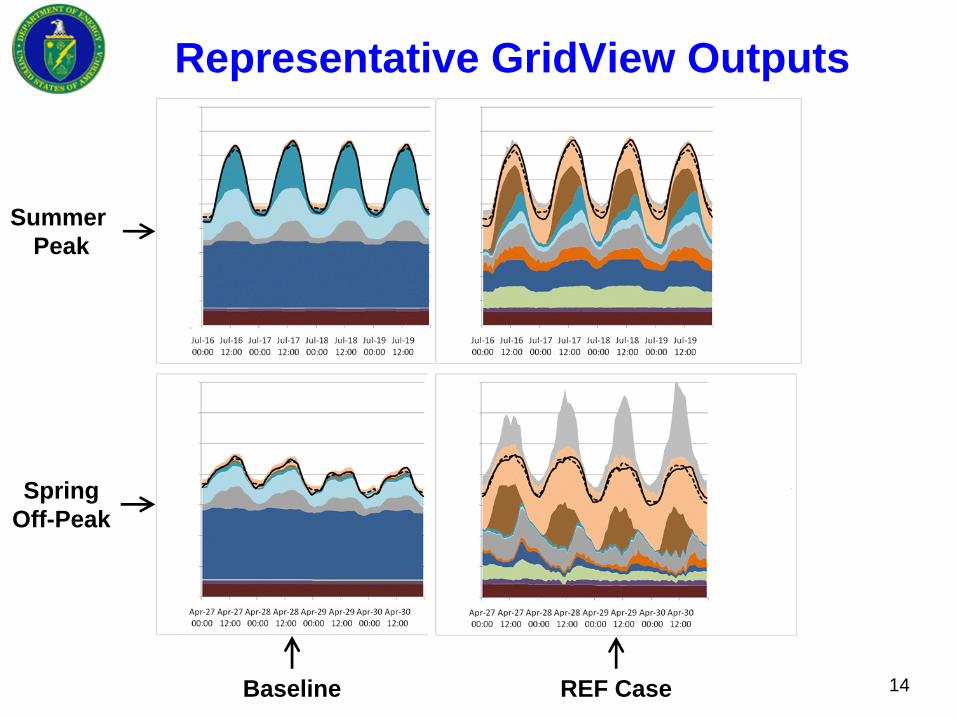
Representative GridView Outputs
14
Summer Peak
SpringOff-Peak
Baseline REF Case
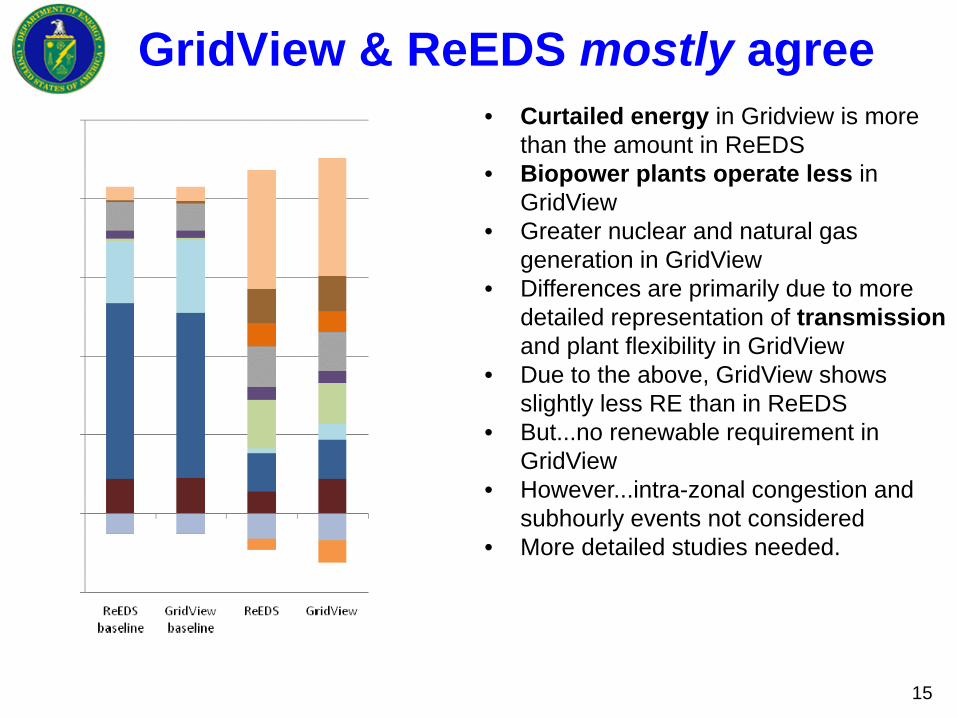
GridView & ReEDS mostly agree
15
• Curtailed energy in Gridview is more than the amount in ReEDS
• Biopower plants operate less in GridView
• Greater nuclear and natural gas generation in GridView
• Differences are primarily due to more detailed representation of transmissionand plant flexibility in GridView
• Due to the above, GridView shows slightly less RE than in ReEDS
• But...no renewable requirement in GridView
• However...intra-zonal congestion and subhourly events not considered
• More detailed studies needed.

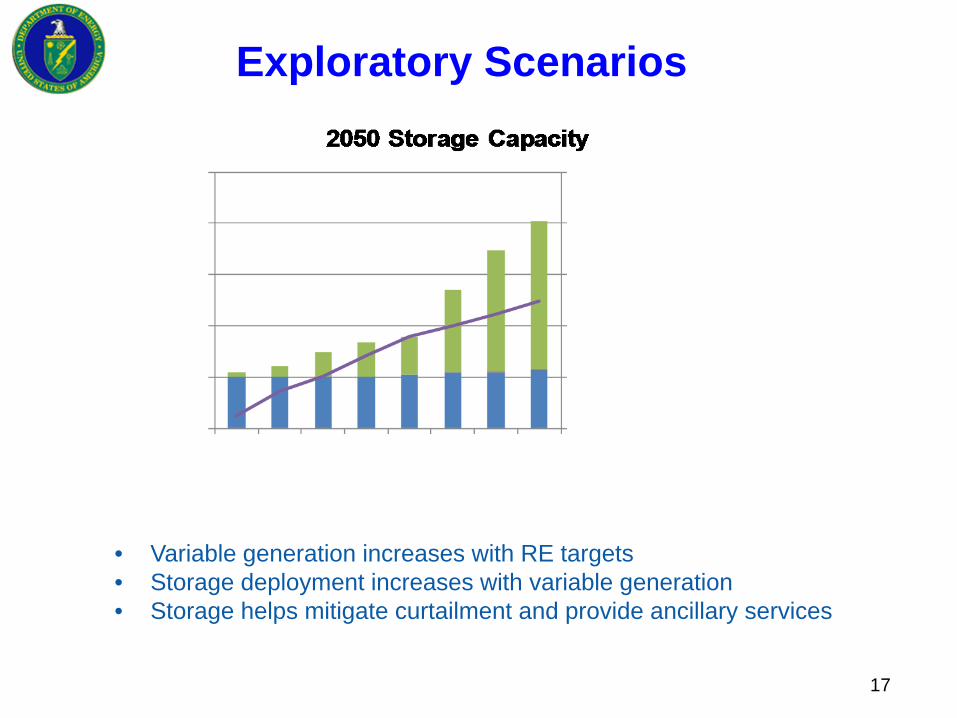
Exploratory Scenarios
16
• Deployment significant for all major renewables• Operational challenges (curtailment, forecast, reserves) grow with increasing
deployment variable generation• Transmission expansion significant with high RE targets (though reduced
because of the low demand assumption and reduced conventional generation)• Storage deployment grows with increasing RE targets• Costs rise non-linearly with RE deployment (but not exponentially)
Generation Mix
Exploratory Scenarios
17
• Variable generation increases with RE targets • Storage deployment increases with variable generation • Storage helps mitigate curtailment and provide ancillary services
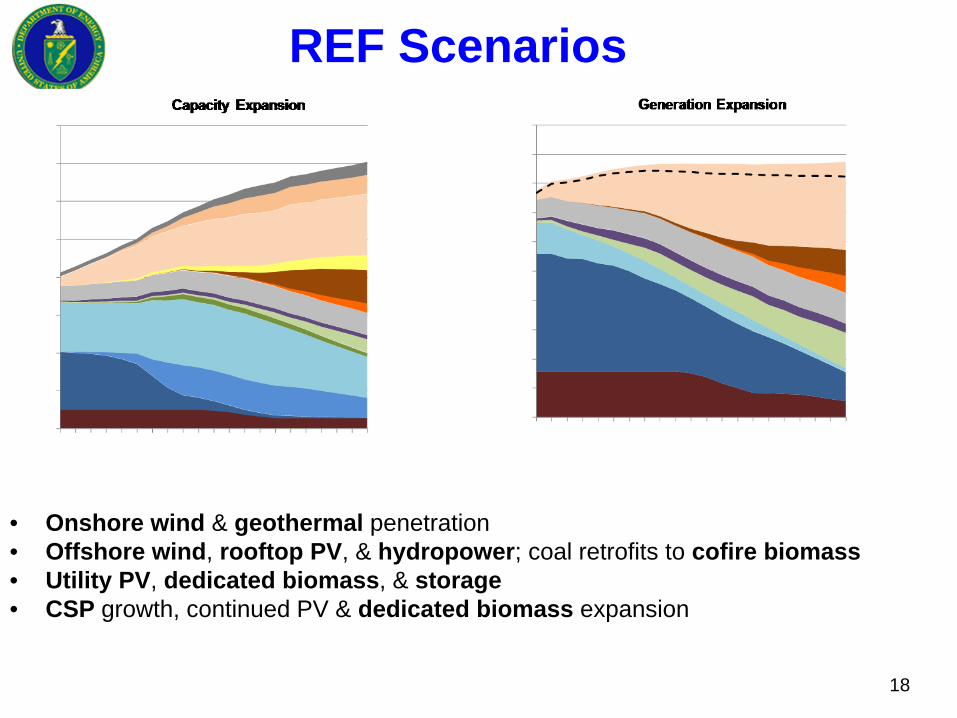
REF Scenarios
18
• Onshore wind & geothermal penetration• Offshore wind, rooftop PV, & hydropower; coal retrofits to cofire biomass • Utility PV, dedicated biomass, & storage• CSP growth, continued PV & dedicated biomass expansion
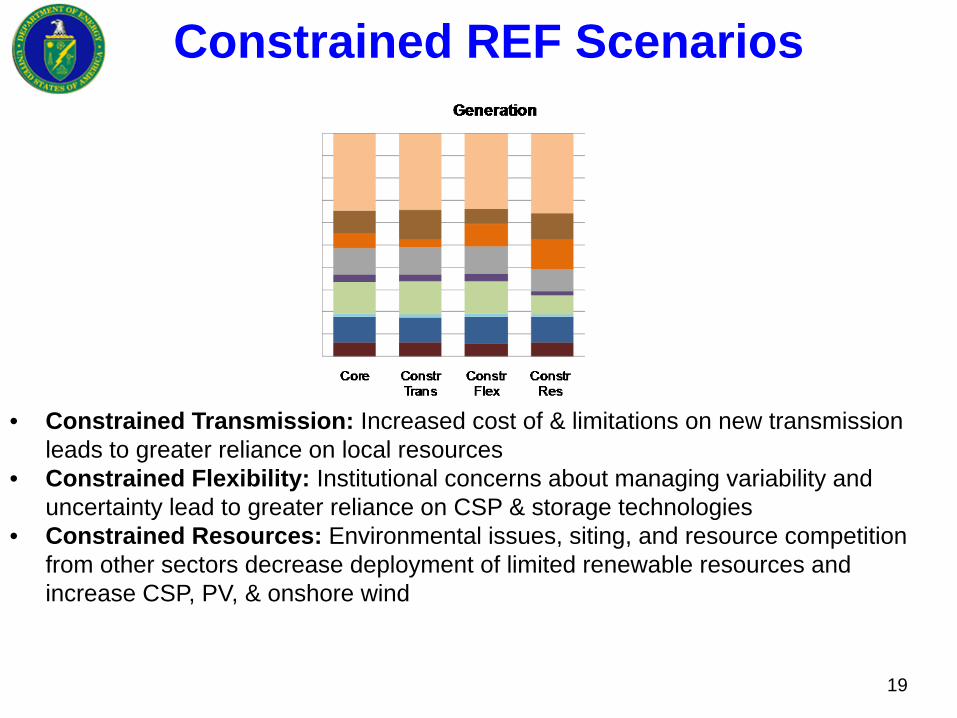
Constrained REF Scenarios
19
• Constrained Transmission: Increased cost of & limitations on new transmission leads to greater reliance on local resources
• Constrained Flexibility: Institutional concerns about managing variability and uncertainty lead to greater reliance on CSP & storage technologies
• Constrained Resources: Environmental issues, siting, and resource competition from other sectors decrease deployment of limited renewable resources and increase CSP, PV, & onshore wind
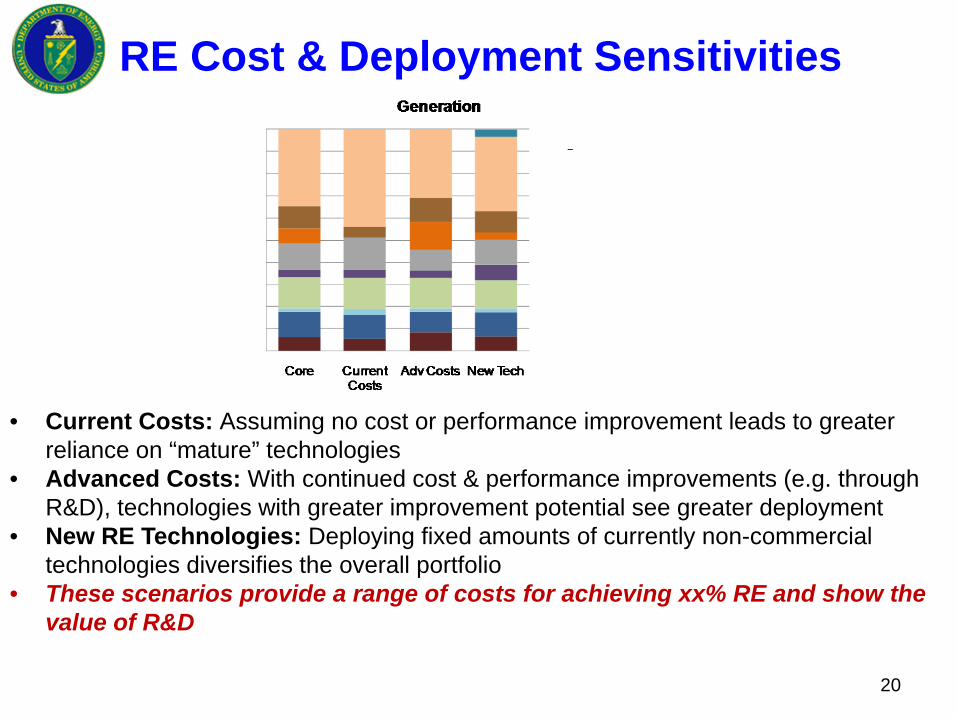
RE Cost & Deployment Sensitivities
20
• Current Costs: Assuming no cost or performance improvement leads to greater reliance on “mature” technologies
• Advanced Costs: With continued cost & performance improvements (e.g. through R&D), technologies with greater improvement potential see greater deployment
• New RE Technologies: Deploying fixed amounts of currently non-commercial technologies diversifies the overall portfolio
• These scenarios provide a range of costs for achieving xx% RE and show the value of R&D
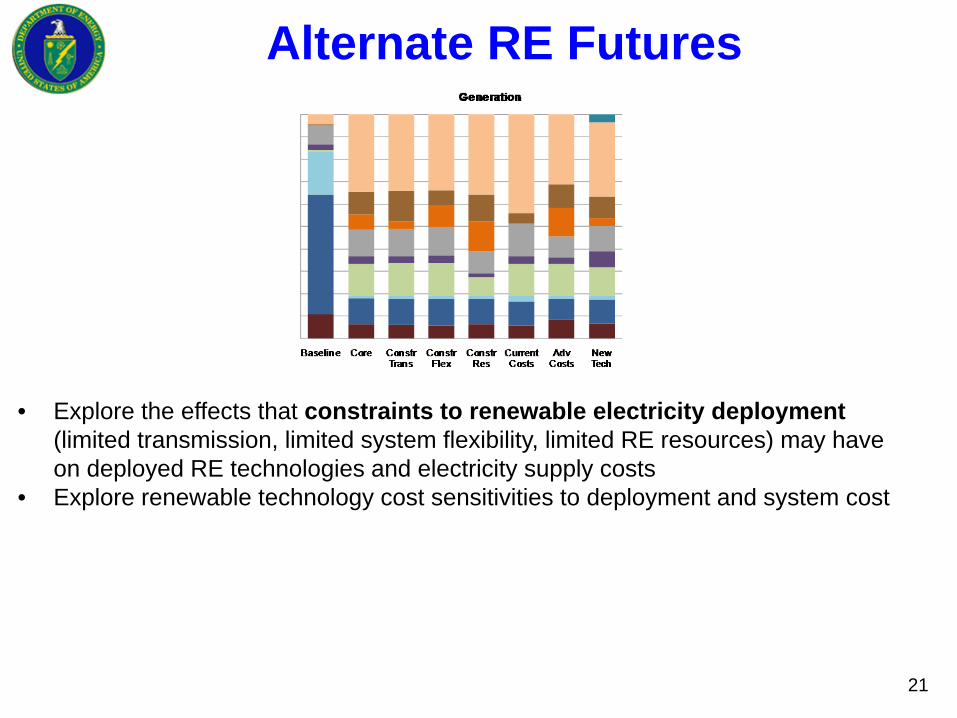
Alternate RE Futures
• Explore the effects that constraints to renewable electricity deployment (limited transmission, limited system flexibility, limited RE resources) may have on deployed RE technologies and electricity supply costs
• Explore renewable technology cost sensitivities to deployment and system cost
21

Impacts of achieving xx% RE by 2050
22
• Water use reduction• Public health impacts• Reduced risk due to fossil fuel price volatility• Land use implications• Scale up challenges
23
• RE capacity/generation over time?• Sensitivity to transmission costs, utility flexibility, resource availability?• RE curtailments?• System cost?• Unserved load?• Regional variations?• Other key questions?
Key Questions


![[CBOT] CBOT Electricity Futures and Options Reference and Applications Guide](https://static.fdocuments.in/doc/165x107/577d2f891a28ab4e1eb1fe34/cbot-cbot-electricity-futures-and-options-reference-and-applications-guide.jpg)