Venture Capital Investments by IPO Underwriters Certification or Conflict of Interest
US IPO Market 2018 Annual Review
About Renaissance Capital Renaissance Capital provides pre-IPO institutional research and management of the Renaissance IPO ETF (NYSE symbol: IPO) and the Renaissance International IPO ETF (NYSE symbol: IPOS). For more information, visit www.renaissancecapital.com.
Page 1 of 25
January 2, 2018
2018 IPO Market Hits a 4-Year High Despite Bad 4Q
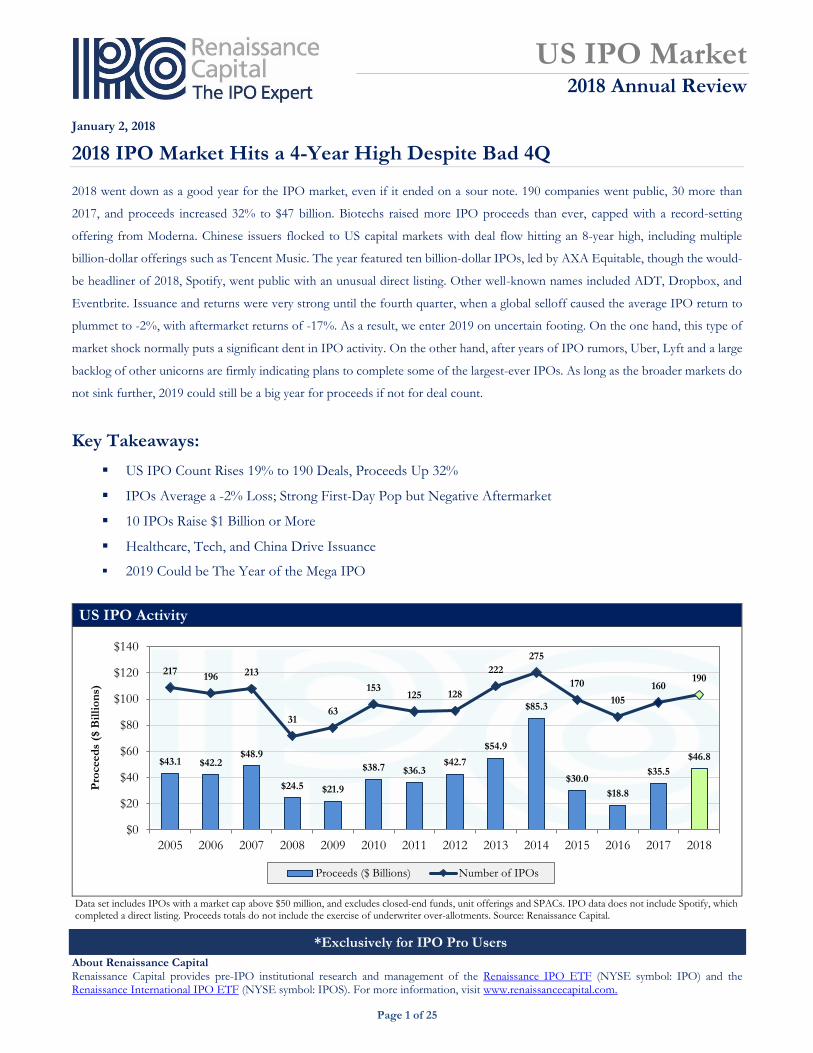
2018 went down as a good year for the IPO market, even if it ended on a sour note. 190 companies went public, 30 more than
2017, and proceeds increased 32% to $47 billion. Biotechs raised more IPO proceeds than ever, capped with a record-setting
offering from Moderna. Chinese issuers flocked to US capital markets with deal flow hitting an 8-year high, including multiple
billion-dollar offerings such as Tencent Music. The year featured ten billion-dollar IPOs, led by AXA Equitable, though the would-
be headliner of 2018, Spotify, went public with an unusual direct listing. Other well-known names included ADT, Dropbox, and
Eventbrite. Issuance and returns were very strong until the fourth quarter, when a global selloff caused the average IPO return to
plummet to -2%, with aftermarket returns of -17%. As a result, we enter 2019 on uncertain footing. On the one hand, this type of
market shock normally puts a significant dent in IPO activity. On the other hand, after years of IPO rumors, Uber, Lyft and a large
backlog of other unicorns are firmly indicating plans to complete some of the largest-ever IPOs. As long as the broader markets do
not sink further, 2019 could still be a big year for proceeds if not for deal count.
Key Takeaways:
US IPO Count Rises 19% to 190 Deals, Proceeds Up 32%
IPOs Average a -2% Loss; Strong First-Day Pop but Negative Aftermarket
10 IPOs Raise $1 Billion or More
Healthcare, Tech, and China Drive Issuance
2019 Could be The Year of the Mega IPO
US IPO Activity
Data set includes IPOs with a market cap above $50 million, and excludes closed-end funds, unit offerings and SPACs. IPO data does not include Spotify, which completed a direct listing. Proceeds totals do not include the exercise of underwriter over-allotments. Source: Renaissance Capital.
$43.1 $42.2$48.9
$24.5 $21.9
$38.7 $36.3$42.7
$54.9
$85.3
$30.0
$18.8
$35.5
$46.8
217196 213
3163
153125 128
222
275
170
105
160190
$0
$20
$40
$60
$80
$100
$120
$140
2005 2006 2007 2008 2009 2010 2011 2012 2013 2014 2015 2016 2017 2018
Pro
ceed
s ($
Bil
lio
ns)
Proceeds ($ Billions) Number of IPOs
*Exclusively for IPO Pro Users

US IPO Market 2018 Annual Review
About Renaissance Capital Renaissance Capital provides pre-IPO institutional research and management of the Renaissance IPO ETF (NYSE symbol: IPO) and the Renaissance International IPO ETF (NYSE symbol: IPOS). For more information, visit www.renaissancecapital.com.
Page 2 of 25
US IPO Count Rises 19% to 190 Deals, Proceeds Up 32%
The US IPO market continued to climb in 2018 as 190 IPOs raised $47 billion, 32% more capital than 2017 and a four-year high.
By deal count and proceeds, 2018 was the third most active year in the past decade, behind 2013 and 2014. A surge of biotechs and
foreign tech companies drove the increase over 2017; two-thirds of IPOs were either tech or healthcare. Foreign issuers made up
28% of US IPOs, the highest since 2010 and 7 points above the 10-year average.
The IPO market had been well on track to hit the 200-IPO mark until November, when the drop in the stock market and spike in
volatility caused deals to push to 2019. Activity in the final two months fell by 66% compared to last year, after a 42% year-over-
year increase in the first ten months. Additionally, the availability of large amounts of private capital likely continued to be a drag
on IPOs, and fewer US tech companies went public than last year.
Venture capital and private equity each comprised about one-third of proceeds raised. Even with an uptick in billion-dollar IPOs,
the median deal size fell to $108 million due to the flood of small biotechs.
Key US IPO Statistics – Activity IPO Volume 2010 2011 2012 2013 2014 2015 2016 2017 2018 Number of Deals 154 125 128 222 275 170 105 160 190
Proceeds Raised (US$ in bil) $38.7 $36.3 $42.7 $54.9 $85.3 $30.0 $18.8 $35.5 $46.8
Median Deal Size (US$ in mil) $108 $160 $124 $126 $100 $94 $95 $120 $108
PE-Backed Deals 38 35 45 68 71 39 30 46 44
PE-Backed Proceeds (US$ in bil) $9.6 $20.4 $10.3 $24.5 $25.0 $11.3 $8.8 $13.4 $16.0
VC-Backed Deals 61 51 46 82 126 85 42 61 87
VC-Backed Proceeds (US$ in bil) $6.0 $7.9 $20.7 $9.7 $35.3 $8.9 $3.5 $11.3 $15.0
Source: Renaissance Capital.
*Exclusively for IPO Pro Users
US IPO Market 2018 Annual Review
About Renaissance Capital Renaissance Capital provides pre-IPO institutional research and management of the Renaissance IPO ETF (NYSE symbol: IPO) and the Renaissance International IPO ETF (NYSE symbol: IPOS). For more information, visit www.renaissancecapital.com.
Page 3 of 25
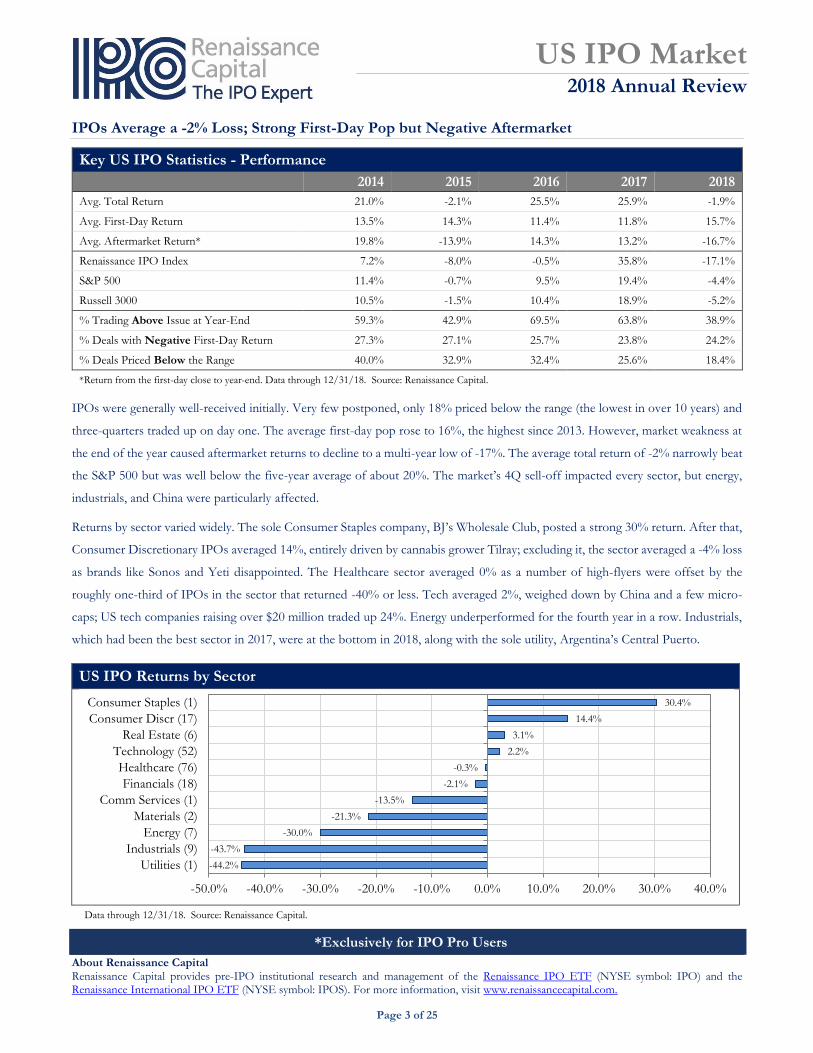
IPOs Average a -2% Loss; Strong First-Day Pop but Negative Aftermarket
IPOs were generally well-received initially. Very few postponed, only 18% priced below the range (the lowest in over 10 years) and
three-quarters traded up on day one. The average first-day pop rose to 16%, the highest since 2013. However, market weakness at
the end of the year caused aftermarket returns to decline to a multi-year low of -17%. The average total return of -2% narrowly beat
the S&P 500 but was well below the five-year average of about 20%. The market’s 4Q sell-off impacted every sector, but energy,
industrials, and China were particularly affected.
Returns by sector varied widely. The sole Consumer Staples company, BJ’s Wholesale Club, posted a strong 30% return. After that,
Consumer Discretionary IPOs averaged 14%, entirely driven by cannabis grower Tilray; excluding it, the sector averaged a -4% loss
as brands like Sonos and Yeti disappointed. The Healthcare sector averaged 0% as a number of high-flyers were offset by the
roughly one-third of IPOs in the sector that returned -40% or less. Tech averaged 2%, weighed down by China and a few micro-
caps; US tech companies raising over $20 million traded up 24%. Energy underperformed for the fourth year in a row. Industrials,
which had been the best sector in 2017, were at the bottom in 2018, along with the sole utility, Argentina’s Central Puerto.
US IPO Returns by Sector
Data through 12/31/18. Source: Renaissance Capital.
-44.2%
-43.7%
-30.0%
-21.3%
-13.5%
-2.1%
-0.3%
2.2%
3.1%
14.4%
30.4%
-50.0% -40.0% -30.0% -20.0% -10.0% 0.0% 10.0% 20.0% 30.0% 40.0%
Utilities (1)
Industrials (9)
Energy (7)
Materials (2)
Comm Services (1)
Financials (18)
Healthcare (76)
Technology (52)
Real Estate (6)
Consumer Discr (17)
Consumer Staples (1)
Key US IPO Statistics - Performance
2014 2015 2016 2017 2018
Avg. Total Return 21.0% -2.1% 25.5% 25.9% -1.9%
Avg. First-Day Return 13.5% 14.3% 11.4% 11.8% 15.7%
Avg. Aftermarket Return* 19.8% -13.9% 14.3% 13.2% -16.7%
Renaissance IPO Index 7.2% -8.0% -0.5% 35.8% -17.1%
S&P 500 11.4% -0.7% 9.5% 19.4% -4.4%
Russell 3000 10.5% -1.5% 10.4% 18.9% -5.2%
% Trading Above Issue at Year-End 59.3% 42.9% 69.5% 63.8% 38.9%
% Deals with Negative First-Day Return 27.3% 27.1% 25.7% 23.8% 24.2%
% Deals Priced Below the Range 40.0% 32.9% 32.4% 25.6% 18.4%
*Return from the first-day close to year-end. Data through 12/31/18. Source: Renaissance Capital.
*Exclusively for IPO Pro Users

US IPO Market 2018 Annual Review
About Renaissance Capital Renaissance Capital provides pre-IPO institutional research and management of the Renaissance IPO ETF (NYSE symbol: IPO) and the Renaissance International IPO ETF (NYSE symbol: IPOS). For more information, visit www.renaissancecapital.com.
Page 4 of 25
Healthcare and Tech Continue to Drive Issuance
Healthcare again topped IPO activity as the biotech boom stretched into its sixth year. The year’s 58 biotechs included a handful
of billion-dollar companies and raised a record-setting $6.3 billion. The tech sector jumped to 52 IPOs raising $18 billion, the highest
amount since 2014, boosted by five billion-dollar IPOs from China and Brazil. One-half of the tech IPOs were foreign issuers,
including many Chinese fintech and online media and services companies, while the number of US-based tech companies going
public actually declined slightly. That said, the year saw a pickup in “unicorns” like Dropbox and DocuSign: 38 tech companies
went public at valuations of $1 billion or more, almost double last year and a six-fold increase over 2016. Like last year, energy
started strong early in the year but then petered out as oil prices softened. The Financials sector included the year’s largest offering
and a dozen regional banks. Consumer Discretionary featured several connected device makers and foreign education companies,
along with one large retailer, airport shop Hudson.
IPOs and Proceeds by Sector (US$ Billion)
2014 2015 2016 2017 2018
Sector # $
% of
# $
% of
# $
% of
# $
% of
# $
% of
IPOs IPOs IPOs IPOs IPOs
Healthcare 102 $8.7 38% 78 $6.7 46% 42 $3.4 40% 47 $4.2 30% 76 $9.1 40%
Technology 59 $34.1 22% 29 $7.9 17% 21 $2.9 20% 39 $10.1 25% 52 $18.3 27%
Financials 27 $13.9 10% 16 $1.3 10% 11 $2.8 10% 21 $3.1 13% 18 $4.3 9%
Consumer Discr 17 $3.7 6% 12 $3.1 7% 5 $1.5 5% 12 $2.2 8% 17 $4.1 9%
Industrials 14 $4.2 5% 7 $1.5 4% 10 $3.5 10% 10 $3.8 6% 9 $4.1 5%
Energy 29 $11.6 11% 10 $4.4 6% 4 $1.4 4% 14 $4.4 9% 7 $1.5 4%
Real Estate 9 $3.3 3% 5 $1.1 3% 4 $1.5 4% 7 $2.6 4% 6 $3.7 3%
Materials 7 $2.3 3% 5 $1.5 3% 2 $0.1 2% 6 $2.7 4% 2 $0.9 1%
Consumer Staples 2 $0.3 1% 3 $1.2 2% 4 $1.6 4% 1 $0.0 1% 1 $0.6 1%
Utilities 6 $2.1 2% 3 $1.3 2% 2 $0.1 2% - - - 1 $0.3 1%
Comm. Services 1 $0.4 0% 1 $0.1 1% - - - 3 $2.5 2% 1 $0.0 1%
Data through 12/31/18. Source: Renaissance Capital.
*Exclusively for IPO Pro Users

US IPO Market 2018 Annual Review
About Renaissance Capital Renaissance Capital provides pre-IPO institutional research and management of the Renaissance IPO ETF (NYSE symbol: IPO) and the Renaissance International IPO ETF (NYSE symbol: IPOS). For more information, visit www.renaissancecapital.com.
Page 5 of 25
10 IPOs Raise $1 Billion or More
The year’s 10 largest offerings raised $16.4 billion, 35% of 2018 proceeds. 10 IPOs raised more than $1 billion, the same as the past
three years combined. In the past decade, only 2014 had as many billion-dollar IPOs. The 10 averaged a first-day gain of 15%, in
line with the 2018 total; while muted initial returns are typical for large deals, 2018 surprisingly saw four deals pop more than 30%
and two deals drop more than 10% in first-day trading. By year-end the largest IPOs had a -8% average return.
French insurer AXA spun out its US operations in the year’s largest IPO. Foreign issuers represented six of the 10 largest, including
all five technology companies; the other five each represented a different sector. Chinese streaming giants iQIYI and Tencent Music
were spun out of Baidu and Tencent, respectively. Venture capital made a showing thanks to two China-based companies,
marketplace app Pinduoduo and electric vehicle developer NIO. Two large and fast-growing Brazilian payment processors listed,
PagSeguro and StoneCo. Spun out of Eli Lilly, top-performer Elanco initially popped 50%, the best first-day return for a billion-
dollar IPO since Twitter in 2013. Just one LBO made the list, ADT, which was also the group’s worst-performing deal with a
-57% loss at year-end.
The largest US listing by market cap was not an IPO: music streaming giant Spotify completed a direct listing on the NYSE, valuing
the company at about $25 billion. It finished the year 24% below its first-day close due to a sell-off in streaming stocks, but its
relatively low volatility meant that this non-traditional listing was generally seen as a success.
Largest US IPOs
Company Ticker Offer Date Deal Size
($mm) Sector
First-Day Pop
Return from IPO
AXA Equitable Holdings EQH 9-May $2,745 Financials 1.7% -16.9%
PagSeguro Digital PAGS 23-Jan $2,266 Technology 35.8% -12.9%
iQIYI IQ 28-Mar $2,250 Technology -13.6% -17.4%
Pinduoduo PDD 25-Jul $1,626 Technology 40.5% 18.1%
Elanco Animal Health ELAN 19-Sep $1,510 Healthcare 50.0% 31.4%
ADT ADT 18-Jan $1,470 Industrials -11.5% -57.1%
StoneCo STNE 24-Oct $1,217 Technology 30.6% -23.2%
VICI Properties VICI 31-Jan $1,210 Real Estate 4.5% -6.1%
Tencent Music Entertainment TME 11-Dec $1,066 Technology 7.7% 1.7%
NIO NIO 11-Sep $1,002 Consumer Discr 5.4% 1.8%
Data through 12/31/18. Source: Renaissance Capital.
*Exclusively for IPO Pro Users

US IPO Market 2018 Annual Review
About Renaissance Capital Renaissance Capital provides pre-IPO institutional research and management of the Renaissance IPO ETF (NYSE symbol: IPO) and the Renaissance International IPO ETF (NYSE symbol: IPOS). For more information, visit www.renaissancecapital.com.
Page 6 of 25
Tilray and Healthcare Top List of Best-Performing IPOs
The best-performing IPOs of 2018 were mostly healthcare, with four biotechs and two medical device companies. Tilray had by far
the highest return, up 315%, as the only US-listed play on Canada’s legalization of cannabis. The top-performing IPOs also included
two enterprise SaaS unicorns with best-in-class growth, Zscaler and Elastic. With the exception of Liquidia Technologies, all 10 had
superb first-day returns (63% average) and all 10 traded up in the aftermarket (73% average). Eight of the 10 priced above the
midpoint, and six priced above the range; Goosehead Insurance was unusual in slashing its price by 33% before taking flight.
Best-Performing US IPOs
Company Ticker Offer Date Deal Size
($mm) Sector
First-Day Pop
Return from IPO
Tilray TLRY 18-Jul $153 Consumer Discr 31.7% 314.9%
ARMO BioSciences ARMO 25-Jan $128 Healthcare 74.9% 194.0%*
Allakos ALLK 18-Jul $128 Healthcare 73.6% 190.4%
Inspire Medical Systems INSP 2-May $108 Healthcare 56.1% 164.1%
Goosehead Insurance GSHD 26-Apr $85 Financials 57.5% 162.9%
Zscaler ZS 15-Mar $192 Technology 106.3% 145.1%
Elastic ESTC 27-Sep $100 Technology 94.4% 98.6%
Guardant Health GH 3-Oct $238 Healthcare 69.5% 97.8%
Liquidia Technologies LQDA 25-Jul $50 Healthcare 0.9% 96.9%
Autolus Therapeutics AUTL 21-Jun $150 Healthcare 47.1% 93.2%
Data through 12/31/18. Source: Renaissance Capital. *Return from Jan IPO to May acquisition at $50 per share.
The healthcare sector also dominated the year’s worst-performing IPOs, which included seven biotechs and a device company.
Menlo Therapeutics priced above the range and had the strongest initial trading of the group, but plummeted 77% in a single day
after disappointing trial results. Fast-growing auto insurance site EverQuote also priced up, but never saw a meaningful return.
Chinese education stocks like Sunlands were hit particularly hard by new regulations.
Worst-Performing US IPOs
Company Ticker Offer Date Deal Size
($mm) Sector
First-Day Pop
Return from IPO
Genprex GNPX 28-Mar $6 Healthcare -6.0% -78.0%
EverQuote EVER 27-Jun $84 Technology 0.1% -76.8%
Menlo Therapeutics MNLO 24-Jan $119 Healthcare 68.9% -75.8%
Sunlands Online Education STG 22-Mar $150 Technology -3.5% -73.6%
Constellation Pharmaceuticals CNST 18-Jul $60 Healthcare -23.3% -73.3%
Entasis Therapeutics ETTX 25-Sep $75 Healthcare -28.9% -72.9%
Surface Oncology SURF 18-Apr $108 Healthcare -11.1% -71.7%
Eyenovia EYEN 24-Jan $27 Healthcare -0.8% -71.5%
Hancock Jaffe Laboratories HJLI 30-May $8 Healthcare 4.8% -70.5%
Vaccinex VCNX 9-Aug $40 Healthcare -5.2% -69.6%
Data through 12/31/18. Source: Renaissance Capital.
*Exclusively for IPO Pro Users

US IPO Market 2018 Annual Review
About Renaissance Capital Renaissance Capital provides pre-IPO institutional research and management of the Renaissance IPO ETF (NYSE symbol: IPO) and the Renaissance International IPO ETF (NYSE symbol: IPOS). For more information, visit www.renaissancecapital.com.
Page 7 of 25
Private Equity IPOs Climb to a Four-Year High by Proceeds
Private equity was behind 44 IPOs raising $16.0 billion. While proceeds reached a four-year high in 2018, PE-backed deal count
declined slightly from the prior year. The group included 18 LBOs and 26 backed by growth or other private equity. Deal flow
would have been higher if energy had not dropped off after the first quarter. The decline was also partly cyclical, stemming from
low buyout activity during 2009-2012. PE-backed deals averaged a loss of -2%. Excluding Tilray, however, they averaged a -9%
loss, dragged down by energy, industrials, and Chinese issuers.
Private equity was behind three billion-dollar IPOs: foreign issuers Pinduoduo and StoneCo, and Apollo’s ADT. Privateer Holdings-
backed cannabis grower Tilray was the top performer (+315%), followed by payment processor i3 Verticals (+85%), Yucaipa-
backed cold storage REIT Americold (+60%), and THL Partners’ HR software provider Ceridian HCM (+57%). Apollo and KKR
were the joint-most active PE firms as the lead investors on two IPO exits each.
US IPO Activity – Private Equity-Backed IPOs (View 2018 PE IPOs, including SPACs)
Source: Renaissance Capital.
$20.4
$10.3
$24.5 $25.0
$11.3$8.8
$13.4$16.0
35(28%)
45(35%)
68(31%)
71(26%)
39(23%) 30
(29%)
46(29%)
44(23%)
$0
$5
$10
$15
$20
$25
$30
$35
$40
2011 2012 2013 2014 2015 2016 2017 2018
Proceeds ($ Billions) Number of IPOs
*Exclusively for IPO Pro Users

US IPO Market 2018 Annual Review
About Renaissance Capital Renaissance Capital provides pre-IPO institutional research and management of the Renaissance IPO ETF (NYSE symbol: IPO) and the Renaissance International IPO ETF (NYSE symbol: IPOS). For more information, visit www.renaissancecapital.com.
Page 8 of 25
Venture Capital Picks Up from Biotech Boom and Foreign Tech
Venture capital backed 87 IPOs, 46% of the year’s total, and a 43% increase over last year thanks to a pickup in the already-active
biotech space. Even without last year’s mega IPO Snap, VC-backed proceeds rose more than 30% in 2018 to $15.0 billion, helped
by large foreign tech issuers and bigger biotechs. The largest VC exits came from China-based Pinduoduo and NIO, followed by
UK fashion site Farfetch. After doubling in 2017 to $100 million, the average biotech deal size further increased to $108 million,
led by a record-setting $604 million IPO by Moderna. US tech declined slightly. Two VC-backed US software companies, Qualtrics
and Adaptive Insights, were acquired at $1+ billion valuations days before their scheduled IPOs. Venture outperformed in 2018
with an 10% average return, including 23% gain on the first day and -12% in the aftermarket. Several home runs in biotech increased
the average, along with strong returns from US tech companies.
US IPO Activity – Venture Capital-Backed IPOs (View 2018 VC IPOs)
Source: Renaissance Capital.
Biotechs made up half of all VC exits, while the broader
healthcare sector accounted for two-thirds of deals.
Biotech activity increased sharply in 2018, due to a high
number of pre-IPO funding rounds in 2015-2017, more
early-stage drug developers going public, and substantial
support from insiders on the IPO. Insiders bought on
84% of VC-backed biotechs, representing one-third of
the deal size on average. VC-backed healthcare traded up
11% on average, and the group included many of the
year’s best and worst performers.
$7.9
$20.7
$9.7
$35.3
$8.9
$3.5
$11.3$15.0
51(41%)
46(36%)
82(37%)
126(46%)
85(50%)
42(40%)
61(38%)
87(46%)
$0
$10
$20
$30
$40
$50
$60
2011 2012 2013 2014 2015 2016 2017 2018
Proceeds ($ Billions) Number of IPOs
Source: Renaissance Capital. Includes biotechs without VC backing.
11(32%)
37(18%)
71(23%)
59(21%)
29(33%)
36(33%)
58(31%)
0
10
20
30
40
50
60
70
80
90
2012 2013 2014 2015 2016 2017 2018
Bio
tech
IP
Os
(avg.
% in
sid
er b
uyi
ng)
Biotech IPOs and Insider Buying
*Exclusively for IPO Pro Users

US IPO Market 2018 Annual Review
About Renaissance Capital Renaissance Capital provides pre-IPO institutional research and management of the Renaissance IPO ETF (NYSE symbol: IPO) and the Renaissance International IPO ETF (NYSE symbol: IPOS). For more information, visit www.renaissancecapital.com.
Page 9 of 25
Blank Check IPOs Hit an 11-Year High: 46 Deals Raise $9.7 Billion
46 blank check companies raised $9.7 billion during 2018, the most since 2007. Driving SPAC issuance were large deals from high-
profile management teams. Like last year, three raised over $500 million. The average SPAC gained 0.5% on its first day and traded
up 1.3% from there, with year-end returns ranging from -0.7% to 7.5%. SPACs are not included in our total IPO statistics.
SPAC IPOs Have Biggest Year Since 2007 (View 2018 SPAC IPOs)
Includes blank check companies listing on the Nasdaq/NYSE/AmEx with a market value above $50 million. Source: Renaissance Capital.
Technology was the most targeted sector with nine SPACs raising $2.5 billion, including two of the three largest. Churchill Capital
raised $600 million, led by Jerre Stead, former CEO of IHS Markit, and veteran dealmaker Michael Klein. Goldman Sachs-backed
GS Acquisition also raised $600 million for former Honeywell CEO David Cote to find an industrials business.
2018’s Largest Blank Check IPOs
Company Ticker Target Sector
Sponsor Offer Date Deal Size
($mm) Return
from IPO
Churchill Capital CCC.U Technology M. Klein, J. Stead 6-Sep $600 1.1%
GS Acquisition Holdings GSAH.U Industrials Goldman, D. Cote 7-Jun $600 2.5%
Far Point Acquisition FPAC.U Technology Far Point, T. Farley 11-Jun $550 0.9%
Spartan Energy Acquisition SPAQ.U Energy Apollo 9-Aug $480 0.0%
Collier Creek Holdings CCH.U Consumer Stap. C. Chu, R. Deromedi 4-Oct $400 0.5%
Gores Holdings III GRSHU Misc. The Gores Group 6-Sep $375 0.5%
Pure Acquisition PACQU Energy HighPeak Energy 13-Apr $360 5.0%
FinTech Acquisition III FTACU Technology The Bancorp mgmt. 15-Nov $300 0.0%
Trinity Merger TMCXU Real Estate Trinity Investments 15-May $300 3.2%
Platinum Eagle Acquisition EAGLU Comm. Services. J. Sagansky, E. Baker 11-Jan $300 5.9%
One Madison Corp OMAD.U Consumer Disc. One Madison Group 18-Jan $300 4.0%
Data through 12/31/18. Source: Renaissance Capital.
$10.7
$3.5
$0.0 $0.0 $0.0 $0.4 $1.3 $1.6
$3.6 $3.2
$8.7 $9.7
58
12
0 0 17 10 11
2013
32
46
$0
$5
$10
$15
2007 2008 2009 2010 2011 2012 2013 2014 2015 2016 2017 2018
Proceeds ($B) SPAC IPOs
*Exclusively for IPO Pro Users
US IPO Market 2018 Annual Review
About Renaissance Capital Renaissance Capital provides pre-IPO institutional research and management of the Renaissance IPO ETF (NYSE symbol: IPO) and the Renaissance International IPO ETF (NYSE symbol: IPOS). For more information, visit www.renaissancecapital.com.
Page 10 of 25
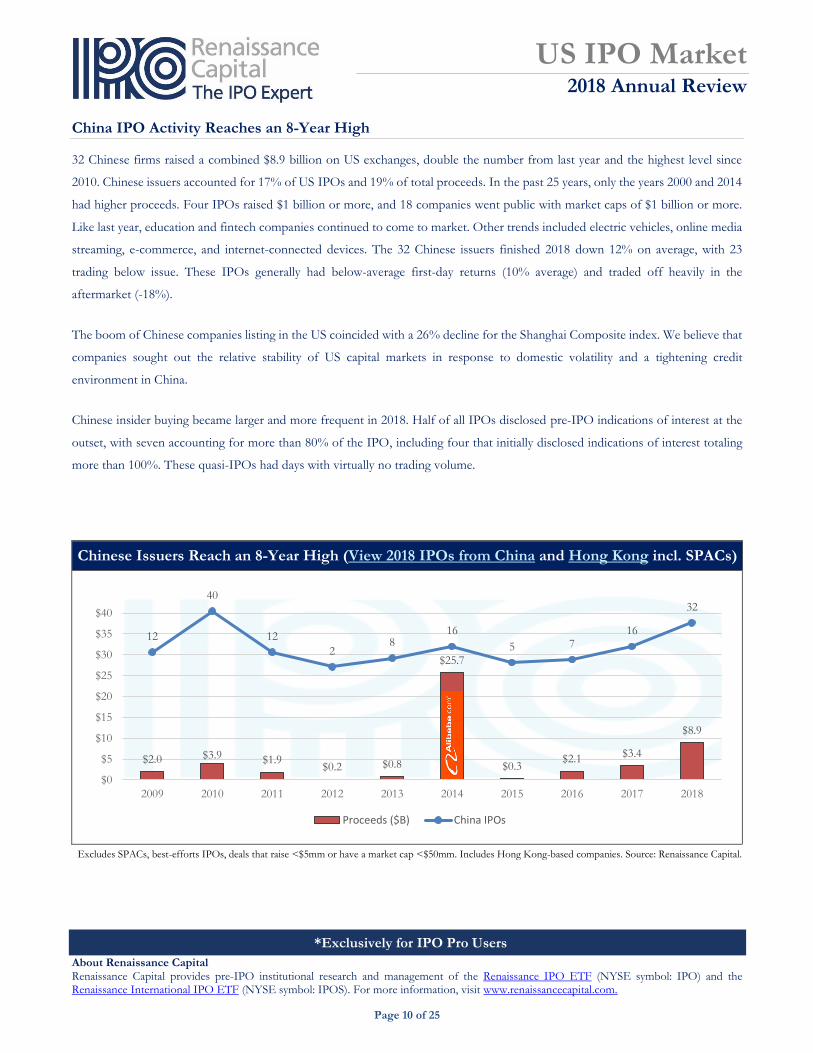
China IPO Activity Reaches an 8-Year High
32 Chinese firms raised a combined $8.9 billion on US exchanges, double the number from last year and the highest level since
2010. Chinese issuers accounted for 17% of US IPOs and 19% of total proceeds. In the past 25 years, only the years 2000 and 2014
had higher proceeds. Four IPOs raised $1 billion or more, and 18 companies went public with market caps of $1 billion or more.
Like last year, education and fintech companies continued to come to market. Other trends included electric vehicles, online media
streaming, e-commerce, and internet-connected devices. The 32 Chinese issuers finished 2018 down 12% on average, with 23
trading below issue. These IPOs generally had below-average first-day returns (10% average) and traded off heavily in the
aftermarket (-18%).
The boom of Chinese companies listing in the US coincided with a 26% decline for the Shanghai Composite index. We believe that
companies sought out the relative stability of US capital markets in response to domestic volatility and a tightening credit
environment in China.
Chinese insider buying became larger and more frequent in 2018. Half of all IPOs disclosed pre-IPO indications of interest at the
outset, with seven accounting for more than 80% of the IPO, including four that initially disclosed indications of interest totaling
more than 100%. These quasi-IPOs had days with virtually no trading volume.
Chinese Issuers Reach an 8-Year High (View 2018 IPOs from China and Hong Kong incl. SPACs)
Excludes SPACs, best-efforts IPOs, deals that raise <$5mm or have a market cap <$50mm. Includes Hong Kong-based companies. Source: Renaissance Capital.
$2.0 $3.9 $1.9$0.2 $0.8
$25.7
$0.3$2.1 $3.4
$8.9
12
40
12
28
16
5 716
32
$0
$5
$10
$15
$20
$25
$30
$35
$40
2009 2010 2011 2012 2013 2014 2015 2016 2017 2018
Proceeds ($B) China IPOs
*Exclusively for IPO Pro Users
US IPO Market 2018 Annual Review
About Renaissance Capital Renaissance Capital provides pre-IPO institutional research and management of the Renaissance IPO ETF (NYSE symbol: IPO) and the Renaissance International IPO ETF (NYSE symbol: IPOS). For more information, visit www.renaissancecapital.com.
Page 11 of 25
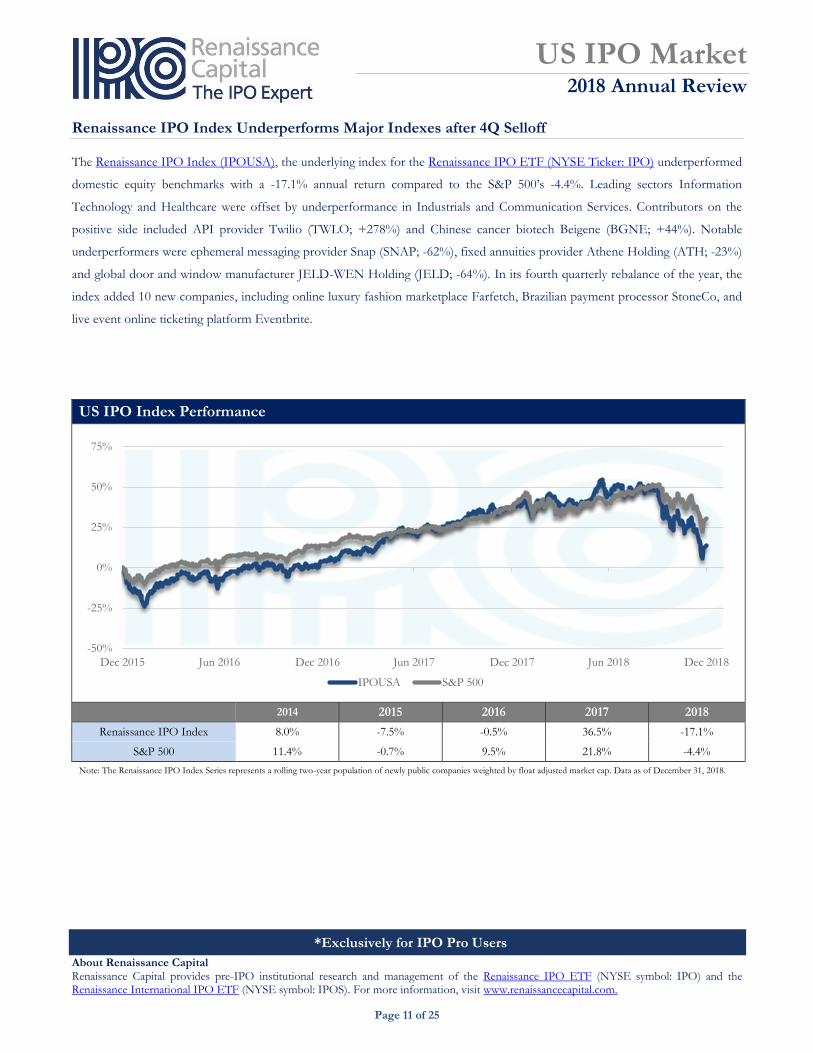
Renaissance IPO Index Underperforms Major Indexes after 4Q Selloff
The Renaissance IPO Index (IPOUSA), the underlying index for the Renaissance IPO ETF (NYSE Ticker: IPO) underperformed
domestic equity benchmarks with a -17.1% annual return compared to the S&P 500’s -4.4%. Leading sectors Information
Technology and Healthcare were offset by underperformance in Industrials and Communication Services. Contributors on the
positive side included API provider Twilio (TWLO; +278%) and Chinese cancer biotech Beigene (BGNE; +44%). Notable
underperformers were ephemeral messaging provider Snap (SNAP; -62%), fixed annuities provider Athene Holding (ATH; -23%)
and global door and window manufacturer JELD-WEN Holding (JELD; -64%). In its fourth quarterly rebalance of the year, the
index added 10 new companies, including online luxury fashion marketplace Farfetch, Brazilian payment processor StoneCo, and
live event online ticketing platform Eventbrite.
US IPO Index Performance
2014 2015 2016 2017 2018
Renaissance IPO Index 8.0% -7.5% -0.5% 36.5% -17.1%
S&P 500 11.4% -0.7% 9.5% 21.8% -4.4%
Note: The Renaissance IPO Index Series represents a rolling two-year population of newly public companies weighted by float adjusted market cap. Data as of December 31, 2018.
-50%
-25%
0%
25%
50%
75%
Dec 2015 Jun 2016 Dec 2016 Jun 2017 Dec 2017 Jun 2018 Dec 2018
IPOUSA S&P 500
*Exclusively for IPO Pro Users

US IPO Market 2018 Annual Review
About Renaissance Capital Renaissance Capital provides pre-IPO institutional research and management of the Renaissance IPO ETF (NYSE symbol: IPO) and the Renaissance International IPO ETF (NYSE symbol: IPOS). For more information, visit www.renaissancecapital.com.
Page 12 of 25
Pipeline and PCW: Notable Upcoming Technology IPOs
223 companies filed for IPOs in 2018, up 14% from 2017 and on par with the 10-year average of 226 filings. There are 70 IPOs
publicly on file looking to raise a combined $10 billion, down from 73 at year-end 2017 and 69 the year before that. The pipeline’s
“active backlog” of companies that have submitted filings within the past 90 days stands at 31 deals targeting $3.3 billion, and is
mostly healthcare, followed by financials and energy.
Our Private Company Watchlist (PCW) contains 234 companies, over 50 of which have reportedly selected banks or filed
confidentially. Technology companies account for approximately 60% of the list and include some familiar names like Uber and
Lyft, which have both filed confidentially and expect to go public in 2019. Several other large private tech firms have been the
subject of 2019 IPO speculation, including Palantir, Pinterest, and Slack. Online women’s fashion retailer Revolve initially filed back
in September, and could potentially set terms this coming year. Beyond these names, 2019 is likely to see more enterprise software
IPOs, as these deals were still able to perform well in the last few months of 2018 despite broader market weakness.
Notable Upcoming Technology IPOs (View Full IPO Pipeline)
Company Business Est.
Sales Est.
Funding Deal Status Industry
Uber On-demand personal transportation service. $12,000 $13,100 Conf. Filing Technology
Lyft On-demand personal transportation service. $2,000 $5,100 Conf. Filing Technology
Palantir Government-focused data analytics platform. $750 $2,440 PCW Technology
Pinterest Pinboard-style social photo sharing website. $1,000 $1,470 PCW Technology
Slack Workplace messaging application. $150 $1,270 PCW Technology
Postmates Online food and goods delivery service. $1,200 $578 Selected Banks Technology
CrowdStrike Cloud-native endpoint security software. $100 $481 Selected Banks Technology
CloudFlare Web security and web content optimization. $100 $182 Selected Banks Technology
Big Switch Networks Hybrid data center networking solutions. n/a $120 PCW Technology
Fiverr Online marketplace for hiring freelancers. n/a $110 PCW Technology
Vertiv Provides fail-safe systems for data centers. $3,900 n/a Selected Banks Technology
Change Healthcare Healthcare revenue management software. $3,400 n/a Selected Banks Technology
Rackspace Leading cloud hosting services provider. n/a n/a PCW Technology
All $ in million. Source: Renaissance Capital.
*Exclusively for IPO Pro Users

US IPO Market 2018 Annual Review
About Renaissance Capital Renaissance Capital provides pre-IPO institutional research and management of the Renaissance IPO ETF (NYSE symbol: IPO) and the Renaissance International IPO ETF (NYSE symbol: IPOS). For more information, visit www.renaissancecapital.com.
Page 13 of 25
Pipeline and PCW: Notable Upcoming Consumer IPOs
While 2018 saw some IPOs from well-known consumer companies, including YETI, Sonos, Hudson, and BJ’s, performance was
decidedly mixed. That said, several consumer names could be gearing up for 2019 offerings. The strong performance by electronic
gaming machine supplier PlayAGS and Macau-based resort and casino Studio City may have encouraged Canadian casino operator
Gateway Casinos to file late in the year. 165-year-old jean maker Levi Strauss is also reportedly planning a potential 2019 IPO that
could raise up to $800 million.
Notable Upcoming Consumer IPOs
Company Business Est.
Sales Est.
Funding Deal Status Industry
Peloton Interactive Stationary bikes with spin class subscriptions. $700 $995 PCW Consumer Disc.
Casper Online mattress retailer. $300 $240 PCW Consumer Disc.
Beyond Meat Sells plant-based meat products. $68 $175 Filed Consumer Staples
Cibus Developing gene-edited seeds. $3 $127 Filed Consumer Staples
Revolve Online women’s fashion retailer. $473 $15 Filed Consumer Disc.
Levi Strauss Sells jeans, jackets, and other apparel. $5,449 n/a PCW Consumer Disc.
Post Active Nutrition Post’s protein supplement spinoff. $828 n/a PCW Consumer Staples
Gateway Casinos Canadian casino operator. $470 n/a Filed Consumer Disc.
PDC Brands Sells branded beauty and wellness products. n/a n/a Selected Banks Consumer Staples
Focus Brands Multi-branded franchisor of 4,500 eateries. n/a n/a Selected Banks Consumer Disc.
Joe & the Juice Health-food chain with 283 global locations. n/a n/a PCW Consumer Disc.
All $ in million. Source: Renaissance Capital.
*Exclusively for IPO Pro Users

US IPO Market 2018 Annual Review
About Renaissance Capital Renaissance Capital provides pre-IPO institutional research and management of the Renaissance IPO ETF (NYSE symbol: IPO) and the Renaissance International IPO ETF (NYSE symbol: IPOS). For more information, visit www.renaissancecapital.com.
Page 14 of 25
Pipeline and PCW: Other Notable Upcoming IPOs
There are a large number of financial companies poised to come public in 2019 including zero-fee stock and cryptocurrency trading
app Robinhood, which was most recently valued at $5.6 billion. Financials are the third most represented sector on our PCW,
behind Healthcare, which has experienced strong performance this year. GE reportedly submitted a confidential filing for its
healthcare unit, which could fetch a value of more than $60 billion. Grail, which was formed by Illumina and is backed by Jeff Bezos
and Bill Gates, is developing a “pan-cancer” screening tests to diagnose people with very early stage cancer, and could come public
during 2019. Biotech IPOs have also been getting bigger, and 2019 could see more well-funded biotechs like Gossamer Bio come
public if the poor trading of high-profile Moderna does not dissuade them.
Other Notable Upcoming IPOs
Company Business Est.
Sales Est.
Funding Deal Status Industry
Robinhood Zero-fee stock trading app. n/a $539 PCW Financials
Futu Holdings Largest China-based online brokerage. $92 $215 Filed Financials
Tiger Brokers Online brokerage for Chinese investors. n/a $139 PCW Financials
TNG FinTech Offers an electronic wallet service in Asia. n/a $115 PCW Financials
XP Investimentos Brazil’s third-largest brokerage firm. n/a n/a PCW Financials
Perella Weinberg Partners Financial services firm and investment bank. n/a n/a Selected Banks Financials
Caliburn International Provides security services to the US government. $704 n/a Filed Industrials
Virgin Trains USA Owns a passenger rail system in Florida. $5 n/a Filed Industrials
Change Healthcare Healthcare revenue management software. $3,400 n/a Selected Banks Industrials
GE Healthcare GE’s healthcare imaging and diagnostics unit. $19,116 n/a Conf. Filing Healthcare
Ardent Health LBO’d operator of 31 acute care hospitals. $3,919 n/a Filed Healthcare
Gossamer Bio Immunotherapies for multiple indications. $0 $310 Filed Healthcare
Grail Developing cancer screening tests. n/a n/a PCW Healthcare
EnVen Energy E&P focused on deepwater oil projects. $524 $145 Filed Energy
Atotech Carlyle-backed specialty chemicals company. $1,100 n/a PCW Materials
Home Partners of America Rent-to-own homeownership programs. n/a n/a PCW Real Estate
All $ in million. Source: Renaissance Capital.
*Exclusively for IPO Pro Users
US IPO Market 2018 Annual Review
About Renaissance Capital Renaissance Capital provides pre-IPO institutional research and management of the Renaissance IPO ETF (NYSE symbol: IPO) and the Renaissance International IPO ETF (NYSE symbol: IPOS). For more information, visit www.renaissancecapital.com.
Page 15 of 25
Outlook
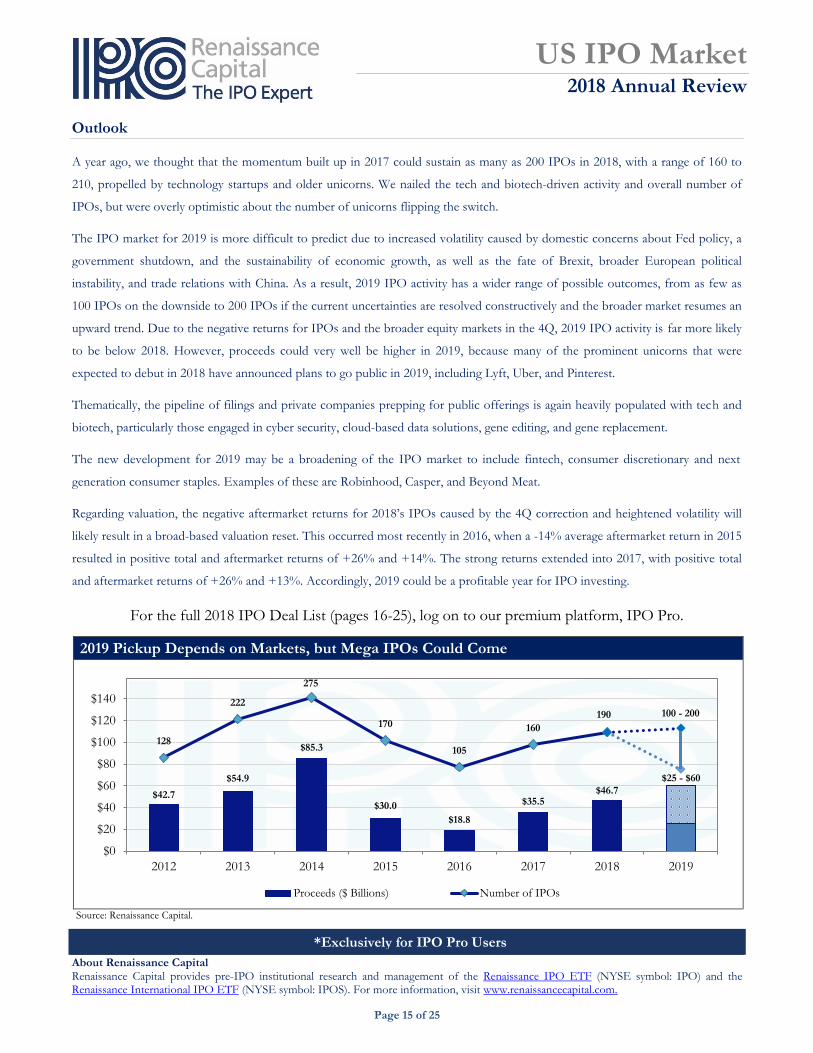
A year ago, we thought that the momentum built up in 2017 could sustain as many as 200 IPOs in 2018, with a range of 160 to
210, propelled by technology startups and older unicorns. We nailed the tech and biotech-driven activity and overall number of
IPOs, but were overly optimistic about the number of unicorns flipping the switch.
The IPO market for 2019 is more difficult to predict due to increased volatility caused by domestic concerns about Fed policy, a
government shutdown, and the sustainability of economic growth, as well as the fate of Brexit, broader European political
instability, and trade relations with China. As a result, 2019 IPO activity has a wider range of possible outcomes, from as few as
100 IPOs on the downside to 200 IPOs if the current uncertainties are resolved constructively and the broader market resumes an
upward trend. Due to the negative returns for IPOs and the broader equity markets in the 4Q, 2019 IPO activity is far more likely
to be below 2018. However, proceeds could very well be higher in 2019, because many of the prominent unicorns that were
expected to debut in 2018 have announced plans to go public in 2019, including Lyft, Uber, and Pinterest.
Thematically, the pipeline of filings and private companies prepping for public offerings is again heavily populated with tech and
biotech, particularly those engaged in cyber security, cloud-based data solutions, gene editing, and gene replacement.
The new development for 2019 may be a broadening of the IPO market to include fintech, consumer discretionary and next
generation consumer staples. Examples of these are Robinhood, Casper, and Beyond Meat.
Regarding valuation, the negative aftermarket returns for 2018’s IPOs caused by the 4Q correction and heightened volatility will
likely result in a broad-based valuation reset. This occurred most recently in 2016, when a -14% average aftermarket return in 2015
resulted in positive total and aftermarket returns of +26% and +14%. The strong returns extended into 2017, with positive total
and aftermarket returns of +26% and +13%. Accordingly, 2019 could be a profitable year for IPO investing.
2019 Pickup Depends on Markets, but Mega IPOs Could Come
Regardless
Source: Renaissance Capital.
$42.7
$54.9
$85.3
$30.0
$18.8
$35.5$46.7
$25 - $60
100 - 200
128
222
275
170
105
160
190
$0
$20
$40
$60
$80
$100
$120
$140
2012 2013 2014 2015 2016 2017 2018 2019
Proceeds ($ Billions) Number of IPOs
*Exclusively for IPO Pro Users
For the full 2018 IPO Deal List (pages 16-25), log on to our premium platform, IPO Pro.


![CARE IPO [Subscribe to this issue] - HBJ Capital](https://static.fdocuments.in/doc/165x107/54c085b04a79596c678b4583/care-ipo-subscribe-to-this-issue-hbj-capital.jpg)