Capital gains taxes and IPO under-pricing · 1 Capital Gains Taxes and IPO Underpricing I....
44
Capital Gains Taxes and IPO Underpricing Katrina Ellis University of California, Davis (530) 754-8407 [email protected] Oliver Zhen Li University of Notre Dame (574) 631-9469 [email protected] John R. Robinson University of Texas at Austin (512) 471-5315 [email protected] November, 2006 ABSTRACT: We investigate the effect of capital gains taxes on security prices by examining whether returns for initial public offerings (IPOs) reflect tax capitalization and/or lock-in. Initial stock returns for IPOs are a proxy for the short-term taxable gains incurred by sellers who receive initial allocations at the offer price. If initial investors are able to shift the short-term capital gains tax burden from selling their shares to equity issuers or subsequent buyers, then the magnitude of IPO underpricing should increase in short-term capital gains taxes. On the other hand, a historically lower long-term capital gains tax rate offers initial investors the opportunity to reduce capital gains taxes if they delay the sale of their shares. If these tax savings are sufficiently large, then the magnitude of IPO underpricing should decrease in long-term capital gains tax rates. We provide empirical evidence supporting both predictions. Further analysis shows that short-term capital gains rate dampens IPO first-day trading volume and long-term capital gains rate enhances trading volume, consistent with the lock-in effect. Our results suggest that taxes play an important role in IPO underpricing and, more broadly, in valuing securities. _______________ We thank seminar participants at the University of California, Davis, University of Florida, Purdue University, and the University of Texas at Austin for helpful comments and suggestions. We also gratefully acknowledge research support provided by our respective institutions: Ellis (University of California, Davis), Li (University of Notre Dame), and Robinson (Red McCombs School of Business and C. Aubrey Smith Professorship).
Transcript of Capital gains taxes and IPO under-pricing · 1 Capital Gains Taxes and IPO Underpricing I....

Capital Gains Taxes and IPO Underpricing
Katrina Ellis University of California, Davis
(530) 754-8407 [email protected]
Oliver Zhen Li
University of Notre Dame (574) 631-9469
John R. Robinson University of Texas at Austin
(512) 471-5315 [email protected]
November, 2006
ABSTRACT: We investigate the effect of capital gains taxes on security prices by examining whether returns for initial public offerings (IPOs) reflect tax capitalization and/or lock-in. Initial stock returns for IPOs are a proxy for the short-term taxable gains incurred by sellers who receive initial allocations at the offer price. If initial investors are able to shift the short-term capital gains tax burden from selling their shares to equity issuers or subsequent buyers, then the magnitude of IPO underpricing should increase in short-term capital gains taxes. On the other hand, a historically lower long-term capital gains tax rate offers initial investors the opportunity to reduce capital gains taxes if they delay the sale of their shares. If these tax savings are sufficiently large, then the magnitude of IPO underpricing should decrease in long-term capital gains tax rates. We provide empirical evidence supporting both predictions. Further analysis shows that short-term capital gains rate dampens IPO first-day trading volume and long-term capital gains rate enhances trading volume, consistent with the lock-in effect. Our results suggest that taxes play an important role in IPO underpricing and, more broadly, in valuing securities. _______________ We thank seminar participants at the University of California, Davis, University of Florida, Purdue University, and the University of Texas at Austin for helpful comments and suggestions. We also gratefully acknowledge research support provided by our respective institutions: Ellis (University of California, Davis), Li (University of Notre Dame), and Robinson (Red McCombs School of Business and C. Aubrey Smith Professorship).

1
Capital Gains Taxes and IPO Underpricing
I. INTRODUCTION
A growing literature suggests that firm value is not independent of shareholder taxes.
Capital gains taxes can affect asset prices in two ways: capitalization or lock-in. Tax
capitalization represents the belief that equilibrium prices reflect expected after-tax
returns. For example, the price of municipal bonds reflects the tax exemption granted
interest paid by these securities. Likewise, if equity prices reflect taxes that investors
expect to pay upon the sale of the securities, pre-tax returns will increase with tax rates
(Brennan (1970)). Recent empirical evidence supports the proposition that equity prices
and trading volume reflect expected taxes on ordinary income or capital gains (i.e.,
Erickson and Maydew (1999); Guenther and Willenborg (1999); Lang and Shackelford
(2000); Ayers, Cloyd, and Robinson (2002); Dhaliwal, Li, and Trezevant (2003);
Dhaliwal, Krull, Li and Moser (2005); and Dhaliwal and Li (2006)).
Lock-in is a related argument made by Klein (1999, 2001) and Viard (2000). They
posit that equity holders will demand to be compensated for any sale that increases or
accelerates expected capital gains taxes. Hence, lock-in refers to the reluctance of holders
to sell securities in the absence of price adjustments that offset incremental taxes. The
literature has also provided some evidence of this effect (Landsman and Shackelford
(1995); Reese (1998); Poterba and Weisbenner (2001); Blouin, Raedy, and Shackelford
(2003); Ayers, Lefanowicz, and Robinson (2003); and Ivkovic, Poterba, and Weisbenner
(2004)).
2
We argue that lock-in is related to tax capitalization. If initial investors fully and
perfectly capitalize taxes on expected future capital gains, there should be no lock-in
effect. The lock-in effect could, however, manifest itself with unexpected price
fluctuations (Klein (2001)), changes in expected tax rates (Lang and Shackelford (2000);
Dai, Maydew, Shackelford, and Zhang (2006)), changes in holding periods (Blouin,
Raedy, and Shackelford (2003)), and in the presence of inadequate initial tax
capitalization. In this paper, we explore the extent to which initial IPO returns reflect
capitalization of short-term capital gains (ordinary) taxes and the trade-off associated
with the expected benefit of deferring realization until gains are subject to lower long-
term capital gain tax rates.
Despite a number of empirical studies, it has been difficult to estimate the direction or
magnitude of any distortion caused by capital gains taxes. This difficulty stems, in part,
from an inability to estimate the marginal trader’s taxable gain and tax rate. There has
been some progress in research on corporate acquisitions. For example, Ayers,
Lefanowicz, and Robinson (2003) argue that the price-setting shareholders in acquired
firms are likely to have the largest taxable gains and are most likely to be taxed at the top
long-term capital gains tax rate. Consistent with this argument, they report a positive
association between the maximum long-term capital gains tax rates and acquisition
premiums and conclude that this represents the capital gains tax lock-in effect.
Initial public offerings (IPOs) offer another potential transaction where tax distortions
might be isolated. For example, Reese (1998) investigates the lock-in effect by arguing
that investors in IPOs are likely to be taxed at the short-term capital gains (ordinary) tax
rate until sufficient time elapses to qualify for a long-term holding period. He compares

3
share prices and volume for two samples of IPOs. One sample consists of IPOs during a
period in which short-term capital gains rates exceeded long-term capital gains rates. He
reports differential price and volume pressure consistent with IPO investors timing the
sale of shares to increase after-tax returns. That is, investors delay the sale of appreciated
shares until after they qualify for long-term status and sell depreciated shares prior to
long-term qualification.
We argue that initial investors are the likely marginal sellers of IPO shares on the first
day of trading. These sellers are likely taxed at the short-term capital gains tax rate, and
because they purchased IPO shares at the offer price, their taxable gains are likely well
represented by the first-day price reaction. If short-term capital gains taxes are
incorporated into equity value, then initial investors will consider potential taxes when
evaluating IPO offer prices. High short-term capital gains tax rates should induce higher
IPO initial returns because equity issuers (underwriters) will reduce the IPO offer prices
to entice initial investors into buying the initial shares (capital gains tax capitalization).
Initial investors could also shift short-term taxes to buyers in the secondary market via
higher ask prices (capital gains tax lock-in). These arguments suggest that IPO
underpricing (first-day returns) could reflect both the capitalization effect and the lock-in
effect for initial investors.
Following Reese (1998), we use the IPO setting to investigate the tension between
short-term and long-term capital gains tax rates to isolate the lock-in effect. However,
instead of examining price and volume reactions around the long-term capital gains
qualification dates, we test whether long-term capital gains tax rates are associated with
IPO underpricing on the offer date. Because initial holders have a stronger incentive to

4
delay sales when long-term capital gains tax rates are low, we argue that a negative
association between underpricing and long-term capital gains tax rates represents the
lock-in effect. Combining these two predictions, we hypothesize that the magnitude of
IPO underpricing should increase in the spread between short-term and long-term capital
gains tax rates.
We test our predictions by estimating underpricing regressions using a sample of
IPOs from 1987 to 2004, a period that includes multiple changes in both long-term and
short-term capital gains tax rates. After controlling for the economic factors commonly
believed to influence IPO underpricing, we find that short-term capital gains rates are
positively associated with IPO underpricing, while long-term capital gains rates are
negatively associated with IPO underpricing. In addition, IPO underpricing is positively
associated with the spread between individual short-term and long-term capital gains tax
rates. We also estimate regressions after limiting our sample to IPOs in adjacent short-
term and long-term tax regimes and find that the positive relation between IPO
underpricing and the spread between short-term and long-term capital gains tax rates is
robust in these sub-periods. Finally, we provide evidence that due to the capital gains tax
lock-in effect, the spread between short-term and long-term capital gains tax rates
suppresses the supply of initial shares on the secondary market and, thereby, trading
volume on IPO days. This volume-based result is important because it provides
substantiation that the lock-in effect of capital gains taxes works through the supply of
initial shares on the secondary market.
Taken together, these findings are consistent with research indicating that capital
gains taxes are capitalized into stock prices and that the magnitude of tax savings

5
associated with long-term status inhibits sales (capital gains tax lock-in). The net effect of
these two forces is that IPO returns are increasing in the spread between short-term and
long-term capital gains rates. Our results triangulate with those in a concurrently
developed paper by Dai, Maydew, Shackelford and Zhang (2006). Dai et al. examine
returns around the Taxpayer Relief Act of 1997 and find evidence of a tax capitalization
effect and a lock-in effect around the announcement and effective dates of the legislation.
The remainder of this paper proceeds as follows. In Section II, we discuss the link
between the magnitude of IPO underpricing and short-term and long-term capital gains
tax rates. Section III describes our sample selection process and empirical methodology.
Section IV presents and discusses the empirical results on IPO underpricing and capital
gains taxes. Section V presents and discusses the empirical results on IPO first-day
trading volume and capital gains taxes. Section VI concludes.
II. UNDERPRICING OF INITIAL PUBLIC OFFERING AND CAPITAL GAINS TAXES
Underpricing of Initial Public Offerings
The average first-day return to IPOs for the period 1987 to 2004 is 21.16 percent.1
Various theories have been developed to explain why firms and their underwriters set the
offer price below what the market is willing to pay (see Ljungqvist (2006) for a thorough
summary). A common feature of many IPO pricing models is that they are driven by
investor demand: firms want to maximize IPO proceeds, but they need to set a price low
enough to encourage enough investors to purchase the entire offering. There are many
1 Average initial return was calculated using the sample on Jay Ritter’s website. Professor Ritter provides monthly initial return data from 1960-2005, with the average initial return for the whole period being 18.82%.

6
conjectures about why firms set offer prices below true (intrinsic) value. For example,
firms may seek to either reward uninformed investors who face a winner’s curse problem
(Rock (1986)), signal firm quality (and hence attract investors) and future capital raising
intentions (Allen and Faulhaber (1989)), or avoid litigation (Tinic (1988)). Alternatively,
firms may attempt to reward informed investors (institutions) who regularly participate in
IPOs and reveal their information about the offering to the underwriter via the book
building process (Benveniste and Spindt (1989)).
Alternative models for IPO underpricing are based on behavioral theories of irrational
firm insiders. These models assume that underwriters do not set IPO prices at a level that
only attracts sufficient investor demand to sell the shares. Instead, they set the price much
lower so that offerings are oversubscribed and IPO shares experience a large price run-up
on the first day of trading. This is due to investor irrationality in Loughran and Ritter
(2002) where insiders focus on their paper wealth, while Loughran and Ritter (2004)
argue that during the 1990s and especially the bubble period of 1999-2000, instead of
focusing on maximizing IPO proceeds, issuers focused on attracting analyst coverage and
finding underwriters who would provide the executives with allocations in other
underpriced IPOs. In both of these frameworks, IPO underwriters choose to set offer
prices far below the reservation price of investors. Marginal effects, such as the tax-rate
of the investor, are unlikely to play a role in these models because the before-tax return
facing investors more than compensates them for their required after-tax return. Thus, if
IPO underpricing is driven by the supply-side (underwriter motives and costs, or firm
insider irrationality) rather than the demand-side (to induce investors to purchase shares
and maximize IPO proceeds), then the impact of taxes may not be important.
7
In this paper, we assume that firms are attempting to maximize IPO proceeds, and
hence the offer price is set by investor demand. Within this class of IPO models, we do
not test which specific theory for IPO underpricing is valid; instead we assume that IPO
underpricing exists as a rational strategy used to induce demand in the IPO, and we argue
that initial investors require the magnitude of IPO underpricing on an after-tax basis. If
this is the case, then the before-tax magnitude of IPO underpricing should be a function
of capital gains taxes.
In addition to the theories mentioned above, researchers have documented that IPO
underpricing and the number of firms going public varies over time with “hot issues”
periods of high activity and high initial returns (Ibbotson and Jaffe (1975)), followed by
periods of low activity. Because we are examining IPOs across time (tax regimes), we
control for the periods of hot and cold cycles in our analysis to isolate any tax regime
effect that may exist above and beyond the variation due to investor sentiment or
changing investment needs of firms going public.
Role of Capital Gains Taxes in the Underpricing of Initial Public Offerings
When an individual buys an asset and later sells it, the resulting gain or loss qualifies
for capital gains treatment. Capital losses offset capital gains, and excess (net) losses
offset other taxable income, albeit to a very limited extent. When the underlying assets
were held more than one year, any resulting net capital gain qualifies for a preferential
(lower) tax rate.2 Otherwise, the gain is taxed at the short-term capital gains tax rate,
which is the same as the tax rate on ordinary income. The marginal tax rate that an
2 With the exception of a brief period during 1997, the long-term holding period of one year did not change during our sample period.

8
investor faces on the sale of an asset depends jointly upon her income level and the
amount of time between the purchase and the sale of the asset. Figure 1 presents the
seven separate short-term capital gains tax rates and three different long-term capital
gains tax rates in effect since 1986.
The tax capitalization effect proposes that the price an investor is willing to pay for an
asset is determined on an after-tax basis. That is, if the tax rate on the expected future
appreciation of an asset is too high, investors will offer to pay a lower price for that asset.
From the perspective of the initial IPO investors, this is a demand-side argument and if
IPO initial investors capitalize capital gains taxes, then IPO offer prices should decrease
in capital gains taxes. On the other hand, the capital gains lock-in effect suggests that if
investors are taxed on capital gains when they sell an asset, they will hold out for a higher
selling price, thereby reducing the supply of the asset. From the perspective of the initial
IPO investors, this is a supply-side argument. Initial investors may require higher short-
term returns to induce selling at high short-term capital gains tax rates, or initial investors
may trade off paying taxes at high short-term capital gains tax rates versus holding the
stock and paying taxes at preferential long-term capital gains tax rates. The differential
taxation of short-term and long-term capital gains in an IPO setting provides an
opportunity to empirically distinguish the capitalization argument from the lock-in
argument. Ultimately, whether we have capitalization and/or lock-in depends on how the
tax burdens are shared among the equity issuers, initial investors, and secondary market
investors.
An important benefit of studying the effect of capital gains taxes on share prices in
the IPO setting is that the tax basis of the initial investors is likely known: it is the IPO
9
offer price. Of course, this benefit relies on the above assumption that the marginal sellers
on the first few days after IPOs are those that receive initial allocations, not the original
owners of the IPO firms.3 In most other settings, such as mergers and acquisitions (Ayers,
Lefanowicz, and Robinson (2003)) and earnings announcements (Blouin, Raedy, and
Shackelford (2003)), proxies have to be used for investor capital gains tax bases. These
proxies almost certainly contain measurement errors. Landsman and Shackelford (1995)
use the actual tax basis to examine confidential shareholder records prior to the RJR
Nabisco leveraged buyout, and they find support for the lock-in effect as shareholders
with the largest capital gains demanded the highest selling price. Although analyzing the
RJR Nabisco transaction in detail provided many insights into investor tax rationality,
IPOs provide us with another setting with a known tax basis that varies across many deals
over many years.
We investigate the capitalization and lock-in effects of capital gains taxes on IPO
underpricing by exploring the relation between the magnitude of IPO underpricing and
the short-term capital gains tax rate. As initial investors are the likely marginal sellers for
IPOs on the first day (or the first few days) of trading, they are likely taxed at the short-
term capital gains tax rate on the amount of the initial returns (or underpricing).
Of course, not all initial investors in IPOs are subject to income taxes. Hanley and
Wilhelm (1995) show that institutional investors account for over 70% of IPO
3 In a typical initial public offering, the initial owners of the firm are either bound by underwriter lock-up agreements or by SEC Rule 144 trading volume restrictions, and thus these long-term investors are unable to trade during the first few days after the IPOs. Indeed, Brav and Gompers (2003) document that insiders lock up 93% of their shares during an IPO. SEC Rule 144 trading restrictions apply to owners who received shares that were issued via private placements before the company went public (restricted shares). Rule 144 allows for the sale of restricted shares in limited quantities: shares cannot be sold until they have been owned for at least one year, after which the number of shares sold during a three-month period cannot exceed 1% of the shares outstanding, or the average weekly trading volume. As these owners are also likely subject to underwriter lock-ups, their trading is minimal in the first few days after the IPOs.

10
allocations, and Boehmer, Boehmer, and Fishe (2006) show equally high institutional
participation in IPOs. Institutional investors may be tax-exempt (e.g., retirement plans),
taxable (corporations), or mutual funds, which may or may not make investment
decisions consistent with the tax status of their investors (i.e., taxable individuals,
corporations, retirement plans, etc.). Although capital gains taxes may be an important
consideration for certain types of institutional investors, in aggregate, the presence of
institutional investors mitigates the effect of capital gains taxes (Ayers, Lefanowicz, and
Robinson (2003)). In our research design, the presence of institutional investors should
bias against finding a relation between capital gains tax rates and the magnitude of IPO
underpricing.
If the marginal seller of IPO shares on the first few days of trading is subject to short-
term capital gains taxes on the initial IPO returns, her willingness to sell her initial shares
is inversely related to the level of short-term capital gains taxes because these taxes
represent a cost of selling her initial shares. To induce her to sell these shares, the buyers
in the secondary market have to offer to pay a higher price (lock-in). Alternatively, if
initial investors are tax sensitive, underwriters may need to lower the initial offer price to
induce these investors to buy the initial allocations (capitalization). If capital gains taxes
are capitalized into stock prices, then the tax burden likely is passed onto the equity
issuers as underwriters are willing to lower the offer prices so that the initial investors’
after-tax returns stay constant. In other words, capital gains taxes represent a component
of the cost of equity capital. To summarize, tax capitalization causes IPO initial return to
increase through a lower offer price, whereas lock-in causes IPO initial return to increase
through a higher secondary market ask price. Thus, our first hypothesis is:

11
HYPOTHESIS 1: The magnitude of IPO underpricing increases in the short-term capital gains tax rate.
Using a group of small IPOs around the 1993 tax law change that reduced the capital
gains taxes on qualified small business stocks, Guenther and Willenborg (1999) report
that IPOs qualifying for this special preferential tax treatment have higher issuing prices
(smaller first-day returns) after the tax regime change, while non-qualifying IPOs are not
affected by this tax law change. Their evidence suggests that capital gains taxes affect
IPO underpricing. However, their study is restricted to an analysis of a very limited
sample of small IPOs (177 IPOs) around 1993 that appeared to qualify for an unusual
capital gains treatment. In contrast, we analyze a large sample of IPOs occurring over 18
years. Thus, we are able to provide more general evidence that taxes impact IPO
underpricing.
The lock-in effect of capital gains taxes can be distinguished from the capitalization
effect by the tension between short-term and long-term capital gains taxes. In the U.S.,
the long-term capital gains tax rate has been historically lower than the short-term capital
gains tax rate. This being the case, initial investors will be less willing to sell IPO shares
if the initial gains can qualify for long-term capital gains treatment at a lower rate in the
future. For example, suppose that an investor is subject to a long-term capital gains tax
rate of 15% and a short-term capital gains tax rate of 35%. In order to realize an after-tax
return of 20% on an IPO, this investor must realize a short-term pre-tax return of 30.8%
[20%/(1 – 0.35)] but will only need to realize a long-term pre-tax return of 23.5%
[20%/(1 – 0.15)]. Hence, the lower the long-term capital gains tax rate, the more likely
that initial investors will refrain from selling initial shares. This reduces the supply of
initial shares in the secondary market and thereby increases the initial returns.

12
With the exception of the original owners of the firm, none of the initial investors in
an IPO will qualify for a long-term holding period if they sell shares immediately after
the IPO. We conjecture that the accumulation of short-term capital gains by initial
investors causes the supply of IPO shares to shrink in the secondary market. Because the
sale of IPO shares will trigger a tax liability, potential buyers need to offer a higher price
to induce initial investors to sell. A reduced long-term capital gains tax rate induces
initial investors to delay the sale. To the extent that initial investors ignore this tax saving
opportunity and sell shares on the IPO days, initial returns should increase to compensate
investors for foregoing the benefits of deferring sales. Thus, our second hypothesis is:
HYPOTHESIS 2: The magnitude of IPO underpricing decreases in the long-term capital gains tax rate.
Reese (1998) presents evidence consistent with this conjecture. Using IPO firms, he
shows that when the short-term capital gains tax rate is higher than the long-term capital
gains tax rate, stocks that have appreciated prior to long-term qualification exhibit
increased volume and decreased returns immediately after their qualification dates. In
contrast, stocks that have declined in value prior to long-term qualification exhibited
these same price and volume effects immediately prior to the date for long-term
qualification.
Reese (1998) does not examine whether capital gains taxes affect stock returns on the
first few days of trading after IPOs. There are reasons to believe that the effect of long-
term capital gains taxes on the magnitude of IPO underpricing is limited. The incentive of
initial investors to wait to sell their shares right after IPOs may not be as pronounced as
right before (after) long-term capital gains qualification dates when their shares have
appreciated (depreciated). Uncertainty over the long run may mitigate the incentive to

13
hold shares for long-term qualification. For example, Ritter (1991) and Loughran and
Ritter (1995)) document that IPO stocks under-perform over time. Hence, the extent to
which the lock-in effect is manifested in initial returns is an empirical question.
Hypotheses 1 and 2 suggest that if initial investors value their shares on an after-tax
basis, then the magnitude of IPO underpricing increases in short-term capital gains tax
rate and decreases in long-term capital gains tax rate. An alternative way of testing
Hypotheses 1 and 2 is to examine the link between IPO underpricing and the spread
between short-term and long-term capital gains tax rates. The spread between short-term
and long-term capital gains tax rates represents the potential tax savings from deferring
the realization of the initial gains from IPOs. To the extent that initial investors do not
defer the sale of their initial shares, this spread represents a tax burden. In equilibrium,
this tax burden may be absorbed by the equity issuers as a component of the cost of
equity capital. Thus, we can integrate Hypotheses 1 and 2 into one hypothesis and test
whether this spread between long-term and short-term capital gains tax rates is positively
associated with the magnitude of IPO underpricing.
HYPOTHESIS 3: The magnitude of IPO underpricing increases in the spread between short-term and long-term capital gains tax rates.
Hypothesis 3 is not independent of Hypotheses 1 and 2. It is an alternative way of testing
Hypotheses 1 and 2 simultaneously.
Underpricing could reflect capitalization, lock-in, or a combination of these effects,
or, if initial investors cannot recoup taxes from either equity issuers or the buyers in the
secondary market, then neither effect may occur. Hence, the existence of capitalization
and/or lock-in is an empirical question. This study and Dai, Maydew, Shackelford, and

14
Zhang (2006) are among the first to strive to empirically isolate and estimate these two
influences.
III. DATA AND METHODS
We collect an initial sample of 5,534 initial public offerings from 1987 to 2004 using
Thomson Financial’s SDC Global New Issues Database. We choose to initiate the sample
in 1987 for several reasons. First, the Tax Reform Act of 1986 reduced both short-term
and long-term capital gains tax rates, and it also significantly altered the tax landscape
with major revisions of both corporate and individual taxes. Second, prior to 1987 the
short-term and long-term capital gains tax rates were highly correlated, making it difficult
to distinguish the capital gains tax capitalization effect from the lock-in effect.4 Finally,
many of our regression control variables are only available beginning around 1987 (e.g.,
underwriter rankings, auditors, etc.).
We exclude IPOs that are typically excluded from empirical studies: closed-end
funds, REITS, ADRs, unit offerings, IPOs with an offer price below $5 per share, and
financial sector IPOs (one-digit SIC code = 6). We obtain price data from the Center for
Research in Security Prices (CRSP) to calculate initial returns. Limiting IPOs to those
with initial returns restricts our sample to 4,675 IPOs. To conduct regression analysis, we
restrict our sample to those IPOs with complete price and control data. This limitation
reduces the regression sample to 4,044 IPOs. The distribution of sample IPOs across
4 The correlation between the long-term and short-term capital gains tax rates is primarily due to the deduction for long-term capital gains. In essence, prior to 1986 the long term tax rate was a fraction of the short-term rate, and the fraction was dictated by the percentage of the capital gains deduction. For example, when the capital gains deduction was 60 percent, the long-term tax rate was effectively 40 percent of the short-term rate.

15
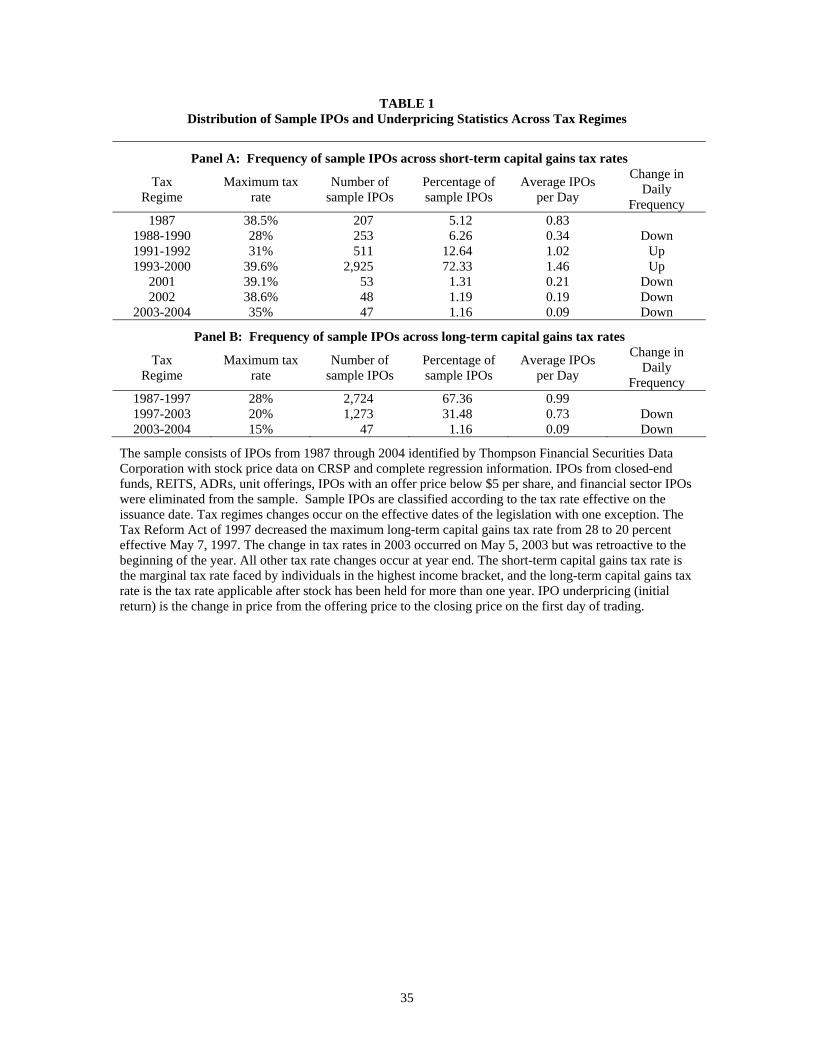
short-term and long-term tax regimes is presented in Table 1, Panels A and B,
respectively.
The characteristics of the control variables are presented in Table 2. The firms in our
regression sample have an average market capitalization of $448.9 million, with an
average IPO size of $54.9 million at an average offer price of $12.19 per share. As the
time period spans almost two decades, rather than using the size of the deal in dollars, we
use the logarithm of the deal size deflated by the CPI index. The average initial return is
23.65%, with a median of 9.09%, in line with other studies. Most deals are underwritten
by high quality underwriters, 47.5% have venture capitalist backing, and 44.4% are in a
technology industry. The average (median) firm is just over 13 (4) years old at the time of
the IPO.
As controls for underpricing, we include several variables that have been found to be
related to initial returns in other studies. Hanley (1993) showed that initial returns are
positively correlated with the price revision during the bookbuilding process. This
relation is consistent with the model proposed in Benveniste and Spindt (1989) where
underwriters induce investors to reveal information during the bookbuilding process by
rewarding them with underpricing, as well as with the prospect theory argument in
Loughran and Ritter (2002). The result is that there is only a partial adjustment of the
offer price to the information revealed during the bookbuilding process.
Underpricing is related to uncertainty about the value of the offering, and thus
variables that reduce this uncertainty have been found to be negatively related to
underpricing. The reputation of the lead underwriter can certify the quality of the IPO,
and thus IPOs underwritten by higher reputation underwriters have less underpricing.
16
This relation was found during the 1980s (Carter, Dark, and Singh (1998)) but reversed
during the 1990s and especially during the dotcom bubble of the late 1990s, where the
most prestigious investment banks underwrote enormously underpriced IPOs. Thus, as
our sample covers 1987 to 2004, we expect to find the same positive relation between
reputation and initial returns as found in Beatty and Welch (1996) and Loughran and
Ritter (2004). We use Carter and Manaster’s (1990) underwriter ranking, as updated on
Jay Ritter’s web page. Other variables that are related to the quality of the firm, and
hence lower underpricing, are the age of the firm (Field and Karpoff (2002)), a venture-
backing dummy (Barry, Muscarella, Peavy, and Vetsuypens (1990)), and auditor prestige
(Michaely and Shaw (1995)).
Although the presence of venture capital investors can certify the quality of an IPO to
the market and results in lower initial returns, an alternative view is that venture
capitalists opportunistically time the IPOs of their investments in order to maximize their
returns (Lerner (1994)) and to attract future venture fund investors. Gompers (1996)
highlights the motives of young venture capital firms to establish a reputation by
successfully exiting their investments quickly through IPOs. This results in higher
underpricing for venture-backed IPOs, as the venture capitalists are willing to bear this
cost rather than fail to exit the investment. Consistent with this idea, Lee and Wahal
(2004) find that venture-backed IPOs have higher initial returns than non-venture-backed
IPOs.
During the dotcom boom, IPO initial returns were extremely high, averaging over
70%, so we also add a dummy variable for this time period. Lowry (2003) shows that
IPO returns are related to recent past returns and recent IPO activity. We control for hot

17
IPO cycles by including the average return and the total number of IPOs during a firm’s
IPO month and the prior month. Underpricing is a cost to the issuing firm. Another cost
that the issuing firm bears is the fee paid to the underwriting syndicate. Although fees are
clustered at 7% of the offering amount for the majority of offerings (Chen and Ritter
(2000)), higher fees are charged for more risky deals.
We control for all the above factors that impact the magnitude of IPO underpricing in
our examination of the relation between IPO underpricing and capital gains taxes. We
estimate the following regression model:
Underpricingit = β0 + β1ST TAXit or β1LT TAXit or β1TAXDIFFit + β2VCit + β3RANKit + β4REVISIONit + β5SPREADit + β6TECHit + β7VWTOTit + β8IPORETit + β9IPOTOTit + β10AUDITDit + β11LAGEit + β121/OFFERit + β13PROCEEDSit + β14DOTCOMit+ εit, (1)
where Underpricing is the dependent variable IPO underpricing or first-day return; ST
TAX is short-term capital gains tax rate; LT TAX is long-term capital gains tax rate; and
TAXDIFF is the spread between short-term capital gains tax rate ST TAX and long-term
capital gains tax rate LT TAX. We test the effects of ST TAX, LT TAX and TAXDIFF
separately. We expect the effect of ST TAX on Underpricing to be positive (Hypothesis
1), the effect of LT TAX on Underpricing to be negative (Hypothesis 2), and the effect of
TAXDIFF on Underpricing to be positive (Hypothesis 3).
We define our control variables using prior studies. Venture capital backing (VC) is
represented by a binary dummy that equals one if the IPO has venture capitalists’ backing
and zero otherwise. Consistent with the view that venture capitalists grandstand via
taking their investments public (Gompers (1996); Lee and Wahal (2004)) we expect
venture capital backing VC to be positively related to Underpricing. Reputation of

18
underwriters (RANK) is the Carter-Manaster ranking (Carter and Manaster (1990)). As
discussed previously, we expect RANK to have a positive effect on Underpricing for our
time period. We expect price revision (REVISION) during the bookbuilding process to be
positively related to Underpricing (Hanley (1993)). Underwriters do not trade off fees for
Underpricing, instead charging higher fees for more risky offerings. Hence, we expect
the effect of fee paid to underwriters (SPREAD) to be positively associated with
Underpricing. Technology IPOs are represented by a binary variable (TECH) that equals
one for firms defined as within a technology industry. We define technology industries
following the four-digit SIC codes in Cliff and Denis (2004), and we expect TECH to
have a positive effect on Underpricing.
We control for the market return preceding sample IPOs using a market return
(VWTOT) calculated as the sum of the value weighted market return for the month of the
IPO and the month prior to the IPO. We expect VWTOT to be positively associated with
Underpricing. We also control for the strength of the IPO market prior to each IPO by
including two variables: the average IPO initial return during a firm’s IPO month and the
prior month (IPORET) and the total number of IPOs during a firm’s IPO month and the
prior month (IPOTOT). We expect IPORET to be positively associated with
Underpricing. If IPOTOT represents the total supply of IPOs, it should be negatively
associated with Underpricing. AUDITD is a big-auditor dummy that equals one if the
auditor of the IPO firm is a big-8, -6 or -4 auditor, and zero otherwise. We expect
AUDITD to have a negative effect on Underpricing. LAGE is the logarithm of a firm’s
age at IPO. We expect young firms to have more IPO underpricing. 1/OFFER is the
inverse of IPO offer price. Since firms with a lower offer price have high IPO
19
underpricing, we expect it to have a positive effect on Underpricing. PROCEEDS is the
logarithm of IPO proceeds in millions, deflated by CPI. We expect it to have a negative
effect on Underpricing. DOTCOM is a dummy variable that equals 1 for an IPO during
the dotcom period (January 1999 through March 2000) and zero otherwise. We expect
DOTCOM to have a positive effect on IPO underpricing.
IV. EMPIRICAL RESULTS ON IPO UNDERPRICING AND CAPITAL GAINS TAXES
Univariate Analysis
Before analyzing the relation between initial returns and capital gains tax rates via
regression analysis, we compare the level of initial returns from one tax regime to the
next to determine whether the returns appear to move up in higher tax regimes and down
in lower tax regimes. Short-term capital gains taxes have the most variation in maximum
tax rates with seven different tax regimes. All else equal, we would expect the changes in
the mean (median) first-day return to be positively associated with the changes in the
short-term regime, but we observe in Panel A of Table 3 that the change in first-day
return is in the same direction as the change in the tax rate for only four of the six short-
term regime changes.
Likewise, in Panel B of Table 3 the change in first-day return is in the opposite
direction as the change in the tax rate for one of the two long-term regime changes. The
last column in Table 1 and Table 3 presents the average daily frequency of IPO issuances
across each tax regime. All else equal, we would expect IPO volume to change inversely
with the top tax rates as high tax rates would inhibit investor demand for shares.
However, the pattern of IPOs does not align with the expected tax pattern. Hence, in

20
Tables 1 and 3 we do not observe a strong pattern of first-day returns or IPO volume
consistent with a tax hypothesis. Of course, caution should be used in interpreting
descriptive data without other controls.
Regression Analysis
Information for constructing many of our control variables is limited prior to 1980,
and hence, our initial regression analysis is based upon IPOs from 1987 through 2004.
For example, our measure of underwriter reputation RANK is limited to periods
beginning in 1980, and our auditor dummy variable AUDITD is limited to IPOs occurring
after 1986. In addition, from Table 2 it is apparent that many of our sample IPOs fall in
one tax regime, the 1993-2000 period that covers the technology bubble period, and this
may bias against finding strong time series results that are related to capital gains taxes.
Our regression results are presented in Table 4. In the model with the short-term
capital gains tax rate, the coefficient on ST TAX is positive (0.72, t = 4.03) and significant
at the 1% level. This result is consistent with Hypothesis 1: the magnitude of IPO
underpricing is positively related to the short-term capital gains tax rate. In the model
with the long-term capital gains tax rate, the coefficient on LT TAX is negative (–0.63, t =
-3.35) and significant at the 1% level. This result is consistent with Hypothesis 2: the
magnitude of IPO underpricing is negatively related to long-term capital gains tax rate.
While a positive coefficient on ST TAX can reflect both a capitalization effect and a lock-
in effect, the negative coefficient on LT TAX reflects a lock-in effect. When we include
ST TAX and LT TAX simultaneously in the regression model, the coefficient on ST TAX is

21
positive and significant (0.58, t = 2.98), and the coefficient on LT TAX is negative and
significant (-0.40, t = -1.97), again supporting both Hypotheses 1 and 2.
In the model using the spread between short-term and long-term capital gains tax
rates, the coefficient on TAXDIFF is positive (0.50, t = 4.45) and significant at the 1%
level. This result supports Hypothesis 3. That is, the magnitude of IPO underpricing is
positively related to the tax rate difference between short-term and long-term capital
gains. In summary, the above results suggest that taxes impact the magnitude of IPO
underpricing and that taxes are likely a component of the cost of equity capital.
Based on the regression model that includes short-term and long-term capital gains
tax rates simultaneously, the above results suggest that with a 5% increase in the short-
term capital gains tax rate, the magnitude of IPO underpricing increases by 2.90% [0.58 ×
5%]; and with a 5% increase in the long-term capital gains tax rate, the magnitude of IPO
underpricing decreases by 2.00% [0.40 × 5%]. Based on the regression model that uses
the spread between short-term and long-term capital gains tax rates, a 5% widening of the
spread translates into a 2.50% [0.50 × 5%] increase in the magnitude of IPO
underpricing. While it is difficult to predict ex ante the sensitivity of underpricing to
capital gains taxes, the economic magnitude of the effect of capital gains taxes based on
our regression results appears to be significant.
The effects of most of the control variables are consistent with our expectations. The
coefficients on VC, RANK and REVISION are positive and significant in all three models,
consistent with the literature. The effect of SPREAD is insignificant. The coefficient on
TECH is positive and significant, suggesting that the magnitude of IPO underpricing is
higher for tech firms. While the effect of VWTOT is insignificant, there appears to be
22
some IPO momentum. The coefficient on IPORET is positive and significant. The supply
of IPOs appears to have a dampening effect on IPO underpricing. The coefficient on
IPOTOT is negative and significant. The effect of AUDITD is negative and marginally
significant, suggesting that big auditors help reduce the magnitude of IPO underpricing.
The coefficient on LAGE is negative and significant, consistent with the literature that
younger firms have higher underpricing. 1/OFFER appears to be positively related to
underpricing, suggesting that higher priced IPOs have lower returns. The effect of
PROCEEDS is negative and significant, suggesting that size of the IPO negatively
impacts underpricing. The effect of DOTCOM on underpricing is positive and significant,
consistent with our expectation.5
Regime Comparisons
So far we have tested the relation between the magnitude of IPO underpricing and the
spread between short-term and long-term capital gains tax rates over the period 1987 –
2004 when we have data for control variables. Here we expand our analyses to test the
relation between adjacent regimes to determine if the positive relation between IPO
underpricing and tax spread holds across changes in short-term capital gains tax rates and
long-term capital gains tax rates. In these adjacent regime comparisons, we limit the
regression samples to IPOs in two adjacent tax regimes. For example, in comparing the
short-term capital gains tax regimes (ST2 and ST3), we limit the regression sample to
5 Our results are not driven by the high initial returns in the dotcom period, although the magnitude of coefficients is lower when we exclude this period. Recalculating Table 4 regressions while excluding all 479 IPOs in our sample during the dotcom period of January 1999 through March 2000 result in significant coefficients on the tax variables: ST TAX is positive (0.54, t=4.56), LT TAX is negative (-0.46, t=-3.62), TAXDIFF is positive (0.37, t=4.97), and when we include both ST TAX and LT TAX the coefficients are both significant (ST TAX = 0.44, t=3.48, LT TAX = -0.28, t=-2.10).

23
IPOs over the period 1988-1990 and 1991-1992. There are sufficient IPO observations to
estimate regressions across three short-term capital gains tax regime changes and one
long-term capital gains tax regime change, and the regression results are presented in
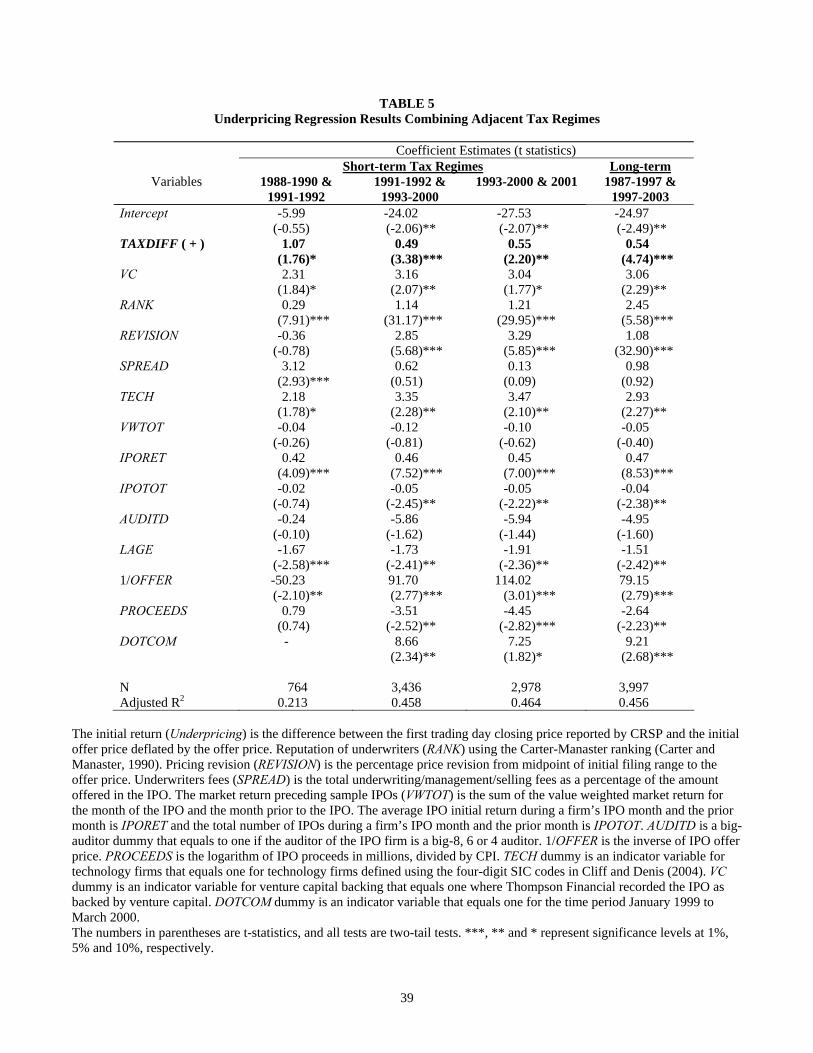
Table 5. We limit our analysis to the model using the spread between short-term and
long-term capital gains tax rates, TAXDIFF.
For the three short-term capital gains tax regime changes, consistent with Hypothesis
3, the estimated coefficients on TAXDIFF are all positive and significant. For example,
the estimated coefficient for TAXDIFF is 0.49 (t = 3.38) when the regression sample is
limited to IPOs occurring during the 1991-1992 and 1993-2000 tax regimes. When the
regression sample is limited to the two long-term capital gains tax regimes with sufficient
sample size (the 1987-1997 and 1997-2003 tax regimes), the estimated coefficient for
TAXDIFF is also consistent with Hypothesis 3 (β1 = 0.54, t = 4.74). In summary, the
positive relation between the magnitude of IPO underpricing and the spread between
short-term and long-term capital gains tax rates is robust when the regression sample is
limited to adjacent tax regimes.
Time Clustering
Over time, the number of companies going public fluctuates, resulting in hot and cold
IPO markets. This means that our sample is clustered in time with some months having
many more observations than other months. Because time periods are not weighted
equally in our regressions, our coefficient estimates may be influenced by the hot IPO
months. We address this possibility by estimating the regression analysis in Table 4 using
each month as our unit of observation, rather than each IPO. We calculate monthly

24
averages for all variables and estimate the regressions with 196 month-observations.
Table 6 shows the results: the monthly average initial return is positively related to the
short-term tax rate, negatively (but insignificantly) related to the long-term capital gains
tax rate, and positively related to the spread between them. We conclude that time
clustering is unlikely to be responsible for our results.
Individual and Institutional Investors
The relation between personal tax rates and underpricing should be stronger in IPOs
with more individual investors. However, institutional investors constitute a segment of
IPO investors, and institutions may be nontaxable entities. Unfortunately, we cannot
ascertain which IPOs are more likely to be sensitive to tax rates because IPO allocations
are not made public. While we do not have a good measure of the number of shares
allocated to and purchased by institutions in any specific IPO, we can collect ex post
institutional ownership from Spectrum SEC 13F reports. These quarterly reports contain
institutional ownership and provide an approximate measure of institutional participation
in IPOs, albeit up to three months after the initial trading date.
We collect the first reported institutional ownership from the Spectrum database for
3,949 of the 4,044 IPO firms. We include the percent of shares owned by institutions as
an additional control variable in our return regressions. To test whether the relation
between taxes and initial returns is stronger for firms with more individual initial
investors, we interact institutional ownership percentage with our tax variables. We
expect a negative coefficient on the interaction with short-term tax rate and positive
coefficient on the interaction with long-term tax rate. None of the interaction variables is

25
significant (results not tabulated), and thus we are unable to verify that the impact of
taxes is stronger in IPOs with more individual investors.
We test several other proxies for institutional/individual ownership. For example, we
posit that small IPOs and IPOs underwritten by low reputation underwriters (Carter-
Manaster rank less than eight) are likely to have fewer shares allocated to institutions,
and thus, the underpricing of these IPOs may be more strongly related to individual tax
rates. Using interactions with these proxies in our regressions, we are again unable to
report any significant tax coefficients (results not tabulated). Hence, while our results are
consistent with individual tax capitalization and lock-in for IPOs, we are unable to
directly verify whether firms with higher individual ownership are more likely to exhibit
capitalization or lock-in effects.
V. EMPIRICAL RESULTS ON IPO FIRST-DAY TRADING VOLUME AND CAPITAL GAINS TAXES
As the capital gains tax lock-in hypothesis has implications for the willingness of
initial investors to sell, we expect that IPO first-day trading volume will be related to
taxes. Specifically, the lock-in effect should make an initial investor more reluctant to sell
IPO shares. Thus, we expect a negative (positive) relation between short-term (long-term)
capital gains tax rates and first-day trading volume. However, there are several reasons
why it may be difficult to empirically detect any direct relation between tax rates and
trading volume. First, the trading volume for IPOs is extraordinarily high on the first
days of trading (Aggarwal (2000); Ellis, Michaely, and O’Hara (2000)). Moreover, first-
day trading volume is related to the initial return (i.e. IPOs with larger underpricing have
higher trading volume). Finally, over our sample time period, trading volume has

26
increased across all stocks, and thus we have a general trend of larger trading volume in
the later part of our sample period.6
Rather than testing the direct relation between volume and taxes, we examine how
taxes interact with the relation between trading volume and underpricing. Because there
is a strong positive relation between trading volume and underpricing, we posit that this
relation will be moderated in periods with high lock-in effect (e.g., high short-term tax
rate or low long-term tax rate). Specifically, if short-term capital gains taxes suppress
selling on the first day, we would expect the short-term capital gains tax rate to dampen
the relation between trading volume and underpricing. On the other hand, if a higher
long-term capital gains tax rate makes initial investors less willing to delay their sale of
initial shares, it should enhance the relation between trading volume and underpricing.
Combining both of these predictions, the relation between trading volume and
underpricing should decrease in the spread between short-term and long-term capital
gains tax rates. We estimate the following regression model:
IPO TURNOVERit = α0 + α1TAXit + α2Underpricingit + α3 TAX·Underpricingit + α4VCit + α5RANKit + α6REVISIONit + α7SPREADit + α8TECHit + α9VWTOTit + α10IPORETit + α11IPOTOTit + α12AUDITDit + α13LAGEit + α141/OFFERit + α15PROCEEDSit + α16DOTCOMit + εit. (2)
The dependent variable, IPO TURNOVER, is defined as the number of shares traded on
the first day of trading scaled by the number of shares offered in the IPO. We estimate
four regressions, each with a different TAX measure: either the short term capital gains
tax rate (ST TAX), the long term capital gains tax rate (LT TAX), both short-term and
6 For example, the average daily trading volume on the NYSE was 157,000,000 shares per day in 1990, 346,000,000 shares per day in 1995, 1,042,000,000 shares per day in 2000 (source: NYSE Statistics Archive at www.nyse.com)

27
long-term capital gains tax rates, or the spread between the short-term and long-term
capital gains tax rates (TAXDIFF). In each regression, the variable of interest is the
interaction term between TAX and Underpricing. To avoid multicollinearity, the mean of
each interacted variable is subtracted first, and the interaction is calculated as the product
of the de-meaned underpricing and tax variables. We include the same control variables
as in the prior regressions in Tables 4 and 5.
Table 7 presents regression results analyzing the effect of capital gains taxes on IPO
first-day trading volume. The average IPO turnover is 80% of the offering, with a median
of 64%, in line with other studies. The estimated coefficients on the tax variables reflect
the increase in volume over time (higher volume in the 1990s when short term tax rates
were higher and long-term tax rates were lower), and the positive coefficient on
underpricing is as expected.
Our focus is on the interaction terms, and we find coefficients consistent with the
capital gains tax lock-in effect dampening trading volume: A higher short-term capital
gains tax rate results in a decrease in the relation between trading volume and
underpricing (coeff. = -0.04, t = -3.32); a higher long-term capital gains tax rate results in
an increase in the relation between trading volume and underpricing (coeff. = 0.07, t =
11.37); and the wider the spread between the short-term and long-term capital gains tax
rates, the smaller the magnitude of the relation between trading volume and underpricing
(coeff. = -0.04, t = -9.74). This volume-based result is important because it suggests that
the lock-in effect works through reducing the supply and thus the trading of initial shares
in the secondary market.
28
VI. CONCLUSIONS
In this paper, we empirically examine whether the magnitude of IPO underpricing is
related to capital gains taxes. We argue that if the initial investors of an IPO evaluate
returns on an after-tax basis, then underwriters should consider investor tax rates when
setting offer prices to provide adequate after-tax returns. Alternatively, initial investors
could set ask prices that have the effect of shifting the tax burden to secondary market
investors. Thus, when initial investors are the marginal sellers on the first day of an IPO,
the magnitude of IPO underpricing should increase in short-term capital gains tax rate.
The long-term capital gains tax rate is historically lower than the short-term capital gains
tax rate. It represents the benefit of delaying the realization of initial returns. The lower
the long-term capital gains tax rate, the more reluctant initial investors are to sell their
shares right after IPOs to realize the short-term capital gains. To induce them to sell,
initial before-tax returns have to be higher. Thus, the magnitude of IPO underpricing
should decrease in long-term capital gains tax rate.
Using a large sample of IPOs spanning the period 1987 – 2004, we find a positive
relation between the magnitude of IPO underpricing and the short-term capital gains tax
rate and a negative relation between the magnitude of IPO underpricing and the long-
term capital gains tax rate. We also find a positive relation between IPO underpricing and
the spread between short-term and long-term capital gains tax rates. Further, our analysis
of first-day trading volume suggests that short-term capital gains taxes suppress IPO
trading volume, while long-term capital gains taxes enhance IPO trading volume, due to
the lock-in effect. These results reinforce the notion that taxes are a factor, among others,

29
that determines the magnitude of IPO underpricing. More broadly, our results suggest
that taxes influence asset prices through both the capitalization and lock-in effects.
30
REFERENCES Aggarwal, R., 2000, Stabilization activities by underwriters after Initial Public Offerings,
Journal of Finance 50, 1075-1103. Allen, F., and Faulhaber, G., 1989, Signaling by underpricing in the IPO market, Journal
of Financial Economics 23, 303-323. Ayers, B.C., C.B. Cloyd, and J.R. Robinson, 2002, Capitalization of shareholder taxes in
stock prices: Evidence from the Revenue Reconciliation Act of 1993, The Accounting Review 77, 933-947.
Ayers, B.C., C. E. Lefanowicz, and J. R. Robinson, 2003, Shareholder taxes in
acquisition premiums: The effect of capital gains taxation, The Journal of Finance 58, 2783-2801.
Barry, C., Muscarella, C., Peavy, J., and Vetsuypens, M., 1990, The role of venture
capital in the creation of public companies: evidence from the going-public process, Journal of Financial Economics 27, 447-471.
Beatty, R., and Welch, I., 1996, Issuer expenses and legal liability in initial public
offerings, Journal of Law and Economics 39, 545-602. Benveniste, L., and Spindt, P., 1989, How investment bankers determine the offer price
and allocation of new issues, Journal of Financial Economics 24, 343-362. Blouin, J.L., Raedy, J.S., Shackelford, D.A., 2003. Capital gains taxes and equity trading:
Empirical evidence. Journal of Accounting Research 41, 611-651. Boehmer, B., Boehmer, E., and Fishe, R., 2006, Do institutions receive more favorable
allocations in IPOs with better long run market performance? Journal of Financial and Quantitative Analysis, forthcoming.
Brav, A., and Gompers, P., 2003, The role of lockups in initial public offerings, Review
of Financial Studies 16, 1-29. Brennan, M., J., 1970, Taxes, market valuation and corporate financial policy. National
Tax Journal 23, 417-427. Carter, R., Dark, F., and Singh, A., 1998, Underwriter reputation, initial returns, and the
long-run performance of IPO stocks, Journal of Finance 53, 285-311. Carter, R., Manaster, S., 1990. Initial public offerings and underwriter reputation. Journal
of Finance 44, 1045-1067.

31
Chen, H., and Ritter, J., 2000, The seven percent solution, Journal of Finance 55, 1105-1131.
Cliff, M. T., and D. J. Denis, 2004, Do initial public offering firms purchase analyst
coverage with underpricing? Journal of Finance, 59, 2871-2901. Dai, Z., E. Maydew, D. A. Shackelford, and H. H. Zhang, 2006, Capital gains taxes and
asset prices: Capitalization or lock-in, working paper. Dhaliwal, D. S., Li, O. Z., R. Trezevant, 2003, Is a dividend tax penalty incorporated into
common stock returns? Journal of Accounting and Economics, 35, 155-178. Dhaliwal, D. S., Krull, L., Li, O. Z., Moser, W., 2005. Dividend taxes and implied cost of
equity capital. Journal of Accounting Research 43, 675-708. Dhaliwal, D. S., Li, O. Z., 2006, Investor tax heterogeneity and ex-dividend day trading
volume. Journal of Finance 61, 463-490. Ellis, K., Michaely, R., and O’Hara, M., 2000, When the underwriter is the market
maker: an examination of trading in the IPO aftermarket, Journal of Finance 55, 1039-1074.
Erickson, M., and E. Maydew, 1998, Implicit taxes in high dividend yield stocks,
Accounting Review 73, 435-458. Field, L., and Hanka, G., 2001, The expiration of IPO share lockups, Journal of Finance
56, 471-500. Field, L., and Karpoff, J., 2002, Takeover Defenses of IPO Firms, Journal of Finance 57,
1857-1889. Gompers, P., 1996, Grandstanding in the venture capital industry, Journal of Financial
Economics 42, 133-156. Guenther, D.A., Willenborg, M., 1999. Capital gains tax rates and the cost of capital for
small business: Evidence from the IPO market. Journal of Financial Economics 53, 385-408.
Hanley, K., 1993, Underpricing of initial public offerings and the partial adjustment
phenomenon, Journal of Financial Economics 34, 231-250. Hanley, K., and Wilhelm, W., 1995, Evidence on the strategic allocation of initial public
offerings, Journal of Financial Economics 37, 239-257. Helwege, J., and Liang, N., 2004, Initial public offerings in hot and cold markets, Journal
of Financial and Quantitative Analysis 39, 541-569.

32
Ibbotson, R., and Jaffe, J., 1975, Hot Issue Markets, Journal of Finance 30, 1027-1042. Ivkovic, Z., J. Poterba, and S. Weisbenner, 2004, Tax-motivated trading by individual
investors, working paper. Klein, P., 1999, The capital gain lock-in effect and equilibrium returns, Journal of Public
Economics 71, 355-378. Klein, P., 2001, The capital gain lock-in effect and long-horizon return reversal, Journal
of Financial Economics 59, 33-62. Landsman, W. R., and D. A. Shackelford, 1995, The lock-in effect of capital gains taxes:
Evidence from the RJR Nabisco leveraged buyout, National Tax Journal 48, 245-259. Lang, M., and D. A. Shackelford, 2000, Capitalization of capital gains taxes: Evidence
from stock price reactions to the 1997 rate reductions, Journal of Public Economics 76: 69-85.
Lee, P., and Wahal, S., 2004, Grandstanding, certification and the underpricing of venture
capital backed IPOs, Journal of Financial Economics 73, 375-407. Lerner, J., 1994, Venture capitalists and the decision to go public, Journal of Financial
Economics 35, 293-316. Ljungqvist, A., 2006, IPO underpricing, in B. Espen Eckbo (ed.), Handbook of Corporate
Finance: Empirical Corporate Finance, Handbooks in Finance Series, Elsevier/North-Holland, forthcoming.
Ljungqvist, A., Nanda, V., and Singh, R., 2006, Hot markets, investor sentiment, and IPO
pricing, Journal of Business, forthcoming. Loughran T, Ritter, J.R., 1995. The new issues puzzle. Journal of Finance 50, 23-51. Loughran T, Ritter, J.R., 2002, Why don’t issuers get upset about leaving money on the
table in IPOs? Review of Financial Studies 15, 413-443. Loughran T, Ritter, J.R., 2004, Why has IPO underpricing increased over time? Financial
Management 33, 5-37. Lowry, M., 2003, Why does IPO volume fluctuate so much? Journal of Financial
Economics 67, 3-40. Michaely, R., and Shaw, W., 1995, Does the choice of auditor convey quality in an initial
public offering? Financial Management 24, 15-30.

33
Poterba J. and S. Weisbenner, 2001, Capital gains tax rules, tax-loss trading and turn-of-the-year returns, Journal of Finance 56: 353-368.
Reese, W., 1998. Capital gains taxation and stock market activity: Evidence from IPOs,
Journal of Finance 53, 1799-1820. Ritter, J., 1991. The long-run performance of initial public offerings. Journal of Finance
45, 3-27. Rock, K., 1986, Why new issues are underpriced, Journal of Financial Economics 15,
187-212. Tinic, S., 1988, Anatomy of initial public offerings of common stock, Journal of Finance
43, 789-822. Viard, A. D., 2000. Dynamic asset pricing effects and incidence of realization-based
capital gains taxes, Journal of Monetary Economics 46, 465-488.

34
10
12
14
16
18
20
22
24
26
28
30
32
34
36
38
40
42
19871988
19891990
19911992
19931994
19951996
19971998
19992000
20012002
20032004
Year
Tax
Rat
e (p
erce
nt)
short term tax rate long term tax rate
Figure 1. Short-term and long-term capital gains tax rates 1987-2004. The short-term tax rates are the marginal tax rates faced by individuals in the highest income bracket and the long-term tax rates are the rates that apply after the stock has been held for one year. Tax regimes changes occur on the effective dates of the legislation with one exception. The Tax Reform Act of 1997 decreased the maximum long-term capital gains tax rate from 28 to 20 percent effective May 7, 1997. The change in tax rates in 2003 occurred on May 5, 2003 but was retroactive to the beginning of the year. All other tax rate changes occur at year end.
35
TABLE 1 Distribution of Sample IPOs and Underpricing Statistics Across Tax Regimes
Panel A: Frequency of sample IPOs across short-term capital gains tax rates
Tax Regime
Maximum tax rate
Number of sample IPOs
Percentage of sample IPOs
Average IPOs per Day
Change in Daily
Frequency 1987 38.5% 207 5.12 0.83
1988-1990 28% 253 6.26 0.34 Down 1991-1992 31% 511 12.64 1.02 Up 1993-2000 39.6% 2,925 72.33 1.46 Up
2001 39.1% 53 1.31 0.21 Down 2002 38.6% 48 1.19 0.19 Down
2003-2004 35% 47 1.16 0.09 Down
Panel B: Frequency of sample IPOs across long-term capital gains tax rates
Tax Regime
Maximum tax rate
Number of sample IPOs
Percentage of sample IPOs
Average IPOs per Day
Change in Daily
Frequency 1987-1997 28% 2,724 67.36 0.99 1997-2003 20% 1,273 31.48 0.73 Down 2003-2004 15% 47 1.16 0.09 Down
The sample consists of IPOs from 1987 through 2004 identified by Thompson Financial Securities Data Corporation with stock price data on CRSP and complete regression information. IPOs from closed-end funds, REITS, ADRs, unit offerings, IPOs with an offer price below $5 per share, and financial sector IPOs were eliminated from the sample. Sample IPOs are classified according to the tax rate effective on the issuance date. Tax regimes changes occur on the effective dates of the legislation with one exception. The Tax Reform Act of 1997 decreased the maximum long-term capital gains tax rate from 28 to 20 percent effective May 7, 1997. The change in tax rates in 2003 occurred on May 5, 2003 but was retroactive to the beginning of the year. All other tax rate changes occur at year end. The short-term capital gains tax rate is the marginal tax rate faced by individuals in the highest income bracket, and the long-term capital gains tax rate is the tax rate applicable after stock has been held for more than one year. IPO underpricing (initial return) is the change in price from the offering price to the closing price on the first day of trading.

36
TABLE 2 Sample Statistics for the Regression Sample 1987-2004 (N=4,044)
Panel A: Descriptive Statistics Variable Mean Std Dev. 25% Median 75%
Market Capitalization ($ in millions) 448.91 2,697.56 129.91 58.50 330.75 Total Assets ($ in millions) 208.95 1,355.68 59.13 28.31 133.67 Offering Price 12.19 5.01 12.00 8.50 15.00 Shares Offered (millions) 3.38 5.03 2.40 1.50 3.82 Percentage of Firm Sold 38.61 348.82 25.00 16.67 34.10 Initial Return (percent) 23.65 48.79 9.09 0.52 25.98 Carter Manaster Rank 7.23 2.20 8.00 6.25 9.00 Price Revision from Filing to Offer (percent) 2.12 22.63 0.00 -9.09 9.68 Average IPO Initial Return during month of IPO and prior month (percent) 23.84 22.02 15.72 12.13 21.40 Total Number of IPOs during month of IPO and prior month 96.82 38.25 97.00 72.00 117.00 Age of Firm in Years 13.30 18.38 7.00 4.00 14.00 Offering Proceeds ($ in millions) 54.89 100.13 32.50 17.10 58.40
Panel B: Frequency distribution over tax regimes Sample Size Technology Venture
Overall sample 4,044 44.36% 47.53% Short-term Regimes
1987 207 29.95% 38.16% 1988-1990 253 31.62% 43.08% 1991-1992 511 37.77% 50.49% 1993-2000 2,925 47.69% 48.00%
2001 53 39.62% 54.72% 2002 48 43.75% 43.75%
2003-2004 47 46.81% 46.81% Long-term Regimes
1987-1997 2,724 38.73% 44.35% 1997-2003 1,273 56.32% 54.36% 2003-2004 47 46.81% 46.81%
The market capitalization is the value of all stock outstanding on the offer date, using CRSP shares outstanding and the closing price on the first day of trading. The percentage of the firm offered is calculated as the number of shares offered in the IPO divided by the total shares outstanding after the IPO. The initial return is the difference between the first trading day closing price reported by CRSP and the offer price, deflated by the offer price. Technology firms are defined using the four-digit SIC codes in Cliff and Denis (2004). Venture is a binary variable that equals one where Thompson Financial recorded the IPO as backed by venture capital. The lead underwriter reputation is measured by the Carter Manaster (1990) rank, as updated on Jay Ritter’s website. The price revision from filing to offer is measured from the midpoint of the filing range to the offer price. Data on firm age, number of IPOs and average initial return are collected from Jay Ritter’s website.

37
TABLE 3 Distribution of IPO Underpricing Across Tax Regimes
Panel A: Mean and median underpricing (initial return) across short-term capital gains tax regimes
Tax Regime
Tax Rate
Sample Size
Mean Initial Return
Median Initial Return
Tax Rate Change
Median Reaction Change
Change in Daily
Frequency 1987 38.5% 207 7.09% 1.92%
1988-1990 28% 253 8.53% 4.17% Down Up* Down 1991-1992 31% 511 11.48% 5.88% Up Up Up 1993-2000 39.6% 2,925 28.81% 11.36% Up Up* Up
2001 39.1% 53 15.40% 13.00% Down Up Down 2002 38.6% 48 10.27% 8.45% Down Down* Down
2003-2004 35% 47 12.03% 8.33% Down Down Down
Panel B: Mean and median underpricing (initial return) across long-term capital gains tax regimes
Tax Regime
Tax Rate
Sample Size
Mean Initial Return
Median Initial Return
Tax Rate Change
Median Reaction Change
Change in Daily
Frequency 1987-1997 28% 2,724 13.44% 6.52% 1997-2003 20% 1,273 45.94% 18.75% Down Up* Down 2003-2004 15% 47 12.03% 8.33% Down Down* Down
The initial return (Underpricing) is the difference between the first trading day closing price reported by CRSP and the initial offer price deflated by the offer price. * Change in median price reactions between adjacent tax regimes is significant (Median test p < 0.05).

38
TABLE 4 Initial IPO Underpricing Regression Results 1987-2004 (N=4,044)
Variables Coefficient Estimates (t statistics)
Intercept -45.61 -4.68 -30.74 -25.54 (-3.89)*** (-0.43) (-2.21)** (-2.57)*** ST TAX ( + ) 0.72 - 0.58 - (4.03)*** (2.98)*** LT TAX ( – ) - -0.63 -0.40 - (-3.35)*** (-1.97)** TAXDIFF ( + ) - - - 0.50 (4.45)*** VC 2.94 2.89 2.98 2.98 (2.22)** (-2.19)** (2.25)** (2.25)** RANK 2.49 2.32 2.48 2.46 (5.70)*** (5.35)*** (5.69)*** (5.66)*** REVISION 1.07 1.07 1.07 1.08 (32.89)*** (32.85)*** (32.95)*** (33.00)*** SPREAD 1.06 0.98 0.95 0.93 (1.00) (0.92) (0.89) (0.88) TECH 3.07 3.02 2.88 2.87 (2.40)** (2.35)** (2.25)** (2.24)** VWTOT -0.06 -0.09 -0.07 -0.07 (-0.52) (-0.79) (-0.57) (-0.60) IPORET 0.50 0.51 0.48 0.48 (9.24)*** (9.40)*** (8.90)*** (8.90)*** IPOTOT -0.05 -0.004 -0.04 -0.03 (-2.98)*** (-0.28) (-1.88)* (-1.93)* AUDITD -5.13 -4.75 -4.97 -4.92 (-1.67)* (-1.54) (-1.62) (-1.60) LAGE -1.52 -1.64 -1.50 -1.52 (-2.45)** (-2.65)*** (-2.43)** (-2.45)** 1/OFFER 81.26 75.67 79.78 79.11 (2.89)*** (2.69)*** (2.83)*** (2.81)*** PROCEEDS -2.31 -2.56 -2.73 -2.78 (-2.00)** (-2.19)** (-2.33)** (-2.38)** DOTCOM 10.64 8.31 9.56 9.25 (3.11)*** (2.41)** (2.76)*** (2.71)*** Adjusted R2 0.455 0.454 0.455 0.455
The initial return (Underpricing) is the difference between the first trading day closing price reported by CRSP and the initial offer price deflated by the offer price. Reputation of underwriters (RANK) using the updated Carter-Manaster ranking (Carter and Manaster, 1990) available on Jay Ritter’s website. Pricing revision (REVISION) is the percentage price revision from midpoint of initial filing range to the offer price. Underwriters fees (SPREAD) is the total underwriting/management/selling fees as a percentage of the amount offered in the IPO. The market return preceding sample IPOs (VWTOT) is the sum of the value weighted market return for the month of the IPO and the month prior to the IPO. The average IPO initial return during a firm’s IPO month and the prior month is IPORET and the total number of IPOs during a firm’s IPO month and the prior month is IPOTOT. AUDITD is a big-auditor dummy that equals to one if the auditor of the IPO firm is a big-8, 6 or 4 auditor. 1/OFFER is the inverse of IPO offer price. PROCEEDS is the logarithm of IPO proceeds in millions, divided by CPI. TECH dummy is an indicator variable for technology firms that equals one for technology firms defined using the four-digit SIC codes in Cliff and Denis (2004). VC dummy is an indicator variable for venture capital backing that equals one where Thompson Financial recorded the IPO as backed by venture capital. DOTCOM dummy is an indicator variable that equals one for the time period January 1999 to March 2000. The numbers in parentheses are t-statistics, and all tests are two-tail tests. ***, ** and * represent significance levels at 1%, 5% and 10%, respectively.
39
TABLE 5 Underpricing Regression Results Combining Adjacent Tax Regimes
Coefficient Estimates (t statistics) Short-term Tax Regimes Long-term
Variables 1988-1990 & 1991-1992
1991-1992 & 1993-2000
1993-2000 & 2001 1987-1997 & 1997-2003
Intercept -5.99 -24.02 -27.53 -24.97 (-0.55) (-2.06)** (-2.07)** (-2.49)** TAXDIFF ( + ) 1.07 0.49 0.55 0.54 (1.76)* (3.38)*** (2.20)** (4.74)*** VC 2.31 3.16 3.04 3.06 (1.84)* (2.07)** (1.77)* (2.29)** RANK 0.29 1.14 1.21 2.45 (7.91)*** (31.17)*** (29.95)*** (5.58)*** REVISION -0.36 2.85 3.29 1.08 (-0.78) (5.68)*** (5.85)*** (32.90)*** SPREAD 3.12 0.62 0.13 0.98 (2.93)*** (0.51) (0.09) (0.92) TECH 2.18 3.35 3.47 2.93 (1.78)* (2.28)** (2.10)** (2.27)** VWTOT -0.04 -0.12 -0.10 -0.05 (-0.26) (-0.81) (-0.62) (-0.40) IPORET 0.42 0.46 0.45 0.47 (4.09)*** (7.52)*** (7.00)*** (8.53)*** IPOTOT -0.02 -0.05 -0.05 -0.04 (-0.74) (-2.45)** (-2.22)** (-2.38)** AUDITD -0.24 -5.86 -5.94 -4.95 (-0.10) (-1.62) (-1.44) (-1.60) LAGE -1.67 -1.73 -1.91 -1.51 (-2.58)*** (-2.41)** (-2.36)** (-2.42)** 1/OFFER -50.23 91.70 114.02 79.15 (-2.10)** (2.77)*** (3.01)*** (2.79)*** PROCEEDS 0.79 -3.51 -4.45 -2.64 (0.74) (-2.52)** (-2.82)*** (-2.23)** DOTCOM - 8.66 7.25 9.21 (2.34)** (1.82)* (2.68)*** N 764 3,436 2,978 3,997 Adjusted R2 0.213 0.458 0.464 0.456
The initial return (Underpricing) is the difference between the first trading day closing price reported by CRSP and the initial offer price deflated by the offer price. Reputation of underwriters (RANK) using the Carter-Manaster ranking (Carter and Manaster, 1990). Pricing revision (REVISION) is the percentage price revision from midpoint of initial filing range to the offer price. Underwriters fees (SPREAD) is the total underwriting/management/selling fees as a percentage of the amount offered in the IPO. The market return preceding sample IPOs (VWTOT) is the sum of the value weighted market return for the month of the IPO and the month prior to the IPO. The average IPO initial return during a firm’s IPO month and the prior month is IPORET and the total number of IPOs during a firm’s IPO month and the prior month is IPOTOT. AUDITD is a big-auditor dummy that equals to one if the auditor of the IPO firm is a big-8, 6 or 4 auditor. 1/OFFER is the inverse of IPO offer price. PROCEEDS is the logarithm of IPO proceeds in millions, divided by CPI. TECH dummy is an indicator variable for technology firms that equals one for technology firms defined using the four-digit SIC codes in Cliff and Denis (2004). VC dummy is an indicator variable for venture capital backing that equals one where Thompson Financial recorded the IPO as backed by venture capital. DOTCOM dummy is an indicator variable that equals one for the time period January 1999 to March 2000. The numbers in parentheses are t-statistics, and all tests are two-tail tests. ***, ** and * represent significance levels at 1%, 5% and 10%, respectively.

40
TABLE 6 Monthly Underpricing Regression Results 1987-2004 (N=196)
Variables Coefficient Estimates (t statistics)
Intercept 13.79 71.97 23.24 42.59 (0.26) (1.38) (0.40) (0.83) ST TAX ( + ) 0.74 - 0.67 - (2.38)** (1.92)* LT TAX ( – ) - -0.55 -0.19 - (-1.46) (-0.46) TAXDIFF ( + ) - - - 0.46 (2.31)** VC 7.56 8.11 7.42 7.43 (1.07) (1.13) (1.04) (1.05) RANK -1.86 -3.12 -1.92 -2.22 (-0.89) (-1.54) (-0.91) (-1.08) REVISION -0.23 -0.28 -0.23 -0.23 (-1.45) (-1.72)* (-1.41) (-1.44) SPREAD 5.54 4.28 5.12 4.52 (1.03) (0.78) (0.94) (0.84) TECH 1.81 2.05 1.37 1.08 (0.29) (0.32) (0.22) (0.17) VWTOT 0.19 0.12 0.18 0.17 (1.04) (0.65) (1.02) (0.93) IPORET 1.08 1.12 1.08 1.09 (8.03)*** (8.34)*** (8.01)*** (8.10)*** IPOTOT -0.13 -0.08 -0.12 -0.11 (-3.80)*** (-2.56)** (-3.21)*** (-3.40)*** AUDITD -15.40 -14.13 -15.25 -14.88 (-0.89) (-0.81) (-0.88) (-0.86) LAGE -9.53 -10.49 -9.60 -9.85 (-2.82)*** (-3.10)*** (-2.84)*** (-2.93)*** 1/OFFER -362.96 -390.27 -359.02 -361.33 (-2.74)*** (-2.93)*** (-2.70)*** (-2.72)*** PROCEEDS -5.25 -5.43 -5.80 -6.28 (-1.31) (-1.29) (-1.39) (-1.52) DOTCOM 2.21 -0.20 1.72 0.85 (0.29) (-0.03) (0.22) (0.11) Adjusted R2 0.7259 0.7206 0.72 0.7254
Instead of using each IPO as an independent observation we use each month, resulting in 196 months from 1987 to 2004 with at least one IPO with available data. Using all IPOs during a given month, the equally-weighted averages are calculated for Underpricing, RANK, REVISION, SPREAD,AUDITD, 1/OFFER, PROCEEDS, TECH, VC. The initial return (Underpricing) is the difference between the first trading day closing price reported by CRSP and the initial offer price deflated by the offer price. Reputation of underwriters (RANK) using the Carter-Manaster ranking (Carter and Manaster, 1990). Pricing revision (REVISION) is the percentage price revision from midpoint of initial filing range to the offer price. Underwriters fees (SPREAD) is the total underwriting/management/selling fees as a percentage of the amount offered in the IPO. The market return preceding sample IPOs (VWTOT) is the sum of the value weighted market return for the month of the IPO and the month prior to the IPO. The average IPO initial return during a firm’s IPO month and the prior month is IPORET and the total number of IPOs during a firm’s IPO month and the prior month is IPOTOT. AUDITD is a big-auditor dummy that equals to one if the auditor of the IPO firm is a big-8, 6 or 4 auditor. 1/OFFER is the inverse of IPO offer price. PROCEEDS is the logarithm of IPO proceeds in millions, divided by CPI. TECH dummy is an indicator variable for technology firms that equals one for technology firms defined using the four-digit SIC codes in Cliff and Denis (2004). VC dummy is an indicator variable for venture capital backing that equals one where Thompson Financial recorded the IPO as backed by venture capital. DOTCOM dummy is an indicator variable that equals one for the time period January 1999 to March 2000.

41
The numbers in parentheses are t-statistics, and all tests are two-tail tests. ***, ** and * represent significance levels at 1%, 5% and 10%, respectively.
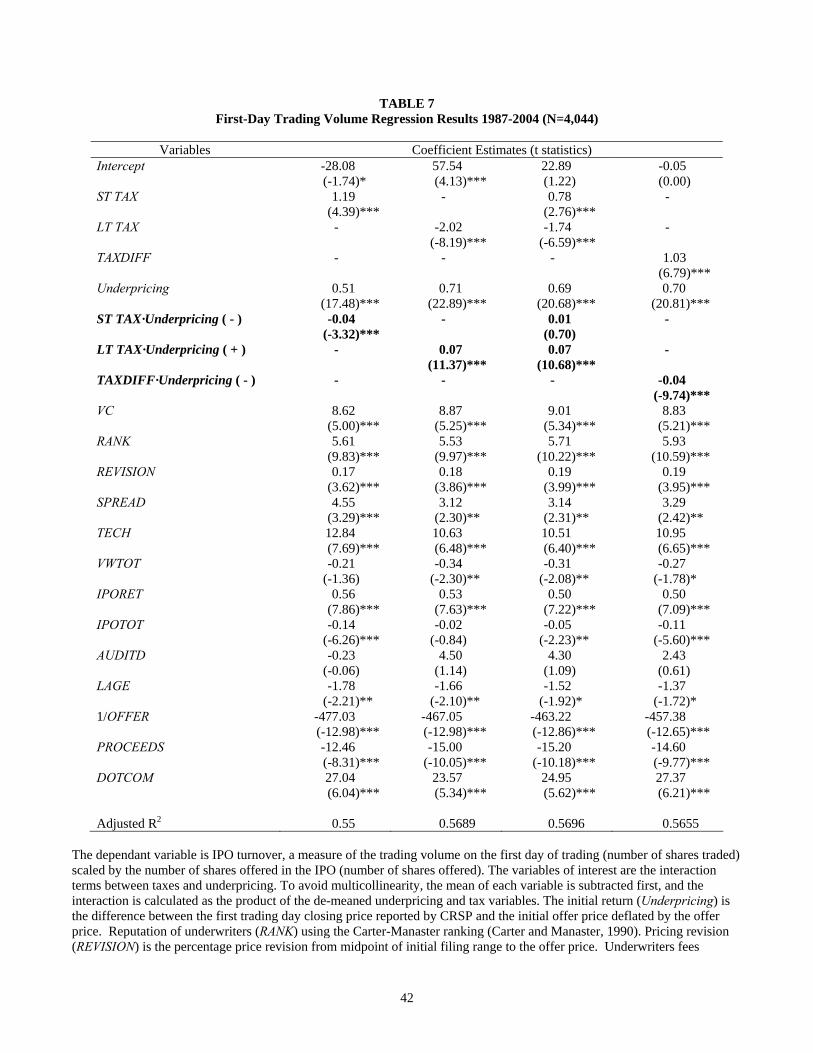
42
TABLE 7 First-Day Trading Volume Regression Results 1987-2004 (N=4,044)
Variables Coefficient Estimates (t statistics)
Intercept -28.08 57.54 22.89 -0.05 (-1.74)* (4.13)*** (1.22) (0.00) ST TAX 1.19 - 0.78 - (4.39)*** (2.76)*** LT TAX - -2.02 -1.74 - (-8.19)*** (-6.59)*** TAXDIFF - - - 1.03 (6.79)*** Underpricing 0.51 0.71 0.69 0.70 (17.48)*** (22.89)*** (20.68)*** (20.81)*** ST TAX·Underpricing ( - ) -0.04 - 0.01 - (-3.32)*** (0.70) LT TAX·Underpricing ( + ) - 0.07 0.07 - (11.37)*** (10.68)*** TAXDIFF·Underpricing ( - ) - - - -0.04 (-9.74)*** VC 8.62 8.87 9.01 8.83 (5.00)*** (5.25)*** (5.34)*** (5.21)*** RANK 5.61 5.53 5.71 5.93 (9.83)*** (9.97)*** (10.22)*** (10.59)*** REVISION 0.17 0.18 0.19 0.19 (3.62)*** (3.86)*** (3.99)*** (3.95)*** SPREAD 4.55 3.12 3.14 3.29 (3.29)*** (2.30)** (2.31)** (2.42)** TECH 12.84 10.63 10.51 10.95 (7.69)*** (6.48)*** (6.40)*** (6.65)*** VWTOT -0.21 -0.34 -0.31 -0.27 (-1.36) (-2.30)** (-2.08)** (-1.78)* IPORET 0.56 0.53 0.50 0.50 (7.86)*** (7.63)*** (7.22)*** (7.09)*** IPOTOT -0.14 -0.02 -0.05 -0.11 (-6.26)*** (-0.84) (-2.23)** (-5.60)*** AUDITD -0.23 4.50 4.30 2.43 (-0.06) (1.14) (1.09) (0.61) LAGE -1.78 -1.66 -1.52 -1.37 (-2.21)** (-2.10)** (-1.92)* (-1.72)* 1/OFFER -477.03 -467.05 -463.22 -457.38 (-12.98)*** (-12.98)*** (-12.86)*** (-12.65)*** PROCEEDS -12.46 -15.00 -15.20 -14.60 (-8.31)*** (-10.05)*** (-10.18)*** (-9.77)*** DOTCOM 27.04 23.57 24.95 27.37 (6.04)*** (5.34)*** (5.62)*** (6.21)*** Adjusted R2 0.55 0.5689 0.5696 0.5655
The dependant variable is IPO turnover, a measure of the trading volume on the first day of trading (number of shares traded) scaled by the number of shares offered in the IPO (number of shares offered). The variables of interest are the interaction terms between taxes and underpricing. To avoid multicollinearity, the mean of each variable is subtracted first, and the interaction is calculated as the product of the de-meaned underpricing and tax variables. The initial return (Underpricing) is the difference between the first trading day closing price reported by CRSP and the initial offer price deflated by the offer price. Reputation of underwriters (RANK) using the Carter-Manaster ranking (Carter and Manaster, 1990). Pricing revision (REVISION) is the percentage price revision from midpoint of initial filing range to the offer price. Underwriters fees

43
(SPREAD) is the total underwriting/management/selling fees as a percentage of the amount offered in the IPO. The market return preceding sample IPOs (VWTOT) is the sum of the value weighted market return for the month of the IPO and the month prior to the IPO. The average IPO initial return during a firm’s IPO month and the prior month is IPORET and the total number of IPOs during a firm’s IPO month and the prior month is IPOTOT. AUDITD is a big-auditor dummy that equals to one if the auditor of the IPO firm is a big-8, 6 or 4 auditor. 1/OFFER is the inverse of IPO offer price. PROCEEDS is the logarithm of IPO proceeds in millions, divided by CPI. TECH dummy is an indicator variable for technology firms that equals one for technology firms defined using the four-digit SIC codes in Cliff and Denis (2004). VC dummy is an indicator variable for venture capital backing that equals one where Thompson Financial recorded the IPO as backed by venture capital. DOTCOM dummy is an indicator variable that equals one for the time period January 1999 to March 2000. The numbers in parentheses are t-statistics, and all tests are two-tail tests. ***, ** and * represent significance levels at 1%, 5% and 10%, respectively.