Remote Sensing Analysis of Recent Carbonate Platforms ... 20120301.pdf · Citra satelit atas...
13
Indonesian Journal of Geology, Vol. 7 No. 3 September 2012: 123-135 Remote Sensing Analysis of Recent Carbonate Platforms, East of Sabah: Potential Analogues for Miocene Carbonate Platforms of the South China Sea Analisis Inderaan Jauh Anjungan Karbonat Resen, Sabah Timur: Analog Potensi bagi Anjungan Karbonat Miosen Laut Cina Selatan A. CHALABI, B. PIERSON, and JASMI AB TALIB Geoscience and Petroleum Engineering Department Universiti Teknologi PETRONAS Bandar Seri Iskandar, 31750 Tronoh, Perak, Malaysia ABSTRACT Recent carbonate platforms may provide useful analogues for fossil platforms and reefs, and could allow the generation of quantitative tools for the prediction of facies distribution, reservoir volumes, and reservoir quality. Data from these modern analogues would greatly enhance our ability to construct more reliable and calibrated reservoir models for carbonate fossil fields, such as the Miocene carbonate platforms of Central Luconia Province, Sarawak. In this study, carbonate facies maps and quantitative reservoir data will be gen- erated by using remote sensing techniques. Satellite imageries over the carbonate platforms east of Sabah have been acquired and processed for generating facies maps. In order to produce a reliable facies map, the composition and grain size distribution of the sediments that make up individual facies must be known in order to determine the classes that have been identified on the initial facies maps. Samples collected from the Gaya and Selekan platforms were analyzed and the results of grain size analysis are illustrated. Keywords: carbonates, facies, platform, remote sensing, mapping SARI Anjungan karbonat Resen dapat menjadi analog yang berguna bagi anjungan fosil dan terumbu, dan memungkinkan peralatan kuantitatif dapat memprediksi distribusi fasies, volume reservoar, dan kualitas reservoar. Data dari analog modern ini akan sangat meningkatkan kemampuan kita dalam merekonstruksikan model reservoar yang terkalibrasi dan dapat diandalkan untuk lapangan fosil karbonat, seperti anjungan kar- bonat Miosen di Provinsi Luconia Tengah, Sarawak. Dalam studi ini, peta fasies karbonat dan data reservoar kuantitatif dihasilkan dengan menggunakan teknik inderaan jauh. Citra satelit atas anjungan karbonat di timur Sabah telah diperoleh dan diproses untuk menghasilkan peta fasies. Dalam upaya untuk membuat peta fasies yang dapat diandalkan, komposisi sedimen dan distribusi ukuran butirnya yang membentuk fasies individu harus diketahui untuk menentukan kelas yang telah diidentifikasi pada peta fasies awal. Percontoh yang didapatkan dari anjungan Gaya dan Selekan dianalisis dan hasil analisis ukuran butir didapatkan. Kata kunci: karbonat, fasies, anjungan, inderaan jauh, pemetaan 123 Manuscript received: January 3, 2012, final acceptance: September 3, 2012 Corresponding Author: [email protected]
Transcript of Remote Sensing Analysis of Recent Carbonate Platforms ... 20120301.pdf · Citra satelit atas...

Indonesian Journal of Geology, Vol. 7 No. 3 September 2012: 123-135
Remote Sensing Analysis of Recent Carbonate Platforms, East of Sabah: Potential Analogues for Miocene Carbonate
Platforms of the South China Sea
Analisis Inderaan Jauh Anjungan Karbonat Resen, Sabah Timur: Analog Potensi bagi Anjungan Karbonat Miosen
Laut Cina Selatan
A. ChAlAbi, b. Pierson, and JAsmi Ab TAlib
Geoscience and Petroleum Engineering DepartmentUniversiti Teknologi PETRONAS
Bandar Seri Iskandar, 31750 Tronoh, Perak, Malaysia
AbstrAct
Recent carbonate platforms may provide useful analogues for fossil platforms and reefs, and could allow the generation of quantitative tools for the prediction of facies distribution, reservoir volumes, and reservoir quality. Data from these modern analogues would greatly enhance our ability to construct more reliable and calibrated reservoir models for carbonate fossil fields, such as the Miocene carbonate platforms of Central Luconia Province, Sarawak. In this study, carbonate facies maps and quantitative reservoir data will be gen-erated by using remote sensing techniques. Satellite imageries over the carbonate platforms east of Sabah have been acquired and processed for generating facies maps. In order to produce a reliable facies map, the composition and grain size distribution of the sediments that make up individual facies must be known in order to determine the classes that have been identified on the initial facies maps. Samples collected from the Gaya and Selekan platforms were analyzed and the results of grain size analysis are illustrated.
Keywords: carbonates, facies, platform, remote sensing, mapping
Sari
Anjungan karbonat Resen dapat menjadi analog yang berguna bagi anjungan fosil dan terumbu, dan memungkinkan peralatan kuantitatif dapat memprediksi distribusi fasies, volume reservoar, dan kualitas reservoar. Data dari analog modern ini akan sangat meningkatkan kemampuan kita dalam merekonstruksikan model reservoar yang terkalibrasi dan dapat diandalkan untuk lapangan fosil karbonat, seperti anjungan kar-bonat Miosen di Provinsi Luconia Tengah, Sarawak. Dalam studi ini, peta fasies karbonat dan data reservoar kuantitatif dihasilkan dengan menggunakan teknik inderaan jauh. Citra satelit atas anjungan karbonat di timur Sabah telah diperoleh dan diproses untuk menghasilkan peta fasies. Dalam upaya untuk membuat peta fasies yang dapat diandalkan, komposisi sedimen dan distribusi ukuran butirnya yang membentuk fasies individu harus diketahui untuk menentukan kelas yang telah diidentifikasi pada peta fasies awal. Percontoh yang didapatkan dari anjungan Gaya dan Selekan dianalisis dan hasil analisis ukuran butir didapatkan.
Kata kunci: karbonat, fasies, anjungan, inderaan jauh, pemetaan
123
Manuscript received: January 3, 2012, final acceptance: September 3, 2012Corresponding Author: [email protected]

124 Indonesian Journal of Geology, Vol. 7 No. 3 September 2012: 123-135
IntroductIon
Constructions of static reservoir models in oil and gas fields where carbonates make up the main reservoir usually rely on subsurface data. The ac-curacy of a model depends on the density of the sampling by wells, the quality of the seismic data, and the interpretation of facies distribution in the carbonate section.
Modern carbonate platforms may provide useful analogues to fossil platforms and reefs. The Miocene carbonate platforms of Sarawak, for instance, are likely to be comparable to the modern carbonate platforms of Sabah, as the main carbonate-producing organisms for both platform types are similar if not identical.
In this study, carbonate facies maps are gener-ated from satellite images of present-day platforms east of Sabah, as well as quantitative data that will help predict facies distribution, reservoir volumes, heterogeneity, and quality in Miocene platforms. Data from these modern analogues will greatly enhance the ability to construct more reliable and calibrated static and dynamic reservoir models for fossil carbonate fields.
Satellite images provide data in different regions of the electromagnetic spectrum, allowing detec-tion, identification, and characterization of recent carbonate facies on modern platforms. This study will mainly rely on techniques used to extract in-formation layers and monitor historical changes of these carbonate facies using multi- and hyperspectral censors (in the optical and thermal windows) in conjunction with field checking.
Remote sensing is a useful tool for obtaining information about an object from space, based on object’s electromagnetic radiation (Lillesand and Kiefer, 1994). The recording data of electromag-netic radiations after interaction with an object can be interpreted as an image with single or multiple bands. This process has become possible due to data acquisition in limited and narrow spectral bands, near IR and thermal IR imaging and microwave imaging (Murai, 1993).
Remote sensing in geology and environmental fields is widely used because it provides a unique global view at different spatial scales and in different ranges of the electromagnetic spectrum (Mumby and
Edwards, 2002; Purkis and Riegl, 2005; Yamano et al., 2006).
The study area is located east of Sabah, between 4° 25´ and 4° 45´ North, 118° 35´ 26" - 118° 58´ East as shown in Figure 1.
Methodology
Data Acquisition The first satellite data received was from the
Malaysian Remote Sensing Agency (MRSA) in Kuala Lumpur. It was a SPOT image data of 2.5 m resolution made up of 4 separate scenes, acquired on 17th December 2006. These images were geometri-cally corrected using GCP (Ground Control Point) from JUPEM (Series L 7030 Topographic map of 1 : 50.000) and terrain correction using SRTM (Shuttle Radar Topography Mission). The error was less than half a pixel.
The second type of data was QuickBird image data (0.6 m resolution as shown in Figures 2 and 3) which were acquired in 2006 and 2009 respectively covering seven platforms. The other image acquired was IKONOS satellite data with the resolution of 1 m.
Facies ClassificationFor the preliminary facies maps, two isolated
carbonate platforms, Selekan (Figure 3) and Gaya (Figure 4) banks, were selected.
A geometric correction process was performed for each image and the accuracy was less than half a pixel. The satellite images for Selekan bank, Maiga, Gaya, Sibuan, and Terembu Reef were classified using unsupervised classification in order to create different classes based on a grey level similarity. To verify the validity of this classification, sampling was performed on the various platforms and the samples were analyzed for composition and grain size distribution. Sediment classes obtained from this analysis will be superposed and compared with the satellite image-derived classification. Final maps will be generated from this superposition.
Once the initial classification was performed, sampling points for each platform were selected based on the class color (17 points for Selekan bank and 14 points for Gaya) as partly shown in Figures 4 and 5. Each point is defined by its geographic coor-

125Remote Sensing Analysis of Recent Carbonate Platforms, East of Sabah: Potential Analogues for Miocene Carbonate Platforms of the South China Sea (A. Chalabi et al.)
W E
0 3 6 12 kilometers
Figure 1. Locality map of studied area.

126 Indonesian Journal of Geology, Vol. 7 No. 3 September 2012: 123-135
Figure 3. QuickBird image of Gaya Island, acquired in 2009, showing carbonate platforms.
Figure 2. QuickBird image (0.6 m resolution), covering carbonate platforms.

127Remote Sensing Analysis of Recent Carbonate Platforms, East of Sabah: Potential Analogues for Miocene Carbonate Platforms of the South China Sea (A. Chalabi et al.)
dinates using PCI Geomatics which made sampling easier. First field trip to the study area was conducted on 12th to 15th November 2009.
Second field trip was carried out from 11th to 26th March 2010 with a collaboration of Sabah Parks to collect sediment samples and Universiti Malaysia Terengganu for bathymetry data acquisition. During this field trip, a total of 109 sediment samples were collected either by snorkeling or diving (64 points for Selekan bank, 7 points for Maiga, 7 points for
Sibuan, 12 points for Terembu Reef, and 19 points for Gaya) as shown in Figures 4 and 5.
Sample AnalysisSamples were collected from the surficial sedi-
ments on each platform depending on the depth of the sampling point that were guided and chosen by using GPS. In general, the depth of Selekan bank varies between 40 cm to 12 m, and Gaya depth can reach 27 m in the inner lagoon.
Figure 4. Sampling points ( ) of the Selekan Island.

128 Indonesian Journal of Geology, Vol. 7 No. 3 September 2012: 123-135
A sample analysis procedure includes com-ponent identification and grain size distribution analysis. An initial identification of carbonate components was carried out at SEACARL. The sediment samples were washed using clorox to remove organic matter and reduce the strong smell of sea water, and then were dried before sieving. Grain size separation was carried out using sieves with sizes between 63 µ to 2 mm and each sieve sample weighed (63 µm, 125 µm, 250 µm, 500 µm, 1 mm, and 2 mm).
results and dIscussIon
Facies MapsSatellite images covering the study areas gener-
ate facies maps of the Selekan and Gaya Islands as shown in Figures 6 and 7 respectively.
Sample Analysis ResultsThe primary focus of this paper is to report the
initial grain size distribution analysis for the samples collected from field visits to Selekan and Gaya banks
Figure 5. Sampling points ( ) of Gaya Island.
(Figures 4 and 5). The following observations can be extracted from Figures 8 and 9.
Southern Margin of Selekan bankThe area is presented in Figure 8. Points S0
to S3, close to the fringing reef, show a bimodal distribution, with a peak at 250 µ and an upwards trend towards coarser grain sizes (>2 mm), probably representing large coral fragments.
In the back-reef area, point S4 shows a unimodal distribution with an almost perfect bell-shaped graph, centered on a peak value of 250 µ. This suggests a lower proportion of large coral fragments. Going further to the North, away from the reef but still in the back-reef area, a grain size of 500 µ is a characteristic of point S5. Further away from the reef reaching a more quiescent zone, the dominant grain size seems to decrease gradually. The histogram of S6 shows a high percentage of grains between 125 µ and 250 µ, whereas at point S7, the dominant grain size is 250 µ.
Center of Selekan bankIn Figure 9, points S23 and S37 show a similar
grain size distribution histogram, dominated by a

129Remote Sensing Analysis of Recent Carbonate Platforms, East of Sabah: Potential Analogues for Miocene Carbonate Platforms of the South China Sea (A. Chalabi et al.)
Figure 6. Unsupervised classification of the Selekan Island map.
4 31’10’ N4 31’10’ N
4 32’20’ N4 32’20’ N
4 33’30’ N4 33’30’ N
4 34’40’ N4 34’40’ N
4 35’50’ N4 35’50’ N
4 37’00’ N4 37’00’ N
4 38’10’ N4 38’10’ N
118 40’00’ E
118 40’00’ E
118 38’50’ E
118 38’50’ E
118 37’40’ E
118 37’40’ E
118 41’10’ E
118 41’10’ E
118 42’20’ E
118 42’20’ E
oo
oo
oo
oo
oo
oo
oo
o
o
o
o
o
o
o
o
o
o
0 2,000 4,000 m
Legend
Island/Volcano
Reef complex
Carbonate sand shoal
Shallow lagoon
Deep lagoon
fine fraction (less than 63 µ). These points are both in lagoonal areas.
Northern Margin of Gaya bankFigure 10 shows that the sampling point nearest to
the fringing reef (point G1) indicates a similar bimodal
grain size distribution as in Selekan, with a peak at 250 µ and an upward trend towards coarser grain sizes (>2 mm), probably representing large coral fragments close to the carbonate factory.
Points G2 and G3 are on the reef flat, the zone of highest energy, and have no fine fraction. The
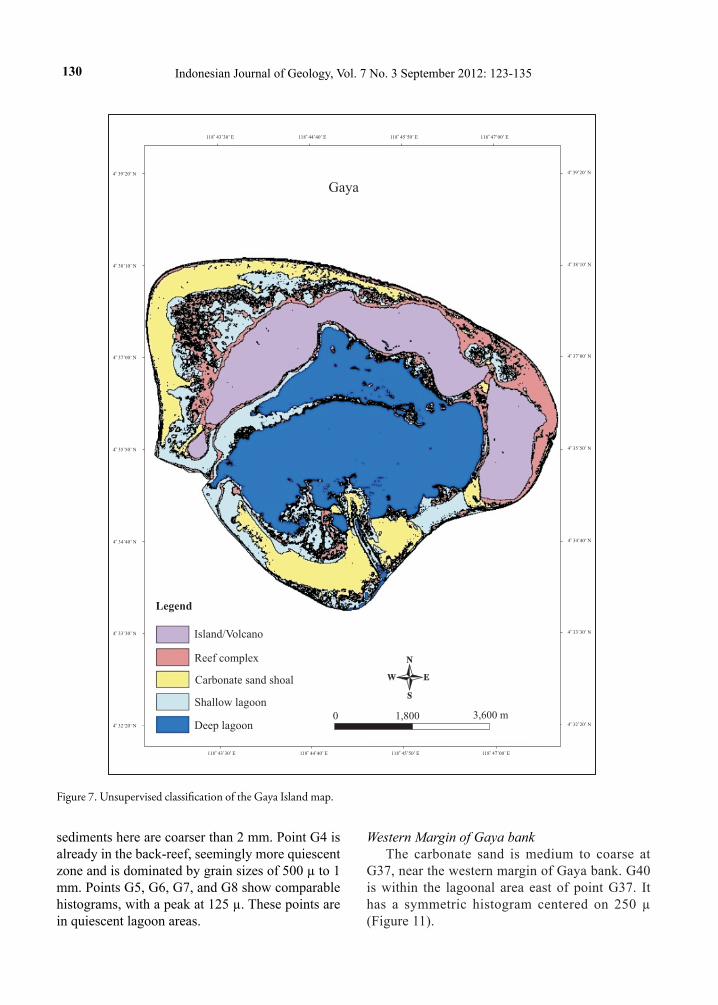
130 Indonesian Journal of Geology, Vol. 7 No. 3 September 2012: 123-135
sediments here are coarser than 2 mm. Point G4 is already in the back-reef, seemingly more quiescent zone and is dominated by grain sizes of 500 µ to 1 mm. Points G5, G6, G7, and G8 show comparable histograms, with a peak at 125 µ. These points are in quiescent lagoon areas.
Western Margin of Gaya bankThe carbonate sand is medium to coarse at
G37, near the western margin of Gaya bank. G40 is within the lagoonal area east of point G37. It has a symmetric histogram centered on 250 µ (Figure 11).
Figure 7. Unsupervised classification of the Gaya Island map.
4 32’20’ N 4 32’20’ N
4 33’30’ N 4 33’30’ N
4 34’40’ N 4 34’40’ N
4 35’50’ N 4 35’50’ N
4 37’00’ N 4 37’00’ N
4 38’10’ N 4 38’10’ N
4 39’20’ N 4 39’20’ N
118 44’40’ E
118 44’40’ E
118 43’30’ E
118 43’30’ E
118 45’50’ E
118 45’50’ E
118 47’00’ E
118 47’00’ E
o o
o o
o o
o o
o o
o o
o o
o
o
o
o
o
o
o
o
0 1,800 3,600 m
Legend
Island/Volcano
Reef complex
Carbonate sand shoal
Shallow lagoon
Deep lagoon
Gaya

131Remote Sensing Analysis of Recent Carbonate Platforms, East of Sabah: Potential Analogues for Miocene Carbonate Platforms of the South China Sea (A. Chalabi et al.)
Figu
re 8
. His
togr
ams o
f Sel
ekan
sam
plin
g an
alys
is o
f sou
ther
n m
argi
n of
the
Sele
kan
bank
.
% o
f M
ass
Reta
ined
S2
05
10
15
20
25
30
35
40
PA
N6
3µ
12
5µ
25
0µ
50
0µ
1m
m2
mm
Sie
ve S
ize
Percentage Retained
% o
f M
ass
Reta
ined
S1
05
10
15
20
25
30
PA
N63µ
125µ
250µ
500µ
1m
m2 m
m
Sie
ve S
ize
Percentage Retained
% o
f M
ass
Reta
ined
S0
05
10
15
20
25
30
35
PA
N63µ
125µ
250µ
500µ
1m
m2 m
m
Sie
ve S
ize
Percentage Retained
% o
f M
ass R
eta
ined
S7
0.0
0
5.0
0
10.0
0
15.0
0
20.0
0
25.0
0
30.0
0
35.0
0
40.0
0
PA
N63µ
125µ
250µ
500µ
1m
m2 m
m
Sie
ve S
ize
Percentage Retained
S2
S1 S0%
of
Mass
Reta
ined S
4
0.0
0
5.0
0
10.0
0
15.0
0
20.0
0
25.0
0
30.0
0
35.0
0
40.0
0
PA
N63µ
125µ
250µ
500µ
1m
m2 m
m
Sie
ve S
ize
Percentage Retained
% o
f M
ass R
eta
ined S
5
0.0
0
5.0
0
10.0
0
15.0
0
20.0
0
25.0
0
30.0
0
35.0
0
40.0
0
PA
N63µ
125µ
250µ
500µ
1m
m2 m
m
Sie
ve S
ize
Percentage Retained
% o
f M
ass
Reta
ined S
6
0.0
0
5.0
0
10.0
0
15.0
0
20.0
0
25.0
0
30.0
0
PA
N63µ
125µ
250µ
500µ
1m
m2 m
m
Sie
ve S
ize
Percentage Retained
S7 S6
S5
S4
% o
f M
ass
Reta
ined
S3
0.0
0
5.0
0
10
.00
15
.00
20
.00
25
.00
30
.00
PA
N6
3µ
12
5µ
25
0µ
50
0µ
1m
m2
mm
Sie
ve S
ize
Percentage Retained
S3

132 Indonesian Journal of Geology, Vol. 7 No. 3 September 2012: 123-135
Figu
re 9
. His
togr
ams o
f Sel
ekan
sam
plin
g an
alys
is o
f cen
ter o
f the
Sel
ekan
ban
k.
% o
f M
ass
Reta
ined
S3
7
0.0
0
10.0
0
20.0
0
30.0
0
40.0
0
50.0
0
60.0
0
PA
N63µ
125µ
250µ
500µ
1m
m2 m
m
Sie
ve S
ize
Percentage Retained
S37
% o
f M
ass
Ret
ained
S23
0.0
0
5.0
0
10.0
0
15.0
0
20.0
0
25.0
0
30.0
0
35
.00
PAN
63µ
125µ
250µ
500µ
1m
m2 m
m
Sie
ve
Siz
e
Percentage Retained
S23

133Remote Sensing Analysis of Recent Carbonate Platforms, East of Sabah: Potential Analogues for Miocene Carbonate Platforms of the South China Sea (A. Chalabi et al.)
Figu
re 1
0. H
isto
gram
s of G
aya
Sam
plin
g A
naly
sis o
f no
rther
n m
argi
n of
the
Gay
a B
ank.
% o
f T
otal
Pas
sing
G1
05
1015202530
PAN
63µ
125µ
250µ
500µ
1mm
2 m
m
Sie
ve S
ize
Percentage Passing
% o
f T
ota
l P
assi
ng G
2
0
10
20
30
40
50
60
70
80
90
PAN
63µ
125µ
250µ
500µ
1m
m2 m
m
Sie
ve
Siz
e
Percentage Passing
% o
f T
ota
l P
assi
ng
G3
0
10
20
30
40
50
60
70
80
PAN
63
µ1
25
µ2
50
µ5
00
µ1
mm
2 m
m
Sie
ve
Siz
e
Percentage Passing
% o
f T
ota
l P
assi
ng
G4
05
10
15
20
25
30
35
40
PAN
63
µ1
25
µ2
50
µ5
00
µ1
mm
2 m
m
Sie
ve
Siz
e
Percentage Passing%
of
Tot
al P
assi
ng G
5
0
10
20
30
40
50
60
PA
N63µ
125µ
250µ
500µ
1m
m2 m
m
Sie
ve
Siz
e
Percentage Passing
% o
f To
tal P
assi
ng G
6
0102030405060
PAN
63µ
125µ
250µ
500µ
1mm
2 m
m
Siev
e Si
ze
Percentage Passing
% o
f M
ass
reta
ined
G7
0510152025303540
PAN
63µ
125µ
250µ
500µ
1mm
2 m
m
Siev
e Si
ze
Percentage retained
% o
f M
ass
Ret
aine
d G
8
0102030405060
PAN
63µ
125µ
250µ
500µ
1mm
2 m
m
Sie
ve S
ize
Percentage Retained
G8
G4
G3
G2
G1
G5
G6
G7

134 Indonesian Journal of Geology, Vol. 7 No. 3 September 2012: 123-135
Figu
re 1
1. H
isto
gram
s of G
aya
Sam
plin
g A
naly
sis o
f w
este
rn m
argi
n of
the
Gay
a ba
nk.
% o
f M
ass
Ret
ained
G37
05
10
15
20
25
30
35
40
45
PAN
63µ
125µ
250µ
500µ
1m
m2 m
m
Sie
ve
Siz
e
Percentage retained
% o
f M
ass
Ret
aine
d G
40
0510152025303540
PAN
63µ
125µ
250µ
500µ
1mm
2 m
m
Sie
ve S
ize
Percentage Retained
G37
G40

135Remote Sensing Analysis of Recent Carbonate Platforms, East of Sabah: Potential Analogues for Miocene Carbonate Platforms of the South China Sea (A. Chalabi et al.)
conclusIons
The grain size analysis of carbonate sands on Sele-kan and Gaya banks is an important early step to illustrate the variation and distribution of carbonate sand on the platforms. From this analysis, a few points can be noted:1. Carbonate grain sizes at platforms Selekan and
Gaya are closely related to the location of sam-ples with respect to the reef (carbonate factory). The carbonate grain size increases towards the reef and decreases away from it.
2. High energy, currents, and storms are the main factors in managing the distribution of carbonate sand. The samples taken in high energy zones are devoid of a fine fraction, whereas samples collected in low-energy zones contain no coarse fraction.
3. Unsupervised classification is a useful method to classify the area in order to choose the sampling points.
4. The facies classification obtained through sample analysis does not perfectly match the unsu-pervised classification obtained from satellite imagery processing.
5. A combination between unsupervised classifica-tion and a classification derived from component identification and grain size analysis will be needed to modify facies maps accurately.
Acknowledgment---The authors are greatly indebted to President of CCOP, who gave permission to publish the paper.
references
Lillesand, M.T. and Kiefer, R.W., 1994. Remote sensing and image interpretation, (3rd ed.). John Wiley & Son, Inc., USA, 750pp.
Mumby, P.J. and Edwards, A.J., 2002. Mapping marine environments with IKONOS imagery: enhanced spatial resolution can deliver greater thematic accuracy. Remote Sensing of Environment, 82 (2-3), p.248-257.
Murai, S., 1993. Remote sensing note. Japan association on Remote Sensing, 284pp.
Purkis, S. J. and Riegl, B., 2005. Spatial and temporal dynamics of Arabian Gulf coral assemblages quantified from remote-sensing and in situ monitoring data. Marine Ecology Progress Series, 287, p.99-113.
Yamano, H., Shimazaki, H., Matsunaga, T., Ishoda, A., McClennen, C., Yokoki, H., Fujita, K., Osawa, Y., and Kayanne, H., 2006. Evaluation of various satellite sensors for waterline extraction in a coral reef environment: Majuro Atoll, Marshall Islands. Geomorphology, 82, p.398-411.