3-D Imaging of Cleat and Micro-cleat Characteristics, South … · akhir adalah mineral karbonat,...
9
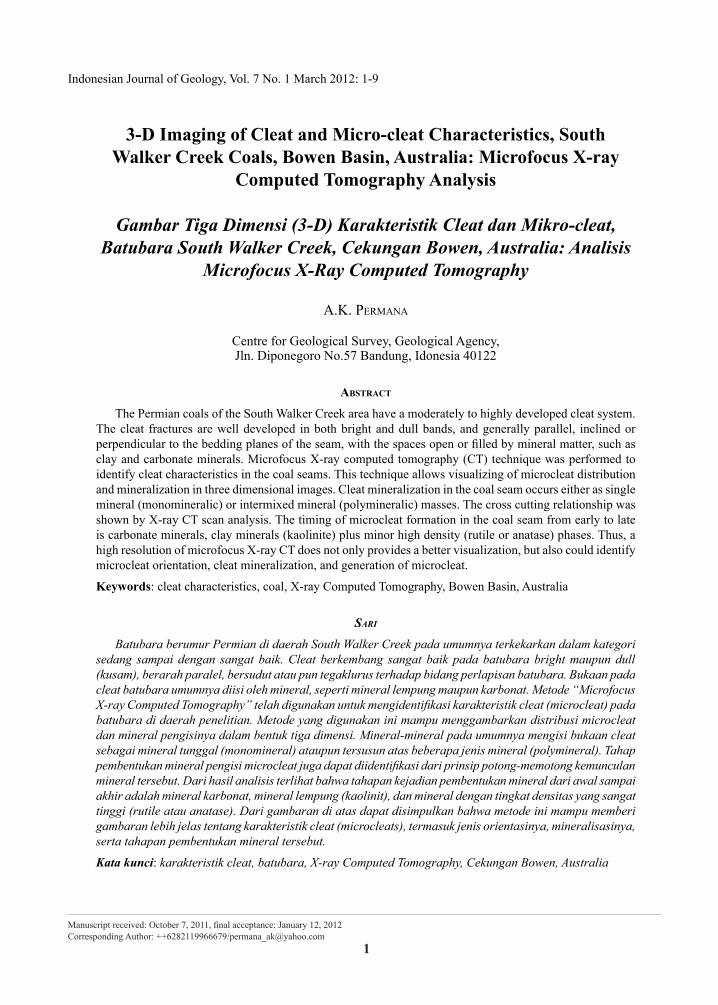
Indonesian Journal of Geology, Vol. 7 No. 1 March 2012: 1-9 3-D Imaging of Cleat and Micro-cleat Characteristics, South Walker Creek Coals, Bowen Basin, Australia: Microfocus X-ray Computed Tomography Analysis Gambar Tiga Dimensi (3-D) Karakteristik Cleat dan Mikro-cleat, Batubara South Walker Creek, Cekungan Bowen, Australia: Analisis Microfocus X-Ray Computed Tomography A.K. PERMANA Centre for Geological Survey, Geological Agency, Jln. Diponegoro No.57 Bandung, Idonesia 40122 ABSTRACT The Permian coals of the South Walker Creek area have a moderately to highly developed cleat system. The cleat fractures are well developed in both bright and dull bands, and generally parallel, inclined or perpendicular to the bedding planes of the seam, with the spaces open or filled by mineral matter, such as clay and carbonate minerals. Microfocus X-ray computed tomography (CT) technique was performed to identify cleat characteristics in the coal seams. This technique allows visualizing of microcleat distribution and mineralization in three dimensional images. Cleat mineralization in the coal seam occurs either as single mineral (monomineralic) or intermixed mineral (polymineralic) masses. The cross cutting relationship was shown by X-ray CT scan analysis. The timing of microcleat formation in the coal seam from early to late is carbonate minerals, clay minerals (kaolinite) plus minor high density (rutile or anatase) phases. Thus, a high resolution of microfocus X-ray CT does not only provides a better visualization, but also could identify microcleat orientation, cleat mineralization, and generation of microcleat. Keywords: cleat characteristics, coal, X-ray Computed Tomography, Bowen Basin, Australia SARI Batubara berumur Permian di daerah South Walker Creek pada umumnya terkekarkan dalam kategori sedang sampai dengan sangat baik. Cleat berkembang sangat baik pada batubara bright maupun dull (kusam), berarah paralel, bersudut atau pun tegaklurus terhadap bidang perlapisan batubara. Bukaan pada cleat batubara umumnya diisi oleh mineral, seperti mineral lempung maupun karbonat. Metode “Microfocus X-ray Computed Tomography” telah digunakan untuk mengidentifikasi karakteristik cleat (microcleat) pada batubara di daerah penelitian. Metode yang digunakan ini mampu menggambarkan distribusi microcleat dan mineral pengisinya dalam bentuk tiga dimensi. Mineral-mineral pada umumnya mengisi bukaan cleat sebagai mineral tunggal (monomineral) ataupun tersusun atas beberapa jenis mineral (polymineral). Tahap pembentukan mineral pengisi microcleat juga dapat diidentifikasi dari prinsip potong-memotong kemunculan mineral tersebut. Dari hasil analisis terlihat bahwa tahapan kejadian pembentukan mineral dari awal sampai akhir adalah mineral karbonat, mineral lempung (kaolinit), dan mineral dengan tingkat densitas yang sangat tinggi (rutile atau anatase). Dari gambaran di atas dapat disimpulkan bahwa metode ini mampu memberi gambaran lebih jelas tentang karakteristik cleat (microcleats), termasuk jenis orientasinya, mineralisasinya, serta tahapan pembentukan mineral tersebut. Kata kunci: karakteristik cleat, batubara, X-ray Computed Tomography, Cekungan Bowen, Australia 1 Manuscript received: October 7, 2011, final acceptance: January 12, 2012 Corresponding Author: ++6282119966679/[email protected]
Transcript of 3-D Imaging of Cleat and Micro-cleat Characteristics, South … · akhir adalah mineral karbonat,...
Indonesian Journal of Geology, Vol. 7 No. 1 March 2012: 1-9
3-D Imaging of Cleat and Micro-cleat Characteristics, South Walker Creek Coals, Bowen Basin, Australia: Microfocus X-ray
Computed Tomography Analysis
Gambar Tiga Dimensi (3-D) Karakteristik Cleat dan Mikro-cleat, Batubara South Walker Creek, Cekungan Bowen, Australia: Analisis
Microfocus X-Ray Computed Tomography
A.K. PermAnA
Centre for Geological Survey, Geological Agency, Jln. Diponegoro No.57 Bandung, Idonesia 40122
AbstrAct
The Permian coals of the South Walker Creek area have a moderately to highly developed cleat system. The cleat fractures are well developed in both bright and dull bands, and generally parallel, inclined or perpendicular to the bedding planes of the seam, with the spaces open or filled by mineral matter, such as clay and carbonate minerals. Microfocus X-ray computed tomography (CT) technique was performed to identify cleat characteristics in the coal seams. This technique allows visualizing of microcleat distribution and mineralization in three dimensional images. Cleat mineralization in the coal seam occurs either as single mineral (monomineralic) or intermixed mineral (polymineralic) masses. The cross cutting relationship was shown by X-ray CT scan analysis. The timing of microcleat formation in the coal seam from early to late is carbonate minerals, clay minerals (kaolinite) plus minor high density (rutile or anatase) phases. Thus, a high resolution of microfocus X-ray CT does not only provides a better visualization, but also could identify microcleat orientation, cleat mineralization, and generation of microcleat.
Keywords: cleat characteristics, coal, X-ray Computed Tomography, Bowen Basin, Australia
Sari
Batubara berumur Permian di daerah South Walker Creek pada umumnya terkekarkan dalam kategori sedang sampai dengan sangat baik. Cleat berkembang sangat baik pada batubara bright maupun dull (kusam), berarah paralel, bersudut atau pun tegaklurus terhadap bidang perlapisan batubara. Bukaan pada cleat batubara umumnya diisi oleh mineral, seperti mineral lempung maupun karbonat. Metode “Microfocus X-ray Computed Tomography” telah digunakan untuk mengidentifikasi karakteristik cleat (microcleat) pada batubara di daerah penelitian. Metode yang digunakan ini mampu menggambarkan distribusi microcleat dan mineral pengisinya dalam bentuk tiga dimensi. Mineral-mineral pada umumnya mengisi bukaan cleat sebagai mineral tunggal (monomineral) ataupun tersusun atas beberapa jenis mineral (polymineral). Tahap pembentukan mineral pengisi microcleat juga dapat diidentifikasi dari prinsip potong-memotong kemunculan mineral tersebut. Dari hasil analisis terlihat bahwa tahapan kejadian pembentukan mineral dari awal sampai akhir adalah mineral karbonat, mineral lempung (kaolinit), dan mineral dengan tingkat densitas yang sangat tinggi (rutile atau anatase). Dari gambaran di atas dapat disimpulkan bahwa metode ini mampu memberi gambaran lebih jelas tentang karakteristik cleat (microcleats), termasuk jenis orientasinya, mineralisasinya, serta tahapan pembentukan mineral tersebut.
Kata kunci: karakteristik cleat, batubara, X-ray Computed Tomography, Cekungan Bowen, Australia
1
Manuscript received: October 7, 2011, final acceptance: January 12, 2012Corresponding Author: ++6282119966679/[email protected]
2 Indonesian Journal of Geology, Vol. 7 No. 1 March 2012: 1-9
IntroductIon
X-ray computed tomography (CT) is a nonde-structive technique which allows visualization of the internal structure of objects, determined mainly by variations in density and atomic composition (Mees et al., 2003). CT was originally developed as a medical imaging technique in the early 1970s (Hounsfield, 1972, 1973), and the application of the technique to geoscience studies began in the early 1980s. Several publications show the possibility for use of this technique in geology and engineer-ing studies, such as in soil science (Petrovic et al., 1982; Hainsworth and Aylmore, 1983), meteorites (Arnold et al., 1982), petroleum geology (Vinegar, 1986; Vinegar and Wellington, 1986), paleontology (Haubitz et al., 1988), geotechnics (Raynaud et al., 1989), and sedimentology (Kenter, 1989).
In coal science, the CT technique has been suc-cessfully applied for determination of fracture or cleat structures in coals from Zonguldak Basin, northwestern Turkey, in relation to coalbed methane recovery (Karacan and Okandan, 2000). Other stud-ies of cleat distribution, aperture, orientation, and spacing in coals have been described using CT scans (Mazumder et al., 2006). This technique also allows correlation with other image analysis data, such as that obtained from reflected-light microscope and back scattered electron microscope observations, to obtain better visualization of distribution of coal components in three dimensions.
Cleat characteristics are commonly identified and measured directly from in-situ outcrop in the field and under the microscopic analysis, in which relevant information can be obtained, including the spacing, distribution, aperture, mineralization, dip direction, and azimuth of the cleats (Close and Mavor, 1991; Laubach et al., 1998). From those techniques, the high rank of the South Walker Creek coals have a moderately to highly developed cleat system. Cleat fractures are generally parallel, inclined or perpen-dicular to the bedding planes of the seam, with the spaces open or filled by mineral matter. The brighter coal lithotypes have lower cleat spacings than the duller coal bands. The face and butt cleats can also be recognized from the top to the bottom of the seam, with both open and closed apertures. The cleats are often infilled by mineral matter, mostly carbonate and clay minerals (Permana et al., 2010; Permana, 2011).
In order to obtain a better orientation about cleat characteristics in the South Walker Creeks coals, mainly on the microcleat analysis, microfocus of 3D X-ray tomography was performed in this study. The aims are to evaluate the possible application of this technology (microfocus X-ray computed tomography) to understand the three-dimensional microcleat characteristics in the coal seam, includ-ing microcleat orientation, cleat mineralization, and microcleat generation based on cross-cutting relationships.
Methodology (X-rAy coMputed toMogrAphy)
To attain the aim of this study, a coal sample from borehole 11852 of Mulgrave Pit, South Walker Creek Mine (Figure 1) was cored and subjected to X-ray CT scanning by Digitalcore Pty, Ltd, a con-sortium operated by the Australian National Uni-versity and the University of New South Wales. The facility is capable of acquiring 3D X-ray CT images of core plugs up to 20483 with resolutions down to 2 µm. This also allows SEM images, on sections through the sample using QEMSCAN®, a fully integrated X-ray microanalysis and image analysis technique, to obtain data from 2D mineralogical mapping, including modal mineral proportions, mineral relationships, and associations. Precise image registration between QEMSCAN® and µCT gives more accurate results in the 3D mineralogical mapping process.
A 19 mm diameter core of the coal from sample 11852-4 was mounted on the high precision rotation stage of the 3D X-ray CT. The facility has both the X-ray source and the detector optimized for high resolution and maximum field of view (FOV). By moving the position of the rotation stage and x-ray camera, magnification can be set between x1.1 to over x100 (Figure 2). The facility can acquire 3D X-ray CT images of cores and plugs at 20483 (voxels size 10.0 µm). Tomograms were collected with an acquisition time of 10 - 20 hours. The tomographic series were reconstructed by using in-house algorithms and the data were processed using a SuperComputer. Computational results were presented both as 2-D and 3-D images and through video visualization.

33-D Imaging of Cleat and Micro-cleat Characteristics, South Walker Creek Coals, Bowen Basin, Australia: Microfocus X-ray Computed Tomography Analysis (A.K. Permana)
2 km0
NBMA open-cut mine
BHP Mitsui open-cut mine
BMA underground mine
Competitor open-cut mine
BMA export part
Coal bearing area
LEGEND
0 20 40 60 80 100
kilometers
AREAOF MAP
N
Figure 1. Locality map of core samples in the South Walker Creek Coal Mine.
Rotation stageScintillator +CCD X-ray source
Figure 2. Photograph of microfocus 3D X-ray computed tomography (CT) instrument.
Data set images from the CT scan were gathered in three directions, X, Y, and Z. The section plan (core diameter) is the XY plane and the scan direc-tion (core axis) is the Z-axis. The image sequences
from the orthogonal sets in the YZ and XZ direction, saved as JPG images, were used to provide a com-plete set of images in three directions. Image analysis software was used to correct the beam hardening ef-

4 Indonesian Journal of Geology, Vol. 7 No. 1 March 2012: 1-9
fect, which was induced by high density spots in the sample. The images of coal matrix, mineral matter, and cleat were separated by grey tones. The sequence of all images was then subjected to the software for 3-D visualization and modelling (Figure 3).
result of InvestIgAtIon
Cleat Characteristics As indicated above (methodology), images were
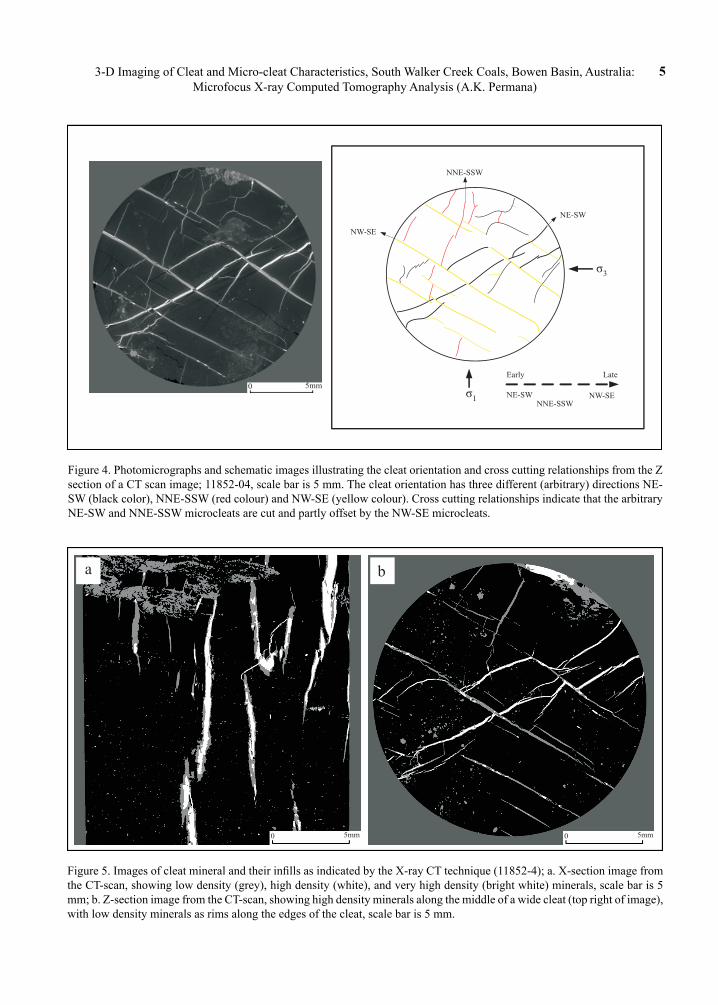
obtained from a 19 mm core of a selected sample (11852-4) by 3-D X-ray computed micro-tomog-raphy. The initial data obtained were expressed in two dimensions by sections through the X, Y, and Z planes. Figure 4 shows the Z section image is parallel to the bedding plane. The microcleat orientations in this plane can be categorized at least into three sets, with (arbitrary) NE - SW, NNE - SSE, and NW - SE strike trends. The orientation trends used in this dia-gram to describe the various sets and their sequence of formation are not based on the actual in-situ (geo-
graphic) orientation, but on an arbitrary north taken at the top of the Z images in the CT scans. Although faults with a NNE trend are dominant in the actual field area, no relation to these features should be inferred from these arbitrary orientation data.
In general, the cross cutting relationships in Figure 4 indicate that (the arbitrary) NE - SW trend-ing microcleats were cut by (arbitrary) NNE - SSE trending microcleats, then both were invariably cut or displaced by (arbitrary) NW - SE microcleats. Thus, overall the sequence of microcleat formation in this part of the coal seam, from early to late was NE - SW, NNE - SSW, and NW - SE directions.
Cleat Mineralization from CT Analysis X-ray CT scanning from this core, taken from
borehole 11852-4 at a depth of 38.79 m (Figure 5), shows that cleats or microcleats are well developed, with the microcleats being more closely spaced in the top compared to the bottom part of the cored sec-tion. The cleats appear to be both perpendicular and oblique to bedding, curved or sub-curved, and range
Green – low density (kaolinite)Red – high density (calcite, ankerite)
19 mm mini-plugextracted from here
Coal
Clay
High density mineral
Very high density mineral
scan direction
derived planesscanned plane
X
Y
Z
00
5mm5mm
Figure 3. Overview of the workflows of 3-D processing and visualization.
53-D Imaging of Cleat and Micro-cleat Characteristics, South Walker Creek Coals, Bowen Basin, Australia: Microfocus X-ray Computed Tomography Analysis (A.K. Permana)
NE-SW
NNE-SSW
NW-SE
s 1
s 3
NE-SWNNE-SSW
NW-SE
Early Late
0 5mm
Figure 4. Photomicrographs and schematic images illustrating the cleat orientation and cross cutting relationships from the Z section of a CT scan image; 11852-04, scale bar is 5 mm. The cleat orientation has three different (arbitrary) directions NE-SW (black color), NNE-SSW (red colour) and NW-SE (yellow colour). Cross cutting relationships indicate that the arbitrary NE-SW and NNE-SSW microcleats are cut and partly offset by the NW-SE microcleats.
a b
0 5mm 0 5mm
Figure 5. Images of cleat mineral and their infills as indicated by the X-ray CT technique (11852-4); a. X-section image from the CT-scan, showing low density (grey), high density (white), and very high density (bright white) minerals, scale bar is 5 mm; b. Z-section image from the CT-scan, showing high density minerals along the middle of a wide cleat (top right of image), with low density minerals as rims along the edges of the cleat, scale bar is 5 mm.
6 Indonesian Journal of Geology, Vol. 7 No. 1 March 2012: 1-9
from 0.5 to 15 mm in length, and 0.3 to 1.5 mm in width. The larger cleats are continuous through the dull band in the core, while the smaller cleats are isolated to the bright (vitrinite) bands.
From the CT-scan observations, the cleats appear to be filled with at least three types of minerals: low, high, and very high density minerals. In the CT-scan images (Figure 5) the low density minerals (prob-ably kaolinite, which XRD indicates up 78% of the mineral matter for this sample) are represented by the grey colour, high density minerals, probably calcite (5.5% of the mineral matter), by the white colour, and very high density minerals, in this par-ticular probably apatite (8.6%) and/or rutile/anatase by the bright white colour. The very high density minerals (bright white) appear to cross cut the low density minerals (grey) within the cleats or to form oval or circular shaped nodules within in the grey or white coloured areas. Cleats filled with low density minerals (kaolinite) may also contain high density minerals (calcite), which are mostly concentrated in the middle of the cleats, with low density minerals as rims along the edge of the cleat infill.
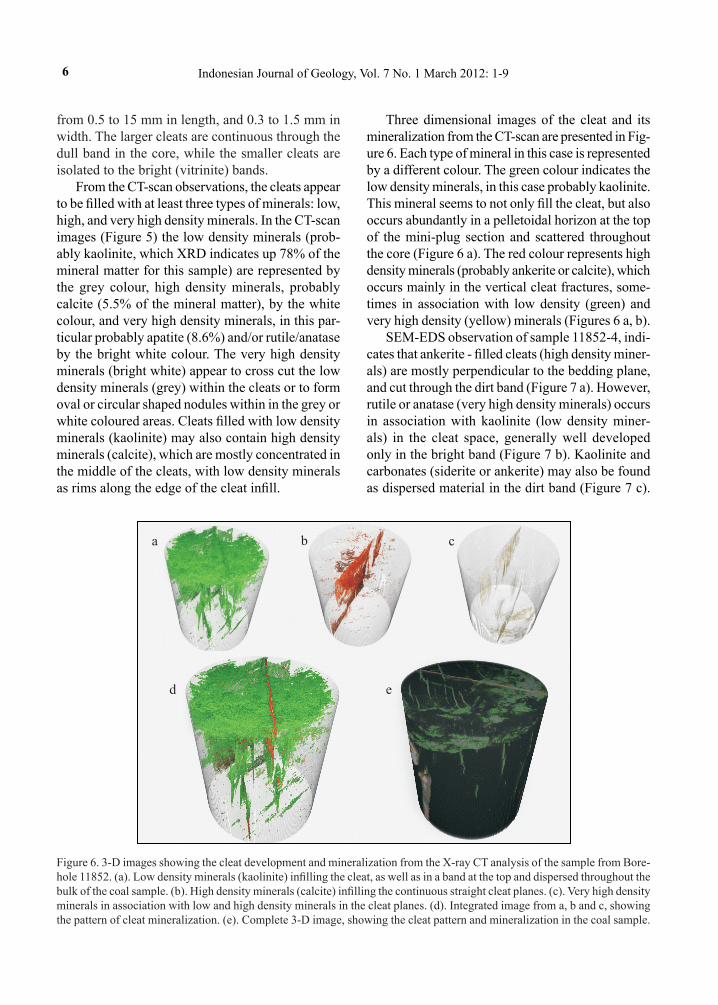
Three dimensional images of the cleat and its mineralization from the CT-scan are presented in Fig-ure 6. Each type of mineral in this case is represented by a different colour. The green colour indicates the low density minerals, in this case probably kaolinite. This mineral seems to not only fill the cleat, but also occurs abundantly in a pelletoidal horizon at the top of the mini-plug section and scattered throughout the core (Figure 6 a). The red colour represents high density minerals (probably ankerite or calcite), which occurs mainly in the vertical cleat fractures, some-times in association with low density (green) and very high density (yellow) minerals (Figures 6 a, b).
SEM-EDS observation of sample 11852-4, indi-cates that ankerite - filled cleats (high density miner-als) are mostly perpendicular to the bedding plane, and cut through the dirt band (Figure 7 a). However, rutile or anatase (very high density minerals) occurs in association with kaolinite (low density miner-als) in the cleat space, generally well developed only in the bright band (Figure 7 b). Kaolinite and carbonates (siderite or ankerite) may also be found as dispersed material in the dirt band (Figure 7 c).
a
d e
b c
Figure 6. 3-D images showing the cleat development and mineralization from the X-ray CT analysis of the sample from Bore-hole 11852. (a). Low density minerals (kaolinite) infilling the cleat, as well as in a band at the top and dispersed throughout the bulk of the coal sample. (b). High density minerals (calcite) infilling the continuous straight cleat planes. (c). Very high density minerals in association with low and high density minerals in the cleat planes. (d). Integrated image from a, b and c, showing the pattern of cleat mineralization. (e). Complete 3-D image, showing the cleat pattern and mineralization in the coal sample.

73-D Imaging of Cleat and Micro-cleat Characteristics, South Walker Creek Coals, Bowen Basin, Australia: Microfocus X-ray Computed Tomography Analysis (A.K. Permana)
A
K
Ti
K
Si
Ankerite (A)
Ti
Kaolinite (K)
Rutile or anatase (Ti)
Siderite (Si)
Ca FeMg
SiAl
TiZr
FeMg Ca
b
a
c
Si
K
K
0
0
0
0
1
1
2
1
2
2
2
3
3
4
3
4
4
4
5
5
6
5
6
6
8
6
7
7
10
7
8
12
8
9
1
1
1
1
2
2
2
2
3
3
3
3
4
4
4
4
6
6
6
6
7
7
7
7
8
8
8
8
9
9
9
9
keV
keV
keV
5
5
5
5
cps/eV
cps/eV
cps/eV
points 1
points 2
points 2
points 1
keV
cps/eV
Figure 7. SEM images from sample 11852-4; a. Ankerite filled-cleat, mostly perpendicular and cutting through the dirt band, with prismatic rutile or anatase in the middle of the cleat space; b. Rutile or anatase cross cutting kaolinite cleat mineral, found localized in the bright band; c. Dispersed particle of kaolinite and carbonates (siderite) in the dirt band.
8 Indonesian Journal of Geology, Vol. 7 No. 1 March 2012: 1-9
Therefore, this suggests that the ankerite cleat infill (high density minerals) is more penetrative than the kaolinite infilling (low density minerals), and would be more likely to represent filling of fractures invaded by fluids passing through the seam.
Cross Cutting Relationships of Cleat FracturesThe cross cutting relationships of the cleat sets
from the CT analysis, combined with an interpretation of the mineral-filled cleats indicate that the timing of microcleat formation in the coal seam may be divided into three stages. The earliest-formed microcleats (arbitrary NE-SW direction) are filled with high, low, and very high density minerals, and probably contain a mixture of carbonate (dominant) and clay mineral infillings. These microcleats are cut by the NNE-SSW microcleat, which is filled with low and very high density minerals, probably representing associations of clay minerals with rutile/anatase or apatite as seen in the SEM-EDS study. Both sets of microcleats are then cut by the most recent set (arbitrary NW-SE di-rection), which is filled with low, high, and very high density minerals, probably representing clay minerals (dominant), mixed with carbonates and rutile/anatase as indicated by SEM-EDS observations.
dIscussIon
The limitation of the previous CT is low resolu-tion, 500 µm within the slice and a slice thickness of 1 mm. For this reason, it is difficult to identify small objects such as macerals in coal samples. In more recent studies, microfocus computer tomography (µ CT) has been developed by Sasov (1987). De-velopments in X-ray tube production have enabled to increase in the resolution of CT units.
Simmons et al. (1997) have described some en-hanced results for coal characterization by using this type of instrument. However, the technique still has limitations in resolution and artefacts are often pro-duced in the final results. Geet et al. (2001) proposed a new technique in development of this equipment. Resampling methods and a dual energy approach has been applied to obtain a better resolution, reducing the artefacts and extracting quantitative information. The facility (microfocus 3-D X-ray CT, with core plugs up to 20483 and resolutions down to 2µm) which was applied in this study clearly shows an
amazing result. This technology could identify a microcleat distribution and its characteristics, as well as cleat mineralization and their genetics in the coal seam.
The paragenetic sequence of cleat mineralization from SEM - EDS analysis based on many samples through the coal seam (Permana, 2011), suggests that the carbonate-filled cleats were mainly formed in the latest stage of cleat mineralization, associated with hot fluid solution within the coal seam. However, the cross cutting relationships of microcelats from the 3-D X-ray tomography show that the earliest generation of microcleats was filled mainly with carbonate minerals (NE-SW), and that the latter generations (NNE-SSW and NW-SE) were mainly filled with clays (kaolinite) plus minor high density (rutile or anatase) phases. Ankerite-filled cleats (high density minerals) are much more penetrative than kaolinite-filled cleats (low density minerals). This suggests that the epigenetic ankerite may have been derived from fluid solutions passing through the coal seam, then the kaolinite cleat minerals may have been formed at a later stage, after displacement after the carbonate-filling episode was completed.
As indicated above, microfocus of 3-D X-ray tomography shows more clearly the distribution of microcleat within the seam, and could also much better identified the timing of microcleats mineral-ization in three dimensional images.
conclusIons
Microfocus 3-D X-ray tomography could suc-cessfully determine microcleat characteristics of the coal seam in the South Walker Creek area, includ-ing, microcleat orientation, cleat mineralization, and microcleat generation based on cross-cutting relationships.
From this technique, the South Walker Coals have categorized as a moderately to highly devel-oped cleat system. The cleat fractures are parallel, inclined or perpendicular to the bedding planes of the seam, with the spaces open or filled by mineral matter, both monomineralics and polymineralics. Cross cutting relationship shown by X-ray CT scan analysis clearly shows that the carbonate minerals is the earliest generation, followed by clays (kaolinite) plus minor high density (rutile or anatase).
93-D Imaging of Cleat and Micro-cleat Characteristics, South Walker Creek Coals, Bowen Basin, Australia: Microfocus X-ray Computed Tomography Analysis (A.K. Permana)
Acknowledgments---The material is obtained from au-thor’s M.Sc. thesis in the University of New South Wales, Sydney. Thanks are expressed to author’s supervisor and co-supervisor, Prof. Colin R. Ward and Dr. Lila W. Gurba for their encouragement and motivation. The author would also like to thank Dr. Alexandra Golab, for her assistance during X-ray computed tomography training in DigitalCore Pty.Ltd, Canberra.
references
Arnold, J.R., Testa, J., Friedman, P.J., and Kambic, G.X., 1982. Computed tomographic analysis of meteorite inclusions. Science, 219, p 383-384.
Close, J. C. and Mavor, M.J., 1991. Influence of coal composition and rank on fracture development in Fruitland coal gas reservoirs of San Juan Basin. In: Schwochow, S., Murray, D.K., and Fahy, M.F. (Eds.), Coalbed Methane of Western North America. Rk.Mt. Association Geological Field Conference (1991), p.109-121.
Geet, M.V., Swennen, R., and David, P., 2001. Quantitative coal characterisation by means of microfocus X-ray computer tomography, colour image analysis and back-scattered scanning electron microscopy. International Journal of Coal Geology, 46, p.11-25.
Hainsworth, J.M. and Aylmore, L.A.G., 1983. The use of computer-assisted tomography to determine spatial distribution of soil water content. Australian Journal of Soil Research, 21, p.435-443.
Haubitz, B., Prokop, M., Dohring, W., Ostrom, J.H., and Wellhofer, P., 1988. Computed tomography of Archeopterix. Paleobiology, 14, p.206-213.
Hounsfield, G.N., 1972. A method of and apparatus for examination of a body by radiation such as X- or gamma-radiation. British Patent No 1.283.915, London.
Hounsfield, G.N., 1973. Computerized transverse axial scanning (tomography). Part 1: Description of system. British Journal of Radiology, 46 (10), p.16-22.
Karacan, C.O. and Okandan, E., 2000. Fracture cleat analysis of coals from Zonguldak Basin, northwestern Turkey/ relative to the potential of coalbed methane production. International Journal of Coal Geology, 44, p.109-125.
Kenter, J.A.M., 1989. Applications of computerized tomography in sedimentology. Marine Geotechnology, 8, p.201-211.
Laubach, S.E., Marrett, R.A., Olson, J.E., and Scott, A.R., 1998. Characteristics and origins of coal cleat: a review. International Journal of Coal Geology 35, p.175-207.
Mazumder, S., Wolf, K.-H.A.A., Elewaut, K., and Ephraim, R., 2006. Application of X-ray computed tomography for analyzing cleat spacing and cleat aperture in coal samples. International Journal of Coal Geology, 68, p.205-222.
Mees, F., Swennen, R., Van Geet, M., and Jacobs, P. (eds)., 2003. Applications of X-ray Computed Tomography in the Geosciences. Geological Society, London, Special Publications, 215, p.1-5.
Permana, A.K., Ward, C.R., Li, Z., Gurba, L.W., and Davison, S., 2010. Mineral matter in the high rank coals of the South Walker Creek area, northern Bowen Basin. In: Beeston, J.W. (Ed), Proceedings of Bowen Basin Symposium - Back in (the) Black, Geological Society of Australia Coal Geology Group and Bowen Basin Geologists Group, Mackay, Qld, 6-8 October, 2010, p.27-34.
Permana, A.K., 2011. Mineralogical variation and changes in the South Walker Creek coals, Bowen Basin, Queensland, Australia. M.Sc Thesis. University of New South Wales, Sydney, 276pp. (Unpublished).
Petrovic, P.E., Siebert, A.M., and Rieke, I.E., 1982. Soil bulk density analysis in three dimensions by computed tomographic scanning. Soil Science Society of America Journal, 46, p.445-450.
Raynaud, S., Fabre, D., Mazerolle, F., Geraud, Y., and Latiere, H.J., 1989. Analysis of the internal structure of rocks and characterisation of mechanical deformation by a non-destructive method: X-ray tomodensitometry. Tectonophysics, 159, p.149-159.
Sasov, A.Y., 1987. Microtomography: I. Methods and equipment. II. Examples of applications. Journal of Microscope, 147, p.169-192.
Simmons, F.J., Verhelst, F., and Swennen, R., 1997. Quantitative characterization of coal by means of microfocal X-ray computed microtomography (CMT) and color image analysis (CIA). International Journal of Coal Geology, 34, p.69-88.
Vinegar, H.J., 1986. X-ray CT and NMR imaging of rocks. Journal of Petroleum Technology, 38, p.257-259.
Vinegar, H.J. and Wellington, S.L., 1986. Tomographic imaging of three-phase flow experiments. Review of Scientific Instruments, 58, p.96-107.